economic and strategy viewpoint
TRANSCRIPT
For professional investors only.
Q3 2021
Economic and Strategy Viewpoint September 2021
Economic and Strategy Viewpoint September 2021 2
Forecast update: a touch of stagflation
– We still expect a robust recovery in the world economy, but the outlook has moved in a stagflationary direction as growth momentum fades and price pressures rise. Our forecast for global GDP growth is unchanged, but we are raising our inflation projections.
– The initial acceleration stage of the recovery is over and we are in a new phase where supply constraints are having a major impact on the cycle.
– There are important regional variations in the growth forecast, with downgrades to the US and China offset by upgrades to the UK, eurozone and Japan. For the first time since 2007 we expect European growth to be ahead of the US in 2022.
– We still expect the Federal Reserve (Fed) to start to taper asset purchases in December and raise interest rates at the end of next year. There is a case for a faster tapering of policy as there seems little point in stimulating demand in an economy suffering from supply side problems. However, the Fed is likely to tolerate the higher inflation that this brings.
– Although we have raised our growth and inflation forecasts for the eurozone, we don’t expect the European Central Bank (ECB) to tighten policy until 2023. Only then will inflation be sustainably at or above the 2% threshold now needed to prompt the central bank to act. We also expect the Bank of England (BoE) to be on hold until 2023. These moves support a stronger dollar over the forecast period.
– Our outlook for emerging market (EM) GDP growth is shaped by China, where bottlenecks and Covid restrictions prompt a downgrade for this year to 8.5%. More mild easing of policy is likely to be announced in China, but in the absence of larger stimulatory measures we continue to expect GDP growth to decelerate to around 5.5% in 2022.
– Although there are risks of stronger growth, the principal threat to our forecast is that the world economy remains constrained for longer by shortages of labour and components, an outcome captured by our supply side inflation scenario. Stagflationary pressures could also be raised by an increase in tariffs, potentially linked to attempts to control carbon emissions after COP26.
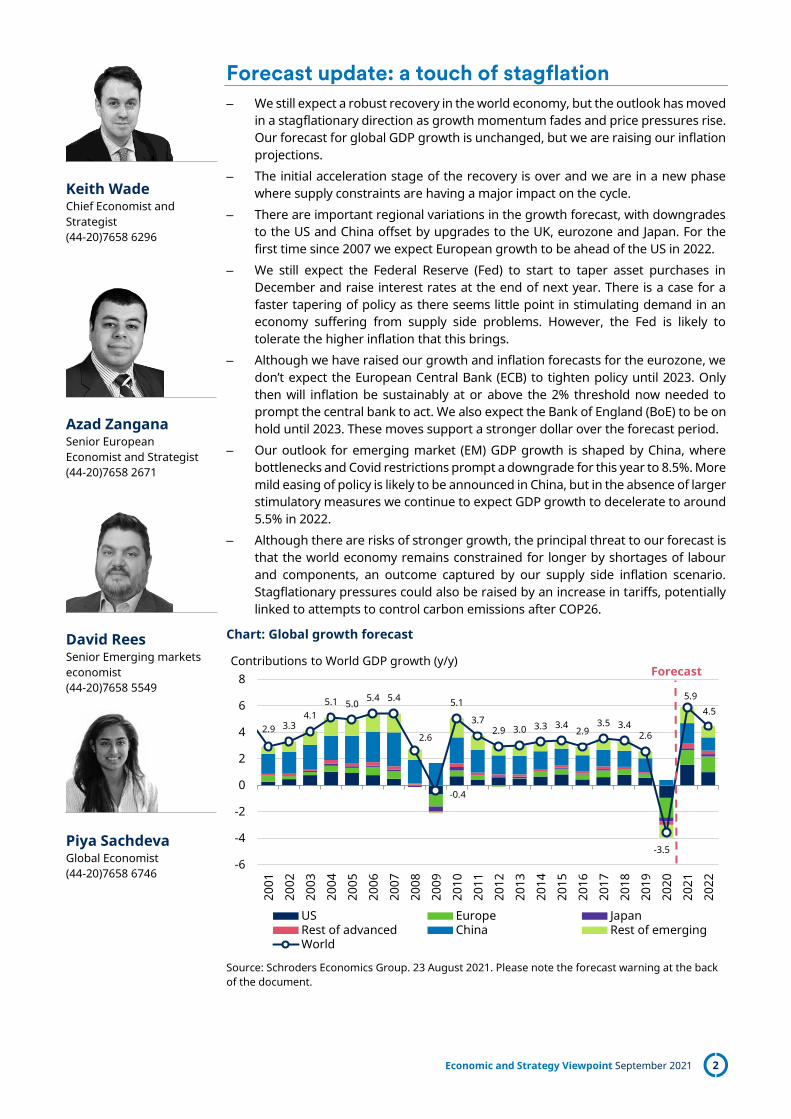
Chart: Global growth forecast
Source: Schroders Economics Group. 23 August 2021. Please note the forecast warning at the back of the document.
2.9 3.34.1
5.1 5.05.4 5.4
2.6
-0.4
5.1
3.72.9 3.0 3.3 3.4 2.9
3.5 3.42.6
-3.5
5.94.5
-6
-4
-2
0
2
4
6
8
2001
2002
2003
2004
2005
2006
2007
2008
2009
2010
2011
2012
2013
2014
2015
2016
2017
2018
2019
2020
2021
2022
Contributions to World GDP growth (y/y)
US Europe JapanRest of advanced China Rest of emergingWorld
Forecast
Keith Wade Chief Economist and Strategist (44-20)7658 6296
Azad Zangana Senior European Economist and Strategist (44-20)7658 2671
David Rees Senior Emerging markets economist (44-20)7658 5549
Piya Sachdeva Global Economist (44-20)7658 6746
Economic and Strategy Viewpoint September 2021 3
Forecast update: a touch of stagflation
The re-opening of the world economy continues and economic activity has picked up substantially. However, the strength of the rebound in demand has caught firms by surprise and supply chains are stretched with the consequence that inflation has picked up.
In this update we remain optimistic about the outlook for the world economy, but we leave our forecast for global growth unchanged and are raising our inflation forecast. This marks a change from the last year where we had been consistently raising our growth forecasts.
We still expect a robust recovery in the world economy, but at the margin the forecast has moved in a stagflationary direction as growth momentum fades and price pressures rise. The initial acceleration stage of the recovery is over and we are in a new phase where supply constraints are having a major impact on the cycle.
There are important regional variations in the growth forecast, with downgrades to the US and China offset by upgrades to the UK, eurozone and Japan. European growth is expected to be ahead of the US in 2022, for the first time since 2007.
In part this is a timing issue, the consequence of extended lockdowns, a delay in vaccine distribution in the eurozone and Japan and a later catch-up. More fundamentally though, fiscal stimulus and pent-up consumer demand have further to run in Europe.
We also see fewer issues in Europe in getting labour back to work as furlough schemes allow for a smoother transition than in the US, where workers have been disconnected from their employers who are finding it harder to entice them back.
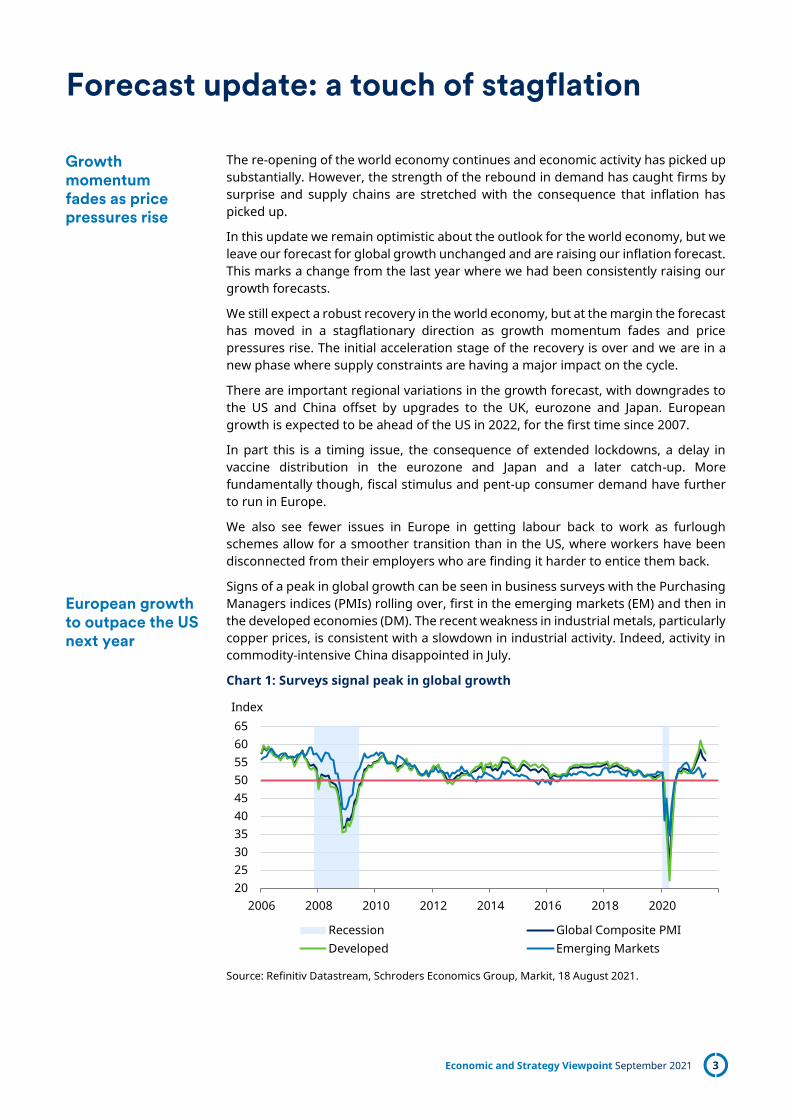
Signs of a peak in global growth can be seen in business surveys with the Purchasing Managers indices (PMIs) rolling over, first in the emerging markets (EM) and then in the developed economies (DM). The recent weakness in industrial metals, particularly copper prices, is consistent with a slowdown in industrial activity. Indeed, activity in commodity-intensive China disappointed in July.
Chart 1: Surveys signal peak in global growth
Source: Refinitiv Datastream, Schroders Economics Group, Markit, 18 August 2021.
20253035404550556065
2006 2008 2010 2012 2014 2016 2018 2020
Recession Global Composite PMIDeveloped Emerging Markets
Index
Growth momentum fades as price pressures rise
European growth to outpace the US next year
Economic and Strategy Viewpoint September 2021 4
Supply-led slowdown
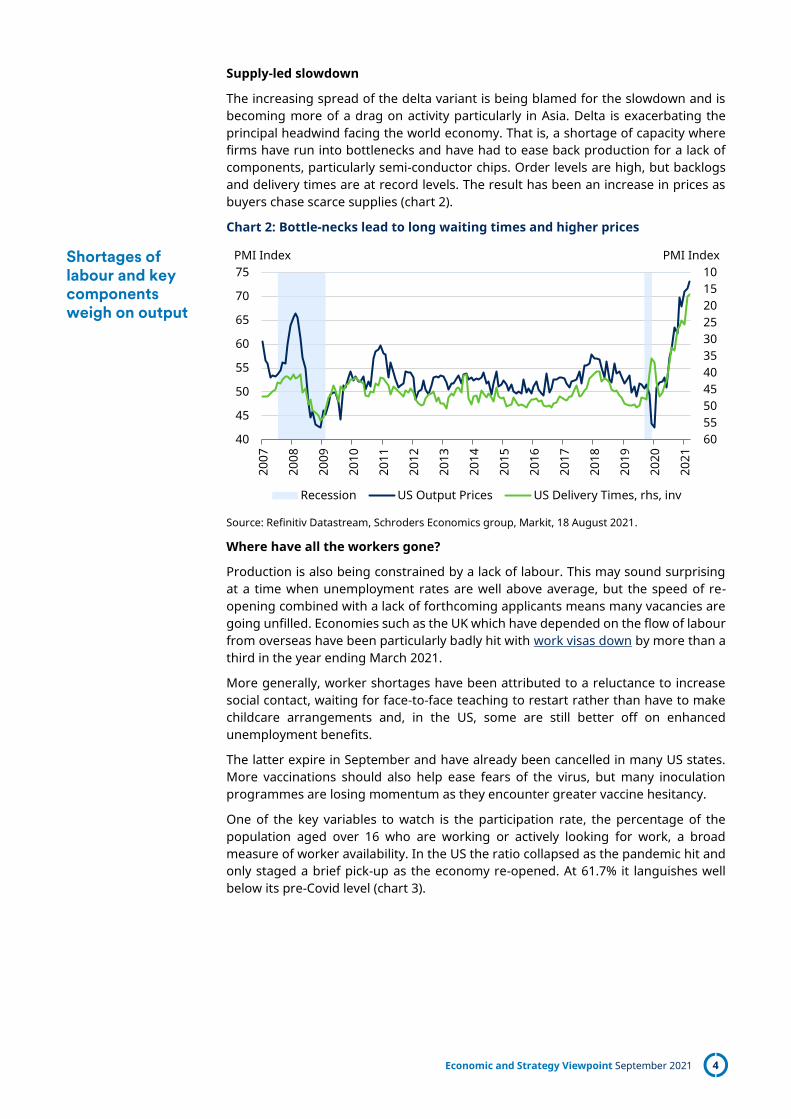
The increasing spread of the delta variant is being blamed for the slowdown and is becoming more of a drag on activity particularly in Asia. Delta is exacerbating the principal headwind facing the world economy. That is, a shortage of capacity where firms have run into bottlenecks and have had to ease back production for a lack of components, particularly semi-conductor chips. Order levels are high, but backlogs and delivery times are at record levels. The result has been an increase in prices as buyers chase scarce supplies (chart 2).
Chart 2: Bottle-necks lead to long waiting times and higher prices
Source: Refinitiv Datastream, Schroders Economics group, Markit, 18 August 2021.
Where have all the workers gone?
Production is also being constrained by a lack of labour. This may sound surprising at a time when unemployment rates are well above average, but the speed of re-opening combined with a lack of forthcoming applicants means many vacancies are going unfilled. Economies such as the UK which have depended on the flow of labour from overseas have been particularly badly hit with work visas down by more than a third in the year ending March 2021.
More generally, worker shortages have been attributed to a reluctance to increase social contact, waiting for face-to-face teaching to restart rather than have to make childcare arrangements and, in the US, some are still better off on enhanced unemployment benefits.
The latter expire in September and have already been cancelled in many US states. More vaccinations should also help ease fears of the virus, but many inoculation programmes are losing momentum as they encounter greater vaccine hesitancy.
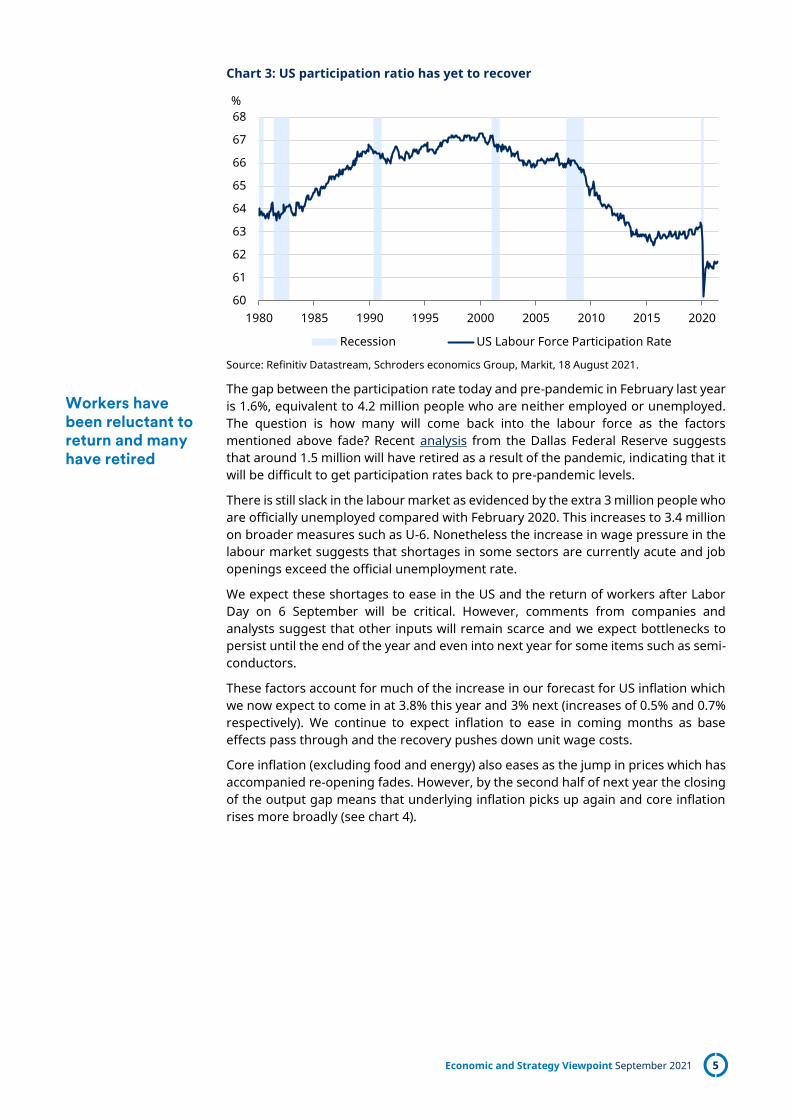
One of the key variables to watch is the participation rate, the percentage of the population aged over 16 who are working or actively looking for work, a broad measure of worker availability. In the US the ratio collapsed as the pandemic hit and only staged a brief pick-up as the economy re-opened. At 61.7% it languishes well below its pre-Covid level (chart 3).
101520253035404550556040
45
50
55
60
65
70
7520
07
2008
2009
2010
2011
2012
2013
2014
2015
2016
2017
2018
2019
2020
2021
Recession US Output Prices US Delivery Times, rhs, inv
PMI Index PMI Index Shortages of labour and key components weigh on output
Economic and Strategy Viewpoint September 2021 5
Chart 3: US participation ratio has yet to recover
Source: Refinitiv Datastream, Schroders economics Group, Markit, 18 August 2021.
The gap between the participation rate today and pre-pandemic in February last year is 1.6%, equivalent to 4.2 million people who are neither employed or unemployed. The question is how many will come back into the labour force as the factors mentioned above fade? Recent analysis from the Dallas Federal Reserve suggests that around 1.5 million will have retired as a result of the pandemic, indicating that it will be difficult to get participation rates back to pre-pandemic levels.
There is still slack in the labour market as evidenced by the extra 3 million people who are officially unemployed compared with February 2020. This increases to 3.4 million on broader measures such as U-6. Nonetheless the increase in wage pressure in the labour market suggests that shortages in some sectors are currently acute and job openings exceed the official unemployment rate.
We expect these shortages to ease in the US and the return of workers after Labor Day on 6 September will be critical. However, comments from companies and analysts suggest that other inputs will remain scarce and we expect bottlenecks to persist until the end of the year and even into next year for some items such as semi-conductors.
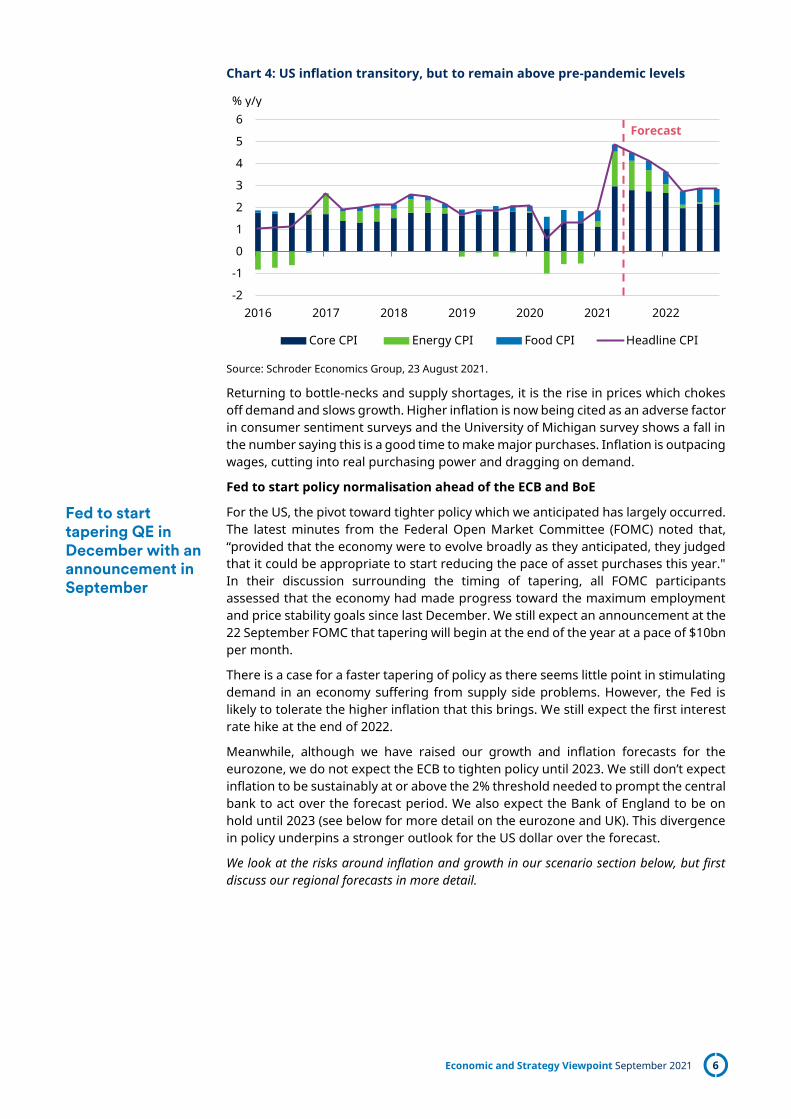
These factors account for much of the increase in our forecast for US inflation which we now expect to come in at 3.8% this year and 3% next (increases of 0.5% and 0.7% respectively). We continue to expect inflation to ease in coming months as base effects pass through and the recovery pushes down unit wage costs.
Core inflation (excluding food and energy) also eases as the jump in prices which has accompanied re-opening fades. However, by the second half of next year the closing of the output gap means that underlying inflation picks up again and core inflation rises more broadly (see chart 4).
60
61
62
63
64
65
66
67
68
1980 1985 1990 1995 2000 2005 2010 2015 2020
%
Recession US Labour Force Participation Rate
Workers have been reluctant to return and many have retired
Economic and Strategy Viewpoint September 2021 6
Chart 4: US inflation transitory, but to remain above pre-pandemic levels
Source: Schroder Economics Group, 23 August 2021.
Returning to bottle-necks and supply shortages, it is the rise in prices which chokes off demand and slows growth. Higher inflation is now being cited as an adverse factor in consumer sentiment surveys and the University of Michigan survey shows a fall in the number saying this is a good time to make major purchases. Inflation is outpacing wages, cutting into real purchasing power and dragging on demand.
Fed to start policy normalisation ahead of the ECB and BoE
For the US, the pivot toward tighter policy which we anticipated has largely occurred. The latest minutes from the Federal Open Market Committee (FOMC) noted that, “provided that the economy were to evolve broadly as they anticipated, they judged that it could be appropriate to start reducing the pace of asset purchases this year." In their discussion surrounding the timing of tapering, all FOMC participants assessed that the economy had made progress toward the maximum employment and price stability goals since last December. We still expect an announcement at the 22 September FOMC that tapering will begin at the end of the year at a pace of $10bn per month.
There is a case for a faster tapering of policy as there seems little point in stimulating demand in an economy suffering from supply side problems. However, the Fed is likely to tolerate the higher inflation that this brings. We still expect the first interest rate hike at the end of 2022.
Meanwhile, although we have raised our growth and inflation forecasts for the eurozone, we do not expect the ECB to tighten policy until 2023. We still don’t expect inflation to be sustainably at or above the 2% threshold needed to prompt the central bank to act over the forecast period. We also expect the Bank of England to be on hold until 2023 (see below for more detail on the eurozone and UK). This divergence in policy underpins a stronger outlook for the US dollar over the forecast.
We look at the risks around inflation and growth in our scenario section below, but first discuss our regional forecasts in more detail.
-2
-1
0
1
2
3
4
5
6
2016 2017 2018 2019 2020 2021 2022
Core CPI Energy CPI Food CPI Headline CPI
% y/y
Forecast
Fed to start tapering QE in December with an announcement in September
Economic and Strategy Viewpoint September 2021 7
Regional views
Europe: upgrades thanks to tourism and pent-up demand
The better than expected growth outturn for the second quarter has led to many economists revising up their forecasts for eurozone GDP for the rest of the year. We recently highlighted not only the good progress governments have made in vaccinating their populations, but also the reduction in restrictions and the upside risk to household consumption thanks to the accumulation of excess savings. Please see the perspective note: “Eurozone’s great reopening to unleash pent-up demand”.
The analysis on household savings and the return to normality has led us to revise up the forecast for household eurozone spending, helping to boost the GDP forecast overall for this year and next. There are some nuances in the near-term, which we will attempt to summarise.
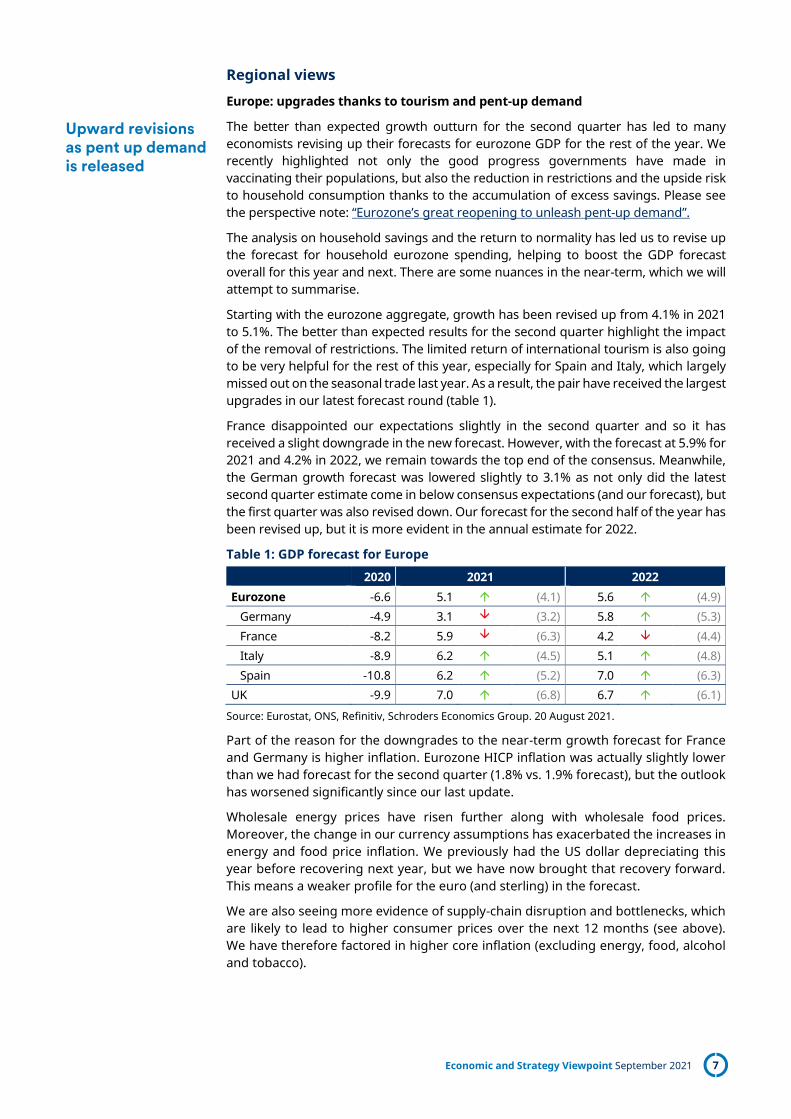
Starting with the eurozone aggregate, growth has been revised up from 4.1% in 2021 to 5.1%. The better than expected results for the second quarter highlight the impact of the removal of restrictions. The limited return of international tourism is also going to be very helpful for the rest of this year, especially for Spain and Italy, which largely missed out on the seasonal trade last year. As a result, the pair have received the largest upgrades in our latest forecast round (table 1).
France disappointed our expectations slightly in the second quarter and so it has received a slight downgrade in the new forecast. However, with the forecast at 5.9% for 2021 and 4.2% in 2022, we remain towards the top end of the consensus. Meanwhile, the German growth forecast was lowered slightly to 3.1% as not only did the latest second quarter estimate come in below consensus expectations (and our forecast), but the first quarter was also revised down. Our forecast for the second half of the year has been revised up, but it is more evident in the annual estimate for 2022.
Table 1: GDP forecast for Europe
2020 2021 2022 Eurozone -6.6 5.1 (4.1) 5.6 (4.9)
Germany -4.9 3.1 (3.2) 5.8 (5.3) France -8.2 5.9 (6.3) 4.2 (4.4) Italy -8.9 6.2 (4.5) 5.1 (4.8) Spain -10.8 6.2 (5.2) 7.0 (6.3)
UK -9.9 7.0 (6.8) 6.7 (6.1)
Source: Eurostat, ONS, Refinitiv, Schroders Economics Group. 20 August 2021.
Part of the reason for the downgrades to the near-term growth forecast for France and Germany is higher inflation. Eurozone HICP inflation was actually slightly lower than we had forecast for the second quarter (1.8% vs. 1.9% forecast), but the outlook has worsened significantly since our last update.
Wholesale energy prices have risen further along with wholesale food prices. Moreover, the change in our currency assumptions has exacerbated the increases in energy and food price inflation. We previously had the US dollar depreciating this year before recovering next year, but we have now brought that recovery forward. This means a weaker profile for the euro (and sterling) in the forecast.
We are also seeing more evidence of supply-chain disruption and bottlenecks, which are likely to lead to higher consumer prices over the next 12 months (see above). We have therefore factored in higher core inflation (excluding energy, food, alcohol and tobacco).
Upward revisions as pent up demand is released
Economic and Strategy Viewpoint September 2021 8
Overall, we have revised up the eurozone HICP inflation forecast from 1.9% for this year to 2.1%, and from 1.3% for 2022 to 1.7%. The monthly profile has headline inflation peaking at 3% in the fourth quarter of this year, before falling back towards 1.5% by the end of the 2022.
For the ECB, the profile we present would not be enough to start the tightening cycle. In the latest ECB press conference, president Christine Lagarde stated that “…the Governing Council expects the key ECB interest rates to remain at their present or lower levels until we see inflation reaching two per cent well ahead of the end of our projection horizon and durably for the rest of the projection horizon, and we judge that realised progress in underlying inflation is sufficiently advanced to be consistent with inflation stabilising at two per cent over the medium term. This may also imply a transitory period in which inflation is moderately above target.” This essentially provides the ECB with far more flexibility than its previous target. Any sign that inflation could be below 2% over the next three years would implicitly support the ECB’s simulative policies.
The ECB is very dovish and has succeeded this quarter in supporting European government bonds into outperforming US Treasuries, helping to weaken the euro against the US dollar. While the temptation to keep stimulus going at its current pace is great, it will be politically difficult to do so. The ECB needs to make a decision by the end of this year, at which point, growth will be very strong, inflation will be close to 3%, and concerns over the pandemic should have subsided. Therefore, the forecast assumes the ECB will end its pandemic emergency purchase programme (PEPP), which we estimate will reduce purchases by about €100 billion per quarter, at the end of the first quarter of 2022.
The traditional form of QE (targeting inflation) will likely continue until 2023, but the ending of PEPP means a 63% reduction in government bond purchases. Tapering of PEPP is very likely from the end of this year as the ECB has been buying more than a steady run-rate, implying a slowdown in purchases unless they are to end early.
UK: strong growth, but with some fragilities
As with the eurozone forecast, the UK growth outlook is also improving. Our forecast for GDP growth has been revised up from 6.8% for 2021 to 7%, and from 6.1% to 6.7% for 2022. Household consumption is forecast to be the main driver thanks to pent-up demand and excess savings, though business investment appears to be ready to rebound, helped by generous tax deductions announced earlier this year.
The UK has also had its inflation forecast revised higher for largely the same reasons as the eurozone. Headline CPI inflation is expected to average 2.3% in 2021 (up from 1.9% previously) and 2.7% in 2022 (1.8% previously). The monthly inflation profile has CPI reaching 3.8% at the end of this year, before falling back to just below 2% by the end of 2022.
The BoE seems reasonably confident in the recovery, but is not concerned by the expected rise in inflation. It shares our view that higher inflation is due to transient factors, and so does not warrant a response yet. However, in its August Monetary Policy Report, the Bank’s governor mentioned the BoE’s forecast is consistent with an increase in the main policy interest rate by the end of the forecast horizon (2024). This is a notable change in language, but not unexpected. Indeed, a single rate rise compared to past recoveries would still be very dovish.
This reflects some fragilities in the economy that raise risks for the economic recovery. First, the housing market has had fuel poured on to the proverbial fire with a stamp duty holiday. This was extended from last year as the second Covid wave hit, but expired at the end of June this year. Providers of house-price data are already reporting slight falls, as so much future demand has been sucked forward to take advantage of the huge tax break.
Dovish ECB unlikely to raise rates despite higher inflation
UK growth and inflation revised up
Economic and Strategy Viewpoint September 2021 9
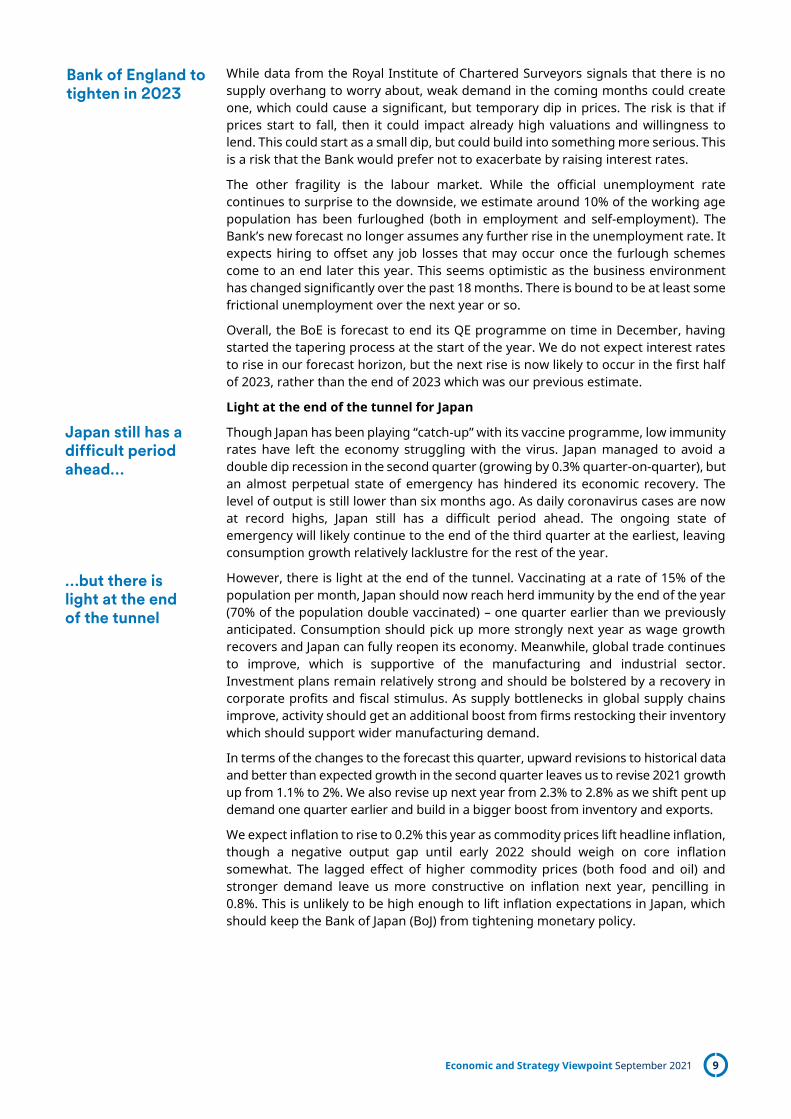
While data from the Royal Institute of Chartered Surveyors signals that there is no supply overhang to worry about, weak demand in the coming months could create one, which could cause a significant, but temporary dip in prices. The risk is that if prices start to fall, then it could impact already high valuations and willingness to lend. This could start as a small dip, but could build into something more serious. This is a risk that the Bank would prefer not to exacerbate by raising interest rates.
The other fragility is the labour market. While the official unemployment rate continues to surprise to the downside, we estimate around 10% of the working age population has been furloughed (both in employment and self-employment). The Bank’s new forecast no longer assumes any further rise in the unemployment rate. It expects hiring to offset any job losses that may occur once the furlough schemes come to an end later this year. This seems optimistic as the business environment has changed significantly over the past 18 months. There is bound to be at least some frictional unemployment over the next year or so.
Overall, the BoE is forecast to end its QE programme on time in December, having started the tapering process at the start of the year. We do not expect interest rates to rise in our forecast horizon, but the next rise is now likely to occur in the first half of 2023, rather than the end of 2023 which was our previous estimate.
Light at the end of the tunnel for Japan
Though Japan has been playing “catch-up” with its vaccine programme, low immunity rates have left the economy struggling with the virus. Japan managed to avoid a double dip recession in the second quarter (growing by 0.3% quarter-on-quarter), but an almost perpetual state of emergency has hindered its economic recovery. The level of output is still lower than six months ago. As daily coronavirus cases are now at record highs, Japan still has a difficult period ahead. The ongoing state of emergency will likely continue to the end of the third quarter at the earliest, leaving consumption growth relatively lacklustre for the rest of the year.
However, there is light at the end of the tunnel. Vaccinating at a rate of 15% of the population per month, Japan should now reach herd immunity by the end of the year (70% of the population double vaccinated) – one quarter earlier than we previously anticipated. Consumption should pick up more strongly next year as wage growth recovers and Japan can fully reopen its economy. Meanwhile, global trade continues to improve, which is supportive of the manufacturing and industrial sector. Investment plans remain relatively strong and should be bolstered by a recovery in corporate profits and fiscal stimulus. As supply bottlenecks in global supply chains improve, activity should get an additional boost from firms restocking their inventory which should support wider manufacturing demand.
In terms of the changes to the forecast this quarter, upward revisions to historical data and better than expected growth in the second quarter leaves us to revise 2021 growth up from 1.1% to 2%. We also revise up next year from 2.3% to 2.8% as we shift pent up demand one quarter earlier and build in a bigger boost from inventory and exports.
We expect inflation to rise to 0.2% this year as commodity prices lift headline inflation, though a negative output gap until early 2022 should weigh on core inflation somewhat. The lagged effect of higher commodity prices (both food and oil) and stronger demand leave us more constructive on inflation next year, pencilling in 0.8%. This is unlikely to be high enough to lift inflation expectations in Japan, which should keep the Bank of Japan (BoJ) from tightening monetary policy.
Bank of England to tighten in 2023
Japan still has a difficult period ahead…
…but there is light at the end of the tunnel
Economic and Strategy Viewpoint September 2021 10
While the central bank’s recent focus has been providing cheap loans to banks financing green projects, its move to make policy more flexible earlier this year has meant less (rather than more) balance sheet expansion. For investors focussed on liquidity, this may have gone under the radar as government bond yields have since moved lower under the power of yield curve control. We now expect the balance sheet to expand only moderately through the forecast horizon, but the BoJ retains the option of ramping up Japanese Government Bond (JGB) purchases if needed.
Finally, Suga’s cabinet approval rating is at a record low. We continue to take the view that he will not gain the support from his party needed to continue after September. This could slow down the reform agenda and mark a change for investors, who, for some years, have seen Japan as source of political stability
Emerging markets
Our forecast for aggregate emerging market (EM) GDP growth remains largely unchanged after the latest round of revisions. Growth received a marginal downgrade for this year and next, but the bigger picture remains that we continue to expect an increase of about 7% this year to give way to a much slower rate of expansion next year of around 4.7%.
Within that, though, there have been some more significant changes, in large part due to the continued impact of Covid in the emerging world. In some EMs, notably in Asia, zero-tolerance strategies and relatively slow vaccine roll-outs have seen governments re-introduce restrictions on activity in response to local outbreaks of the delta variant. This will weigh on activity in the third quarter and put downward pressure on full-year growth. By contrast, activity in other economies such as Brazil, where there have been fewer restrictions despite large numbers of Covid infections, has been surprisingly resilient and we have revised up our forecasts.
Most major EMs are on track to have vaccinated large shares of their populations by year-end, meaning that Covid should have less of an impact on relative growth dynamics across EM next year. But it is still likely to be a challenging time, as attention turns to repairing the fiscal damage caused by the pandemic while current increases in EM interest rates will begin to bite. And all of this will come at a time when we expect US monetary policy to become less accommodative.
China
Growth in China's economy slowed on an annual basis to 7.9% in the second quarter from a record 18.3% in Q1 as powerful base effects continued to distort the national accounts. The economy has already enjoyed a rapid, V-shaped recovery from the Covid crisis, but the rebound has been uneven. Indeed, two-year annualised rates of growth, which cut through some of the noise caused by base effects, show that while China's manufacturing sector has powered ahead, a relatively weak recovery in the labour market has ensured that consumer spending has lagged behind (chart 5).
Political change could slow down the reform agenda
Approaches to Covid will differentiate EM growth in the second half of this year

Economic and Strategy Viewpoint September 2021 11
Chart 5: An uneven recovery in China
Source: Refinitiv Datastream, Schroder Economics Group. 20 August 2021.
Disruptions to supply chains mean that inventories have been cut to the bone around the world and a period of restocking should support activity in the manufacturing sector for a while longer and may stimulate some investment in the sector.
However, the outlook for other parts of the economy is less rosy. The lagged impact of tighter policy, notably the restriction of financing to the real estate sector, will begin to bite in the second half of the year. Meanwhile, the domestic economy faces the additional near-term headwind of the reintroduction of restrictions to tame the spread of Covid after regional outbreaks of the delta variant. Activity is likely to normalise again in the fourth quarter, but we suspect the disruption will still be enough to pull full-year growth for this year down from our previous forecast of 9.2% to about 8.5%.
Evidence of the impending cyclical slowdown has seen policymakers spring into action by lowering reserve requirements for banks and signalling that some public infrastructure projects will be brought forward to cushion the slowdown. More mild easing of policy is likely to be announced but, in the absence of larger stimulatory measures, we continue to expect GDP growth to decelerate to around 5.5% in 2022.
India: RBI to lay the ground for policy normalisation
India has overcome its devastating second wave and while this clearly weighed on activity, high frequency activity indicators and mobility data shows that activity has bounced back very sharply. Powerful base effects are pushing growth up strongly in the second quarter – to around 25% y/y. We do not make any material changes to the outlook. Base effects should wash out in the second half of the year leaving annual growth at 9.1%. Next year, we expect growth to slow to 6.3% as poor credit growth forces us to rule out a structural upswing in investment, leaving consumption as the key lever of growth in a backdrop where households have received little income support.
Inflation has proved challenging for the Reserve Bank of India (RBI). Over the quarter, CPI inflation breached the upper band of the target (6%) driven by supply side disruptions and commodity prices. But inflation has now peaked and should fall to 4.5% by the middle of next year as these factors prove temporary. Meanwhile food inflation, the largest part of the inflation basket, should also fall, helped by the excess rainfall during the monsoon season and favourable base effects.
-12-10
-8-6-4-202468
10
2016 2017 2018 2019 2020 2021
2 Year Annualised Real Growth (%)
Industrial Production Retail Sales* GDP
Further policy easing is likely as China’s economy continues to slow
India has bounced back from its second wave
Inflation has proved challenging for the RBI…
…who should lay the ground for rate hikes next year

Economic and Strategy Viewpoint September 2021 12
However, looking further out to the second half of next year, the recovery in activity should eat into capacity and add to underlying inflation pressure. We expect the RBI to respond, raising the repo rate twice next year. Working backwards, the central bank will likely want to withdraw liquidity earlier in the form of a reverse repo rate hike or via Open Market Operations. Therefore the RBI is likely to turn more cautious on its tone in upcoming meetings given real rates are still negative and most major EMs have started policy tightening already.
Brazil
Brazil's economy has continued to prove more resilient than expected to the Covid crisis. Following a strong first quarter, the economy appears to have eked out some further growth in Q2 on the back of a surge in Brazil's terms of trade and extension of emergency fiscal support. Early leading indicators point to a robust increase in output in the third quarter, and we have revised up our forecast for GDP growth this year to 5.8% from 4.7% previously.
That being said, stronger growth has been accompanied by higher inflation, which climbed to 9% in July. Much of the increase in inflation can be explained by the impact of higher food and energy costs, which will fade in the months ahead. However, core inflation has also picked up, prompting the central bank to accelerate the pace of monetary tightening as it delivered a 100bp increase in the policy Selic rate in August, to 5.25%. We expect rates to climb further to around 7.5% by year-end, which will weigh on activity with a lag of about nine months. The government is likely to push the limits of its fiscal rule to boost public spending ahead of next year's general election. This may lead to bouts of volatility in the financial markets but is unlikely to prevent growth slowing next year, to around 2.7%.
Russia
Like Brazil, Russia's economy has also enjoyed a strong boost to its terms of trade from higher oil prices. And the agreement amongst OPEC+ producers to gradually increase production volumes will add to real GDP growth. As a result, we have revised up our forecast and now expect the economy to expand by 4.5% this year.
However, Russia's economy has also been blighted by higher-than-expected inflation that has forced the central bank to step up the pace of monetary tightening. The CBR also increased its policy rate by 100bp at its last meeting, to 6.5%, and will probably lift it further to around 7.5% during the third quarter. Tighter policy and fading support from the boost to the economy's terms of trade as oil prices level off, or even pull back a little, point to slower growth next year of around 2.3%.
Scenario analysis
The principal risk to our forecast is that the world economy remains constrained by shortages of labour and components, an outcome captured by our supply side inflation scenario. Inflation is higher than in the baseline whilst growth is weaker – a stagflationary outcome.
We recognise that the spread of the delta variant is exacerbating this scenario given the reaction of policymakers who have been prepared to shutdown businesses and key infrastructure to contain the virus. Previously we saw Covid risks as deflationary, but recent experience suggests they are stagflationary given the impact on the supply side of the economy. Consequently, we drop our previous vaccines fail scenario and have rolled these risks into the supply-side inflation variant.
Brazil’s economy has performed well this year, but tighter policy will begin to bite in 2022
Growth to slow in Russia next year as boost from higher oil prices fades
Stagflationary risks predominate
Economic and Strategy Viewpoint September 2021 13
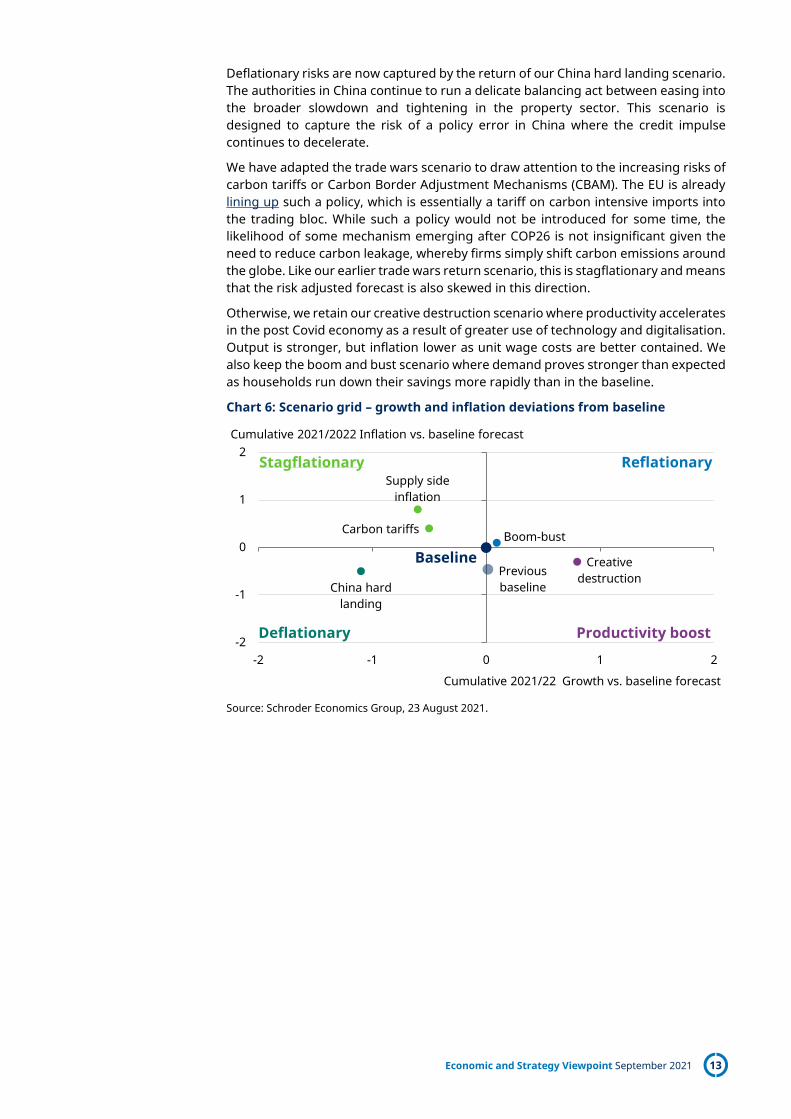
Deflationary risks are now captured by the return of our China hard landing scenario. The authorities in China continue to run a delicate balancing act between easing into the broader slowdown and tightening in the property sector. This scenario is designed to capture the risk of a policy error in China where the credit impulse continues to decelerate.
We have adapted the trade wars scenario to draw attention to the increasing risks of carbon tariffs or Carbon Border Adjustment Mechanisms (CBAM). The EU is already lining up such a policy, which is essentially a tariff on carbon intensive imports into the trading bloc. While such a policy would not be introduced for some time, the likelihood of some mechanism emerging after COP26 is not insignificant given the need to reduce carbon leakage, whereby firms simply shift carbon emissions around the globe. Like our earlier trade wars return scenario, this is stagflationary and means that the risk adjusted forecast is also skewed in this direction.
Otherwise, we retain our creative destruction scenario where productivity accelerates in the post Covid economy as a result of greater use of technology and digitalisation. Output is stronger, but inflation lower as unit wage costs are better contained. We also keep the boom and bust scenario where demand proves stronger than expected as households run down their savings more rapidly than in the baseline.
Chart 6: Scenario grid – growth and inflation deviations from baseline
Source: Schroder Economics Group, 23 August 2021.
Boom-bust
Creative destruction
Carbon tariffs
Supply side inflation
China hard landing
BaselinePrevious baseline
-2
-1
0
1
2
-2 -1 0 1 2
Cumulative 2021/22 Growth vs. baseline forecast
Cumulative 2021/2022 Inflation vs. baseline forecast
Stagflationary Reflationary
Productivity boostDeflationary
Economic and Strategy Viewpoint September 2021 14
Schroders Economics Group: Views at a glance Macro summary – September 2021
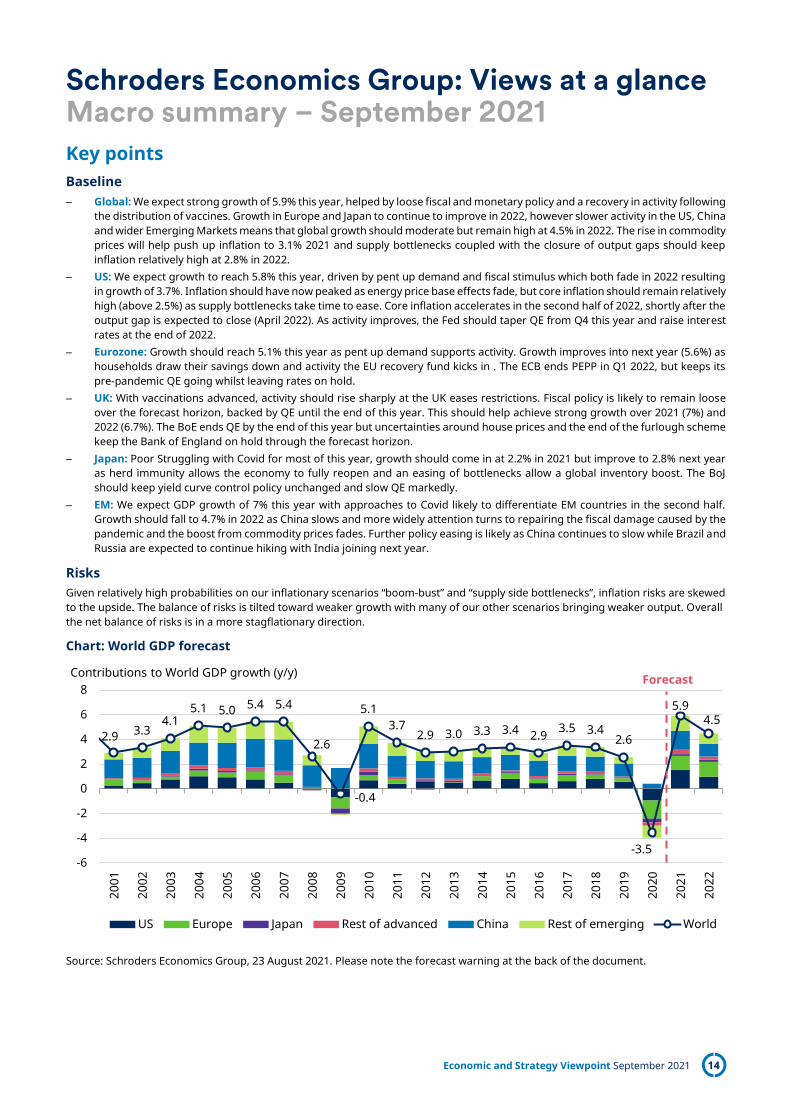
Key points Baseline – Global: We expect strong growth of 5.9% this year, helped by loose fiscal and monetary policy and a recovery in activity following
the distribution of vaccines. Growth in Europe and Japan to continue to improve in 2022, however slower activity in the US, China and wider Emerging Markets means that global growth should moderate but remain high at 4.5% in 2022. The rise in commodity prices will help push up inflation to 3.1% 2021 and supply bottlenecks coupled with the closure of output gaps should keep inflation relatively high at 2.8% in 2022.
– US: We expect growth to reach 5.8% this year, driven by pent up demand and fiscal stimulus which both fade in 2022 resulting in growth of 3.7%. Inflation should have now peaked as energy price base effects fade, but core inflation should remain relatively high (above 2.5%) as supply bottlenecks take time to ease. Core inflation accelerates in the second half of 2022, shortly after the output gap is expected to close (April 2022). As activity improves, the Fed should taper QE from Q4 this year and raise interest rates at the end of 2022.
– Eurozone: Growth should reach 5.1% this year as pent up demand supports activity. Growth improves into next year (5.6%) as households draw their savings down and activity the EU recovery fund kicks in . The ECB ends PEPP in Q1 2022, but keeps its pre-pandemic QE going whilst leaving rates on hold.
– UK: With vaccinations advanced, activity should rise sharply at the UK eases restrictions. Fiscal policy is likely to remain loose over the forecast horizon, backed by QE until the end of this year. This should help achieve strong growth over 2021 (7%) and 2022 (6.7%). The BoE ends QE by the end of this year but uncertainties around house prices and the end of the furlough scheme keep the Bank of England on hold through the forecast horizon.
– Japan: Poor Struggling with Covid for most of this year, growth should come in at 2.2% in 2021 but improve to 2.8% next year as herd immunity allows the economy to fully reopen and an easing of bottlenecks allow a global inventory boost. The BoJ should keep yield curve control policy unchanged and slow QE markedly.
– EM: We expect GDP growth of 7% this year with approaches to Covid likely to differentiate EM countries in the second half. Growth should fall to 4.7% in 2022 as China slows and more widely attention turns to repairing the fiscal damage caused by the pandemic and the boost from commodity prices fades. Further policy easing is likely as China continues to slow while Brazil and Russia are expected to continue hiking with India joining next year.
Risks Given relatively high probabilities on our inflationary scenarios “boom-bust” and “supply side bottlenecks”, inflation risks are skewed to the upside. The balance of risks is tilted toward weaker growth with many of our other scenarios bringing weaker output. Overall the net balance of risks is in a more stagflationary direction.
Chart: World GDP forecast
Source: Schroders Economics Group, 23 August 2021. Please note the forecast warning at the back of the document.
2.9 3.34.1
5.1 5.0 5.4 5.4
2.6
-0.4
5.13.7
2.9 3.0 3.3 3.4 2.9 3.5 3.42.6
-3.5
5.94.5
-6
-4
-2
0
2
4
6
8
2001
2002
2003
2004
2005
2006
2007
2008
2009
2010
2011
2012
2013
2014
2015
2016
2017
2018
2019
2020
2021
2022
Contributions to World GDP growth (y/y)
US Europe Japan Rest of advanced China Rest of emerging World
Forecast
Economic and Strategy Viewpoint September 2021 15
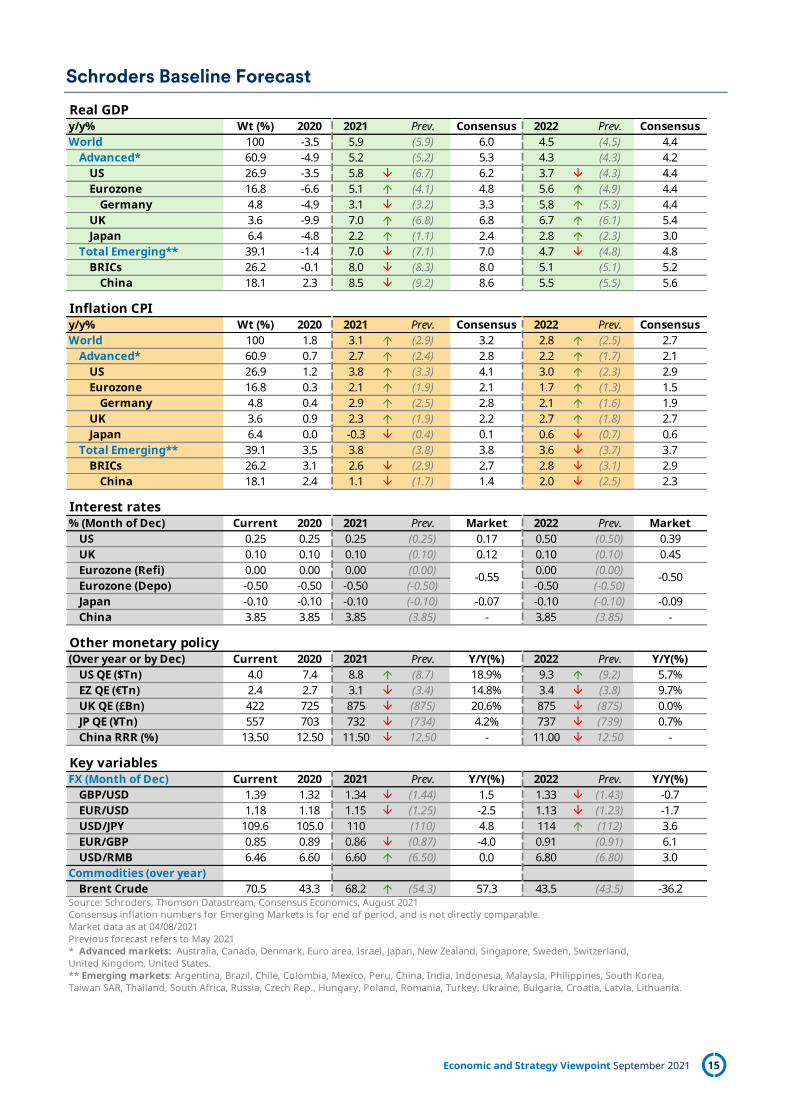
Schroders Baseline Forecast
Real GDPy/y% Wt (%) 2020 2021 Prev. Consensus 2022 Prev. ConsensusWorld 100 -3.5 5.9 (5.9) 6.0 4.5 (4.5) 4.4
Advanced* 60.9 -4.9 5.2 (5.2) 5.3 4.3 (4.3) 4.2US 26.9 -3.5 5.8 (6.7) 6.2 3.7 (4.3) 4.4Eurozone 16.8 -6.6 5.1 (4.1) 4.8 5.6 (4.9) 4.4
Germany 4.8 -4.9 3.1 (3.2) 3.3 5.8 (5.3) 4.4UK 3.6 -9.9 7.0 (6.8) 6.8 6.7 (6.1) 5.4Japan 6.4 -4.8 2.2 (1.1) 2.4 2.8 (2.3) 3.0
Total Emerging** 39.1 -1.4 7.0 (7.1) 7.0 4.7 (4.8) 4.8BRICs 26.2 -0.1 8.0 (8.3) 8.0 5.1 (5.1) 5.2
China 18.1 2.3 8.5 (9.2) 8.6 5.5 (5.5) 5.6
Inflation CPI y/y% Wt (%) 2020 2021 Prev. Consensus 2022 Prev. ConsensusWorld 100 1.8 3.1 (2.9) 3.2 2.8 (2.5) 2.7
Advanced* 60.9 0.7 2.7 (2.4) 2.8 2.2 (1.7) 2.1US 26.9 1.2 3.8 (3.3) 4.1 3.0 (2.3) 2.9Eurozone 16.8 0.3 2.1 (1.9) 2.1 1.7 (1.3) 1.5
Germany 4.8 0.4 2.9 (2.5) 2.8 2.1 (1.6) 1.9UK 3.6 0.9 2.3 (1.9) 2.2 2.7 (1.8) 2.7Japan 6.4 0.0 -0.3 (0.4) 0.1 0.6 (0.7) 0.6
Total Emerging** 39.1 3.5 3.8 (3.8) 3.8 3.6 (3.7) 3.7BRICs 26.2 3.1 2.6 (2.9) 2.7 2.8 (3.1) 2.9
China 18.1 2.4 1.1 (1.7) 1.4 2.0 (2.5) 2.3
Interest rates % (Month of Dec) Current 2020 2021 Prev. Market 2022 Prev. Market
US 0.25 0.25 0.25 (0.25) 0.17 0.50 (0.50) 0.39UK 0.10 0.10 0.10 (0.10) 0.12 0.10 (0.10) 0.45Eurozone (Refi) 0.00 0.00 0.00 (0.00) 0.00 (0.00)Eurozone (Depo) -0.50 -0.50 -0.50 (-0.50) -0.50 (-0.50)Japan -0.10 -0.10 -0.10 (-0.10) -0.07 -0.10 (-0.10) -0.09China 3.85 3.85 3.85 (3.85) - 3.85 (3.85) -
Other monetary policy(Over year or by Dec) Current 2020 2021 Prev. Y/Y(%) 2022 Prev. Y/Y(%)
US QE ($Tn) 4.0 7.4 8.8 (8.7) 18.9% 9.3 (9.2) 5.7%EZ QE (€Tn) 2.4 2.7 3.1 (3.4) 14.8% 3.4 (3.8) 9.7%UK QE (£Bn) 422 725 875 (875) 20.6% 875 (875) 0.0%JP QE (¥Tn) 557 703 732 (734) 4.2% 737 (739) 0.7%China RRR (%) 13.50 12.50 11.50 12.50 - 11.00 12.50 -
Key variablesFX (Month of Dec) Current 2020 2021 Prev. Y/Y(%) 2022 Prev. Y/Y(%)
GBP/USD 1.39 1.32 1.34 (1.44) 1.5 1.33 (1.43) -0.7EUR/USD 1.18 1.18 1.15 (1.25) -2.5 1.13 (1.23) -1.7USD/JPY 109.6 105.0 110 (110) 4.8 114 (112) 3.6EUR/GBP 0.85 0.89 0.86 (0.87) -4.0 0.91 (0.91) 6.1USD/RMB 6.46 6.60 6.60 (6.50) 0.0 6.80 (6.80) 3.0
Commodities (over year)Brent Crude 70.5 43.3 68.2 (54.3) 57.3 43.5 (43.5) -36.2
Consensus inflation numbers for Emerging Markets is for end of period, and is not directly comparable.
Previous forecast refers to May 2021
** Emerging markets: Argentina, Brazil, Chile, Colombia, Mexico, Peru, China, India, Indonesia, Malaysia, Philippines, South Korea,Taiwan SAR, Thailand, South Africa, Russia, Czech Rep., Hungary, Poland, Romania, Turkey, Ukraine, Bulgaria, Croatia, Latvia, Lithuania.
-0.55 -0.50
Source: Schroders, Thomson Datastream, Consensus Economics, August 2021
Market data as at 04/08/2021
* Advanced markets: Australia, Canada, Denmark, Euro area, Israel, Japan, New Zealand, Singapore, Sweden, Switzerland,United Kingdom, United States.
Economic and Strategy Viewpoint September 2021 16
Schroders Forecast Scenarios
*Scenario probabilities are based on mutually exclusive scenarios. Please note the forecast warning at the back of the document.
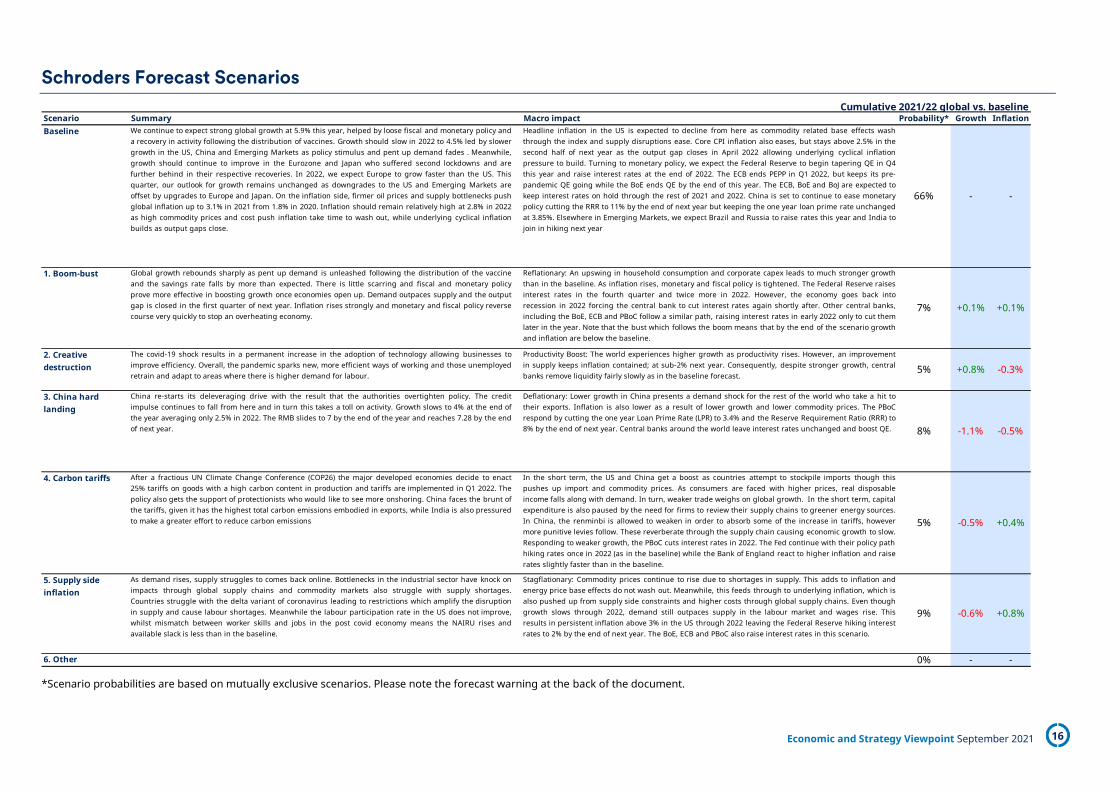
Scenario Summary Macro impact Probability* Growth InflationBaseline We continue to expect strong global growth at 5.9% this year, helped by loose fiscal and monetary policy and
a recovery in activity following the distribution of vaccines. Growth should slow in 2022 to 4.5% led by slowergrowth in the US, China and Emerging Markets as policy stimulus and pent up demand fades . Meanwhile,growth should continue to improve in the Eurozone and Japan who suffered second lockdowns and arefurther behind in their respective recoveries. In 2022, we expect Europe to grow faster than the US. Thisquarter, our outlook for growth remains unchanged as downgrades to the US and Emerging Markets areoffset by upgrades to Europe and Japan. On the inflation side, firmer oil prices and supply bottlenecks pushglobal inflation up to 3.1% in 2021 from 1.8% in 2020. Inflation should remain relatively high at 2.8% in 2022as high commodity prices and cost push inflation take time to wash out, while underlying cyclical inflationbuilds as output gaps close.
Headline inflation in the US is expected to decline from here as commodity related base effects washthrough the index and supply disruptions ease. Core CPI inflation also eases, but stays above 2.5% in thesecond half of next year as the output gap closes in April 2022 allowing underlying cyclical inflationpressure to build. Turning to monetary policy, we expect the Federal Reserve to begin tapering QE in Q4this year and raise interest rates at the end of 2022. The ECB ends PEPP in Q1 2022, but keeps its pre-pandemic QE going while the BoE ends QE by the end of this year. The ECB, BoE and BoJ are expected tokeep interest rates on hold through the rest of 2021 and 2022. China is set to continue to ease monetarypolicy cutting the RRR to 11% by the end of next year but keeping the one year loan prime rate unchangedat 3.85%. Elsewhere in Emerging Markets, we expect Brazil and Russia to raise rates this year and India tojoin in hiking next year
66% - -
1. Boom-bust Global growth rebounds sharply as pent up demand is unleashed following the distribution of the vaccineand the savings rate falls by more than expected. There is little scarring and fiscal and monetary policyprove more effective in boosting growth once economies open up. Demand outpaces supply and the outputgap is closed in the first quarter of next year. Inflation rises strongly and monetary and fiscal policy reversecourse very quickly to stop an overheating economy.
Reflationary: An upswing in household consumption and corporate capex leads to much stronger growththan in the baseline. As inflation rises, monetary and fiscal policy is tightened. The Federal Reserve raisesinterest rates in the fourth quarter and twice more in 2022. However, the economy goes back intorecession in 2022 forcing the central bank to cut interest rates again shortly after. Other central banks,including the BoE, ECB and PBoC follow a similar path, raising interest rates in early 2022 only to cut themlater in the year. Note that the bust which follows the boom means that by the end of the scenario growthand inflation are below the baseline.
7% +0.1% +0.1%
2. Creative destruction
The covid-19 shock results in a permanent increase in the adoption of technology allowing businesses toimprove efficiency. Overall, the pandemic sparks new, more efficient ways of working and those unemployedretrain and adapt to areas where there is higher demand for labour.
Productivity Boost: The world experiences higher growth as productivity rises. However, an improvementin supply keeps inflation contained; at sub-2% next year. Consequently, despite stronger growth, centralbanks remove liquidity fairly slowly as in the baseline forecast.
5% +0.8% -0.3%
3. China hard landing
China re-starts its deleveraging drive with the result that the authorities overtighten policy. The creditimpulse continues to fall from here and in turn this takes a toll on activity. Growth slows to 4% at the end ofthe year averaging only 2.5% in 2022. The RMB slides to 7 by the end of the year and reaches 7.28 by the endof next year.
Deflationary: Lower growth in China presents a demand shock for the rest of the world who take a hit totheir exports. Inflation is also lower as a result of lower growth and lower commodity prices. The PBoCrespond by cutting the one year Loan Prime Rate (LPR) to 3.4% and the Reserve Requirement Ratio (RRR) to8% by the end of next year. Central banks around the world leave interest rates unchanged and boost QE. 8% -1.1% -0.5%
4. Carbon tariffs After a fractious UN Climate Change Conference (COP26) the major developed economies decide to enact25% tariffs on goods with a high carbon content in production and tariffs are implemented in Q1 2022. Thepolicy also gets the support of protectionists who would like to see more onshoring. China faces the brunt ofthe tariffs, given it has the highest total carbon emissions embodied in exports, while India is also pressuredto make a greater effort to reduce carbon emissions
In the short term, the US and China get a boost as countries attempt to stockpile imports though thispushes up import and commodity prices. As consumers are faced with higher prices, real disposableincome falls along with demand. In turn, weaker trade weighs on global growth. In the short term, capitalexpenditure is also paused by the need for firms to review their supply chains to greener energy sources.In China, the renminbi is allowed to weaken in order to absorb some of the increase in tariffs, howevermore punitive levies follow. These reverberate through the supply chain causing economic growth to slow.Responding to weaker growth, the PBoC cuts interest rates in 2022. The Fed continue with their policy path hiking rates once in 2022 (as in the baseline) while the Bank of England react to higher inflation and raiserates slightly faster than in the baseline.
5% -0.5% +0.4%
5. Supply side inflation
As demand rises, supply struggles to comes back online. Bottlenecks in the industrial sector have knock onimpacts through global supply chains and commodity markets also struggle with supply shortages.Countries struggle with the delta variant of coronavirus leading to restrictions which amplify the disruptionin supply and cause labour shortages. Meanwhile the labour participation rate in the US does not improve,whilst mismatch between worker skills and jobs in the post covid economy means the NAIRU rises andavailable slack is less than in the baseline.
Stagflationary: Commodity prices continue to rise due to shortages in supply. This adds to inflation andenergy price base effects do not wash out. Meanwhile, this feeds through to underlying inflation, which isalso pushed up from supply side constraints and higher costs through global supply chains. Even thoughgrowth slows through 2022, demand still outpaces supply in the labour market and wages rise. Thisresults in persistent inflation above 3% in the US through 2022 leaving the Federal Reserve hiking interestrates to 2% by the end of next year. The BoE, ECB and PBoC also raise interest rates in this scenario.
9% -0.6% +0.8%
6. Other 0% - -*Scenario probabilities are based on mutually exclusive scenarios. Please note the forecast warning at the back of the document.
Cumulative 2021/22 global vs. baseline
Economic and Strategy Viewpoint September 2021 17
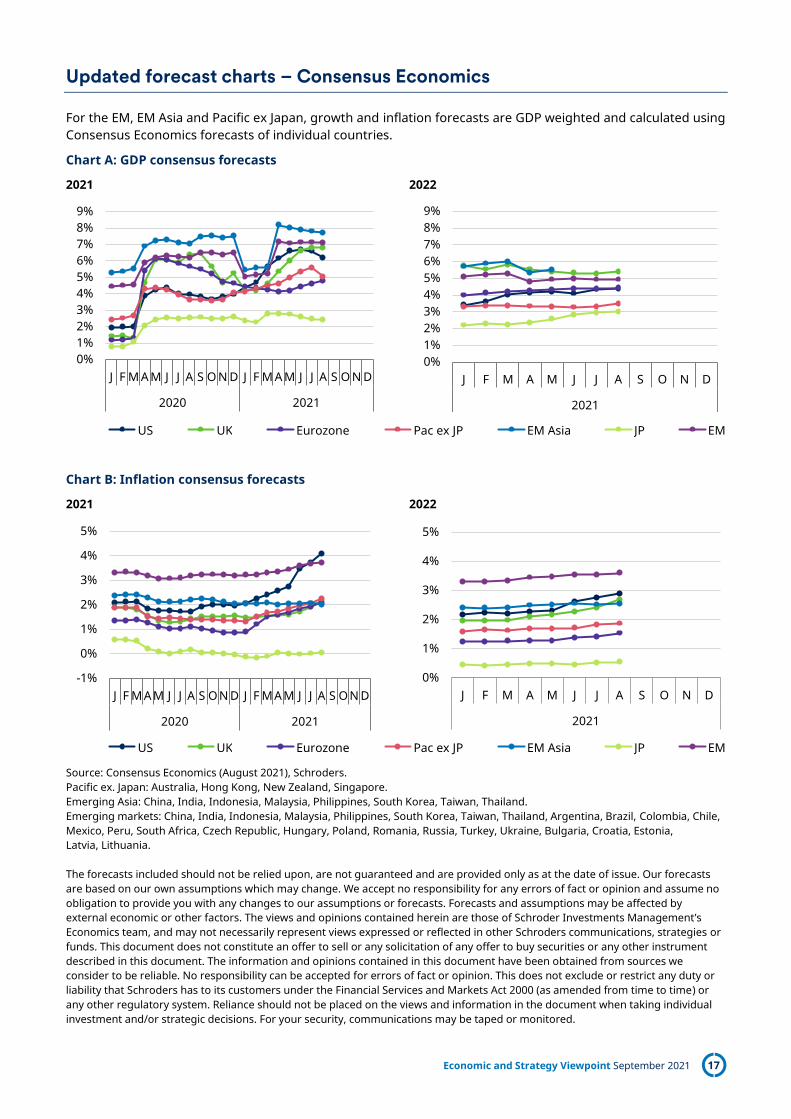
Updated forecast charts – Consensus Economics
For the EM, EM Asia and Pacific ex Japan, growth and inflation forecasts are GDP weighted and calculated using Consensus Economics forecasts of individual countries.
Chart A: GDP consensus forecasts
2021 2022
Chart B: Inflation consensus forecasts
2021 2022
Source: Consensus Economics (August 2021), Schroders. Pacific ex. Japan: Australia, Hong Kong, New Zealand, Singapore. Emerging Asia: China, India, Indonesia, Malaysia, Philippines, South Korea, Taiwan, Thailand. Emerging markets: China, India, Indonesia, Malaysia, Philippines, South Korea, Taiwan, Thailand, Argentina, Brazil, Colombia, Chile, Mexico, Peru, South Africa, Czech Republic, Hungary, Poland, Romania, Russia, Turkey, Ukraine, Bulgaria, Croatia, Estonia, Latvia, Lithuania. The forecasts included should not be relied upon, are not guaranteed and are provided only as at the date of issue. Our forecasts are based on our own assumptions which may change. We accept no responsibility for any errors of fact or opinion and assume no obligation to provide you with any changes to our assumptions or forecasts. Forecasts and assumptions may be affected by external economic or other factors. The views and opinions contained herein are those of Schroder Investments Management’s Economics team, and may not necessarily represent views expressed or reflected in other Schroders communications, strategies or funds. This document does not constitute an offer to sell or any solicitation of any offer to buy securities or any other instrument described in this document. The information and opinions contained in this document have been obtained from sources we consider to be reliable. No responsibility can be accepted for errors of fact or opinion. This does not exclude or restrict any duty or liability that Schroders has to its customers under the Financial Services and Markets Act 2000 (as amended from time to time) or any other regulatory system. Reliance should not be placed on the views and information in the document when taking individual investment and/or strategic decisions. For your security, communications may be taped or monitored.
0%1%2%3%4%5%6%7%8%9%
J F M A M J J A S O N D J F M A M J J A S O N D
2020 2021
0%1%2%3%4%5%6%7%8%9%
J F M A M J J A S O N D
2021
-1%
0%
1%
2%
3%
4%
5%
J F M A M J J A S O N D J F M A M J J A S O N D
2020 2021
0%
1%
2%
3%
4%
5%
J F M A M J J A S O N D
2021
US UK Eurozone Pac ex JP EM Asia JP EM
US UK Eurozone Pac ex JP EM Asia JP EM

Schroder Investment Management Limited
1 London Wall Place, London, EC2Y 5AU Tel: + 44(0) 20 7658 6000
schroders.com
@Schroders Important information: This document is intended to be for information purposes only and it is not intended as promotional material in any respect. The material is not intended as an offer or solicitation for the purchase or sale of any financial instrument. The material is not intended to provide, and should not be relied on for, accounting, legal or tax advice, or investment recommendations. Information herein is believed to be reliable but Schroders does not warrant its completeness or accuracy. No responsibility can be accepted for errors of fact or opinion. Reliance should not be placed
on the views and information in the document where taking individual investment and/or strategic decisions. Past performance is not a reliable indicator of future results, prices of shares and income from them may fall as well as rise and investors may not get back the amount originally invested. Schroders has expressed its own views in this document and these may change. Issued by Schroder Investment Management Limited, 1 London Wall Place, London, EC2Y 5AU, which is authorised and regulated by the Financial Conduct Authority. For your security, communications may be taped or monitored. EU04102.