economic assessment of different air-conditioning and … · · 2015-02-17transport companies...
TRANSCRIPT

EVS28 International Electric Vehicle Symposium and Exhibition 1
EVS28 KINTEX, Korea, May 3-6, 2015
Economic assessment of different air-conditioning and heating systems for electric city buses
based on comprehensive energetic simulations
Dietmar Göhlich, Tu-Anh Ly, Alexander Kunith, Dominic Jefferies
Department Methods for Product Development and Mechatronics Technische Universität Berlin Strasse des 17. Juni 135, 10623 Berlin, Germany
Abstract
The air-conditioning and heating of the passenger cabin in an electric bus leads to a significant increase of
the auxiliaries’ energy consumption. Due to limited battery capacity, the daily operating range of electric
buses depends considerably on the ambient climate. In particular, heating is an energy-intensive process
since no waste heat from the IC engine is available. Energetic simulations show drastic range reductions
when the interior is heated by an electric resistance heater. In contrast, the range reduction can be limited
noticeably if a heat pump is utilised. Therefore, the selection of heating and air-conditioning (HVAC)
systems has a significant impact not only on the range but also on the operating costs of an electric vehicle.
The aim of this study is to conduct a cost analysis for different HVAC systems of an electric city bus. The
economic assessment is based on comprehensive energy consumption simulation and a life-cycle costing
approach considering all expenses of the operation period.
The examination reveals that the heat pump systems feature significant energy savings compared to
conventional HVAC systems. However, over a life span of twelve years, the current high acquisition cost
of a heat pump system is not compensated when only considering direct cost.
Keywords: Electric bus, HVAC systems, energy simulation, economic assessment
1 Introduction Ambitious climate goals of the European Union entailing emission caps [1] demand for the development and deployment of “clean technologies”. Electric vehicles have the potential to achieve sustainable results combined with renewable and non-polluting energy sources. The introduction of alternative drive train technologies, e.g. battery-powered electric bus
systems, is of major importance to decrease the exhaust gas and noise emissions of public transportation. Transport companies around the globe are strengthening their commitment to evaluate the possible substitution of currently deployed conventional diesel buses by carrying out numerous pilot projects [2]. The main market barriers for widespread deployment of electric buses are still high acquisition cost and limited operation range. Urban bus lines are characterized by long daily services.

EVS28 International Electric Vehicle Symposium and Exhibition 2
Exchanging vehicles within daily operation is generally not expedient. Thus, the diurnal required energy for drive and auxiliaries has to be provided onboard or replenished during operation through fast-charging. Therefore, battery-powered elctric buses have to be equipped with an excessive amount of costly batteries – involving a reduction of passenger capacity – in case of overnight charging. Alternatively, an extensive charging infrastructure is required to enable fast-charging en route in order to achieve reasonable daily operating ranges. Facing these issues, research institutions and industry are intensifying their research activities on energy consumption optimization. In particular, the air-conditioning and heating systems are main consumers and lead to shortened ranges since the heat demand of electric buses can not be supplied by waste heat from the combustion engine. Furthermore, the specific energy density of batteries compared to fossil fuels is significantly smaller and hence precludes an arbitrary dimensioning of the battery capacity. Examinations for electric passenger vehicles predict a range reduction of up to 45 % for an ambient temperature of 0°C using an electric resistance heater [3]. In the case of urban buses, the impact on operation range can be expected to further increase due to thermal losses caused by frequent opening of doors at bus stops. The deployment of efficient heating, ventilation and air-conditioning (HVAC) systems is indispensable to cope with range limitation. Electric buses are still often equipped with an additional diesel fueled heating system in order to ensure sufficient operation range. Some projects are testing the innovative deployment of electric heat pumps [4] which feature a more efficient heat supply compared to resistance heaters [5]. The usage of heat pumps in electric buses leads to higher acquisition cost compared to conventional HVAC systems. However, little attention has been paid to the economical assessment of HVAC systems in electric buses from a life-cycle perspective. To the best knowledge of the authors, no comprehensive studies have been carried out elaborating the economic deployment of different HVAC systems, including a heat pump, for electric city buses.
This paper undertakes an economical assessment based on a life-cycle costing analysis for different air-conditioning and heating systems of an electric city bus. The dynamic model was set up using the multi-domain modelling language Modelica. The passenger cabin model takes into account the heat transfer to the surroundings, the heat contained by thermal masses in the cabin (seats, etc.), air exchange through open doors as well as the heat and humidity generated by passengers. The yearly energy consumption for each system under representative climatic conditions and driving cycles is calculated and used as input data for the operating cost assessment. In addition, the acquisition, financial and maintenance cost is considered.
2 Simulation and economic assessment
The economic assessment of HVAC systems for electric buses involves three different systems: System 1: R134a roof top air-conditioner
with electric compressor and an electric resistance heater
System 2: R134a roof top air-conditioner
with electric compressor and diesel fuel heater
System 3: CO2 roof top air conditioner with
electric compressor and additional heat pump mode
The roof top systems were parameterized based on data from real common systems of European manufacturers. Table 1 summarizes the mentioned systems.
Table 1: Investigated Systems
mode system 1 system 2 system 3 heating 30 kW
PTC 30 kW
diesel fuel heater
18 kW CO2 Heat
pump cooling 25 kW
134a AC 25 kW
134a AC 18 kW
CO2 AC
It is worth noting that although system 3 has a lower maximum cooling and heating capacity (18 kW) than systems 1 and 2, differences in the dynamic behaviour of the simulation models were minor. This is because under the boundary conditions applied, a maximum heating/cooling load of 18 kW was seldom exceeded.

EVS28 International Electric Vehicle Symposium and Exhibition 3
In the following section, the applied boundary conditions, energy simulations and the life-cycle cost assessment are described.
2.1 Operating conditions Figure 1 shows the velocity profile of a heavy urban bus line in the city centre of Berlin and the current amount of passengers. The profile shows a round trip from end stop to end stop (and back) including a dwell time at both sides according to the operation plan.
Figure 1: Driving cycle and number of passengers
The average passenger occupancy rate is 22 % which is typical according to [6, 7]. Taking into account the energy consumption model of [8] and the current payload of the drive cycle shown, the energy consumption of the drivetrain (excluding the HVAC system) is 1.52 kWh/km, including an average auxiliary power of 3.35 kW for lights, pumps, air compressor, control units and battery cooling. For the climatic boundary conditions, test reference years (TRY) were considered which have been developed for the simulation of heating and air conditioning systems and the thermal behaviour of buildings. The TRY consists of actual measured weather sections, so that the monthly and yearly mean values represent the long-term mean from 1988 to 2007. The data contains hourly meteorological data of each day for one year and for 15 representative weather stations in Germany [9]. For this study, TRY data for Berlin was selected. Moreover, the hourly data were combined to a mean value per day to reduce the number of simulations. One day is considered from 4 AM to 1 AM which are the typical operating hours of a Berlin city bus.
Figure 2 shows a histogram of days Nd with daily mean temperature T. The corresponding daily mean relative humidity and daily mean global radiation is shown in Figure 3.
Figure 2: Long-term average yearly temperature distribution for Berlin, generated from [9]
Figure 3: Average relative humidity and global irra-diance as a function of temperature, generated from [9]
The heat and humidity generation by passengers is calculated based on [10]. The temperature threshold for heating (Tamb < 20°C) is chosen according to an actual control system deployed in city buses (Wabco ATC-CAN) [11]. The set temperature for the passenger cabin TPC,set is 20°C for heating mode and 25°C for cooling mode as shown in Table 2.
Table 2: Simulation mode
Tamb [°C] mode TPC,set
-15…15 heating 20°C 20…30 cooling 25°C
For the simulation of one whole operating day the simulation of one cycle (see Figure 1) is repeated using the final state values of the former calculation as initial values for the following simulation. The states with start values adapted to the former calculation are the passenger cabin temperature (including thermal mass) TPC and the passenger cabin humidity φPC. For the first simulation of a given day, these initial values were set to the environmental conditions. For the chosen bus route, an operating day consists of 15 cycles. The daily energy demand Wd,total is

EVS28 International Electric Vehicle Symposium and Exhibition 4
given as the sum of the total electric work of the climate system Wel,total of each simulation. The annual energy demand Wa,total of the different climate system combinations is
�a,total � d� �����°�
�����°��d,total (1)
2.2 Energy consumption model The simulation model was set up by using the system modelling language Modelica. The Modelica model is composed of two main components, the passenger cabin model and the HVAC model.
2.2.1 Passenger model The passenger cabin model considers the heat flow and the mass flow with moist air. The total net heat flow is comprised of the heat transfer through windows, doors, and body to the environment ��heatLoss. Additionally the heat input due to solar radiation �� sol , the sensible heat generation by passengers ��pass and the heat contained by thermal masses in the cabin (seats, etc.) �� inner are taken into account.
��net ���pass � ��heatLoss � ��sol � �� inner (2) The mass flow includes the air exchange through open doors (#� doors,in,#� doors,out), the in- and outflow air of the HVAC (#� recircAir,#� treatedAir), the vapour generation of passengers #� vapour,pass and the outflow air #� exitAir. 2.2.2 HVAC model The cooling mode of the HVAC model uses either the R134a or CO2 roof top air conditioner. The heating mode uses either PTC, diesel fuel heater or CO2 heat pump. Figure 4 illustrates the real HVAC system and the interaction between the heating and cooling system as well as the arrangement of components. In reality the heater in system 1 and 2 heats up a liquid circuit which is connected to convectors. Those convectors heat up the passenger cabin air near the floor. The air conditioner is placed on roof and supplies the cabin with cooled or heated air from the top. In this work, the HVAC model was simplified, as shown in Figure 4. The heaters directly heat up the air and all heat transfer into the passenger cabin is from the top. This modification is valid since an
Figure 4: Actual HVAC system and modification for simulation

EVS28 International Electric Vehicle Symposium and Exhibition 5
ideally mixed cabin air is assumed. Moreover, the fresh air ratio of the system was fixed to 10 % for heating mode. Further, it is assumed for the air conditioner that the evaporator and condenser have a constant temperature approach (∆ evap �10K , ∆ cond � 15K� to the inflowing air � evap,air,in, cond,air,in ). This leads to defined evaporation and condensation temperatures:
evap � evap,air,in .∆ evap (3) cond � cond,air,in .∆ cond (4)
The calculation of the evaporator ��evap and condenser capacity ��cond as well as the compressor power ��comp is based on an ideal refrigerant circuit simulation, with neglected pressure drop and ideal control of suction gas overheating. The refrigerant cycle for R134a is illustrated in Figure 5.
Figure 5: Ideal refrigerant cycle for R134a
The suction gas overheating ∆ SH and the condensate subcooling ∆ SC are assumed to be constant (∆ SH = 5 K, ∆ SC = 3 K, according to [12]). The cooling capacity is adjusted by a closed-loop controller with the passenger cabin temperature TPC as controlled variable. The controller output s sets the refrigerant mass flow:
#� R � 4#� R,max (5) The maximum mass flow is determined to yield the cooling capacity in Table 1 at predefined conditions. The CO2 roof top air conditioner with heat pump mode is calculated similarly. In comparison to the R134a air conditioner, the CO2 air conditioner has an additional internal heat exchanger (IHX) and the condenser is denoted gas cooler (GC). Depending on the pressure after the compressor, the operational mode can be transcritical or subcritical. In transcritical mode, an optimal high pressure 5h,opt is assumed for the
system. The optimal high pressure is calculated according to [13] and is dependent on the evaporation temperature evap and the outlet temperature of the gas cooler GC,out. In heat pump mode the evaporator changes its function and becomes a gas cooler. The cooling coefficient of performance (COP) for R134a and CO2 is calculated with equation 6:
789AC � ��evap��comp
(6)
The heating COP for CO2 heat pump mode is:
789HP � ��GC��comp
(7)
To calculate the total COP (789total) of the roof top air conditioner (refrigerant R134a and CO2), the power demand of fans is added to the denominator. The electrical energy consumption of the total system is:
�el,total � ; ���comp ��� fans�=end
=startd> (8)
In heat pump mode, frosting may occur in the evaporator and additional energy is needed to defrost the system. This mechanism was not implemented in the simulation, therefore a correction factor has been chosen. Miller [14] has investigated this effect for the usage of heat pumps in buildings. From his data, defrosting losses were estimated as 11% of the heat pump’s electrical energy consumption in the heating season. This factor has been selected for the correction:
�el,total,HP,corrected � 10.89 ∙ �el,total,HP (9)
The needed heat output of the PTC heater and diesel fuel heater is again controlled by the controller output s.
��PTC � 4��PTC,max (10) ��Fuel � 4��Fuel,max (11)
The energy consumption of these heaters is:
�el,PTC � 1EPTC ; ��PTCd>
=end
=start (12)
EVS28 International Electric Vehicle Symposium and Exhibition 6
�Fuel � 1EFuel ; ��Fueld>
=end
=start (13)
With the fuel density FFueland the lower heating value Gu,Fuel , the volumetric fuel consumption can be obtained.
HFuel � �FuelFFuelGu,Fuel
(14)
2.3 Life-Cycle Cost Assessment The lifecycle costing (LCC) model is composed of acquisition cost, operational cost (subdivided into energy and maintenance cost) and capital financing cost. The input parameters of the LCC model for the three HVAC systems considered are listed in Table 3. The final LCC value is given as the sum of all mentioned costs over the operation period of twelve years. The energy cost was calculated by multiplying the total yearly electricity consumption of each HVAC system with the expected average electricity price over the entire life span (German industrial price for transport companies) [15]. Analogously, the diesel cost of system 2 was determined. In addition, a battery charging efficiency of 90 % was taken into account. The electricity and diesel price for the considered operation lifetime is forecast with 0.157 €/kWh and 1.16 €/l, respectively. The maintenance cost for the HVAC systems includes the expenses for replacement parts as well as for labour. The maintenance cost was determined based on maintenance schedules for each system. The calculation presumes an inflation rate and wage increase of 2 % per year. The acquisition cost represents the cost of purchasing for a bus manufacturer. The input data were obtained from expert interviews with public transport authorities and manufacturers. All data for the LCC assessment are referring to year 2014.
Table 3: Input parameters of the LCC model
Acquisition cost HVAC
System price purchasing price
Operational cost HVAC
Energy consumption, electricity/diesel price
Maintenance labour, spare parts
Financing cost
Interest expenditures
WACC
Furthermore, the operating lifetime of the HVAC systems was assumed equal to the life span of the bus in the fleet of a German transport authority and stated with twelve years. After this period the salvage value is equal to zero. The financing cost covers the interest expenditures for the procurement of the HVAC systems. The weighted average cost of capital (WACC) of a publicly owned German transport operator was assumed as 5 % per year [16].
3 Results
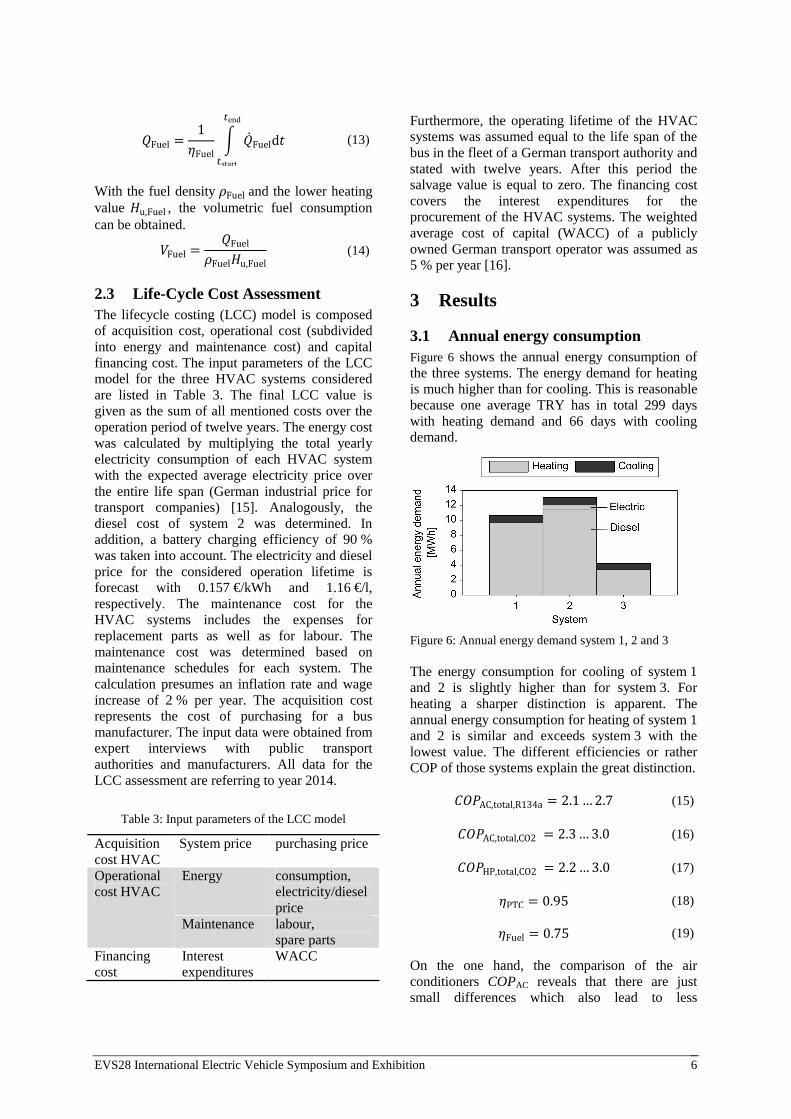
3.1 Annual energy consumption Figure 6 shows the annual energy consumption of the three systems. The energy demand for heating is much higher than for cooling. This is reasonable because one average TRY has in total 299 days with heating demand and 66 days with cooling demand.
Figure 6: Annual energy demand system 1, 2 and 3 The energy consumption for cooling of system 1 and 2 is slightly higher than for system 3. For heating a sharper distinction is apparent. The annual energy consumption for heating of system 1 and 2 is similar and exceeds system 3 with the lowest value. The different efficiencies or rather COP of those systems explain the great distinction.
789AC,total,R134a � 2.1…2.7 (15)
789AC,total,CO2 � 2.3…3.0 (16)
789HP,total,CO2 � 2.2…3.0 (17)
EPTC � 0.95 (18)
EFuel � 0.75 (19) On the one hand, the comparison of the air conditioners COPAC reveals that there are just small differences which also lead to less

EVS28 International Electric Vehicle Symposium and Exhibition 7
significant differences in the amount of energy consumption for cooling. On the other hand, for heating remarkable distinction can be seen between the heaters and the heat pump. The conventional heaters have an efficiency lower 1. This means a certain amount of the input energy cannot be converted into heat. The COP of the heat pump is exceeding 1. The input energy is not only converted but also increased. The following table presents the final result of the total yearly energy consumption for each system.
Table 4: Total yearly energy consumption of HVAC systems
System Energy required [MWh] Total electricity diesel 1 11.80 0 11.80 2 1.84 11.36 13.19 3 5.16 0 5.16
3.2 Life-Cycle Cost Assessment In this study, the annual energy consumption values of three different HVAC systems for
electric city buses were obtained using climate data and a specific bus route as elaborated in section 2.1. Based on the consumption simulation, a cost analysis for the systems was conducted. The life-cycle cost of each system over a period of twelve years was determined in order to evaluate the cost effectiveness for the deployment in electric buses. The final results are presented in Figure 8 and Figure 8. The life-cycle cost over the operating time is shown in Figure 7. The analysis reveals that system 2 “R134a + diesel” is the most economic HVAC configuration followed by system 1 “R134a + PTC”. The initial cost premium comparing the acquisition cost of the heat pump system cannot be totally stemmed over the lifetime by cost beneficial aspects such as lower operating cost. The cost advantages lead to a convergence of the considered systems over the operating period. The cost disadvantage of the heat pump system at the end of twelve years is stated with around 10 % and 20 % comparing to system 1 and 2, respectively.
0
10
20
30
40
50
60
0 2 4 6 8 10 12
Life
-cyc
le c
ost
[00
0's
€]
Operating time [yrs.]
R134a + PTC
R134a + Diesel
CO2-Heat Pump
Figure 7: LCC of HVAC systems over the operating time
0
10
20
30
40
50
60
R134a+PTC (system 1) R134a+Diesel (system 2) CO2 Heat Pump (system 3)
Life
-cyc
le c
ost
[00
0's
€]
Financing cost
Maintenance cost
Energy cost
Acquisition cost
Figure 8: LCC structure of HVAC systems

EVS28 International Electric Vehicle Symposium and Exhibition 8
The cost structure of each system composed of acquisition, financing, maintenance and energy cost is illustrated in Figure 8. It can be observed that the acquisition cost in case of the system 3 and the energy cost considering system 1 and 2 are dominant cost drivers. The relative high acquisition cost of system 3 leads to significant higher financing cost. Furthermore, higher efficiency of the heat pump systems generate energy cost savings of 50 % compared to system 2 and almost 60 % to system 1. With regard to the maintenance expenses, system 3 features considerably higher cost than the other systems with a premium of around 35 % due to the all-season operation of the refrigerant circuit. Over a period of twelve years system 1 and 2 prevail over system 3. Further studies indicate that the cost neutrality of system 3 is achieved after 17 when compared to system 1 and 22 years when compared to system 2.
4 Conclusion The optimization of energy consumption for electric buses leads to a rethinking of HVAC systems. Efficient HVAC systems are a key factor to overcome the range limitations of electric buses. The deployment of a heat pump is a promising solution to reduce the required energy significantly. However, currently the utilization of heat pumps cause significant higher acquisition cost compared to conventional systems. A life-cycle cost assessment of two conventional HVAC systems and the innovative deployment of CO2 heat pump in electric buses were conducted. The required energy for the bus air-conditioning in a reference year was determined by a comprehensive simulation involving a passenger cabin and HVAC model. The annual energy consumption served as the basis for the economic assessment. The cost analysis includes the acquisition, financial and operational cost over the entire service life. The energy consumption simulation reveals that with the deployment of a CO2 heat pump such as of system 3 the energy consumption can be reduced by more than 50 % under the outlined scenario. The underlying bus line specifications and derived technical data are typical for urban areas and electric buses and hence the presented results are reasonable from an operational perspective. However, the distinct energy savings of the heat pump system does not lead to a compensation of
higher acquisition and slightly higher maintenance cost over the operating time of twelve years compared to the “R134a + PTC” and “R134a + diesel” HVAC system. Since the current acquisition cost of heat pump systems are based on low production quantities, it can be expected that with an increase production volume noticeable economies of scale can be realized implicating cost reduction. A heat pump cost reduction of 20 % is bringing forward the cost break-even of the considered systems to 9 years in case of system 1 and 15 years for system 2. Some limitations of the modelling approach are worth noting. With regards to the HVAC model, the mentioned simplification excludes the impacts of heat exchangers (see equation 3 and 4). Although a comprehensive life-cycle cost model was applied, the impact of energy savings on the ability to extend the daily operating range and on smaller dimensioning batteries were not taken into account. Due to energy savings by deploying a heat pump system, cost reduction from smaller battery systems could be realized. Furthermore, the advantage of system 1 and 3 to prevent emission was out of scope of this study. Future work should therefore include the cost effects of the entire bus system when assessing the deployment of HVAC systems. Moreover, the evaluation of bus route specific characteristics such as occupancy rate and its effects on HVAC consumption should be examined.
Acknowledgements
The authors gratefully acknowledge the financial support provided by the German Federal Government. This research was carried out as a part of the German Federal Government’s Showcase Regions for Electromobility [17]. The funding is issued by the Federal Ministry of Transportation and Digital Infrastructure.
References [1] European Commission, http://ec.europa.eu/clima /policies/roadmap, accessed on 2014-12-02.
[2] A. Kunith, D. Goehlich, R. Mendelevitch, Planning and optimization of a fast-charging infrastructure for electric urban bus systems, Proceedings of ICTTE, Belgrade, ISBN 978-86-916153-2-1, 2014, 43-50.
[3] H.H. Braess (Ed.), U. Seiffert (Ed.), Vieweg Handbuch Kraftfahrzeugtechnik, ISBN 978-3-658-01691-3, Wiesbaden, Springer Vieweg, 2013.

EVS28 International Electric Vehicle Symposium and Exhibition 9
[4] Transport Operator Braunschweig, http://www.verkehr-bs.de/unternehmen/ forschungsprojekt-emil.html, accessed on 2015-01-20.
[5] U. Hesse, M. Arnemann, T. Hartmann, Ergebnisse von R 744 Wärmepumpen-Applikationen im Fahrzeug (Results of R 744 heat pump application in passenger vehicle), http://www.dkv.org/index.php?id=9&no_cache=1, accessed on 2015-01-05.
[6] Verband Deutscher Verkehrsunternehmen (VDV), VDV-Statistik 2013 (VDV statistics 2013), https://www.vdv.de/jahresbericht---statistik.aspx, accessed on 2015-01-05.
[7] Verband Deutscher Verkehrsunternehmen (VDV), VDV 236-1: Life-Cycle-Cost-optimierte Klimatisierung von Linienbussen (Life-Cycle-Cost-optimized climate control of buses), 2009.
[8] D. Goehlich, A. Kunith, T. Ly, Technology assessment of an electric urban bus system for Berlin, Urban Transport XX, ISBN 978-1-84564-778-0, 2014, 131-150.
[9] BBSR Homepage Testreferenzjahre - Beitrag 2, http://www.bbsr-energieeinsparung.de/EnEV Portal/DE/Regelungen/Testreferenzjahre/Testreferenzjahre/, accessed on 2015-01-20.
[10] Verein Deutscher Ingenieure (VDI), VDI-Richtlinie 2078: Berechnung von Kühllast und Raumtemperaturen von Räumen und Gebäuden (Calculation of cooling load and room temperatures of rooms and buildings), 2012, Eq. 12.
[11] Wabco Vehicle Control Systems, Automatic Temperature Control with CAN in MAN-city bus with WABCO ATC (System description), http://inform.wabco-auto.com/intl/pdf/815/00/ 14/8150100143.pdf, accessed on 2015-01-20.
[12] H. Jungnickel, R. Agsten, W.E. Kraus, Grundlagen der Kältetechnik (Fundamentals of Refrigeration), ISBN 978-3341008065, Berlin, Verlag Technik, 1990.
[13] J. Sakar, S. Bhattacharyya, M.R. GOPAL, Optimization of a transcritical CO2 heat pump cycle for simultaneous cooling and heating applications, Int. Journal of Refrigeration, ISSN 0140-7007, 27 (2004), 830–838.
[14] W.A. Miller, Laboratory examination and seasonal analysis of frosting and defrosting for an air-to-air heat pump. ASHRAE Transactions, ISSN 0001-2505, 93 (1987), 1474–1489.
[15] Prognos, EWI, GWS, Development of Energy Markets – Energy Reference Forecas, http://www.bmwi.de/DE/Mediathek/publikationen,did=644920.html, accessed on 2015-01-29.
[16] C. Boettger, Ergebniskennzahlen und marktübliche Renditen (Earning figures and normal market return), Verkehr und Technik, 3 (2013), 101-106.
[17] Schowcase Electromobility, http://schaufenster-elektromobilitaet.org/en/content/index.html, accessed on 2015-01-30.
Authors
Prof. Dr.-Ing. Dietmar Goehlich leads the Department of Methods of Product Development and Mechatronics at the Technische Universität Berlin since 2010. He is also coordinator of the Electromobility Research Network of the TU Berlin. He previously held a senior management position at Daimler AG. His research focus lies on the field of electromobility and innovative methods in the product development process.
Tu-Anh Ly joined the Department of Methods of Product Development and Mechatronics at the Technische Universität Berlin as a research associate in 2013. She is a member of the Research Network Electromobility at the TU Berlin. Her research is focussed on energy simulation and consumption optimization in the field of electromobility.
Alexander Kunith joined the Department of Methods of Product Development and Mechatronics at the Technische Universität Berlin as a research associate in 2013. He is a member of the Research Network Electromobility at the TU Berlin. His research is focussed on technology assessment in the field of electromobility.
Dominic Jefferies joined the Department of Product Development Methods and Mechatronics at the Technische Universität Berlin as a student assistant in 2014. He is a member of the Research Network Electromobility at the TU Berlin.