economic assessment of nj oswt-sept08ed
TRANSCRIPT

A REPORT FOR:
The State of New Jersey
PREPARED BY:
Global Insight Travel & Tourism
1510 Chester Pike 800 Baldwin Tower
Eddystone, PA 19022
Global Insight Energy
24 Hartwell Avenue Lexington, MA 02421
September 2008
AN ASSESSMENT OF THE POTENTIAL COSTS AND BENEFITS OF OFFSHORE WIND TURBINES

An Assessment of Potential Costs and Benefits of Offshore Wind Turbines 2
Table of Contents
1. INTRODUCTION ................................................................................................................................ 3
2. EXECUTIVE SUMMARY.................................................................................................................. 6
3. ENERGY BENEFITS AND COSTS................................................................................................. 11 3.1 ECONOMIC BENEFITS TO CONSUMERS AND BUSINESSES ............................................................... 11 3.2 EMISSION REDUCTIONS AND BENEFITS......................................................................................... 20 3.3 ECONOMIC BENEFITS TO WIND FARM OWNERS............................................................................ 22
4. TOURISM BENEFITS AND COSTS............................................................................................... 27 4.1 TOURISM IMPACT: LITERATURE REVIEW....................................................................................... 30 4.2 TOURISM IMPACT: OVERVIEW....................................................................................................... 31 4.3 FOREGONE TOURISM SALES .......................................................................................................... 36 4.4 TOURISM'S BENEFIT ...................................................................................................................... 46 4.5 TOURISM NET IMPACTS................................................................................................................. 48 4.6 TOURISM CONCLUSIONS................................................................................................................ 55
5. PROPERTY VALUE IMPACTS AT THE NEW JERSEY SHORE ............................................ 56 5.1 PROPERTY VALUES: OVERVIEW .................................................................................................... 56 5.2 RESIDENTIAL PROPERTY VALUES.................................................................................................. 58 5.3 COMMERCIAL PROPERTY VALUES................................................................................................. 65 5.4 PROPERTY VALUES CONCLUSIONS................................................................................................ 79
6. ECONOMIC IMPACTS ON COMMERCIAL AND RECREATIONAL FISHERIES ............. 81 6.1 ECONOMIC IMPACTS ON COMMERCIAL AND RECREATIONAL FISHERIES........................................ 81 6.2 FISHERIES AND WIND FARMS ........................................................................................................ 83 6.3 CONCLUSIONS ON FISHERIES ......................................................................................................... 93
7. INCREMENTAL IMPACTS ON NJ BRAND IMAGE: DESTINATION AND BUSINESS LOCATION ................................................................................................................................................ 95
7.1 INCREMENTAL IMPACTS ON NJ BRAND IMAGE: DESTINATION AND BUSINESS LOCATION............. 95 8. CONCLUSION................................................................................................................................. 101
9. APPENDICES .................................................................................................................................. 104

An Assessment of Potential Costs and Benefits of Offshore Wind Turbines 3
1. Introduction Global Insight is pleased to present our report to assess the benefits and costs of a planned 288-MW1 offshore wind turbine farm on the New Jersey shore. More than simply assessing the economic impact of developing the wind farm, Global Insight has executed a comprehensive analysis of the energy, tourism, construction, property value, image, fishing, and economic development implications of the power-generation facility.
Our hope and expectation is that the state of New Jersey, and its constituencies will be able to utilize this research and results to help make a more informed go/no-go decision on wind farm development. The results of our research will also help provide a more comprehensive explanation of the benefits and costs to policy makers, businesses, and citizens.
The economic benefits of construction, operation, and additional generation capacity are perhaps most easily recognized, although a measurement challenge in their own right. The offshore facility will also impact tourism, fishing, economic development, property values, and New Jersey's overall brand image as a destination and place to live/work.
The geographic area studied mirrors the concurrent New Jersey Department of Environmental Protection (NJDEP)-sponsored environmental impact analysis. This area is defined as an area extending generally from Toms River in the north, to Stone Harbor in the south and extending out 20 nautical miles. The analysis will consider the effect of locating the wind farm at 3, 6, 12, and 20 nautical miles from shore.
1 This analysis is done on a 288 MW wind farm. New Jersey's test facility can be up to 350 MW. The difference does not affect the analysis in any material manner.

An Assessment of Potential Costs and Benefits of Offshore Wind Turbines 4
Figure 1.1: Examples of Potential Wind Farm Locations2
The economic analysis of the proposed offshore wind energy project involves comparison of the benefits and costs with and without an offshore wind turbine development from the local perspective, to New Jersey as a whole. The wind turbine development analysis assumes a 20-year life span
The report is comprised of separate analyses of the benefits and costs of each major sector that is touched by the offshore wind farm including:
• Turbine construction, operation, and maintenance (over a 20-year operating horizon)
• Electricity prices
• Fossil fuel emission reductions and the cost savings of lower CO2 levels under the proposed Lieberman-Warner Bill.
2 Wind Farm locations are for illustrative purposes only. Global Insight does not have any information on where a wind farm might be located.

An Assessment of Potential Costs and Benefits of Offshore Wind Turbines 5
• Potential tourism benefits/costs from a change in destination image, improved water-based recreation activities, and/or the development of a wind turbine educational attraction
• Potential benefits/costs to the commercial and recreational fishing industries
• Potential economic development benefits/costs including job growth, business location/relocation, and residential in/out migration
• Potential branding/image benefits/costs on location decisions of businesses, employees, and visitors
• Potential reductions/increases in property values, both residential and commercial, and their resulting impact on housing wealth, property tax revenues, and real estate commissions
The following chapters contain a detailed 360° view of wind farm costs and benefits; Global Insight will generate a summary assessment. Specifically, we enumerate a comparison of the New Jersey economy under two scenarios, "With-Turbines" and "Without Turbines." Costs and benefits for each scenario will be monetized wherever possible and expressed in net present value terms (from a 20-year planning horizon). The result will provide the state with a comprehensive, detailed, and comparative accounting of wind farm benefits and costs. A summary level analysis will result in a benefit/cost ratio that will help to communicate the net value of an offshore wind turbine facility.

An Assessment of Potential Costs and Benefits of Offshore Wind Turbines 6
2. Executive Summary Global Insight is pleased to present our report to assess the benefits and costs of a planned 288-MW offshore wind turbine farm on individual counties along the New Jersey coast along with the whole state. More than simply assessing the economic impact of developing the wind farm, Global Insight has executed a comprehensive analysis of the energy, tourism, construction, property value, image, fishing, and economic development implications of the power generation facility.
The following analysis represents potential costs or benefits to individual counties on the Jersey Shore and to the state of New Jersey as a whole. In most cases, assumptions have been made that would produce the largest negative impact of a potential wind farm. As such, any impact should be viewed as a maximum negative impact as the result of a potential wind farm compared to a no wind farm scenario.
The NJ Wind Farm project would be among the first off-shore renewable energy facilities of its kind, possibly the first in the United States. While interesting for its precedent-setting qualities, the potential economic benefits and the costs of a 288-MW wind farm are not large, in comparison to the state and county economies, and based on the assumptions made to show the largest possible negative impact of a wind farm.
Further, these economic impacts are reduced as the proposed locations move further offshore. The economic impacts of a proposed wind farm should be read as either foregone growth in revenues (e.g. growing more slowly than trend), or as additional growth in revenues beyond trend, in the case of positive impacts.
Specific findings include:
• The offshore wind pilot could generate 717-Gigawatt (GW) hours per year, about 1% of generational output; but because wholesale power prices are set by the generation of last resort—usually natural gas—the impact on the price of electricity is negligible.
• The offshore wind farm is likely to have a small, but positive effect on congestion pricing.
• Greenhouse gas emissions will potentially drop by 430,000 metric tons (measured by CO2 emissions).
• The wind farm is assumed to operate at 35% of capacity from October to May; only 15% in the summer peak months. As a result, there will be minimal change in reliability and connectivity issues statewide.
• Construction costs of an offshore wind farm range from $1 to $1.3 billion. Of that amount, about $330 million would be spent in New Jersey.
• Tourism spending forgone or gained as the result of a proposed offshore wind farm will directly affect only that county that is closest to the wind farm.

An Assessment of Potential Costs and Benefits of Offshore Wind Turbines 7
• The impact on tourism sales to the whole state of New Jersey will be the net effect in the affected county along with the substitution of different shore counties within New Jersey by some travelers.
• Tourism sales impacts are temporary and decline quickly.
• With a wind farm located three miles offshore, net tourism sales lost in Atlantic County, compared with the case of no wind farm, could potentially reach 2.7% of total tourism sales in Atlantic County in 2012, or $474 million. In Cape May County, foregone tourism sales could potentially reach 2.4% of the total county-projected tourism sales in 2012, or $156 million. In Ocean County, the three-mile offshore wind farm location would impact 3.6% of Ocean County tourism sales in 2012.
• For Cape May County, the $156 million difference in tourism spending between a no wind farm scenario and a scenario with a wind farm located three miles offshore would result in an economic impact to Cape May County (Gross County Product) of $70 million being relinquished. Forgone direct wages in the county could reach $28 million with a difference of $42 million in total labor income as 1,081 jobs would potentially not be created.
• Statewide, locating the wind farm three miles off the coast of Cape May County could result in $156 million difference in tourism spending in Cape May County and a potential increase in spending in the other shore counties of $64 million, as the result of travelers substituting other shore locations for their visits. Tourism sales forgone in New Jersey as the result of a wind farm off of Cape May County could reach $91 million. The statewide forgone value added could reach $31 million in this scenario.
• The net present value (NPV) in Ocean County of the maximum level of the stream of net forgone tourism sales in Ocean County with a wind farm three miles offshore is just under $400 million, in 2012 dollars. This number reflects the NPV of the potential net forgone tourism sales in Ocean County over the operational lifetime of the wind farm
• The difference in lost revenues drops significantly if a potential wind farm were to be located six miles versus three miles offshore. For example, the net effect on Cape May's tourism sales with a wind farm located six miles offshore of Cape May County could potentially increase tourism sales by $16 million. Locating a proposed wind farm six miles offshore of Atlantic County could result in net forgone county tourism sales of up to $125 million in 2012, a decrease in forgone sales by almost two-thirds from the three mile case. Net tourism sales in Ocean County could potentially decline $53 million in 2012, if a wind farm were to be located six miles off of Ocean County beaches.
• The net present value of the forgone county tourism sales in Cape May County could potentially reach $101 million with a wind farm located six miles offshore of Cape May County.
• At 12 and 20 miles, both Atlantic and Cape May counties could potentially gain tourism sales in their counties with a wind farm located off of their county in comparison to a no wind farm case. Cape May County's tourism sales could be $16 million higher with a wind farm 20 miles offshore than with no wind farm. Atlantic County's difference could
An Assessment of Potential Costs and Benefits of Offshore Wind Turbines 8
reach $14 million. Ocean County would still see a potential tourism sales decrease of potentially $53 million with a wind farm 20 miles offshore of Ocean County.
• With a wind farm located 20 miles offshore, the State of New Jersey as a whole is expected to gain tourism sales no matter which county is affected by a wind farm, over a no wind farm scenario. This occurs as either the gain in tourism sales within the affected county offsets any foregone sales in that county or the displacement of tourism sales to other shore counties offsets the potential foregone sales. A wind farm off the coast of Atlantic County is projected to bring the largest gain to the state. Tourism sales in Atlantic County could increase by $14 million; displaced Atlantic County sales to other shore counties could add another $51.5 million in sales, for a total increase in tourism sales of potentially over $65 million statewide.
• Any impact on residential property values by a proposed wind farm would occur on oceanfront and ocean-view properties only. Any difference between having wind farms at certain distances versus a no wind farm case would be the result of the visual impact of a potential wind farm.
• A potential wind farm three miles offshore could potentially decrease residential property values in Cape May County by less than 1% of the projected shore town residential property values in 2012. The value of the impact could reach up to $244 million. The reduction in residential property values with a wind farm six miles off of Cape May County in 2012 could reach $122 million in comparison to a scenario with no wind farm. There would be no residential property value lost if a proposed wind farm were located 20 miles offshore, the wind farm is located out of visual view. The affected residential property values in Atlantic and Ocean, percentage wise, would be similar.
• The potential residential property value differences would result in lower property tax revenue compared to not having a wind farm. At three miles, affected towns in Ocean County would potentially lose up to $1.3 million in property tax revenue in 2012. The decline in affected towns in Atlantic County could reach a maximum of under $1.6 million. The property tax decline in all three counties would decrease to a potential difference of under $800,000 if the proposed wind farm were to be located six miles off shore and to around $200,000 at 12 miles. As there is no residential property impact at 20 miles, neither is there a tax impact.
• Residential property differences as the result of a wind farm do not start to decline until a wind farm has been operating for two years.
• Tourism sales forgone or gained because of having a wind farm located off a county's coast would affect commercial property values.
• Atlantic County has the most commercial property at risk.
• In 2012, a proposed wind farm three miles off the shore of Atlantic City could have as much as a negative $70 million commercial property value difference in Atlantic County than in a no wind farm scenario. A wind farm located three miles off the coast of Cape May County could potentially result in lower commercial property values of 1.8%, or just

An Assessment of Potential Costs and Benefits of Offshore Wind Turbines 9
under $15 million in Cape May County, compared with the no wind farm scenario in 2012.
• At a six mile distance offshore of Atlantic County, the wind farm could potentially lower commercial property values by a maximum of $20 million in Atlantic County. In Cape May County, a potential wind farm could result in higher commercial property values of over $1 million in the county, compared to the no wind farm scenario in 2012.
• At 12 and 20 miles, the commercial property difference in Atlantic County would be a gain of about $160,000, not a significant change from the case of no wind farm off Atlantic County's coast. At distances of six miles and beyond in Cape May and Ocean counties, the commercial property impact of a wind farm remains level.
• As commercial property values are assumed to be influenced by differences in tourism sales among the scenarios and tourism sales impacts are temporary, commercial property impacts are also temporary.
• While a potential wind farm's impact on tourism, property values and image can be assessed using the information available, the fisheries impacts are very location dependant. Many of the economic impacts from a proposed offshore wind farm will be site specific and Global Insight, at the time of this report, does not have any specific sites to analyze. In general, none of the public research on wind farms in the public domain shows a large impact on fisheries. It can be stated that, with smart site selection, the impact of the construction and operations of an offshore wind farm in New Jersey is not likely to have a large economic impact on fishing.
• Three different valuation methods were examined to evaluation the potential impact of a wind farm on commercial and recreational fisheries. The major effect of an offshore wind farm on commercial and recreational fishing industry would be during the construction phase. During that phase, it is assumed that the grounds around the wind farm would be closed to recreational and commercial fishing boats and that catch value could differ from the no wind farm case by $150,000 to $6.5 million.
• Once a wind farm is established and the location is opened back up to the fishing industry, the catch value difference is expected to drop to a range of under $100 per year to about $5,000 per year. Locating a wind farm six, twelve, or twenty miles offshore, the difference in catch value to a no wind farm case would be negligible during operations.
• Total present value to the fishing industry of a potential wind farm's construction and operations under these scenarios would range from $154,000 to $6.6 million.
• Once a site has been selected, it is recommended that more studies on the environmental impact be completed to garner a more complete picture of the environment around the potential wind farm. Every acre off the coast of New Jersey is not created equal—in terms of the fish resources themselves, biologically, and for the fisheries, economically—and the impact of the wind farms will be drastically different from one location to the next.

An Assessment of Potential Costs and Benefits of Offshore Wind Turbines 10
• As a stand-alone project, the proposed wind farm will most likely have minimal impact on New Jersey's and the Shore's brand image but, the proposed wind farm can improve New Jersey's brand image with a holistic, credible, accountable green action plan. The ability for the 288-MW proposed wind farm to change New Jersey's brand image would be lessened if other neighborhood, complementary destinations states also propose, build, and operate wind farms, as Delaware, Rhode Island, Long Island (New York), and Massachusetts have proposed.
An Assessment of Potential Costs and Benefits of Offshore Wind Turbines 11
3. Energy Benefits and Costs
3.1 Economic Benefits to Consumers and Businesses
3.1.1 No Consumer Benefit Because Natural Gas Sets Power Prices3
All Generators Receive One Price in a Deregulated Market
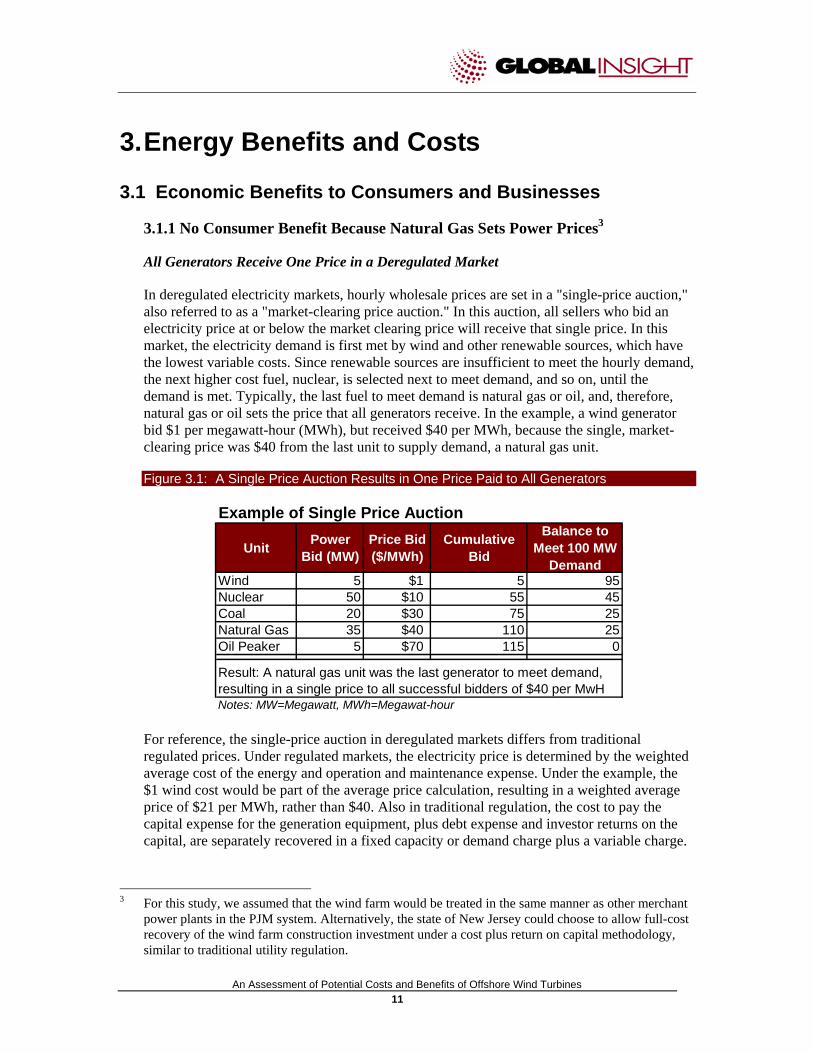
In deregulated electricity markets, hourly wholesale prices are set in a "single-price auction," also referred to as a "market-clearing price auction." In this auction, all sellers who bid an electricity price at or below the market clearing price will receive that single price. In this market, the electricity demand is first met by wind and other renewable sources, which have the lowest variable costs. Since renewable sources are insufficient to meet the hourly demand, the next higher cost fuel, nuclear, is selected next to meet demand, and so on, until the demand is met. Typically, the last fuel to meet demand is natural gas or oil, and, therefore, natural gas or oil sets the price that all generators receive. In the example, a wind generator bid $1 per megawatt-hour (MWh), but received $40 per MWh, because the single, market-clearing price was $40 from the last unit to supply demand, a natural gas unit.
Figure 3.1: A Single Price Auction Results in One Price Paid to All Generators
Example of Single Price Auction
Unit Power Bid (MW)
Price Bid ($/MWh)
Cumulative Bid
Balance to Meet 100 MW
DemandWind 5 $1 5 95Nuclear 50 $10 55 45Coal 20 $30 75 25Natural Gas 35 $40 110 25Oil Peaker 5 $70 115 0
Result: A natural gas unit was the last generator to meet demand, resulting in a single price to all successful bidders of $40 per MwHNotes: MW=Megawatt, MWh=Megawat-hour
For reference, the single-price auction in deregulated markets differs from traditional regulated prices. Under regulated markets, the electricity price is determined by the weighted average cost of the energy and operation and maintenance expense. Under the example, the $1 wind cost would be part of the average price calculation, resulting in a weighted average price of $21 per MWh, rather than $40. Also in traditional regulation, the cost to pay the capital expense for the generation equipment, plus debt expense and investor returns on the capital, are separately recovered in a fixed capacity or demand charge plus a variable charge.
3 For this study, we assumed that the wind farm would be treated in the same manner as other merchant
power plants in the PJM system. Alternatively, the state of New Jersey could choose to allow full-cost recovery of the wind farm construction investment under a cost plus return on capital methodology, similar to traditional utility regulation.

An Assessment of Potential Costs and Benefits of Offshore Wind Turbines 12
Natural Gas Is the Last Unit to Meet Demand, and Therefore Sets the Market Price
The wholesale deregulated market for the Mid-Atlantic States is operated by PJM, a regional transmission organization (RTO).4 One of the RTO's functions is to operate the day-ahead and real-time price auctions for wholesale electricity. PJM collects power price bids from electric generation owners and operators, receiving up to 24 bids for each hour of the next day. PJM's computers match the price and power bids against customer demands for each hour, filling demand with the least expensive power first. Similar to the cited example, the last increment of power that meets the hourly demand—generally a natural-gas-fired generation unit—sets the wholesale power price for the entire market.
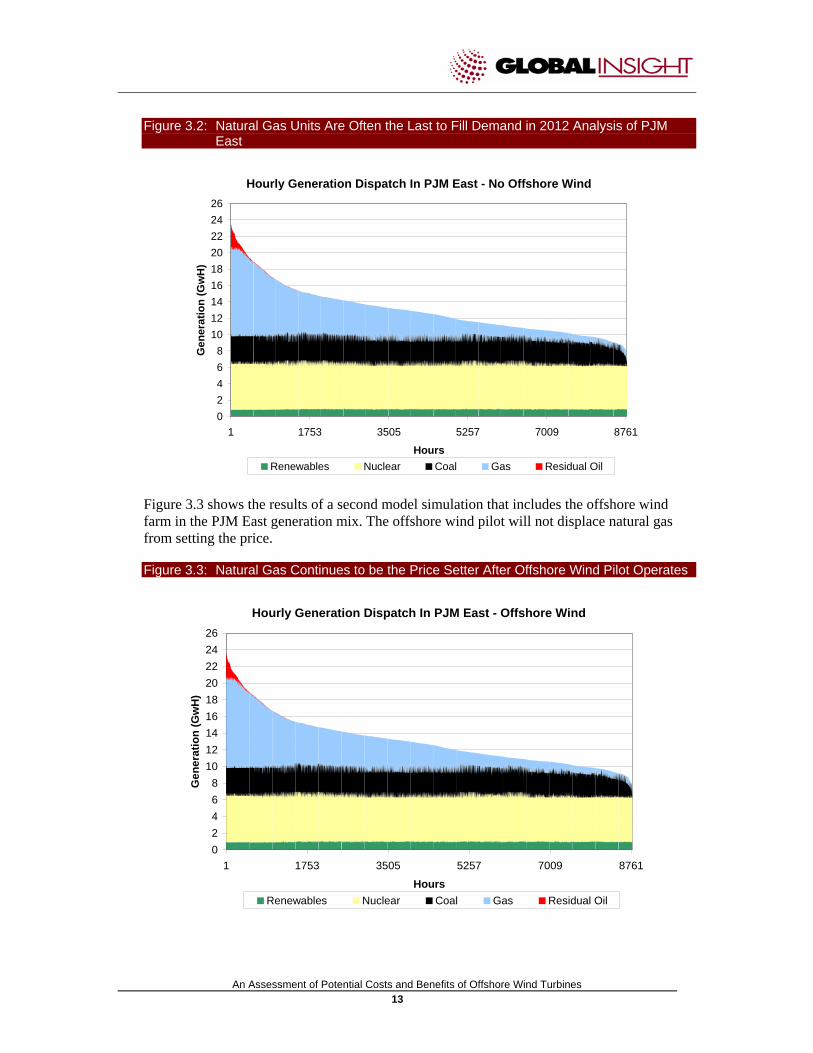
In Figure 3.2, we modeled the PJM East region in 2012, the year that the New Jersey offshore wind pilot farm is expected to begin operation. 5,6 Natural-gas-fired generation units are most often the last units to be dispatched, setting the wholesale power price. Renewable energy sources are the least expensive sources of power bid into PJM, because there is no fuel cost and operating and maintenance costs are very low. Nuclear is the next most expensive resource, followed by coal and then natural gas. Figure 3.3 is a simulation without the offshore wind farm.
4 PJM manages the wholesale market functions and electricity transmission scheduling for all or parts of
Delaware, Illinois, Indiana, Kentucky, Maryland, Michigan, New Jersey, North Carolina, Ohio, Pennsylvania, Tennessee, Virginia, West Virginia, and the District of Columbia
5 Electricity prices, power plant emissions, and power plant dispatch by PJM were modeled using the AURORA Electric Market Model. AURORA is a fundamentals-based model that employs a multi-area, transmission-constrained dispatch logic to simulate real market conditions. Its true economic dispatch captures the dynamics and economics of electricity markets—both short term (hourly, daily, monthly) and long term.
6 PJM East comprises New Jersey, parts of eastern Pennsylvania, Delaware, and part of eastern Maryland.
An Assessment of Potential Costs and Benefits of Offshore Wind Turbines 13
Figure 3.2: Natural Gas Units Are Often the Last to Fill Demand in 2012 Analysis of PJM East
Hourly Generation Dispatch In PJM East - No Offshore Wind
02468
101214161820222426
1 1753 3505 5257 7009 8761
Hours
Gen
erat
ion
(Gw
H)
Renewables Nuclear Coal Gas Residual Oil
Figure 3.3 shows the results of a second model simulation that includes the offshore wind farm in the PJM East generation mix. The offshore wind pilot will not displace natural gas from setting the price.
Figure 3.3: Natural Gas Continues to be the Price Setter After Offshore Wind Pilot Operates
Hourly Generation Dispatch In PJM East - Offshore Wind
02468
101214161820222426
1 1753 3505 5257 7009 8761
Hours
Gen
erat
ion
(Gw
H)
Renewables Nuclear Coal Gas Residual Oil

An Assessment of Potential Costs and Benefits of Offshore Wind Turbines 14
KEY FINDING: The offshore wind pilot will not lower wholesale power prices. In the single-price auction, only the fuel and operating and maintenance costs of the last unit to meet demand sets the price for the entire market. Generators, who bid below the market-clearing price, receive the single price for power. Therefore, wind generation has no effect on the price of power, unless it displaces natural gas, which is unlikely. Consequently, a wind farm will not lower the cost of electricity to homeowners and businesses. (The possible effect that wind power will have on local congestion prices is discussed in the following.)
3.1.2 Natural Gas Will Remain the Price Setter for the Foreseeable Future
The power grid has become increasingly reliant on natural gas because:
• Gas units are best at load following: Electricity demand falls into one of three categories: base load, intermediate load, and peak loads. Base load demand is constant 24 hours per day, seven days per week. Base load, for instance, is the result of manufacturing operations that operate three shifts, seven days per week, as well as home appliances that are always on, such as the electronics in TVs and computers. Intermediate load serves equipment that operates between the base load and the peak load periods. Intermediate loads usually start in the morning when people wake up and turn on appliances and operate lights, computers, air conditioning units, and office equipment. The peak load occurs for short periods of the day, such as a very hot August afternoon, when air conditioners are operating at maximum levels to keep buildings cool.
In Figures 3.2 and 3.3, renewable energy (such as wind) and nuclear serve base loads. Wind and solar units are included in base load because they generate power when the weather cooperates, not necessarily on the reliability requirements of the power grid. Coal principally serves base loads, especially the large efficient plants. Smaller coal plants will also serve intermediate loads. However, the main equipment for serving intermediate loads is natural-gas-fired electric generators. These highly efficient units perform well at load following, which is the ability of the generating equipment to vary its electricity output to match demand throughout the day.
• Gas units have low capital costs: Natural gas units have low capital costs, but currently high variable costs; while other generation units have high capital costs, but currently low variable costs. For instance, a new gas-fired unit will cost just under $600 per kilowatt (KW), while a new coal unit will cost $1,700 per KW; a new nuclear power plant will cost more than $2,300 per KW; and an offshore wind farm will cost more than $3,500 per KW. In a deregulated market, cost recovery of the capital costs are not guaranteed in the same manner as they are in a traditional regulated market. In deregulated markets, investors have favored construction of lower cost natural-gas-fired units to minimize the risk of not recovering the investment and earning a return on capital.
• Environmental restrictions and NIMBY favor gas units:7 Permitting and siting of power plants is fraught with public opposition. Coal and nuclear power plants are especially tough to site and build. As a result, natural-gas-powered plants have become the default units for new electric generation construction.
7 NIMBY refers to "Not in my back yard"

An Assessment of Potential Costs and Benefits of Offshore Wind Turbines 15
KEY FINDING: Natural gas continues to set the power price during the next 20 years. In our modeling of the PJM East region, natural gas units continued to set the price of power, as these units provide load following services.
Large Wind Generation Often Increases Natural Gas-Fired Generation Use
Because wind units have variable electricity output that is determined by the weather and not by demand, a back-up generation or storage source is required when wind is not available. During hot weather, demand for electricity is high, but wind speed may be low, resulting in low power output. For this analysis, we used 15% availability in the summer and 35% availability in the winter for offshore wind.8 Filling power needs when wind is not available is typically provided by natural-gas-fired units.
The importance of rapid response, back-up power when wind dies down has recently become an important issue in Texas, the state with the largest amount of wind power. On January 27, 2008, the RTO for Texas, ERCOT, was forced to order interruptible industrial electricity customers off of the grid because wind suddenly stopped blowing during warm weather.9
Whether or not wind generation increases gas use depends on the size of the wind generation. If wind generation is large enough to keep an inefficient coal plant from operating, then when the wind dies down, gas must be available to make up the difference, since the coal plant can not respond quickly enough to restart. Under this case, wind plus gas provides the grid-reliability that the inefficient coal plant once provided. However, the unintended consequence is more dependence on high-variable cost natural-gas-fired generation.
KEY FINDING: Natural gas use might increase as reliance on wind power increases. If the wind power displaces a small coal plant, then the combination of gas and wind is required to provide the same level of reliability to the grid.
3.1.3 Mitigating New Jersey's Congestion Prices
PJM's single-price auction, described above, incorporates a separate pricing mechanism to account for localized power supply and demand imbalances. This mechanism is referred to as Locational Marginal Pricing (LMP) and its purpose is to provide price signals that motivate industry investment in projects that reduce transmission congestion, thus enabling lower cost power supplies to reach congested high population and industrial areas. According to a PJM report, various transmission lines serving New Jersey were congested between 240 hours to 3,875 hours in the 2006 day-ahead market.10 Seven of the transmission lines were congested 18% to 44% of the annual hours.
The additional cost for congestion in New Jersey was $261 million in 2006, which was down from $452 million in 2005 (see Figure 3.4).
8 "Comments on EMP Electricity & Heating Assumptions," CEEP/BPU Response,
http://www.nj.gov/emp/home/docs/pdf/Comment%20&%20Response%20document%206-29-07.pdf. 9 Source: McClatchy-Tribune Regional News - R.A. Dyer Fort Worth Star-Telegram, Feb 07, 2008,
"Texas power grid operators narrowly avoid rolling blackouts" 10 "2006 State of the Market Report," PJM Interconnection 2007

An Assessment of Potential Costs and Benefits of Offshore Wind Turbines 16
Figure 3.4: PJM Congestion Costs To New Jersey Utilities In 2006 Were $261 Million.
(Millions)Control Zone 2005 Total 2006 Total Difference
AECO 83.8$ 67.2$ 16.6$ JCPL 162.4$ 95.9$ 66.5$ PSEG 189.4$ 85.6$ 103.8$ RECO 16.9$ 12.0$ 4.9$ Total 452.5$ 260.7$ 191.8$ Total = Day Ahead and Balancing Congestion CostsSource: PJM 2006 State of The Market Report, Section 7
PJM Congestion Costs
As stated in PJM's 2006 State of the Market Report:
Congestion reflects the underlying characteristics of the power system, including the nature and capability of transmission facilities and the cost and geographical distribution of
generation facilities.
PJM is concerned that congestion will get worse in New Jersey as old coal plants, such as Hudson and the BL England units, are deactivated. Deactivation of these units has been delayed to give PJM time to implement plans to assure reliability, especially to northern New Jersey.
Reducing Congestion Costs Requires Transmission Upgrades, New Local Generation, and/or Demand Response
PJM analyzes the reliability of the power system and develops a long-range solution to improve system reliability as part of its Regional Transmission Expansion Plan (RTEP). The most recent RTEP covers the period from 2007 to 2022. In this plan, PJM's Independent Board of Managers (the "Board") approved two major transmission upgrades:
• 500-kV Circuit to Supply Northern New Jersey. This $932 million transmission upgrade project, the "Susquehanna-Lackwanna-Jefferson-Roseland" line, will bring coal and nuclear generation supplies from Northeastern and Central Pennsylvania into New Jersey by about June 1, 2012.
• 500-kV Circuit to Supply Southern New Jersey. This $1.05 billion transmission upgrade project, the "Possum Point-Calvert Cliffs-Indian River-Salem" line, also referred to as the Mid-Atlantic Power Pathway (MAPP), will bring power from the PJM West region to New Jersey.
In addition to these projects, the New Jersey offshore pilot wind farm, as well as other planned wind, solar, biomass, natural gas, oil, and coal projects that will serve New Jersey will help alleviate congestion costs (see Figure 3.5). Within PJM, the amount of active wind projects under development is more than 14,000 MW.11 The offshore wind pilot is 288 MW or just 2% of the planned capacity additions for just wind projects within PJM. In New Jersey, there are more than 3,800 MW of active projects, mostly fossil fuel, planned for construction and operation in the next few years.
11 "Section 3: PJM Board-Approved 15-year Transmission Expansion Plans: 2006-2021" PJM, 2007

An Assessment of Potential Costs and Benefits of Offshore Wind Turbines 17
Figure 3.5: Sample Generation Projects Proposed for New Jersey
Project MW Schedule Fuel Type ToMickelton 230 kV 650 6/1/2012 Coal AECSouth River 230 kV 611 6/30/2009 Natural Gas JCPLLinden 230 kV 600 6/1/2009 Oil PSEGSewaren 230 kV 600 1/1/2011 Natural Gas PSEGHudson - Essex 230 kV 455 5/31/2010 Natural Gas PSEGCumberland 230 kV 366 7/1/2009 Natural Gas AECRed Oak 230 kV 350 6/1/2009 Natural Gas JCPLCedar 230 kV 350 12/31/2012 Wind AECMeriaon 138 kV 350 12/31/2012 Wind AECGloucester 230 kV 55 6/1/2009 Natural Gas PSEGBayonne 138 kV 46 1/1/2009 Natural Gas PSEGMt Hope Mine 34.5 kV 30 1/1/2008 Biomass JCPLCarlis Corner 4.4 6/1/2008 Methane AECQuniton 12 kV 2 11/1/2008 Methane AEC
Source: "PJM Board Approved 15-Year Transmission Expansion Plan, 2007-2012
Representative Sample of Proposed and Active Generation Projects
Demand response is a third method for alleviating congestion. The Federal Energy Regulatory Commission (FERC) issued a 92-page report on their survey of available demand response resources. For PJM, the available summer capacity in 2007 was 3,733 MW.12
Determining the effect of any specific resource—transmission, new generation, or demand response—on reducing congestion pricing requires an hourly analysis of PJM's LMP pricing model. This hourly network analysis, which can only be done by PJM, is required because of the complexity of the local grid interconnections and the hourly resource mix available to balance supply and demand beginning in 2012. Since wind is an intermittent resource, which is assumed to be available only 15% of the time in the summer when congestion is at its worse, the contribution of wind on reducing congestion costs is small compared to the other projects.
KEY FINDING: The offshore wind farm is likely to have a small positive effect on congestion pricing. The offshore wind project is one of many projects that will lower congestion costs. However, the wind farm's contribution to lowering congestion costs is too complex to quantitatively analyze without PJM's LMP models. An exact calculation is also difficult due to the intermittent nature of wind during the congestion periods.
3.1.4 The Offshore Wind Farm Has No Effect on PJM East Prices
To verify that the offshore wind farm would not affect PJM power prices, especially the PJM system marginal price (SMP), we modeled the PJM East system with and without the wind
12 "Assessment of Demand Response & Advanced Metering 2007," Federal Energy Regulatory
Commission, http://www.ferc.gov/legal/staff-reports/09-07-demand-response.pdf.

An Assessment of Potential Costs and Benefits of Offshore Wind Turbines 18
farm.13, There is no difference between prices during peak and off-peak periods or average prices with and without offshore wind generation, as expected.
Figure 3.6: Electricity Price With and Without Wind
Electricty Price With and Without The Off-Shore Wind Farm
$40$60$80
$100$120$140$160$180$200$220$240
2007
2009
2011
2013
2015
2017
2019
2021
2023
2025
2027
2029
Year
Who
lesa
le E
lect
ricty
Pric
e ($
/MW
h)
Offshore No Offshore
Peak
Average
Off-Peak
Note: The prices shown include the anticipated Lieberman-Warner CO2 prices.
The Offshore Wind Farm Adds a Small Increment of New Power to New Jersey
In 2012, the offshore wind farm will produce 1% of New Jersey's generation output, which equates to approximately 717 Gigawatt-hours (GWh) out of a total generation output of 61,333 GWh (see Figure 3.7). In addition, the overall nameplate capacity of the wind farm is 288 MW, which is 2% of New Jersey's generation capacity (see Figure 3.8).14
13 The system marginal price (SMP) is the single auction price that occurs when there is no congestion. 14 For comparison, natural-gas-fired units' capacity is 46% of the total capacity and generates 21% of the
output needed to meet demand. Consequently, natural gas units have spare capacity to meet peak demands as part of their load following function.

An Assessment of Potential Costs and Benefits of Offshore Wind Turbines 19
Figure 3.7: New Jersey's Electric Generation Output by Primary Fuel in 2012
Electric Power Generation Capacity by Primary Fuel
Coal14,274 GWh
23%
Petroleum181 GWh
0%
Natural Gas12,779 GWh
21%
Nuclear31,354 GWh
52%
Other2,028 GWh
3%
Offshore Wind717 GWh
1%
Figure 3.8: New Jersey's Electric Generation Nameplate Capacity in 2012
Electric Power Nameplate Capacity by Primary Fuel
Coal1,845 MW
10%
Petroleum2,844 MW
15%
Natural Gas8,313 MW
46%
Nuclear4,249 MW
23%
Other814 MW
4%
Offshore Wind288 MW
2%

An Assessment of Potential Costs and Benefits of Offshore Wind Turbines 20
3.2 Emission Reductions and Benefits
Unlike fossil fuel plants, wind projects have the significant benefit of not producing any CO2, NOX, SO2, or mercury emissions. Beginning in 2012, the wind farm will generate about 700,000 MWh per year, which will displace natural gas and some coal generation output and emissions. The wind farm will reduce 2012 CO2 emissions by 430,000 metric tons within PJM East or 1/2% of the 43-million metric tons emitted in the region.
Figure 3.9: Summary Table, Showing Annual Emission Reductions Beginning 2012.
NJ Wind Capacity (MW) 288Availability: Jun-Sep 15%Availability: Oct-May 35%Annual Generation (MWh) 716,800Annual CO2 Emissions Displaced by Wind (Metric Tons) 430,000Annual SO2 Emissions Displaced by Wind (Metric Tons) 800 Annual NOX Emissions Displaced by Wind (Metric Tons) 1,500
Summary Table
3.2.1 In a Single Price Auction, Consumers Will Not See The Economic Benefits
Potential CO2 Cost Savings of $9 million in 2012, Rising Steadily to $34 million in 2035
One of the leading Congressional bills for reducing CO2 and other greenhouse gases (GHG) is the Lieberman-Warner Bill ("L-W Bill"). Under this proposed bill, fossil-fuel electric generation units will be assessed $20 per metric ton of CO2 emitted beginning in 2012 with costs increasing steadily each succeeding year (see Figure 3.10). A power generator, such as a wind farm operator, will pay no CO2 fees. That means that the total CO2 fees assessed on the generated power for a given region, such as PJM East, will be reduced. Based on the current L-W Bill, this savings could be as high as $9 million in 2012, rising to $34 million by 2035.

An Assessment of Potential Costs and Benefits of Offshore Wind Turbines 21
Figure 3.10: Potential avoided CO2 Costs from the New Jersey Wind Pilot
YearNominal
$/metric ton CO2
2006 $/metric ton CO2
Emission Cost Savings (2006$
in millions)
2012 22.2 20.0 9$ 2013 34.0 29.9 13$ 2014 46.2 39.9 17$ 2015 59.0 50.0 22$ 2016 60.4 50.2 22$ 2017 61.8 50.4 22$ 2018 63.1 50.6 22$ 2019 64.5 50.8 22$ 2020 65.9 50.9 22$ 2021 69.3 52.6 23$ 2022 72.7 54.2 23$ 2023 76.1 55.7 24$ 2024 79.5 57.1 25$ 2025 84.3 59.5 26$ 2026 89.0 61.7 27$ 2027 93.8 63.8 28$ 2028 98.6 65.9 28$ 2029 103.4 67.8 29$ 2030 108.1 69.7 30$ 2031 112.9 71.5 31$ 2032 117.7 73.2 32$ 2033 122.5 74.8 32$ 2034 127.2 76.3 33$ 2035 132.0 77.8 34$
Notes: The CO2 costs are based on the Lieberman-Warner Bill
Potential Avoided CO2 Costs For PJM East From The Off-Shore Wind Pilot (Not Applicable To Single Price Auction)
In a Single Price Auction, the CO2 Cost Savings Flows to Wind Generators, Not to Consumers
As discussed in Section 3.1.1, the price bid of the last generation unit needed to meet demand sets the hourly system marginal price for all power sellers. When CO2 costs are added to generation costs, each of the generation owners will bid power into the PJM auction at prices that include fuel, operation and maintenance, and the CO2 costs.
We modeled the PJM price auction with and without the L-W Bill's CO2 costs. While coal-fired generation plants had a significantly higher increase in CO2 costs compared to natural gas units, the high price of natural gas with CO2 costs still was higher than the coal with CO2 price, causing the gas units to continue to meet the last increment of hourly demand. Thus, natural gas commodity prices plus the natural gas unit's CO2 costs set the price for the market. The result is that the coal generators received the gas plus CO2 price, as well as the wind developers. For the coal generators, the added CO2 revenues embedded in the PJM

An Assessment of Potential Costs and Benefits of Offshore Wind Turbines 22
natural gas power price will not be sufficient to offset the higher CO2 costs incurred by burning coal. For the wind generator, the added CO2 revenues will be captured 100% by the wind operators, increasing operating margins. The CO2 price component, which accrues to the wind farm owner/operator, is incorporated in the Operation Revenue in Figure 3.12.
3.3 Economic Benefits to Wind Farm Owners
3.3.1 Project Construction Costs
The Construction Cost Range is $3,500 to $4,500 per KW
To date, no offshore wind farms have been built off the coast of the United States. To estimate the cost range of a wind farm, we reviewed published information on eight wind farm proposals and projects. The projects reviewed were:
• Cape Wind (Massachusetts)
• Bluewater Wind (Delmarva Penninsula)
• LIPA Offshore Wind Park (Long Island)
• Lillgrund Wind Farm (Sweden)
• Burbo Bank Offshore Wind Farm (United Kingdom)
• Offshore Windpark Q7-WP (Netherlands)
• NaiKun Wind (British Columbia, Canada)
• Kentish Flats (United Kingdom)
After adjusting for inflation and exchange rates, the range of project costs is between $3,500 and $4,500 per KW with more of the projects closer to the $3,500 to $4,000 range than the $4,000 to $4,500 range. For this study, we calculated the projects costs at both the $3,500 per KW and $4,500 per KW to determine the estimated range.
The Possible Offshore Locations Will Not Appreciably Change the Price Range
The primary cost determinant for an offshore wind farm is the depth of water. For this study, we researched the government data for water depth off the New Jersey shore at 3, 6, 12, and 20 nautical miles. The water depth is less than 30 meters for these distances, which is applicable for one design style, the monopile foundation.15 We, therefore, based our cost estimates on this one design. The other determinant of cost is the transmission cable length. Based on our research, the additional cost of cable is within the $3,500 to $4,500 per KW cost range above, and was not separately added. 16
15 "Overview: Potential for Offshore Wind Energy in the Northeast." Walt Musial, National Renewable
Energy Laboratory, Presentation in Washington, D.C., February 10-11, 2005 16 "Electrical Collection and Transmission Systems for Offshore Wind Power," J. Green, A. Bowen, L.J.
Fingersh, and Y. Wan, National Renewable Energy Laboratory, Conference Paper NREL/CP-500-42235, March 2007.

An Assessment of Potential Costs and Benefits of Offshore Wind Turbines 23
The Total Construction Project Costs Range between $1 and $1.3 Billion
A cost model for offshore wind farms was developed by the National Renewable Energy Laboratory (NREL) and a construction review of an offshore wind farm was completed by the U.S. Department of Interior. 17, 18 Based on these evaluations and our telephone discussions with NREL staff, we estimated the construction cost range between $1 and $1.3 billion.
Figure 3.11: Offshore Wind Farm Project Cost Estimate
Component Percentage of Cost
In/Out of State
Resource
Low (Million $)
High (Million $)
Rotor 7% Out $75 $97Drive train,nacelle 22% Out $225 $289Control, Safety System, Condition Monitoring 1% Out $9 $12Tower 6% Out $66 $84Marinization (13.50% of Turbine and Tower System) 5% In $51 $65Monopile foundation/Support Structure 17% In $176 $226Transportation 4% Out $44 $57Port and staging equipment 1% In $12 $15Turbine Installation 6% Out $59 $75Electrical Interface/Connect 15% Out $146 $188Permits, Engineering, Site Assessment 2% In $19 $24Personnel Access Equipment 1% In $10 $13Scour Protection 3% In $32 $41
Surety Bond (Decomissioning - 3.0% of ICC) 3% In $28 $36Offshore Warranty Premium (15.00% of Turbine and Tower System) 6% Out $56 $72
Cost per kW ($/KW) 100% $3,500 $4,500
Total Project Cost 288 MW $1,008 $1,296
Sources for Construction Data and Methodology: National Renewable Energy Labs (NREL); U.S. Department of the Interior Minerals Management Service
New Jersey Offshore Turbine Pilot Project Cost Estimate
Note: Shallow Water is considered to be 10m, 5 miles offshoreNote: 3.6 Megawatts per turbine * 80 Turbines *1000 KW/MW = 288,888 KW
3.3.2 Revenue Flows to Wind Farm Developers/Owners
Wind farms have four sources of revenues:
• Operation Revenues: Sales of power into PJM receive the single system marginal price (SMP) plus or minus a congestion price adjustment. For this analysis, we calculated the price and revenues using the AURORA model. We assumed that the Lieberman-Warner Bill will be passed and become effective in 2012, as currently written in the proposed federal legislation. Therefore, the SMP price includes the CO2 price embedded in the bid of the last generation unit to meet hourly demand.
• Capacity Revenue or Reliability Pricing Model (RPM) Auction Revenue. The RPM is administered by PJM to provide a separate revenue source for encouraging generation developers to build new capacity that meets anticipated future capacity
17 "Wind Turbine Design Cost and Scaling Model," L. Fingersh, M. Hand, and A. Laxson, National
Renewable Energy Laboratory, Technical Report NREL/TP-500-40566. 18 "Cape Wind Energy Project, Draft EIS," U.S. Department of the Interior Minerals Management
Service, January 2008.
An Assessment of Potential Costs and Benefits of Offshore Wind Turbines 24
shortfalls. PJM is in the process of developing new RPM rules for intermittent power sources such as wind.
The revenue available to the wind developer is determined by several factors beyond the RPM auction price. This auction price is multiplied by the wind farm's "Design Capacity Value," which is the capacity that PJM is confident will be available to meet electricity demand. Because wind varies with weather, PJM discounts the Design Capacity Value if no historical data available. For this analysis, we used PJM's revised discount proposal factor of 14%.19 The PJM formula for Design Capacity Value is:
Design Capacity Value=PJM Class Average Capacity Factor * Net Maximum Capacity
a) PJM Class Average Capacity Factor = 20% (now) and 14% (future) if no history is available. The wind developer may apply for a higher factor, based on demonstrated proof (developers may submit either the average of three single-year capacity factors during the summer peak or hourly data during the summer peak for a single year.)
b) Net maximum Capacity=the manufacturer's electricity output rating less station load.
c) The Design Capacity Value cannot exceed the Capacity Injection Rights assigned after the transmission interconnection process has been satisfied and after all transmission upgrades have been completed.
• Renewable Energy Certificates/Credits (REC). Renewable Energy Credits are a separate pricing mechanism to support the development of renewable energy resources in states that have adopted renewable energy portfolio standards (RPS). Electric proprietors and providers must buy RECs in order to satisfy the RPS requirement. The RPS law requires electric proprietors and providers to buy a specific portion of their customers' power needs from renewable energy sources. By 2021, New Jersey utilities must buy 22.5% of their customer's power requirements from renewable resources. The price for these credits is determined by the market. For this analysis, we used the Evolution Markets price for January and inflated that price on an annual basis.20
• Production Tax Credits (PTC). The Production Tax Credit provides a two-cent-per-kWh credit (adjusted for annual inflation) to wind developers for a 10-year period after the wind farm begins operation. The current tax credit is due to expire on December 31, 2008. Global Insight believes the PTC will be extended by the U. S. Congress, and we have included the PTC in the revenue analysis.
Based on these revenue sources, we expect the wind farm will generate a 2012 total revenue flow of $90 million. By 2031, we anticipate the cumulative revenue will reach $2.5 billion.
19 Currently, the PJM Class Average Capacity Factor is 20%. In December 2007, PJM's RPM Working
Group recommended 14%. Source: "Offering Intermittent Capacity into RPM Auctions," RPM Working Group, December 20, 2007.
20 Evolution Markets operates REC trading markets, http://new.evomarkets.com/index.php.

An Assessment of Potential Costs and Benefits of Offshore Wind Turbines 25
Figure 3.12: Estimated Annual Revenue For The New Jersey Wind Farm Pilot
Operation Revenue
Capacity Revenue
Annual REC Income
Annual PTC Income
Gross Revenue
2012 55,641 3,211 16,217 15,822 90,891 2013 60,790 3,264 16,475 16,073 96,602 2014 68,736 3,342 16,867 16,456 105,401 2015 76,177 3,404 17,178 16,759 113,518 2016 77,309 3,475 17,552 17,124 115,460 2017 79,270 3,529 17,810 17,376 117,985 2018 81,727 3,592 18,131 17,689 121,140 2019 84,559 3,672 18,531 18,079 124,841 2020 86,417 3,747 18,923 18,462 127,549 2021 90,243 3,802 19,191 18,723 131,959 2022 94,049 3,863 19,498 - 117,410 2023 98,311 3,930 19,835 - 122,076 2024 101,559 4,024 20,322 - 125,905 2025 104,361 4,081 20,598 - 129,041 2026 107,874 4,166 21,025 - 133,064 2027 110,804 4,228 21,339 - 136,371 2028 114,684 4,326 21,846 - 140,856 2029 115,752 4,401 22,210 - 142,363 2030 118,419 4,464 22,528 - 145,411 2031 120,643 4,552 22,973 - 148,167 Total 1,847,326$ 77,072$ 389,051$ 172,563$ 2,486,011$
Annual Revenue of NJ Offshore Wind Farm ($ 000)
Note: Only eligible for the PTC credit during the first 10 years of operation. Credit allowance is based of owners tax liability. If credit exceeds tax liability, the owner(s) may carry any unused current year credit back 1 year and then forward up to 20 years.
3.3.4 Project Economics
Based on our analysis, the project economics are below investment grade, considering the commodity price risk and regulatory uncertainties. The range of pretax returns is between 5.4% and 3.9% (See Figure 3.13).

An Assessment of Potential Costs and Benefits of Offshore Wind Turbines 26
Figure 3.13: Economic Benefits for the Wind Developer
Year Cash Flow Year Cash Flow$3,500/kW $4,500/kW
2011 (1,008,000,000) 2011 (1,296,000,000) 2012 90,891,418 2012 90,891,418 2013 96,602,099 2013 96,602,099 2014 105,401,240 2014 105,401,240 2015 113,518,292 2015 113,518,292 2016 115,460,070 2016 115,460,070 2017 117,984,609 2017 117,984,609 2018 121,139,601 2018 121,139,601 2019 124,840,934 2019 124,840,934 2020 127,549,414 2020 127,549,414 2021 131,959,432 2021 131,959,432 2022 117,409,978 2022 117,409,978 2023 122,076,210 2023 122,076,210 2024 125,904,926 2024 125,904,926 2025 129,040,590 2025 129,040,590 2026 133,064,472 2026 133,064,472 2027 136,370,953 2027 136,370,953 2028 140,855,617 2028 140,855,617 2029 142,363,447 2029 142,363,447 2030 145,410,606 2030 145,410,606 2031 148,166,979 2031 148,166,979
IRR 4.8% 3.3%NPV @ 25% Return ($529,855,627) ($714,175,627)NPV @ 15% Return ($513,689,508) ($731,458,884)NPV @ 10% Return ($407,445,903) ($645,462,432)
Economic Analysis For the Wind Developer
Notes:IRR = Internal Rate of ReturnNPV = Net Present Value at an assumed required investment return, given the risks

An Assessment of Potential Costs and Benefits of Offshore Wind Turbines 27
4. Tourism Benefits and Costs Global Insight has employed an approach that compares NJ tourism under two different scenarios: one with a functioning offshore wind turbine farm and the other without this facility. To describe tourism under these different conditions, four vital information inputs have been examined:
1. The results from the 2006 attitudinal survey conducted by Lieberman Research Group (LRG) of Great Neck, NY. Properly weighted survey results will be used to help describe the impact of the wind farm on NJ visitation.
2. An exhaustive literature search of all domestic and international wind turbine research, whether offshore or land-based examples. We have already uncovered a number of studies where visitor and resident opinion surveys have been conducted. Some have also addressed the impact on fishing and water recreation. Finally, having executed the economic impact study of the Cape Wind Turbine project off of Nantucket, Global Insight will add any appropriate research and data on behalf of the NJ test bed.
3. The New Jersey Visitation Forecasting Model built by Global Insight on behalf of the New Jersey Commerce Commission (NJCC) and the State of New Jersey. The model will help to describe and measure the economic environment of the two alternative scenarios over the 20-year planning horizon for the wind turbines. It will incorporate the essential economic and demographic factors expected to exist over the planning horizon. The benefits and costs to tourism are best examined in the context of a dynamic and ever-changing NJ economy. This information asset is already owned by the NJ state government.
4. The 2006 New Jersey Tourism Satellite Account and economic impact study. The inputs, analysis, and model built to assess the contribution that tourism makes to the NJ economy will provide the all-important ability to translate visitation changes to visitor spending, jobs, wages, taxes, and NJ GDP. As in the case of the NJ Visitor Forecasting Model, these inputs are already owned by the state government.
These tools will be utilized to assess and translate the benefits and costs to tourism in New Jersey.
As Global Insight goes through this analysis, it is important for the reader to understand that the forgone sales and impacts presented for each county are not cumulative. Said differently, the reader should not add the forgone sales from each county together to attempt to get a total wind farm impact; results are presented for each county, and the tourism impact in each county should be considered unique. A wind farm located offshore from Ocean County will only have an impact on Ocean County; a wind farm located off Atlantic City will only affect tourism sales and property values in Atlantic County.
The individual county nature of a potential wind farm can be seen in the map that follows. It presents four different potential wind farm locations. The colored circles represent the area from which a person at sea level could see any part of a tower of 250 feet above sea level on a

An Assessment of Potential Costs and Benefits of Offshore Wind Turbines 28
clear day at that wind farm location. While Global Insight does not have information on the size of the towers, 250 feet is the proposed size of the wind farm towers of Cape Wind and is considered a fair proxy.
The map gives four potential wind farm locations. The northern wind farm location is located twenty miles off of Ocean County. The area from which a person at sea level could see the top of a tower twenty miles off of Ocean County is represented by the green shade within the circle surrounding that wind farm. A wind farm twenty miles offshore with towers 250 feet above sea level is not visible anywhere along the New Jersey shore.
Looking next at the southern wind farm location, this is 12 miles off the coast of Cape May County. A person in Cape May County may be able to see the tops of a tower 250 feet high at this location during times of good visibility (hazy conditions, fog, rain, and other weather-related issues will have an impact on the visibility distances), as represented by the darker blue shaded area around that wind farm. However, someone in Atlantic City, or Harvey Cedars (in Ocean County), will not be able to see these towers.
The two potential wind farm locations off of Atlantic City represent wind farms three and six miles off the coast. In the six mile location, the visual impact of towers 250 feet high, represented by the orange-shaded circle, really affects only Atlantic County. Ocean County visitors or homeowners will not be able to see this wind farm; only residents in the northern tip of Cape May County will be able to see it. The visual impact of the wind farm will be blended in with Atlantic City and be way off to the left as visitors look off to sea. With a wind farm six miles off the coast of Atlantic City, the area of Cape May that would be affected is small and that wind farm location is assumed to only impact the shore towns of Atlantic County.
A potential wind farm located three miles off of Atlantic City has similar analysis—the visual impact on Atlantic County is undeniable, however the visual impact of these towers on Cape May and Ocean counties is negligible.

An Assessment of Potential Costs and Benefits of Offshore Wind Turbines 29
Figure 4.1: Four Potential Wind Farm Locations, with Visual Impact
One final note, to calculate the net present value (NPV) of the difference in tourism expenditures in the wind farm case versus the no wind farm case, Global Insight is using a discount rate of 8%. The 8% level was used as an example of a number that lies between price inflation, New Jersey bond costs, and commercial investment costs, and is similar to one recommended by the federal government.
At the time of this report, the CPI (Consumer Price Index) is currently running at 4% annual rate. Interest rates on municipal bonds now average just under 5%.21 The federal Office of Management and Budget suggests a rate of higher than 7% be used, suggesting that "Constant-dollar benefit-cost analyses of proposed investments and regulations should report net present value and other outcomes determined using a real discount rate of 7%. This rate approximates the marginal pretax rate of return on an average investment in the private sector
21 http://www.kiplinger.com/businessresource/forecast/archive/credit_crunch_takes_toll_080314.html

An Assessment of Potential Costs and Benefits of Offshore Wind Turbines 30
in recent years." 22 Finally, commercial investment decisions to invest are commonly viewed to be in the teen's percent range.
4.1 Tourism Impact: Literature Review
Quantitative research on the impact of wind development on local tourism in the United States and abroad is not readily available, although several studies have been conducted using surveys that assess participants’ stated preferences and predicted attitudes towards wind development in tourist areas. The consensus of this research is the conclusion that a wind farm has minimal to no impact on tourism. Surveys consistently show a vast majority of respondents report no effect from the existence of a proposed or existing wind farm. The more evidence that is gathered points to the conclusion that wind turbines do not drive people away from an area and in fact could become a tourist attraction.
Examining the impact of wind farm at a countrywide level in Europe shows little-to-no risk of a wind farm affecting tourism. Denmark, the leading country in terms of wind farms, has reported a 25% increase in tourism around its wind farms; and studies done in Scotland and Wales, top tourism regions in Great Britain, also showed strong tourism growth in areas with wind farms.
One widely cited study was conducted in Scotland by an independent contractor who interviewed over 300 tourists in a tourism-driven town about their attitudes toward existing local wind development facilities. The study found that the wind development facilities in the region had no adverse impact on tourism in an area that was valued for its “beautiful views and scenery.” In addition, although the majority of tourists visited the locations in which wind farm were located, many were not even aware of their existence.
The research showed that the majority showed a favorable opinion towards the prospect of having a visitor center at the site of the wind farm and would be interested in visiting and finding out more about wind farms and their operation.23
More locally, a study in Vermont's Northeast Kingdom reported that 95% of visitors would no be deterred from further visits by the existence of a wind farm. In addition, 92% of skiers said they would ski in the region even if the wind turbines were located on a nearby ridgeline.24
More recently, a report done by the University of Delaware titled Delaware Opinion on Offshore Wind Power asked a similar question about the potential effect on beach visitation by Delaware residents in the case of a large wind farm six miles offshore. Two questions were asked. The first asking whether the wind farm would cause the individual to switch to another beach if the wind farm was located off the beach that individual last visited. The second asking whether the wind farm visible from a Delaware Beach that the person did not visit would result in the individual being likely to visit that beach at least once to see the wind farm.
22 http://www.whitehouse.gov/omb/circulars/a094/a094.html 23 http://bwea.com/pdf/mori.pdf 24 http://www.revermont.org/press/neksurvey.pdf

An Assessment of Potential Costs and Benefits of Offshore Wind Turbines 31
For the first question, 90% indicated they would continue to visit the same beach they last visited were a wind farm to be built offshore. Of the rest, 5.6% would switch to another Delaware beach with the rest either leaving Delaware to visit a beach or rethinking their vacation plans entirely.
The second question showed a substantial curiosity effect in that about 84% of respondents were likely to visit an unfamiliar beach to see a wind farm with almost 56% answering very likely.
The Cape Wind project is another good comparison. While it has not been built yet, several studies and the environmental impact have been published at this time. Cape Wind Associates proposes to build 130 large wind turbines in Nantucket Sound, five miles off the coast. In 2003, Beacon Hill Institute conducted a tourist survey, which found that:
• 3.2% of tourists would spend fewer days on the Cape if the windmills were built
• 1.8% of tourists said they would not visit at all
• 1.0% of tourists would stay longer on the Cape
• The number of tourists that would visit the Cape because of the windmills would boost visits by 0.6%
In total, if the wind farm was built, tourism spending forgone would range from $57 to $123 million. They calculated an employment reduction of 1,200 to 2,500 jobs with a fall in local earnings of $28 to $61 million annually.25
While quantitative research is unavailable at this time, research and survey work done on the tourism impact of a wind farm clearly shows that a potential wind farm will have minimal impact on tourism and may become an attraction that brings new visitors to an area.
4.2 Tourism Impact: Overview
The benefits and costs of the offshore wind turbine facility are to be measured in the context of two scenarios: a NJ shore with and without the wind farm. Two variable types are needed to measure the benefits and cost: visitor volume and visitor spending by category.
Building the "Without Turbines" scenario amounts to projecting NJ visitation over the facility planning horizon under normal and existing conditions. The assumption is that visitation will grow at an organic rate dictated primarily by economic and demographic conditions in key source markets. The existing NJ Visitor Forecasting Model will be utilized to establish baseline projections of visitation. The model relates economic and demographic conditions in New Jersey's key source markets to changes in state-wide visitation.
Applying corresponding visitor spending levels and distributions (across major categories such as accommodations, food, entertainment, etc.) from the New Jersey Tourism Satellite Account to the baseline visitor volume projections yields expected visitor spending, by category, for the 20-year wind farm planning cycle.
25 Blowing in the Wind: Offshore Wind and the Cape Cod Economy, Beacon Hill Institute, October 2003
An Assessment of Potential Costs and Benefits of Offshore Wind Turbines 32
The development of the "With Turbines" scenario requires the reconciliation of the findings from the 2006 visitor/resident opinion survey with existing visitation momentum (from the model). The survey clearly identifies a portion of each county's visitors that will not choose to come, if the wind farm is built. This proportion falls as the wind farm's distance from shore increases. These negatively inclined respondents will be weighted relative to the universe of all visitors in order to estimate the total number who will choose to stay away.
There is also a portion of the respondents who said that they would purposely visit New Jersey to see and possibly tour the offshore facility. These, too, will be weighted to create an estimate of the total number of new visitors drawn by their interest in the wind farm.
Visitor spending for the "With-Turbine" scenario will be likewise determined using the recently completed 2006 NJ Tourism Satellite Account. The increase in visitors (and spending) from those compelled to visit will be netted against the decline in visits/spending from those who would stay away, resulting in a net visitation and spending value.
Prior to being able to enumerate the costs/benefits of a wind farm off the New Jersey shore, it is important to first put tourism's overall importance to New Jersey in context.
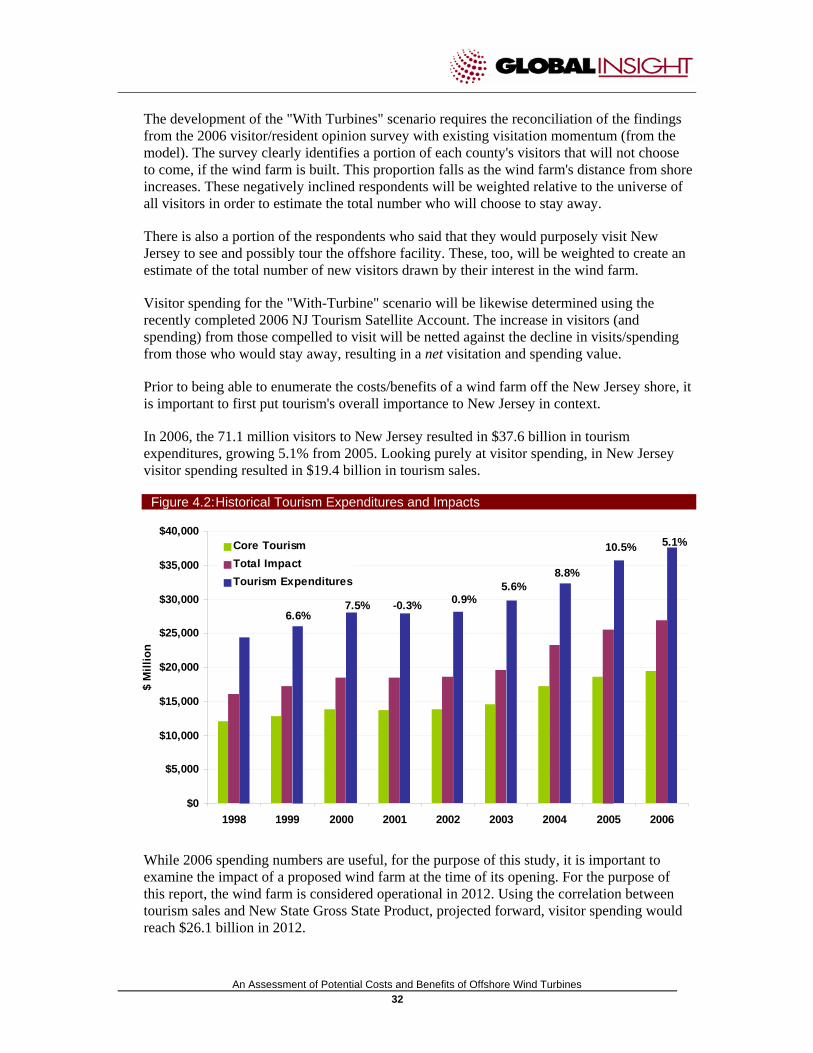
In 2006, the 71.1 million visitors to New Jersey resulted in $37.6 billion in tourism expenditures, growing 5.1% from 2005. Looking purely at visitor spending, in New Jersey visitor spending resulted in $19.4 billion in tourism sales.
Figure 4.2: Historical Tourism Expenditures and Impacts
5.1%
6.6%7.5% -0.3% 0.9%
5.6%8.8%
10.5%
$0
$5,000
$10,000
$15,000
$20,000
$25,000
$30,000
$35,000
$40,000
1998 1999 2000 2001 2002 2003 2004 2005 2006
$ M
illio
n
Core TourismTotal ImpactTourism Expenditures
While 2006 spending numbers are useful, for the purpose of this study, it is important to examine the impact of a proposed wind farm at the time of its opening. For the purpose of this report, the wind farm is considered operational in 2012. Using the correlation between tourism sales and New State Gross State Product, projected forward, visitor spending would reach $26.1 billion in 2012.

An Assessment of Potential Costs and Benefits of Offshore Wind Turbines 33
Figure 4.3: Forecast of Tourism Expenditures
$12.0 $13.7$19.4
$26.1$31.6
$40.2
$10$15$20$25$30$35$40$45
Billions
1998
2000
2002
2004
2006
2008
2010
2012
2014
2016
2018
2020
Total Visitor Spending
In 2006, as an industry, Travel and Tourism added almost $20 billion to the state of New Jersey's Gross Domestic Product, 4.8% of the total state GDP. As an industry, tourism employs over 390,000 workers; one out of every nine New Jersey workers owes their job to tourism.26
Figure 4.4: New Jersey Industry Comparison
4.9%5.2%3.7%6.1%5.1%5.4%2.5%5.1%5.9%4.2%5.1%3.6%3.0%6.9%4.3%6.5%8.8%4.8%
’05-’06 Growth
100.0%408,569Total4.5%2.4%2.4%2.8%3.3%3.3%3.6%4.6%5.2%7.0%7.1%8.0%8.9%9.3%9.8%
17.8%
% of State
18,596Construction914,624Administrative and Waste Services1013,494Transportation and Warehousing1113,377Durables Manufacturing1211,481Accommodation and Food Services139,717Management of Companies and Enterprises149,679Other Services15
18,457Other Industries
44,841Government
32,791Health Care and Social Assistance528,812Non-Durables Manufacturing628,765Retail Trade721,292Information8
38,099Professional, Scientific, & Technical Services336,473Wholesale Trade4
Finance and InsuranceReal Estate and Rental and Leasing
Industry
40,05472,859
Millions $
21
Rank
4.6% 4.8%19,448Travel & Tourism 4.6% 4.8%19,448Travel & Tourism
26 New Jersey Tourism Satellite Account, 2006

An Assessment of Potential Costs and Benefits of Offshore Wind Turbines 34
Narrowing our focus to examine regions of New Jersey that would be impacted by a proposed offshore wind farm, visitor spending and its importance to the affected areas really stand out.
For the purposes of the New Jersey Tourism Satellite Account, New Jersey was divided into six regions:
• Skylands: Sussex, Warren, Hunterdon, Somerset, and Morris Counties
• Gateway: Passaic, Hudson, Bergen, Essex, Union, and Middlesex Counties
• Shore: Ocean and Monmouth Counties
• Greater Atlantic City: Atlantic County
• Southern Shore: Cape May and Cumberland Counties
• Delaware River: Mercer, Gloucester, Camden, Salem, and Burlington Counties
Figure 4.5 New Jersey Regional Expenditures
6.6%
8.4%
14.0%
14.7%
19.5%
36.8%
0% 5% 10% 15% 20% 25% 30% 35% 40%
Skylands
Delaware River
Southern Shore
Shore Region
Gateway
Greater Atlantic City
Tourism Expenditure (Share of State)
The three regions that would be impacted by an offshore wind farm would be Greater Atlantic City, the Shore Region, and the Southern Shore. As expected, these three regions rank one, three, and four in the tourism expenditure category.

An Assessment of Potential Costs and Benefits of Offshore Wind Turbines 35
Figure 4.6: New Jersey County Expenditures
121.4%8.8%369.6Gloucester190.9%1.5%362.9Passaic53.3%3.6%212.9Sussex91.6%8.0%152.7Hunterdon101.5%12.3%107.7Warren200.7%12.7%86.9Cumberland210.1%10.1%82.2Salem
151.3%0.9%1,269.8Middlesex111.4%6.8%1,070.0Morris81.7%15.5%784.0Somerset171.2%-3.9%703.6Union141.3%5.8%534.1Camden161.2%5.6%506.0Mercer180.9%0.0%475.8Hudson
312.8%3.2%3,234.4Ocean
Share of County Economy
2.4%2.1%3.7%1.1%
9.3%
3.8%
2.6%
71346
12
Rank
35,238
1,456.41,575.21,953.12,469.1
4,854.212,977.9
Tourism Expenditure ($$ in MM)
3.8%
3.1%1.4%3.7%3.3%
64.2%57.8%
‘05-’06 Growth
BurlingtonBergenMonmouthEssex
Cape MayAtlantic
Counties
County Expenditure
Total *
Narrowing our focus even further, the three counties that would be affected by an offshore wind farm as proposed by New Jersey are Ocean, Atlantic, and Cape May Counties. Tourism expenditures in 2006 in Atlantic County came close to hitting the $13 billion mark, while Cape May County tourism spending reached $4.8 billion and Ocean, $3.2 billion. Combined, these three counties contribute almost two-thirds of New Jersey’s total tourism expenditure.
Not only is tourism spending the largest in these three counties, the greatest share of the county economy is attributable to tourism. Tourism expenditures in Cape May County are an astounding 64% of total county sales and over half of Atlantic County sales are tourism dependent.
As has been presented here, visitors and the dollars they leave behind are very important to the state of New Jersey, and especially to the counties that would be impacted by a proposed offshore wind farm. With the importance of tourism in the affected region established, the impact of a proposed offshore wind farm on tourism in Atlantic, Cape May, and Ocean Counties can now be examined.
An Assessment of Potential Costs and Benefits of Offshore Wind Turbines 36
4.3 Foregone Tourism Sales
Global Insight will first focus on increases in tourism spending (also termed "sales" herein) that will be forgone as the result of a potential wind farm off the shore of Atlantic, Ocean, or Cape May Counties, followed by potential benefits to tourism due to a wind farm.
Revenue forgone as the result of a proposed wind farm would be in the reduction of visitors and their spending to New Jersey and to the impacted shore region in particular. For the purposes of enumerating the impact of a proposed wind farm on the New Jersey shore, Global Insight examined the tourism impact of offshore wind farms in Europe and elsewhere (none currently exist in the United States) and extensively used information gathered from consumer surveys on wind farms from Cape Wind and other proposed facilities in the United States. Survey results from the New Jersey Shore Opinion Study about Offshore Wind Turbines will be extensively used, with backup, to commoditize the costs and benefits of a proposed wind farm.
In the following sections, the numbers cited will be based on the New Jersey Tourism Satellite Account and the New Jersey Shore Opinion Study about Offshore Wind Turbines. For purposes of the analysis, only the percentage of visitation that is leisure is considered, as the assumption is business travel is location dependent and would be unaffected by a wind farm.
The New Jersey Shore Opinion Study about Offshore Wind Turbines reports shore residents' and shore tourists' opinions about wind turbine placement on the New Jersey coastline. Over 4,000 in-person interviews were conducted at shore locations in Monmouth, Ocean, Atlantic, and Cape May Counties. Respondents were read a description and shown pictures representing the wind turbine project at one of several distances from shore.
Global Insight has augmented these results by cross checking them with other consumer surveys about wind farms and actual tourism numbers pre- and post-wind farm.
In general, survey results showed that nearly half the respondents were in favor of the New Jersey Offshore Wind Turbine project with only 21% opposed. The support and opposition findings are comparable to results from Cape Wind and Delaware offshore wind farm studies. While the New Jersey survey was not a random sample, like the Delaware and Cape Cod examples, the comparisons give confidence in the results from the New Jersey Wind Farm survey.
Examining the support for a wind farm six miles offshore, Delaware residents are more supportive of offshore wind farm development with New Jersey with support lowest in Massachusetts. In New Jersey, 41% of respondents were defined as supporting a wind farm six miles offshore, with 32% unsure. Delaware results showed 78% supporting for a wind farm six miles offshore, with 18% unsure. Only a quarter of Massachusetts residents support Cape Wind, with another 32% unsure.27
As the wind turbines are located further away from the shore, opposition to the wind farm decreases at each distance and a total decline of half by the time the turbines are located 20 miles off shore. Respondents believe that wind turbines will have a positive impact on the
27 http://www.ocean.udel.edu/windpower/docs/DE-survey-InterimReport-16Jan2007.pdf

An Assessment of Potential Costs and Benefits of Offshore Wind Turbines 37
New Jersey shore environment and any wind turbine project would not deter or encourage visitation from over 70% of respondents.
One of the unique features of the New Jersey Shore Opinion Study about Offshore Wind Turbines is that it allows analysts the ability to break out the impact of a proposed wind farm by county and distance off shore of a proposed wind farm.
Overall, analyzing the answers to the New Jersey Shore Opinion Study about Offshore Wind Turbines, 12% of surveyed visitors would be less likely to visit. Of these 12%, 40% would go elsewhere on the shore and 27.5% would go "elsewhere." The "elsewhere" respondents were not asked for their alternative destinations, which could be in New Jersey or outside. It is important to realize that many of the displaced visitors would substitute another destination at the shore or in New Jersey. This means that the forgone sales to the state as a whole would be less than the forgone sales to the individual shore county.
If the wind farm turbines were built outside of sight lines, the percentage of visitors less likely to visit share drops to 5%.
Ironically, of the visitors to the shore, it is the NJ residents that would be less likely to visit if a wind farm went up: 15% of the NJ visitors would be less likely to go to the shore. Corresponding numbers are 9% for Pennsylvania, 10% for New York, 12.5% for other states, and 8% for outside the United States.
As the only data on the location of a proposed offshore wind farm that Global Insight has at this time is from the BPU RFP, the analysis of the tourism cost of a proposed wind farm will be broken out by county. As a potential wind farm can only be located off the coast of one of the counties named below; a potential wind farm impact will accrue to only one county. Since the study area contains all three counties, potential impacts for each are calculated.
Atlantic County
Total tourism expenditures in Atlantic County reached almost $13 billion in 2006.28 29 Assuming that Atlantic County's visitor expenditures grow similar to state visitor expenditures as forecast in the previous section, visitor expenditures would rise to $17.4 billion in 2012 assuming no wind farm impact.
In Atlantic County, the large majority of visitor expenditures are leisure related, 86% of all traveler expenditures are classified as leisure spending (as opposed to business spending). It is assumed that a potential offshore wind farm will only affect the leisure tourism market, as business travelers visiting Atlantic County will be assumed to not be affected by a wind farm. Their visitation is affected more by economic activity in the area, not physical attributes.
The survey results from the New Jersey Shore Opinion Study about Offshore Wind Turbines show that, with a wind farm located three miles off shore, 16.5% of Atlantic County visitors are less likely to visit Atlantic County. The Atlantic County results—that 16.5% of visitors are more likely not to visit—were the highest of all the counties studied.
28 New Jersey Tourism Satellite Account 29 Tourism expenditures are defined as the spending of travelers who made an overnight trip or traveled in excess of 50 miles for a day-trip. It includes both business and leisure travel.

An Assessment of Potential Costs and Benefits of Offshore Wind Turbines 38
It is important to note that this survey asked the respondent "how likely you would be to visit the New Jersey Shore in the future for vacations or day trips." Speculations about future behavior can be unreliable. It is possible that in 2012, even with a wind farm located off the coast of Atlantic County, many of these visitors won't act on their stated preference to not visit. A study done by Travelocity points out that the majority of travelers (60%) vacation in exactly the same spot year after year, despite the variety of choices travelers have.30 A study done on usability showed a correlation of 44% between users' measured performance and their stated preference.31
Global Insight has taken the survey responses of visitors that are more likely not to visit and translated them into visitors that actually don't visit using the information on travelers reflected choices previously stated.
Using leisure visitor spending data forecast to 2012, and the assumption that the visitors who no longer visit are representative of the whole visitor population, the forgone visitor spending is $696 million in Atlantic County.
Put in context, Atlantic County tourism expenditures are forecast to be about $16.6 billion in 2011. The $696 million in forgone revenue would mean a difference between the forecast tourism expenditure in 2012 of $17.4 billion, and a wind-farm-impacted-tourism expenditure of $16.7 billion; a difference of 4.0%. Even with the $700 million forgone revenue, visitor expenditure in Atlantic County would show a gain of 0.4% over 2011, as opposed to a forecast 5.1% growth rate with no wind farm.
The difference between a potential wind farm impact and no wind farm impact on tourism spending in Atlantic County can best be seen in the following graph. With the assumption that a potential wind farm begins operations in 2012, the forgone tourism sales start in that year and quickly rebound back to trend growth.
30 http://www.thefreelibrary.com/Repeat+Travel+Popular+as+Ever+as+Family+&+Friends+Travel+Great...-a0141029672 31 http://www.useit.com/alertbox/20010805.html

An Assessment of Potential Costs and Benefits of Offshore Wind Turbines 39
Figure 4.7: Atlantic County Tourism Expenditures: Wind Farm and No Wind Farm
Tourism Spending Impact of Proposed Offshore Wind Farm:
Atlantic County
$15$16$17$18$19$20$21$22$23
2010 2011 2012 2013 2014 2015 2016 2017
Billions
Forecast, no Wind Farm Forecast, Wind Farm
While the effect on tourism sales in Atlantic County would be around $700 million in 2012 if a wind farm were built three miles offshore, not all of those sales would leave New Jersey. Results from the New Jersey Shore Opinion Study about Offshore Wind Turbines survey show that some of those tourists would visit other shore destinations.
Figure 4.8: Atlantic County Wind-Farm-Affected Tourism Expenditures
2012Accomodations Entertainment Food & Drink Retail Transport Grand Total
Atlantic $310,440,270 $8,347,744 $201,370,005 $171,043,167 $5,245,644 $696,446,831Other Shore Counties $76,554,571 $2,058,554 $49,657,843 $42,179,245 $1,293,576 $171,743,788
Elsewhere, period $110,578,824 $2,973,466 $71,727,996 $60,925,576 $1,868,498 $248,074,361
Unsure $123,306,875 $3,315,724 $79,984,166 $67,938,346 $2,083,570 $276,628,681
Atlantic CountyWind Farm Location - 3 miles Off Shore
Of the 16.5% of visitors who would no longer visit Atlantic County because of a wind farm being located three miles offshore, 25% would substitute another destination on the New Jersey Shore for their vacation. So, of that $700 million, $171 million would be simply transferred to other locations on the shore. Of the visitors surveyed, 35% stated they would go "Elsewhere, period." These forgone tourism sales to Atlantic County would reach $250 million. The remaining visitors and their $277 million in spending were unsure what they would do for their vacation, or even if they would take one.
For the state of New Jersey, the maximum forgone level of spending in 2012 from putting the wind farm three miles off the shore of Atlantic County would be the sum of the "elsewhere, period" and "unsure" answers, or a total of $525 million. Global Insight stresses that this is a
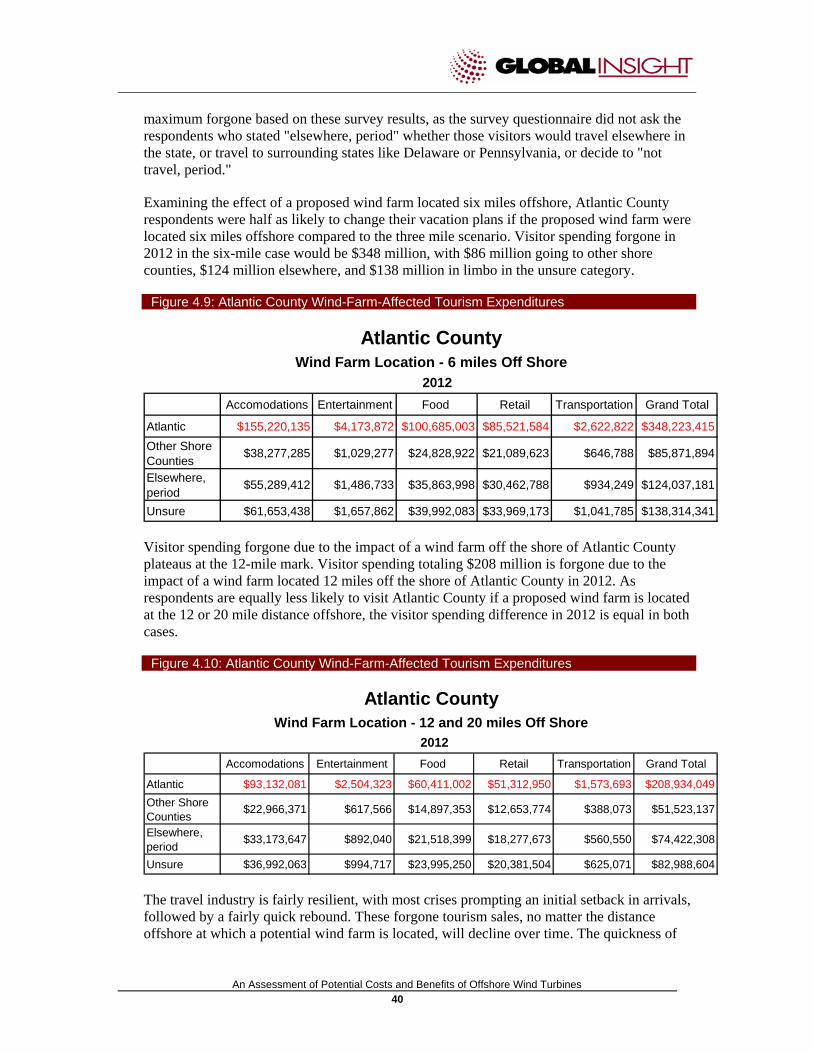
An Assessment of Potential Costs and Benefits of Offshore Wind Turbines 40
maximum forgone based on these survey results, as the survey questionnaire did not ask the respondents who stated "elsewhere, period" whether those visitors would travel elsewhere in the state, or travel to surrounding states like Delaware or Pennsylvania, or decide to "not travel, period."
Examining the effect of a proposed wind farm located six miles offshore, Atlantic County respondents were half as likely to change their vacation plans if the proposed wind farm were located six miles offshore compared to the three mile scenario. Visitor spending forgone in 2012 in the six-mile case would be $348 million, with $86 million going to other shore counties, $124 million elsewhere, and $138 million in limbo in the unsure category.
Figure 4.9: Atlantic County Wind-Farm-Affected Tourism Expenditures
2012Accomodations Entertainment Food Retail Transportation Grand Total
Atlantic $155,220,135 $4,173,872 $100,685,003 $85,521,584 $2,622,822 $348,223,415Other Shore Counties $38,277,285 $1,029,277 $24,828,922 $21,089,623 $646,788 $85,871,894
Elsewhere, period $55,289,412 $1,486,733 $35,863,998 $30,462,788 $934,249 $124,037,181
Unsure $61,653,438 $1,657,862 $39,992,083 $33,969,173 $1,041,785 $138,314,341
Atlantic CountyWind Farm Location - 6 miles Off Shore
Visitor spending forgone due to the impact of a wind farm off the shore of Atlantic County plateaus at the 12-mile mark. Visitor spending totaling $208 million is forgone due to the impact of a wind farm located 12 miles off the shore of Atlantic County in 2012. As respondents are equally less likely to visit Atlantic County if a proposed wind farm is located at the 12 or 20 mile distance offshore, the visitor spending difference in 2012 is equal in both cases.
Figure 4.10: Atlantic County Wind-Farm-Affected Tourism Expenditures
2012Accomodations Entertainment Food Retail Transportation Grand Total
Atlantic $93,132,081 $2,504,323 $60,411,002 $51,312,950 $1,573,693 $208,934,049Other Shore Counties $22,966,371 $617,566 $14,897,353 $12,653,774 $388,073 $51,523,137
Elsewhere, period $33,173,647 $892,040 $21,518,399 $18,277,673 $560,550 $74,422,308
Unsure $36,992,063 $994,717 $23,995,250 $20,381,504 $625,071 $82,988,604
Atlantic CountyWind Farm Location - 12 and 20 miles Off Shore
The travel industry is fairly resilient, with most crises prompting an initial setback in arrivals, followed by a fairly quick rebound. These forgone tourism sales, no matter the distance offshore at which a potential wind farm is located, will decline over time. The quickness of
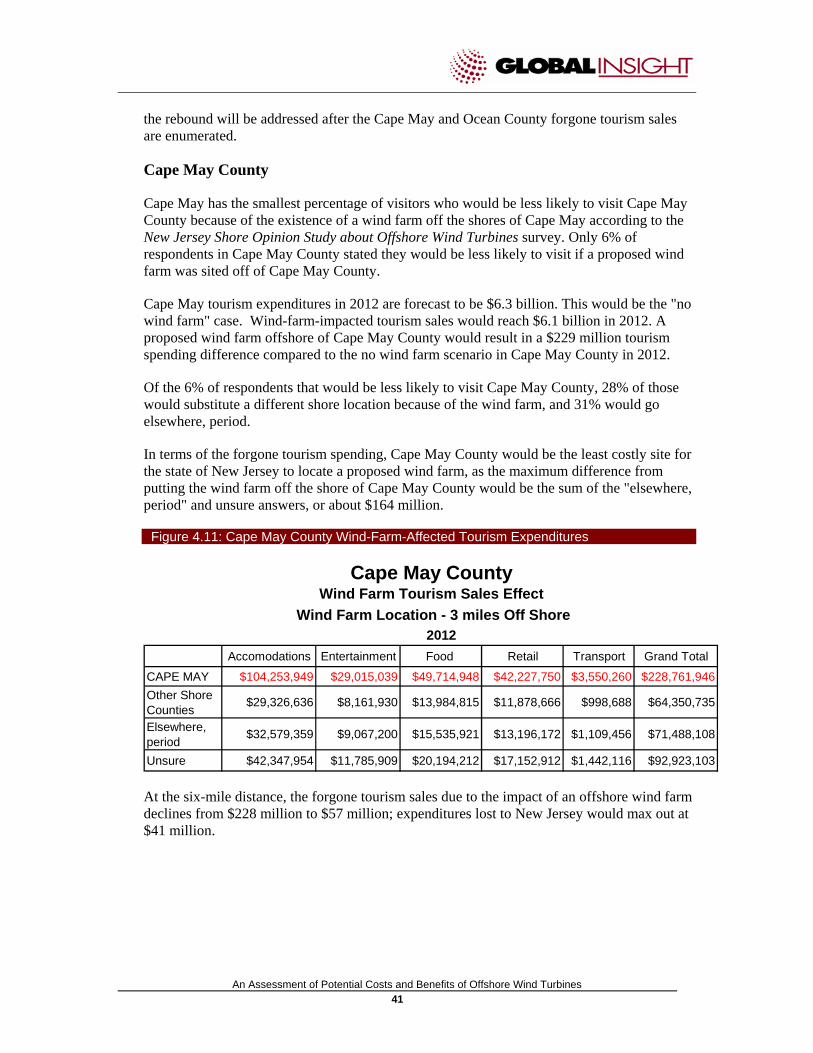
An Assessment of Potential Costs and Benefits of Offshore Wind Turbines 41
the rebound will be addressed after the Cape May and Ocean County forgone tourism sales are enumerated.
Cape May County
Cape May has the smallest percentage of visitors who would be less likely to visit Cape May County because of the existence of a wind farm off the shores of Cape May according to the New Jersey Shore Opinion Study about Offshore Wind Turbines survey. Only 6% of respondents in Cape May County stated they would be less likely to visit if a proposed wind farm was sited off of Cape May County.
Cape May tourism expenditures in 2012 are forecast to be $6.3 billion. This would be the "no wind farm" case. Wind-farm-impacted tourism sales would reach $6.1 billion in 2012. A proposed wind farm offshore of Cape May County would result in a $229 million tourism spending difference compared to the no wind farm scenario in Cape May County in 2012.
Of the 6% of respondents that would be less likely to visit Cape May County, 28% of those would substitute a different shore location because of the wind farm, and 31% would go elsewhere, period.
In terms of the forgone tourism spending, Cape May County would be the least costly site for the state of New Jersey to locate a proposed wind farm, as the maximum difference from putting the wind farm off the shore of Cape May County would be the sum of the "elsewhere, period" and unsure answers, or about $164 million.
Figure 4.11: Cape May County Wind-Farm-Affected Tourism Expenditures
2012Accomodations Entertainment Food Retail Transport Grand Total
CAPE MAY $104,253,949 $29,015,039 $49,714,948 $42,227,750 $3,550,260 $228,761,946Other Shore Counties $29,326,636 $8,161,930 $13,984,815 $11,878,666 $998,688 $64,350,735
Elsewhere, period $32,579,359 $9,067,200 $15,535,921 $13,196,172 $1,109,456 $71,488,108
Unsure $42,347,954 $11,785,909 $20,194,212 $17,152,912 $1,442,116 $92,923,103
Cape May County
Wind Farm Location - 3 miles Off ShoreWind Farm Tourism Sales Effect
At the six-mile distance, the forgone tourism sales due to the impact of an offshore wind farm declines from $228 million to $57 million; expenditures lost to New Jersey would max out at $41 million.

An Assessment of Potential Costs and Benefits of Offshore Wind Turbines 42
Figure 4.12: Cape May County Wind-Farm-Affected Tourism Expenditures
2012Accomodations Entertainment Food Retail Transportation Grand Total
CAPE MAY $26,063,487 $7,253,760 $12,428,737 $10,556,937 $887,565 $57,190,487Other Shore Counties $7,331,659 $2,040,483 $3,496,204 $2,969,666 $249,672 $16,087,684
Elsewhere, period $8,144,840 $2,266,800 $3,883,980 $3,299,043 $277,364 $17,872,027
Unsure $10,586,989 $2,946,477 $5,048,553 $4,288,228 $360,529 $23,230,776
Cape May County
Wind Farm Location - 6 miles Off ShoreWind Farm Tourism Sales Effect
For Cape May County, the tourism sales effect of a potential offshore wind farm plateaus at the six-mile mark and the forgone tourism spending for wind farm locations twelve and twenty miles offshore will be the same as the six-mile distance.
Ocean County
The survey results for Ocean County, of the three counties studied, from the offshore wind farm survey are closest to the state averages: 14.5% of visitors to Ocean County would be less likely to visit Ocean County if a wind farm were to be located off the shore of Ocean County. This would result in $231 million of forgone tourism spending to Ocean County in 2012.
Figure 4.13: Ocean County Tourism Expenditures: Wind Farm vs. No Wind Farm
Tourism Spending Impact of Proposed Offshore Wind Farm:
Ocean County
$3.5$3.7$3.9$4.1$4.3$4.5$4.7$4.9$5.1$5.3$5.5
2010 2011 2012 2013 2014 2015 2016 2017
Billions
Forecast, no Wind Farm Forecast, Wind Farm

An Assessment of Potential Costs and Benefits of Offshore Wind Turbines 43
However, Ocean County visitors were the most likely of all the counties surveyed to substitute another New Jersey shore location for their holiday if the wind farm were located off of Ocean County. Almost half (49%) would visit the other shore counties in this case. Of the $231 million, over $114 million would be spent in the other shore counties.
Of the visitors who would be less likely to visit Ocean County, 25% stated they would go elsewhere, period; while another quarter were unsure of where their vacations would take them.
These numbers would result in a maximum forgone tourism spending to the state of New Jersey as a result of a wind farm off the Ocean County shore to about $117 million in 2012.
Figure 4.14: Ocean County Tourism Expenditures: Wind Farm vs. No Wind Farm
2012Accomodations Entertainment Food Retail Transport Grand Total
Ocean $68,983,347 $26,061,362 $70,779,849 $60,120,223 $5,241,595 $231,186,376Other Shore Counties $34,057,078 $12,866,495 $34,944,011 $29,681,354 $2,587,776 $114,136,714
Elsewhere, period $17,466,583 $6,598,737 $17,921,458 $15,222,440 $1,327,172 $58,536,390
Unsure $17,459,685 $6,596,131 $17,914,380 $15,216,428 $1,326,648 $58,513,272
Ocean County
Wind Farm Location - 3 miles Off ShoreWind Farm Tourism Sales Effect
At the six-mile distance, the forgone tourism sales due to the impact of an offshore wind farm declines from $231 million to $127 million; expenditures lost to New Jersey would max out at $64 million.
Figure 4.15: Ocean County Tourism Expenditures: Wind Farm vs. No Wind Farm
2012Accomodations Entertainment Food Retail Transportation Grand Total
Ocean $37,940,841 $14,333,749 $38,928,917 $33,066,122 $2,882,877 $127,152,507Other Shore Counties $18,731,393 $7,076,572 $19,219,206 $16,324,745 $1,423,277 $62,775,193
Elsewhere, period $9,606,621 $3,629,305 $9,856,802 $8,372,342 $729,945 $32,195,015
Unsure $9,602,827 $3,627,872 $9,852,909 $8,369,036 $729,656 $32,182,300
Wind Farm Location - 6 miles Off Shore
Ocean CountyWind Farm Tourism Sales Effect
For Ocean County, the less likely visitor opinion plateaus at the six-mile mark and the tourism spending forgone for wind farm locations 12 and 20 miles offshore will be the same as the six-mile distance.

An Assessment of Potential Costs and Benefits of Offshore Wind Turbines 44
Over time:
What has been enumerated previously is forgone revenue from tourism in year one, considered to be 2012, of the operations of an offshore wind farm. Along with taking into account the wind farms differential impact by county and distance from shore, it is important to look at the full cost over time.
While most other cost/benefit analysis of wind farms that Global Insight has reviewed simply take the forgone tourism revenue and extend it over the lifetime of the operation of the wind farm, actual tourism reactions to a negative event do not support that assumption.
Tourism can be considered a fragile industry in that it is highly susceptible to external shocks and economic downturns. A shock can produce a sharp downward spike in tourist arrivals followed by an immediate recovery. In this way, the tourism industry is resilient and responds quickly to crises, regaining momentum over a relatively short-time span. While most analysis at this time focuses on external shocks such as natural disasters or political upheaval or terrorism acts, the tourism reaction to a potential wind farm is expected to be essentially the same.
Global Insight's analysis of such tourism impacting events as SARS, the Bali bombing, etc. shows that any tourism impact is short lived. In fact, tourism in year two rebounds beyond the loss of the event in year one in most cases.
Figure 4.16: Tourism Resiliency: Limited Impact of Destination-Specific Events
+6.0%+7.3%
+1.4%(e)
+1.2%+7.9%+5.5%
Madrid Train Bombing (March 2004)London: Russell Sq Tube Bombings (Mar ’05)Egypt Dahab Resort Bombing (April 2006)
+13.6% ytd-4.0%Israel/Lebanon Conflict (2006)
+30%-28%SARS in Hong Kong (Spring 2003)
+21%-11.2%Bali Night Club Bombing (Oct 2002)
+7.5%-10%Civil Violence preceding Argentina Currency Devaluation (Fall 2002)
-7%-11%9/11 Attacks (Sep 2001)
+40%-12.1%Luxor (Egypt) Terrorist Attacks (Nov 1997)
+14.9%-3.5%Tokyo Subway Nerve Gas Attack (Mar 95)
Arrival Growth Next
Year
Arrival Growth Year
of EventEvent
Global Insight uses this information to show only the resiliency of tourism to negative events, not to compare a potential wind farm to a natural disaster or terrorist act.

An Assessment of Potential Costs and Benefits of Offshore Wind Turbines 45
By contrast, there is not much research on when and how quickly such events affect the process and rate of recovery and when full recovery has been achieved following a negative shock. There are uncertainties concerning the duration of any downturn.
A 2007 U.S. Department of Commerce press release shows an idea of the length of a recovery to a negative event: "U.S. travel and tourism exports have never been higher. Indeed, international travelers spent a record-breaking $108 billion experiencing the United States in 2006, eclipsing the previous record set in 2000 by nearly 5%."32 In this case, recovery from the 2001 terrorist acts could be considered to be five years.
Global Insight has taken a conservative approach to the length and quickness to any "decay" to a potential wind farm's impact on tourism. The decay of the tourism impact is assumed to be about 50% the first three years, accelerating after that, and the length of the wind farm tourism impact is assumed to be seven years. This decay and length of impact applies both to the forgone tourism sales from a potential wind farm and possible tourism gains from that wind farm.
Figure 4.17: Wind Farm vs. No Wind Farm Tourism Expenditures Over Time
CountyNet Present
Value 2012 2013 2014 2015 2016ATLANTIC $1,151,427,520 $696,446,831 $341,496,996 $171,679,463 $66,524,624 $27,029,207CAPE MAY $389,867,924 $228,761,946 $116,628,677 $60,878,951 $24,845,275 $10,604,290OCEAN $393,882,731 $231,186,376 $117,821,232 $61,479,558 $25,078,075 $10,698,663
Tourism Wind Farm ImpactThree Miles Offshore
In Ocean County, for example, tourism sales in affected shore towns would be $231 million smaller than forecast in 2012, as the result of a wind farm being located off Ocean County's shoreline. In 2013, tourism sales forgone from the operations of a wind farm would reach $118 million and the forgone sales number would continue to decrease quickly over time. The net present value of the forgone tourism sales is just under $400 million, in 2012 dollars. This assumes an 8% discount rate.
Affected towns in Cape May County show the lowest net present value tourism sales forgone. Tourism sales would decline $228 million if a wind farm were located three miles off the Cape May coast. Atlantic County would show the highest net present value forgone sales of $1.15 billion.
If a proposed wind farm were located six miles off the coast of one of these counties, the spending forgone would decline by anywhere from half-to-three-quarters.
32 http://www.commerce.gov/NewsRoom/PressReleases_FactSheets/PROD01_002912

An Assessment of Potential Costs and Benefits of Offshore Wind Turbines 46
Figure 4.18: Wind Farm vs. No Wind Farm Tourism Expenditures Over Time
CountyNet Present
Value 2012 2013 2014 2015 2016ATLANTIC $586,560,002 $348,223,415 $174,941,539 $90,030,920 $36,030,651 $15,095,187CAPE MAY $101,523,640 $57,190,487 $30,606,767 $16,742,251 $7,288,248 $3,307,440OCEAN $220,382,964 $127,152,507 $66,171,892 $35,233,029 $14,777,551 $6,473,250
Tourism Wind Farm ImpactSix Miles Offshore
Atlantic and Ocean County's tourism sales impact of a proposed wind farm six miles off the coast would halve, to $348 and $127 million, respectively. Cape May's tourism sales impact would drop by three-quarters, to $57 million. The net present value of the forgone tourism sales in Cape May County drops to $101 million; while Atlantic County forgone sales drop to $586 million with a wind farm located six miles off the coast.
Similar analyses have been done assuming a potential wind farm located at distances of 12 and 20 miles off shore. In Cape May and Ocean County's cases, the forgone sales level remains constant at these further distances, while the decline in forgone sales in Atlantic County becomes less drastic. At the 20-mile distance, Atlantic County tourism sales impact drops to $208 million, from $696 million in the three-mile case. The net present value drops from $1.15 billion to around $350 million.
Figure 4.19: Wind Farm vs. No Wind Farm Tourism Expenditures Over Time
CountyNet Present
Value 2012 2013 2014 2015 2016ATLANTIC $356,989,887 $208,934,049 $106,858,457 $55,950,064 $22,930,343 $9,826,300CAPE MAY $101,523,640 $57,190,487 $30,606,767 $16,742,251 $7,288,248 $3,307,440OCEAN $220,382,964 $127,152,507 $66,171,892 $35,233,029 $14,777,551 $6,473,250
Tourism Wind Farm ImpactTwenty Miles Offshore
4.4 Tourism's Benefit
The tourism benefit of a proposed wind farm would lie in any gain of visitors and their spending or an increase in spending by visitors already visiting New Jersey and to the impacted shore region in particular.
The New Jersey Shore Opinion Study about Offshore Wind Turbines reports that 14% of visitors would be more likely to visit the New Jersey shore in the future if wind turbines were located off the New Jersey shore. This compares with 12%, who would be less likely to visit, who were the group considered in the forgone tourism section. Almost three-quarters (72%)

An Assessment of Potential Costs and Benefits of Offshore Wind Turbines 47
would be neither more nor less likely to visit the New Jersey shore if a wind farm were located off shore.
Drilling down to the county level of the three counties pertinent here, only Atlantic County visitors were equally likely to respond that they were less likely to visit as respondents that were more likely to visit, each with 16% of respondents. In Cape May County, 12% of respondents would be more likely to visit against only 6% less likely to visit. In Ocean County, 22% of the respondents were more likely to visit against 14% less likely to visit.
Even with the overwhelming majority of visitors to the shore claiming they would not have their travel plans disrupted by a proposed wind farm off the New Jersey shore, information on how many additional visitors would go to the shore if a wind farm were built is lacking. The New Jersey Shore Opinion Study about Offshore Wind Turbines surveyed visitors to places already on the shore and does not give us information about additional visitation.
The results of the New Jersey Shore Opinion Study about Offshore Wind Turbines are very similar to a consumer survey done by Beacon Hill on the Cape Wind project. In that study, surveys were taken by potential visitors to the shore. Combining the results from the two surveys can give an idea as to the increased visitation at the New Jersey shore that could occur due to a potential wind farm.
In the report from the Beacon Hill Institute—Blowing in the Wind: Offshore Wind and the Cape Cod Economy—the results from a similar tourist survey were presented. Respondents were asked if their travel habits might change as a result of the windmills and, specifically, whether they would visit less (or more) and spend less (or more).
Of the tourists, 3.2% said they would spend fewer days on the Cape and 1.8% would not visit at all. This total of 5.0% of visitors that are considered "less likely" to visit from the Cape survey correlates well with the results presented in the previous section. The forgone tourism spending at the New Jersey shore would range from 3.5% (Cape May County) to 5.3% (Ocean County) of total tourism sales.
The Cape Cod study results continue with 1.0% of respondents stating they would stay longer on the Cape. The study estimates that the windmills would boost visits by about 0.6%. The total of 1.6% is considered the more likely to visit set.
From the Blowing in the Wind: Offshore Wind and the Cape Cod Economy survey, the ratio of more likely to visit over the less likely to visit becomes 1.6/5. Using the fact that the tourism spending forgone in New Jersey is similar to the less likely to visit set from the Cape survey, Global Insight is using the ratio of less likely to visit over more likely to visit from the Cape Cod study and applying that to the New Jersey shore results.
For example, in Atlantic County, the forgone tourism sales level is 4% of the total. Multiplying by 1.6, the increase in Cape visitation, and then dividing by 5, the forgone Cape visitation, gives an increase in tourism sales of 1.3% in 2012. As tourism sales are expected to reach $17.4 billion in 2012, this would mean an increase in tourism sales in Atlantic County of $223 million.

An Assessment of Potential Costs and Benefits of Offshore Wind Turbines 48
Figure 4.20: Wind Farm Benefit
County
Accomodations Entertainment Food & Drink Retail Transport Grand Total
Atlantic $99,340,886 $2,671,278 $64,438,402 $54,733,814 $1,678,606 $222,862,986
Cape May $33,361,264 $9,284,812 $15,908,783 $13,512,880 $1,136,083 $73,203,823
Ocean $22,074,671 $8,339,636 $22,649,552 $19,238,471 $1,677,310 $73,979,640
Wind Farm Impact - Tourism Sales GainSpending Category
Similar calculations have been done for Cape May and Ocean counties. Cape May County and Ocean County are estimated to gain around $74 million each with a wind farm location off the shore of each county.
Global Insight is assuming the decay of impact in the tourism gain will be similar to the decay of impact in the forgone tourism. In addition, one point that can be taken from the New Jersey Shore Opinion Study about Offshore Wind Turbines is that, unlike the less likely to return to the shore respondents, more likely to return respondents were not affected by the distance offshore of the wind farm. The tourism gain is assumed to remain at the above level no matter what distance the wind farm is located offshore.
4.5 Tourism Net Impacts
4.5.1 Tourism Sales—Net, with Impacts
The preceding results would make net tourism revenue forgone of about $475 million in Atlantic County with a proposed wind farm three miles offshore. Affected shore towns in Cape May County would forgo tourism spending of $156 million in 2012, with Ocean County towns forgoing $157 million.
Figure 4.21: Net Wind Farm Tourism Sales Impact
Counties Atlantic Cape May OceanTourism Spending Loss $696,446,831 $228,761,946 $231,186,376Tourism Spending Gain $222,862,986 $73,203,823 $73,979,640Net Spending Gain/Loss ($473,583,845) ($155,558,123) ($157,206,736)
Tourism Sales Wind Farm ImpactThree Miles Offshore
2012
With an estimated $17.4 billion in tourism spending in Atlantic County in 2012, the estimated sales forgone of $474 million is 2.7% of total tourism sales. In Cape May County, the $156 million is 2.4% of total tourism sales in the Cape May County affected shore towns; in Ocean County, the three-mile offshore wind farm location would impact 3.6% of tourism sales in 2012.

An Assessment of Potential Costs and Benefits of Offshore Wind Turbines 49
Spending is just one measure of a wind farm's impact on tourism at the Jersey shore. The potential wind farm impact on economic output (gross state or county product), labor income, and employment are other measures important to examine.33
As shown, these expenditures represent lodging sales, retail sales, transportation sales, and others. These sales flow through the economy as tourists sales purchase labor services (pay wages and salaries), purchase intermediate goods and services (accounting services, cleaning services, food purchases), and purchase cost of goods (retail goods from outside the study area). The initial infusion of outside money into a community creates several rounds of spending and re-spending. An area restaurant pays wages to an employee, who then buys groceries from the local supermarket, creating income for the supermarket. The supermarket pays its employees, who also purchase goods and services. This cycle continues until the initial infusion of money is offset by leakages. This creates a multiplier for the original sales.
Leakage occurs when money is spent on good and services outside of the community. The purchase of a T-shirt at a shore vendor is an example. The cost of the T-shirt to that vendor is a leakage, assuming the T-shirt was made outside New Jersey.
These economic impacts of forgone tourism spending were estimated using the IMPLAN software and databases. IMPLAN (IMpact analysis of PLANing) uses the input-output (I-O) to model the total economic impact that these forgone tourism expenditures would have had on each county and statewide. The IMPLAN model, developed by the U.S. Forest Service, uses a comprehensive and detailed database that covers most economic sectors. It allows users to construct input-output models for geographic areas of any size in the United States.
IMPLAN is an excellent tool to evaluate regional and community economic impacts resulting from changes in specific sectors of the economy. The model generates aggregate or sectoral impacts on various measures of economic activity, including output, value added, personal income, and employment. It is widely used to analyze the impacts of visitor expenditures and is an appropriate model for our analysis.
The IMPLAN database of 2006 was used in this study, which was the most recent database available. This database contains statewide and county-level economic data, and the program is versatile in terms of generating different types of impact reports, such as income, sales, employment, and taxes.
Global Insight used the Atlantic, Cape May, and Ocean County's databases to estimate the economic impact in each county. For the displacement of tourism spending, the four county shore (including Monmouth, as it could be where the displaced visitors spend their vacations) aggregate model was used to estimate economic impacts. The IMPLAN database contains economic data on 528 industries, but the model was aggregated to the three-digit NAICS level for the purposes of this analysis.
In Atlantic County, with forgone tourism spending of $474 million in 2012, the forgone value-added impact to Atlantic County would be $370 million and forgone labor income would be $233 million of which about $150 million would be direct. Fewer than 4,000 direct jobs would be forgone and the state and Atlantic County would forgo under $50 million in tax revenue.
33 For definitions of concepts, please see the appendix

An Assessment of Potential Costs and Benefits of Offshore Wind Turbines 50
Figure 4.22: Net Wind Farm Tourism Economic Impact – Atlantic County
2012 Direct Indirect Induced TotalVisitor Spending $473,583,845Economic Impact $223,322,084 $55,562,361 $67,837,991 $346,722,436Wages $138,883,963 $33,474,657 $45,068,903 $217,427,524Jobs 3,694 579 780 5,052 State & Local Taxes - - - $44,252,433
Wind Farm Tourism Impact - Atlantic CountyAtlantic County Wind Farm, Located 3 Miles Offshore
Locating a proposed wind farm three miles off the coast of either Ocean or Cape May counties would lower 2012 forgone revenues and jobs.
Figure 4.23: Net Wind Farm Tourism Economic Impact – Other Counties
2012 Direct Indirect Induced TotalVisitor Spending $155,558,123Economic Impact $47,003,935 $10,738,321 $11,951,379 $69,693,635Wages $27,870,543 $6,139,417 $7,647,086 $41,657,046Jobs 810 119 153 1,081 Taxes - - - $8,787,875
Wind Farm Tourism Impact - Cape May CountyWind Farm Located 3 Miles Offshore
2012 Direct Indirect Induced TotalVisitor Spending $157,206,736Economic Impact $48,143,140 $12,240,150 $15,505,310 $75,888,600Wages $29,655,160 $7,092,944 $9,560,356 $46,308,459Jobs 999 134 188 1,321 Taxes - - - $10,047,507
Wind Farm Tourism Impact - Ocean CountyWind Farm Located 3 Miles Offshore
In Cape May County, the forgone $156 million in tourism spent in 2012 would mean an economic impact of $70 million would be forgone. Forgone direct wages would be $28 million lower with a difference of $42 million in total labor income as 1,081 jobs wouldn't be created. Ocean County shows similar numbers.
Locating a proposed wind farm six miles off shore would decrease the forgone tourism sales by almost two-thirds in Atlantic County, down to a difference of $125 million in 2012 in the affected shore towns. Cape May's tourism sales would increase by $16 million, while Ocean County tourism sales forgone would amount to about $53 million in 2012, if a wind farm were to be built six miles off the coast of Ocean County.

An Assessment of Potential Costs and Benefits of Offshore Wind Turbines 51
Figure 4.24: Net Wind Farm Tourism Sales Impact – Six Miles Offshore
Counties Atlantic Cape May OceanTourism Spending Loss $348,223,415 $57,190,487 $127,152,507Tourism Spending Gain $222,862,986 $73,203,823 $73,979,640Net Spending Gain/Loss ($125,360,429) $16,013,336 ($53,172,867)
Tourism Sales Wind Farm ImpactSix Miles Offshore
2012
The resulting employment and economic impact numbers for each county decreases in accordance with the lower amount of forgone spending. As can be seen in the Ocean County example, with forgone spending down to $53 million with a wind farm location six miles offshore, the economic impact value forgone is $25 million in 2012. At three miles, this difference was $76 million. Similarly, employment forgone in 2012 drops to 435 jobs in Ocean County from over 1,300 in the three-mile case.
Figure 4.25: Net Wind Farm Tourism Economic Impact – Ocean Counties
2012 Direct Indirect Induced TotalVisitor Spending $53,172,867Economic Impact $15,972,588 $4,080,075 $5,156,949 $25,209,612Wages $9,854,847 $2,369,064 $3,179,702 $15,403,613Jobs 328 45 62 435 Taxes - - - $3,344,928
Wind Farm Tourism Impact - Ocean CountyWind Farm Located 6 Miles Offshore
The net present value of the tourism sales forgone, using a discount rate of 8% and decay of the wind farm effect at around 50%, would be $228 million in Atlantic County with a proposed wind farm six miles off shore. Affected shore towns in Cape May County would see a net present value increase in tourism spending of $20 million in 2012 with Ocean County towns forgoing a net present value of tourism sales of $97 million.
Figure 4.26: Net Wind Farm Tourism Sales Impact – Six Miles Offshore, Net Present Value
Counties Atlantic Cape May OceanTourism Spending Loss $586,560,002 $101,523,640 $220,382,964Tourism Spending Gain $358,628,556 $121,761,312 $123,011,786Net Spending Gain/Loss ($227,931,447) $20,237,672 ($97,371,179)Assumes Discount Rate of 8%
Net Present Value
Tourism Sales Wind Farm ImpactSix Miles Offshore
With a wind farm 20 miles offshore, tourism sales forgone in Atlantic County would be positive. Beyond six miles, the distances out to sea would have no further effect on the Cape

An Assessment of Potential Costs and Benefits of Offshore Wind Turbines 52
May and Ocean Counties tourism sales. In the Cape May and Ocean County cases, the respondents to the offshore wind farm survey show a level negative opinion of the wind farm once it has moved beyond the three-mile mark.
Atlantic County tourism sales show a gain in 2012 with a proposed wind farm located 20 miles off shore. Tourism sales would increase $14 million in Atlantic County, as the attraction of tourists outweighs the displacement of visitors. Cape May County and Ocean County affected towns' tourism sales impact with a wind farm 20 miles offshore remains the same as a six-mile offshore wind farm.
Figure 4.27: Net Wind Farm Tourism Sales Impact – Twenty Miles Offshore
Counties Atlantic Cape May OceanTourism Spending Loss $208,934,049 $57,190,487 $127,152,507Tourism Spending Gain $222,862,986 $73,203,823 $73,979,640Net Spending Gain/Loss $13,928,937 $16,013,336 ($53,172,867)
Tourism Sales Wind Farm ImpactTwenty Miles Offshore
2012
There is now a net present value gain in tourism sales in Atlantic and Cape May County. The NPV of the tourism sales gains reaches $20 million in Cape May County with a proposed wind farm 20 miles off shore. The NPV in Atlantic County would hit about $1.6 million in 2012 dollars. Ocean County towns NPV of tourism sales would mean forgoing $97 million level from the six miles example.
Figure 4.28: Net Wind Farm Tourism Sales Impact – Twenty Miles Offshore, Net Present Value
Counties Atlantic Cape May OceanTourism Spending Loss $356,989,887 $101,523,640 $220,382,964Tourism Spending Gain $358,628,556 $121,761,312 $123,011,786Net Spending Gain/Loss $1,638,669 $20,237,672 ($97,371,179)Assumes Discount Rate of 8%
Net Present Value
Tourism Sales Wind Farm ImpactTwenty Miles Offshore
4.5.2 Tourism Economic Impact - State-wide
It is important to remember that the aforementioned spending, value added, labor income, and employment impacts are county specific. That is, any forgone tourism sales or increase in tourism sales for each county is the impact on that county and that county alone. The tourism sales forgone would be different with the state of New Jersey as the geographic analysis.
As stated in section 4.4, a significant percentage of visitors that decide they would not visit the county that had a wind farm offshore would instead visit another shore county. The analysis does not take in the impacts created by visitors merely substituting another
An Assessment of Potential Costs and Benefits of Offshore Wind Turbines 53
destination on the Jersey Shore for the affected county into account. This will substantially lower the foregone revenues and jobs to the state of New Jersey as the result of a potential wind farm.
As stated, a wind farm located three miles off the shore of Atlantic County would mean about $473 million in forgone tourism sales in Atlantic County. As stated in previous sections, some of forgone tourism spending would merely move to other shore locations, about $171 million. This spending would be spread among the remaining New Jersey shore counties. Calculating the economic impact of $171 million in additional spending in the other shore counties, $110 million in value added would be created in those shore counties. This spending would add about 1,400 jobs to those other shore locations.
While the Atlantic County forgone sales amount reaches $473 million, opening up the geographic area impacted by a potential wind farm three miles off of Atlantic County to include the state of New Jersey, forgone tourism sales declines to $302 million in 2012. With the state of New Jersey as the analysis area, forgone gross state product would be $260 million and 4,000 jobs would not get created. The additional $302 million in tourism sales that would not happen in 2012 as the result of a wind farm three miles off Atlantic County shores means that about $34 million in state and local tax revenue would not be created in this case.

An Assessment of Potential Costs and Benefits of Offshore Wind Turbines 54
Figure 4.29: Net Wind Farm Tourism Economic Impact – Statewide
2012 Direct Indirect Induced TotalVisitor Spending $473,583,845Economic Impact $223,322,084 $55,562,361 $67,837,991 $346,722,436Wages $138,883,963 $33,474,657 $45,068,903 $217,427,524Jobs 3,694 579 780 5,052 State & Local Taxes - - - $44,252,433
2012 Direct Indirect Induced TotalVisitor Spending $171,743,788Economic Impact $65,206,241 $19,443,946 $25,128,937 $109,779,124Wages $42,177,424 $11,840,324 $16,123,907 $70,141,655Jobs 1,014 167 243 1,423 State & Local Taxes - - - $12,901,885
2012 Direct Indirect Induced TotalVisitor Spending $301,840,056Economic Impact $158,115,843 $36,118,414 $42,709,054 $236,943,312Wages $96,706,539 $21,634,333 $28,944,997 $147,285,869Jobs 2,680 412 537 3,629State & Local Taxes - - - $31,350,548
Net Wind Farm Tourism Impact to New Jersey Atlantic County Wind Farm, Located 3 Miles Offshore
Wind Farm Tourism Impact - Other Jersey ShoreAtlantic County Wind Farm, Located 3 Miles Offshore
Wind Farm Tourism Impact - Atlantic CountyAtlantic County Wind Farm, Located 3 Miles Offshore
Looking at another example, a potential wind farm located six miles off Cape May County, as stated above, would have a positive affect on tourism sales in Cape May County in 2012 of about $16 million. This is the result of the lower forgone tourism sales in Cape May and the increase in sales from new visitors that would occur as the result of a wind farm. This gain of $16 million in tourism sales in Cape May would mean an increase in employment of 112 in 2012.
As was the case in Atlantic County, a portion of the lower forgone tourism sales would be displaced to other shore counties. With a wind farm located six miles off the coast of Cape May County, tourism sales displaced to the other shore counties in 2012 would reach $64 million. This spending would be spread among the remaining New Jersey shore counties. The economic impact of $64 million in additional spending in the other shore counties would add $39 million in value added in those shore counties. This spending would add about 540 jobs to those other shore locations.
Locating a wind farm six miles off of Cape May County would add $16 million in tourism sales in Cape May County and would add $64 million in displaced tourism sales to the other shore counties for a total tourism sales gain in the state of New Jersey of $80 million.

An Assessment of Potential Costs and Benefits of Offshore Wind Turbines 55
This $80 million is the tourism sales gain the state of New Jersey would forgo versus the case of not building a wind farm six miles off of Cape May County. Building a wind farm six miles off of Cape May County would add an additional $46 million to the state of New Jersey's Gross State Product. It would mean an additional $28 million in labor income and 656 jobs.
Figure 4.30: Net Wind Farm Tourism Economic Impact – Statewide
2012 Direct Indirect Induced TotalVisitor Spending $16,013,336Economic Impact $4,856,399 $1,106,693 $1,234,858 $7,197,951Wages $2,881,537 $632,476 $790,124 $4,304,137Jobs 84 12 16 112State & Local Taxes - - - $675,761
2012 Direct Indirect Induced TotalVisitor Spending $64,350,735Economic Impact $23,072,521 $6,947,722 $8,850,492 $38,870,736Wages $14,408,785 $4,265,707 $5,635,164 $24,309,656Jobs 376 70 98 544State & Local Taxes - - - $3,907,639
2012 Direct Indirect Induced TotalVisitor Spending $80,364,072Economic Impact $27,928,921 $8,054,415 $10,085,350 $46,068,686Wages $17,290,322 $4,898,183 $6,425,288 $28,613,793Jobs 460 82 114 656State & Local Taxes - - - $4,583,400
Net Wind Farm Tourism Impact to New Jersey Cape May County Wind Farm, Located 6 Miles Offshore
Wind Farm Tourism Impact - Cape May CountyWind Farm, Located 6 Miles Offshore
Wind Farm Tourism Impact - Other Jersey ShoreCape May County Wind Farm, Located 6 Miles Offshore
It is important for readers and policy makers to understand the difference in the overall wind farm impacts to each county alone and then to the state of New Jersey as a whole. The displacement of the forgone tourism sales to other shore counties will lower the negative impacts of the wind farm to the state as a whole, in many cases creating positive tourism sales and employment impacts.
4.6 Tourism Conclusions
While research Global Insight has seen shows minimal tourism impact as the result of a wind farm, either on-shore or offshore, it is important to understand and enumerate possible tourism impacts of a potential wind farm to New Jersey using local surveys and studies.
Estimates based on survey results from the New Jersey Shore Opinion Study about Off Shore Wind Turbines and results from the New Jersey Satellite Account show that possible foregone

An Assessment of Potential Costs and Benefits of Offshore Wind Turbines 56
tourism sales in 2012, as the result of wind farm in each county with a wind farm located three miles offshore would run from $700 million in Atlantic County to $230 million in Ocean and Cape May counties. Global Insight believes that this slowdown in tourism growth would quickly fade away over time, resulting in the net present value of a potential wind farm three miles off the coast of $1.15 billion in Atlantic County to $400 million in Ocean and Cape May counties.
The forgone tourism sales decline as a proposed wind farm is located further away from the shoreline. The change in the forgone tourism sales is largest between a wind farm location three and then six miles offshore; in Atlantic County the six mile location shows forgone sales less than half that of the three-mile case.
Possible tourism sales gains in each county from a potential wind farm range from an additional $222 million in tourism sales in Atlantic County to around $74 million in both Cape May and Ocean Counties in 2012. These sales are not affected by the distance offshore of a wind farm.
Looking at the individual shore counties alone, the net change in tourism sales ranges from a forgone $474 million in Atlantic County in the case of a proposed wind farm three miles off shore, to a gain in tourism sales of $16 million in Cape May County were a proposed wind farm located six miles or further offshore. Tourism sales gains as the result of a wind farm are also seen in Atlantic County, with a wind farm located 20 miles offshore.
Overall, opening the geographical analysis to a statewide level, forgone tourism sales of a wind farm in 2012 would run from $300 million in Atlantic County to under $100 million in Cape May County to under $50 million in Ocean County. The net present value cost of a potential wind farm three miles off the coast would be $560 million in Atlantic County to $185 million in Ocean and Cape May counties. These numbers are not additives; if a wind farm is not built offshore of a county, there will be no foregone tourism sales.
At the other extreme, statewide tourism sales and impacts as the result of an offshore wind farm would show an increase in Cape May County beyond six miles, and in Atlantic County were a potential wind farm located 20 miles off the coast. This would result in a net present value forgone tourism difference of about $57 million in Ocean County, and gains of $22 million in Atlantic County and $26 million in Cape May.
5. Property Value Impacts at the New Jersey Shore
5.1 Property Values: Overview
The question of property value impacts from the offshore wind turbine project is also part of our comprehensive assessment. New Jersey shore properties have risen dramatically in value, particularly over the past decade. The analysis includes both residential and commercial property values.

An Assessment of Potential Costs and Benefits of Offshore Wind Turbines 57
Changes in property values are best captured at the point of sale. That is, assessed property values are driven by market prices as shore properties (residential and commercial) turn over. While the opinions of current home/business owners have something to say about potential changes in their property value, it is the prospective home or commercial property buyer that will either: pay a premium, demand a discount, or be unaffected by the existence of the offshore wind turbines.
As stated in the RFP, the study area for the impact of a proposed offshore wind farm aligns with the concurrent NJDEP-sponsored environmental impact analysis. This study area extends from Toms River to the north to Stone Harbor in the south. The 72 miles of shoreline contains several different political boundaries and the towns and counties studied include:
• Atlantic County: Atlantic City, Brigantine City, Longport Borough, Margate City, and Ventnor City.
• Cape May County: Avalon Borough, Ocean City, Sea Isle City, and Stone Harbor Borough.
• Ocean County: Barnegat Light Borough, Beach Haven Borough, Harvey Cedars Borough, Long Beach Township, Seaside Heights Borough, Seaside Park Borough, Ship Bottom Borough, and Surf City Borough.
It is important to note that in the following analysis; only the residential and commercial property values of the towns listed above are included. Thus, for Cape May County, any residential or commercial property value in Cape May or Upper Township is excluded from the analysis. In other words, the focus is on the impacted shore towns mentioned only.
As a starting point, it is important to understand the importance of property values and property taxes to New Jersey and the shore in particular.
In the state of New Jersey, the total value of land and improvements in 2006 was $743.2 billion, of which 76% or $562.3 billion was residential value. For the shore counties studied, the importance of residential values to total values is greater. While in Atlantic County, 66.5% of the total value of land and improvements is residential; in Cape May and Ocean Counties, the percentage is greater than 81% in each county. Ocean and Cape May Counties reach 86% and 87% of total value that is residential. In total, these four counties have land and improvements valued at just over $200 billion, with residential value of $164 billion. As a percentage of the total state, these four counties represent 27% of all the state's property values and 29% of New Jersey's residential value.34
In looking at the importance of property taxes to New Jersey, the overwhelming majority of property tax collections are by local governments (county, town, school) in New Jersey. Over $19 billion in property taxes were collected by local governments in New Jersey in 2004–05.35 This represents 76% of all general revenue collected from own sources by local governments. The $19.2 billion in property taxes collected by local governments represents over half of all revenues collected, with support from the state of New Jersey representing $11.3 billion of the total.
34 State of New Jersey, Department of Community Affairs, Division of Local Government Service,
Property Tax Information. 35 http://www.census.gov/govs/www/estimate.html. Local governments in this annual survey include
county, municipal, township, special district, and school district governments.

An Assessment of Potential Costs and Benefits of Offshore Wind Turbines 58
5.2 Residential Property Values
Global Insight looked at the impact of a proposed wind farm on property values in several different ways. Global Insight gathered information on the impact of wind farms on property values from the consumer point of view, using the NJ Shore Wind Farm Survey and similar surveys from Cape Wind, and other wind farm sites. Global Insight looked at actual wind farm impacts on property values. Above and beyond those studies, Global Insight examined the premium that shore views and shore access has on properties and the potential impact a wind farm might have on those premiums.
A: Consumer Surveys
It is worth pointing out that the views on impacts here are based on perceptions of the respondents and not any actual residential home price impacts.
The Royal Institution of Chartered Surveyors (RICS) carried out a study to examine the impact of wind farm development and focused on responses from surveyors with experiences of transactions affected by wind farms. Among their findings were that 60% of the sample suggested that wind farms decrease the value of residential property where the development is in view. The main factors cited as reasons for the negative impact were the visual impact of the wind farm and proximity of the property to a wind farm.
Another interesting point from this study was the temporary impact of wind farms on residential housing. Once a wind farm is completed, the negative impact on property values continues, but becomes less severe after two years or so after completion.36
In a recent update by RICS, they stated that there was "limited linear relationship between house prices and distance." It does suggest "that other variables related to the presence of wind farms may be amongst the main drivers of house prices in these locations."37
In their consumer survey studying the impact of the Cape Wind project, the Beacon Hill Institute presented respondents with photographs of the view of Nantucket Sound: 62% of tourists and 68% of homeowners said that the windmills worsen the view "slightly" or "a lot". The survey asked homeowners to estimate the price they would get if the home were sold and found that homeowners believe that the wind farm would reduce property values by 4.0%. Households with waterfront property believe that it will lose 10.9% of its value.
Beacon Hill applies this reduction in property values to the total residential property in each town and finds the difference in property values from the wind farm to be over $1.3 billion.
There have been several criticisms of this methodology. The first is that it assumes every house in each town is equally affected by the wind farm, something that our property value
36 http://www.stop-wadlow-wind-farm.org.uk/resources/RICSSurvey-WindFarmEffects.pdf 37 http://www.rics.org/NR/rdonlyres/63D1BF3E-A608-45CD-8086-A6E7924D7F14/0/WindfarmsFiBREversionthreelowres.pdf

An Assessment of Potential Costs and Benefits of Offshore Wind Turbines 59
studies will suggest is inappropriate. Second is that 79% of interviewees said that they did not expect a drop in home value—a fact not mentioned in the report.38
B: Property Value Studies
For the most part, and including the most influential and comprehensive study done to date, these studies show that a wind farm sited within either a certain distance or view shed has no impact on property values.39
In 2003, the Renewable Energy Policy Project (REPP) reviewed data on property sales in the vicinity of wind projects and used statistical analysis to determine whether and the extent to which the presence of a wind power project has had an influence on the prices that properties have been sold. This analysis covered a total of 30 analyses on 10 large wind farm projects in the United States, and considered the visual impact of a wind farm to cover five miles. It was assumed that beyond that distance, wind farms do not tend to be highly noticeable.
The findings that for the great majority of projects (eight out of ten), property values actually increased more quickly in the view shed than they did in the comparable community in the three years prior and post the on-line date of the wind farm. Even in the two projects where the view shed values increased slower than for the comparable community, circumstances made the results questionable.
Moreover, values increased faster in the view shed after the projects came on-line than they did before, and increased faster than comparable properties not in the view shed. This study does not disclose what factors did affect property values in those areas, but the data does determine that the claim that wind farms harm property values does not have merit.
In examining the consumer surveys and property value studies, Global Insight is in agreement with the REPP study in assessing the impact of the wind farm on property values overall to be zero.
There is one difference between the analyses done in the REPP study versus the proposed offshore wind farm. In all of the cases examined in the REPP study, the wind farm was land-based. At no time did the consideration of view premiums come into play, especially the value of an ocean-view or oceanfront house. It is those premiums that Global Insight examines.
The oceanfront premium is examined as, in many consumer surveys and environmental impact statements; it is the impact of wind farms on the view that is considered one of the biggest drawbacks of wind farms. In addition, there exists significant literature stating that an ocean view/oceanfront house adds to the value of that property.
Results from the New Jersey Shore Opinion Study About Off Shore Wind Turbines show that, of all the disadvantages mentioned, esthetic issues (a wind farm would be "ugly" or an "eye sore" and it would obstruct the ocean view) were mentioned most often.
38 http://www.capecodtoday.com/blogs/index.php/2007/06/27/wind_farms_nearby_may_actuallt_increase?blog=94 39 http://www.crest.org/articles/static/1/binaries/wind_online_final.pdf

An Assessment of Potential Costs and Benefits of Offshore Wind Turbines 60
In fact, of the 66% of respondents that mentioned a disadvantage to the wind turbine project, 32% of the total mentioned the impact of the wind farm on the ocean view. This ranged from a high of 45% of all respondents who mentioned view issues at three miles, to a low of 20% of respondents at 20 miles.
With this in mind, Global Insight felt it important to assess the possible impact of a proposed offshore wind farm on property values based on the wind farm impacting the ocean-view premium.
On barrier islands, as well as other beachfront communities, the distance from one's residence to the beach is strongly connected to the property price. Although scenic view is desirable, the single most important attribute for vacationing families is: how close is the beach? In a recreation-oriented beach community, this question is answered in blocks or, even better, in the number of houses from the beach.
There have been two recent empirical studies that measure the impact of proximity to the ocean on communities in New Jersey that Global Insight will use. The first measured the ocean front premium on Long Beach Island, New Jersey (LBI) in 2000.40 The selling price of LBI houses depends on the usual amenities, but location to the beach (in walking distance) is particularly important on narrow barrier islands. After including variables to control for all other aspects that add value to an island house, a variable for distance to the beach is included to ascertain the willingness to pay for one additional house closer.
The second study, done in 2004, measured the impact of proximity to the water in Avalon and Stone Harbor. In the Avalon and Stone Harbor study, the authors found that a property on the beach block would sell for a 46% premium over an "average" property and an oceanfront home would sell for a 156% premium.41
A similar study done in Washington State found that oceanfront views added 147% to value, ocean views added 32%, and partial ocean views added 10%.42
Global Insight will use these results to calculate the view premiums and assess the potential visual impact of a wind farm.
Property Value Wind Turbine Impact
Our starting point is township property value data available from the state of New Jersey, Department of Community Affairs, Division of Local Government Service, and Property Tax Information. The latest year available from this source at the time of this study was 2006 property value data. This report will present analysis of the wind farm property value impact at the county geography; however, the detailed analysis of property values was done at the township level and aggregated to county numbers. The Avalon example is for illustrative purposes only.
40 Value of Ocean Proximity on Barrier Island Houses, Appraisal Journal (April 2000) 41 The Beach Study: An Empirical Analysis of Distribution of Coastal Property Values, http://forms.gradsch.psu.edu/equity/mcnair/2003/major.pdf 42 Influence of Canadian Investment on U.S. Residential Property Values, Journal of Real Estate Research, 2003

An Assessment of Potential Costs and Benefits of Offshore Wind Turbines 61
Global Insight's Regional Department forecasts residential housing values out five years for all metro areas of the United States. The shore region being studied is covered by three metro area definitions: Ocean County is part of the Edison Metropolitan Division; Cape May County is part of the Ocean Metropolitan Statistical Area (MSA); and Atlantic County comprises the Atlantic City MSA. This allows us to calculate the property value for each township at the proposed operational date of the wind farm—2012.
Several assumptions have been made: each township's property value increase follows the MSA's property value growth rate; there are no changes in property tax rates, and the percentage of property tax rebated to New Jersey residents remains the same as in 2006.
As an example:
Figure 5.1: Avalon Residential Property Values
Residential Parcels 5,053 Value of Residential Home - 2006 $7,967,792,300Average Value of Residential Home - 2006 $1,576,8442006 Average Total Property Taxes $5,0142006 Average Net Property Taxes $4,179
Average Value of Residential Home - 2012 $1,594,7472012 Average Total Property Taxes $5,0712012 Average Net Property Taxes $4,227
Average Value of Ocean Front property - 2012 156% View Premium $4,082,552Average Value of Ocean View property - 2012 46% View Premium $2,328,331Average Value of Ocean Proximity property 2012 10% Premium $1,754,222% Ocean view housing 6% Ocean View Properties 303
Township of Avalon
In Avalon, Cape May County, there are over 5,000 residential parcels with property values reaching $8 billion in 2006. The average value of a residential home is $1.5 million and the average residential property owner paid just over $5,000 in property taxes.
Using Global Insight's property value forecast, prices in the Ocean Metropolitan Statistical Area (Cape May County) are forecast to increase slightly, by about 1.1% from 2006 to 2012. This would increase the average value of a residential property in Avalon to about $1.6 million.
Using an oceanfront premium of 156% makes the value of an Avalon oceanfront residential property worth about $4.1 million. A residential property with an ocean view would be worth $2.3 million, and a property in proximity to the ocean would be worth $1.75 million. Global Insight, based on a visual inspection of Google Earth satellite photos, assumed 3% of the properties in the affected shore towns were oceanfront and that a similar number were ocean view, for a total of 303 affected residential properties in Avalon.
It is the assumption of this paper that a property can only "fall" one category as the result of a wind farm being placed off shore. Said differently, the value of an oceanfront property can drop no lower than the value of an ocean-view property. Similarly, an ocean-view property

An Assessment of Potential Costs and Benefits of Offshore Wind Turbines 62
whose value is affected by the wind farm will drop no lower than a house in proximity to the ocean. Logically, this makes sense as the homeowner will still be in proximity to the ocean with its breezes and the easy walk back even if the homeowner's total view is affected by the wind farm.
With this assumption, Global Insight can now calculate the potential value impact of a proposed wind farm.
Figure 5.2: Avalon Residential Property Values—Wind Farm Impact
Possibly value loss, MAX $352,951,631Possibly value loss, MAX % 4.4%
3 miles Possibly value loss 25.0% $88,237,9086 miles Possibly value loss 12.5% $44,118,95412 miles Possibly value loss 3.2% $11,294,45220 miles Possibly value loss 0.0% $03 miles Property Tax Loss $280,5986 miles Property Tax Loss $140,29912 miles Property Tax Loss $35,91720 miles Property Tax Loss $0
Township of Avalon
In this example, if the premium of an oceanfront house drops to ocean-view housing and the premium of the ocean-view property drops to ocean-proximity premium, the total property value difference to the township of Avalon would be $353 million, compared to a no wind farm scenario. This is considered the maximum value difference as the result of the visual impact of a potential wind farm that could happen.
However, even if the wind farm is built three miles off of Avalon's shores, it would not impact the whole view, nor would it be expected to wipe away the total premium of an oceanfront or ocean-view property.
In the preceding analysis, Global Insight makes the assumption that the premium loss would be in direct relation to the amount of the view lost. For example, an oceanfront property has a view that covers about 180 degrees. If a wind farm was built directly off the shore only three miles away, it would impact about 45 degrees of that view, or about a quarter of its view. The property would lose 25% of the premium due to the wind farm.
Making that assumption would result in a property value difference of $88 million in the township of Avalon. Resulting tax hit due to the lower property values as the result of building a wind farm, assuming rates per $1000 of property value remains constant, would be a difference of about $280,000 to the township.
At six miles, the wind farm would impact about 22.5 degrees of the view, or 12.5% of the view resulting in a property value difference of about $44 million and property tax difference of about $140,000. At the maximum distance considered, 20 miles, the wind farm is beyond the horizon and invisible to viewers on the shore and there will be no impact.
Examining property values in the towns by county shows that the wind-farm-affected towns in Cape May County have the highest total value of residential properties—$29 billion—at

An Assessment of Potential Costs and Benefits of Offshore Wind Turbines 63
risk from a proposed wind farm. Locating the wind farm off the shore of Cape May County would impact 919 properties, under Global Insight's assumptions. This provides the possibility of creating a maximum property value difference, assuming all ocean premiums are lost due to a wind farm, of $976 million, about 3.4% of the total residential property values. This represents the maximum value difference between the two scenarios, assuming the entire value premium of an oceanfront home to an ocean view home is wiped out by a potential wind farm.
Figure 5.3: County Residential Property Values
County Subtotals
Residential Home
Parcels
Total Value of Residential Home
Average Value of Residential
Home
Ocean View Properties
Possibly value loss, MAX
Possibly value loss, MAX
%
Atlantic 33,605 $18,058,317,893 $537,370 734 $568,571,142 3.1%Cape May 30,628 $29,035,045,582 $947,990 919 $976,164,439 3.4%Ocean 19,468 $12,351,217,060 $634,437 584 $589,789,139 4.8%
The entire view will not be affected by a potential wind farm and a wind farm location will have different visual impacts on different houses in a county. The impact of a wind farm off of Avalon will affect an Avalon home differently than a Sea Isle City home, and the residential value difference will not reach the maximum.
Under the assumption that the premium lost would be in direct relation to the amount of the view lost, the residential property value difference in Cape May County would be $244 million with a wind farm located three miles off shore, and $122 million at six miles. There would be no residential property value difference if a proposed wind farm were located 20 miles off shore, as that site is out of view.
These residential property value differences would result in some reduction in the collection of property taxes. At three miles, affected towns in Ocean County would bring in about $1.3 million less in property tax revenue. The revenue difference to affected towns in Atlantic County would be just under $1.6 million, assuming all shore towns are affected equally in the whole county.
The revenue difference in all three counties would decrease to under $800,000 if the proposed wind farm were to be located six miles off shore and to around $200,000 at 12 miles. At 20 miles, there is no residential property or a tax impact.

An Assessment of Potential Costs and Benefits of Offshore Wind Turbines 64
Figure 5.4: County Residential Property Values – Wind Farm Impact
County SubtotalsValue Decline
Compared to No Wind Farm Case
Value Decline Compared to No Wind Farm Case
Value Decline Compared to No Wind Farm Case
Value Decline Compared to No Wind Farm Case
Distance from Shore 3 miles 6 miles 12 miles 20 miles
% of view affected 25.0% 12.5% 3.2% 0.0%
Atlantic $142,142,786 $71,071,393 $18,194,277 $0Cape May $244,041,110 $122,020,555 $31,237,262 $0Ocean $147,447,285 $73,723,642 $18,873,252 $0
County Subtotals Property Tax Difference
Property Tax Difference
Property Tax Difference
Property Tax Difference
Distance from Shore 3 miles 6 miles 12 miles 20 miles
Atlantic $1,573,233 $786,616 $201,374 $0Cape May $1,468,346 $734,173 $187,948 $0Ocean $1,307,101 $653,550 $167,309 $0
Property Values —Benefits
Wind farms can result in higher property values under certain conditions. They can make property more valuable by increasing economic activity through increased traffic/tourism or in support of the wind farm in the area. They can provide electricity/more reliable service to underserved areas.
While certain wind farm regions have shown a higher growth rate in residential property values than surrounding regions in certain studies, Global Insight does not believe that the proposed New Jersey offshore wind farm will positively affect residential property values at the shore.
In those cases where wind farms increased residential property values, the farm was sited in rural/economically depressed areas and the wind farms brought in commercial and other economic activity to the area, thus resulting in higher property values.
The region studied here—the New Jersey shoreline from Toms River to Stone Harbor—would not be considered a rural area, or an economically depressed area with depressed property values in which the addition of a wind farm could result in property value appreciation. As such, this study assumes no residential property value benefit to New Jersey from an offshore wind farm.

An Assessment of Potential Costs and Benefits of Offshore Wind Turbines 65
5.3 Commercial Property Values
5.3.1 Commercial Property Values—Overview
As stated, much of the shoreline in New Jersey is residential in nature. Only in Atlantic County is the value of commercial property on shore towns studied in this report greater than 5%. The resulting benefit or cost to the residential sector of a proposed wind farm will be much greater in value than any cost or benefit to the commercial sector.
Figure 5.5: County Residential vs. Commercial Property Values
Atlantic CountyShore Town Property Value Breakout
33.1%66.9%
Commercial Value Residential Value
Cape May CountyShore Town Property Value Breakout
3.4%
96.6%
Commercial Value Residential Value

An Assessment of Potential Costs and Benefits of Offshore Wind Turbines 66
Ocean CountyShore Town Property Value Breakout
4.7%
95.3%
Commercial Value Residential Value
To fully understand the total costs/benefits of a wind farm, it is still important to consider the impact of a wind farm on commercial properties.
Global Insight, using data from the New Jersey Department of Revenue, examined commercial property values in shore towns and boroughs that might be affected by an offshore wind farm.
Commercial property values can be affected by the location of a proposed wind farm off the coast of New Jersey. It is not expected that the view impact, as in the residential property value side, would impact commercial property values. After all, commercial properties and their rents are valued for their income stream they bring in more than anything else.
The proposed wind farm could have an impact on commercial property values by increasing or decreasing "traffic" or visitors resulting in sales differences in the two cases.
It should be noted that, in the following analysis, the county totals reflect only those towns that might be impacted by an offshore wind farm. As the stated report area stretches from Toms River to Stone Harbor, towns like Cape May, Wildwood, and others have been omitted from the analysis.
Total sales are estimated by taking the sum of shore towns potentially affected by a wind farm commercial property values divided by the total county commercial property values. Atlantic County shore towns have the highest valuation of commercial property values.
Figure 5.6: County Commercial Property Values
County Total Commercial
Value Affected Shore
Commercial Value PercentageAtlantic $8,563,318,200 $6,975,191,800 81%Cape May $3,072,021,000 $779,418,100 25%Ocean $4,593,843,952 $658,058,392 14%
In the tourism section of the report, the spending differences between a potential wind farm and no wind farm scenarios have been examined. To calculate the income differences from this change in visitation, Global Insight has broken out tourism sales to its major components

An Assessment of Potential Costs and Benefits of Offshore Wind Turbines 67
(Accommodations, Retail Trade, Food & Beverages, Entertainment & Recreation, and Transportation) and examined the impact of a proposed wind farm on those categories of sales.
5.3.2 Commercial Property Values—Forgone Sales
In this section, Global Insight examines the potential wind farm forgone sales in two business sectors in each county. This information will be used to estimate the change in the value of commercial properties by discounting the value of the possible change in future sales from commercial properties. Global Insight will be valuing commercial property values using a variation of the income capitalization approach. This approach capitalizes an income stream into a present value and is one of the methods commonly used in commercial property appraisal. In this manner, the tourism sales analysis from section four will be used as a proxy for the property's income stream and will be used to evaluate the wind farm impact on commercial property values. The commercial property value changes will be enumerated in the next section.
It is assumed that the only impact of a wind farm on commercial property values is the sales forgone due to the impact of an offshore wind farm. The following analysis takes first the forgone tourism sales as the result of an offshore wind farm, and then, the increase in tourism sales as the result of a wind farm, and adds them together to show the overall tourism sales impact of a proposed wind farm. All forgone tourism spending reported is assumed to have occurred at commercial establishments at the shore and in the affected towns.
As stated in the tourism section of this report, the decline in visitation as a result of a proposed offshore wind farm could potentially reach around 4% of total visitation (measured by spending). Breaking out the spending component differences, this wind farm impact on tourism sales would result in retailers receiving $171 million less in Atlantic County in 2012. Retail trade sales differences between the two cases would be $60 million in Ocean County and $42 million in Cape May County in 2012, as a result of a smaller potential decline in tourism visitation as the result of a wind farm.
As stated previously, the sales forgone would decrease quickly over time as tourism rebounded from the negative impact of the wind farm and go to zero within seven years.
Figure 5.7: Retail Trade Sales Wind Farm Impact – Three Miles
Wind Farm Sales Impact Wind Farm Located 3 Miles OffshoreRetail Trade Sector (Millions of $)County 2012 2013 2014 2015 2016 2017Atlantic Total Sales $4,795.9 $4,983.3 $5,183.7 $5,404.0 $5,640.5 $5,910.2
Wind Farm Sales Impact ($171.0) ($88.1) ($46.4) ($19.2) ($8.3) ($3.7)% of Sales Lost -3.57% -1.77% -0.90% -0.36% -0.15% -0.06%
Cape May Total Sales $650.0 $675.8 $701.0 $731.8 $763.5 $800.2Wind Farm Sales Impact ($42.2) ($22.8) ($12.6) ($5.6) ($2.6) ($1.2)% of Sales Lost -6.50% -3.38% -1.80% -0.76% -0.34% -0.15%
Ocean Total Sales $1,439.3 $1,502.4 $1,572.0 $1,646.9 $1,724.5 $1,813.6Wind Farm Sales Impact ($60.1) ($32.1) ($17.5) ($7.6) ($3.4) ($1.6)% of Sales Lost -4.18% -2.14% -1.12% -0.46% -0.20% -0.09%

An Assessment of Potential Costs and Benefits of Offshore Wind Turbines 68
Overall, assuming an 8% discount rate, the difference in retail spending over the span of the wind farm is estimated to be valued at $294 million in 2012 dollars in Atlantic County, as a result of tourism spending that no longer occurs. The total net present value of retail spending in shore towns in 2012 in Atlantic County is estimated at $38 billion and the difference is about 0.8% of the total.
In Cape May County, the net present value of retail sales lost as a result of a proposed wind farm is valued at $76 million. With the net present value of all retail sales valued at $5.1 billion, the $47 million difference is 1.5% of the total. Similarly, in Ocean County, the net present value difference would be about 0.9%.
Figure 5.8: Retail Trade Sales Wind Farm Impact – Three Miles, Net Present Value
Wind Farm Sales Impact Wind Farm Located 3 Miles OffshoreRetail Trade Sector (Millions of $)County 2012Atlantic Sales NPV $38,013.6
Sales Loss NPV ($293.9)NPV Percent Loss -0.77%
Cape May Sales NPV $5,152.4Sales Loss NPV ($75.7)NPV Percent Loss -1.47%
Ocean Sales NPV $11,634.2Sales Loss NPV ($106.6)NPV Percent Loss -0.92%
Using 8% Discount Rate
Of course, retail sales are only a part of total visitor spending. Next, the food and beverage sector, mainly restaurants and bars, is examined. Before this is done, the reader is reminded that the analysis done here assumes all sales occur in the shore towns. In many cases, a significant portion of food and beverage sales occur in towns just inland from the shore towns. For example, many of the fast food outlets and grocery stores that serve Avalon and Stone Harbor are located in Middle Township. Similarly, in Ocean County, many of the shore visitors on Long Beach Island do much of their food and beverage sector spending on Route 72 in Stafford Township. It is important to remember this as the analysis moves forward, since any impacts on the shore towns will be exaggerated as a result. Yet, even with these assumptions, when looking at the NPV of lost sales, the impacts are still small in comparison to the shore towns' business sectors.
In 2012, sales difference as the result of a proposed wind farm located three miles off the shore of each New Jersey shore county would result in a $200 million gap in Atlantic County, $50 million in Cape May County, and $70 million in Ocean County. This difference ranges from 20% to 55% of total food and beverages sales.

An Assessment of Potential Costs and Benefits of Offshore Wind Turbines 69
Figure 5.9: Food & Beverage Sales Wind Farm Impact—Three Miles
Wind Farm Sales Impact Wind Farm Located 3 Miles OffshoreFood & Beverage Sector (Millions of $)County 2012 2013 2014 2015 2016 2017Atlantic Total Sales $1,004.6 $1,096.7 $1,192.7 $1,292.3 $1,394.2 $1,503.4
Wind Farm Sales Impact ($201.4) ($103.1) ($54.1) ($22.2) ($9.5) ($4.3)% of Sales Lost -20.05% -9.40% -4.53% -1.72% -0.68% -0.28%
Cape May Total Sales $131.8 $136.8 $141.8 $146.8 $151.3 $156.1Wind Farm Sales Impact ($49.7) ($26.7) ($14.7) ($6.4) ($2.9) ($1.4)% of Sales Lost -37.71% -19.54% -10.36% -4.39% -1.94% -0.89%
Ocean Total Sales $128.1 $133.5 $138.9 $144.3 $149.6 $155.0Wind Farm Sales Impact ($70.8) ($37.6) ($20.4) ($8.8) ($4.0) ($1.9)% of Sales Lost -55.24% -28.16% -14.70% -6.10% -2.65% -1.19%
Calculating the net present value of the potential food and beverage sales difference to each county shows a $344 million spending gap in Atlantic County, a 3.7% difference. Sales changes as the result of a wind farm reach 8.8% and 12.5% in Cape May and Ocean counties.
Figure 5.10: Food & Beverage Sales Wind Farm Impact—Three Miles, Net Present Value
Wind Farm Sales Impact Wind Farm Located 3 Miles OffshoreFood & Beverage Sector (Millions of $)County 2012Atlantic Sales NPV $9,415.0
Sales Loss NPV ($344.4)NPV Percent Loss -3.66%
Cape May Sales NPV $1,013.4Sales Loss NPV ($88.6)NPV Percent Loss -8.75%
Ocean Sales NPV $1,002.6Sales Loss NPV ($124.8)NPV Percent Loss -12.45%
Using 8% Discount Rate
Remembering that many of the food and beverage sales may either happen in grocery stores or outside of affected towns, it may be more appropriate to look at the aggregate totals of these two sectors to get a better handle on the possible commercial sales, and thus commercial property value, differences to the affected shore towns.
In aggregate, the 2012 net present value of retail sales and food and beverages sales in Atlantic County at an 8% discount rate is $47.4 billion. The net present value of the sales lost if a wind farm was located three miles offshore would reach just over $640 million for a percentage sales difference of 1.35.
In Cape May County, the net present value sales impact of a wind farm located three miles offshore would be just over $164 million in the retail trade and food and beverage sectors.
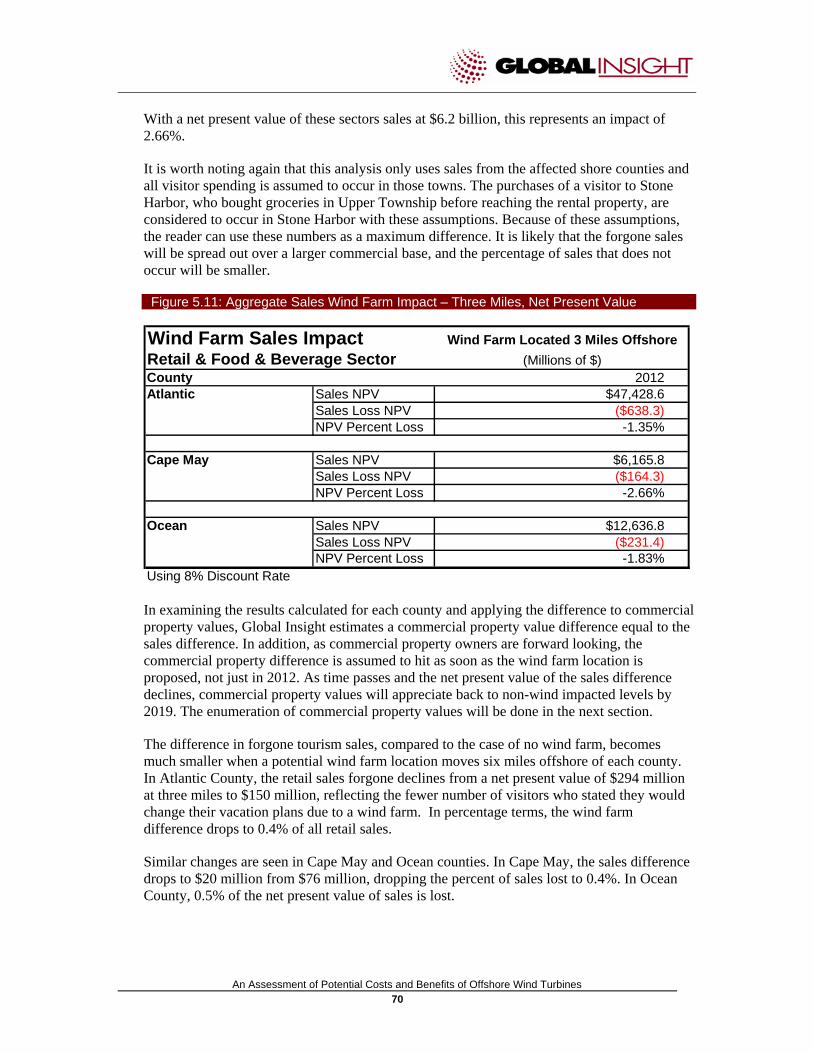
An Assessment of Potential Costs and Benefits of Offshore Wind Turbines 70
With a net present value of these sectors sales at $6.2 billion, this represents an impact of 2.66%.
It is worth noting again that this analysis only uses sales from the affected shore counties and all visitor spending is assumed to occur in those towns. The purchases of a visitor to Stone Harbor, who bought groceries in Upper Township before reaching the rental property, are considered to occur in Stone Harbor with these assumptions. Because of these assumptions, the reader can use these numbers as a maximum difference. It is likely that the forgone sales will be spread out over a larger commercial base, and the percentage of sales that does not occur will be smaller.
Figure 5.11: Aggregate Sales Wind Farm Impact – Three Miles, Net Present Value
Wind Farm Sales Impact Wind Farm Located 3 Miles OffshoreRetail & Food & Beverage Sector (Millions of $)County 2012Atlantic Sales NPV $47,428.6
Sales Loss NPV ($638.3)NPV Percent Loss -1.35%
Cape May Sales NPV $6,165.8Sales Loss NPV ($164.3)NPV Percent Loss -2.66%
Ocean Sales NPV $12,636.8Sales Loss NPV ($231.4)NPV Percent Loss -1.83%
Using 8% Discount Rate
In examining the results calculated for each county and applying the difference to commercial property values, Global Insight estimates a commercial property value difference equal to the sales difference. In addition, as commercial property owners are forward looking, the commercial property difference is assumed to hit as soon as the wind farm location is proposed, not just in 2012. As time passes and the net present value of the sales difference declines, commercial property values will appreciate back to non-wind impacted levels by 2019. The enumeration of commercial property values will be done in the next section.
The difference in forgone tourism sales, compared to the case of no wind farm, becomes much smaller when a potential wind farm location moves six miles offshore of each county. In Atlantic County, the retail sales forgone declines from a net present value of $294 million at three miles to $150 million, reflecting the fewer number of visitors who stated they would change their vacation plans due to a wind farm. In percentage terms, the wind farm difference drops to 0.4% of all retail sales.
Similar changes are seen in Cape May and Ocean counties. In Cape May, the sales difference drops to $20 million from $76 million, dropping the percent of sales lost to 0.4%. In Ocean County, 0.5% of the net present value of sales is lost.

An Assessment of Potential Costs and Benefits of Offshore Wind Turbines 71
Figure 5.12: Retail Sales Wind Farm Impact—Six Miles, Net Present Value
Wind Farm Sales Impact Wind Farm Located 6 Miles OffshoreRetail Trade Sector (Millions of $)County 2012Atlantic Sales NPV $38,013.6
Sales Loss NPV ($150.0)NPV Percent Loss -0.39%
Cape May Sales NPV $5,152.4Sales Loss NPV ($19.8)NPV Percent Loss -0.38%
Ocean Sales NPV $11,634.2Sales Loss NPV ($59.7)NPV Percent Loss -0.51%
Using 8% Discount Rate
Similar results are seen in the lower forgone sales in the food and beverage sector. The net present value percent of sales forgone declines by half in Atlantic County with a wind farm location doubled to six miles. The potential NPV percent of sales drops to a quarter of the three-mile NPV in Cape May County and by about half in Ocean County.
Figure 5.13: Food & Beverage Sales Wind Farm Impact – Six Miles, Net Present Value
Wind Farm Sales Impact Wind Farm Located 6 Miles OffshoreFood & Beverage Sector (Millions of $)County 2012Atlantic Sales NPV $9,415.0
Sales Loss NPV ($175.7)NPV Percent Loss -1.87%
Cape May Sales NPV $1,013.4Sales Loss NPV ($23.2)NPV Percent Loss -2.29%
Ocean Sales NPV $1,002.6Sales Loss NPV ($69.9)NPV Percent Loss -6.98%
Using 8% Discount Rate
Again aggregating the two sectors and examining the impact of an offshore wind farm to the retail trade and food and beverage sales to each county assuming a wind farm location six miles off shore, the potential net present value sales forgone drops to 1% or lower in each county.

An Assessment of Potential Costs and Benefits of Offshore Wind Turbines 72
Figure 5.14: Aggregate Sales Wind Farm Impact—Six Miles, Net Present Value
Wind Farm Sales Impact Wind Farm Located 6 Miles OffshoreRetail & Food & Beverage Sector (Millions of $)County 2012Atlantic Sales NPV $47,428.6
Sales Loss NPV ($325.7)NPV Percent Loss -0.69%
Cape May Sales NPV $6,165.8Sales Loss NPV ($43.0)NPV Percent Loss -0.70%
Ocean Sales NPV $12,636.8Sales Loss NPV ($129.6)NPV Percent Loss -1.03%
Using 8% Discount Rate
Moving a proposed wind farm out to 12 miles offshore reduces the potential sales difference even further. There is no reduction gained by moving a potential wind farm 20 miles off shore. In addition, much of the sales impact mitigation happens between a wind farm location of three miles and six miles offshore.
Figure 5.15: Aggregate Sales Wind Farm Impact—Twelve Miles, Net Present Value
Wind Farm Sales Impact Wind Farm Located 12 Miles OffshoreRetail & Food & Beverage Sector (Millions of $)County 2012Atlantic Sales NPV $47,428.6
Sales Loss NPV ($198.5)NPV Percent Loss -0.42%
Cape May Sales NPV $6,165.8Sales Loss NPV ($43.0)NPV Percent Loss -0.70%
Ocean Sales NPV $12,636.8Sales Loss NPV ($129.6)NPV Percent Loss -1.03%
Using 8% Discount Rate
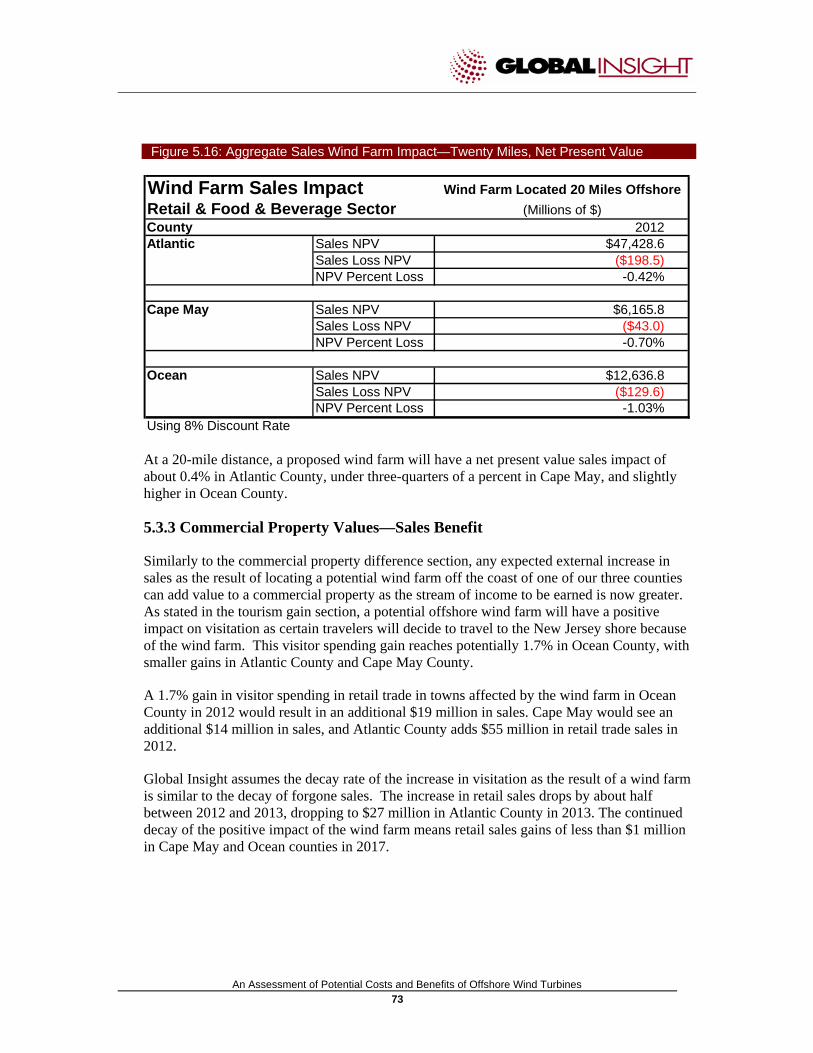
An Assessment of Potential Costs and Benefits of Offshore Wind Turbines 73
Figure 5.16: Aggregate Sales Wind Farm Impact—Twenty Miles, Net Present Value
Wind Farm Sales Impact Wind Farm Located 20 Miles OffshoreRetail & Food & Beverage Sector (Millions of $)County 2012Atlantic Sales NPV $47,428.6
Sales Loss NPV ($198.5)NPV Percent Loss -0.42%
Cape May Sales NPV $6,165.8Sales Loss NPV ($43.0)NPV Percent Loss -0.70%
Ocean Sales NPV $12,636.8Sales Loss NPV ($129.6)NPV Percent Loss -1.03%
Using 8% Discount Rate
At a 20-mile distance, a proposed wind farm will have a net present value sales impact of about 0.4% in Atlantic County, under three-quarters of a percent in Cape May, and slightly higher in Ocean County.
5.3.3 Commercial Property Values—Sales Benefit
Similarly to the commercial property difference section, any expected external increase in sales as the result of locating a potential wind farm off the coast of one of our three counties can add value to a commercial property as the stream of income to be earned is now greater. As stated in the tourism gain section, a potential offshore wind farm will have a positive impact on visitation as certain travelers will decide to travel to the New Jersey shore because of the wind farm. This visitor spending gain reaches potentially 1.7% in Ocean County, with smaller gains in Atlantic County and Cape May County.
A 1.7% gain in visitor spending in retail trade in towns affected by the wind farm in Ocean County in 2012 would result in an additional $19 million in sales. Cape May would see an additional $14 million in sales, and Atlantic County adds $55 million in retail trade sales in 2012.
Global Insight assumes the decay rate of the increase in visitation as the result of a wind farm is similar to the decay of forgone sales. The increase in retail sales drops by about half between 2012 and 2013, dropping to $27 million in Atlantic County in 2013. The continued decay of the positive impact of the wind farm means retail sales gains of less than $1 million in Cape May and Ocean counties in 2017.

An Assessment of Potential Costs and Benefits of Offshore Wind Turbines 74
Figure 5.17: Retail Sales Wind Farm Impact—Benefit
Wind Farm Sales ImpactRetail Trade Sector (Millions of $)County 2012 2013 2014 2015 2016 2017Atlantic Total Sales $4,795.9 $4,983.3 $5,183.7 $5,404.0 $5,640.5 $5,910.2
Wind Farm Sales Impact $54.7 $26.8 $13.5 $6.0 $2.7 $1.3% of Sales Lost 1.14% 0.54% 0.26% 0.11% 0.05% 0.02%
Cape May Total Sales $650.0 $675.8 $701.0 $731.8 $763.5 $800.2Wind Farm Sales Impact $13.5 $7.0 $3.7 $1.8 $0.9 $0.4% of Sales Lost 2.08% 1.04% 0.53% 0.24% 0.11% 0.05%
Ocean Total Sales $1,439.3 $1,502.4 $1,572.0 $1,646.9 $1,724.5 $1,813.6Wind Farm Sales Impact $19.2 $9.8 $5.2 $2.4 $1.1 $0.6% of Sales Lost 1.34% 0.65% 0.33% 0.14% 0.07% 0.03%
Overall, assuming an 8% discount rate, the net present value (NPV) gain of retail spending over the span of the wind farm is estimated to be valued at $92 million in Atlantic County, about a quarter of a percent total retail sales. NPV values in Cape May are 0.46% and Ocean County's positive impact from a potential wind farm reaches 0.3%. Figure 5.18: Retail Sales Wind Farm Impact—Benefit, Net Present Value
Wind Farm Sales ImpactRetail Trade Sector (Millions of $)County 2012Atlantic Sales NPV $38,013.6
Sales Loss NPV $91.9NPV Percent Gain 0.24%
Cape May Sales NPV $5,152.4Sales Loss NPV $23.8NPV Percent Gain 0.46%
Ocean Sales NPV $11,634.2Sales Loss NPV $33.4NPV Percent Gain 0.29%
Using 8% Discount Rate
Skipping ahead to the aggregate number for retail trade and food and beverage sectors, affected towns in Cape May County would see an additional $30 million in sales in 2012. Similarly to the forgone sales, tourism gains are expected to quickly decline over time, with the resulting sector sales gain of $15 million in 2013, dropping to $8 million in 2014, and to zero by 2019.
The additional $30 million in retail and food and beverage sales in Cape May County in 2012 represent a positive sales impact of 3.8%. This drops to below 1.0% in 2014.
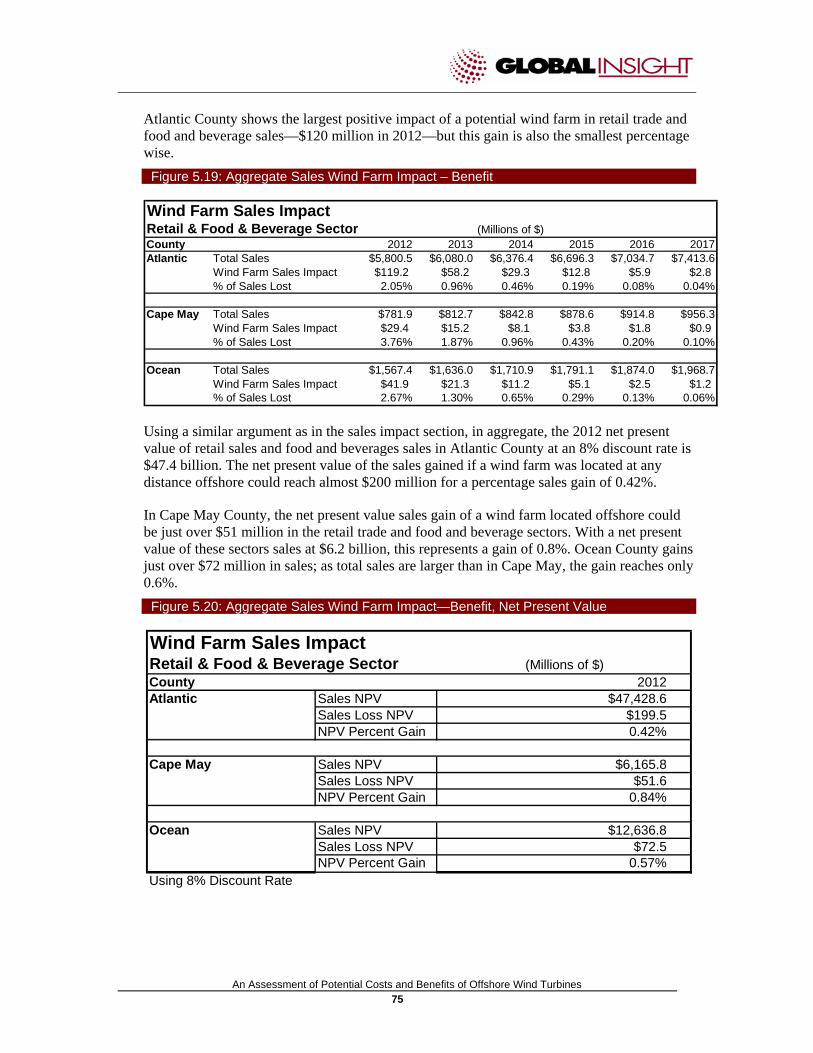
An Assessment of Potential Costs and Benefits of Offshore Wind Turbines 75
Atlantic County shows the largest positive impact of a potential wind farm in retail trade and food and beverage sales—$120 million in 2012—but this gain is also the smallest percentage wise. Figure 5.19: Aggregate Sales Wind Farm Impact – Benefit
Wind Farm Sales ImpactRetail & Food & Beverage Sector (Millions of $)County 2012 2013 2014 2015 2016 2017Atlantic Total Sales $5,800.5 $6,080.0 $6,376.4 $6,696.3 $7,034.7 $7,413.6
Wind Farm Sales Impact $119.2 $58.2 $29.3 $12.8 $5.9 $2.8% of Sales Lost 2.05% 0.96% 0.46% 0.19% 0.08% 0.04%
Cape May Total Sales $781.9 $812.7 $842.8 $878.6 $914.8 $956.3Wind Farm Sales Impact $29.4 $15.2 $8.1 $3.8 $1.8 $0.9% of Sales Lost 3.76% 1.87% 0.96% 0.43% 0.20% 0.10%
Ocean Total Sales $1,567.4 $1,636.0 $1,710.9 $1,791.1 $1,874.0 $1,968.7Wind Farm Sales Impact $41.9 $21.3 $11.2 $5.1 $2.5 $1.2% of Sales Lost 2.67% 1.30% 0.65% 0.29% 0.13% 0.06%
Using a similar argument as in the sales impact section, in aggregate, the 2012 net present value of retail sales and food and beverages sales in Atlantic County at an 8% discount rate is $47.4 billion. The net present value of the sales gained if a wind farm was located at any distance offshore could reach almost $200 million for a percentage sales gain of 0.42%.
In Cape May County, the net present value sales gain of a wind farm located offshore could be just over $51 million in the retail trade and food and beverage sectors. With a net present value of these sectors sales at $6.2 billion, this represents a gain of 0.8%. Ocean County gains just over $72 million in sales; as total sales are larger than in Cape May, the gain reaches only 0.6%. Figure 5.20: Aggregate Sales Wind Farm Impact—Benefit, Net Present Value
Wind Farm Sales ImpactRetail & Food & Beverage Sector (Millions of $)County 2012Atlantic Sales NPV $47,428.6
Sales Loss NPV $199.5NPV Percent Gain 0.42%
Cape May Sales NPV $6,165.8Sales Loss NPV $51.6NPV Percent Gain 0.84%
Ocean Sales NPV $12,636.8Sales Loss NPV $72.5NPV Percent Gain 0.57%
Using 8% Discount Rate

An Assessment of Potential Costs and Benefits of Offshore Wind Turbines 76
5.3.4 Commercial Property Values – Net Sales
Knowing the positive impact on sales of a wind farm and the forgone sales resulting from a wind farm location off of one of our target counties, the overall potential sales impact of a wind farm can be calculated.
Adding together the forgone sales and sales gain as the results of an Atlantic County offshore wind farm three miles out, the potential net impact to Atlantic County is a net present value sales difference of around $440 million; a net change of just under 1% from the non-wind farm case of the net present value of total sales in the retail trade and food and beverage sectors.
Locating the wind farm three miles off the shores of Ocean County could result in a net present value sales difference of -1.26% compared to the no-build case; while the potential Cape May offshore wind farm impact would be -1.83% of sales in the retail trade and food and beverage sector at a three-mile distance. Figure 5.21: Net Aggregate Sales Wind Farm Impact—Three Miles, Net Present Value
Net Wind Farm Sales Impact Wind Farm Located 3 Miles OffshoreRetail & Food & Beverage Sector (Millions of $)County 2012Atlantic Sales NPV $47,428.6
Sales Loss NPV ($438.9)NPV Percent Gain -0.93%
Cape May Sales NPV $6,165.8Sales Loss NPV ($112.7)NPV Percent Gain -1.83%
Ocean Sales NPV $12,636.8Sales Loss NPV ($158.9)NPV Percent Gain -1.26%
Using 8% Discount Rate
Moving to the comparison of a wind farm located six miles offshore compared to a no-build case, the potential difference in tourism sales in these sectors, measured by NPV, drops to $126 million or about a quarter of a percent. Ocean County's difference is under a half of a percent lower than the non-build case; while Cape May County could gain tourism sales in comparison to a no-build case. In Cape May County, tourism sales could be 0.14% higher in the case of building a wind farm six miles off shore in comparison to a case with no wind farm.

An Assessment of Potential Costs and Benefits of Offshore Wind Turbines 77
Figure 5.22: Net Aggregate Sales Wind Farm Impact—Six Miles, Net Present Value
Net Wind Farm Sales Impact Wind Farm Located 6 Miles OffshoreRetail & Food & Beverage Sector (Millions of $)County 2012Atlantic Sales NPV $47,428.6
Sales Loss NPV ($126.2)NPV Percent Gain -0.27%
Cape May Sales NPV $6,165.8Sales Loss NPV $8.6NPV Percent Gain 0.14%
Ocean Sales NPV $12,636.8Sales Loss NPV ($57.1)NPV Percent Gain -0.45%
Using 8% Discount Rate
To show the range of wind farm sales impacts, Global Insight next moves to the analysis of the 20-mile offshore wind farm. This will allow the reader to see the range of commercial property value difference as the result of a wind farm. With a potential wind farm located 20 miles offshore, the sales difference drops significantly from the three-mile case. In Atlantic and Cape May Counties, the sales difference between the no wind farm case and a wind farm 20 miles offshore would be positive towards building a wind farm. In Ocean County, sales difference would drop to about $57 million, a drop of 0.45%. Figure 5.23: Net Aggregate Sales Wind Farm Impact—Twenty Miles, Net Present Value
Net Wind Farm Sales Impact Wind Farm Located 20 Miles OffshoreRetail & Food & Beverage Sector (Millions of $)County 2012Atlantic Sales NPV $47,428.6
Sales Loss NPV $1.0NPV Percent Gain 0.00%
Cape May Sales NPV $6,165.8Sales Loss NPV $8.6NPV Percent Gain 0.14%
Ocean Sales NPV $12,636.8Sales Loss NPV ($57.1)NPV Percent Gain -0.45%
Using 8% Discount Rate
5.3.5 Commercial Property Values—Impacts
With an idea of the potential wind farm sales impact at each distance, the resulting effect on commercial property values can be enumerated. Using Avalon Township as our example again, it can be seen that the total value of commercial properties in Avalon Township is

An Assessment of Potential Costs and Benefits of Offshore Wind Turbines 78
$188 million in 2006. Using the same property value growth rate as in the previous residential piece, commercial property values would increase to $190 million in 2012. Figure 5.24: Commercial Property Value, Avalon
Commercial Parcels 143 Total Commercial Value - 2006 $188,042,800Average Value of Commercial Property - 2006 $1,314,985Total Commercial Value - 2012 $190,177,786
Township of Avalon
The net present value of the wind farm impact on sales in Cape May County at a distance of three miles offshore was -1.83%. This represents the net present value sales impact of $112 million fewer sales in the retail trade and food and beverage sectors.
Making the assumption that this sales difference will directly and wholly impact the value of commercial properties in Avalon Township, the difference in value due to a wind farm three miles offshore versus a no wind farm off the coast would be just under $3.5 million. Note that this assumes all the net forgone sales occur in Avalon and the sales difference in Avalon Township is affected similarly to all of the shore towns in Cape May County. This might be different were a wind farm to be located directly off of Avalon, or if a potential wind farm to be located farther north, off of Ocean City.
With the wind farm location changed to six miles and beyond, the wind farm would have a positive impact on the net present value of sales compared to a no wind farm case. The commercial value in this case would increase by $260,000 in 2012. Figure 5.25: Wind Farm Impact, Commercial Property Value, Avalon
2012Possibly value
loss % of total3 miles -$3,477,676 -1.83%6 miles $264,803 0.14%12 miles $264,803 0.14%20 miles $264,803 0.14%
Township of Avalon
Conducting this analysis for all the affected towns in each county, the commercial property impact of an offshore wind farm to each county can be calculated. Note that this assumes the sales difference occurs in all the towns in a county affected by a wind farm (as stated at the beginning of this section). It should also be noted that each county is impacted individually. It is not expected that a wind farm located off the coast of Harvey Cedars Borough, Ocean County, would affect commercial property values in Margate City, Atlantic County.
As can be seen in the Table 5.26, building a wind farm located three miles off the coast of Cape May County could result in commercial property value differences in the shore towns totaling a maximum of under $15 million as the result of forgone sales. This is 1.83% of the total value of $788 million in 2012. If the wind farm were proposed for six miles offshore, the commercial property value difference of a potential wind farm compared to no wind farm

An Assessment of Potential Costs and Benefits of Offshore Wind Turbines 79
being built in Cape May County, a wind farm could have a positive impact of over $1 million, or 0.14% of the total. This gain in commercial property values would remain a positive $1 million with a potential wind farm built 12 or 20 miles offshore.
Atlantic County has the most commercial property at risk. Commercial property values in 2012 in shore towns are forecast to be almost $7.5 billion. Much of that value is in the casinos in Atlantic City. If a proposed wind farm were to be located three miles off the shore of Atlantic City, it could result in close to a negative $70 million commercial property value difference than in a no wind farm case to beach towns of Atlantic County. This difference quickly drops as the wind farm location moves further off shore. At a six mile distance off shore, the commercial property value difference drops by two-thirds, to negative $20 million. At 12 and 20 miles, the commercial property difference in Atlantic County could reach a gain of about $160,000, not a significant change from the case of no wind farm off Atlantic County's coast. Figure 5.26: Wind Farm Impact, Commercial Property Value, 2012
Location
CountyCommercial
Property ValueValue
Difference %Value
Difference %Value
Difference %Atlantic $7,454,635,141 -$68,980,514 -0.93% -$19,837,973 -0.27% $159,902 0.00%Cape May $788,267,397 -$14,414,610 -1.83% $1,097,581 0.14% $1,097,581 0.14%Ocean $664,845,909 -$8,358,415 -1.26% -$3,005,321 -0.45% -$3,005,321 -0.45%
Commercial Property Value Impact of a Wind FarmCompared to No Wind Farm
3 miles 6 miles 12 & 20 miles
5.4 Property Values Conclusions
There is minimal evidence that wind farms have a large adverse impact on property values, either residential or commercial. It is important not to ignore consumer survey results at the shore that do pose the possibility of a wind farm property value impact.
In examining a proposed wind farm on residential values, Global Insight has found minimal impact on all but oceanfront properties. As one of the major complaints and one of the few impacts that environmental impact statements claim to be moderate to significant, the impact of a wind farm on the oceanfront premium cannot be ignored.
Global Insight estimates the value of the oceanfront premium at risk in Cape May's residential property to have a maximum value difference at $615 million between the two scenarios. Overall, this effect of the wind farm in each county could reach 2–3% of total residential value, compared to the case where no wind farm is built. As the wind farm will not affect the total view, and thus not totally destroy the oceanfront premium, Global Insight estimates residential property value impact of a proposed wind farm three miles off the coast of Cape May to be $153 million, or around 0.5% of total residential value in 2012. This would result in property tax revenue reduction of just under $1 million. Residential property value impacts would be smaller in Atlantic and Ocean Counties.
As a proposed wind farm is located further and further offshore, the residential property value lost as a result of a wind farm declines and is zero for an offshore wind farm 20 miles offshore.

An Assessment of Potential Costs and Benefits of Offshore Wind Turbines 80
Commercial property values are affected by the difference in sales that occur as a result of an offshore wind farm. Global Insight estimates the negative impact of net sales forgone due to a wind farm located three miles offshore to be 1.8% in Cape May County, below 1% in Atlantic County, and around 1.25% in Ocean County. At 20 miles offshore, the net sales difference from the case of no wind farm would be positive in Atlantic and Cape May counties and about 0.45% lower with a wind farm off the coast of Ocean County.
If a proposed wind farm were to be located three miles offshore of Atlantic County, potentially $70 million in commercial property values would be forgone. Locating a wind farm three miles off of Ocean or Cape May counties could result in commercial property value impacts of about $8 and $14 million, respectively.
Locating a wind farm at distances further offshore would reduce the commercial property valuations difference between the offshore wind farm and no wind farm cases. In Atlantic and Cape May, the difference of having a wind farm would be positive on commercial property valuations at 20 miles offshore.
It should be noted that both estimated residential and commercial property value impacts are estimated to be less than 2% of 2012 totals in all affected counties. With this result and evidence from other wind farms, Global Insight views the impact from a proposed offshore wind farm in New Jersey to be negligible.

An Assessment of Potential Costs and Benefits of Offshore Wind Turbines 81
6. Economic Impacts on Commercial and Recreational Fisheries
6.1 Economic Impacts on Commercial and Recreational Fisheries
6.1.1 Literature Review
In this section, Global Insight investigates the economic costs and or benefits of an offshore wind farm in New Jersey on the commercial and recreational fishing industry.
In many sections, Global Insight has been able to enumerate the costs and benefits of a wind farm off the coast of New Jersey. While the overall value of the shore and fisheries has been assessed, at this time, Global Insight does not know the exact location of an offshore wind farm. As such, the ability to enumerate the economic impact of a potential wind farm on fishing, as we have done in tourism and property-values sections, is lessened. What can be done is a general conclusion of what the economic cost and or benefit for fisheries would be for an offshore wind farm.
The construction and operation of an offshore wind farm in New Jersey is not likely to have a large economic impact on the fisheries industries. To date, none of the research on wind farms in the public domain shows a large impact on fisheries.
In a Danish study, one of the most comprehensive scientific analysis on offshore wind farms to date, little to no economic impact on the environment was found from the world's two largest offshore wind projects.43
The Danish report focused on two large offshore wind farms: an 80-turbine Horns Rev project, located nine miles offshore; and the 72-turbine Nysted project, located about six miles offshore.
Among the findings of the Danish report:
• The main environmental effect resulted from the introduction of hard-bottomed structures on a previously sandy seabed. These structures acted like artificial reefs and increased the total number and diversity of certain organisms.
• There was no impact on fish populations.
• After construction, marine mammals returned after avoiding the area due to noisy construction (pile driving) activities.
It should be noted that the Danish government identifies appropriate sites for offshore wind farms. Similar selection criteria for an offshore wind farm in New Jersey should result in similar minimal impacts on fisheries.
43 http://www.ens.dk/graphics/Publikationer/Havvindmoeller/havvindmoellebog_nov_2006_skrm.pdf

An Assessment of Potential Costs and Benefits of Offshore Wind Turbines 82
Other environmental impact statements (EIS’s) that Global Insight has examined have similar results from their analysis.
The Lincs offshore wind farm in England, a 250-MW project consisting of 83 turbines in a location 8 km (3.5 miles) offshore, undertook a number of key surveys as part of its environmental impact statement. As stated in the EIS, "it is not yet known how the development would be phased or the sizes of the turbines that would be used. Therefore, all the EIA assessments have addressed the scenario that would have the GREATEST potential effect on the environment."44 (emphasis added)
Some of the surveys conducted for the Lincs wind farm included: marine traffic surveys, bird surveys, commercial and natural fish surveys, and more. All environmental impacts were described as "minor," "negligible," and "insignificant." Only the visual impact was described as a "moderately adverse impact."45
In addition, the report surveyed public opinion and the opposition in nearby communities was based mostly on visual impacts. Local residents wanted future projects to be built farther offshore and/or out of sight.
In the draft environmental impact statement issued on the Cape Wind project, U.S. Minerals Management Service officials found only "negligible" and "minor" effects across most of the areas they analyzed.46
The only areas relevant here where moderate impacts were possible were impacts on the eggs and larvae of bottom-dwelling fish and turbidity effects on marine mammals during construction.
The view from the water in "close proximity" to the turbines was the only potential major impact cited in the Cape Wind EIS. This impact has been examined in the property values section. Proper location of an offshore wind farm in New Jersey would be able to alleviate most of these impacts.
Along with noting the possible fisheries impacts of a wind farm, it is important to understand what is at risk. As stated in a 2007 report, the total value of New Jersey's natural capital is estimated at about $26 billion per year with a net present value of $856 billion, based on a 3% discount rate in perpetuity. Of these amounts, marine ecosystems (excluding estuaries and tidal bays) provide about $390 million of goods and services per year for coastal waters. It is important to note that these values are for the state waters only—they are only measured out to the three-nautical-mile limit.47
Based on harvest and price data from the National Marine Fisheries Service, the annual harvest of finfish and shellfish by New Jersey's commercial fishing vessels (including estuaries and tidal bays along with coastal waters out to three miles) has an estimated direct economic value in 2004 dollars of about $750 million per year. The present value of those
44 http://www.centrica.com/files/reports/2006cr/files/Lincs_NonTechnical_Summary.pdf 45 IBID 46 http://www.nae.usace.army.mil/projects/ma/ccwf/deis.htm 47 Valuing New Jersey's Natural Capital, http://www.nj.gov/dep/dsr/naturalcap/

An Assessment of Potential Costs and Benefits of Offshore Wind Turbines 83
benefits is estimated at $25 billion, with shellfish representing the majority of economic benefits.
Recreationally, New Jersey's anglers harvest saltwater and freshwater fish with an estimated direct economic value in 2004 dollars of about $207 million per year, with an estimated present value of about $7 billion.
As stated in the introduction to this section, the enumeration of a wind farm economic impact on fisheries is difficult without an actual site. Even with that in mind, there are steps that can be taken to estimate certain economic impacts. This has been done for the commercial and recreational fishing industry, as the fishing industry is an important industry along the New Jersey coast.
This analysis should be considered to be preliminary at this point. Among the findings in the literature search for this area, fisheries in general are in constant flux from tidal forces, storms, catch totals, and more. It will be important to continually monitor the fisheries around the wind farm in order to determine the short- and long-term impacts and what force is creating that effect. While fisheries may change around a potential wind farm, the question also arises: is it the wind farm that is creating that change? It is recommended that studies of the exact site prior to construction be undertaken; updates should be performed throughout the wind farm lifespan.
6.2 Fisheries and Wind Farms
The study of fish behavior and reactions to the change in habitat resulting from introducing wind turbines to an area is still in its infancy. While the factors that might influence what type of change occurs when an offshore wind farm is erected are known, the fisheries' reaction is not as fully documented. Noise and vibration, changes in currents, light reflections, and the introduction of the scour protection are just a few of the changes in habitat that could occur with a wind farm.
In the creation of this section, Global Insight has looked at man-made reef experiences, wind farm studies from offshore turbines in Europe, fisheries knowledge from the State of New Jersey DEP, National Marine Fisheries Service data, and others.
Offshore wind farms can influence fish and the fishing habitat at four different stages of a wind farm's existence: pre-construction, construction, operations, and decommissioning. The main effects in the pre-construction, construction, and decommissioning phases are short-term. While these phases are not expected to have long-term effects on fish, there may be some short-term restrictions on fishing around the wind farm.
Two elements may have long-term effects: the turbine foundations and the substructure.
The offshore structures might attract many species of migrating invertebrates and fish searching for food, shelter, and places to reproduce. In particular, observations in the Gulf of Mexico revealed a strong positive correlation between the number of oil platforms, growing
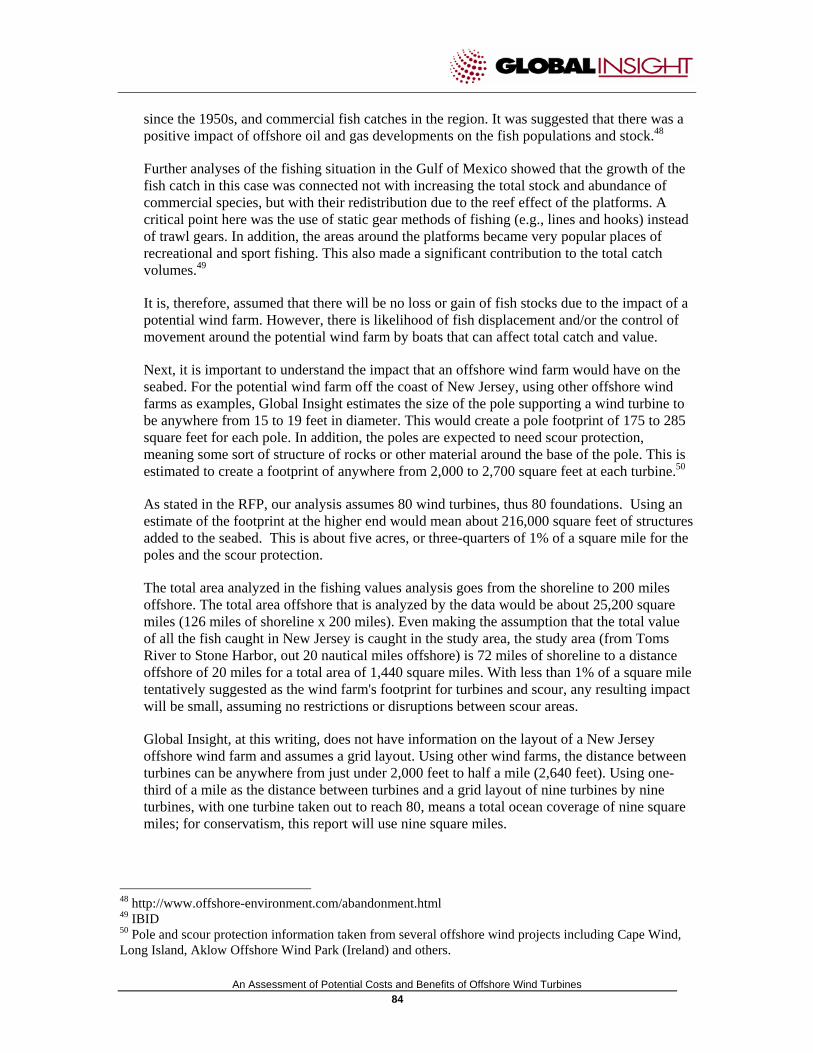
An Assessment of Potential Costs and Benefits of Offshore Wind Turbines 84
since the 1950s, and commercial fish catches in the region. It was suggested that there was a positive impact of offshore oil and gas developments on the fish populations and stock.48
Further analyses of the fishing situation in the Gulf of Mexico showed that the growth of the fish catch in this case was connected not with increasing the total stock and abundance of commercial species, but with their redistribution due to the reef effect of the platforms. A critical point here was the use of static gear methods of fishing (e.g., lines and hooks) instead of trawl gears. In addition, the areas around the platforms became very popular places of recreational and sport fishing. This also made a significant contribution to the total catch volumes.49
It is, therefore, assumed that there will be no loss or gain of fish stocks due to the impact of a potential wind farm. However, there is likelihood of fish displacement and/or the control of movement around the potential wind farm by boats that can affect total catch and value.
Next, it is important to understand the impact that an offshore wind farm would have on the seabed. For the potential wind farm off the coast of New Jersey, using other offshore wind farms as examples, Global Insight estimates the size of the pole supporting a wind turbine to be anywhere from 15 to 19 feet in diameter. This would create a pole footprint of 175 to 285 square feet for each pole. In addition, the poles are expected to need scour protection, meaning some sort of structure of rocks or other material around the base of the pole. This is estimated to create a footprint of anywhere from 2,000 to 2,700 square feet at each turbine.50
As stated in the RFP, our analysis assumes 80 wind turbines, thus 80 foundations. Using an estimate of the footprint at the higher end would mean about 216,000 square feet of structures added to the seabed. This is about five acres, or three-quarters of 1% of a square mile for the poles and the scour protection.
The total area analyzed in the fishing values analysis goes from the shoreline to 200 miles offshore. The total area offshore that is analyzed by the data would be about 25,200 square miles (126 miles of shoreline x 200 miles). Even making the assumption that the total value of all the fish caught in New Jersey is caught in the study area, the study area (from Toms River to Stone Harbor, out 20 nautical miles offshore) is 72 miles of shoreline to a distance offshore of 20 miles for a total area of 1,440 square miles. With less than 1% of a square mile tentatively suggested as the wind farm's footprint for turbines and scour, any resulting impact will be small, assuming no restrictions or disruptions between scour areas.
Global Insight, at this writing, does not have information on the layout of a New Jersey offshore wind farm and assumes a grid layout. Using other wind farms, the distance between turbines can be anywhere from just under 2,000 feet to half a mile (2,640 feet). Using one-third of a mile as the distance between turbines and a grid layout of nine turbines by nine turbines, with one turbine taken out to reach 80, means a total ocean coverage of nine square miles; for conservatism, this report will use nine square miles.
48 http://www.offshore-environment.com/abandonment.html 49 IBID 50 Pole and scour protection information taken from several offshore wind projects including Cape Wind, Long Island, Aklow Offshore Wind Park (Ireland) and others.

An Assessment of Potential Costs and Benefits of Offshore Wind Turbines 85
During operations, Global Insight assumes that it will be possible for recreational users to use the wind site; i.e., boats can sail between the turbines as long as they avoid the turbine foundations and don't anchor on them. Trawlers are expected to lose the ability to fish in the area around the wind farm, but commercial users of static gear methods of fishing are not expected to be affected. It is possible for the grounds around a potential wind farm to remain closed during operations. If the wind farm area is not open to fishing during operations, the impact will be the same as in the construction phase.
Any reduction in catch would last only the length of time that the wind farm site was completely closed for fishing, assumed to be the construction period, and is estimated to last one year.51 The losses can be considered a maximum reduction in catch under the assumptions. It is likely the reduction in catch will be much smaller as boats that would have fished the wind farm grounds will merely shift their fishing grounds. It is likely that there will be some reduction in catch due to wind farm construction as more boats in less area (the whole study area minus the wind farm site) will mean slightly reduced catches per boat.
Post construction, the wind farm site is assumed to be open to commercial fishing boats and only the area around the wind turbine towers will be off-limits to certain types of fishing (trawling) due to the possibility of interaction with the turbine foundation. If the wind farm grounds are not opened after construction, the impact will remain equal to the construction impact.
During operations, Global Insight assumes that there will be no area off-limits to recreational fishermen. It is assumed that recreational fishermen use lines and hooks and that the area around the wind farm will be opened for line and hook fishermen. In addition, it is expected that the wind farms act as artificial reefs and, at the least, increase the number of fish around the turbines. Note that this does not argue that there is an overall increase in the number of fish in and around New Jersey; just that the towers act as areas around which, at least, the same number of fish congregate.
With these assumptions, the turbines become an attractor not only for fish, but for fishermen. As such, it is possible for the overall recreational catch to increase. As stated in the Cape Wind Draft Environmental Impact Statement, "the wide spacing…would not result in the creation of a concentrated area of vertical or hard substrate that may otherwise act as a larger reef."52 In other words, similar to the small size of the wind farm compared to the overall New Jersey offshore region, any positive impact would be negligible.
In the rest of this section, wherever possible, Global Insight will analyze a wind farm's potential economic impact on commercial fishing and recreational fishing separately, along with separately analyzing the wind farm impact in the temporary phases and operations phase.
The valuations of commercial and recreational fisheries will be based on the average value per acre, using the detail available at this time53. Three valuations, using different datasets, will be calculated. The first will use follow the valuation methodology used in the Valuing
51 One year of construction based on Cape Wind estimates. Cape Wind is estimated to take 18 months and has over one-and-a-half times the number of towers to erect. 52 Cape Wind Draft Environmental Impact Statement, page I-8. 53 This methodology was chosen to follow the NJ report on Valuing New Jersey's Natural Captial

An Assessment of Potential Costs and Benefits of Offshore Wind Turbines 86
New Jersey's Natural Capital report, using updated information. The second will use landings detail by distance from shore. This available detail will allow valuations to be done for state waters (offshore to three miles) and federal waters (three to 200 miles offshore) using the species and catch value data available from the National Marine Fisheries Service (NMFS). Finally, the valuation of catch landings by NMFS statistical area will be calculated. Global Insight will use the scenario that would give the largest negative impact in the final analysis of potential landings losses.
6.2.1 Natural Capital Valuation Method:
Valuing New Jersey's Natural Capital was released in early 2007 and uses 2004 data from the National Marine Fisheries Service, among other sources. As stated in that report, in 2004, vessels based in New Jersey landed over 187 million pounds of fish (including shellfish) valued at over $145 million. Updated numbers show that, in 2006, total catch dropped almost 20% to 153 million pounds. However, increasing prices kept the value at $136 million.54
Figure 6.1: Commercial Fisheries Catch
Year Species Metric Tons Pounds $
2002 ALL SPECIES COMBINED 73,545.60 162,138,648 112,708,1802003 ALL SPECIES COMBINED 77,172.00 170,133,407 120,671,7022004 ALL SPECIES COMBINED 85,190.00 187,809,916 145,858,4742005 ALL SPECIES COMBINED 71,204.30 156,976,948 159,007,1612006 ALL SPECIES COMBINED 69,301.70 152,782,618 136,052,949
The state's commercial fishing industry depends heavily on a few species, especially the top shellfish species. Some of the key fish species landed in New Jersey include Summer Flounder, Atlantic Mackerel, Black Sea Bass, Sea Scallops, and Atlantic Surf Clams. Their catch and value for a couple selected species for the five-year period ending in 2006 follows. Figure 6.2: Commercial Fisheries Catch by Species
Year Species Metric Tons Pounds $
2002 FLOUNDER, SUMMER 1,091.80 2,406,904 3,504,2962003 FLOUNDER, SUMMER 1,081.90 2,385,157 3,682,6612004 FLOUNDER, SUMMER 1,283.90 2,830,565 4,430,7042005 FLOUNDER, SUMMER 1,147.30 2,529,240 4,641,6522006 FLOUNDER, SUMMER 1,079.50 2,379,801 4,926,406
Year Species Metric Tons Pounds $
2002 MACKEREL, ATLANTIC 9,292.60 20,486,409 1,779,5962003 MACKEREL, ATLANTIC 14,994.30 33,056,432 2,855,3922004 MACKEREL, ATLANTIC 16,370.70 36,090,862 3,398,1952005 MACKEREL, ATLANTIC 14,703.40 32,415,006 4,028,3432006 MACKEREL, ATLANTIC 11,329.30 24,976,551 3,716,627
54 http://www.st.nmfs.noaa.gov/st1/commercial/landings/annual_landings.html

An Assessment of Potential Costs and Benefits of Offshore Wind Turbines 87
Year Species Metric Tons Pounds $
2002 GOOSEFISH 2,584.00 5,696,587 5,895,5572003 GOOSEFISH 3,259.00 7,184,847 6,199,5142004 GOOSEFISH 1,918.70 4,229,913 3,496,1702005 GOOSEFISH 1,779.00 3,922,008 4,429,2842006 GOOSEFISH 1,742.40 3,841,326 4,415,593
Year Species Metric Tons Pounds $
2002 CLAM, ATLANTIC SURF 24,308.60 53,590,740 29,172,3732003 CLAM, ATLANTIC SURF 23,286.30 51,336,955 27,431,6452004 CLAM, ATLANTIC SURF 19,741.30 43,521,704 22,284,3352005 CLAM, ATLANTIC SURF 17,675.80 38,967,993 20,028,6622006 CLAM, ATLANTIC SURF 19,796.70 43,643,726 25,107,029
The report, Valuing New Jersey's Natural Capital, gives the annual value of the fish harvest from an acre on the coastal shelf as $1,126. This is the report's value based on an examination of published NMFS data, and it reflects both the commercial catch of $994/acre/year and the recreational catch of $132/acre/year. As there is no clear trend in the revenue brought in from commercial fishing, Global Insight will assume the value per acre is constant over time.
In the construction phase, with nine square miles assumed to be unavailable, the one-time reduction in value as the result of a potential wind farm would be about $5.7 million (9 sq mi x 640 ac/sq mi x $994/ac), assuming a one-year construction period. During the operational stage, assuming that only the wind farm's structures (turbines and scours) represent a loss of acreage available for fishing, the 4.5 acres of lost fishing area would result in a value difference from a no wind farm case of about $4,500 annually (4.5 ac x $994/ac). The present value of this reduction at 3%/year in perpetuity is about $150,000. Taking the construction and operations catch reductions together gives a total present value of about $5.85 million.
Recreational Fishing The following table shows the 2004 recreational harvest of saltwater fish for New Jersey and the value of that harvest as estimated by NMFS. According to NMFS, the 2004 harvest had an aggregate weight of 13.7 million pounds and an estimated landing value of $20.5 million. The many uncertainties make it difficult to project future landings with any confidence, but in the absence of a better methodology and better data, the 2004 value will be taken as a recurring market value for this sub-sector.

An Assessment of Potential Costs and Benefits of Offshore Wind Turbines 88
Figure 6.3: Recreational Saltwater Harvest
2004 New Jersey Recreational Saltwater Harvest AFS Species Name Pounds Dollars Striped Bass* 4,634,160 $ 12,234,182Flounder, Summer 3,413,126 5,358,608Bluefish 2,714,608 1,004,405All others 2,953,110 1,883,245Total 13,715,004 $ 20,480,440 Source: NMFS website accessed 8/15/06 (www.st.nmfs.gov)
Based on the analysis described in detail in Part III of Valuing New Jersey's Natural Capital, the total economic value per acre for recreational fishing is estimated to be as follows:
Figure 6.4: Natural Capital Value of Recreational Saltwater Harvest
Natural Capital Value of Recreational Saltwater Fish Harvest (2004 $) Market value/year $MM $20.5Estimated consumer surplus/year $MM $104.6Total Economic Value/year $MM $125.1Natural capital (acreage to 3-nautical-mile limit) 946,055Total Economic Value/acre/year $ $132
Based on this information, in the construction phase, with nine square miles assumed to be unavailable, the one-time reduction in value as the result of a potential wind farm would be about $760,000 (9 sq mi x 640 ac/sq mi x $132/ac), assuming a one-year construction period. During the operational stage, assuming that only the wind farm's structures (turbines and scours) represent a loss of acreage available for fishing, the 4.5 acres of lost fishing area would result in a value difference from a no wind farm case of about $600 annually (4.5 ac x $132/ac). The present value of this reduction at 3% per year in perpetuity is about $20,000. Taking the two reductions together gives a total present value of about $780,000.
6.2.3 Valuation by NMFS Statistical Area:
Global Insight realizes there are limitations in valuing commercial and recreational fisheries based on any one set of estimates. To add credence to those estimates, the value per acre is examined under an alternative method. This method examines the value per acre using catch valuations in the applicable National Marine Fisheries Services Statistical Areas55.
The benefit of this approach is a slightly finer geographic analysis, rather than one large sector all the way out to 200 miles. The NMFS statistical areas closer to shore, while large, are defined well enough to allow a more detailed valuation of the potential wind farm fisheries impact.
55 For NMFS Statistical Areas, please see Appendix

An Assessment of Potential Costs and Benefits of Offshore Wind Turbines 89
The valuation of the fisheries catch is done for three NMFS statistical areas, Areas 614, 615 and 621. There is a large percentage of total catch which is not allocated by NMFS to statistical area. The total amount of this unallocated catch will be parceled out among the three statistical areas in order to create a worst case scenario for the economic impact of a potential wind farm to the fisheries industry. The more likely case is that the unallocated landings belong to many other statistical areas as well.
Figure 6.5: New Jersey Landings by Statistical Area
Area Fished Code OFM & OFR Allocated Pounds** Value $ Pounds Value $ Value $
612 2,391,870 3,951 11,643613 1,058,626 111,974 358,230614 1,045,154 100,799 281,817 23,852,018615 724,726 2,558 4,577 16,539,367616 3,514,038 83,824 123,066621 3,400,352 5,365 10,268 77,601,266622 769,678 1,435 2,524623 9,600 0 0
OFM 117,274,671 0 0OFR 717,979 0 0Total 130,906,696 309,905 792,124
2007 New Jersey Landings by Statistical Area*
** No pounds listed for shellfish because a variety of weight units provided in data set (i.e. pounds, bushels etc.) * Landings only include Sea Scallop, Surf Clam, Monkfish, Summer Flounder
Shellfish Finfish
The unallocated catch is captured by the area fished codes OFM and OFR. As stated, the entire value of that catch, around $118 million, is allocated to only the three areas in which a potential wind farm might be placed allowing the analysis to be considered a worst case scenario. The allocation is weighted by the value of catch reported in each statistical area divided by the total of the three studied areas.
Allocating the value of the unallocated catch to the three study area, the value of catch per mile in Area 614 could reach $16,800 per square mile. The value of catch per mile could reach a similar number in Area 621, about $16,500 per square mile, or about $26 per acre. The lower value of catch in Area 615 means the value per square mile in that area is $4,700.
Using information provided by NMFS, statistical area 614 covers 1,499 square miles. With a wind farm covering nine square miles, 0.6% of the statistical area would be covered by a potential wind farm. The total value of the reduction in landings, assuming a uniform distribution of fish across the statistical area, in NMFS statistical area 614 could reach $151,000. Statistical area 621 could potentially have a total catch value of $81 million. A nine square mile wind farm would cover less than 0.2% of the 4908 square miles in this statistical area resulting in a potential loss of fish landings of just under $150,000, were the wind farm to be placed in this statistical area. A potential wind farm of nine miles in statistical area 615 would result in landings reduction of $42,000 during the period where the whole wind farm location is shut off to commercial fishing boats.

An Assessment of Potential Costs and Benefits of Offshore Wind Turbines 90
During operations, the value would be 4.5 acres x $19/acre = $86/year, with a present value at 3% in perpetuity of $3,000. The total present value impact in area 614 could reach $151,000 + $3,000 = $154,000.
This analysis was derived using 2007 landings data from four most important (by dollar value) commercial species, and it does not account for recreational landings and value. This analysis is difficult to apply to recreational fisheries because the necessary harvest data is not available on this spatial scale.
6.2.4 Distance Valuation Method:
6.2.4.a Commercial Fisheries
The third method of valuing the fishing industry that Global Insight examines uses catch by distance data. NMFS data breaks out the commercial catch by species and distance from shore (Figure 6.6). In the state territorial seas (0-3 nautical miles from shore), fifty million pounds of fish and shellfish were caught in 2006, split evenly between fish and shellfish. The total value of that catch was just under $30 million. Further out to sea, from three miles offshore to 200 miles offshore, 125 million pounds, valued at $117 million, were landed in New Jersey. The differences in the total weight and value of the catch (as stated in Fig. 6.1 and in Fig. 6.3) may be due to the areas covered and/or the prices of each species. As a reminder both data sets represent NMFS data.
In valuing the possible effect on the commercial catch of a potential wind farm at the four distances offshore, it is important to understand the spatial distributions in each species. The reader is reminded that the distances studied are three, six, twelve, and twenty miles offshore. The catch numbers from zero to three miles offshore are used as a proxy for a potential wind farm located three miles offshore. For a potential wind farm farther from shore, the catch numbers from three to 200 miles are used, although this may overstate the potential impact.
Fishermen for some species, e.g., menhaden, will be concerned much more about a potential offshore wind farm three miles off shore than boats that go after mackerel, herring, and scallops. Those workers and boat owners will be more concerned with wind farms located farther offshore, possibly in their fishing grounds. On the other hand, blue crab and oystermen will likely not care about wind farms in state waters, at least in the context of losing fishing access, because they fish primarily in back bay fisheries in the Delaware Bay and not out off the Atlantic Coast. Without further information on a potential wind farm location and the location of fisheries by species, any analysis should be considered quite preliminary.

An Assessment of Potential Costs and Benefits of Offshore Wind Turbines 91
Figure 6.6: Commercial Fisheries Landings by Distance
National Marine Fisheries ServiceFisheries Statistics and Economics Division
Landings by Distance from U.S. Shores, 2006, State of New Jersey
Pounds Dollars Pounds Dollars Pounds Dollars Price/(000)s (000)s (000)s (000)s (000)s (000)s Pound
Mackerel-A. 0 0 24,976 9,317 24,977 9,318 $0.37 Fl-Summer, Flk 238 510 2,142 4,581 2,380 5,091 $2.14 Goosefish/Anglerfish 41 49 3,800 4,453 3,842 4,501 $1.17 Herring-Sea-A. - - 25,486 3,296 25,486 3,296 $0.13 Menhaden 24,071 1,616 14 1 24,085 1,617 $0.07 Sea Bass-Bk.-A. 5 14 489 1,314 494 1,327 $2.68 Scup Or Porgy 18 16 1,375 1,266 1,393 1,282 $0.92 Tilefish - - 538 1,119 538 1,119 $2.08 Croaker 53 25 1,564 748 1,617 774 $0.48 Swordfish - - 299 771 299 771 $2.58 Fl-Winter, B Bk 302 586 76 146 378 732 $1.94 Tuna-Yellowfin - - 362 718 362 718 $1.98 Tuna-Bigeye - - 176 680 176 680 $3.86 Fish-Marine-O. 232 437 56 69 288 506 $1.76 -- Subtotals -- 25,913 3,734 63,376 29,449 89,289 33,183Scallop(Mts)Sea - - 8,443 58,538 8,443 58,538 $6.93Clam-(Meat)Surf 10,096 5,231 33,548 19,876 43,644 25,107 $.58Clam-(Meat)Hard 1,844 7,615 - - 1,844 7,615 $4.13Crab-Blue-Hard 5,770 5,974 - - 5,770 5,974 $1.04Clam-(Meat)O.Q. 5,438 2,738 6,204 3,192 11,643 5,931 $.51Lobster-Amer. 142 753 329 1,769 471 2,522 $5.36Oyster-Meats-A. 343 2,255 - - 343 2,255 $6.57Shellfish-Other 1 3 10,671 1,891 10,672 1,894 $.18Squid-At,Loligo 64 37 3,137 1,810 3,201 1,847 $.58Conch(Snail)-Mt 200 579 - - 200 579 $2.90-- Subtotals -- 24,120 25,574 62,350 87,092 86,470 112,666-- Grand Totals -- 50,033 29,308 125,727 116,541 175,760 145,849Confidential landings are aggregated and reported as "other".All Species with total Dollar Value under $500,000 have been deleted from Table
Report printed on: 28-APR-08
TOTAL
Species
Distance from U. S. Shores0 - 3 Miles 3 - 200 Miles
While more spatial detail on fisheries and the catch of fish would be beneficial in the calculation of any wind farm impact, the data do bolster the point that New Jersey fisheries are spread out over quite a distance. In fact, if one considers the area out to the end of the federal exclusive economic zone, at 200 miles offshore, the total area offshore that is analyzed would be about three times the size of New Jersey.
According to the report Valuing New Jersey's Natural Capital, there are 299,835 acres or about 470 square miles in the state territorial waters. Using this acreage and the catch value reported in Fig. 6.3, the value of the commercial catch in the state territorial waters in 2006 was about $98 per acre ($29.3 million / 300,000 acres). Beyond the three mile distance, the

An Assessment of Potential Costs and Benefits of Offshore Wind Turbines 92
value of the commercial catch per acre in 2006 was about $7 per year ($116.5 million x 640 / [25,200 sq mi – 470 sq mi] ).
6.2.4.b Recreational Fisheries
Salt water recreational fishing brought in a catch value of just over $20 million in 2004, according to the Valuing New Jersey's Natural Capital report.
Like the commercial fishing data, the National Marine Fisheries Service catch totals for recreational fisheries are broken out for state waters (0 to 3 miles offshore) and for the Federal Economic Zone (from 3 miles out to 200 miles offshore). This data includes only the catch by weight, not by price. Examining the total catch data shows that about a quarter of the total recreational catch (by weight) is from the federal economic zone meaning three quarters of the recreational catch is from three miles offshore or closer.56
Examining some of the key species caught by recreational fishermen and women (ranked by weight) continues to show that the majority of recreational fishing is done close to shore. Over 95% of the recreational striped bass catch (by weight) is within state waters—6.3 million pounds of the 6.6 million pound catch in 2006 was caught within 3 miles of the shore.57 The Bluefish and Summer Flounder catch ratio within three miles of the coast is 73% of the total weight caught.
Global Insight will value the wind farm impact of recreational fisheries three miles offshore using information from the state territorial waters (0-3 miles offshore). While there is information on the spatial distribution of the recreational fishing areas beyond three miles58, the similarities in the ratio of catch within three miles of the coast to total catch among the species with the highest total catch allows the assumption that the wind farm impact beyond the three mile distance will be valued at one-third the value of the state territorial sea (based on weight of catch).
Using the fishing values from the recreational and commercial fisheries sections, under the assumption that during construction, no boats may enter the wind farm grounds and that this results in a proportional decline in fish catch similar to the loss of fishing grounds, a wind farm three miles offshore would result in a commercial catch value $700,000 lower than a non wind farm scenario. This is the $29.3 million catch divided by the 378 square miles of state waters (126 miles of shoreline * 3 miles offshore) multiplied by nine square miles of state waters closed during construction. For wind farms located farther off shore, the nine square miles of blocked off fishing areas would result in a lower catch value of $42,250 ($116.5 million x 9 / [25,200 sq mi - 378 sq mi ] ).
As mentioned, the total area of the foundation is expected to cover about 4.5 acres. During the operating phase, with commercial catch per acre valued at $98 per acre at three miles and $7/acre beyond three miles, the reduction in catch value would be $441 were a wind farm to be located three miles offshore. At the six-, twelve-, and twenty-mile distances, a wind farm could potentially reduce the commercial catch value by $27 compared to a no wind farm scenario.
56 http://www.st.nmfs.noaa.gov/st1/recreational/queries/catch/snapshot.html 57 IBID 58 http://www.nj.gov/dep/cmp/fishing_areas_map.pdf

An Assessment of Potential Costs and Benefits of Offshore Wind Turbines 93
The present value (PV) of a potential wind farm three miles offshore would register $15,000 less value than the no wind farm case. At the six-, twelve-, and twenty-mile distances, the difference in value from the no wind farm case would be $1,000.
Looking at the reduction in catch and its value to the recreational fishing industry under similar assumptions, the construction impact of a wind farm three miles offshore (nine square miles of closed fishing grounds) is $750,000. This is 15 million pounds of fish caught within state waters with an average value per pound of $2.05 creating a species weighted value of $31.5 million. Dividing by the square miles within state waters (126 miles of coast with state waters going out three miles) puts the recreational catch value of about $83,000 per square mile. With nine square miles assumed closed for the duration of construction and the assumption that the one-time reduction in catch is equal to the fishing grounds lost, that results in the $750,000 catch reduction.
Were a proposed wind farm located at six, twelve or twenty miles off the coast, the value of each square mile beyond the three mile limit is just over $410. The $410 per square mile is almost 5.4 million pounds of fish caught with an average value of $1,91 for a total catch value of just over $10.2 million in the federal zone. Nine miles of closed fishing grounds would cause a maximum reduced value of recreational fish catch of $3,700 during the one year of construction. As in the commercial case, the $750,000 at three miles and the $3,700 beyond three miles can be considered the maximum catch reduction to the recreational fisheries industry if a wind farm was to be located three miles offshore. With only nine square miles closed to boats, there are plenty of other fishing grounds still available to fish and it is expected most boats and fishermen would simply move to other grounds, reducing the overall catch reduction.
6.3 Conclusions on Fisheries
Many of the economic impacts on fisheries of a proposed offshore wind farm will be site-specific, and Global Insight, at the time of this report, does not have any specific sites to analyze. Based on studies from other offshore wind farm and information thus far, the construction and operations of an offshore wind farm in New Jersey does not seem likely to have a large economic impact on fisheries.
Global Insight examined three different methodologies to value the New Jersey fish landings, with present value results as follows (including both construction and operations):

An Assessment of Potential Costs and Benefits of Offshore Wind Turbines 94
Figure 6.7: Fisheries Summary Chart
Construction Operations Operations Total
Method Sector Present value Annual Present value Present valueNatural capital Commercial 5,700,000 4,500 150,000 5,850,000Natural capital Recreational 760,000 600 20,000 780,000
Total 6,460,000 5,100 170,000 6,630,000
Statistical areas Commercial 151,000 86 3,000 154,000Statistical areas Recreational n/a n/a n/a n/a
Total 151,000 86 3,000 154,000
Distance (3 mi.) Commercial 700,000 441 15,000 715,000Distance (3 mi.) Recreational 750,000 586 20,000 770,000
Total (3 mi.) 1,450,000 1,027 35,000 1,485,000
Of the three, Global Insight suggests the use of the methodology that shows the worst case potential economic impact of an offshore wind farm in any overall analysis of a potential wind farm. Even using assumptions that maximize the potential wind farm fisheries impact, present value differences in catch valuations were about $6.6 million in the worst case.
The major effect of an offshore wind farm on commercial and recreational fisheries would be during the construction phase. During that phase recreational and commercial fish catch value could differ from the non wind farm case by $0.1 to $6.5 million. However, once a wind farm is established, the difference is expected to drop to a minimal level at three miles for the commercial fisheries industry. Locating a wind farm six, twelve or twenty miles offshore, the difference in catch value to a no wind farm case would be negligible.
Recreational fishing could possibly see a gain in catch once a wind farm is established. The difference in any change of catch between a potential wind farm and the no wind farm case is minimal at this level of analysis, with the analysis done at three miles. Were a wind farm to be located further out to sea, any difference would be even smaller.

An Assessment of Potential Costs and Benefits of Offshore Wind Turbines 95
7. Incremental Impacts on NJ Brand Image: Destination and Business Location
7.1 Incremental Impacts on NJ Brand Image: Destination and Business Location
"The Garden State is Green"
New Jersey's image as a destination and as a place to live and work is a critical asset to be carefully managed. In the visitor's mind, the decision to visit the shore region in particular is an intersection of many factors. Aesthetic factors are reconciled with more traditional drivers, such as cost and convenience. As critical as image is to the visitation selection, concern with the impact of the offshore wind farm is warranted.
Likewise, the decision to start or relocate a business in the NJ Shore region is also impacted by image. Business and employees are, holding all else equal, impacted by the image of a jurisdiction.
The question as to whether the existence of an 80-turbine wind farm will enhance or detract from NJ's overall destination and economic development image is a complicated one—at least as complicated as the business location or visitation choice. Global Insight will collect and evaluate other studies of wind turbine impact, as well as any analogous brand/image research. We will also mine the results of last summer's visitor and resident attitudinal survey for directional image inference.
Our mutual goal is to determine the likely directional and incremental impact of New Jersey's existing destination and business location image.
Before we get started, it is helpful to examine New Jersey's image as it stands currently, before an offshore wind farm is proposed and/or built.
New Jersey visitors rate the state higher than the competition on a number of characteristics, including destination quality, relaxing place to visit, and a first class place to visit. However, travelers that have not been to New Jersey in the last 12 months, do rate the state as highly.59
New Jersey's beaches and gaming have much better image ratings than their competition and are reasons that travelers go to New Jersey. New Jersey visitors rate New Jersey as a great overall destination that is popular and has quality restaurants, gaming, and water sports.
59 New Jersey Image Study: http://www.state.nj.us/travel/pdf/2005-nj_tourism_image_study.pdf

An Assessment of Potential Costs and Benefits of Offshore Wind Turbines 96
Figure 7.1: New Jersey Tourism Image
While visitors rate New Jersey highly in certain areas, New Jersey as a destination falls short in meeting the expectations that travelers seek on a leisure vacation.

An Assessment of Potential Costs and Benefits of Offshore Wind Turbines 97
Figure 7.2: New Jersey Tourism Image
New Jersey visitors are generally couples and older than their competitive set; these travelers also have no children. One-third of New Jersey's overnight leisure travel is for Getaway Weekends (trips of two nights) and general vacations, as opposed to visiting friends and relatives.
New Jersey visitors arrive by car (90%) and come from short distance (under 200 miles). The largest proportion of spending for New Jersey visitors is on entertainment, with many New Jersey visitors engaging in gaming, dining, and entertainment night life and beach activities.
An Assessment of Potential Costs and Benefits of Offshore Wind Turbines 98
As expected with beach activities being an activity that visitors participate in, the largest proportion of visitors arrive in the third quarter, especially in July and August. New Jersey visitors are also 20% more likely to stay in hotels or motels than the average U.S. destination.
Global Insight looked at "image" in a couple of different manners. The first is to quantify how much consumers would pay for a "green" experience, be it a vacation or relocation to New Jersey. Using the baseline of no wind farm, and thus no value-added to a vacation or relocation, there is a possible benefit to New Jersey in getting people to pay for a New Jersey green experiences.
Secondly, Global Insight has looked at the value of a green brand. As companies spend millions of dollars trying to show their green values, both positive and negative impacts can result.
Green Premium
One way that a proposed wind farm can create a benefit to New Jersey tourism receipts is for New Jersey and the shore business to emphasize a green visitor vacation. This might mean not only paying for and using the energy created by the wind farm, but to market this fact.
Traveling "green" can be thought of as traveling responsibly, while conserving the environment and sustaining the well being of the local populace. A green tourist will enable other people to visit the same region later and still enjoy the same experience.
There is plenty of evidence showing the importance of eco-friendly travel. Results from a recent TripAdvisor study on ecotourism stated that 38% of respondents said that environmentally-friendly tourism is a consideration when traveling. According to a study from Orbitz, 67% of Americans stressed the importance of eco-friendly travel..60
It isn't just that environmentally friendly tourism is a consideration. Visitors will also pay for the environmentally friendly experience. In the Orbitz survey, 53% stated they would pay a little more to rent a hybrid vehicle or stay at a "green" hotel. 61
"Thirty-four percent of travelers surveyed would pay more to stay at an environmentally-friendly hotel. Twenty-five percent would be willing to pay a 5-10 percent premium, and 12% would pay a 10-20% premium."62
While people will pay more for environmentally friendly vacations, overall, their green behavior tends to take a vacation when they do. A study commissioned by Element Hotels, an extended-stay hotel chain from Starwood Hotels & Resorts Worldwide, Inc., found that nearly 60% of frequent travelers admit to letting their "green routines" slip when they travel.
As to how much of this green vacation premium New Jersey and the shore can accrue, that question cannot be answered at this time. It is up to the state of New Jersey, the towns along the shore, and other regulatory entities and the business to make this happen. It will entail
60 http://www.travelindustrywire.com/article27074-
U_S__Tourism_Industry_Not_Environmentally_Friendly__According_to_____of_Travelers.html 61 ibid 62 http://www.tripadvisor.com/PressCenter-i134-c1-Press_Releases.html

An Assessment of Potential Costs and Benefits of Offshore Wind Turbines 99
support and use of the wind farm generational capabilities along with other environmentally friendly actions and need marketing focus to equate this usage into value for the businesses. It will entail making it easy for the consumer to be "green" while on vacation, including recycling programs, transportation alternatives, educational programs, and more.
Green tourism actions that might help the New Jersey shore increase spending by increasing the average spent could be the offering of local supplies and services, cutting down on transportation costs of goods, conservation of resources, and retention of local features. Green accommodations, which could provide recycling and composting, chemical-free laundry, and energy-efficient room could increase the average spend per visitor.
The goal of green tourism would be more of a quality experience, rather than pure quantity: permanence and richness of the New Jersey experience should be promoted.
Brand
Before Global Insight can be able to assess the impact of a proposed wind farm on New Jersey's brand image, it is important to understand what constitutes a brand. One particular market research organization defines brand as such:
"A product or service to which human beings attach a bundle of tangible (functional product and service characteristics) and intangible (emotional and/or symbolic) meanings that add value. A brand has one strategic purpose and that is to differentiate itself from competitors."63
In addition, they define brand equity as "A term developed to describe the financial value of a brand to the bottom line profit of a business."
Business articles widely site the example of Coca-Cola, the #1 brand based on the 2007 BusinessWeek/Interbrand survey. According to the Brand Finance 250 annual report, Coca-Cola has the highest brand value—over $43 billion or nearly 40% of its total $110 billion enterprise value—in a highly competitive beverage market.
While taste is indeed an important differentiator, Coca-Cola is able to charge a premium for its products—and generate significant brand value—primarily due to the strong brand loyalty of its customers.
Various studies consulted suggest that those destinations with a positive image will have a higher probability of being considered and finally chosen in the process of selection of the destination to visit.64
“A country’s brand reputation is in itself a powerful currency. Reputation drives financial and business investment, sustainable growth and helps add fuel to the private and retail sectors,” said René A. Mack, president, Weber Shandwick’s Travel & Lifestyle Global Practice. “A visitor is the most powerful marketer for any country brand. They import the destination and
63 http://www.esomar.org/index.php/glossary-b.html 64 http://www.um.es/analesps/v22/v22_1/19-22_1.pdf

An Assessment of Potential Costs and Benefits of Offshore Wind Turbines 100
its products and experiences directly into their homes, offices and social communities, combined with the most powerful voice of all – word of mouth.”65
Environmental characteristics are certainly one piece of that image. Travelers are becoming more environmentally responsible. As such, environmental issues are impacting brand value, positively or negatively. On the positive side, entities that are examining internal processes and making credible, auditable changes to reduce environmental impact and working with outside entities to promote green goals will increase the value of their green image.
On the negative side, entities that attempt to greenwash—entities that claim to be going green yet make few internal changes and are found to be not promoting green goals at a strong enough level—can lose significant brand value by mistakenly claiming to be green.
As has been noted previously in this study, the size, in terms of additional power generated by a proposed 288-MW wind farm, is small in comparison to the overall New Jersey power market. Thus, it is likely that the wind farm by itself will be unlikely to cause much change in any New Jersey image held by consumers.
New Jersey can improve its green brand image, and hope to differentiate itself, if it uses this proposed wind farm as a springboard to an overall green effort. Continued recycling efforts down the shore, incorporating greener building codes, promoting more renewable energy projects all could be used to improve New Jersey's brand image. A code of ethics for tourism; and certifying eco-friendly tourism enterprises could be other steps taken to promote New Jersey as a green state.
Brand image is way of differentiating oneself from complementary commodities. As a brand, New Jersey has a tough time distancing itself from a weekend, average destination. Images from its past, such as the garbage barge from the 90s, continue to reflect on New Jersey shore brand image.
As a stand-alone project, the proposed wind farm will most likely have minimal impact on New Jersey's and the Shore's brand image but, the proposed wind farm can improve New Jersey's brand image with a holistic, credible, accountable green action plan.
The ability for the 288-MW proposed wind farm to change New Jersey's brand image would be lessened if other neighborhood, complementary destinations states also propose, build, and operate wind farms, as Delaware, Rhode Island, Long Island (New York), and Massachusetts have proposed.
65 http://www.countrybrandindex.com/whos-talking-about-cbi/futurebrand-releases-2007-study-on-gulf-
real-estate-sector/

An Assessment of Potential Costs and Benefits of Offshore Wind Turbines 101
8. Conclusion In this report, Global Insight has examined the impact of a proposed wind farm off the coast of New Jersey at various distances. In general, the results contained in this report show a minimal impact of a wind farm on the economy, compared to not building a wind farm. In cases where the impact of the wind farm is negative, the impacts are small in comparison to the economic output of the area studied. In certain cases, the wind farm impact can be positive, creating jobs and adding value to New Jersey.
Energy: The offshore wind farm will produce 1% of New Jersey's generation output, which equates to approximately 717 Gigawatt-hours (GWh) out of a total generation output of 61,333 GWh. The overall nameplate capacity of the wind farm is 288 MW, which is 2% of New Jersey's generation capacity
Beginning in 2012, the wind farm will generate about 700,000 MWh per year, which will displace natural gas and some coal generation output and emissions. The wind farm will reduce 2012 CO2 emissions by 430,000 metric tons within PJM East or 1/2% of the 43-million metric tons emitted in the region.
Because of its size, the potential wind farm will not lower the cost of electricity to homeowners and businesses. The offshore wind farm is likely to have a small positive effect on congestion pricing.
The possible offshore locations will not appreciably change the price range as the primary cost determinant for an offshore wind farm is the depth of water. The water depth is less than 30 meters for the distances studied, which is applicable for one design style, the monopile foundation. The other determinant of cost is the transmission cable length. Based on our research, the additional cost of cable is within the $3,500 to $4,500 per KW cost range above, and was not separately added.
Tourism: There is minimal evidence that wind farms have a large adverse impact on tourism. Using the results of the New Jersey Shore Opinion Study about Offshore Wind Turbines and New Jersey's Tourism Satellite Account, a wind farm location three miles offshore could have net possible sales impacts that run from $474 million in Atlantic County to $155 million in Ocean and Cape May counties in 2012. The net present value cost of a potential wind farm three miles off the coast would be $771 million in Atlantic County to $260 million in Ocean and Cape May Counties.
At the other extreme, the impact of a potential wind farm located 20 miles off the coast of each county could be positive, compared to the no wind farm scenario, in Atlantic and Cape May. Both would see a NPV tourism sales gain of around $25 million. Ocean County's NPV difference would drop to $90 million.
Property Values: There is minimal evidence that wind farms have a large adverse impact on property values, either residential or commercial. In examining the impact of a proposed wind farm on residential values, Global Insight estimates zero impact on all but oceanfront properties.

An Assessment of Potential Costs and Benefits of Offshore Wind Turbines 102
The impact of a wind farm on the oceanfront premium cannot be ignored. Global Insight estimates the value of the oceanfront premium at risk in each county at 3-5% of total residential value with a possible residential property gap in Cape May County calculated at a maximum value difference of $976 million.
Global Insight estimates residential property value impact of a proposed wind farm three miles off the coast of Cape May to be $244 million, or around 0.8% of total residential value in 2012. This would result in property tax differences of just under $1.5 million. Residential property value differences would be smaller in Atlantic and Ocean Counties and decline as a wind farm location moves further off shore, to zero for an offshore wind farm 20 miles offshore.
If a proposed wind farm were to be located three miles offshore of Atlantic County, potentially $70 million in commercial property values would be forgone, less than 1.0% of the total. Locating a wind farm three miles off of Ocean or Cape May counties would result in commercial property value differences of about $8 and $14 million, respectively.
Locating a wind farm at distances further offshore, at 20 miles, the impact of a potential wind farm could result in a positive difference in the potential wind farm case compared to no wind farm. Commercial property values in Atlantic County could show a positive difference of $160,000 with Cape May at $1.1 million. Ocean County's wind farm impact on commercial property values would remain negative but only potentially result in $3 million in forgone value in 2012.
It should be noted that both estimated residential and commercial property value impacts are estimated to be less than 2% of 2012 totals in the majority of cases in all affected counties. With this result and evidence from other wind farms, Global Insight views the impact from a proposed offshore wind farm in New Jersey to be negligible.
Fisheries: While many of the economic impacts of a proposed offshore wind farm will be site specific and Global Insight, at the time of this report, does not have any specific sites to analyze, current research states that the construction and operations of an offshore wind farm is not likely to have a large economic impact on fisheries.
The major economic impact from an offshore wind farm on commercial and recreational fisheries would be during the construction phase. During that phase recreational and commercial fish catch value could show a maximum valued difference from the non wind farm case by $150,000 to $6.5 million. This loss is considered to be a maximum loss as it is expected the fishing industry would adapt to the introduction of the wind farm very quickly, assuming no major fishing grounds are disrupted.
Once a wind farm is established, the difference in the value of landings between a potential wind farm three miles offshore and the case of no wind farm is expected to drop to a range of less than $100 to $5,100. Total present value differences during operations would range from $3,000 to $170,000. Locating a wind farm six, twelve or twenty miles offshore, the difference in catch value to a no wind farm case would drop to under $30.
The difference, measured by present value, between no wind farm and a potential wind farm located three miles off shore could range from $154,000 to $6.6 million over the life of the

An Assessment of Potential Costs and Benefits of Offshore Wind Turbines 103
wind farm. This includes the economic impacts from both construction and operations phases.
Economic impacts to the fishing industry are very dependant on the location of a potential wind farm. Every acre off the coast of New Jersey is not created equal, which is the assumption of this report. The impact of a potential wind farm could be drastically different from one location to the next. This is an area that would most benefit from further research, once a site has been selected.
Brand image: As a stand-alone project, the proposed wind farm will most likely have minimal impact on New Jersey's and the Shore's brand image but, the proposed wind farm can improve New Jersey's brand image with a holistic, credible, accountable green action plan.
The ability for the 288-MW proposed wind farm to change New Jersey's brand image would be lessened if other neighborhood, complementary destinations states also propose, build and operate wind farms, as Delaware, Rhode Island, Long Island (New York), and Massachusetts have proposed.
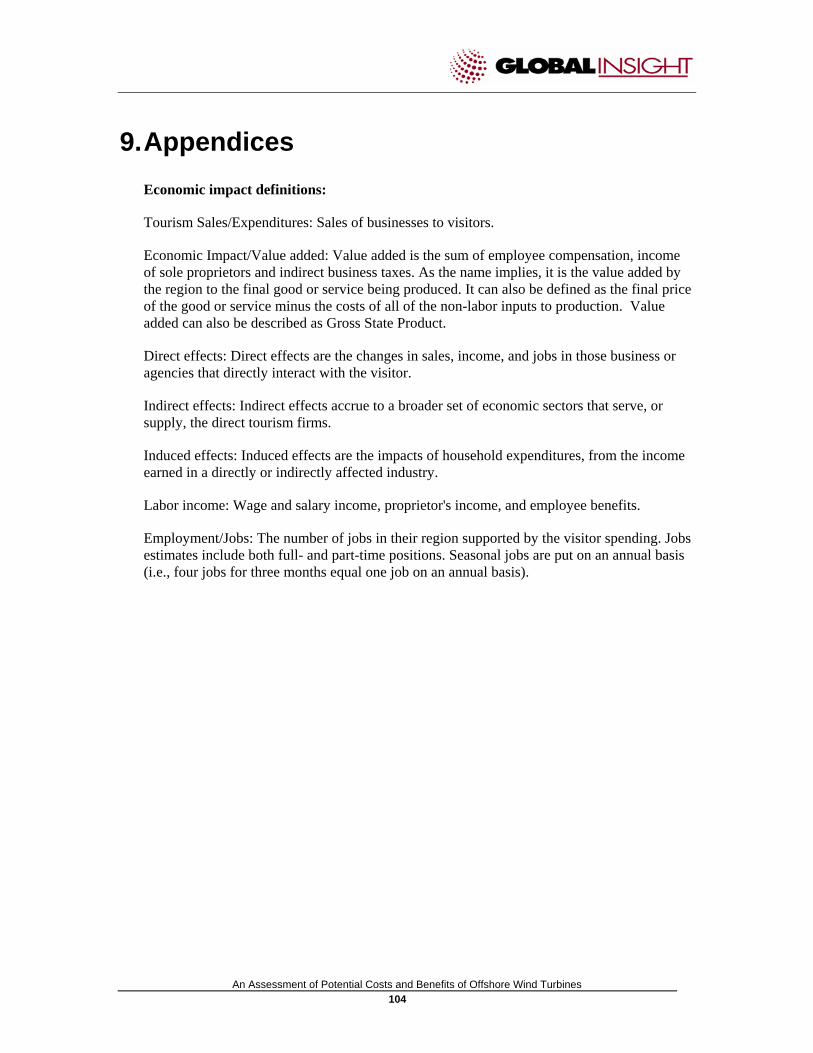
An Assessment of Potential Costs and Benefits of Offshore Wind Turbines 104
9. Appendices Economic impact definitions:
Tourism Sales/Expenditures: Sales of businesses to visitors.
Economic Impact/Value added: Value added is the sum of employee compensation, income of sole proprietors and indirect business taxes. As the name implies, it is the value added by the region to the final good or service being produced. It can also be defined as the final price of the good or service minus the costs of all of the non-labor inputs to production. Value added can also be described as Gross State Product.
Direct effects: Direct effects are the changes in sales, income, and jobs in those business or agencies that directly interact with the visitor.
Indirect effects: Indirect effects accrue to a broader set of economic sectors that serve, or supply, the direct tourism firms.
Induced effects: Induced effects are the impacts of household expenditures, from the income earned in a directly or indirectly affected industry.
Labor income: Wage and salary income, proprietor's income, and employee benefits.
Employment/Jobs: The number of jobs in their region supported by the visitor spending. Jobs estimates include both full- and part-time positions. Seasonal jobs are put on an annual basis (i.e., four jobs for three months equal one job on an annual basis).
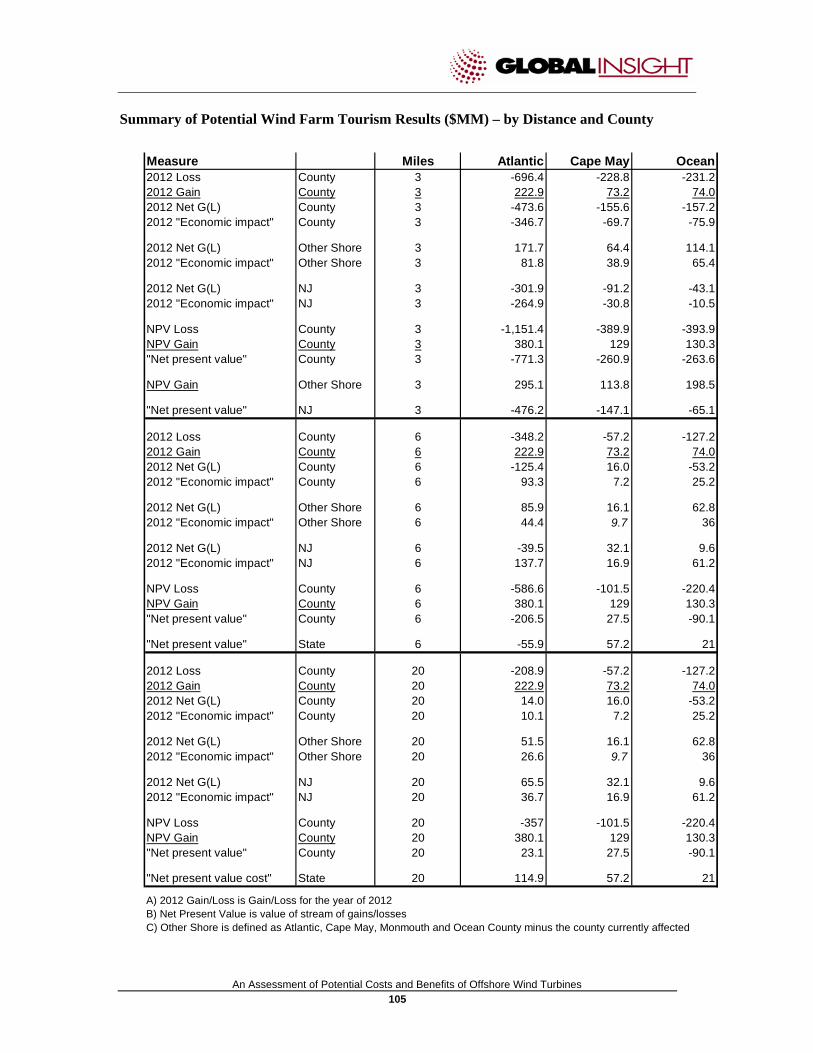
An Assessment of Potential Costs and Benefits of Offshore Wind Turbines 105
Summary of Potential Wind Farm Tourism Results ($MM) – by Distance and County
Measure Miles Atlantic Cape May Ocean2012 Loss County 3 -696.4 -228.8 -231.22012 Gain County 3 222.9 73.2 74.02012 Net G(L) County 3 -473.6 -155.6 -157.22012 "Economic impact" County 3 -346.7 -69.7 -75.9
2012 Net G(L) Other Shore 3 171.7 64.4 114.12012 "Economic impact" Other Shore 3 81.8 38.9 65.4
2012 Net G(L) NJ 3 -301.9 -91.2 -43.12012 "Economic impact" NJ 3 -264.9 -30.8 -10.5
NPV Loss County 3 -1,151.4 -389.9 -393.9NPV Gain County 3 380.1 129 130.3"Net present value" County 3 -771.3 -260.9 -263.6
NPV Gain Other Shore 3 295.1 113.8 198.5
"Net present value" NJ 3 -476.2 -147.1 -65.1
2012 Loss County 6 -348.2 -57.2 -127.22012 Gain County 6 222.9 73.2 74.02012 Net G(L) County 6 -125.4 16.0 -53.22012 "Economic impact" County 6 93.3 7.2 25.2
2012 Net G(L) Other Shore 6 85.9 16.1 62.82012 "Economic impact" Other Shore 6 44.4 9.7 36
2012 Net G(L) NJ 6 -39.5 32.1 9.62012 "Economic impact" NJ 6 137.7 16.9 61.2
NPV Loss County 6 -586.6 -101.5 -220.4NPV Gain County 6 380.1 129 130.3"Net present value" County 6 -206.5 27.5 -90.1
"Net present value" State 6 -55.9 57.2 21
2012 Loss County 20 -208.9 -57.2 -127.22012 Gain County 20 222.9 73.2 74.02012 Net G(L) County 20 14.0 16.0 -53.22012 "Economic impact" County 20 10.1 7.2 25.2
2012 Net G(L) Other Shore 20 51.5 16.1 62.82012 "Economic impact" Other Shore 20 26.6 9.7 36
2012 Net G(L) NJ 20 65.5 32.1 9.62012 "Economic impact" NJ 20 36.7 16.9 61.2
NPV Loss County 20 -357 -101.5 -220.4NPV Gain County 20 380.1 129 130.3"Net present value" County 20 23.1 27.5 -90.1
"Net present value cost" State 20 114.9 57.2 21
A) 2012 Gain/Loss is Gain/Loss for the year of 2012B) Net Present Value is value of stream of gains/lossesC) Other Shore is defined as Atlantic, Cape May, Monmouth and Ocean County minus the county currently affected

An Assessment of Potential Costs and Benefits of Offshore Wind Turbines 106
National Marine Fisheries Service Statistical Areas: