economic assessment of the impact of electricity storage
TRANSCRIPT

Economic assessment of the impact of electricity
storage on power quality in distribution systems
Author: Belén Rabadán Travesí
Director: Pablo Frías Marín
Madrid
August 2016
ESCUELA TÉCNICA SUPERIOR DE INGENIERÍA (ICAI) GRADO EN INGENIERÍA ELECTROMECÁNICA

Economic assessment of the impact of electricity storage on power quality in distribution systems Belén Rabadán Travesí, ICAI
II
AUTORIZACIÓN PARA LA DIGITALIZACIÓN, DEPÓSITO Y DIVULGACIÓN EN ACCESO ABIERTO (RESTRINGIDO) DE DOCUMENTACIÓN 1º. Declaración de la autoría y acreditación de la misma. El autor D. _____________________________________ , como _______________ de la UNIVERSIDAD PONTIFICIA COMILLAS (COMILLAS), DECLARA que es el titular de los derechos de propiedad intelectual, objeto de la presente cesión, en relación con la obra______________________________________________________________________________________________________________________________________, que ésta es una obra original, y que ostenta la condición de autor en el sentido que otorga la Ley de Propiedad Intelectual como titular único o cotitular de la obra. En caso de ser cotitular, el autor (firmante) declara asimismo que cuenta con el consentimiento de los restantes titulares para hacer la presente cesión. En caso de previa cesión a terceros de derechos de explotación de la obra, el autor declara que tiene la oportuna autorización de dichos titulares de derechos a los fines de esta cesión o bien que retiene la facultad de ceder estos derechos en la forma prevista en la presente cesión y así lo acredita. 2º. Objeto y fines de la cesión. Con el fin de dar la máxima difusión a la obra citada a través del Repositorio institucional de la Universidad y hacer posible su utilización de forma libre y gratuita ( con las limitaciones que más adelante se detallan) por todos los usuarios del repositorio y del portal e-ciencia, el autor CEDE a la Universidad Pontificia Comillas de forma gratuita y no exclusiva, por el máximo plazo legal y con ámbito universal, los derechos de digitalización, de archivo, de reproducción, de distribución, de comunicación pública, incluido el derecho de puesta a disposición electrónica, tal y como se describen en la Ley de Propiedad Intelectual. El derecho de transformación se cede a los únicos efectos de lo dispuesto en la letra (a) del apartado siguiente. 3º. Condiciones de la cesión. Sin perjuicio de la titularidad de la obra, que sigue correspondiendo a su autor, la cesión de derechos contemplada en esta licencia, el repositorio institucional podrá: (a) Transformarla para adaptarla a cualquier tecnología susceptible de incorporarla a internet; realizar adaptaciones para hacer posible la utilización de la obra en formatos electrónicos, así como incorporar metadatos para realizar el registro de la obra e incorporar “marcas de agua” o cualquier otro sistema de seguridad o de protección.

Economic assessment of the impact of electricity storage on power quality in distribution systems Belén Rabadán Travesí, ICAI
III
(b) Reproducirla en un soporte digital para su incorporación a una base de datos electrónica, incluyendo el derecho de reproducir y almacenar la obra en servidores, a los efectos de garantizar su seguridad, conservación y preservar el formato. . (c) Comunicarla y ponerla a disposición del público a través de un archivo abierto institucional, accesible de modo libre y gratuito a través de internet. (d) Distribuir copias electrónicas de la obra a los usuarios en un soporte digital. 4º. Derechos del autor. El autor, en tanto que titular de una obra que cede con carácter no exclusivo a la Universidad por medio de su registro en el Repositorio Institucional tiene derecho a: a) A que la Universidad identifique claramente su nombre como el autor o propietario de los derechos del documento. b) Comunicar y dar publicidad a la obra en la versión que ceda y en otras posteriores a través de cualquier medio. c) Solicitar la retirada de la obra del repositorio por causa justificada. A tal fin deberá ponerse en contacto con el vicerrector/a de investigación ([email protected]). d) Autorizar expresamente a COMILLAS para, en su caso, realizar los trámites necesarios para la obtención del ISBN. d) Recibir notificación fehaciente de cualquier reclamación que puedan formular terceras personas en relación con la obra y, en particular, de reclamaciones relativas a los derechos de propiedad intelectual sobre ella. 5º. Deberes del autor. El autor se compromete a: a) Garantizar que el compromiso que adquiere mediante el presente escrito no infringe ningún derecho de terceros, ya sean de propiedad industrial, intelectual o cualquier otro. b) Garantizar que el contenido de las obras no atenta contra los derechos al honor, a la intimidad y a la imagen de terceros. c) Asumir toda reclamación o responsabilidad, incluyendo las indemnizaciones por daños, que pudieran ejercitarse contra la Universidad por terceros que vieran infringidos sus derechos e intereses a causa de la cesión. d) Asumir la responsabilidad en el caso de que las instituciones fueran condenadas por infracción de derechos derivada de las obras objeto de la cesión. 6º. Fines y funcionamiento del Repositorio Institucional. La obra se pondrá a disposición de los usuarios para que hagan de ella un uso justo y respetuoso con los derechos del autor, según lo permitido por la legislación aplicable, y

Economic assessment of the impact of electricity storage on power quality in distribution systems Belén Rabadán Travesí, ICAI
IV
con fines de estudio, investigación, o cualquier otro fin lícito. Con dicha finalidad, la Universidad asume los siguientes deberes y se reserva las siguientes facultades:
a) Deberes del repositorio Institucional: - La Universidad informará a los usuarios del archivo sobre los usos permitidos, y no garantiza ni asume responsabilidad alguna por otras formas en que los usuarios hagan un uso posterior de las obras no conforme con la legislación vigente. El uso posterior, más allá de la copia privada, requerirá que se cite la fuente y se reconozca la autoría, que no se obtenga beneficio comercial, y que no se realicen obras derivadas. - La Universidad no revisará el contenido de las obras, que en todo caso permanecerá bajo la responsabilidad exclusiva del autor y no estará obligada a ejercitar acciones legales en nombre del autor en el supuesto de infracciones a derechos de propiedad intelectual derivados del depósito y archivo de las obras. El autor renuncia a cualquier reclamación frente a la Universidad por las formas no ajustadas a la legislación vigente en que los usuarios hagan uso de las obras. - La Universidad adoptará las medidas necesarias para la preservación de la obra en un futuro.
b) Derechos que se reserva el Repositorio institucional respecto de las obras en él registradas: - retirar la obra, previa notificación al autor, en supuestos suficientemente justificados, o en caso de reclamaciones de terceros. Madrid, a ……….. de …………………………... de ………. ACEPTA Fdo.:……………………………………………………………
Economic assessment of the impact of electricity storage on power quality in distribution systems Belén Rabadán Travesí, ICAI
V

Economic assessment of the impact of electricity storage on power quality in distribution systems Belén Rabadán Travesí, ICAI
VI

Economic assessment of the impact of electricity storage on power quality in distribution systems Belén Rabadán Travesí, ICAI
VII
ACKNOWLEGMENT
Firstly, I would like to express my sincere gratitude to my professor and director, Pablo Frías Marín, for providing me the unique experience to embark this project. I would also like to express my gratitude to all my teachers, in college and in school, who put their faith in me and urged me to do better.
My sincere thank you to my family, specially my parents, for providing me the incredible opportunity of studying at ICAI. The countless times you have helped me through my journey in college; all your efforts will gain something great in the near future. Your unceasing encouragement when the times got rough are much appreciated and duly noted. Thanks to my sisters too for their patience and attention during all this time.
I would also like to thank my friends for their support and for having helped me through the consecution of this project. You have really lifted my spirits up when I have needed it.
Finally, I also place on record, my sense of gratitude to one and all who, directly or indirectly, have lent their helping hand in this venture.
‘It is the combination of reasonable talent and the ability to keep going in the
face of defeat that leads to success’ Martin Seligman.

Economic assessment of the impact of electricity storage on power quality in distribution systems Belén Rabadán Travesí, ICAI
VIII
ECONOMIC ASSESMENT OF THE IMPACT OF ELECTRICITY STORAGE ON POWER QUALITY IN DISTRIBUTION SYSTEMS Author: Rabadán Travesí, Belén
Director: Frías Marín, Pablo
Collaborating entity: Universidad Pontificia Comillas (ICAI)
ABSTRACT Nowadays electricity is one of the most important aspects of people’s lives.
Almost no one can imagine their day without checking their email, showering with hot
water or going to work by train. We can affirm that electricity has become a really
important product and, due to this, several quality requirements need to be fulfilled.
Almost every country in the world, especially the European ones and the US, have laws
that regulate the characteristics of power supply so that electrical companies provide
their customers with the best electricity available in the market.
The main disadvantage of power is that it is produced in a different place where
it is consumed. Electricity is produced in power plants where its main characteristics
(like voltage value, frequency, harmonic’s content…) are highly controlled. But, while
electricity reaches its final customers, those characteristics may be disturbed. Those
disturbances affect the quality of supply, that is the part of quality of electrical service
that represents the measure of how an ideal power supply system should be.
Among the electrical disturbances that affect the quality of supply we can find
the supply voltage variations, voltage dips, voltage swells, short interruptions and long
interruptions. Their causes are various: variations of loads, line faults, incidents in the
line’s insulation… As we can see, not all the disturbances are caused by failures of the
distribution companies but also because of a bad state of the equipment connected to
the distribution network.
Of all the electrical disturbances long and short interruptions are the ones
studied deeper in this project as they are the ones with highest probability of happening.

Economic assessment of the impact of electricity storage on power quality in distribution systems Belén Rabadán Travesí, ICAI
IX
In order to measure them two indexes are mainly used: the SAIDI and the SAIFI. The
SAIDI represents the average duration interruption of service for each customer of the
electrical company. The SAIFI represents the average number of times that a customer
experiences an interruption of power service. Spain is neither among the countries with
the lowest values of SAIDI and SAIFI nor among the countries with the highest ones but
in the middle. This means that we still that actions are still needed in order to improve
the quality of service and, therefore, decrease the value of these indexes. Moreover, the
ENS index is also important as it measures the quantity of energy that hasn’t been
supplied to customers in a certain region.
Furthermore, as disturbances imply a bad quality of service they have an
economic impact. This is why electrical distribution companies carry out studies in order
to know the opinion that customers have on this subject. For example, the AEMO
developed the VCR (Value of Customer Reliability) that is in an index that represents the
willingness of customers to pay in order to avoid disturbances. In this project we have
considered a value of 10€/kWh for the cost of non-supplied energy.
Using the SAIDI, SAIFI, ENS and the cost of non-supplied energy we have obtained
the amount of money that electrical distribution companies need to pay to customers
when interruptions take place. As we have obtained that the total cost of the
interruptions implies a big sum of money it is economically profitable to install storage
systems in order to improve the quality of electricity.
Therefore, in order to reduce the number and length of interruptions several
solutions are presented: Petersen coil, Uninterruptable Power Supply (UPS) System,
flywheel, Dynamic Voltage Restorer (DVR) and Variable Frequency Drive (VFD). Among
them, the flywheel and the UPS are the best solution in economic terms. If we study the
advantages and disadvantages of these two solutions, we conclude that the UPS storage
system is currently the best solution as it can provide energy for almost one hour while
the flywheels only last for a few seconds.
Finally, we have studied the economic impact of the electrical disturbances in
the distribution network in the future. We are living in the decade of the climate change,

Economic assessment of the impact of electricity storage on power quality in distribution systems Belén Rabadán Travesí, ICAI
X
in a few years the average temperature of the planet and its precipitation patterns are
going to change drastically. As a lot of electrical disturbances are caused by weather
phenomena, the climate change will have a big impact on power quality by increasing
the length and frequency of the electrical disturbances. Because of this we have studied
the consequences that the climate change will have in the long and short interruptions.
In order to do this, two scenarios have been presented: a gathered rural zone and an
urban zone. In both cases we have analyzed the economic impact of the interruptions if
its duration and frequency is multiplied by two, by five and by ten. By doing this, we
have modeled the impact of the climate change on electrical disturbances. Moreover,
the economic cost of the installation of an UPS storage system is analyzed.
In the gathered rural zone, even with a small population and a big number of
electrical disturbances (because its configuration is a radial one) it is economically
profitable to install an UPS storage system. Obviously, in an urban zone, with a bigger
population and less disturbances (thanks to its netted configuration) it is also
economically profitable to install the UPS not only in the future with the climate change
but nowadays. In both cases the possibility of charging the customers the cost of the
UPS storage system has been studied but we have concluded that it cannot be all
charged to the customers as it implies a big sum of money.
In this project we can learn the importance that a good quality of electricity has
on all the equipment connected to the electrical network. The problem is that not
everyone is aware of the big consequences that electrical disturbances have. Therefore,
it is important that we all learn about it in order to, as long as it is possible, avoid their
causes.

Economic assessment of the impact of electricity storage on power quality in distribution systems Belén Rabadán Travesí, ICAI
XI
ESTUDIO ECONÓMICO DEL IMPACTO DE SISTEMAS DE ALMACENAMIENTO EN LA CALIDAD DE ENERGÍA EN SISTEMAS DE DISTRIBUCIÓN ELÉCTRICA Autor: Rabadán Travesí, Belén
Director: Frías Marín, Pablo
Entidad Colaboradora: Universidad Pontificia Comillas (ICAI)
RESUMEN Hoy en día la electricidad es uno de los aspectos más importantes en la vida de
las personas. Casi nadie puede imaginar su día a día sin revisar su email, ducharse con
agua caliente o ir a la oficina en tren. Podemos afirmar que la electricidad es un producto
muy importante y, por lo tanto, tiene que cumplir unos requisitos de calidad.
Prácticamente todos los países del mundo, especialmente los países europeos y Estados
Unidos, tienen leyes que regulan las características del suministro eléctrico. De esta
forma, los usuarios de la red eléctrica pueden estar seguros de que la energía que
reciben es la mejor energía disponible en el mercado.
La principal desventaja de la energía eléctrica es que es producida en un lugar
diferente al de su consumo final. La electricidad es producida en centrales eléctricas
donde sus características principales (como el valor de la tensión, la frecuencia, el
contenido en harmónicos…) son controladas. El problema que esas características se
ven alteradas mientras la electricidad llega a los usuarios finales. Estas alteraciones
reciben el nombre de perturbaciones eléctricas y afectan a la calidad de suministro. La
calidad de suministro es una parte de la calidad del servicio eléctrico que se encarga de
medir cómo ha de ser una red eléctrica ideal.
Entre las perturbaciones que afectan a la calidad de suministro encontramos las
variaciones de voltaje, los huecos de tensión, los aumentos de tensión, las
interrupciones largas y las interrupciones cortas. Las causas de estas perturbaciones son
muchas: variaciones en la carga, faltas en las líneas, incidentes en el aislamiento… Como
podemos observar no todas las perturbaciones eléctricas son debidas a fallos de las

Economic assessment of the impact of electricity storage on power quality in distribution systems Belén Rabadán Travesí, ICAI
XII
compañías eléctricas sino también debido a un mal estado de los equipos conectados a
la red de distribución eléctrica.
De todas las perturbaciones eléctricas, las interrupciones largas y cortas son las
más estudiadas en este proyecto puesto que son los que tienen mayor probabilidad de
suceder. Para medirlas se utilizan principalmente dos índices: SAIDI y SAIFI. El SAIDI mide
la duración media de las interrupciones de servicio para un usuario de la red eléctrica.
El SAIFI representa la frecuencia media de interrupciones de servicio. España se
encuentra entre los países con valores medios de estos índices. Esto implica que aún es
necesario actuar para mejorar la calidad de servicio y, por lo tanto, disminuir el valor de
estos índices. Además, también se utiliza el índice ENS que mide la cantidad de energía
que no ha sido provista a los consumidores en una región y debería haberlo sido.
Además, al suponer las perturbaciones eléctricas una mala calidad del servicio
éstas tienen un impacto económico. Debido a esto, las compañías eléctricas centran
muchos de sus estudios en conocer la opinión de los consumidores eléctricos sobre este
tema. Por ejemplo, el AEMO desarrolló el VCR (valor de la fiabilidad del consumidor),
éste es un índice que representa cuánto están los consumidores dispuestos a pagar para
evitar las interrupciones de suministro eléctrico. En este proyecto hemos considerado
un valor de 10€/kWh para representar el coste de la energía no suministrada.
Utilizando los valores de SAIDI, SAIFI, ENS y del coste de la energía calculada se
ha obtenido la cantidad total de dinero que las compañías distribuidoras deben de pagar
a los usuarios debido a las interrupciones de suministro. Puesto que se han obtenido
valores muy elevados se ha concluido que es rentable la instalación de sistemas de
almacenamiento de energía para mejorar la calidad de la energía.
Por lo tanto, para reducir la cantidad y duración de las interrupciones se han
presentado las siguientes soluciones: bobina Petersen, Sistema de Alimentación
Ininterrumpida (SAI), volante de inercia, Restaurador Dinámico de Tensión y un Variador
de Frecuencia. Entre todas estas soluciones, el volante de inercia y el SAI son las mejores
en cuanto a términos económicos. Si estudiamos las ventajas y desventajas de ambos
podemos concluir que el SAI es, a día de hoy, la mejor solución ya que puede

Economic assessment of the impact of electricity storage on power quality in distribution systems Belén Rabadán Travesí, ICAI
XIII
proporcionar energía durante casi una hora mientras que los volantes de inercia
solamente por unos segundos.
Por último, se ha estudiado el impacto económico de las perturbaciones
eléctricas en la red de distribución en el futuro. Vivimos en la década del cambio
climático, en un par de años la temperatura media del planeta, así como el modelo de
precipitaciones cambiarán drásticamente. Puesto que muchas de las perturbaciones
eléctricas son debido a fenómenos meteorológicos, el cambio climático va a tener un
gran impacto en la calidad de suministro eléctrico aumentando la duración y frecuencia
de las distribuciones. Por este motivo se han estudiado las consecuencias que el cambio
climático va a tener en las interrupciones cortas y largas. Para ello se han presentado
dos escenarios: una zona rural agrupada y una zona urbana. En ambos casos se ha
analizado el impacto económico de las interrupciones en el caso de que su duración y
frecuencia se vea multiplicada por dos, por cinco y por diez. Con esto se consigue
modelar el impacto que tendrá el cambio climático en las perturbaciones eléctricas.
Además, el coste de instalar un SAI ha sido analizado.
En el caso de la zona agrupada rural, a pesar de que su población es pequeña y
su cantidad de perturbaciones elevada (debido a su disposición radial) es
económicamente rentable instalar un SAI actualmente y en el futuro. Obviamente, en la
zona urbana, con una mayor población y menor número de perturbaciones (gracias a la
disposición mallada de este tipo de redes) también es rentable en términos económicos
instalar un sistema SAI no sólo en el futuro con el cambio climático sino también hoy en
día. En ambos casos se ha estudiado la posibilidad de cobrar a los usuarios de la red el
coste del sistema SAI, pero se ha concluido que esto no es posible ya que los
consumidores tendrían que pagar una elevada suma de dinero por ello.
Este proyecto nos permite aprender la importancia que la buena calidad de
energía eléctrica tiene sobre los equipos conectados a la red eléctrica. El problema es
que no todo el mundo es consciente de las enormes consecuencias que las
perturbaciones tienen. Por lo tanto, es importante que todos aprendamos sobre ellas
para, en la medida de los posible, disminuir sus causas.

Economic assessment of the impact of electricity storage on power quality in distribution systems Belén Rabadán Travesí, ICAI
XIV

Economic assessment of the impact of electricity
storage on power quality in distribution systems
currently and in the future
Author: Belén Rabadán Travesí
Director: Pablo Frías Marín
Madrid
August 2016
ESCUELA TÉCNICA SUPERIOR DE INGENIERÍA (ICAI) GRADO EN INGENIERÍA ELECTROMECÁNICA

Economic assessment of the impact of electricity storage on power quality in distribution systems Belén Rabadán Travesí, ICAI
16
INDEX
1. INTRODUCTION 24 1.1. Distribution system 24
1.1.1. Quality of electricity 25 1.1.1.1. Customer service 27 1.1.1.2. Continuity of supply 27 1.1.1.3. Power quality 29
1.2. Regulation 33 1.3. Objectives 38 1.4. Structure 38 1.5. Conclusion 39
2. ELECTRICAL DISTURBANCES 42 2.1. Definition of some electrical disturbances 42
2.1.1. Supply voltage variations 43 2.1.1.1. Causes 43 2.1.1.2. Effects 44
2.1.2. Voltage dips 44 2.1.2.1. Causes 46 2.1.2.2. Effects 48
2.1.1. Voltage swell 48 2.1.1.1. Causes 49 2.1.1.2. Effects 49
2.1.2. Shorts interruptions 49 2.1.2.1. Causes 50 2.1.2.2. Effects 51
2.1.3. Long interruption 51 2.1.3.1. Causes 51 2.1.3.2. Effects 52
2.2. How frequent are electrical disturbances? 52 2.3. How to measure continuity of supply 54
2.3.1. SAIDI 56 2.3.1.1. SAIDI in different European countries 58
2.3.2. SAIFI 59 2.3.2.1. SAIFI in different European countries 61
2.3.3. SAIFI and SAIDI 62 2.3.4. ENS 63
2.4. How to measure voltage quality 64 2.4.1. SARFI 65
2.5. Responsibilities 65 2.6. Conclusion 66
3. ECONOMIC STUDY UNDER CURRENT QUALITY LEVELS 68 3.1. Introduction 68 3.2. Costs arising from electrical disturbances 68
3.2.1. Cost of non-supplied energy 70 3.2.1.1. Average cost of long interruptions in Spain 72
3.2.2. Cost due to poor voltage quality 77 3.3. Solutions to avoid electrical disturbances 78

Economic assessment of the impact of electricity storage on power quality in distribution systems Belén Rabadán Travesí, ICAI
17
3.3.1. Petersen coil 80 3.3.2. UPS 81 3.3.3. Flywheel 82 3.3.4. Dynamic Voltage Restorer 84 3.3.5. Variable frequency drive (VFD) 85
3.4. Economic study of the solutions 86 3.5. Conclusion 90
4. ECONOMIC STUDY UNDER FUTURE QUALITY LEVELS 92 4.1. Introduction 92 4.2. Climate change 92 4.3. Scenario I: Gathered rural zone 97
4.3.1. Cost for each customer 105 4.3.2. Sensitivity analysis 106
4.4. Scenario II: Urban zone 107 4.4.1. Cost for each customer 112 4.4.2. Sensitivity analysis 113
4.5. Comparison of both scenarios 114 4.6. Conclusion 115
5. CONCLUSIONS 118 5.1. Limitations of analysis and future research 119
6. BIBLIOGRAPHY 122
7. ANNEX A: BATTERIES 128 7.1. Batteries 128
7.1.1. Lead-Acid batteries 131 7.1.1.1. Flooded Lead-Acid batteries 132 7.1.1.2. Valve-Regulated Acid batteries 133
7.1.2. Nickel-Cadmium batteries 133 7.1.3. Lithium-Ion batteries 134 7.1.4. Comparison of batteries 135 7.1.5. Advancements in batteries 135
7.2. Inverters 136

Economic assessment of the impact of electricity storage on power quality in distribution systems Belén Rabadán Travesí, ICAI
18

Economic assessment of the impact of electricity storage on power quality in distribution systems Belén Rabadán Travesí, ICAI
19
LIST OF FIGURES
Fig. 1: Electric system [2]. ............................................................................................... 24
Fig. 2: Quality of service [8]. ........................................................................................... 26
Fig. 3: Bathtub curve [10]. .............................................................................................. 28
Fig. 4: Some of the disturbances that affect voltage quality [5]. ................................... 33
Fig. 5: The most important parameters of standard EN 50160 in graphical form [15]. 37
Fig. 6: Electrical disturbances that are going to be studied classified by the area of quality of supply that is affected by them. ..................................................................... 43
Fig. 7: Equivalent monophasic scheme of the electrical network.................................. 44
Fig. 8: Voltage dip [19]. ................................................................................................... 45
Fig. 9: Waveform change in two voltage dips starting at a different moment [16]. ..... 46
Fig. 10: Voltage dips with its different causes [20]. ....................................................... 47
Fig. 11: Voltage swell [21]. .............................................................................................. 48
Fig. 12: Short interruption of power supply in which the voltage drops to zero [19]. .. 50
Fig. 13 : Urban network on the right side of the image and rural network on the left side [26]. ......................................................................................................................... 55
Fig. 14: Progress of the SAIDI index over the las few years. .......................................... 57
Fig. 15: Minutes lost per year in different European countries over the last years [7]. 59
Fig. 16: Progress of the SAIFI index over the las few years. ........................................... 60
Fig. 17: Number of interruptions per year in different European countries over the last years [7]. ......................................................................................................................... 62
Fig. 18: SAIFI and SAIDI index in the last few years. T: total, U: urban zone, SU: semi-urban zone, GR: gathered rural zone and SR: scattered rural zone. .............................. 62
Fig. 19: Progress of the ENS index over the las few years. ............................................. 64
Fig. 20: Cost arising from electrical disturbances [32]. .................................................. 69
Fig. 21:VoLL values in different European countries [34]. ............................................. 71
Fig. 22: Procedure that will be followed in order to calculate the “loss” due to interruptions of power supply in Spain between the years 2011-2014. ....................... 73
Fig. 23: Comparison between the total cost due to interruption of power supply and the money not earned by distribution companies due to interruptions of power supply. ........................................................................................................................................ 77
Fig. 24: Relation between the cost of the voltage sag and its duration......................... 78
Fig. 25: Power line insulator cleaning operation [34]. ................................................... 79
Fig. 26: Isolated distribution system where Ic is the discharge current due to capacitance of the healthy phases [35]. ......................................................................... 80
Fig. 27: Compensated system where IL counteracts Ic [35]. ............................................ 81
Fig. 28: An UPS system. The green light represents the power flow [36]. ..................... 82
Fig. 29: Flywheel [37]. ..................................................................................................... 82
Fig. 30: Flywheel energy storage system [39]. ............................................................... 84
Fig. 31: Simplified circuit of a Dynamic Voltage Restorer (DVR) [41]. ............................ 85
Fig. 32: Functioning of a VDF [42]................................................................................... 86
Fig. 33: Comparison between different energy storages according to its energy and power density [44]. ......................................................................................................... 88

Economic assessment of the impact of electricity storage on power quality in distribution systems Belén Rabadán Travesí, ICAI
20
Fig. 34: Natural and intensified greenhouse effect [45]. ............................................... 93
Fig. 35: Impact of the climate change depending on the increase of temperature [47]. ........................................................................................................................................ 94
Fig. 36: Map of Segovia where we can see where Pedraza is located [51]. ................... 97
Fig. 37: Evolution of the initial investment cost of installing an UPS storage system. 100
Fig. 38: Evolution of the initial yearly maintenance cost of installing an UPS storage system (%respect to the initial investment)................................................................. 101
Fig. 39: Graphical comparison between the total cost of interruptions and the total cost of the installation of an UPS system in Pedraza’s scenario. ................................. 104
Fig. 40: Map of Spain where we can see Madrid’s location [52]. ................................ 107
Fig. 41: Graphical comparison between the total cost of interruptions and the total cost of the installation of an UPS system in Madrid’s scenario. .................................. 111
Fig. 42: Example of the reaction that takes place in a Lead-Acid battery [39]. ........... 129
Fig. 43: Types of rechargeable batteries. ..................................................................... 131
Fig. 44: Reaction that takes place in the lead-acid batteries. [42]. .............................. 132
Fig. 45: Values for the specific energy and specific power of different types of batteries [38]. ............................................................................................................................... 136
Fig. 46: Inverter [45]. .................................................................................................... 137

Economic assessment of the impact of electricity storage on power quality in distribution systems Belén Rabadán Travesí, ICAI
21
LIST OF TABLES
Table 1: Supply voltage requirements of EN 50160. LV: Low Voltage (0-1kV), MV: Medium Voltage (1kV-30kV). ......................................................................................... 37
Table 2: Types of voltage swells [22]. ............................................................................. 49
Table 3: Classification of electrical disturbances according to their probability and importance of its effects [17]. ........................................................................................ 53
Table 4: Values of the SAIDI index over the last years depending on the type of zone [28]. ................................................................................................................................. 56
Table 5: Values of the SAIFI index over the last years depending on the type of zone [28]. ................................................................................................................................. 60
Table 6: Values of the ENS index over the last years [29]. ............................................. 63
Table 7: Total number of hours and interruptions accepted in MV (1kV-36Kv) in Spain depending on the type of zone according to the RD 1995/2000. .................................. 66
Table 8: Values of the VCR in dollars and in euros depending on the customer group [32]. ................................................................................................................................ 72
Table 9: Demand and price of the electricity in Spain between years 2011 and 2014 [29]. ................................................................................................................................. 73
Table 10: ENS, SAIDI and SAIFI indexes in Spain in years 2011-2014 [29]- [30]. ............ 73
Table 11: Cost of one hour of electricity in Spain between the years 2011-2014. ........ 74
Table 12: Total number of hours without power supply in Spain between 2011-2014. 74
Table 13: Money not earned by distribution companies due to interruptions of power supply in Spain between 2011-2014. ............................................................................. 75
Table 14: Total cost of interruptions that electrical companies have to pay. ............... 76
Table 15: Values of the VCS in dollars and in euros depending on the customer group [32]. ................................................................................................................................. 78
Table 16: Initial investment and yearly maintenance cost of the different solutions presented. ....................................................................................................................... 87
Table 17: Different values of the SAIDI and SAIFI indexes in a gathered rural zone (average value, average value multiplied by two, average value multiplied by five and average value multiplied by ten). ................................................................................... 97
Table 18: Total number of hours without power supply in Pedraza’s scenario with different values of the interruptions. ............................................................................. 99
Table 19: Total cost of interruptions of power supply in Pedraza’s scenario in one year with different values of the interruption. ...................................................................... 99
Table 20:Future initial investment and yearly maintenance cost for an UPS system. 101
Table 21:Energy needed from the UPS system in one year with different values of the interruption. ................................................................................................................. 102
Table 22: Initial investment and maintenance costs linked to the installation of an UPS system in Pedraza’s scenario. ....................................................................................... 102
Table 23: Comparison of the initial investment and maintenance cost over ten years depending on the length and duration of interruptions. ............................................. 103
Table 24: Comparison between the total cost of interruptions and the total cost of the installation of an UPS system in Pedraza’s scenario. ................................................... 103

Economic assessment of the impact of electricity storage on power quality in distribution systems Belén Rabadán Travesí, ICAI
22
Table 25: Yearly cost and two-monthly cost that each customer has to pay for the UPS’s installation in Pedraza’s scenario. ...................................................................... 105
Table 26: Different values of the SAIDI and SAIFI indexes in an urban zone (average value, average value multiplied by two, average value multiplied by five and average value multiplied by ten). ............................................................................................... 108
Table 27: Total number of hours without power supply in Madrid’s scenario with different values of the interruptions. ........................................................................... 108
Table 28: Total cost of interruptions of power supply in Madrid’s scenario in one year with different values of the interruption. .................................................................... 109
Table 29:Energy needed from the UPS system in one year with different values of the interruption. ................................................................................................................. 109
Table 30: Initial investment and maintenance costs linked to the installation of an UPS system in Madrid’s scenario. ........................................................................................ 110
Table 31: Comparison between the total cost of interruptions and the total cost of the installation of an UPS in Madrid’s scenario. ................................................................. 110
Table 32: Yearly cost and two-monthly cost that each customer has to pay for the UPS’s installation in Madrid’s scenario. ....................................................................... 112
Table 33: Comparison between the initial investment of an UPS system when we maintain fixed the cost of non-supplied energy and the cost of non-supplied energy when we maintain fixed the initial investment of the UPS system in a gathered rural and urban zone. ............................................................................................................ 114
Table 34: Comparison of the different types of batteries. ........................................... 135

Economic assessment of the impact of electricity storage on power quality in distribution systems Belén Rabadán Travesí, ICAI
23
CHAPTER 1:
INTRODUCTION

Economic assessment of the impact of electricity storage on power quality in distribution systems Belén Rabadán Travesí, ICAI
24
1. INTRODUCTION In this first chapter a general introduction to the project can be found.
Firstly, the importance of maintaining the quality of electricity will be expounded.
The main aspects of electrical quality will be given: quality of the customer service,
continuity of supply and power quality. The most representative aspects related to
power quality that affect voltage waveform and voltage stability will be explained.
Moreover, the regulation about quality of electricity is going to be presented.
Finally, the project’s structure and its main objectives will be given.
1.1. Distribution system
The electric system is the group of the necessary installations to generate, transport
and distribute the energy generated in the power plants to the consumers [1].
Therefore, it is composed by three different stages: generation, transportation and
distribution.
Fig. 1: Electric system [2].
An electric power distribution system is the final stage in the delivery of the
electricity power. In this stage the voltage is firstly reduced and then delivered to retail

Economic assessment of the impact of electricity storage on power quality in distribution systems Belén Rabadán Travesí, ICAI
25
customers that have no connection with the high voltage transmission system. The
distribution of the electric power is done by distribution networks and, depending on
the geographical location of the users, it can be done by overhead lines or by
underground cables. The main difference between these two types of lines is the cost,
underground cables are far more expensive than overhead lines so, underground cables
are only used when overhead lines cannot be. Consequently, underground cables are
normally used in large urban centers or in historical places, increasing network safety
and lowering the negative landscape impact of overhead lines.
As electricity cannot be easily stored it is produced and delivered on real time. This
means that, whenever and wherever electricity is consumed, it also has to be generated
at that same moment and somewhere nearby. Therefore, it is strictly necessary to
maintain a balance between the energy’s production and the energy’s consumption. It
is usual to keep generation a little bit above demand so that, if more energy is demanded
suddenly, the balance will not be highly altered and no outages will take place [3].
Moreover, the main power systems follow the N-1 or N-2 criteria which means they can
work properly without one or two elements of the network.
Electricity is produced in power stations where its main characteristics (voltage,
frequency, harmonics’ content…) are highly controlled. The problem is that, while the
power reaches the customer’s supply terminals, some variations can occur. Those
variations are caused by lightning, wind, pollution, user’s equipment… and they can
cause a big degradation in the performance of the electrical equipment. That’s the main
reason why, nowadays, every distribution company needs to maintain an electricity
quality in order to be allowed to provide power [4].
1.1.1. Quality of electricity
Quality of electricity is a measure of how an ideal power supply system should be.
There are various reasons why the quality of electricity has become a strategic issue for
electrical companies, but the main ones are: the economic necessity of increasing
competitiveness, the opening up of the electricity market and the widespread use of

Economic assessment of the impact of electricity storage on power quality in distribution systems Belén Rabadán Travesí, ICAI
26
equipment that is sensitive to voltage disturbances [5]. That’s why, the European Energy
Regulator working through the CEER (Council of European Energy Regulators) has
promoted the well-functioning and competitiveness of the EU energy markets.
Therefore, consumers can get fairy prices, the widest choice of energy suppliers and the
best possible quality.
As the possibility of storing electricity is very reduced nowadays, most of the energy
is consumed at the same instant it is generated. Therefore, it is strictly necessary to
measure its quality at the same point it is generated and while its being transmitted [6].
The quality of the electrical service can be divided in two main aspects: the quality
of customer service or commercial quality and the quality of supply which includes
power quality and continuity of supply. In order to measure the quality of the energy
various indexes are used, the most important ones will be then explained [7]. Indexes
allow us to compare the quality of different networks. They have to be kept to its
minimum value (meaning with this low disturbances) and they need to be
representative of the disturbance they are measuring.
Fig. 2: Quality of service [8].
Quality of service
Quality of customer service
Quality of supply
Continuity of supply: interruptions longer than 3
minutes
Power quality: supply voltage characteristics (freuency, magnitude,
symmetry and waveform)

Economic assessment of the impact of electricity storage on power quality in distribution systems Belén Rabadán Travesí, ICAI
27
1.1.1.1. Customer service
Quality of customer service or commercial quality refers to the treatment received
by the customers from the distribution company. It includes different aspects of the
relationship between the electricity companies and the users such as the supply, the
sale of electricity and the contact between the company and the customer. The most
concerning quality aspect is the timeliness of the service requested by the customers.
Depending on the country the definition of ‘timeliness’ may vary [7]. Even though
commercial quality is a very interesting index it will not be studied in this project.
1.1.1.2. Continuity of supply
Continuity of supply alludes to the interruption in electricity supply, those events in
which the voltage drops to zero. Moreover, the continuity of supply implies that there
is electricity available for all of the network users at all times.
Regarding to the nature of the interruption we can differentiate among planned,
unplanned and exceptional interruptions:
1) Planned interruptions: interruptions for which network users are
informed in advance. They usually happen when the system operator
intentionally switches a circuit breaker leaving part of the network
without energy [9]. In Spain, planned interruptions are the one declared
by a distribution company 72 hours in advance to the Regional
Government and authorized by them [7].
2) Unplanned interruptions: on the opposite to the planned ones, the users
are not informed in advanced. They are due to unpredictable events like
the failure of components.
3) Exceptional events: natural disasters like hurricanes or earthquakes.
Regarding to the duration of the interruption we can distinguish among short (less
than three minutes), long (more than three minutes) and transient (few seconds)
interruptions.

Economic assessment of the impact of electricity storage on power quality in distribution systems Belén Rabadán Travesí, ICAI
28
In order to measure the continuity of supply different indicators are used, the most
used ones are the SAIDI, the SAIFI and the ENS. These indexes will be deeply explained
in chapter number 2.
The indexes mentioned above are reliability indexes. We can understand by
reliability the ability of a system to function for a concrete period of time under specific
characteristics. So, the reliability of power support is related to the ability of providing
customers with continuous and non-disturbed service.
In reliability engineering the bathtub curve is widely used to express how the
electrical system and its components work with time.
Fig. 3: Bathtub curve [10].
This curve comprises three parts:
- Part I: this part is a rapidly decreasing failure rate. It receives the name of
Burn-in period and it is characterized by failures due to manufacturing
details. In the electrical power system this part of the curve can be due,
for example, to a wrong installation of cables.
- Part II: this part is a constant failure rate due to random failures. This part
of the curve represents the useful life of the electrical system. The failures
that are represented in this part of the curve are failures due to random

Economic assessment of the impact of electricity storage on power quality in distribution systems Belén Rabadán Travesí, ICAI
29
events such as the falling of a tree, the impact of a lightning into an
electrical line…
- Part III: this part represents an increasing failure rate. It is known as wear-
out failures. It is caused by the aging and deterioration of the equipment.
Modern electronic equipment is made up of semiconductor devices that
have no real short-term wear out mechanism. Because of that, the part
III of the bathtub curve of the electrical system is practically flat, as
failures caused by electronic equipment don’t have to be considered.
Consequently, we can consider that the reliability curve followed by the electrical
power system is a bathtub curve with a flat third part.
Continuity of supply is a very important issue nowadays as an interruption of
power in a city can be the cause several incidents, for example:
- Interruption of water supply in buildings, as the water pumps need
electricity to function
- Stoppage of electrical vehicles such as trains
- Chaotic traffic as power is needed for the working of traffic lights
- Important economic impact as the production in industries may be totally
stopped
Due to this we can affirm that continuity of supply is crucial. Interruptions of
power supply, that affect continuity, will be studied in this project.
1.1.1.3. Power quality
Power quality is defined in the IEEE 100 Authoritative Dictionary of IEEE Standard
Terms as “the concept of powering and grouping electronic equipment in a manner that
is suitable to the operation of that equipment and compatible with the premise wiring
system and other connected equipment. Utilities may want to define power quality as
reliability” [11]. So, it refers to both the disturbances and the deviations in voltage
magnitude or waveform from the optimal values.

Economic assessment of the impact of electricity storage on power quality in distribution systems Belén Rabadán Travesí, ICAI
30
Power quality includes the variation of voltage, current and frequency.
Historically, most of the power equipment has worked, without big problems, with
fluctuations of those three parameters. The problem is that currently most of the
equipment used cannot function properly with those fluctuations as they are more
sensible to them that the ones used before [12]. Therefore, power quality is an
important matter for electricity consumers especially for industries and the services
sector.
Moreover, as currently sensitive power electronic equipment and non-linear
loads are used in industrial, commercial and domestic applications power quality is
becoming one of the most technically-complex part of quality of electricity supply and
it is also becoming one of the most important issues dealt with by the different countries
[7]. It is estimated that the cost of the losses due to power quality comes to 150 billion
€ in Europe and 119-188 billion $ in US [13]. So, poor power quality has also a big
economic impact.
Furthermore, power quality is a very complex matter of study as three parties
are in charge of it:
1. Producer of energy and operator of the system: they are in charge of
producing energy that satisfies the necessary requirements. They also need
to meet instantaneously the energy demanded at each moment by the
network users.
2. Manufacturer of electrical equipment: they need to provide the market with
equipment that sends out the lowest level of disturbances to the network.
Also, it is mandatory for this equipment to be robust enough to support the
already existing disturbances in the network. The EN 61000 specifies that it
is necessary to study the electromagnetic compatibility of the equipment so
that, there is a limited generation of disturbance and tolerance towards a
specified level of disturbance [8]. Manufactures, in order to know if they are
doing it correctly, can then ask themselves ‘How good is good enough for
electrical equipment? This question is impossible to answer. As it may be

Economic assessment of the impact of electricity storage on power quality in distribution systems Belén Rabadán Travesí, ICAI
31
really easy to determine the behavior of the equipment against some
disturbances like voltage dips it is not as easy to determine how it will react
against other disturbances like harmonic distortion [14].
3. Network user: they are responsible for selecting and installing the necessary
equipment to limit the disturbances introduced in the network. They are also
responsible for installing equipment to prevent the interruption of the
electrical energy (such as UPS) if it is necessary [15].
As it is stated the power quality depends on these three parties and the relation
between them. Quality standards are fixed (they will be explained at the end of this
chapter) and, in order to keep them, the supply system, the manufactures of the
electrical equipment and the network users have to be coordinated.
Aspects related to power quality can be classified into two categories: voltage
stability and voltage waveform.
Voltage stability
Voltage stability refers to the limits of voltage and frequency that cannot be
overpassed. Among the disturbances that affect voltage stability we find:
Over-voltage: raising of the voltage above its upper designed limit caused by line
faults and large load disconnections. Some of the effects caused are the
malfunctioning of the elements connected to the system and the damaging of the
insulation of the electric equipment [8].
Voltage Sag or Voltage Dip: sudden and brief voltage drop caused by faults in order
lines. Among its effects we can find the malfunctioning of electronic and protection
equipment, the change in the speed of motors, faults and errors in computerized
processes… [8].
Voltage Swell: opposite of the voltage sag or voltage dip, it is an increase in voltage
caused when a heavy load turns off in a power system.

Economic assessment of the impact of electricity storage on power quality in distribution systems Belén Rabadán Travesí, ICAI
32
Voltage fluctuations: they are variations in the RMS value or in the peak value with
an amplitude less than 10% of the nominal voltage. They are mainly due to rapidly
varying industrial loads like arc furnaces or rolling mills [5].
Flicker: changing in the intensity of the illuminated flow that affects the human
vision. It is usually generated by fluctuations in the electrical network caused by
loads whose active and reactive power demand change constantly.
Voltage waveform
As its own name indicates, voltage waveform refers to the form of the voltage wave.
The main disturbances that can affect this are:
Unbalance: event that takes place when, in a three-phase system, the RMS values of
each phase are different or their dephasing is different to ±120º. This can be caused
by large single-phase loads, unbalanced three phase loads or unbalanced load
distribution. It can be the cause of an increasing in the energy losses, the
malfunctioning of electronic equipment, the reduction of power transfer and the
braking torques and overheating of rotating machines [8].
Harmonics: they are sinusoidal voltages with frequencies k times the fundamental
frequency (50Hz). The origins of these disturbances are: loads with no sinusoidal
currents, industrial loads such as rectifiers or arc furnaces and domestic loads like
TV sets or fluorescent lamps. Its main effects are: the increasing of losses, electrical
energy measurement errors, interferences in the telecommunication systems,
overheating of motors and capacitates and the malfunctioning of control and
protection electronic equipment [8].
Notch: recurring power quality disturbance that occurs when current is commutated
from one phase to another. It is caused by the normal operations of power electronic
devices.

Economic assessment of the impact of electricity storage on power quality in distribution systems Belén Rabadán Travesí, ICAI
33
Fig. 4: Some of the disturbances that affect voltage quality [5].
In order to study and fix these disturbances it is necessary to know their causes,
effects and how to measure and avoid them. A deeper study on the most important
disturbances can be found in chapter number 2.
1.2. Regulation
As electricity is a product it should satisfy some quality requirements. Therefore, it
is desired that the electrical energy is supplied at a constant frequency and magnitude
and with a perfect sine wave [15].
The EN 50160 is the European Standard in charge of establishing the voltage
parameters of the electrical energy in public distribution systems. This standard
establishes general limits for the supplier to maintain in public distribution systems.
It is important to clarify that the EN 50160 deals with the supply voltage whereas
the EMC standard EN 61000 refers to the utility voltage. The supply voltage is the line-
to-line or line-to-neutral voltage in the point of common coupling. The point of common
coupling, PCC, is defined by the IEEE 519 “Standard Practices and Requirements for

Economic assessment of the impact of electricity storage on power quality in distribution systems Belén Rabadán Travesí, ICAI
34
Harmonic Control in Electrical Power Systems” as the interface between loads and
sources in the electrical system. On the other hand, the utility voltage is the line-to-line
or line-to-neutral voltage at the plug of the electrical device [6]. As this project refers to
the supply voltage only EN 50160 will be presented.
In order to understand the EN 50160 standard is necessary to know the meaning of
some parameters:
- Supply voltage: RMS value of the voltage at a given moment at the PCC,
measured over a given time interval.
- Nominal voltage of the system (Un): voltage by which a system is designated or
identified and to which certain operating characteristics are referred.
- Declared supply voltage (Uc): it is normally the nominal voltage of the system.
- Normal operating condition: the condition of meeting a load demand, systems
switching and clearing faults by an automatic protection system in the absence
of exceptional conditions due to external influences or major events.
- Voltage variation: increase or decrease of voltage, due to variations of the total
load of the distribution system or a part of it.
- Supply voltage dip: sudden reduction of the supply voltage to a value between
90% and 1% of the declared UC, followed by a voltage recovery after a short
period of time.
- Supply interruption: is a condition in which the voltage at the supply terminals is
lower than 1% of the declared voltage UC.
- Temporary power frequency overvoltage: overvoltages that have a relatively
long duration, usually for a few periods. They are mainly originated from
switching operations or faults, e.g. sudden load reduction, or disconnection of
short circuits.
- Transient overvoltages: are oscillatory or non-oscillatory, highly damped, short
overvoltages with a duration of a few milliseconds or less, originating from
lightning or some switching operations, for example a switch-off of an inductive
current.
Economic assessment of the impact of electricity storage on power quality in distribution systems Belén Rabadán Travesí, ICAI
35
- Harmonic voltage: a sinusoidal voltage with a frequency equal to an integer
multiple to the fundamental frequency of the supply voltage.
- Interharmonic voltage: is a sinusoidal voltage with frequency between the
harmonics, i.e. the frequency is not an integer multiple of the fundamental.
- Voltage unbalance: is a condition where the RMS value of the phase voltages or
the phase angles between consecutive phases in a three-phase system are not
equal [8].
Moreover, it is important to clarify that the EN 50160 only applies under normal
conditions. Therefore, the following ones are excluded:
- Conditions arising as a result of a fault or a temporary supply condition.
- In the event of the failure of a customer’s installation or equipment to comply
with the relevant standards or with the technical requirements for the
connection of loads.
- In the events of the failure of a generator installation to comply with relevant
standards or with the technical requirements for interconnection with an
electricity distribution system.
- In exceptional situations outside the electricity supplier’s control such as:
- Exceptional weather conditions and other natural disasters
- Third party interference
- Actions of public authorities
- Industrial action (subject to legal requirements)
- Force majeure
- Power shortages resulting from external events
It is important to note that, during any of those abnormal conditions, the power
supply should be maintained to as many customers as possible, even if some of the
voltage characteristics are deteriorated. This if preferred to completely interrupting the
supply.
All the information included in EN 50160 corresponds to the general limits that are
technically and economically feasible for the energy supplier in a region. If, for any

Economic assessment of the impact of electricity storage on power quality in distribution systems Belén Rabadán Travesí, ICAI
36
reason, a consumer requires tighter conditions then he will have to come to terms with
the supplier.
The requirements included in the standard EN 50160 are presented in the following
table number 1 and some of them are also shown graphically in figure number 5.
Number Parameter Supply Voltage characteristics according to EN
50160
1 Power frequency LV, MV: mean value of fundamental measured over
10s
±1% (49.5 − 50.5 𝐻𝑧) for 99.5% of week
−6% +4⁄ % (47 − 52 𝐻𝑧) for 100% of week
2 Voltage magnitude variations LV, MV: mean value of fundamental measured over
10s
±10% for 99.5% of week, mean 10 minutes RMS
value
3 Rapid voltage changes LV: 5% normal
10% frequently
𝑃𝑙𝑡 ≤ 1 for 95% of the week
MV: 4% normal
6% frequently
𝑃𝑙𝑡 ≤ 1 for 95% of the week
4 Supply voltage dips Majority: duration <1s, depth<60%
Locally limited dips caused by load switching on:
LV: 10-50%, MV:10-15%
5 Short interruptions of supply
voltage
LV, MV (up to 3 minutes): few tens-few
hundreds/year
Duration 70% of them <1s
6 Long interruptions of supply
voltage
LV, MV (longer than 3 minutes)
<10-50/year
7 Temporary, power frequency
overvoltages
LV: <1.5 kV RMS

Economic assessment of the impact of electricity storage on power quality in distribution systems Belén Rabadán Travesí, ICAI
37
MV: 1.7 Uc (solid or impedance earth)
2.0 Uc (unearthed or resonant earth)
8 Transient overvoltages LV: generally, <6kV, occasionally higher; rise time:
ms-µs
MV: not defined
9 Supply voltage unbalanced LV, MV: up to 2% for 95% of week, mean 10 minutes
RM values,
Up to 3% in some locations
Table 1: Supply voltage requirements of EN 50160. LV: Low Voltage (0-1kV), MV: Medium Voltage (1kV-30kV).
Fig. 5: The most important parameters of standard EN 50160 in graphical form [15].

Economic assessment of the impact of electricity storage on power quality in distribution systems Belén Rabadán Travesí, ICAI
38
1.3. Objectives
The main objective of this project is to analyze the technical and economic impacts
that poor quality of electricity, and especially poor continuity of supply, have on the
customers of electrical distribution companies. The current Spanish regulation on
electrical supply quality will be reviewed too. Moreover, the different solutions to avoid
electrical disturbances are also going to be studied.
An economic study of the impact of climate change on electrical disturbances will be
carried out in order to study if the installation of an UPS storage system is economically
profitable for electrical distribution companies or not.
1.4. Structure
The structure followed in this project will now be presented.
In this Chapter a general introduction to the quality of electricity and its regulation
can be found.
In next Chapter, we will deeply study the electrical disturbances: definition, types,
causes, effects and how to measure them. Who is responsible for them can also be
found.
Then, in Chapter 3 the electrical disturbances from an economic point of view will
be presented. We will study the cost arising from electrical disturbances and the cost of
the different technical solutions to avoid them in order to determine which solution is
the best in economic terms.
In Chapter 4, how the climate change will affect electrical disturbances will be
studied. There, two scenarios will be presented in order to know the differences
between them and if it is or not economically profitable to install a storage system.
In Chapter 5 the conclusions of the project will be exposed.
Finally, Chapter 6 and Chapter 7 are bibliography and annexes.

Economic assessment of the impact of electricity storage on power quality in distribution systems Belén Rabadán Travesí, ICAI
39
1.5. Conclusion
Once this chapter has been finished, the concept of power quality has been
introduced. The quality of electricity is divided in two main aspects: the quality of the
customer service and the quality of the power supply including the power quality and
the continuity of supply. As it is an important feature of power it is regulated by the law.
As it is stated power quality has a huge impact not only economically but also
technically as there are some devices that require a certain quality in order to work
properly. So, if those requirements are not fulfilled, then introducing storage devices in
the system may be necessary. Those devices will be studied in next chapter.

Economic assessment of the impact of electricity storage on power quality in distribution systems Belén Rabadán Travesí, ICAI
40

Economic assessment of the impact of electricity storage on power quality in distribution systems Belén Rabadán Travesí, ICAI
41
CHAPTER 2:
ELECTRICAL
DISTURBANCES

Economic assessment of the impact of electricity storage on power quality in distribution systems Belén Rabadán Travesí, ICAI
42
2. ELECTRICAL DISTURBANCES
The two main objectives of quality of supply in a power system operation should be:
1. Security and stability of the system
2. Reliability and quality of the supply
Nowadays, almost every average consumer receives the amount of energy
demanded but the quality and reliability of that energy may vary over time and
depending on the region. Quality issues can be accepted in part or the world while in
others the power quality requirements are increasing. So, currently some customers
expect higher-quality and continuity of electrical power supply with reductions in the
interruptions and other disturbances like harmonics [16].
Therefore, in order to fulfill these requirements, it is necessary to study the causes,
effects and possible solutions that cause not accomplishing them.
An electrical disturbance is caused by a change in the normal conditions of the
electrical power system. This change of conditions can be the result of accidental (a
lightning’s impact on a transmission line) or scheduled (the disconnection of a hydro-
electric power plant in order to improve it) events. Therefore, when studying electrical
disturbances, it is important to distinguish between these two type of causes as, the
effects caused by the intentional ones can be partly avoided. Moreover, if the
interruption of power is due to premeditated causes the users should be informed in
advance.
2.1. Definition of some electrical disturbances
As it has been mentioned before, quality of supply includes continuity of supply and
power quality. Among all of the existing disturbances short and long interruptions,
voltage dips and swells will be studied deeply in this chapter. Any interruption of power
supply causes a change in the normal conditions of the electrical system so, there is a
transient during which the electrical conditions of the system pass from one steady-

Economic assessment of the impact of electricity storage on power quality in distribution systems Belén Rabadán Travesí, ICAI
43
state to another. The causes and effects of supply voltage variations will be also
presented.
In figure number 6 we can find the different disturbances that are going to be
analyzed in this chapter. They are classified depending on the area of quality of supply
that is affected by them: voltage quality or continuity of supply.
Fig. 6: Electrical disturbances that are going to be studied classified by the area of quality of supply that is affected
by them.
2.1.1. Supply voltage variations
Supply voltage variations are increases or decreases of the voltage value. They
are usually caused by load variations.
2.1.1.1. Causes
If the electrical system were perfect, the value of the voltage in the different
points of the electrical system would only depend on the transforming relations of the
transformers. But, as the lines and the transformers on the electrical network have an
internal impedance, there is current that flows through those impedances. That flow of
current produces voltage’s drops in the net. On the other side, if the loads were
Electrical disturbances
Disturbances that affect voltage quality
Short interruptions (less than three minutes)
Supply voltage variations
Voltage dip
Voltage swell
Disturbances that affect continuity of supply
Long interruptions (more than three minutes)

Economic assessment of the impact of electricity storage on power quality in distribution systems Belén Rabadán Travesí, ICAI
44
constant, the voltage drop would be constant too so there will not be voltage variations
so the load’s voltage would only depend on the AT voltage. The main problem is that
the loads in the electrical network are variable, they change hourly depending on the
exterior temperature, humidity, the hour of the day, if it’s a weekday or a weekend day…
These loads variations are the sources of the voltage variations in the different loads
[17].
Fig. 7: Equivalent monophasic scheme of the electrical network.
2.1.1.2. Effects
The effects of voltage variations are numerous depending on the load. For
example, if the load is a lamp, over-voltages will reduce its life while under-voltages will
increase it. In induction motors it will cause alterations in its starting torque and
percentage slip. It will also affect the amount of reactive power given by capacitors as it
depends of the voltage [18] .
2.1.2. Voltage dips
A voltage dip or voltage sag is a sudden and brief reduction of the voltage in an
or all of the electrical phases. It happens when the RMS of voltage decreases between
its 10 and 90% of nominal voltage and it recovers after a short period of time (normally
between 10ms and a few seconds).

Economic assessment of the impact of electricity storage on power quality in distribution systems Belén Rabadán Travesí, ICAI
45
Fig. 8: Voltage dip [19].
We can distinguish between balanced and unbalanced voltage sags. The first are
the ones that affect equally to the three phases maintaining the 120º angle between
them. When an unbalanced voltage dips occurs the fault affects differently to the three
phases so the angle between them doesn’t remain always the same. The unbalanced
voltage dips are more frequent in the real world than the balanced ones.
It may seem obvious that the voltage dip takes place in the peak of the sine wave
or near it as there is more energy at that moment. But, researches have demonstrated
that the dip initiation is a random thing [16]. Moreover, depending on where the voltage
dip takes place there may be a change in the voltage waveform. As we can see in figure
number 9 if the dip happens in the zero crossing of the wave it will maintain its symmetry
while it occurs somewhere else, it will not. There can also be a change in the phase of
the sine wave depending on the fault’s current and the value of the impedance of the
transmission line where the voltage dip takes place.

Economic assessment of the impact of electricity storage on power quality in distribution systems Belén Rabadán Travesí, ICAI
46
Fig. 9: Waveform change in two voltage dips starting at a different moment [16].
2.1.2.1. Causes
The electrical power system has a non-zero impedance therefore, any increase
in the current’s value causes a reduction in the voltage’s value (Ohm’s law). These
reductions are usually small hence the voltage remains within the regulated tolerances.
The problem is that, when there is an increase in the current or in the value of the
system’s impedance, the voltage can drop considerably. It is more unlikely for the
impedance to increase than for the current so, voltage dips are usually caused by
increases in the second one. Therefore, the main causes of increasing the current (and
consequently of voltage dips) are:

Economic assessment of the impact of electricity storage on power quality in distribution systems Belén Rabadán Travesí, ICAI
47
- Starting a large load, usually industrial ones like motors
- Defective wiring
- Faults caused by lightning, tree contact, birds… in the transmission lines
As we can assume from the information shown above, the majority of the voltage
dips are caused in the distribution and transmission lines so, they are responsibility of
the energy supplier.
Fig. 10: Voltage dips with its different causes [20].
In order to describe the power system’s behavior is usual to compare it to a tree:
the trunk is the substation where the voltage is fixed, the branches are the transmission
lines and the leaves are the customer’s loads. Any voltage dip in the trunk or in any of
the branches leading to the leaf will have a negative effect in the leaf (the customer’s
load). Similarly, if there is any problem in one of the loads or one of the distant branches,
this could cause a decrease in the voltage of the trunk, provoking also a voltage dip in
the leaves. So, even faults that take place far in the tree can cause a voltage dig in a leaf
on the other side of the tree [19].
Whenever a fault takes place the electrical protections are in charge of
recognizing the fault and isolating it in a short amount of time. During the time that it
takes them to clear up the fault the voltage dips occurs so, the extent of voltage dips
depends on the reclosing capability of the protections.

Economic assessment of the impact of electricity storage on power quality in distribution systems Belén Rabadán Travesí, ICAI
48
2.1.2.2. Effects
The effects of the voltage dip in the power systems are various and more harmful
when the decrease of the voltage is deeper. As the voltage dip is a brief disturbance,
only the sensitive equipment will be affected by it. During a voltage dip the energy that
is supposed to reach the loads doesn’t reach them so, depending on the type of load the
consequences may or not be important. For example, if a motor doesn’t receive the
required energy it will obtain it from the inertia of the drive, causing its stalling.
Other effects are the tripping of sensitive equipment, instantaneous dimming of
lamps and the resetting of control system [14].
2.1.1. Voltage swell
A voltage swell is rapid increase in the RMS value of the voltage, usually phase to
neutral, above its nominal value ranging from 1.1pu to 1.8pu and that last for half a cycle
up to one minute. We can say that they are the opposite to voltage dip but much less
common.
Fig. 11: Voltage swell [21].
Depending on its magnitude and duration voltage swells can be subdivided in
three categories:

Economic assessment of the impact of electricity storage on power quality in distribution systems Belén Rabadán Travesí, ICAI
49
Type of voltage swell Magnitude Duration
Instantaneous 1.1-1.8pu 0.5-30 cycles
Momentary 1.1-1.4pu 30 cycles-3s
Temporary 1.1-1.2pu 3s-1min
Table 2: Types of voltage swells [22].
2.1.1.1. Causes
The main causes of voltage swells are the line faults, switching off and on large
loads and the energization of capacitor banks.
2.1.1.2. Effects
The effects of the voltage swells are often less noticeable but more destructive
than the voltage dip ones. Consequences from voltage swells are: malfunctioning of
electrical equipment, control problems and hardware failure in the equipment and
possible damaging of the equipment’s insulation due to its overheating.
2.1.2. Shorts interruptions
A short interruption of the voltage supply includes a supply voltage under 10%
for a period less than three minutes [8]. This is a more general definition than the given
by the standard EN50160 that considers short interruptions the ones with a supply
voltage under 1% of the declared voltage supply.

Economic assessment of the impact of electricity storage on power quality in distribution systems Belén Rabadán Travesí, ICAI
50
Fig. 12: Short interruption of power supply in which the voltage drops to zero [19].
2.1.2.1. Causes
A short interruption is similar to a voltage dip where, instead of the RMS
decreasing between the 10%-90% of its nominal value, the decrease is complete. Short
interruptions are usually accidental and caused mainly by short-circuits. They can also
be caused by electrical overloading but this is not so common. The causes of the short-
circuits can be divided into two sections:
- Incidents in the lines’ insulation: they depend on the characteristics of the place.
As it has been mentioned at the beginning of this project underground lines are
usual in large urban centers or in historical places while overhead ones are used
in more rural environments. As the insulation of the underground cables can only
be damaged by drillings or excavators, overhead lines are the ones that suffer
more incidents in their insulation. Those incidents are caused by contamination,
gales, falling of trees, high salinity…
- Overvoltages that overtake the networks’ insulation: the main origin of these
overvoltages are the storms’ lightings. The overvoltages produced by lightings
can be of millions of volts [17].

Economic assessment of the impact of electricity storage on power quality in distribution systems Belén Rabadán Travesí, ICAI
51
2.1.2.2. Effects
The consequences of short interruptions are similar to the ones caused by
voltage dips. Therefore, they may cause the following issues:
- Stoppage of sensitive equipment like PLC, computers…
- Tripping of protective devices
- Loss of data
- Problems in motors start-up
- Arc lightning switch off
- Malfunctioning of data processing equipment
- Overheating of engines producing an accelerated aging of its insulation
2.1.3. Long interruption
Long interruptions occur when the voltage drops to zero during a period of
time longer than three minutes.
2.1.3.1. Causes
The causes of long interruptions are always the outage of equipment. This outage
can be due to three different reasons:
- Fault that occurs in the electrical system and needs human intervention in order
to fix it.
- Incorrect intervention of a protection causing a component outage.
- Operator action: currently it is possible to do live-line working in order to
maintain the continuity of supply while fixing some of the components of the
electrical network. But, due to security reasons, there are certain works than
cannot be done by live-line working so, during those events is necessary to
isolate the section where the maintenance work is taking place. As it has been
mentioned before, the distribution system should follow the N-1 or N-2 criterion.
So, even if one of the elements is not available the power supply shouldn’t be

Economic assessment of the impact of electricity storage on power quality in distribution systems Belén Rabadán Travesí, ICAI
52
interrupted. The problem is that it is not always possible to constantly maintain
all the power supply.
If these events take place in a part of the system that is not redundant (so the
necessary energy cannot be provided to the customers by another part of the
system) a number of pieces or equipment will not have power while the problems is
being solved [23].
2.1.3.2. Effects
The consequence of a long interruption will be the stoppage of all the equipment
as they don’t receive the necessary energy to work.
2.2. How frequent are electrical disturbances?
As it has been previously presented during the last few years the amount of
disturbances in power supply have highly increased. This is due, mainly, to the
widespread use of electronic equipment that doesn’t fulfill the necessary requirements
to avoid the generation of disturbances. Even though, all these electric disturbances
have a big economic impact as they mean losses, not all of them are equally common.
Therefore, in order to make an accurate economic evaluation it would be necessary to
assess the expected number of disturbances in a specific period of time. This assessment
can be done by three different ways:
- Predicting the amount of disturbances and its length. In order to do so,
Stochastic prediction methods are used. The accuracy of these methods
depends on the accuracy of the model and data used. As some of the electric
disturbances are caused by random phenomena, the data used in this type
of models is not always the most precise.
- Uninterrupted monitoring in order to measure at all times the characteristics
of the voltage: frequency, harmonics, vale… Monitoring is a method used to
detect voltage variations such as flickers, harmonics, voltage unbalances… In
Spain the law requires to monitor the voltage levels at all times.

Economic assessment of the impact of electricity storage on power quality in distribution systems Belén Rabadán Travesí, ICAI
53
- Trigger-mechanism that starts recording when the relevant characteristics
exceed a specific value, for example, when a sudden reduction of the voltage
takes place. This mechanism is mainly used for detecting voltage dips, swells
and transient over-voltages [24].
As it may seem obvious neither the probability of the electric disturbances nor
the importance of its effects is the same. In table number 3 we can find the different
electrical disturbances studied before according to their probability and the importance
of their effects.
Importance of its effects Probability
Supply voltage variations Low Low
Voltage dip Medium Very high
Voltage swell Medium Low
Short interruption High High
Long interruption Very high Medium
Table 3: Classification of electrical disturbances according to their probability and importance of its effects [17].
As we can see in the table number 3 supply voltage variations have a low probability
of occurring and their effects are not as dangerous as the effects caused by the other
disturbances. So, even though they impose costs on customers, its economic impact will
not be studied as the costs of the other disturbances are much severe. Moreover,
voltage swells will not be analyzed in deep detail because they rarely occur and the
impact they have is not very important.
It has been previously explained that we can divide the quality of supply into three
main aspects: continuity of supply, voltage quality and commercial quality. Depending
on the type of disturbance the area of quality of supply affected is different. Therefore,
we will classify the disturbances by this criterion. Voltage dips, voltage swells and short
interruptions affect the voltage quality while long interruptions affect the continuity of
supply.

Economic assessment of the impact of electricity storage on power quality in distribution systems Belén Rabadán Travesí, ICAI
54
2.3. How to measure continuity of supply
Continuity of supply is the area of quality of supply that studies how the long
interruptions (understanding by long interruptions the ones that last longer than three
minutes) affect the quality of the electricity. Therefore, continuity of supply represents
the availability of energy; if electricity is not available at a certain moment then we refer
to it as an interruption. It has been explained before that the electric power system is a
reliable one, this means that the duration of interruptions is just some hours per year,
so the system achieves its function the majority of time. Even so, electrical distribution
companies use indexes in order to measure how reliable the system is. Then, once the
indexes have been calculated, they use them to implement new strategies in order to
improve the continuity. Among the strategies we can find: a change in the topology of
the system, reinforcement of some elements…
We can distinguish to main types of indexes: individual or client indexes and system
indexes.
Individual indexes reflect the quality level that an individual client experiments. Even
though these indexes represent perfectly the state of the system they are not commonly
used as they require a high volume of calculations. Electrical companies are starting to
use these indexes as they represent better the singular quality of each client so that the
company can perfectly know if all of the clients have the correct quality.
On the other hand, system indexes reflect the quality of the whole power system in
a particular region. They are usually a weighted average of the individual indexes of the
clients in that region so, they represent in a compact and easy way the behavior of the
electrical system. But, there are also disadvantages when using these indexes because,
as they are an average, there may be clients with quality levels much lower than the
average and that cannot be accepted [25].
Among the system indexes we can find the ones that were presented in the first
chapter of this project. Those indexes are: SAIDI, SAIFI and ENS. They will be explained
above.

Economic assessment of the impact of electricity storage on power quality in distribution systems Belén Rabadán Travesí, ICAI
55
The different distribution companies are in charge of providing information to the
government of each country in order to calculate the value of these indexes to know
how reliable is the energy in each country. Details on the value of these indexes in Spain
can be found below but before that it is important to clarify that the Spanish regulation
divides the Spanish territory in four types of zones:
- Urban: towns with more than 20.000 points of supply.
- Semi-urban: towns with a number of points of supply between 2.000 and
20.000.
- Gathered rural: towns with a number of points of supply between 200 and
2.000.
- Scattered urban: towns with less than 200 points of supply and points of
supply located outside of the population centers that are not industrial nor
population sites.
The Spanish territory is divided in zones depending on the population as the
electrical network is configured in a different way depending on the location. The rural
network is characterized for being arranged like a tree where each customers receives
the energy from only one source of supply. By contrast, customers of the urban network
usually receive the power from different sources that work in parallel.
Fig. 13 : Urban network on the right side of the image and rural network on the left side [26].

Economic assessment of the impact of electricity storage on power quality in distribution systems Belén Rabadán Travesí, ICAI
56
2.3.1. SAIDI
SAIDI (System Average Interruption Duration Index) is the average duration
interruption of service for each customer of the electrical company [27]. The SAIDI is
usually calculated monthly or yearly but it can actually be calculated for any period of
time. This index is usually measured in hours.
𝑆𝐴𝐼𝐷𝐼 = 𝑠𝑢𝑚 𝑜𝑓 𝑎𝑙𝑙 𝑐𝑢𝑠𝑡𝑜𝑚𝑒𝑟𝑠′𝑖𝑛𝑡𝑒𝑟𝑟𝑢𝑝𝑡𝑖𝑜𝑛 𝑑𝑢𝑟𝑎𝑡𝑖𝑜𝑛
𝑡𝑜𝑡𝑎𝑙 𝑛𝑢𝑚𝑏𝑒𝑟 𝑜𝑓 𝑐𝑢𝑠𝑡𝑜𝑚𝑒𝑟𝑠 𝑠𝑒𝑟𝑣𝑒𝑑=
∑ 𝑈𝑖 ∗ 𝑁𝑖
∑ 𝑁𝑖
Where Ui represents the annual failure rate and Ni the number of clients in point i.
So, this index represents the average amount of time during which energy was not
supplied to the customers in a certain period of time.
In the table number 4 and figure number 14 we can find the value of the SAIDI
index from 2003 to 2014 in Spain depending on the zone. We can also find its average
value over those years and a ‘total’ value of each of the indexes that is calculated by
doing a weighted average depending on the population of each zone.
Table 4: Values of the SAIDI index over the last years depending on the type of zone [28].
Zone
Year Total Urban Semi-urban Gathered rural Scattered rural
2003 2,861 1,714 3,285 4,159 7,881
2004 2,422 1,541 2,464 3,589 6,373
2005 2,186 1,444 2,306 3,127 5,008
2006 2,044 1,194 2,161 3,797 4,587
2007 1,930 1,224 2,018 3,409 4,206
2008 1,628 0,932 1,765 2,877 4,014
2009 2,369 1,077 2,790 4,851 5,693
2010 2,495 1,205 2,928 4,362 7,725
2011 1,120 0,671 1,163 1,982 3,364
2012 1,053 0,656 1,063 1,843 2,539
2013 1,623 0,616 1,241 3,658 3,508
2014 1,056 0,594 1,002 1,375 3,202
1,899 1,072 2,016 3,252 4,842 Average

Economic assessment of the impact of electricity storage on power quality in distribution systems Belén Rabadán Travesí, ICAI
57
Fig. 14: Progress of the SAIDI index over the las few years.
From the information presented above we can obtain the following conclusions:
- The progress of the SAIDI index is descending, except for a big peak in 2010.
This is thanks to the improvements in the power distribution system:
automatization of the processes, usage of high efficiency equipment,
monitoring of the electric signals…
- The urban zone is the one with the smallest SAIDI’s values. As it has been
explained before the urban customers receive the power from different
sources so, if any of these sources fails, they can still receive the power from
elsewhere.
- The scattered rural zone and the gathered rural are the ones with the highest
SAIDI’s values. This also due to the disposition of this type of network where
the clients receive power only from one source. So, when there is a problem
in that source, they cannot receive energy from elsewhere as it happens with
the urban zones.
0
1
2
3
4
5
6
7
8
9
2003 2004 2005 2006 2007 2008 2009 2010 2011 2012 2013 2014
Nu
mb
er
of
ho
urs
wit
ho
ut
en
erg
y
Year
SAIDI
Total
Urban
Semi-urban
Gathered rural
Scattered rural

Economic assessment of the impact of electricity storage on power quality in distribution systems Belén Rabadán Travesí, ICAI
58
- As the population in the rural zones is much less than the population in the
urban zones, installing in the rural areas a more interconnected network
doesn’t economically compensate the electrical companies.
2.3.1.1. SAIDI in different European countries
In figure number 15 we can find the progress of the SAIDI index (or the
corresponding index used in each country in order to measure the amount of time
without power supply) in different European countries over the last few years. As we
can see Spain (in light green color) is not among the countries with less minutes lost per
year but it has been improving over the last years.
Moreover, we can perceive that the most industrially developed countries, such
as Germany and the Netherlands, are the ones with less minutes lost per year while the
less industrially developed ones, like the Slovak Republic, are the countries with more
minutes lost per year.
It is also important to note that the countries located in the center of Europe
(Germany, Romania, France…) are the ones that have loss the less minutes per year. This
can be due to the existing interconnections between these countries and their
neighbors. These interconnections can be used to supply power to different zones in the
country when the country itself cannot provide it. Obviously, this is a payed service.
Spain, instead, is not located in the center of Europe so it only has
interconnections with Portugal, France and Morocco. This limits the amount of energy
that can be demanded from other countries as a big number of Spanish regions don’t
border other countries.

Economic assessment of the impact of electricity storage on power quality in distribution systems Belén Rabadán Travesí, ICAI
59
Fig. 15: Minutes lost per year in different European countries over the last years [7].
2.3.2. SAIFI
SAIFI (System Average Interruption Frequency Index) is the average number of
times that a customer experiences an interruption of service in a year.
𝑆𝐴𝐼𝐹𝐼 = 𝑡𝑜𝑡𝑎𝑙 𝑛𝑢𝑚𝑏𝑒𝑟 𝑜𝑓 𝑐𝑢𝑠𝑡𝑜𝑚𝑒𝑟 𝑖𝑛𝑡𝑒𝑟𝑟𝑢𝑝𝑡𝑖𝑜𝑛𝑠
𝑡𝑜𝑡𝑎𝑙 𝑛𝑢𝑚𝑏𝑒𝑟 𝑜𝑓 𝑐𝑢𝑠𝑡𝑜𝑚𝑒𝑟𝑠 𝑠𝑒𝑟𝑣𝑒𝑑=
∑ 𝜆𝑖 ∗ 𝑁𝑖
∑ 𝑁𝑖
Where 𝜆i represents the failure rate and Ni the number of clients in point i.
Therefore, this index represents the average number of interruptions suffered by
each customer during a specific period of time.
In the table number 5 and figure number 16 we can find the value of the SAIFI
index from 2003 to 2014 in Spain depending on the zone. We can also find its average
value over those years and a ‘total’ value of each of the indexes that is calculated by
doing a weighted average depending on the population of each zone.
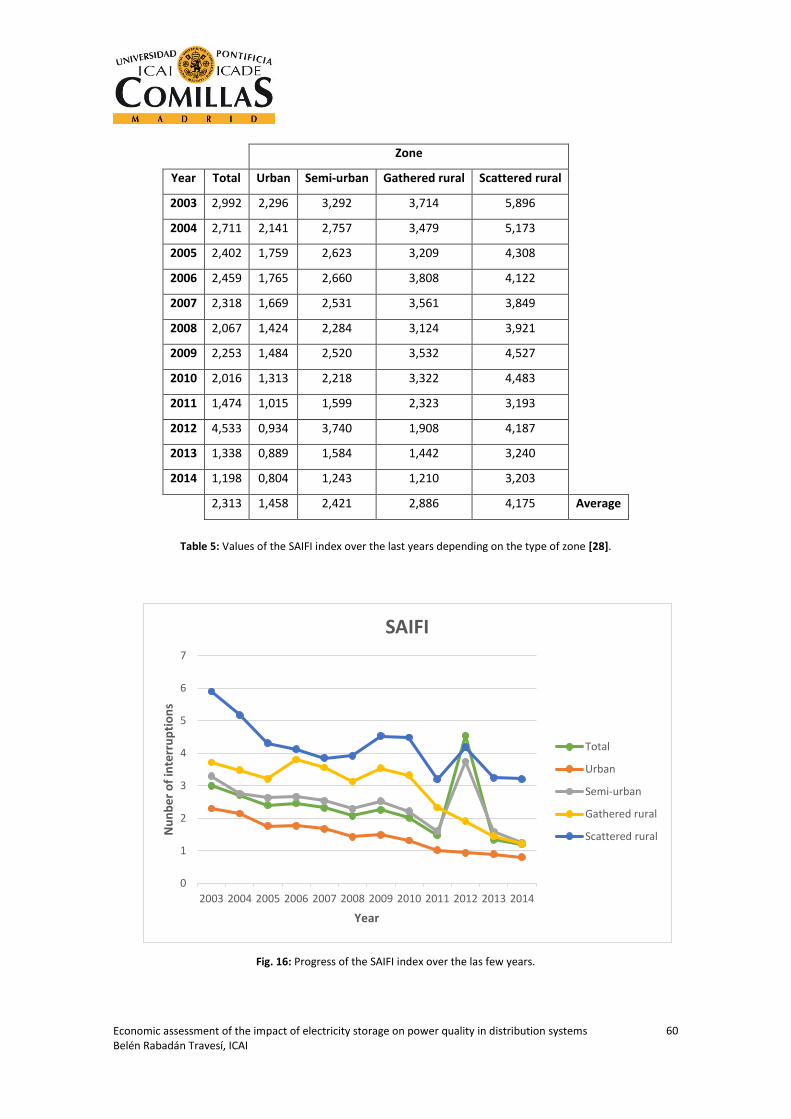
Economic assessment of the impact of electricity storage on power quality in distribution systems Belén Rabadán Travesí, ICAI
60
Table 5: Values of the SAIFI index over the last years depending on the type of zone [28].
Fig. 16: Progress of the SAIFI index over the las few years.
0
1
2
3
4
5
6
7
2003 2004 2005 2006 2007 2008 2009 2010 2011 2012 2013 2014
Nu
nb
er
of
inte
rru
pti
on
s
Year
SAIFI
Total
Urban
Semi-urban
Gathered rural
Scattered rural
Zone
Year Total Urban Semi-urban Gathered rural Scattered rural
2003 2,992 2,296 3,292 3,714 5,896
2004 2,711 2,141 2,757 3,479 5,173
2005 2,402 1,759 2,623 3,209 4,308
2006 2,459 1,765 2,660 3,808 4,122
2007 2,318 1,669 2,531 3,561 3,849
2008 2,067 1,424 2,284 3,124 3,921
2009 2,253 1,484 2,520 3,532 4,527
2010 2,016 1,313 2,218 3,322 4,483
2011 1,474 1,015 1,599 2,323 3,193
2012 4,533 0,934 3,740 1,908 4,187
2013 1,338 0,889 1,584 1,442 3,240
2014 1,198 0,804 1,243 1,210 3,203
2,313 1,458 2,421 2,886 4,175 Average

Economic assessment of the impact of electricity storage on power quality in distribution systems Belén Rabadán Travesí, ICAI
61
From the information presented above we can obtain the following conclusions:
- The progress of the SAIFI is similar to the progress of the SAIDI: descending
thanks to the improvements on the distribution system. In this case, we can
distinguish a peak in 2012 in the semi-urban, gathered rural and scattered
rural zones.
- Just like what happened to the SAIDI, the urban zone is the one with the
smallest SAIFI’s values. This is also due to the distribution of the urban
network, where clients can receive power from different points of supply. So,
if one point of supply fails its clients will not have their power interrupted as
they will be receiving energy from another point of supply.
- Because of the rural disposition of the network, the scattered rural and the
gathered rural zones are the ones with the highest SAIFI’s values as they
cannot receive power from other sources if their usual point of supply fails.
2.3.2.1. SAIFI in different European countries
The number of interruptions per year over the last few years in different
European countries can be found in figure number 17. The conclusions that can be
obtained from this graphic are similar as the ones obtained from the SAIDI graphic in
figure number 15. As we can see Spain (in light green color) is among the countries with
more interruptions per year even though this figure has been decreasing over the last
years.
Besides, the countries that border more countries, as the Netherlands and
Germany, are the ones with the best values of interruptions per year with an average of
0.5 approximately.
As the SAIFI’s evolution is correlated with the SAIDI’s evolution we can observe
that the countries that are more industrially developed are the ones with less
interruptions per year.
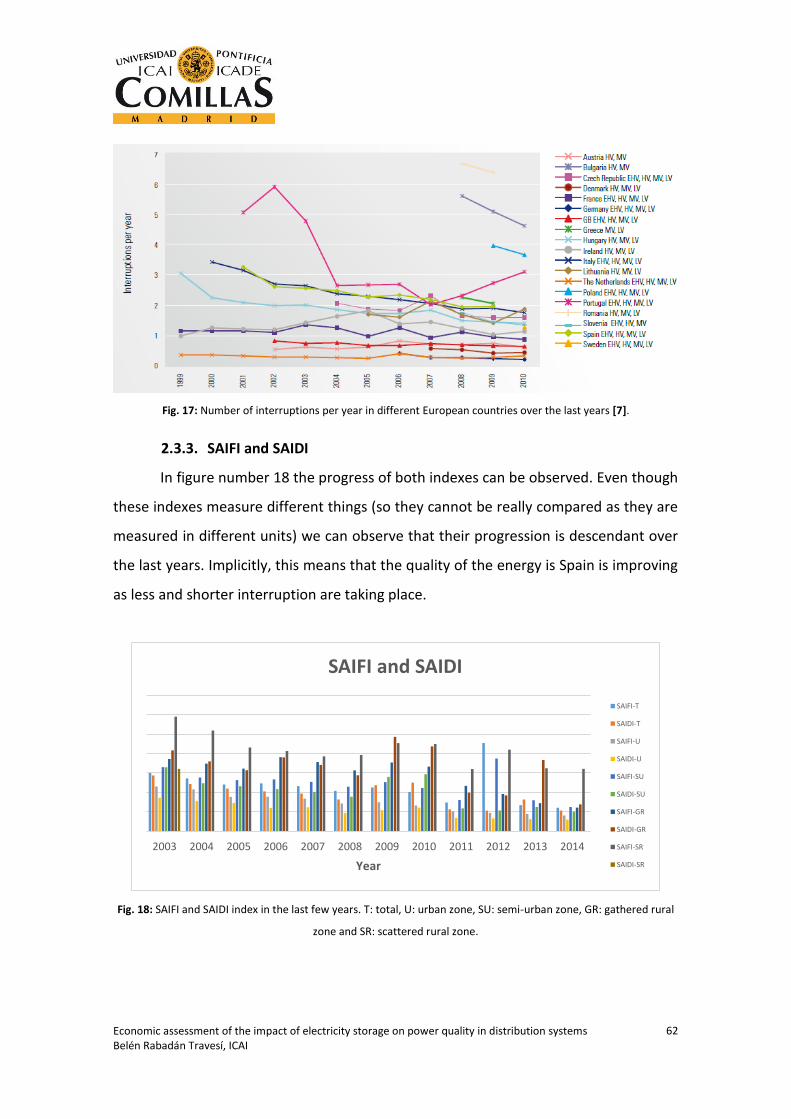
Economic assessment of the impact of electricity storage on power quality in distribution systems Belén Rabadán Travesí, ICAI
62
Fig. 17: Number of interruptions per year in different European countries over the last years [7].
2.3.3. SAIFI and SAIDI
In figure number 18 the progress of both indexes can be observed. Even though
these indexes measure different things (so they cannot be really compared as they are
measured in different units) we can observe that their progression is descendant over
the last years. Implicitly, this means that the quality of the energy is Spain is improving
as less and shorter interruption are taking place.
Fig. 18: SAIFI and SAIDI index in the last few years. T: total, U: urban zone, SU: semi-urban zone, GR: gathered rural
zone and SR: scattered rural zone.
2003 2004 2005 2006 2007 2008 2009 2010 2011 2012 2013 2014
Year
SAIFI and SAIDI
SAIFI-T
SAIDI-T
SAIFI-U
SAIDI-U
SAIFI-SU
SAIDI-SU
SAIFI-GR
SAIDI-GR
SAIFI-SR
SAIDI-SR

Economic assessment of the impact of electricity storage on power quality in distribution systems Belén Rabadán Travesí, ICAI
63
2.3.4. ENS
ENS (Energy Not Supplied) is an index that measures the quantity of energy that
has not been supplied for a year in a certain region.
𝐸𝑁𝑆 = ∑ 𝐿𝑎𝑖 ∗ 𝑈𝑖
Where Lai represents the average energy demanded at knot i and Ni the number
of clients in point i.
So, ENS models the energy that wasn’t supplied to the customers during a certain
period of time due to failures of the system.
In the table number 6 and figure number 19 we can find the values of the ENS
index from 2011 to 2015 in Spain. We can also find its average value over those years.
Table 6: Values of the ENS index over the last years [29].
Year ENS (MWh)
2011 336
2012 150
2013 1240
2014 281
2015 89
419,2 Average

Economic assessment of the impact of electricity storage on power quality in distribution systems Belén Rabadán Travesí, ICAI
64
Fig. 19: Progress of the ENS index over the las few years.
From this information on the ENS index we can conclude that its progress is also
descendant. As it happened with the SAIFI and SAIDI indexes this implies that the
Spanish distribution system is becoming more reliable as more targets on continuity of
supply are being accomplished.
2.4. How to measure voltage quality
Voltage quality is the area of quality energy supply that analyses the voltage
waveform. Among the disturbances that affect voltage waveform we will focus on
voltage dips, voltage swells and short interruptions.
Whenever any of the disturbances mentioned before take place there is a change in
the RMS value of the voltage. The RMS value is the square root of the mean value of the
squared function of the instantaneous values of the voltage. It represents the amount
of AC power that produces the same heating effect as an equivalent DC power.
𝑉𝑅𝑀𝑆 = √1
𝑇∗ ∫ [𝑣(𝑡)]2𝑑𝑡
𝑇
0
Where v(t) represent the voltage waveform and T its period.
0
200
400
600
800
1000
1200
1400
2011 2012 2013 2014 2015
Ene
rgy
(MW
h)
Year
ENS (MWh)

Economic assessment of the impact of electricity storage on power quality in distribution systems Belén Rabadán Travesí, ICAI
65
When a voltage dip or a short interruption takes place the RMS voltage value drops
below a threshold. On the other hand, when a voltage swell takes place the RMS voltage
value increases above a threshold. These durations last until the RMS voltage value
recovers.
Disturbances that affect voltage quality are disturbances that affect a random
number of clients; unlike long interruptions that affected a large number of customers.
Thus, the level of voltage quality needs to be measured at the point of connection of
each client to the distribution. So, a specific voltage quality recorder needs to be
installed. This recorder is expensive so, as of today, measuring voltage quality for every
single customer on a distribution network is not economically feasible. What is currently
done is that voltage quality is measured just on some points of the network [24] .
Among the different indexes used in order to measure the voltage sags and short
interruptions (it is important to note that a short interruption is a voltage sag where the
voltage drops until zero value) the most used one is the SARFI index. Instead, there are
no defined indexes used to measure the voltage swells.
2.4.1. SARFI
The SARFI (System Average RMS Variation Frequency Index) is a count of voltage
sags or short interruptions below a certain threshold.
𝑆𝐴𝑅𝐹𝐼%𝑉 =∑ 𝑁𝑖
𝑁𝑇
Where %V represents the voltage threshold, Ni the number of customers
experiencing a RMS voltage value below that threshold and NT the total number of
customers [30].
2.5. Responsibilities
As we have seen before of power supply, voltage dips, voltage sags… have several
origins. Electrical disturbances are not only caused by distribution companies but also
clients can affect them. Therefore, it is important to identify the origin of the

Economic assessment of the impact of electricity storage on power quality in distribution systems Belén Rabadán Travesí, ICAI
66
disturbances in order to know who is responsible of them. As this is quite difficult to
accomplish, distribution companies are normally responsible for all the costs associated
to disturbances even though they aren’t always responsible of them.
In Spain the RD 1995/2000 establishes that the interruptions of supply in MV (1kV-
36kV) cannot exceed the values shown in table number 7.
Type of zone Number of hours Number of interruptions
Urban 3.5 7
Semi-urban 7 11
Gathered rural 11 14
Scattered rural 15 19
Table 7: Total number of hours and interruptions accepted in MV (1kV-36Kv) in Spain depending on the type of
zone according to the RD 1995/2000.
If those values are exceeded the RD 1995/2000 declares that the distribution
company in responsible for the unfulfillment. Therefore, they will have to compensate
the customers economically if they do so. Depending on the type of client, the length of
the interruption and other aspects the amount of money payed will be different.
It is important to note that the exceptional events (hurricanes, earthquakes,
tsunamis…) are considered as irregularities so the regulation doesn’t count them as
interruptions.
2.6. Conclusion
In this chapter we can find a deep study of the electrical disturbances. We have seen
that some of them have worse effects than others.
Furthermore, we have studied different indexes in order to measure them: SAIDI,
SAIFI and ENS. In order to calculate these indexes Spain is divided into four main areas
depending on the amount of customers in each area. We have seen that Spain is among
the countries with average number and length of interruptions which means that we
still have to progress in order to acquire a better quality of electricity.

Economic assessment of the impact of electricity storage on power quality in distribution systems Belén Rabadán Travesí, ICAI
67
CHAPTER 3:
ECONOMIC STUDY
UNDER
CURRENTLY
QUALITY LEVELS

Economic assessment of the impact of electricity storage on power quality in distribution systems Belén Rabadán Travesí, ICAI
68
3. ECONOMIC STUDY UNDER CURRENT QUALITY LEVELS
3.1. Introduction
As it has been mentioned before the disturbances have several effects. So, the cost
of the damage produced by them can range from a few euros to millions of them. A
study made in 2001 in the United States declared that “data suggest that across all
business sectors, the U.S. economy is losing between $104 billion and $164 billion a year
to outages and another $15 billion to $24 billion to PQ phenomena” [31].
Good quality of supply can assure an enormous reduction of the expenses caused by
electrical disturbances. So, sometimes improvements are needed in order to achieve a
better quality of supply. Nevertheless, it is important to know if the investment is worth
the improvement in quality of supply; so, it is important to quantify the economic impact
that the disturbances have on the customers.
In this chapter an economic study of the electrical disturbances can be found. Firstly,
the costs implied by these disturbances will be exposed and then different solutions will
be analyzed. Moreover, a study of the people responsible for the disturbances can be
found.
3.2. Costs arising from electrical disturbances
The economic impacts due to poor quality of supply are wide and various so, the
costs arising from electrical disturbances are not easy to calculate. It is important to
know that the damage caused by disturbances can be obvious, like the damaging of the
equipment when voltage sags take place. But it can also be not so obvious to identify if
the damage takes longer to manifest, like the ageing of the equipment.
Considering this we can divide the cost arising from electrical disturbances in three
types: direct economic impact, indirect economic impact and social economic impact.
The direct economic impact includes the costs due to the interruptions by themselves.
The indirect economic impact represent the costs associated to the consequences

Economic assessment of the impact of electricity storage on power quality in distribution systems Belén Rabadán Travesí, ICAI
69
provoked by the interruptions. Finally, the social economic impacts are a type of indirect
economic impact that includes the consequences that the interruptions have on people.
Fig. 20: Cost arising from electrical disturbances [32].
Among all the disturbances presented in this paper the costs associated to
interruptions and voltage sags are the ones that will be studied in this chapter. As it has
been explained before we can consider a short interruption as a long voltage sag and a
long interruption as a long short interruption but, it is important to clarify that the
relationship between the length of these disturbances and its impact is not directly
proportional. The cost of the electrical disturbances doesn’t only depend on the
duration of the interruption but in other factors like the frequency of the interruptions,
the day of the week when the interruption takes places, the moment of the day, the
season…
•Loss of production
•Unrecoverable dowtime and resoruces
•Process restar costs
•Spoilage of semi-finished products
•Equipment damage
•Financial penalties
•Utility costs associated with the interruption
Direct economic
impact
•The cost of an organisation of revenue/income being postponed
•The financial loss of market share
•The cost of restoring brand equity
Indirect economic
impact
•Uncomfortable building temperature which may reduce efficiency, health or safety
•Personal injury or fear
•Possible need to evacuate nearby buildings as a result of failure of industrial safey
Social economic
impact

Economic assessment of the impact of electricity storage on power quality in distribution systems Belén Rabadán Travesí, ICAI
70
As not all the customers of a distribution company use the electricity with the
same objective it is relevant to group the clients depending on their activity. So, in order
to do a cost-estimating study we will classify the clients into the following groups:
- Residential: clients that use the energy in their houses to light them up, wash
their clothes, watch TV…
- Agriculture: clients that use the energy in the countryside in order to fulfill
agricultural activities such as cereal milling, irrigation systems, pumping
water…
- Commercial: clients that use energy in order to sell their products like shops,
pharmacies, shopping malls…
- Industrial: clients that use energy for industrial activities like the ones that
take place in refineries, paper mills, chemical plants…
It is important to understand that the consequences of an electrical interruption
are not the same, for example, for an industrial client (he could lose millions of euros if
he isn’t able to produce his product) than for a residential client (an interruption for him
could mean not being able to watch TV for a couple of hours).
3.2.1. Cost of non-supplied energy
As we have seen whenever an interruption occurs server consequences happen.
Therefore, the cost of non-supplied energy is related to the economic consequences
incurred by consumers whenever an interruption of power supply takes place.
Different studies have tried to quantify the economic impact of the loss of
electricity supply. In document [33] we can find a summary of different interruption cost
studies. In them we can find some of the indexes that have been used in order to
measure the willingness of customers to pay in order to obtain a better quality of
electricity. Most of these studies are based on customers’ surveys and this can present
some problems because it is very difficult to directly specify the value placed on
reliability of the electrical distribution network. Due to this, clients my give higher values
to interruption costs than the ones they really have.

Economic assessment of the impact of electricity storage on power quality in distribution systems Belén Rabadán Travesí, ICAI
71
In figure number 21 we can find the value of the VOLL index for different
European countries. The VoLL (Value of Lost Load) is an index used to measure the cost
of non-supplied energy that provides an estimation cost of the damage incurred by
customers because of interruptions of power supply.
Fig. 21:VoLL values in different European countries [34].
Moreover, in order to calculate the costs that arise from electrical interruptions
the AEMO (Australian Energy Market Operator) developed the VCR (Value of Customer
Reliability). The VCR represents, in dollar terms, the estimated aggregated valued that
customers place on the reliable supply of electricity [33]. So, it stands for the willingness
of consumers to pay in order to avoid interruptions. Therefore, the VCR can be used to
calculate the costs due to bad continuity of supply caused by long interruptions. In table
number 8 we can find the value of the VCR depending on the customer group. It can be
found in dollars (calculated by the AEMO) and in euros ($1=0.90€).

Economic assessment of the impact of electricity storage on power quality in distribution systems Belén Rabadán Travesí, ICAI
72
Table 8: Values of the VCR in dollars and in euros depending on the customer group [32]. 1
For this project we will use 10€/kWh for all consumers for the cost of energy non-supplied as it represents an average of the different indexes presented above.
3.2.1.1. Average cost of long interruptions in Spain
As the regulation of the cost of energy non supplied hasn’t always existed in this
chapter we will calculate the amount of money not earned by distribution companies
when an interruption takes place, because as no energy is being powered no money is
being earned and this can be considered as a “loss”, and the money that electrical
distribution companies need to pay to customers when an interruptions tales place. In
order to do this, the values of the SAIDI, SAIFI and ENS in Spain between the years 2011
and 2014 will be used.
We will start by calculating the money “lost” by distribution companies when
interruptions occur.
We can find information about the average demand of energy and its price in
Spain during those years in table number 9.
1 The values of the VCR may seem very high compared to the values of the VoLL represented above. This
can be because the VCR is an index used in Australia while the VoLL is an index used in the European
Union. Therefore, as prices of the electricity are different is this places, the value of these indexes is
different too.
Customer group VCR ($/kWh) VCR (€/kWh)
Residential 25,95 23,41
Agriculture 47,67 43,00
Commercial 44,72 40,34
Industrial 44,06 39,74
40,60 36,63 Average

Economic assessment of the impact of electricity storage on power quality in distribution systems Belén Rabadán Travesí, ICAI
73
Demand (MWh) Price (€/MWh)
2011 41822 60,2
2012 41141 59,6
2013 38681 57,8
2014 37843 55,0
31897,4 46,5 Average
Table 9: Demand and price of the electricity in Spain between years 2011 and 2014 [29].
Furthermore, we will only consider the values of the SAIDI, SAIFI and ENS indices
between the years 2011-2014 in order to do our calculations. Instead of taking into
account the SAIDI’s and SAIFI’s values we will use their ‘total’ values presented above as
they are a weighted average depending on the population of each type of zone and,
therefore, a good approximation to reality.
ENS (MWh) SAIFI (number of interruptions) SAIDI (hours)
2011 336 1,474 1,12
2012 150 4,533 1,053
2013 1240 1,338 1,623
2014 281 1,198 1,056
502 1,198 1,213 Average
Table 10: ENS, SAIDI and SAIFI indexes in Spain in years 2011-2014 [29]- [30].
The procedure followed in order to calculate the cost of interruptions of power
supply in Spain between years 2011-2014 will be the following:
Fig. 22: Procedure that will be followed in order to calculate the “loss” due to interruptions of power supply in Spain
between the years 2011-2014.
So firstly, we will calculate the cost of one hour of electricity in Spain over that
period of time, which is the amount of money payed electricity by the Spanish for one
hour of supply. As we have just explained when an interruption takes place this sum of
money is not earned by the electrical distribution company so we can consider it as a
Calculate the cost of one hour of
electricity
Calculate the total number of hours without power
supply
Use those figures to obtain the "loss" for not
supplying energy

Economic assessment of the impact of electricity storage on power quality in distribution systems Belén Rabadán Travesí, ICAI
74
“loss of money”. In order to do so we will multiply the demand by the price payed for
the electricity. This represents the cost of an hour of electricity the years 2011-2014.
𝐶𝑜𝑠𝑡ℎ𝑜𝑢𝑟 =𝐷𝑒𝑚𝑎𝑛𝑑 ∗ 𝑃𝑟𝑖𝑐𝑒
𝑁𝑢𝑚𝑏𝑒𝑟 𝑜𝑓 ℎ𝑜𝑢𝑟𝑠 𝑖𝑛 𝑜𝑛𝑒 𝑦𝑒𝑎𝑟
Year Cost (thousands of €)
2011 0,287
2012 0,280
2013 0,255
2014 0,238
0,265 Average
Table 11: Cost of one hour of electricity in Spain between the years 2011-2014.
Now the total time without power supply will be calculated. In order to do so we
will use the SAIDI index (average duration of the interruptions) and the SAIFI index
(average amount of interruptions).
𝑇𝑜𝑡𝑎𝑙 𝑡𝑖𝑚𝑒 = 𝑆𝐴𝐼𝐹𝐼 ∗ 𝑆𝐴𝐼𝐷𝐼
Year Total time (hours)
2011 1,650
2012 4,773
2013 2,172
2014 1,265
2,465 Average
Table 12: Total number of hours without power supply in Spain between 2011-2014.
We will now combine the information shown in tables number 11 and 13 in order
to determine the amount of money not earned by the distribution companies due to
interruptions of power supply in Spain between the years 2011 and 2014. To do so, we
will multiply the total time without power supply by the cost of one hour of power
supply.

Economic assessment of the impact of electricity storage on power quality in distribution systems Belén Rabadán Travesí, ICAI
75
𝑀𝑜𝑛𝑒𝑦 𝑛𝑜𝑡 𝑒𝑎𝑟𝑛𝑒𝑑𝑖𝑛𝑡𝑒𝑟𝑟𝑢𝑝𝑡𝑖𝑜𝑛𝑠 = 𝐶𝑜𝑠𝑡ℎ𝑜𝑢𝑟 ∗ 𝑇𝑜𝑡𝑎𝑙 𝑡𝑖𝑚𝑒
Year Cost (millions of €)
2011 4,16
2012 11,70
2013 4,86
2014 2,63
5,72 Average
Table 13: Money not earned by distribution companies due to interruptions of power supply in Spain between
2011-2014.
As we can conclude from the figures in table number 13 the average amount of
money not earned by distribution companies due to interruptions of power supply in
Spain between the years 2011-2014 is 5,72 million of euros.
Even though it hasn’t always worked this way, nowadays whenever an
interruption takes place the electrical companies need to pay the customers a sum of
money to compensate them for not being able to use power while the interruption last.
We will now use the average value of the cost of non-supplied energy and the ENS to
estimate the amount of money lost by distribution companies when interruptions occur.
Since the cost of energy non-supplied represents the cost of non-supplied energy when
interruptions occur and the ENS is the amount of energy not supplied in a year we will
combine both numbers to obtain the total that electrical distribution companies need
to face when an interruption occurs.
𝑇𝑜𝑡𝑎𝑙 𝑐𝑜𝑠𝑡 𝑖𝑛𝑡𝑒𝑟𝑟𝑢𝑝𝑡𝑖𝑜𝑛𝑠 = 𝐶𝑜𝑠𝑡 𝑜𝑓 𝑒𝑛𝑒𝑟𝑔𝑦 𝑛𝑜𝑛 − 𝑠𝑢𝑝𝑝𝑙𝑖𝑒𝑑 ∗ 𝐸𝑁𝑆

Economic assessment of the impact of electricity storage on power quality in distribution systems Belén Rabadán Travesí, ICAI
76
Year Total cost (millions of €)
2011 3,36
2012 1,50
2013 12,4
2014 2,81
5,02 Average
Table 14: Total cost of interruptions that electrical companies have to pay.
In figure number 23 we can find a comparison between the total cost that
electrical distribution companies have to face because of interruption of power supply
and the money not earned by distribution companies due to interruptions of power
supply. As we can see, the money that electrical distribution companies need to pay to
customer when an interruption of power supply takes place is very high compared to
the amount of money not earned by them (that can be considered as a loss) when an
interruption takes place.
Therefore, as the total sum of money lost by electrical distribution companies
because of interruptions of power supply is very high, the distribution companies should
improve the distribution system in order to decrease as much as possible, the number
and length of the interruptions. In chapter number 3 we can find a study of the different
solutions that distribution companies can apply in order to reduce the length and
number of power supply interruptions.

Economic assessment of the impact of electricity storage on power quality in distribution systems Belén Rabadán Travesí, ICAI
77
Fig. 23: Comparison between the total cost due to interruption of power supply and the money not earned by
distribution companies due to interruptions of power supply.
3.2.2. Cost due to poor voltage quality
As it has been explained before the cost of non-supplied energy is a measure for
long interruptions. Therefore, it represents the cost of non-supplying energy for a period
over three minutes. These interruptions affect continuity of supply but not voltage
quality. It is more difficult to calculate costs provoked by bad voltage quality (due to
voltage sags, voltage swells and short interruptions) as there is not many information
available about this topic. Therefore, we will only analyze briefly how to measure
voltage quality.
Voltage sags are the costliest of all power quality disturbances mainly because
they can affect users in greater than a 100km radius from causing the event. Normally,
voltage sags are caused by faults so, voltage sags last until the fault lasts.
It is important to know that if the relationship between the duration of a voltage
sag and is cost begins at 0€ and then increases linearly with time. Several studies have
concluded that a one-second outage provokes, approximately, 20% of the cost of one-
hour outage. Therefore, the relationship between the cost and the duration of a voltage
will be the following:
- €
2,00 €
4,00 €
6,00 €
8,00 €
10,00 €
12,00 €
14,00 €
2011 2012 2013 2014
Mill
ion
of
eu
ros
Year
Money not earnedbecause of theinterruptions
Total cost of theinterruptions

Economic assessment of the impact of electricity storage on power quality in distribution systems Belén Rabadán Travesí, ICAI
78
Fig. 24: Relation between the cost of the voltage sag and its duration.
Voltage sag can be considered a short interruption that last only a few seconds.
In the Australian case, where the cost of long interruptions is measured using the
VCR, the cost of voltage sags is determined by using that same data. By doing so, we will
obtain the VCS (Value of Customer Sags) as the 20% of the VCR [32].
Customer group VCS ($/kWh) VCS (€/kWh)
Residential 5,19 4,68
Agriculture 9,53 8,59
Commercial 8,94 8,06
Industrial 8,81 7,94
Table 15: Values of the VCS in dollars and in euros depending on the customer group [32].
3.3. Solutions to avoid electrical disturbances
The consequences of a poor quality of supply are various are severe. It is important,
therefore, to try to maintain the best quality in distribution systems in order to avoid
electrical disturbances. As we have seen, the VCR values prove that customers want to
cease those disturbances even if they have to pay more money to electrical distribution
companies to achieve it. In this section of the project we will approach some of the
0
20
40
60
80
100
120
0 10 20 30 40 50 60 70 80 90 100
Co
st (
%)
Duration (%)
Voltage sag: cost vs. duration

Economic assessment of the impact of electricity storage on power quality in distribution systems Belén Rabadán Travesí, ICAI
79
solutions to avoid disturbances and their effects. We will then choose the best solution
according to economic and quality terms.
Obviously the best and cheapest solution consists in a correct maintenance of the
electric lines and all the devices that are used to distribute electricity. Firstly, it is
important to assure a proper cleaning of the insulators. Over time solid particles are
deposited in the electrical insulators decreasing their efficiency. This cleaning is
especially relevant in coastal regions, deserts and places with high contamination levels.
Fig. 25: Power line insulator cleaning operation [34].
Moreover, it is important to assure a minimum distance between the trees and
shrubs and the power lines and the electric towers. By doing so, disturbances caused by
faults can be avoided. Also, protections against electric shocks need to be installed to
guarantee proper shielding. It is relevant too to maintain the proper operation
temperatures and confirm that the ground wiring of the circuits is the correct one as the
ground wiring is responsible for diverting the power surges.
Even though a correct maintenance is really important when avoiding electrical
disturbances some of them are caused by random phenomena so we cannot be totally
sure that they will not harm our distribution system. This is why, some equipment is
installed in the system in order to minimize the harm caused by the disturbances that
cannot be avoided. We will now study the most common solutions to electrical

Economic assessment of the impact of electricity storage on power quality in distribution systems Belén Rabadán Travesí, ICAI
80
equipment: Petersen coil, UPS, flywheel, dynamic voltage restorer and variable
frequency drive.
3.3.1. Petersen coil
Petersen coils are used in order to limit arcing currents during earth faults. It is a
variable ballast that is connected between the earth and the star point of the substation
transformer in a three phase system.
In an ungrounded three-phase-system when a phase-to-earth fault takes place,
the phase voltage of the phase where the fault occurs is reduced to the earth potential
(the capacitance of this line is discharged where the fault happens); while the phase-to-
earth voltage of the other two phases is multiplied by √3. When this happens, a charging
current ‘IC’ flows between these phase-to-earth capacitances. This current is three times
the charging current of each phase-to-earth and continues to flow via the path created
by the fault until the fault disappears.
Fig. 26: Isolated distribution system where Ic is the discharge current due to capacitance of the healthy phases [35].
When a Petersen coil is installed and a fault takes place, the Ic is neutralized by a
current (IL) that flows from the coil, with equal magnitude but with a change of phase of
180º. By doing this, it counteracts the capacitive current Ic by an inductive one IL so that
the value of the current where the fault takes place is extremely reduced [35].

Economic assessment of the impact of electricity storage on power quality in distribution systems Belén Rabadán Travesí, ICAI
81
Fig. 27: Compensated system where IL counteracts Ic [35].
The main advantage of the Petersen coil is that it avoids the activation of the
electrical protections so that the system can still work when the fault occurs.
3.3.2. UPS
An UPS (Uninterruptable power supply) is an electrical device that provides
power to a load in an emergency situation when the main power fails. When the system
is correctly working it uses its energy to power a battery system through a converter.
Just as soon as the electrical disturbance occurs the UPS provides the power stored in
the battery system. Currently, we can find in the market different types of batteries
depending. Using one type or another depends on the application and the needs. We
can find more information about batteries in Annex A.
So, UPSs are used to protect equipment or hardware to which an unexpected
power stoppage can cause serious injuries. We can find UPSs in data centers, hospitals,
telecommunication equipment…

Economic assessment of the impact of electricity storage on power quality in distribution systems Belén Rabadán Travesí, ICAI
82
Fig. 28: An UPS system. The green light represents the power flow [36].
3.3.3. Flywheel
A flywheel is a mechanical device that stores rotational energy, we can compare
it to a ‘mechanical battery’.
Fig. 29: Flywheel [37].
Basically, it is a big wheel that needs a big force to spin around. As it is very heavy
or very big it is necessary to push very hard to make it spin. And, as a lot of force is
needed to make it spin, a lot of force is also needed to stop it. Because of this, when it
is spinning at high speed it wants to keep on doing so (it has a lot of angular moment),
so it can store a lot of kinetic energy.
The kinetic energy is:
𝐸𝑘 =1
2∗ 𝐼 ∗ 𝜔2

Economic assessment of the impact of electricity storage on power quality in distribution systems Belén Rabadán Travesí, ICAI
83
Where I represent the moment of inertia and 𝜔 the rotational speed of the
rotating disc. The moment of inertia of a cylinder is:
𝐼 =1
2∗ 𝑟2 ∗ 𝑚
Where m represents the mass of the cylinder and r its radius.
From the equations shown above we can conclude that the kinetic energy of the
flywheel increases with its mass, radius and angular speed.
The functioning of this mechanism is very simple: energy is transferred to the
flywheel by the application of a torque. So, when the rotational speed of the torque
grows, more energy is stored in it. Then, as soon as the energy is needed, the flywheel
releases it by applying a torque to a mechanical load. Moreover, when this is done it
increases its own rotational speed.
As flywheel can store kinetic energy they are used to reduce disturbances. The
system (shown in figure 30) includes an engine and a generator installed into the same
axis. As the electrical network powers the motor the axis spins. The axis is also
connected to a generator that produces the electrical energy. Therefore, electrical
energy is converted into mechanical energy and, after then into electrical energy again.
So, in this system a flywheel can be installed between the motor and the generator.
Thanks to this, the flywheel spins at the engine’s speed acquiring inertia. So, when a
disturbance occurs, the flywheel is able to maintain the spin with its inertia for a few
seconds providing power [38].

Economic assessment of the impact of electricity storage on power quality in distribution systems Belén Rabadán Travesí, ICAI
84
Fig. 30: Flywheel energy storage system [39].
One of the main disadvantages of flywheels is its safety. As the energy contained
in them has to be released very quickly the flywheel may break or fall off its axle. So,
investigations are now being carried out in order to find their perfect material and
design.
3.3.4. Dynamic Voltage Restorer
A Dynamic Voltage Restorer (DVR) is a device used to compensate voltage sags
by injecting a 3-phase voltage in series and in synchronism with the distribution voltage
feeder. It represents a fast, flexible and efficient solution for this type of disturbances.
When a voltage sag takes place the DVR injects voltage in order to restore the
load supply voltage. To do so, an energy source is needed. This energy can be obtained
either from a storage device like a battery or from the incoming supply through a shunt
converter [40].

Economic assessment of the impact of electricity storage on power quality in distribution systems Belén Rabadán Travesí, ICAI
85
Fig. 31: Simplified circuit of a Dynamic Voltage Restorer (DVR) [41].
Figure number 31 is a simplified circuit of a DVR in the distribution system.
Whenever a fault takes place the load’s voltage suddenly drops to zero experiencing a
voltage sag. The DVR compares voltage V1 with the load’s predetermined voltage and,
as they are not the same, it injects the necessary voltage in order to maintain constant
the value of the load’s voltage V2. This device allows to control the magnitude and the
phase of the voltage achieving a perfect control of the load’s voltage and the active and
reactive power exchanged with the distribution system.
3.3.5. Variable frequency drive (VFD)
One of the worst effects of the interruption of voltage is the decrease of an
engine’s speed. In order to avoid this variable frequency drives (VFD) are installed.
An VFD is an adjustable speed drives that allows to control the AC motor speed
by varying the input frequency and voltage of the motor.
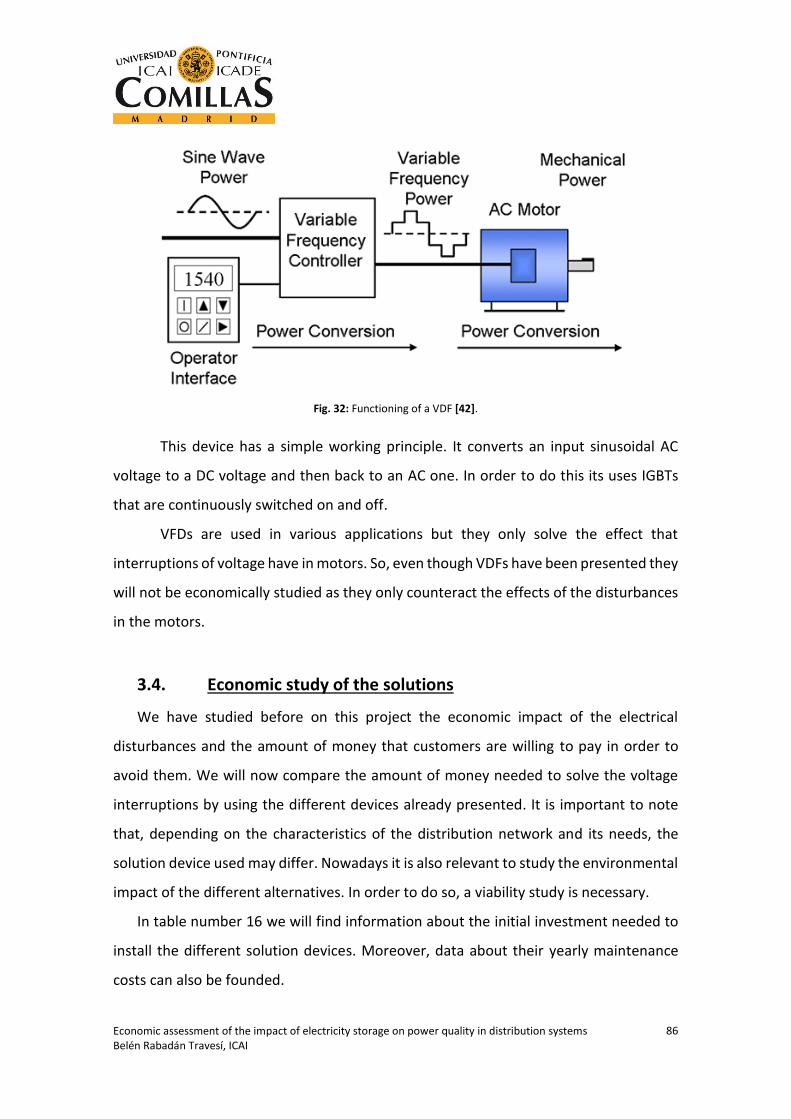
Economic assessment of the impact of electricity storage on power quality in distribution systems Belén Rabadán Travesí, ICAI
86
Fig. 32: Functioning of a VDF [42].
This device has a simple working principle. It converts an input sinusoidal AC
voltage to a DC voltage and then back to an AC one. In order to do this its uses IGBTs
that are continuously switched on and off.
VFDs are used in various applications but they only solve the effect that
interruptions of voltage have in motors. So, even though VDFs have been presented they
will not be economically studied as they only counteract the effects of the disturbances
in the motors.
3.4. Economic study of the solutions
We have studied before on this project the economic impact of the electrical
disturbances and the amount of money that customers are willing to pay in order to
avoid them. We will now compare the amount of money needed to solve the voltage
interruptions by using the different devices already presented. It is important to note
that, depending on the characteristics of the distribution network and its needs, the
solution device used may differ. Nowadays it is also relevant to study the environmental
impact of the different alternatives. In order to do so, a viability study is necessary.
In table number 16 we will find information about the initial investment needed to
install the different solution devices. Moreover, data about their yearly maintenance
costs can also be founded.
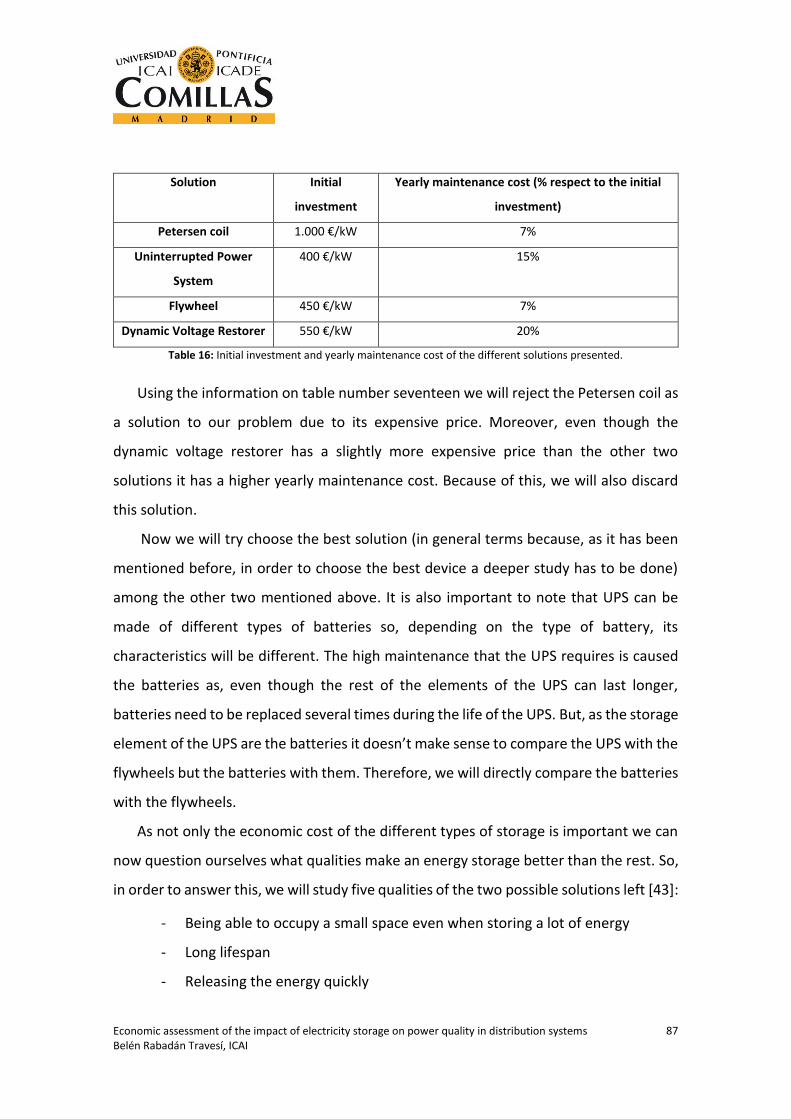
Economic assessment of the impact of electricity storage on power quality in distribution systems Belén Rabadán Travesí, ICAI
87
Solution Initial
investment
Yearly maintenance cost (% respect to the initial
investment)
Petersen coil 1.000 €/kW 7%
Uninterrupted Power
System
400 €/kW 15%
Flywheel 450 €/kW 7%
Dynamic Voltage Restorer 550 €/kW 20%
Table 16: Initial investment and yearly maintenance cost of the different solutions presented.
Using the information on table number seventeen we will reject the Petersen coil as
a solution to our problem due to its expensive price. Moreover, even though the
dynamic voltage restorer has a slightly more expensive price than the other two
solutions it has a higher yearly maintenance cost. Because of this, we will also discard
this solution.
Now we will try choose the best solution (in general terms because, as it has been
mentioned before, in order to choose the best device a deeper study has to be done)
among the other two mentioned above. It is also important to note that UPS can be
made of different types of batteries so, depending on the type of battery, its
characteristics will be different. The high maintenance that the UPS requires is caused
the batteries as, even though the rest of the elements of the UPS can last longer,
batteries need to be replaced several times during the life of the UPS. But, as the storage
element of the UPS are the batteries it doesn’t make sense to compare the UPS with the
flywheels but the batteries with them. Therefore, we will directly compare the batteries
with the flywheels.
As not only the economic cost of the different types of storage is important we can
now question ourselves what qualities make an energy storage better than the rest. So,
in order to answer this, we will study five qualities of the two possible solutions left [43]:
- Being able to occupy a small space even when storing a lot of energy
- Long lifespan
- Releasing the energy quickly

Economic assessment of the impact of electricity storage on power quality in distribution systems Belén Rabadán Travesí, ICAI
88
- Low losses when transferring and absorbing energy
- Little environmental impact
Firstly, we will study the amount of energy that both batteries and flywheels can
store and the speed at which they release energy stored. In order to compare both
technologies we will talk about energy density and power density. Energy density refers
to the amount of energy stored per unit of volume or mass. Power density refers to the
amount of power stored per unit of volume or mass. So, while energy density represents
the capacity of storing energy, power density represents the ability of delivering it faster.
Figure number 33 shows a comparison between different storage systems (including
batteries and flywheels) according to its power and energy density. As batteries have
been in the market for more decades than flywheels they have improved more than
them in general terms. Thanks to this, we can now find batteries that store a lot of
energy when occupying a small place. But their main disadvantage is that they are not
able to deliver it really fast. On the other side and even though flywheels can deliver
energy faster than batteries, they also occupy a bigger space. This is why batteries have
a higher energy density than flywheels but a smaller power density.
Fig. 33: Comparison between different energy storages according to its energy and power density [44].

Economic assessment of the impact of electricity storage on power quality in distribution systems Belén Rabadán Travesí, ICAI
89
If we compare the life of both technologies, we find out that the lifespan of the
flywheels is higher (10.000 cycles) than the lifespan of the batteries (3.000 cycles). The
problem is that, while the batteries can last for that long, the mechanical components
of the flywheels may fail shortening its life duration. Furthermore, one of the advantages
of flywheels is that their life duration and performance isn’t affected by changes of
temperature while it does affect batteries. Thanks to this, flywheels are able to operate
at a wider temperature range.
When talking about batteries its self-discharge may vary from a 1-2% monthly to
a 30-40% monthly, depending on the type of battery. But, flywheels also loose energy
when transferring and absorbing it, an average value of losses between a 5-15% due to
friction.
Finally, if we compare the environmental damaged caused by both technologies
we will find that batteries have a lower carbon footprint than flywheels. The reason to
this is that the carbon emissions caused to operate the flywheel are greater. But, on the
other hand, flywheels don’t contain any hazardous material while the batteries are
made of chemicals that can be toxic.
Summarizing, from all the information above it may seem difficult to choose
between batteries and flywheels as they both seem to have disadvantages and
advantages. But, when choosing between them it is important to consider that, while
some batteries can provide energy for almost one hour, the typical energy storage time
of flywheel is only between 8-30 seconds. That amount of time is sufficient to cover
short interruptions or voltage sags but doesn’t work for long interruptions. Therefore,
even it is necessary a further technical study in order to choose between these two, we
can conclude that in order to solve the problems caused by short interruptions, long
interruptions and voltage sags, UPS (with batteries as their storage device) may be
better than flywheels nowadays.

Economic assessment of the impact of electricity storage on power quality in distribution systems Belén Rabadán Travesí, ICAI
90
3.5. Conclusion
As we have seen the electrical disturbances have an economic impact in the users of
the electrical system and in the distribution companies. In particular, we have studied
the implications of the short and long interruptions.
Using the information of several surveys we have stated that the money lost by
electrical distribution companies is very high. This is because whenever an interruption
takes place electrical distribution companies need to pay a big sum of money to the
users. In this study we have considered the cost of non-supplied energy 10€/kWh as an
average of the different indexes used to measure this cost. The problem is that,
depending on the cost of non-supplied energy, the figures obtained in this type of
project can vary a lot.
After analyzing the advantages and the disadvantages of the different storage
solutions we have concluded that the best one is the UPS system. Nevertheless, when
installing a storage device, a deeper technical and economic study will always be
necessary.

Economic assessment of the impact of electricity storage on power quality in distribution systems Belén Rabadán Travesí, ICAI
91
CHAPTER 4:
ECONOMIC STUDY
UNDER FUTURE
QUALITY LEVELS

Economic assessment of the impact of electricity storage on power quality in distribution systems Belén Rabadán Travesí, ICAI
92
4. ECONOMIC STUDY UNDER FUTURE QUALITY LEVELS
4.1. Introduction
In this chapter we can firstly find a theoretical introduction to the climate change
and the impact it will have on the electrical disturbances. As a lot of disturbances are
due to weather conditions, the climate change will highly increase them.
Then, two cases of study are presented: a gathered urban zone and a rural zone. We
will study the cost that the increase of electrical disturbances will have on these two
types of zones and the cost of installing an UPS storage system in order to avoid them.
4.2. Climate change
When we talk about climate change we understand it as a change in the Earth’s
overall climate. So it can refer to a change in its average temperature and/or a change
in its typical precipitations patterns. This changes in the Earth’s climate have happened
before, the Earth has suffered warmer and cooler periods. So, as this has happened
before we are sure human behavior is not the only cause of the climate change.
Scientifics have assured that some causes of climate change are natural like changes of
the Earth’s orbit, the amount of energy coming from the sun, volcanic eruptions…
Currently the Earth is becoming warmer. The main problem is that the rate at which
Earth’s temperature is increasing is very big and this is not only due to natural causes
but also to the actions of human beings. Nowadays a lot of fuels are burned generating
heat-trapping gases, known as greenhouse gases, like the carbon dioxide.

Economic assessment of the impact of electricity storage on power quality in distribution systems Belén Rabadán Travesí, ICAI
93
Fig. 34: Natural and intensified greenhouse effect [45].
As it is shown in figure number 34 sunlight goes through the atmosphere and warms
the Earth during the normal greenhouse effect. Part of this radiation is given off by the
Earth, other part escapes to the outer space and the remaining radiation is trapped by
gases in the air to keep the Earth warm enough to sustain life. Those gases are the
greenhouse ones. The problem is that, as we have released so much greenhouse gases,
our atmosphere is now like a heat-trapping blanket. The result to this is the climate
change which provokes a general warming of our planet [46].
The effects of climate change are various and severe. Among them we can find the
following ones:
- Rising of the sea level, 17cm over the last century
- Global temperature rising, an average 0.6ºC over the last century
- Warming of the oceans, 0.1ºC over the last century
- Increasing of the sea level, 3mm over the last decades
- Acidification of the ocean
- Melting of the arctic icecap
- Increasing number of extreme events like hurricanes or tsunamis

Economic assessment of the impact of electricity storage on power quality in distribution systems Belén Rabadán Travesí, ICAI
94
The worst aspect of climate change is that it is only starting. So, if we keep on
producing the amounts of greenhouse gases that we are currently producing the effects
will be much worse. Figure number 35 shows graphically the impacts that different
raises of temperature would have.
Fig. 35: Impact of the climate change depending on the increase of temperature [47].
Even though electrical disturbances may seem to have nothing to do with climate
change that is not true. The Edison Electric Institute has stated that 70% of power
outages in the US are caused by weather phenomena such as lightings, snow, ice,
temperature, hurricanes… As due to climate change all this weather events will increase
in intensity and in frequency, they will affect the quality of electricity supply. For
instance:
- High winds can blow tree branches into power lines provoking a voltage sag
or even an interruption
- The accumulation of snow and ice on power line insulators can provoke flash-
overs

Economic assessment of the impact of electricity storage on power quality in distribution systems Belén Rabadán Travesí, ICAI
95
- Lightning strikes in power lines and towers cause voltage sags
- An increasing in the global temperatures provokes a growing in the electrical
demand because of the higher demand for air conditioning and refrigeration
systems
- The temperature rise also produces a higher evaporation of water,
decreasing the chance of using that water in order to generate electricity
- Need of moving or elevating infrastructures due to the rise of sea level
making them more expensive
- Aging of the electrical equipment because of extreme heating
- Extreme events like tornados destroy elements of the electrical system such
as cables or power tower [47] [48]
The main problem is that traditionally the electrical infrastructure (substations,
cables, power towers…) hasn’t been designed to bear extreme meteorological events as
it is not economically profitable. This is why some actions have to be taken now in order
to prepare the electrical system for the future impacts the climate change may provoke.
Among the solutions we find the followings:
- Constant measuring of the power through the different power lines in order
to know if their temperature limits are being exceeded
- Elevating or relocating electrical equipment in order to avoid accidents like
the fall of branches over a power line
- Reduction of the energy demand nowadays so that less greenhouse gases
are emitted
- Evaluation of the risks of climate change to electricity infrastructure in cities,
counties, states…
- Strengthen clean energy policies in order to lower the amount of greenhouse
gases emissions
- Installing equipment to mitigate the effects of climate change (like UPS) in
order to reduce power outages, interruptions and voltage sags

Economic assessment of the impact of electricity storage on power quality in distribution systems Belén Rabadán Travesí, ICAI
96
- Upgrading electricity equipment so that renewable energies are more
integrated [50]
In the solutions shown above we find that the installation of UPS or other storage
device may be useful in the future in order to avoid some of the effects that the climate
change will have in electrical disturbances. We have studied before in this project both
the economic cost of UPS and its advantages and disadvantages.
Now, we will examine if it is economically profitable the installation of UPS in the
distribution system in order to prevent interruptions of power supply. In order to do this
several scenarios will be presented. We will vary the type of zone, the number of
interruptions and its length. In order to do this, we will double the value of the SAIDI
and SAIFI indexes to model the impact that climate change will have in interruptions of
power supply. Therefore, in our study two scenarios can be found: a rural zone and a
gathered rural zone. We will study the economic impact by multiplying the amount and
duration of interruptions by 2, by 5 and by 10. We will study as well the worthiness of
the installation of an UPS in the distribution system. Then, both scenarios will be
compared.
When we are multiplying the values of the SAIDI and the SAIFI by 2, by 5 and by 10
we are not only considering the impact of the climate change on the electrical
disturbances but other facts that may increase their value. For example, if the electrical
equipment is old it may be not as precise as it is when it is new. This implies that it will
not clear the faults as it clears them when the equipment is new, increasing the time
that it takes an interruption to be solved. Moreover, the extreme events (like hurricanes
or tornados) can destroy a big number of electrical equipment. As the number of these
extreme events is going to increase in the future, more electrical equipment will be
destroyed so more and longer interruptions will take place.

Economic assessment of the impact of electricity storage on power quality in distribution systems Belén Rabadán Travesí, ICAI
97
4.3. Scenario I: Gathered rural zone
For this scenario we will consider a Spanish municipality called Pedraza. It is located
in the province of Segovia and it has a population of 416 inhabitants. It is a fortified
medieval village.
Fig. 36: Map of Segovia where we can see where Pedraza is located [51].
As it has less than 2.000 inhabitants but more than 200 it is considered a gathered
rural zone. In table number 17 we can find the average value of the SAIDI and SAIFI
indexes in the gathered rural zone over the last few years. This table also those indexes
multiplied by different constants in order to model the impact of climate change in those
indexes.
Average value of
interruptions
Average value of
interruptions x 2
Average value of
interruptions x 5
Average value of
interruptions x 10
SAIDI (hours) 3,252 6,504 16,26 32,52
SAIFI (number of
interruptions) 2,886 5,772 14,43 28,86
Table 17: Different values of the SAIDI and SAIFI indexes in a gathered rural zone (average value, average value
multiplied by two, average value multiplied by five and average value multiplied by ten).
Moreover, the average demand of electricity of Spanish customers over the last
years is 31897,4 MWh with a price of 46,5€/MWh. Even though Spain has 46,5 million
people they may not be all customers of the distributions companies. We will use a ratio
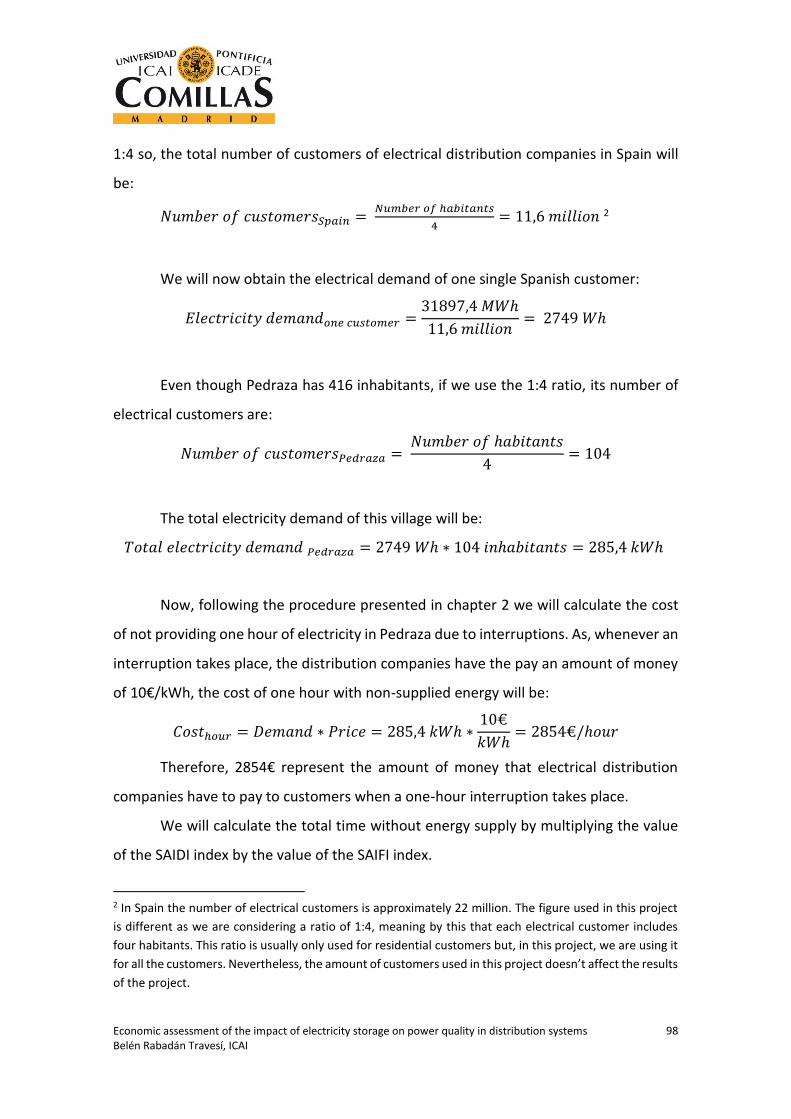
Economic assessment of the impact of electricity storage on power quality in distribution systems Belén Rabadán Travesí, ICAI
98
1:4 so, the total number of customers of electrical distribution companies in Spain will
be:
𝑁𝑢𝑚𝑏𝑒𝑟 𝑜𝑓 𝑐𝑢𝑠𝑡𝑜𝑚𝑒𝑟𝑠𝑆𝑝𝑎𝑖𝑛 = 𝑁𝑢𝑚𝑏𝑒𝑟 𝑜𝑓 ℎ𝑎𝑏𝑖𝑡𝑎𝑛𝑡𝑠
4= 11,6 𝑚𝑖𝑙𝑙𝑖𝑜𝑛 2
We will now obtain the electrical demand of one single Spanish customer:
𝐸𝑙𝑒𝑐𝑡𝑟𝑖𝑐𝑖𝑡𝑦 𝑑𝑒𝑚𝑎𝑛𝑑𝑜𝑛𝑒 𝑐𝑢𝑠𝑡𝑜𝑚𝑒𝑟 =31897,4 𝑀𝑊ℎ
11,6 𝑚𝑖𝑙𝑙𝑖𝑜𝑛= 2749 𝑊ℎ
Even though Pedraza has 416 inhabitants, if we use the 1:4 ratio, its number of
electrical customers are:
𝑁𝑢𝑚𝑏𝑒𝑟 𝑜𝑓 𝑐𝑢𝑠𝑡𝑜𝑚𝑒𝑟𝑠𝑃𝑒𝑑𝑟𝑎𝑧𝑎 = 𝑁𝑢𝑚𝑏𝑒𝑟 𝑜𝑓 ℎ𝑎𝑏𝑖𝑡𝑎𝑛𝑡𝑠
4= 104
The total electricity demand of this village will be:
𝑇𝑜𝑡𝑎𝑙 𝑒𝑙𝑒𝑐𝑡𝑟𝑖𝑐𝑖𝑡𝑦 𝑑𝑒𝑚𝑎𝑛𝑑 𝑃𝑒𝑑𝑟𝑎𝑧𝑎 = 2749 𝑊ℎ ∗ 104 𝑖𝑛ℎ𝑎𝑏𝑖𝑡𝑎𝑛𝑡𝑠 = 285,4 𝑘𝑊ℎ
Now, following the procedure presented in chapter 2 we will calculate the cost
of not providing one hour of electricity in Pedraza due to interruptions. As, whenever an
interruption takes place, the distribution companies have the pay an amount of money
of 10€/kWh, the cost of one hour with non-supplied energy will be:
𝐶𝑜𝑠𝑡ℎ𝑜𝑢𝑟 = 𝐷𝑒𝑚𝑎𝑛𝑑 ∗ 𝑃𝑟𝑖𝑐𝑒 = 285,4 𝑘𝑊ℎ ∗10€
𝑘𝑊ℎ= 2854€/ℎ𝑜𝑢𝑟
Therefore, 2854€ represent the amount of money that electrical distribution
companies have to pay to customers when a one-hour interruption takes place.
We will calculate the total time without energy supply by multiplying the value
of the SAIDI index by the value of the SAIFI index.
2 In Spain the number of electrical customers is approximately 22 million. The figure used in this project
is different as we are considering a ratio of 1:4, meaning by this that each electrical customer includes
four habitants. This ratio is usually only used for residential customers but, in this project, we are using it
for all the customers. Nevertheless, the amount of customers used in this project doesn’t affect the results
of the project.

Economic assessment of the impact of electricity storage on power quality in distribution systems Belén Rabadán Travesí, ICAI
99
𝑇𝑜𝑡𝑎𝑙 𝑡𝑖𝑚𝑒 = 𝑆𝐴𝐼𝐹𝐼 ∗ 𝑆𝐴𝐼𝐷𝐼
Total time (hours)
Average value of the interruptions 9,385
Average value of interruptions x 2 37,541
Average value of the interruptions x 5 234,632
Average value of interruptions x 10 938,527
Table 18: Total number of hours without power supply in Pedraza’s scenario with different values of the
interruptions.
The SAIDI and SAIFI represent the frequency and length of the interruptions for
only one customer. Therefore, in order to calculate the total cost of the interruptions
we will have to multiply the cost of one hour of power by the average number of hours
without energy supply by the total number of customers.
𝐶𝑜𝑠𝑡𝑖𝑛𝑡𝑒𝑟𝑟𝑢𝑝𝑡𝑖𝑜𝑛𝑠 = 𝐶𝑜𝑠𝑡ℎ𝑜𝑢𝑟 ∗ 𝑇𝑜𝑡𝑎𝑙 𝑡𝑖𝑚𝑒 ∗ 𝑁𝑢𝑚𝑏𝑒𝑟 𝑜𝑓 𝑐𝑢𝑠𝑡𝑜𝑚𝑒𝑟𝑠
Cost (€)
Average value of the interruptions 2.791.327
Average value of the interruptions x 2 44.661.244
Average value of interruptions x 5 279.132.777
Average value of interruptions x 10 1.116.531.111
Table 19: Total cost of interruptions of power supply in Pedraza’s scenario in one year with different values of the
interruption.
Once we are aware of the total cost of interruptions of power supply in Pedraza in
one year we will figure out if it compensates economically to install UPS in their
distribution system. From the information on table 16 we know that the initial
investment in order to install an UPS system is approximately 400€/kW with a yearly
maintenance cost of 15% of the initial investment.
As we are studying the climate change the interruptions will increase not currently
but in the future. We have just presented the current initial investment and yearly
maintenance cost. But, as we are studying a future event, we will suppose that the initial
investment of the batteries and its maintenance cost will decrease in the future that is
when those events will take place.

Economic assessment of the impact of electricity storage on power quality in distribution systems Belén Rabadán Travesí, ICAI
100
In order to simplify our calculations, we will suppose that the transition from the
current value of the interruptions to the future value of them will be direct (meaning
with this that it will jump from its current value to its value multiplied by two, by five or
by ten).
As we are not really certain of how the UPSs’ cost will progress, we have estimated
them. Figures number 37 and 38 show us the evolution of the initial investment cost of
installing an UPS system and the evolution of its yearly maintenance cost.
Fig. 37: Evolution of the initial investment cost of installing an UPS storage system.
0
50
100
150
200
250
300
350
400
450
1 2 5 10
Initial investment (€/kW)

Economic assessment of the impact of electricity storage on power quality in distribution systems Belén Rabadán Travesí, ICAI
101
Fig. 38: Evolution of the initial yearly maintenance cost of installing an UPS storage system (%respect to the initial
investment).
The following values of the initial investments to install and UPS system and its
maintenance will be used:
Initial investment
(€/kW)
Yearly maintenance cost (% respect to the
initial investment)
Average value of the
interruptions 400 15
Average value of
interruptions x 2 200 12
Average value of the
interruptions x 5 100 7
Average value of
interruptions x 10 50 5
Table 20:Future initial investment and yearly maintenance cost for an UPS system.
Furthermore, we know that the total electricity demand in Pedraza is 285,4kWh. If
we multiply this figure by the total number of hours without power supply, we obtain
the amount of kW that we need our UPS to provide.
𝑇𝑜𝑡𝑎𝑙 𝑘𝑊𝑈𝑃𝑆 = 𝑇𝑜𝑡𝑎𝑙 𝑒𝑙𝑒𝑐𝑡𝑟𝑖𝑐𝑖𝑡𝑦 𝑑𝑒𝑚𝑎𝑛𝑑 𝑃𝑒𝑑𝑟𝑎𝑧𝑎
∗ 𝑇𝑜𝑡𝑎𝑙 𝑛𝑢𝑚𝑏𝑒𝑟 𝑜𝑓 ℎ𝑜𝑢𝑟𝑠 𝑤𝑖𝑡ℎ𝑜𝑢𝑡 𝑝𝑜𝑤𝑒𝑟
0
2
4
6
8
10
12
14
16
1 2 5 10
Yearly maintenance cost (% respect to the initial investment)
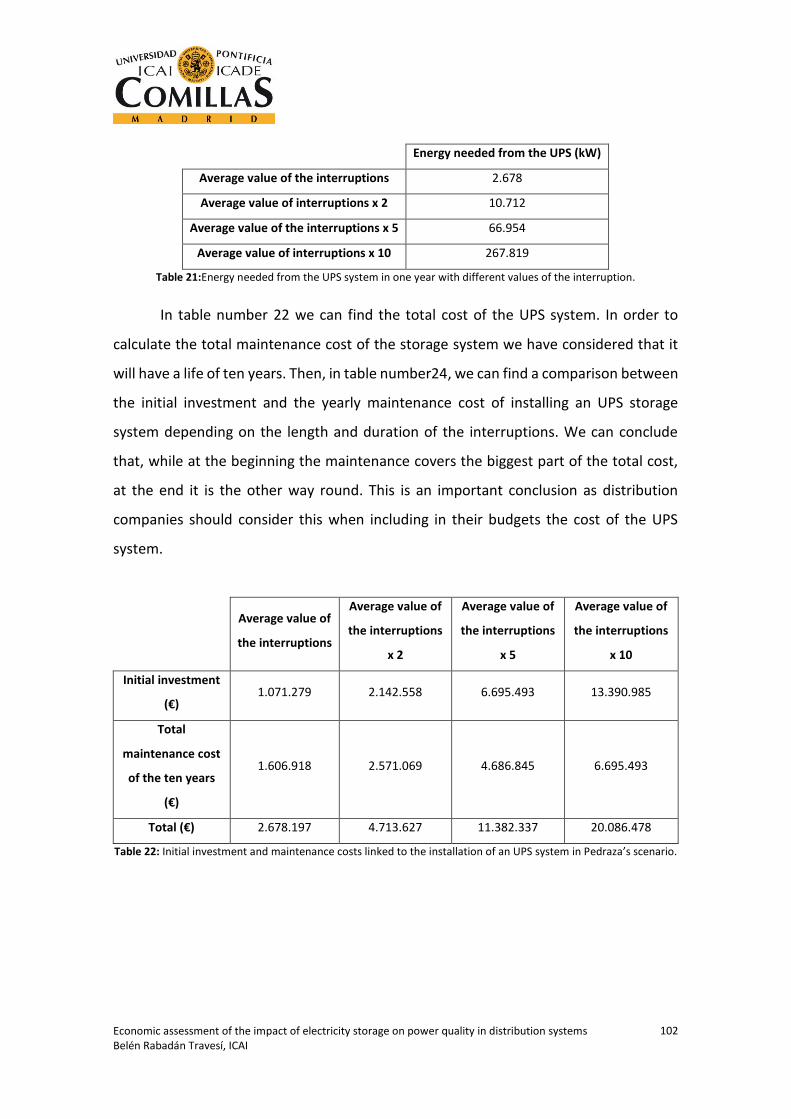
Economic assessment of the impact of electricity storage on power quality in distribution systems Belén Rabadán Travesí, ICAI
102
Energy needed from the UPS (kW)
Average value of the interruptions 2.678
Average value of interruptions x 2 10.712
Average value of the interruptions x 5 66.954
Average value of interruptions x 10 267.819
Table 21:Energy needed from the UPS system in one year with different values of the interruption.
In table number 22 we can find the total cost of the UPS system. In order to
calculate the total maintenance cost of the storage system we have considered that it
will have a life of ten years. Then, in table number24, we can find a comparison between
the initial investment and the yearly maintenance cost of installing an UPS storage
system depending on the length and duration of the interruptions. We can conclude
that, while at the beginning the maintenance covers the biggest part of the total cost,
at the end it is the other way round. This is an important conclusion as distribution
companies should consider this when including in their budgets the cost of the UPS
system.
Average value of
the interruptions
Average value of
the interruptions
x 2
Average value of
the interruptions
x 5
Average value of
the interruptions
x 10
Initial investment
(€) 1.071.279 2.142.558 6.695.493 13.390.985
Total
maintenance cost
of the ten years
(€)
1.606.918 2.571.069 4.686.845 6.695.493
Total (€) 2.678.197 4.713.627 11.382.337 20.086.478
Table 22: Initial investment and maintenance costs linked to the installation of an UPS system in Pedraza’s scenario.

Economic assessment of the impact of electricity storage on power quality in distribution systems Belén Rabadán Travesí, ICAI
103
Average value of the
interruptions
Average value of the
interruptions x 2
Average value of the
interruptions x 5
Average value of the
interruptions x 10
Table 23: Comparison of the initial investment and maintenance cost over ten years depending on the length and
duration of interruptions.
To sum up, we will compare the costs associated to the installation of an UPS storage
system to the cost of interruptions in a period of time of ten years.
Average value
of the
interruptions
Average value of
the
interruptions x 2
Average value of
the interruptions
x 5
Average value of
the interruptions x
10
Total cost of
interruptions (€) 27.913.277 446.612.444 2.791.327.778 11.165.311.115
Total cost of the
installation of an
UPS storage system
(€)
2.678.197 4.713.627 11.382.337 20.086.478
Table 24: Comparison between the total cost of interruptions and the total cost of the installation of an UPS system
in Pedraza’s scenario.
Initial investment (€)
Total maintenance cost of the ten years (€)
Initial investment (€)
Total maintenance cost of the ten years (€)
Initial investment (€)
Total maintenance cost of the ten years (€)
Initial investment (€)
Total maintenance cost of the ten years (€)

Economic assessment of the impact of electricity storage on power quality in distribution systems Belén Rabadán Travesí, ICAI
104
Fig. 39: Graphical comparison between the total cost of interruptions and the total cost of the installation of an UPS
system in Pedraza’s scenario.
0
2.000.000.000
4.000.000.000
6.000.000.000
8.000.000.000
10.000.000.000
12.000.000.000
Average value ofthe interruptions
Average value ofinterruptions x 2
Average value ofinterruptions x 5
Average value ofinterruptions x 10
Total cost of interruptions (€) in ten years
Total cost of the installation and maintenance of an UPS (€)

Economic assessment of the impact of electricity storage on power quality in distribution systems Belén Rabadán Travesí, ICAI
105
Figure number 39 and table number 24 demonstrate that installing an UPS storage
system in a gathered rural zone as Pedraza is currently profitable. Moreover, we can
also observe that if the total cost of the interruptions increases while the cost of the
installation and maintenance of an UPS decreases, so it will be even more profitable to
install this storage system in the future. Therefore, by installing an UPS system the
number and length of interruptions will decrease so that electrical distribution
companies will not need to pay those big sums of money to customers when
interruptions take place.
4.3.1. Cost for each customer
In this section we will study how much will each customer need to pay if the
electrical distribution company decided to charge them for the installation of the UPS
storage system meaning by this an improvement in the quality of their power.
In order to do this, we will divide the total cost of the installation of the UPS by the
number of electrical customers in Pedraza. We will consider that the customer will pay
the same amount of money every year, i.e., the distribution company will need to be
aware that the first year they’ll not receive all the money spent initial investment and
first-year maintenance but a proportional part of the total cost. Then, as the customers
usually pay the electrical companies every two months we will calculate the amount of
money they’ll pay.
Average value of
the interruptions
Average value of
the interruptions
x 2
Average value of
the interruptions
x 5
Average value of
the interruptions
x 10
Yearly cost
(€)/customer 2.581 4.542 10.968 19.356
Cost
(€)/customer
every two
months
430 757 1.828 3.226
Table 25: Yearly cost and two-monthly cost that each customer has to pay for the UPS’s installation in Pedraza’s
scenario.

Economic assessment of the impact of electricity storage on power quality in distribution systems Belén Rabadán Travesí, ICAI
106
From table number 25 we can conclude that the installation of the UPS storage
system will cost the customers a lot of money. Even if they want to improve the quality
of their power the distribution company will need to pay for part of the storage system.
4.3.2. Sensitivity analysis For our sensitivity analysis we will consider what happens if we equal the cost of the
UPS storage system to the cost of the energy not supplied. We will carry out the
sensitivity analysis only in the present where the value and length of the interruptions
is the average one.
𝐶𝑜𝑠𝑡𝑈𝑃𝑆 = 𝐶𝑜𝑠𝑡𝐸𝑁𝑆
𝐼𝑛𝑖𝑡𝑖𝑎𝑙 𝑖𝑛𝑣𝑒𝑠𝑡𝑚𝑒𝑛𝑡𝑈𝑃𝑆 ∗ 𝐸𝑛𝑒𝑟𝑔𝑦 𝑛𝑒𝑒𝑑𝑒𝑑 = 𝐸𝑁𝑆 ∗ 𝐶𝑜𝑠𝑡 𝑜𝑓 𝑛𝑜𝑛 − 𝑠𝑢𝑝𝑝𝑙𝑖𝑒𝑑 𝑒𝑛𝑒𝑟𝑔𝑦
The average value of the energy needed from the UPS is 2678kW and the average
value of the energy not supplied is 419.2MWh.
If we maintain the value of the initial investment of the UPS to 400€/kW we obtain
that the cost of non-supplied energy should be:
𝐶𝑜𝑠𝑡 𝑜𝑓 𝑛𝑜𝑛 − 𝑠𝑢𝑝𝑝𝑙𝑖𝑒𝑑 𝑒𝑛𝑒𝑟𝑔𝑦 =𝐼𝑛𝑖𝑡𝑖𝑎𝑙 𝑖𝑛𝑣𝑒𝑠𝑡𝑚𝑒𝑛𝑡𝑈𝑃𝑆 ∗ 𝐸𝑛𝑒𝑟𝑔𝑦 𝑛𝑒𝑒𝑑𝑒𝑑
𝐸𝑁𝑆
=400 ∗ 2678
419200= 2,5€/𝑘𝑊ℎ
The average cost of non-supplied energy used in this project is 10€/kWh. If we
compare this with the figure we have just obtained, we can conclude that it is worth for
companies to install UPS systems while the cost of non-supplied energy is more than
2,5€/kWh (considering that the initial investment of the UPS is fixed) in a gathered rural
zone.
If we maintain fixed the cost of non-supplied energy, we obtain that the initial
investment of the batteries is:
𝐼𝑛𝑖𝑡𝑖𝑎𝑙 𝑖𝑛𝑣𝑒𝑠𝑡𝑚𝑒𝑛𝑡𝑈𝑃𝑆 =𝐸𝑁𝑆 ∗ 𝐶𝑜𝑠𝑡 𝑜𝑓 𝑛𝑜𝑛 − 𝑠𝑢𝑝𝑝𝑙𝑖𝑒𝑑 𝑒𝑛𝑒𝑟𝑔𝑦
𝐸𝑛𝑒𝑟𝑔𝑦 𝑛𝑒𝑒𝑑𝑒𝑑=
419200 ∗ 10
2678
= 1565€/𝑘𝑊
The figure obtained means that, if the cost of non-supplied energy stays fixed, it will
be profitable for electrical distribution companies to install storage technologies whose
initial investment is less than 1565€/kW in a gathered rural zone.

Economic assessment of the impact of electricity storage on power quality in distribution systems Belén Rabadán Travesí, ICAI
107
4.4. Scenario II: Urban zone
We will use Spain’s capital, Madrid, as the urban zone studied in this scenario. It is
the most populated city of Spain with 3.141.991 habitants and located in the center of
the country. It is the third largest city of the European Union after London and Berlin.
Fig. 40: Map of Spain where we can see Madrid’s location [52].
Madrid is considered an urban zone as it has more than 20.000 habitants. The
average value of the SAIDI and SAIFI indexes for this type of zone can be found in table
number 26. As we did with the gathered urban zone scenario, the values of these
indexes can also be found multiplied by some constants in order to model the impact of
the climate change on the electrical disturbances.

Economic assessment of the impact of electricity storage on power quality in distribution systems Belén Rabadán Travesí, ICAI
108
Average value of
interruptions
Average value of
interruptions x 2
Average value of
interruptions x 5
Average value of
interruptions x 10
SAIDI (hours) 1,072 2,144 5,36 10,72
SAIFI (number of
interruptions) 1,458 2,916 7,29 14,58
Table 26: Different values of the SAIDI and SAIFI indexes in an urban zone (average value, average value multiplied
by two, average value multiplied by five and average value multiplied by ten).
As we calculated in the Pedraza’s scenario, the electricity demand of one Spanish
electrical customer has an average value of 2749Wh. Considering the population of
Madrid we will now obtain the amount of customers of electrical distribution companies
in it:
𝑁𝑢𝑚𝑏𝑒𝑟 𝑜𝑓 𝑐𝑢𝑠𝑡𝑜𝑚𝑒𝑟𝑠𝑀𝑎𝑑𝑟𝑖𝑑 = 𝑁𝑢𝑚𝑏𝑒𝑟 𝑜𝑓 ℎ𝑎𝑏𝑖𝑡𝑎𝑛𝑡𝑠
4= 785497
Using this information, we obtain that the total electricity demand of this city is:
𝑇𝑜𝑡𝑎𝑙 𝑒𝑙𝑒𝑐𝑡𝑟𝑖𝑐𝑖𝑡𝑦 𝑑𝑒𝑚𝑎𝑛𝑑 𝑀𝑎𝑑𝑟𝑖𝑑 = 2749 𝑊ℎ ∗ 785479 𝑖𝑛ℎ𝑎𝑏𝑖𝑡𝑎𝑛𝑡𝑠
= 2159331 𝑘𝑊ℎ = 2159 𝑀𝑊ℎ
Now, following the procedure presented in chapter 3 and as we did in the
Pedraza’s scenario we will calculate the sum of money that electrical companies have to
pay for not providing one hour of electricity in Madrid.
𝐶𝑜𝑠𝑡ℎ𝑜𝑢𝑟 = 𝐷𝑒𝑚𝑎𝑛𝑑 ∗ 𝑃𝑟𝑖𝑐𝑒 = 2159331 𝑘𝑊ℎ ∗10€
𝑘𝑊ℎ= 21599331 €/ℎ𝑜𝑢𝑟
𝑇𝑜𝑡𝑎𝑙 𝑡𝑖𝑚𝑒 = 𝑆𝐴𝐼𝐹𝐼 ∗ 𝑆𝐴𝐼𝐷𝐼
Total time (hours)
Average value of the interruptions 1,563
Average value of interruptions x 2 6,252
Average value of the interruptions x 5 39,074
Average value of interruptions x 10 156,298
Table 27: Total number of hours without power supply in Madrid’s scenario with different values of the
interruptions.

Economic assessment of the impact of electricity storage on power quality in distribution systems Belén Rabadán Travesí, ICAI
109
In order to calculate the total cost of the interruptions we will have to multiply
the cost of one hour of power by the average number of hours without energy supply
by the total number of customers.
𝐶𝑜𝑠𝑡𝑖𝑛𝑡𝑒𝑟𝑟𝑢𝑝𝑡𝑖𝑜𝑛𝑠 = 𝐶𝑜𝑠𝑡ℎ𝑜𝑢𝑟 ∗ 𝑇𝑜𝑡𝑎𝑙 𝑡𝑖𝑚𝑒 ∗ 𝑁𝑢𝑚𝑏𝑒𝑟 𝑜𝑓 𝑐𝑢𝑠𝑡𝑜𝑚𝑒𝑟𝑠
Cost (€)
Average value of the interruptions 26.517.922.402.477
Average value of the interruptions x 2 106.071.689.609.908
Average value of interruptions x 5 662.948.060.061.927
Average value of interruptions x 10 2.651.792.240.247.710
Table 28: Total cost of interruptions of power supply in Madrid’s scenario in one year with different values of the
interruption.
Once we are aware of the total cost of interruptions of power supply in Madrid in
one year we will figure out if it compensates economically the installation of UPS in their
distribution system. In order to do this, we will use the values of the initial investment
and yearly maintenance cost that appear on table number 20.
As we know that the total electricity demand in Madrid is 2159MWh. If we multiply
this figure by the total number of hours without power supply, we obtain the amount
of kW that we need our UPS to provide.
𝑇𝑜𝑡𝑎𝑙 𝑘𝑊𝑈𝑃𝑆 = 𝑇𝑜𝑡𝑎𝑙 𝑒𝑙𝑒𝑐𝑡𝑟𝑖𝑐𝑖𝑡𝑦 𝑑𝑒𝑚𝑎𝑛𝑑 𝑀𝑎𝑑𝑟𝑖𝑑
∗ 𝑇𝑜𝑡𝑎𝑙 𝑛𝑢𝑚𝑏𝑒𝑟 𝑜𝑓 ℎ𝑜𝑢𝑟𝑠 𝑤𝑖𝑡ℎ𝑜𝑢𝑡 𝑝𝑜𝑤𝑒𝑟
Energy needed from the UPS (kW)
Average value of the interruptions 3.375.939
Average value of interruptions x 2 13.503.755
Average value of the interruptions x 5 84.398.467
Average value of interruptions x 10 337.593.868
Table 29:Energy needed from the UPS system in one year with different values of the interruption.
Finally, in table number 30 we can find the total cost of the UPS system. In order
to calculate the total maintenance cost of the storage system we have considered that
it lasts ten years.

Economic assessment of the impact of electricity storage on power quality in distribution systems Belén Rabadán Travesí, ICAI
110
Average value of
the
interruptions
Average value of
the interruptions
x 2
Average value of
the interruptions
x 5
Average value of
the interruptions
x 10
Initial
investment (€) 1.350.375.474 2.700.750.947 8.439.846.709 16.879.693.419
Total
maintenance
cost of the ten
years (€)
2.025.563.210 3.240.901.136 5.907.892.697 8.439.846.709
Total (€) 3.375.938.683 5.941.652.083 14.347.739.406 25.319.540.128
Table 30: Initial investment and maintenance costs linked to the installation of an UPS system in Madrid’s scenario.
Now we will calculate the costs associated to the installation of an UPS storage
system to the cost of interruptions in a period of time of ten years to sum up.
Average value of
the interruptions
Average value of
the interruptions x
2
Average value of
the interruptions x
5
Average value of
the interruptions x
10
Total cost of
interruptions
in ten years
(€)
265.179.224.024.771 1.060.716.896.099.080 6.629.480.600.619.270 26.517.922.402.477.100
Total cost of
the
installation of
an UPS
storage
system (€)
3.375.938.683 5.941.652.083 14.347.739.406 25.319.540.128
Table 31: Comparison between the total cost of interruptions and the total cost of the installation of an UPS in
Madrid’s scenario.

Economic assessment of the impact of electricity storage on power quality in distribution systems Belén Rabadán Travesí, ICAI
111
Fig. 41: Graphical comparison between the total cost of interruptions and the total cost of the installation of an UPS
system in Madrid’s scenario.
0
5.000.000.000.000.000
10.000.000.000.000.000
15.000.000.000.000.000
20.000.000.000.000.000
25.000.000.000.000.000
30.000.000.000.000.000
Average value ofthe interruptions
Average value ofthe interruptions x
2
Average value ofthe interruptions x
5
Average value ofthe interruptions x
10
Total cost of interruptions (€) in ten years
Total cost of the installation and maintenance of an UPS (€)

Economic assessment of the impact of electricity storage on power quality in distribution systems Belén Rabadán Travesí, ICAI
112
Figure number 41 and table number 31 demonstrate that installing an UPS storage
system in an urban zone as Madrid is economically profitable. Even nowadays, when the
number and length of interruptions is not very high, the electrical distribution will earn
money by installing an UPS storage system in their distribution network. In addition,
when there is an increase in the length and amount of interruption and a decrease in
the cost of the UPS system, installing this storage equipment is even more profitable.
Moreover, a technical study of the installation of the UPS system may be necessary
in order to assure the benefits of this measure.
4.4.1. Cost for each customer
As we did in the last scenario, it this section we will calculate the amount of money
that needs to be payed for each customer in cade the electrical company wanted to
charge them the total cost of the installation of the UPS.
In table number 32 we can find the yearly and two-monthly costs that the customers
of the Madrid scenario will have to pay in order to install the UPS storage system. As we
can see, the amount of money needed is a lot for the clients to afford. Therefore, the
distribution companies would need to pay part of the installation by themselves.
Average value of
the interruptions
Average value of
the interruptions
x 2
Average value of
the interruptions
x 5
Average value of
the interruptions
x 10
Yearly cost
(€)/customer 430 756 1827 3223
Cost
(€)/customer
every two
months
72 126 304 537
Table 32: Yearly cost and two-monthly cost that each customer has to pay for the UPS’s installation in Madrid’s
scenario.

Economic assessment of the impact of electricity storage on power quality in distribution systems Belén Rabadán Travesí, ICAI
113
4.4.2. Sensitivity analysis As we did in the Pedraza’s scenario we will carry out a sensitivity analysis for this
scenario too.
𝐶𝑜𝑠𝑡𝑈𝑃𝑆 = 𝐶𝑜𝑠𝑡𝐸𝑁𝑆
𝐼𝑛𝑖𝑡𝑖𝑎𝑙 𝑖𝑛𝑣𝑒𝑠𝑡𝑚𝑒𝑛𝑡𝑈𝑃𝑆 ∗ 𝐸𝑛𝑒𝑟𝑔𝑦 𝑛𝑒𝑒𝑑𝑒𝑑 = 𝐸𝑁𝑆 ∗ 𝐶𝑜𝑠𝑡 𝑜𝑓 𝑛𝑜𝑛 − 𝑠𝑢𝑝𝑝𝑙𝑖𝑒𝑑 𝑒𝑛𝑒𝑟𝑔𝑦
The average value of the energy needed from the UPS in an urban zone is
3375939kW and the average value of the energy not supplied is 419.2MWh.
If we maintain the value of the initial investment of the UPS to 400€/kW we obtain
that the cost of non-supplied energy should be:
𝐶𝑜𝑠𝑡 𝑜𝑓 𝑛𝑜𝑛 − 𝑠𝑢𝑝𝑝𝑙𝑖𝑒𝑑 𝑒𝑛𝑒𝑟𝑔𝑦 =𝐼𝑛𝑖𝑡𝑖𝑎𝑙 𝑖𝑛𝑣𝑒𝑠𝑡𝑚𝑒𝑛𝑡𝑈𝑃𝑆 ∗ 𝐸𝑛𝑒𝑟𝑔𝑦 𝑛𝑒𝑒𝑑𝑒𝑑
𝐸𝑁𝑆
=400 ∗ 3375939
419200= 3221€/𝑘𝑊ℎ
The average cost of non-supplied energy used in this project is 10€/kWh. If we
compare this with the figure we have just obtained, we can conclude that, in order to
cover the initial investment of the UPS system the cost of non-supplied energy that
electrical distribution companies should pay is very high. If we just considered this figure
we would conclude that it is worth for electrical distribution companies to install an UPS
system because, if they don’t do so, they’ll need to pay a big cost for the non-supplied
energy.
If we maintain fixed the cost of non-supplied energy, we obtain that the initial
investment of the batteries is:
𝐼𝑛𝑖𝑡𝑖𝑎𝑙 𝑖𝑛𝑣𝑒𝑠𝑡𝑚𝑒𝑛𝑡𝑈𝑃𝑆 =𝐸𝑁𝑆 ∗ 𝐶𝑜𝑠𝑡 𝑜𝑓 𝑛𝑜𝑛 − 𝑠𝑢𝑝𝑝𝑙𝑖𝑒𝑑 𝑒𝑛𝑒𝑟𝑔𝑦
𝐸𝑛𝑒𝑟𝑔𝑦 𝑛𝑒𝑒𝑑𝑒𝑑=
419200 ∗ 10
3375939
= 1,25€/𝑘𝑊
The figure obtained means that electrical companies save a lot of money by installing
the UPS storage system. Therefore, it will compensate them economically to install any
storage system in an urban zone whose initial investment cost is above 1,25€/kW.

Economic assessment of the impact of electricity storage on power quality in distribution systems Belén Rabadán Travesí, ICAI
114
4.5. Comparison of both scenarios
Comparing the both study cases we can conclude that it is more profitable to install
an UPS storage system in an urban zone like Madrid than in a rural gathered one like
Pedraza. This is mainly because, while the average amount of interruptions in an urban
zone is smaller and its population bigger, in a gathered rural zone the average amount
of interruptions is bigger with a much smaller population.
Therefore, even if the cost of the UPS system in Madrid’s scenario is higher than in
Pedraza’s, the cost of the interruption is also higher in this first city. This implies that it
is more profitable to install a storage system in Madrid than in Pedraza. This can also be
concluded by studying the costs of the installation to the customers.
In table number 33 we can find a comparison between the initial investment of an
UPS system when we maintain fixed the cost of non-supplied energy and the cost of
non-supplied energy when we maintain fixed the initial investment of the UPS system
in a gathered rural and urban zone.
Gathered rural zone Urban zone
Cost of non-supplied energy (€/kWh) 2,5 3221
Initial investment UPS (€/kW) 1565 1,25
Table 33: Comparison between the initial investment of an UPS system when we maintain fixed the cost of non-
supplied energy and the cost of non-supplied energy when we maintain fixed the initial investment of the UPS
system in a gathered rural and urban zone.
From the information shown in the table above we can conclude that the cost of
non-supplied energy should be more in the urban zones and less in the rural ones. On
the other side, regarding the initial investment of the UPS system and due to the savings
it provokes, the UPS system should cost more in a gathered rural zone than in an urban
one.
Besides, even though we have studied the scenarios for separate, the distribution
companies usually power different types or zones (not only gathered rural or urban). So,
it will be necessary to study both scenarios together in order to obtain a more global
vision of the situation.

Economic assessment of the impact of electricity storage on power quality in distribution systems Belén Rabadán Travesí, ICAI
115
4.6. Conclusion
From this chapter we can conclude that the climate change will have severe
consequences in duration and length of the electrical disturbances. As we have seen, a
lot of electrical disturbances are caused by weather phenomena and, as weather will
change with the climate change, electrical disturbances will too.
Moreover, from the two scenarios presented we can affirm that installing a storage
system like an UPS will be economically profitable. Therefore, electrical distribution
companies should study this option from an economic and a technical point of view.
On the other hand, we have considered that, while the number and length of the
interruption increase, the initial investment and yearly maintenance cost of the UPS
system decreases. We are assuming that the technology advancement on batteries will
reduce the cost of the UPS system but this will may not be the case. Therefore, it is
important to consider this in future studies.
Nevertheless, it is important to consider that the UPS storage systems are installed
in the electric power transforming centers. And, depending on the type of zone, the
characteristics of the transformers are different. For example, while a transformer of an
urban zone has an average power of 1MVA as it has to supply a big number of customers,
the power of a rural transformer has an average power of 150kVA as the number of
customers is smaller. In this project we have considered that the power is provided by a
“big UPS system” that is able to provide all the necessary energy. But, in real life these
UPS systems don’t exist. Therefore, in order to quantify more precisely the total cost of
the UPS system this has to be considered as various UPS system will be installed with a
different value for each of them depending on the type of zone.
We have concluded that it is economically profitable if both situations the
installation of a storage system like an UPS. It is important to note that in a country like
Spain the quality of electricity is very good. Thanks to this, we have very low values of
SAIDI and SAIFI in we compare them with other countries in the globe (because, as we
have seen, in Europe there are countries with better quality indexes than us). This is
why, currently, not all the distribution companies install storage systems as they

Economic assessment of the impact of electricity storage on power quality in distribution systems Belén Rabadán Travesí, ICAI
116
consider their networks good enough. But, in other countries of the globe their quality
indexes are not as good. We can compare the values of the indexes when multiplying
the SAIDI and SAIFI by 2 and by 5 to the indexes of the east of US where tornados are
hurricanes are quite usual. There, the installation of storages systems even in individual
households is quite usual. Moreover, the values of the indexes of developing countries
like the Dominican Republic, Nigeria or India; are very close to the value when we
multiply the SAIDI and SAIFI index by ten. In those countries the amount and length of
the interruptions of power supply is very high (they can even be without energy for days
in a monthly basis) so the installation of batteries or other storage system in becoming
an usual practice nowadays.
And, finally, it is important to clarify that this has only been an economic study but
in order to probe the feasibility of installing the storage system, a technical study is
necessary too.

Economic assessment of the impact of electricity storage on power quality in distribution systems Belén Rabadán Travesí, ICAI
117
CHAPTER 5:
CONCLUSIONS

Economic assessment of the impact of electricity storage on power quality in distribution systems Belén Rabadán Travesí, ICAI
118
5. CONCLUSIONS
In this project we can find an economic study of the electricity storage on power
quality in distribution systems.
We have studied all the aspects related to the quality of electricity: customer
service, continuity of supply and power quality. Among those aspects we have focused
our study in the continuity of supply as interruptions on power supply are among the
electrical disturbances with higher economic impact. In order to measure the
disturbances indexes are used and we have studied the most important indexes: SAIDI
(average duration), SAIFI (average frequency) and ENS (average energy not supplied).
Spain isn’t among the European countries with the best values on those indexes.
Therefore, in order to improve them, storage devices are used.
We have used the indexes mentioned above in order to measure the amount of
money that electrical distribution companies have to pay to customers when
interruptions of power supply take place. To do that, a cost of non-supplied energy of
10€/kWh has been used. This figure represents the amount of money that distribution
companies have to pay for each kWh of energy not supplied to customers. In this project
we have used an average value of it but, it is important to note that the cost of non-
supplied energy depends on a lot of factors like the country or the type of client.
Therefore, if we change the value of the cost of non-supplied energy the conclusions
obtained in the project may vary.
Among the storage devices we have centered our attention into five: Petersen coil,
UPS, flywheel, DVR and VFD. We have studied their advantages and disadvantages in
order to conclude that currently the best solutions are the UPS system and the flywheel.
As UPSs use batteries in order to store their energy and this element has been on the
market for a lot of time its improvements are more than the improvements in flywheels.
That is why UPSs are nowadays able to store a lot of energy while flywheels are only
able to store a bit. This is the main reason why we have chosen UPS over the flywheels.
Finally, we have studied if it is economically profitable to install an UPS system
nowadays and in the future. We have considered that, due to the climate change, the
Economic assessment of the impact of electricity storage on power quality in distribution systems Belén Rabadán Travesí, ICAI
119
electrical disturbances including the interruptions will highly increase. Because of this, a
storage device like the UPS will be necessary in order to assure customers that they have
the best possible power supply. With the economic study we can affirm that, depending
on the area of living of the customers, it is currently profitable or not the installation of
the UPS. But, in the future it will be highly profitable the installation of the as the number
and length of electrical disturbances will increase. As electrical distribution companies
don’t power just a village but a lot more (so different types of zones are included) we
can conclude that electrical distribution companies should install storage systems to
avoid the cost of electrical disturbances.
5.1. Limitations of analysis and future research This project can be considered as a research work in order to know the viability that
different storage systems when reducing the impact of electrical disturbances in
electrical distribution networks.
It is important to know that, mainly due to the short amount of time given to carry
out this study, some limitations have been involved. Anyone doing a future research of
this topic may wish to consider the following aspects:
- Studying the impact of electrical disturbances currently and in the future for
other zones
- Considering another storage technologies
- Varying the value of the cost of the ENS in order to compare the results
- Varying the value of the cost of non-supplied energy depending on the type
of customer
- Considering the cost of different UPS systems instead of the cost of just an
UPS system that power the whole zone
- Not varying the cost of the UPS system with time

Economic assessment of the impact of electricity storage on power quality in distribution systems Belén Rabadán Travesí, ICAI
120

Economic assessment of the impact of electricity storage on power quality in distribution systems Belén Rabadán Travesí, ICAI
121
CHAPTER 6:
BIBLIOGRAPHY
Economic assessment of the impact of electricity storage on power quality in distribution systems Belén Rabadán Travesí, ICAI
122
6. BIBLIOGRAPHY
[1] J. D. Pampín, El sistema eléctrico y las centrales de generación, 2015.
[2] "Trafoworld," [Online]. Available: http://www.trafoworld.com/en/Didactic_Area/what_is_a_power_grid/.
[3] J. F. Prada, "The value of reliability in power systems - pricing operation reserves," 1999.
[4] Union of the electricity industry, "Application guide to the European Standard EN50160 on "voltage characteristics of electricity supplied by public distribution systems"," 1995.
[5] P. Ferracci, "Cahier Technique no. 199 Power Quality," 2001.
[6] H. Markiewicz and A. Klajn, "Voltage Disturbances: Standard EN 50160 - Voltage Characteristics in Public Distribution Systems," 2004.
[7] CEER, "5th CEER Benchmarking Report on the Quality of Electricity Supply," Brussels, 2012.
[8] P. Frías, Power Quality in Distribution Networks, Madrid: ICAI notes on Smart Grids, 2014.
[9] R. Azevedo and M. J. Resende, "Continuity of Supply Indices," IEEE, 2011.
[10] "All things nuclear," [Online]. Available: http://allthingsnuclear.org/wp-content/uploads/2014/02/FS157-Figure-1-bathtub-nrc-ml13044a469.jpg. [Accessed 4 8 2016].
[11] IEEE, "The Authoritative Dictionary of IEEE Standard Terms, Seventh Edition," 2000. [Online]. Available: http://ieeexplore.ieee.org/servlet/opac?punumber=4116785.
[12] W. E. Reid, "Power quality issues, standards and guidelines," IEEE, vol. 32, no. 3, pp. 625-631, 1996.
[13] V. Ignatova, V. Dominique and J.-M. Hypolite, "Simple Indicators for an effective Power Quality Monitoring and Analysis," IEEE, 2015.
[14] D. Chapman, "Introduction to power quality," European Copper Institute, 2012.
[15] A. Klajn and M. Bątkiewicz-Pantuła, "Standard EN 50160," 2013.
[16] IEEE, "IEEE Trial-use recommended practice for voltage sag and short interruption ride-through testing for end-user eletrical equipment rated less than 1000V," IEEE Industry applications society, New York, 2014.
[17] A. Bayona Lejarraga, "Minización de los efectos de las perturbaciones eléctricas en los procesos industriales," p. 103, 2008.
[18] "Todo productividad," [Online]. Available: http://todoproductividad.blogspot.com.es/2012/09/efecto-de-las-variaciones-de-voltaje-y_2715.html. [Accessed 3 08 2016].

Economic assessment of the impact of electricity storage on power quality in distribution systems Belén Rabadán Travesí, ICAI
123
[19] N. Louzán Pérez and M. Pérez Donsión, "Technical methods for the prevention and correction of voltage sags and short interruptions inside the industrial plants and in the distribution networks," in International conference on renewable energy and power quality, 2003.
[20] "Measur logic," [Online]. Available: http://www.measurlogic.com/Resources/Paper1_book.pdf. [Accessed 3 July 2016].
[21] "PQ Problems," [Online]. Available: https://sites.google.com/site/druidspot/projects-1/projects/pq-problem-identification/pq-problems. [Accessed 4 July 2016].
[22] "Power Quality World," [Online]. Available: http://www.powerqualityworld.com/2011/04/voltage-swell-power-quality-basics.html. [Accessed 4 July 2016].
[23] "Top ten electrical," [Online]. Available: http://top10electrical.blogspot.com.es/2015/03/causes-of-long-interruptions.html. [Accessed 4 July 2016].
[24] E. Fumagalli, F. Delestre and L. Lo Schiavo, "Service quality regulation in electricity distribution and retail," New York, Springer, 2007, p. 153.
[25] D. Campa Cervero, "Valoración de la fiabilidad de una red eléctrica de distribución," p. 90, 2012.
[26] "Samnawar," [Online]. Available: http://samanwar.weebly.com/uploads/2/6/7/5/26754689/9813129_orig.png. [Accessed 06 08 2016].
[27] "Wikipedia," 2016. [Online]. Available: https://en.wikipedia.org/wiki/SAIDI.
[28] "Ministerior de Industria, Energía y Turismo de España," [Online]. Available: https://sedeaplicaciones.minetur.gob.es/eee/Conexion/listadoNotas.aspx. [Accessed 05 08 2016].
[29] Red eléctrica de España, "El sistema eléctrico español 2015. Síntesis," 2015.
[30] D. D. Sabin, "Indices used to asses RMS voltage variation".
[31] D. Lineweber and S. McNulty, "The cost of power disturbances to industral and digital economy companies," 2001.
[32] S. Elphick, P. Ciufo, V. Smith and S. Perera, "Summary of the economic impacts of power quality on customers," Wollongong.
[33] P. Linares and L. Rey, "The costs of electricity interruptions. Are we sending the right signals?," 2012.
[34] I. Losa, "Regulation of continuity of supply in the electricity sector and cost of energy not supplied".
[35] AEMO (Australian Energy Market Operator) , "Value of customer reliability review," 2014.

Economic assessment of the impact of electricity storage on power quality in distribution systems Belén Rabadán Travesí, ICAI
124
[36] "Simplex aerospace," [Online]. Available: http://www.simplex.aero/video-photos/bell-407-power-line-cleaning/. [Accessed 09 08 2016].
[37] HV Power, "Petersen Coils - Basic principales and applications".
[38] "Wikipedia," [Online]. Available: https://en.wikipedia.org/wiki/Uninterruptible_power_supply. [Accessed 15 08 2016].
[39] "Advanced clutch," [Online]. Available: http://www.advancedclutch.com/news-blog/wp-content/uploads/2011/02/6002901.jpg. [Accessed 17 08 2016].
[40] M. Monzón, "Calidad de suministro eléctrico: huecos de tensión. Mitigación de sus efectos en las plantas industriales," 2013.
[41] "Free energy info," [Online]. Available: http://www.free-energy-info.co.uk/Ch4/Fig3.gif. [Accessed 17 08 2016].
[42] M. A. El-Gammal, A. Y. Abou-Ghazala and T. I. El-Shennawy, "Dynamic Voltage Restorer (DVR) for voltage sag mitigation," International Journal on Electrical Engineering and Informatics , vol. 3, no. 1, p. 11, 2011.
[43] "Scientific and academic publishing," [Online]. Available: http://article.sapub.org/image/10.5923.j.control.20120204.02_010.gif. [Accessed 21 08 2016].
[44] "Tech Flo," [Online]. Available: http://www.tech-flo.net/variable-frequency-drive.html. [Accessed 21 08 2016].
[45] "Slate," [Online]. Available: http://www.slate.com/articles/health_and_science/alternative_energy/2013/03/energy_storage_technology_batteries_flywheels_compressed_air_rail_storage.html. [Accessed 23 08 2016].
[46] "Electropaedia," [Online]. Available: http://www.mpoweruk.com/images/ragone_alternatives.gif. [Accessed 23 08 2016].
[47] "BRACE-Illinois," [Online]. Available: https://braceillinois.uic.edu/climate-change/what-causes-climate-change/. [Accessed 24 08 2016].
[48] "Global climate change," NASA, [Online]. Available: http://climate.nasa.gov/evidence/. [Accessed 24 08 2016].
[49] "The british geographer," [Online]. Available: http://thebritishgeographer.weebly.com/the-impacts-of-climate-change1.html. [Accessed 24 08 2016].
[50] "Slide share," [Online]. Available: http://es.slideshare.net/ajal4u/voltage-sag. [Accessed 24 08 2016].
[51] A. Del Rosso and A. Ghia, "Efectos de la interrupción del suministro eléctrico y adaptación de los sistemas eléctricos a eventos extremos," Cámara argentina de la construcción, 2012.

Economic assessment of the impact of electricity storage on power quality in distribution systems Belén Rabadán Travesí, ICAI
125
[52] "Union of concerned scientifics," 04 2014. [Online]. Available: http://www.ucsusa.org/global_warming/science_and_impacts/impacts/effects-of-climate-change-risks-on-our-electricity-system.html#.V737LZiLTIU. [Accessed 24 08 2016].
[53] "Los viajeros," [Online]. Available: http://www.losviajeros.com/Blogs.php?b=12697. [Accessed 24 08 2016].
[54] "Wikipedia Provices of Spain," [Online]. Available: https://en.wikipedia.org/wiki/Provinces_of_Spain. [Accessed 27 08 2016].
[55] J. P. Nelson and W. D. Bolin, "Basics and Advances in Battery Systems," IEEE, vol. 31, no. 2, pp. 419-428, 1995.
[56] "Battery university. Getting to know the battery," [Online]. Available: http://batteryuniversity.com/learn/article/getting_to_know_the_battery. [Accessed 09 June 2016].
[57] "All about circuits," [Online]. Available: http://www.allaboutcircuits.com/textbook/direct-current/chpt-11/electron-activity-chemical-reactions/. [Accessed 28 June 2016].
[58] D. Gies, "New apporaches to safe ventilation of equipment containing Lead Acid and NiCd batteries," IEEE, 2015.
[59] A. Gonzalez Gil, R. Palacin and P. Batty, "Sustainable urban rail systems: strategies and technologies for optimal management of regenerative braking energy," El Sevier, pp. 375-386, 2013.
[60] "Lead-Acid Batteries," [Online]. Available: http://hyperphysics.phy-astr.gsu.edu/hbase/electric/imgele/ladis.gif.
[61] J. A. McDowall, "Substation battery options: present and future," IEEE, November 2000.
[62] M. J.Riezenman, "The search for better batteries," IEEE Spectrum, pp. 51-56, May 1995.
[63] L. Sigrist and F. Fernandez, "PWM Escalar," Madrid, 2015.

Economic assessment of the impact of electricity storage on power quality in distribution systems Belén Rabadán Travesí, ICAI
126

Economic assessment of the impact of electricity storage on power quality in distribution systems Belén Rabadán Travesí, ICAI
127
ANNEX A:
BATTERIES

Economic assessment of the impact of electricity storage on power quality in distribution systems Belén Rabadán Travesí, ICAI
128
7. ANNEX A: BATTERIES It has been already explained that the batteries are the main element of the UPS
storage system as they are the ones in charge of storing the energy. So, in order to
further our knowledge in batteries in the annex we can find a theoretical study of them.
In it, different technologies that are currently used in storage will be studied with its
benefits and disadvantages. Moreover, the need of using an DC/AC inverter will be
explained.
7.1. Batteries
A battery is an electromechanical cell which can be used to deliver current or to
power a load [37]. Therefore, the battery allows to release energy at a desired time. The
improvements in the battery world have been very slow. The main problem is that,
theoretically, the energy that can be provided by batteries is ten times higher than the
commercial equivalent [38].
Its nominal voltage is determined by the number of cells connected in series and its
discharge capacity rate is mainly determined by its size. But, how do batteries really
work? A chemical reaction called electrolysis takes place. During this reaction an ionic
bond is formed: the atoms of one element possess an excess of electrons and the atoms
of another element lack of electrons. The bond is formed because of the electrostatic
attraction between these two charges. When the ionic bond is formed from neutral
atoms the electrons are transferred from one element two the other providing electrical
current. The atom that gains the electron is said to be reduced while the atom that
releases it is said to be oxidized. In order to facilitate the reaction a chemical mixture
called electrolyte is used [39]. During this reaction the following events occur:
- Electrons from a DC load enter the cathode and are collected by the positive ion
(the PbO2 in the example shown in figure 42)
- The positive ion is neutralized by the electrons
- At the same time electrons from a negative ion are released (the Pb in figure
number 42)

Economic assessment of the impact of electricity storage on power quality in distribution systems Belén Rabadán Travesí, ICAI
129
- The electrons follow the circuit and continue the reaction
Fig. 42: Example of the reaction that takes place in a Lead-Acid battery [39].
During a battery chemical reaction water is produced, the electrolyte is weakened
and lead sulfates are formed on the electrodes. The effect that this causes in the battery
is its discharge. Also, hydrogen gas and oxygen are produced during the electrolysis.
These gases need to be releases from the battery cells and, in order to do that,
ventilation is required [40]. If the ventilation is not correct the gas can be ignited causing
serious explosions.
The state of charge of batteries describes how full a battery is. Temperature is
important as, cold batteries will show a lower voltage than hot batteries when they are
fully charged. Moreover, the depth of discharge (DOD) describes how deeply a battery
is discharged. If the DOD is 0% its means that the battery is 100% full while, if the battery
is empty, the DOD will be 100%.
The battery storage capacity is measured in Amp-hour (Ah); this is the amount of
energy charge in a battery that will allow one ampere of current to flow for one hour.
𝐴𝑚𝑝𝑒𝑟𝑒 − ℎ𝑜𝑢𝑟𝑠 = 𝑎𝑚𝑝𝑒𝑟𝑒 ∗ 𝑑𝑖𝑠𝑐ℎ𝑎𝑟𝑔𝑒 ℎ𝑜𝑢𝑟𝑠
The quantity of current that can be delivered by a battery depends, not only on its
battery storage capacity, but also in the speed the battery has to release that current.

Economic assessment of the impact of electricity storage on power quality in distribution systems Belén Rabadán Travesí, ICAI
130
As a fluid stored in a container, the energy of a battery can be dispensed slower over a
long period of time or faster over a short period of time [38].
A battery system is made up of different cells configured in series/parallel arrays in
order to obtain the amount of voltage and current that are required by the
system. The electricity obtained in the batteries needs to be modified so that it
is suitable for the loads in the system. Therefore, this process is followed:
- Adjusting the current and voltage to maximize power output
- Converting the DC power to AC power using an inverter
- Matching the converted AC electricity to a utility’s AC electrical network
- Halting the current flow from the system into the grid during the utility outages
to safeguard utility personnel
The introduction of batteries in the electrical system will help improving the
continuity and quality of supply. As the continuity is measured by indexes that count the
number and/or duration of the outages, the inclusion of batteries will reduce its figures
as the outages will take shorter (while the outage is being solved the batteries will
proportionate the necessary energy).
Depending on how they make the chemical energy to electrical energy conversion
we can find three main types of batteries:

Economic assessment of the impact of electricity storage on power quality in distribution systems Belén Rabadán Travesí, ICAI
131
Fig. 43: Types of rechargeable batteries.
Although we can find different types of batteries in the market they all have one
thing in common: they can also last for a certain amount of cycles. Therefore, battery
replacement is always needed. The idea of an uninterrupted energy source is still a
dream [38].
7.1.1. Lead-Acid batteries
Lead-Acid batteries are the oldest ones; they were invented in 1859 by the
French physicist Gaston Planté. As it is shown in figure number 44 its electrodes are
made of lead metal and lead oxide and its electrolyte consists in a diluted sulphuric acid
solution. During its discharge the electrodes turn into lead sulphate while the electrolyte
becomes water. [41]
Rechargeablebatteries
Lead-Acid
Flooded (FLA)
Valve regulated (VRLA)
Nickel cadmium Lithium-Ion

Economic assessment of the impact of electricity storage on power quality in distribution systems Belén Rabadán Travesí, ICAI
132
Fig. 44: Reaction that takes place in the lead-acid batteries. [42].
The cost-benefit ratio of this batteries is quite good since they have relatively
low costs, high reliability and efficiency (75%-80%). Moreover, their self-discharge rates
are very low (<0.1%). Their lifespan is very limited as it consists in 1200-1800 cycles.
Among their disadvantages we can find the fact that they cannot be discharged
completely because, leaving these batteries discharged causes sulfation (phenomena
during which amorphous lead sulfate converts to stable crystalline and deposits on the
negative plates). Also, they have negative impact on the environment because of the
lead processing, very low temperature performance, very low self-discharge rates and
its life shortens if the battery is discharged below 30%. Its optimum operating time is
25ºC and temperature represents an important role in its behavior (a rise of 8 degrees
will reduce its lifespan in half).
They can be found installed in uninterruptible power systems (UPS), renewable
power systems and distribution systems.
We can distinguish two categories of lead-acid batteries: flooded lead-acid (FLA)
and valve regulated lead-acid (VRLA).
7.1.1.1. Flooded Lead-Acid batteries
They are also made of lead but, while its positive electrode is made of lead dioxide
the negative one is made of thinly divided lead.
The FLA batteries’ batteries have the longest life and the least cost per amp-hour.
Their principal inconvenience is that they need a strict maintenance. They are the most

Economic assessment of the impact of electricity storage on power quality in distribution systems Belén Rabadán Travesí, ICAI
133
common ones as they entered the marketplace first. These batteries have a wide range
of applications including solar and wind electric systems.
7.1.1.2. Valve-Regulated Acid batteries
These batteries, instead of having a liquid electrolyte have a Gel or AGM (Absorbed
Glass Mat) electrolyte. The venting of the products of electrolysis is controlled by
reclosing pressure-sensitive valve; therefore, no ventilation is required and no constant
maintenance is needed.
The disadvantages of VRLA batteries are that they are less robust than FLA and have
a shorter life. Moreover, its subsystem may need to be replaced more frequently than
with FLA making them more expensive.
VRLA batteries are the most used ones because of their high power density and ease
of use. They can also be used in reduced spaces as no ventilation is required. Among
their applications are electronics, wheelchairs, motorcycles…
7.1.2. Nickel-Cadmium batteries
Nickel-Cadmium batteries are a type of batteries that use nickel oxide hydroxide
as the positive electrode and metallic cadmium as the negative one, its electrolyte
consists in an alkaline potassium hydroxide KOH.
These batteries have the disadvantage of having a higher initial cost than lead-
acid ones but, in contrast, they have a longer life (>3500 cycles). They also have quick
charge and discharge capabilities.
In comparison with lead-acid these batteries have a higher resistance to
temperature. As it was mentioned before, lead-acid batteries reduce their lifespan by
50% with an increase of temperature of 8ºC above 25ºC while Ni-Cd batteries reduce
their lifespan only by 20%. Moreover, Ni-Cd batteries’ plates don’t suffer degradation
because the alkaline electrolyte used protects them from corrosion [43]. Another
problem with NiCd batteries is that they lose charge even when they are not being used,
around 1% per day. They also have low efficiency (60%-70%).

Economic assessment of the impact of electricity storage on power quality in distribution systems Belén Rabadán Travesí, ICAI
134
Nowadays, they are losing power because of their memory effect. This memory
effect is that, if a Ni-Cd battery is recharged repeatedly after being discharged for
example, 60% , it will become incapable of delivering more than 60% of its capacity [44].
So, the battery will “think” that it is fully charged when it is really only 60% charged. The
memory effect is caused by a change in the crystalline formation of the Cadmium from
a small size to a big size. The large crystal increases the cell impedance and cause the
self-discharge of the battery. Therefore, as the cadmium is the element behind the
memory effect Ni-Cd batteries are now being replaced by Nickel-Metal Hydride (NiMH)
batteries.
Their main use currently is the domestic one. They can be found in portable
electronics (such as solar garden lights) and toys. Ni-Cd batteries are also used in
photographic equipment, emergency lighting and wireless telephones.
7.1.3. Lithium-Ion batteries
Lithium-Ion batteries are a type of rechargeable batteries. Its positive electrode is
made of lithium metallic oxide while its negative electrode is made of a carbon material.
The electrolyte used is a lithium salt in an organic solvent. During charging, lithium ions
flow from the positive electrode tot the negative one trough the electrolyte. In the
negative electrode electrons and ions combine so lithium is deposited there. The flow
of ions is interrupted when the battery is fully charged. This same process, the other
way round, takes place when the battery is discharging.
This type of batteries has a lot of advantages such as high energy density, fast charge
and high round trip efficiency (80%-90%). Moreover, they have a long cycle life, around
3000 cycles. They are more expensive than NiCd ones but they operate over a wider
temperature. Compared to NiCd batteries their self-discharge rate is much lower as it is
only 2% per month, while in NiCd it was almost 30% per month.
Their main disadvantage is that they are currently very expensive. This is due to the
special packaging required and the internal overcharge protection that the circuits need.
Moreover, as they need less volume to generate more energy their price rises even

Economic assessment of the impact of electricity storage on power quality in distribution systems Belén Rabadán Travesí, ICAI
135
more. They also have a short life, approximately 3 years, even if they are or they are not
used.
Li-Ion batteries are the most demanded ones in the mobile phone market due to
their huge energy/weight ratio. Also, in the last years Li-Ion batteries have been installed
in electric vehicles.
7.1.4. Comparison of batteries
In the following table we can found a comparison between the three main types of
batteries. The most important characteristics are the ones shown.
Cell type Lead-Acid Nickel-Cadmium Lithium-Ion
Voltage (V) 2.0 1.2 3.0
Power density Moderate Moderate Very high
Specific energy (Wh/kg) 30-40 50-60 130-200
Self-discharge (%per month) 4-8 20-30 1-2
DOD (V/cell) 1.75 1.0 3.0
Life cycles 1200-1800 >3500 3000-3200
Weight comparison for the same capacity 4 2 1
Size comparison for the same capacity 3.5 1.8 1
Cost Moderate Moderate High
Table 34: Comparison of the different types of batteries.
7.1.5. Advancements in batteries
Even though we are living in the technological era the advancements in batteries
during the last decades have been very shots. Batteries have several limitations: they
are heavy, they have a short life span and they can only storage a small amount of
power. Moreover, the smaller the battery, the higher its cost. So, currently, there are
two main fronts of advancement in batteries: increasing its specific energy in order to
obtain longer runtimes and increasing its specific power to obtain high-current load
requirements. In figure number 45 we can find the relationship between these two
improvements according to the battery type.
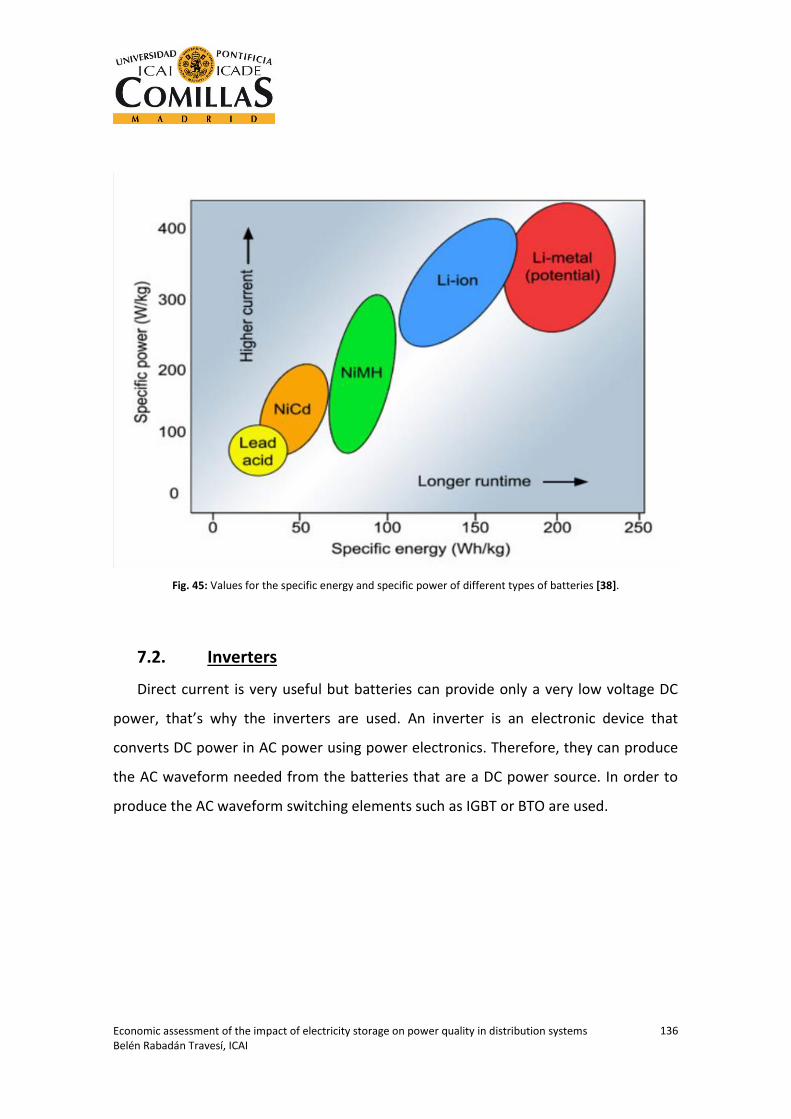
Economic assessment of the impact of electricity storage on power quality in distribution systems Belén Rabadán Travesí, ICAI
136
Fig. 45: Values for the specific energy and specific power of different types of batteries [38].
7.2. Inverters
Direct current is very useful but batteries can provide only a very low voltage DC
power, that’s why the inverters are used. An inverter is an electronic device that
converts DC power in AC power using power electronics. Therefore, they can produce
the AC waveform needed from the batteries that are a DC power source. In order to
produce the AC waveform switching elements such as IGBT or BTO are used.

Economic assessment of the impact of electricity storage on power quality in distribution systems Belén Rabadán Travesí, ICAI
137
Fig. 46: Inverter [45].
Depending on the requirements of the network the inverter needs to work within
voltage and frequency margin. A filter is usually inserted in the system to reject the
switching frequencies that could deteriorate the power quality. Moreover, modulation
(adjusting the switching of the elements) will help by reducing the harmonic distortion.

Economic assessment of the impact of electricity storage on power quality in distribution systems Belén Rabadán Travesí, ICAI
138

Economic assessment of the impact of electricity storage on power quality in distribution systems Belén Rabadán Travesí, ICAI
139

Economic assessment of the impact of electricity storage on power quality in distribution systems Belén Rabadán Travesí, ICAI
140