economic assumptions & actuarial methods
TRANSCRIPT
Economic Assumptions & Actuarial Methods OREGON PUBLIC EMPLOYEES RETIREMENT SYSTEM
May 26, 2017
This work product was prepared for discussion purposes only and may not be appropriate to use for other purposes. Milliman does not intend to benefit and assumes no duty or liability to other parties who receive this work. Any recipient of this work product who desires professional guidance should engage qualified professionals for advice appropriate to its own specific needs.
Presented by:
Matt Larrabee, FSA, EA
Scott Preppernau, FSA, EA
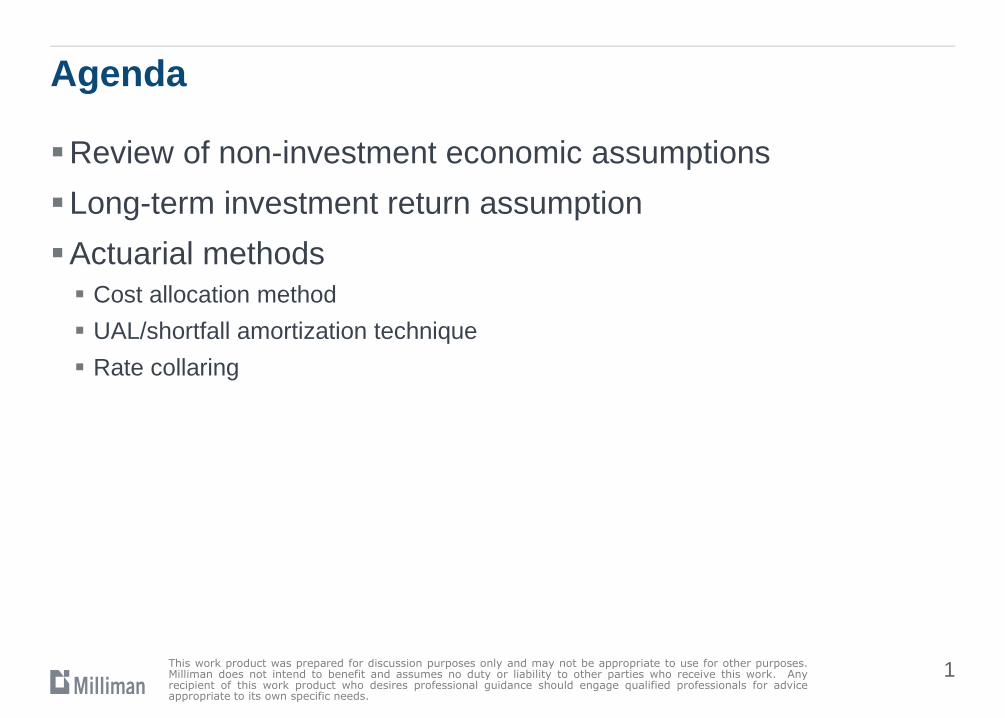
Agenda
Review of non-investment economic assumptions
Long-term investment return assumption
Actuarial methods
Cost allocation method
UAL/shortfall amortization technique
Rate collaring
This work product was prepared for discussion purposes only and may not be appropriate to use for other purposes. Milliman does not intend to benefit and assumes no duty or liability to other parties who receive this work. Any recipient of this work product who desires professional guidance should engage qualified professionals for advice appropriate to its own specific needs.
1
System Liability System Normal Cost
Projected Future Benefit Payments
Funded Status Contribution Rates
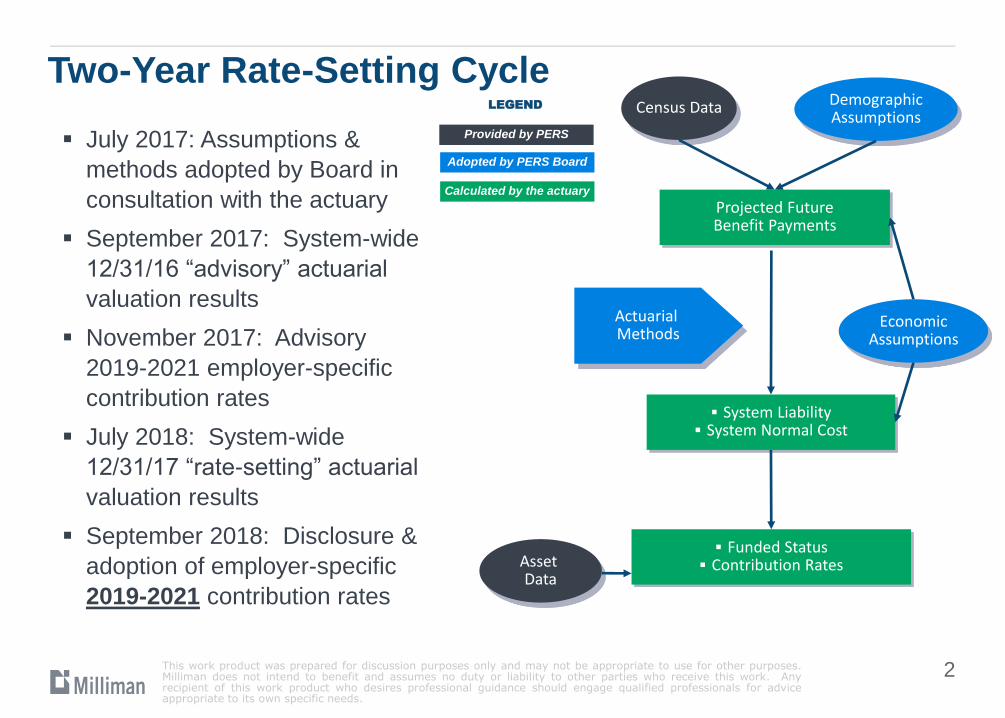
July 2017: Assumptions &
methods adopted by Board in
consultation with the actuary
September 2017: System-wide
12/31/16 “advisory” actuarial
valuation results
November 2017: Advisory
2019-2021 employer-specific
contribution rates
July 2018: System-wide
12/31/17 “rate-setting” actuarial
valuation results
September 2018: Disclosure &
adoption of employer-specific
2019-2021 contribution rates
Census Data Demographic Assumptions
Economic Assumptions
Asset Data
Actuarial Methods
Provided by PERS
Adopted by PERS Board
Calculated by the actuary
LEGEND
This work product was prepared for discussion purposes only and may not be appropriate to use for other purposes. Milliman does not intend to benefit and assumes no duty or liability to other parties who receive this work. Any recipient of this work product who desires professional guidance should engage qualified professionals for advice appropriate to its own specific needs.
Two-Year Rate-Setting Cycle
2
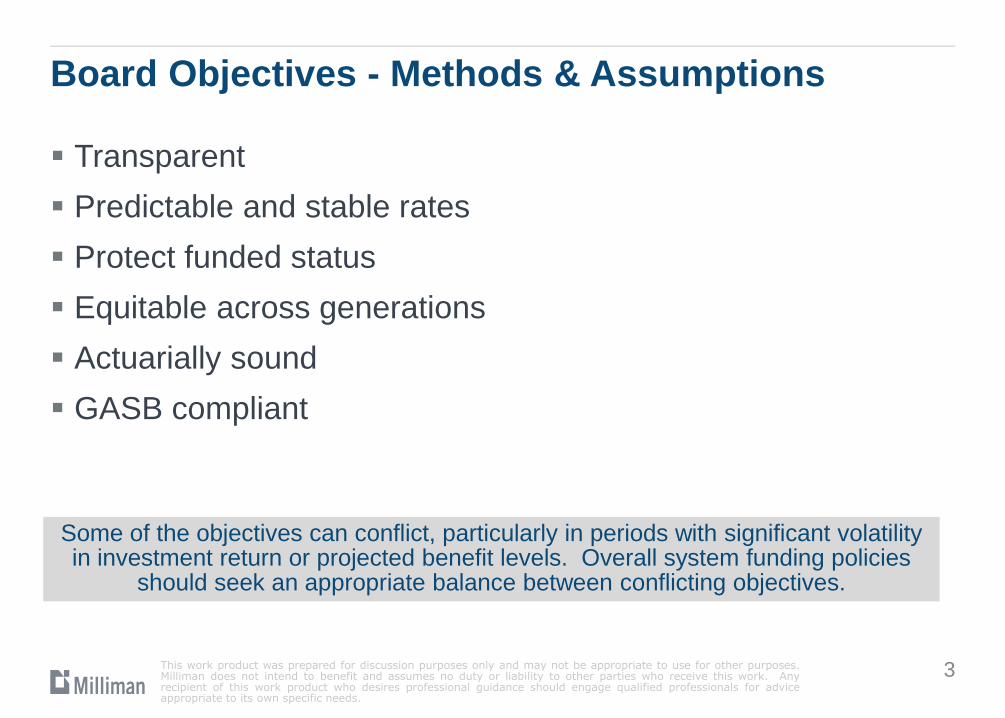
Board Objectives - Methods & Assumptions
Transparent
Predictable and stable rates
Protect funded status
Equitable across generations
Actuarially sound
GASB compliant
This work product was prepared for discussion purposes only and may not be appropriate to use for other purposes. Milliman does not intend to benefit and assumes no duty or liability to other parties who receive this work. Any recipient of this work product who desires professional guidance should engage qualified professionals for advice appropriate to its own specific needs.
Some of the objectives can conflict, particularly in periods with significant volatility in investment return or projected benefit levels. Overall system funding policies
should seek an appropriate balance between conflicting objectives.
3
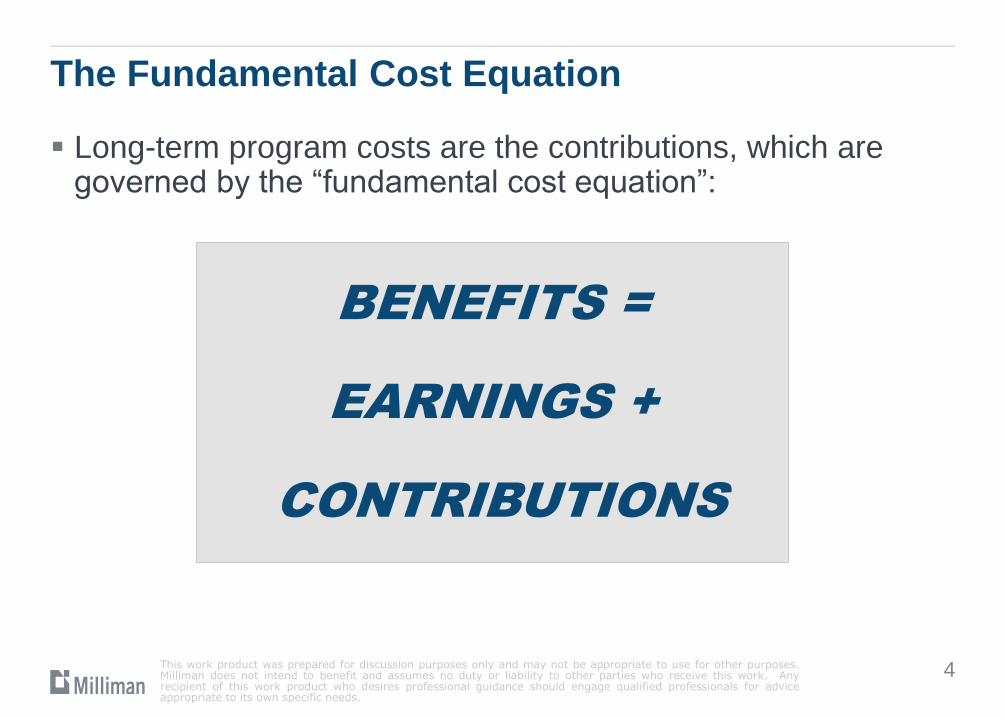
The Fundamental Cost Equation
Long-term program costs are the contributions, which are governed by the “fundamental cost equation”:
This work product was prepared for discussion purposes only and may not be appropriate to use for other purposes. Milliman does not intend to benefit and assumes no duty or liability to other parties who receive this work. Any recipient of this work product who desires professional guidance should engage qualified professionals for advice appropriate to its own specific needs.
BENEFITS =
EARNINGS +
CONTRIBUTIONS
4

Governance Structure
Benefits:
Plan design set by Oregon Legislature
Subject to judicial review
Earnings:
Asset allocation set by OIC
Actual returns determined by market
This work product was prepared for discussion purposes only and may not be appropriate to use for other purposes. Milliman does not intend to benefit and assumes no duty or liability to other parties who receive this work. Any recipient of this work product who desires professional guidance should engage qualified professionals for advice appropriate to its own specific needs.
Contributions:
Funding, including methods & assumptions, set by PERS Board
Since contributions are the balancing item in the fundamental cost equation, PERS Board policies primarily affect the timing of contributions
Different actuarial methods and assumptions produce different projected future contribution patterns
5
Review of Non-Investment
Economic Assumptions
This work product was prepared for discussion purposes only and may not be appropriate to use for other purposes. Milliman does not intend to benefit and assumes no duty or liability to other parties who receive this work. Any recipient of this work product who desires professional guidance should engage qualified professionals for advice appropriate to its own specific needs.
6
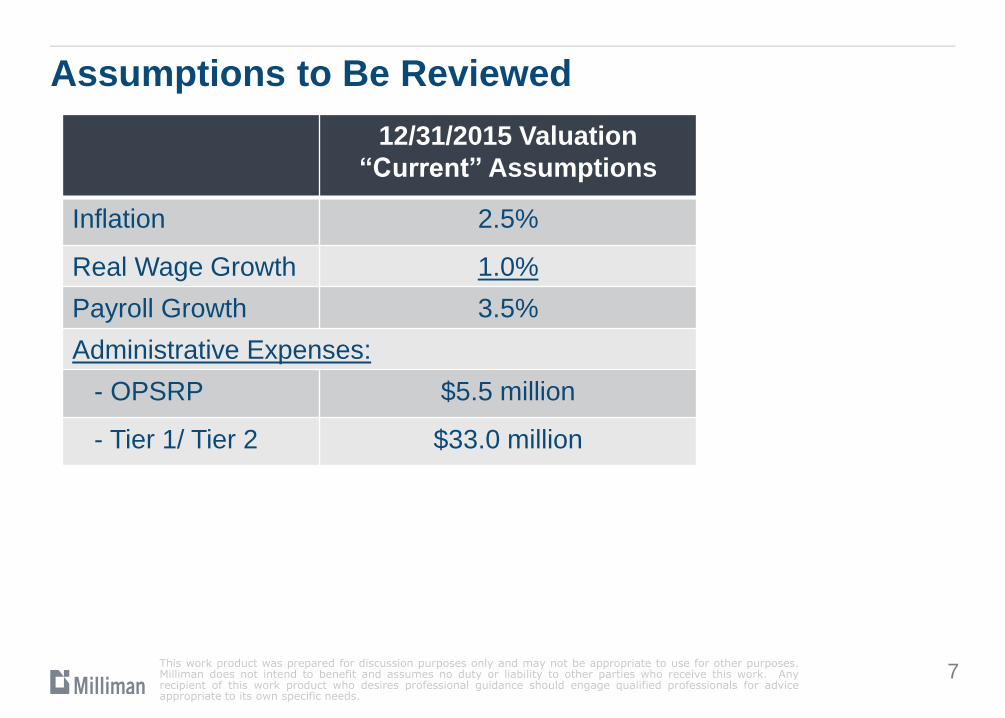
Assumptions to Be Reviewed
This work product was prepared for discussion purposes only and may not be appropriate to use for other purposes. Milliman does not intend to benefit and assumes no duty or liability to other parties who receive this work. Any recipient of this work product who desires professional guidance should engage qualified professionals for advice appropriate to its own specific needs.
12/31/2015 Valuation
“Current” Assumptions
Inflation 2.5%
Real Wage Growth 1.0%
Payroll Growth 3.5%
Administrative Expenses:
- OPSRP $5.5 million
- Tier 1/ Tier 2 $33.0 million
7
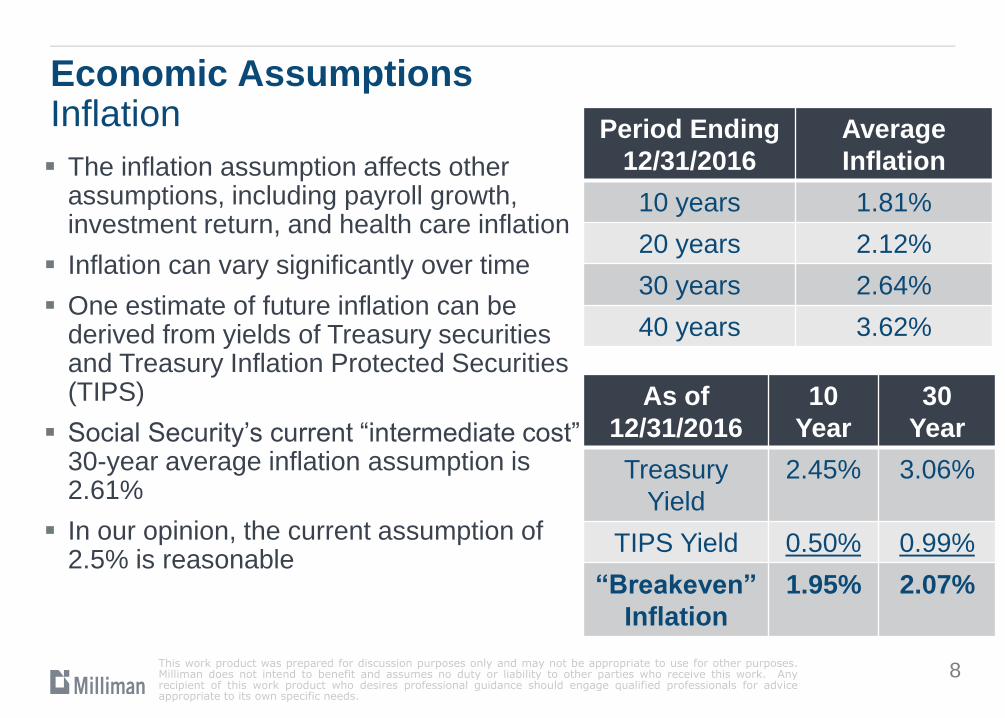
Economic Assumptions Inflation
The inflation assumption affects other assumptions, including payroll growth, investment return, and health care inflation
Inflation can vary significantly over time
One estimate of future inflation can be derived from yields of Treasury securities and Treasury Inflation Protected Securities (TIPS)
Social Security’s current “intermediate cost” 30-year average inflation assumption is 2.61%
In our opinion, the current assumption of 2.5% is reasonable
This work product was prepared for discussion purposes only and may not be appropriate to use for other purposes. Milliman does not intend to benefit and assumes no duty or liability to other parties who receive this work. Any recipient of this work product who desires professional guidance should engage qualified professionals for advice appropriate to its own specific needs.
As of
12/31/2016
10
Year
30
Year
Treasury
Yield
2.45% 3.06%
TIPS Yield 0.50% 0.99%
“Breakeven”
Inflation
1.95% 2.07%
Period Ending
12/31/2016
Average
Inflation
10 years 1.81%
20 years 2.12%
30 years 2.64%
40 years 3.62%
8
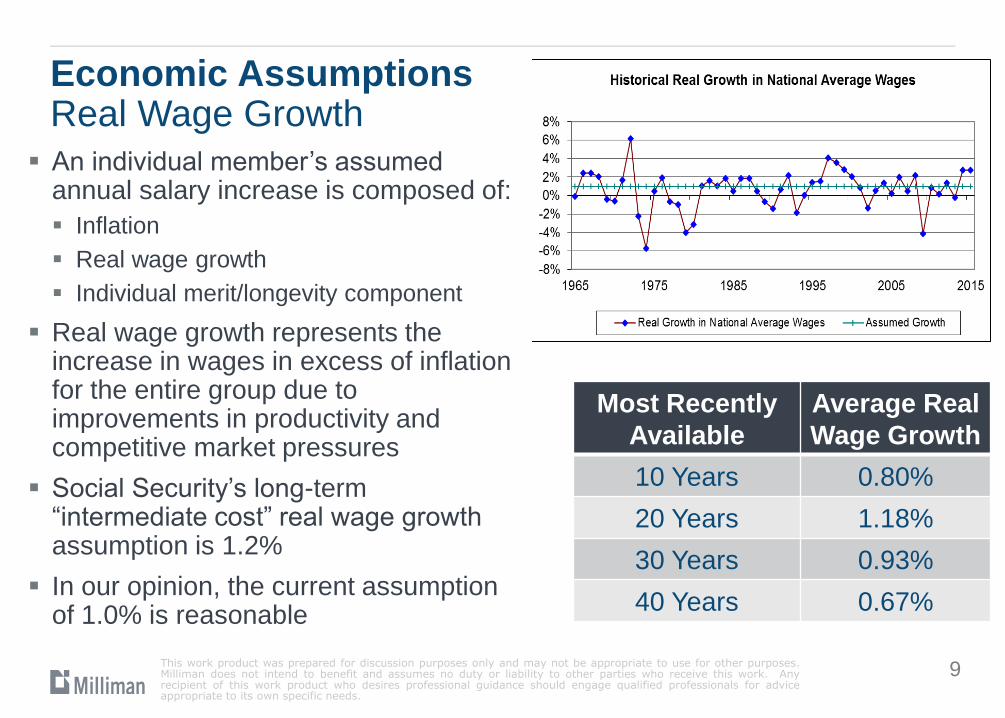
Economic Assumptions Real Wage Growth
An individual member’s assumed annual salary increase is composed of:
Inflation
Real wage growth
Individual merit/longevity component
Real wage growth represents the increase in wages in excess of inflation for the entire group due to improvements in productivity and competitive market pressures
Social Security’s long-term “intermediate cost” real wage growth assumption is 1.2%
In our opinion, the current assumption of 1.0% is reasonable
This work product was prepared for discussion purposes only and may not be appropriate to use for other purposes. Milliman does not intend to benefit and assumes no duty or liability to other parties who receive this work. Any recipient of this work product who desires professional guidance should engage qualified professionals for advice appropriate to its own specific needs.
Most Recently
Available
Average Real
Wage Growth
10 Years 0.80%
20 Years 1.18%
30 Years 0.93%
40 Years 0.67%
9
Economic Assumptions Payroll Growth
Overall system payroll growth is assumed to equal the sum of:
Inflation
Real wage growth
The system payroll growth assumption determines the shape of the curve of payments to amortize the unfunded liability
Given that in our opinion both an inflation assumption of 2.5% and a real wage growth assumption of 1.0% are reasonable, the current payroll growth assumption of 3.5% is also reasonable in our opinion
Over the past ten years, average annualized system valuation payroll growth has been approximately 3.5%
This work product was prepared for discussion purposes only and may not be appropriate to use for other purposes. Milliman does not intend to benefit and assumes no duty or liability to other parties who receive this work. Any recipient of this work product who desires professional guidance should engage qualified professionals for advice appropriate to its own specific needs.
10
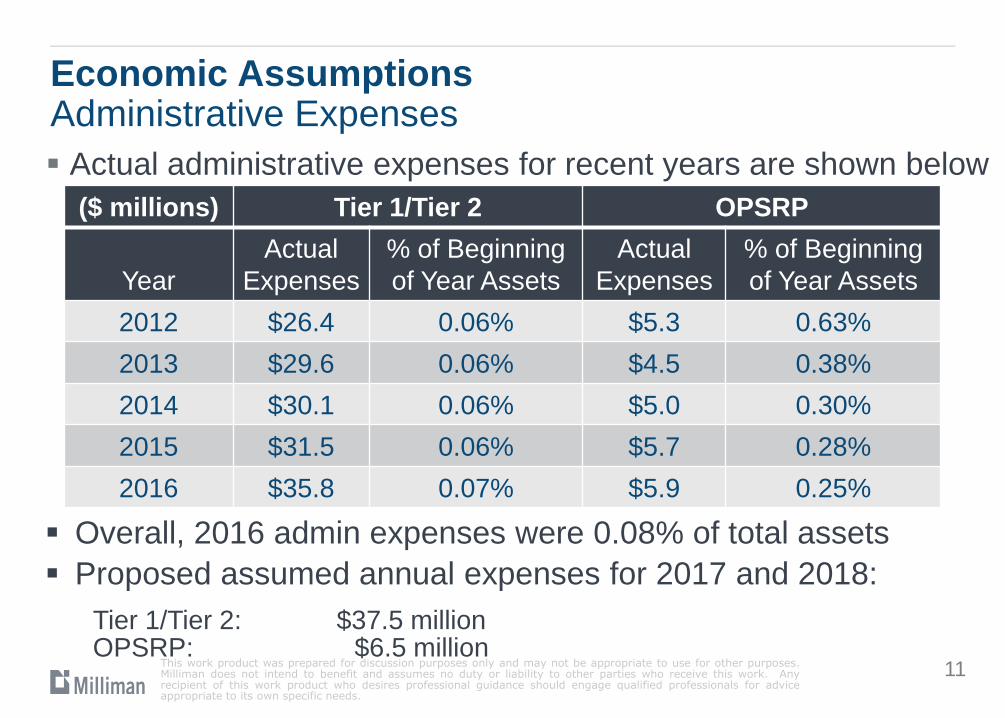
Economic Assumptions Administrative Expenses
Actual administrative expenses for recent years are shown below
This work product was prepared for discussion purposes only and may not be appropriate to use for other purposes. Milliman does not intend to benefit and assumes no duty or liability to other parties who receive this work. Any recipient of this work product who desires professional guidance should engage qualified professionals for advice appropriate to its own specific needs.
($ millions) Tier 1/Tier 2 OPSRP
Year
Actual
Expenses
% of Beginning
of Year Assets
Actual
Expenses
% of Beginning
of Year Assets
2012 $26.4 0.06% $5.3 0.63%
2013 $29.6 0.06% $4.5 0.38%
2014 $30.1 0.06% $5.0 0.30%
2015 $31.5 0.06% $5.7 0.28%
2016 $35.8 0.07% $5.9 0.25%
11
Overall, 2016 admin expenses were 0.08% of total assets
Proposed assumed annual expenses for 2017 and 2018:
Tier 1/Tier 2: $37.5 million OPSRP: $6.5 million
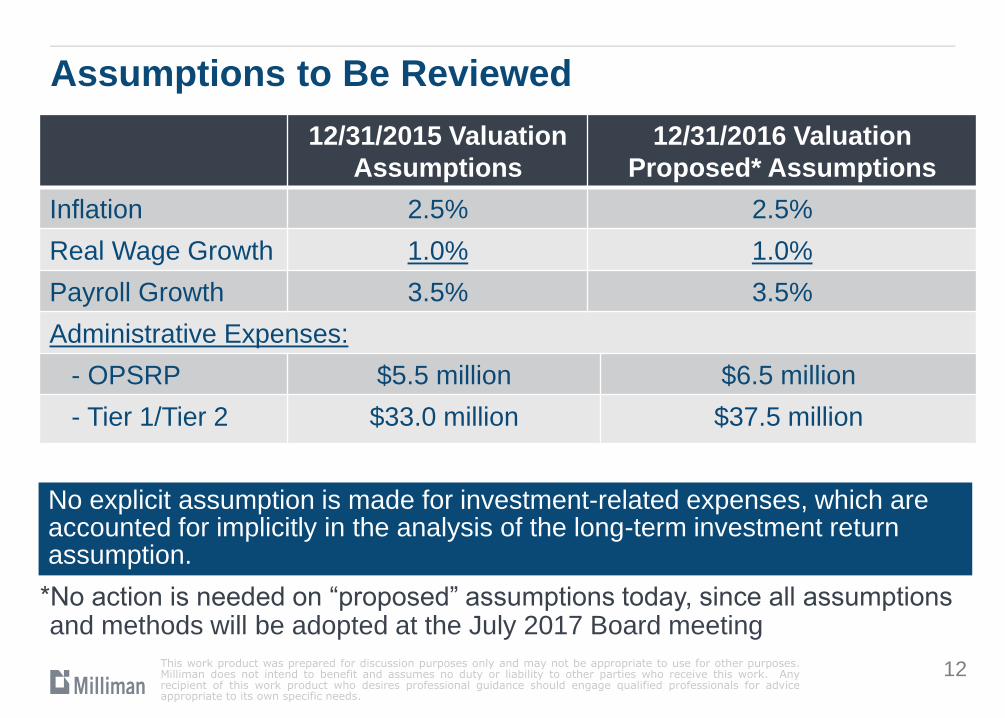
Assumptions to Be Reviewed
This work product was prepared for discussion purposes only and may not be appropriate to use for other purposes. Milliman does not intend to benefit and assumes no duty or liability to other parties who receive this work. Any recipient of this work product who desires professional guidance should engage qualified professionals for advice appropriate to its own specific needs.
12/31/2015 Valuation
Assumptions
12/31/2016 Valuation
Proposed* Assumptions
Inflation 2.5% 2.5%
Real Wage Growth 1.0% 1.0%
Payroll Growth 3.5% 3.5%
Administrative Expenses:
- OPSRP $5.5 million $6.5 million
- Tier 1/Tier 2 $33.0 million $37.5 million
No explicit assumption is made for investment-related expenses, which are accounted for implicitly in the analysis of the long-term investment return assumption.
12
*No action is needed on “proposed” assumptions today, since all assumptions and methods will be adopted at the July 2017 Board meeting
Long-Term Investment Return
Assumption
This work product was prepared for discussion purposes only and may not be appropriate to use for other purposes. Milliman does not intend to benefit and assumes no duty or liability to other parties who receive this work. Any recipient of this work product who desires professional guidance should engage qualified professionals for advice appropriate to its own specific needs.
13
Long-Term Investment Return Assumption
Uses of the investment return assumption
As a “discount rate” for establishing the:
Actuarial accrued liability, which is a net present value
Associated unfunded actuarial liability, also called the UAL or actuarial shortfall
Guaranteed crediting level for regular Tier 1 active member account balances
Annuitization rate for converting member account balances to lifetime money match monthly benefits
This work product was prepared for discussion purposes only and may not be appropriate to use for other purposes. Milliman does not intend to benefit and assumes no duty or liability to other parties who receive this work. Any recipient of this work product who desires professional guidance should engage qualified professionals for advice appropriate to its own specific needs.
Reflecting expectations for both investment earnings and benefit levels for certain members, the assumption helps set a reasonable and appropriate budgeting glide path for projected employer contribution rates
14
Investment Return Estimates
To assist the Board, we developed return estimates based on capital market outlook assumptions from four sources and an industry standard mean/variance model
Milliman
Callan – Consultant to OIC
Pension Consulting Alliance (PCA) – Consultant to OIC
2016 Horizon survey of capital market assumptions (survey of 35 advisors)
Estimates do not reflect any possible “alpha” due to selected managers potentially outperforming market benchmarks over the long term, net of fees
Today’s speakers are not credentialed investment advisors
We are presenting Milliman capital market outlook model results based on assumptions developed by Milliman’s credentialed investment professionals
This work product was prepared for discussion purposes only and may not be appropriate to use for other purposes. Milliman does not intend to benefit and assumes no duty or liability to other parties who receive this work. Any recipient of this work product who desires professional guidance should engage qualified professionals for advice appropriate to its own specific needs.
Details on each set of capital market outlook assumptions are in the Appendix
15
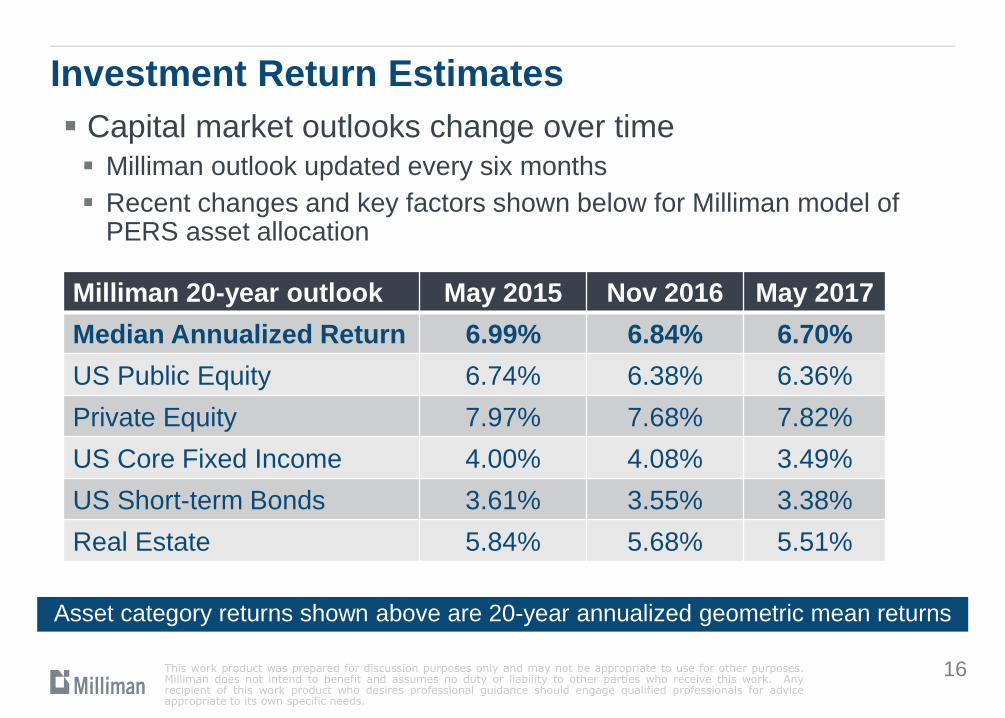
Investment Return Estimates
Capital market outlooks change over time
Milliman outlook updated every six months
Recent changes and key factors shown below for Milliman model of PERS asset allocation
This work product was prepared for discussion purposes only and may not be appropriate to use for other purposes. Milliman does not intend to benefit and assumes no duty or liability to other parties who receive this work. Any recipient of this work product who desires professional guidance should engage qualified professionals for advice appropriate to its own specific needs.
Milliman 20-year outlook May 2015 Nov 2016 May 2017
Median Annualized Return 6.99% 6.84% 6.70%
US Public Equity 6.74% 6.38% 6.36%
Private Equity 7.97% 7.68% 7.82%
US Core Fixed Income 4.00% 4.08% 3.49%
US Short-term Bonds 3.61% 3.55% 3.38%
Real Estate 5.84% 5.68% 5.51%
Asset category returns shown above are 20-year annualized geometric mean returns
16
Investment Return Estimates
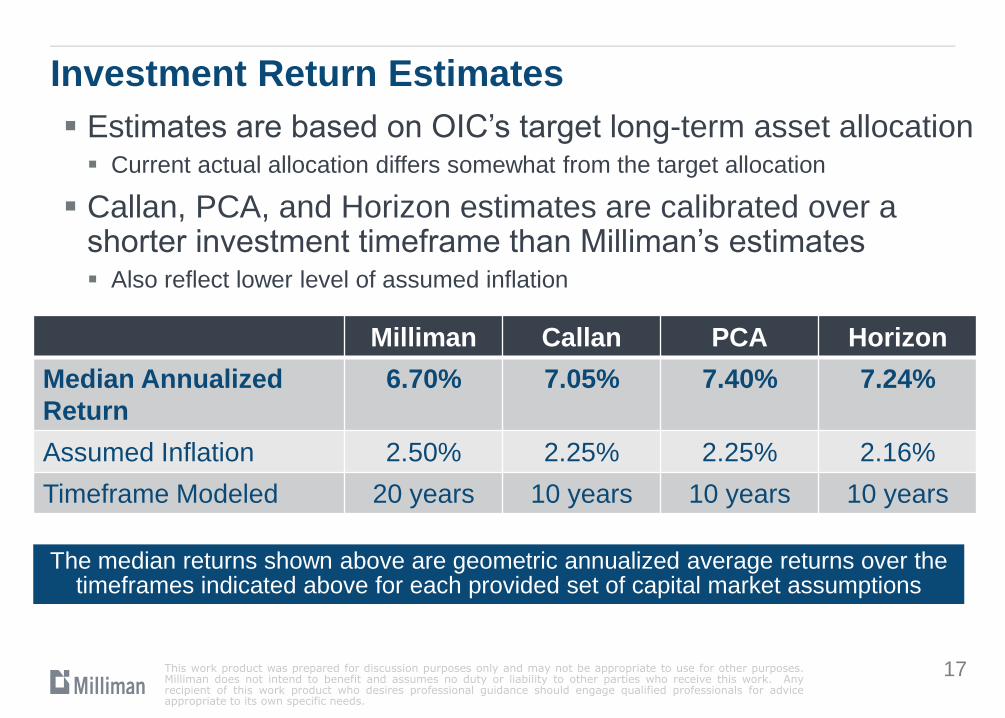
Estimates are based on OIC’s target long-term asset allocation Current actual allocation differs somewhat from the target allocation
Callan, PCA, and Horizon estimates are calibrated over a shorter investment timeframe than Milliman’s estimates Also reflect lower level of assumed inflation
This work product was prepared for discussion purposes only and may not be appropriate to use for other purposes. Milliman does not intend to benefit and assumes no duty or liability to other parties who receive this work. Any recipient of this work product who desires professional guidance should engage qualified professionals for advice appropriate to its own specific needs.
Milliman Callan PCA Horizon
Median Annualized
Return
6.70% 7.05% 7.40% 7.24%
Assumed Inflation 2.50% 2.25% 2.25% 2.16%
Timeframe Modeled 20 years 10 years 10 years 10 years
The median returns shown above are geometric annualized average returns over the timeframes indicated above for each provided set of capital market assumptions
17
Effects of Lowering the Assumed Return
A lower investment return assumption would produce higher calculated liabilities and contribution rates
Liabilities are net present values, as of the valuation date, of a benefit payment projection that stretches far into the future Changing the assumption modifies the projected balance of the fundamental cost
equation between future investment earnings and future contributions
The actual balance will depend on actual investment earnings, not on the assumed return adopted by the PERS Board
The effect of lowering the assumed return to 7.00% is estimated as a 3.5% of payroll increase (or 1.8% of payroll increase at a 7.25% assumption) in the uncollared system average base employer contribution rate
For PERS, such an assumption change would also lower benefits for future retirements calculated under Money Match From “PERS by the Numbers”, in 2016 the Money Match formula determined
benefits for 34% of retirees (typically long-service General Service members)
Illustration for a hypothetical Tier 1 member shown in Appendix
This work product was prepared for discussion purposes only and may not be appropriate to use for other purposes. Milliman does not intend to benefit and assumes no duty or liability to other parties who receive this work. Any recipient of this work product who desires professional guidance should engage qualified professionals for advice appropriate to its own specific needs.
18
Financial Modeling & The Return Assumption Milliman prepared additional financial modeling projections,
building on work from the November 2016 Board meeting
Includes projections under both:
7.5% investment return assumption (as presented in November 2016)
7.0% investment return assumption (as requested for subsequent analysis)
Results are illustrative, not presuming a specific Board decision on investment return assumption
See November 2016 Board materials for discussion of modeling basis and assumptions
This work product was prepared for discussion purposes only and may not be appropriate to use for other purposes. Milliman does not intend to benefit and assumes no duty or liability to other parties who receive this work. Any recipient of this work product who desires professional guidance should engage qualified professionals for advice appropriate to its own specific needs.
19
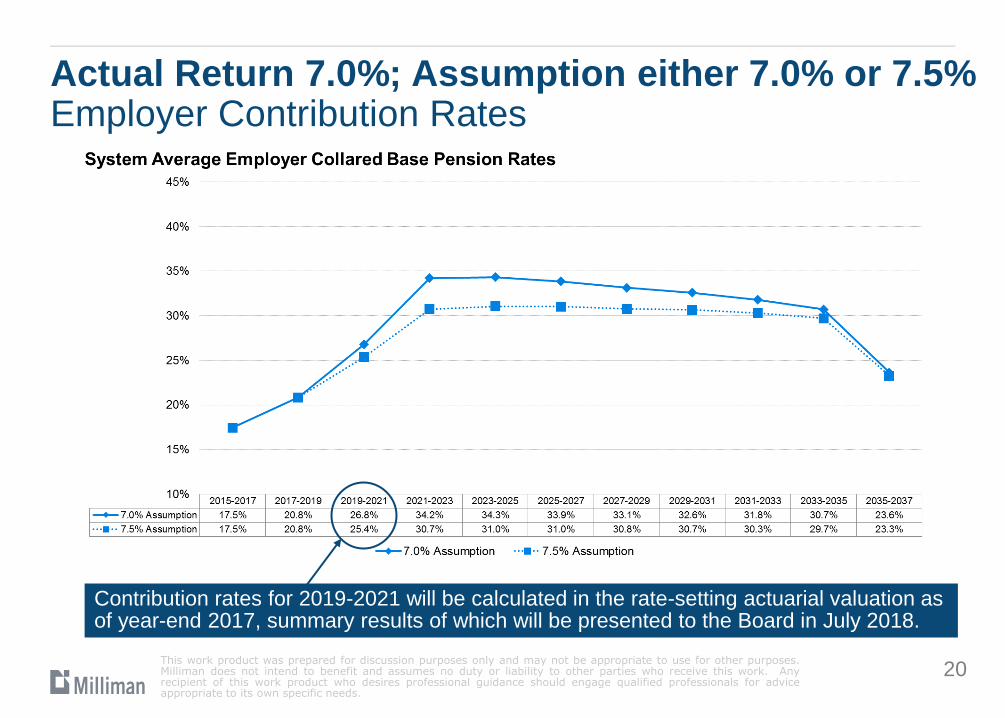
Actual Return 7.0%; Assumption either 7.0% or 7.5% Employer Contribution Rates
This work product was prepared for discussion purposes only and may not be appropriate to use for other purposes. Milliman does not intend to benefit and assumes no duty or liability to other parties who receive this work. Any recipient of this work product who desires professional guidance should engage qualified professionals for advice appropriate to its own specific needs.
20
Contribution rates for 2019-2021 will be calculated in the rate-setting actuarial valuation as of year-end 2017, summary results of which will be presented to the Board in July 2018.
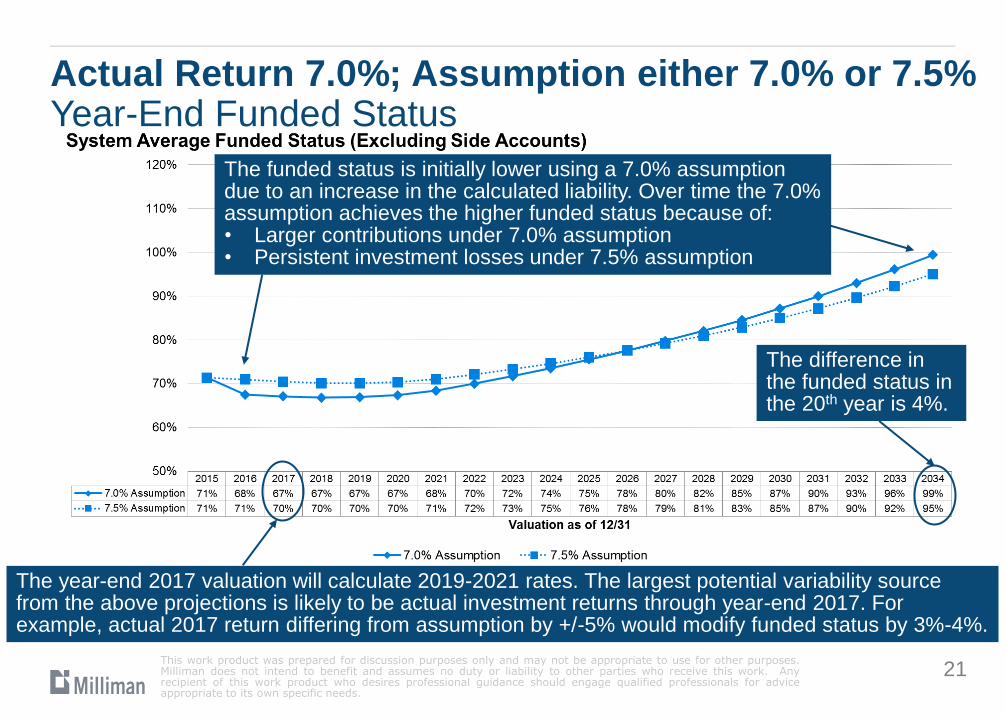
Actual Return 7.0%; Assumption either 7.0% or 7.5% Year-End Funded Status
This work product was prepared for discussion purposes only and may not be appropriate to use for other purposes. Milliman does not intend to benefit and assumes no duty or liability to other parties who receive this work. Any recipient of this work product who desires professional guidance should engage qualified professionals for advice appropriate to its own specific needs.
21
The year-end 2017 valuation will calculate 2019-2021 rates. The largest potential variability source from the above projections is likely to be actual investment returns through year-end 2017. For example, actual 2017 return differing from assumption by +/-5% would modify funded status by 3%-4%.
The difference in the funded status in the 20th year is 4%.
The funded status is initially lower using a 7.0% assumption due to an increase in the calculated liability. Over time the 7.0% assumption achieves the higher funded status because of: • Larger contributions under 7.0% assumption • Persistent investment losses under 7.5% assumption
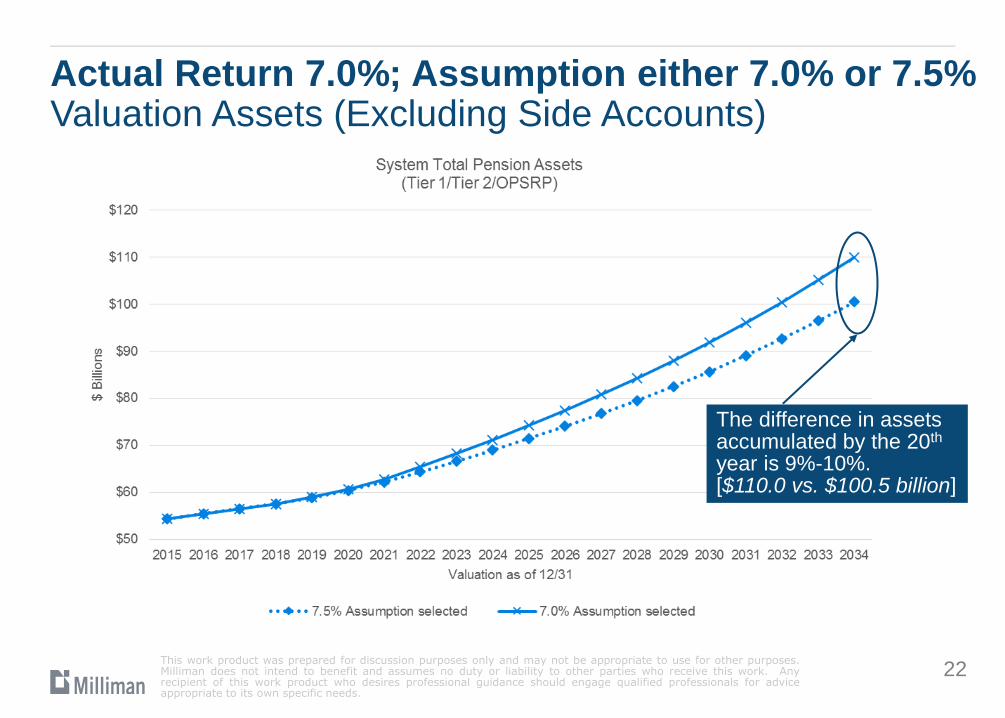
Actual Return 7.0%; Assumption either 7.0% or 7.5% Valuation Assets (Excluding Side Accounts)
This work product was prepared for discussion purposes only and may not be appropriate to use for other purposes. Milliman does not intend to benefit and assumes no duty or liability to other parties who receive this work. Any recipient of this work product who desires professional guidance should engage qualified professionals for advice appropriate to its own specific needs.
22
The difference in assets accumulated by the 20th year is 9%-10%. [$110.0 vs. $100.5 billion]
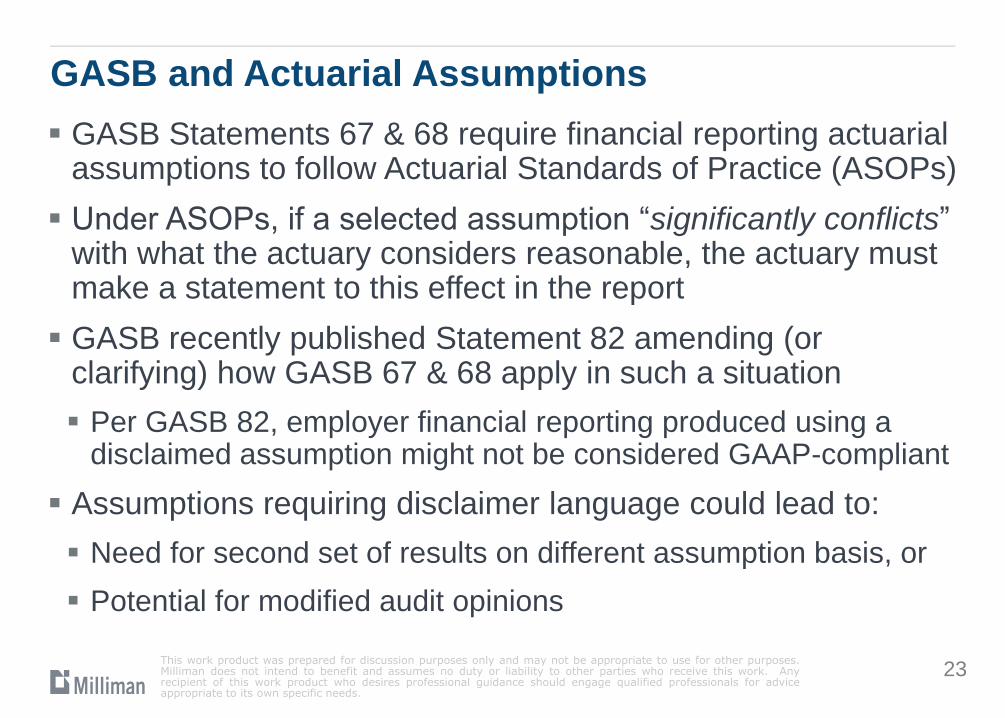
GASB and Actuarial Assumptions GASB Statements 67 & 68 require financial reporting actuarial
assumptions to follow Actuarial Standards of Practice (ASOPs)
Under ASOPs, if a selected assumption “significantly conflicts” with what the actuary considers reasonable, the actuary must make a statement to this effect in the report
GASB recently published Statement 82 amending (or clarifying) how GASB 67 & 68 apply in such a situation
Per GASB 82, employer financial reporting produced using a disclaimed assumption might not be considered GAAP-compliant
Assumptions requiring disclaimer language could lead to:
Need for second set of results on different assumption basis, or
Potential for modified audit opinions
This work product was prepared for discussion purposes only and may not be appropriate to use for other purposes. Milliman does not intend to benefit and assumes no duty or liability to other parties who receive this work. Any recipient of this work product who desires professional guidance should engage qualified professionals for advice appropriate to its own specific needs.
23
Wrap-up & Next Steps on the Return Assumption In our opinion, the long-term future investment return
assumption should be lowered based on the current data from the capital market outlook models, review of the guiding principles, and our perspective regarding Actuarial Standards of Practice
At the July meeting, we will ask the Board to adopt an assumption for use in the upcoming valuation
This work product was prepared for discussion purposes only and may not be appropriate to use for other purposes. Milliman does not intend to benefit and assumes no duty or liability to other parties who receive this work. Any recipient of this work product who desires professional guidance should engage qualified professionals for advice appropriate to its own specific needs.
24
Actuarial Methods
This work product was prepared for discussion purposes only and may not be appropriate to use for other purposes. Milliman does not intend to benefit and assumes no duty or liability to other parties who receive this work. Any recipient of this work product who desires professional guidance should engage qualified professionals for advice appropriate to its own specific needs.
25
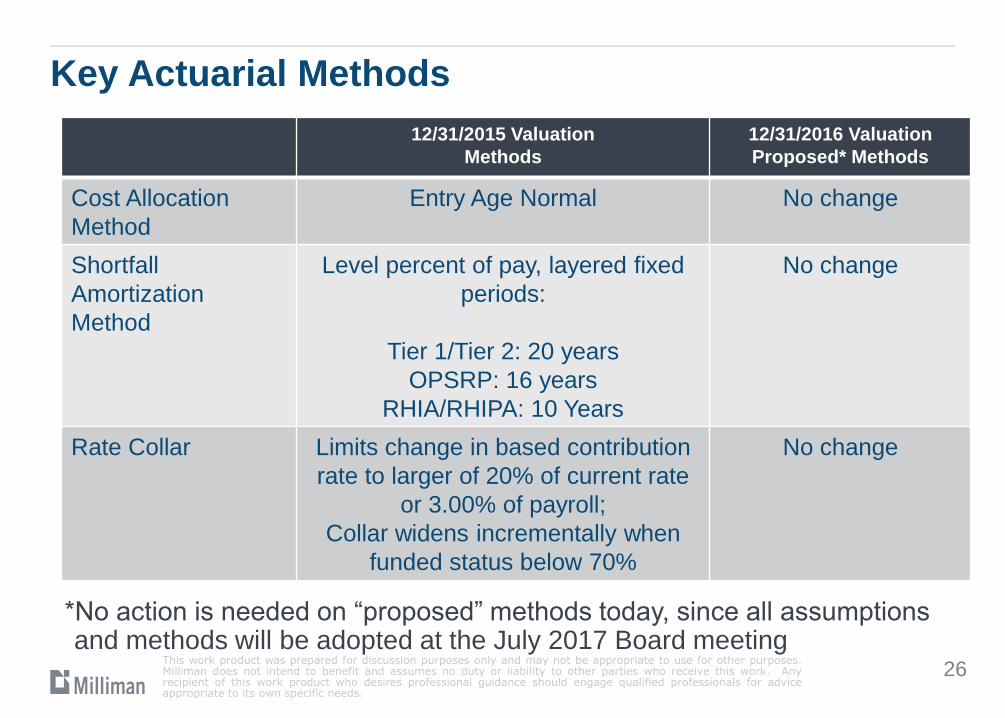
Key Actuarial Methods
This work product was prepared for discussion purposes only and may not be appropriate to use for other purposes. Milliman does not intend to benefit and assumes no duty or liability to other parties who receive this work. Any recipient of this work product who desires professional guidance should engage qualified professionals for advice appropriate to its own specific needs.
12/31/2015 Valuation
Methods
12/31/2016 Valuation
Proposed* Methods
Cost Allocation
Method
Entry Age Normal No change
Shortfall
Amortization
Method
Level percent of pay, layered fixed
periods:
Tier 1/Tier 2: 20 years
OPSRP: 16 years
RHIA/RHIPA: 10 Years
No change
Rate Collar Limits change in based contribution
rate to larger of 20% of current rate
or 3.00% of payroll;
Collar widens incrementally when
funded status below 70%
No change
26
*No action is needed on “proposed” methods today, since all assumptions and methods will be adopted at the July 2017 Board meeting
Cost Allocation Method
Rates are calculated to pre-fund retirement benefits during a member’s working career if all assumptions are met
The present day value of projected future benefits allocated to a particular working year is the Normal Cost
The present day value of projected future benefits allocated to prior years is the Accrued Liability
The division between past, current & future service is done through use of an actuarial cost allocation method
PERS currently uses GASB-compliant cost allocation method of Entry Age Normal (EAN)
We recommend no change to the cost allocation method
This work product was prepared for discussion purposes only and may not be appropriate to use for other purposes. Milliman does not intend to benefit and assumes no duty or liability to other parties who receive this work. Any recipient of this work product who desires professional guidance should engage qualified professionals for advice appropriate to its own specific needs.
27
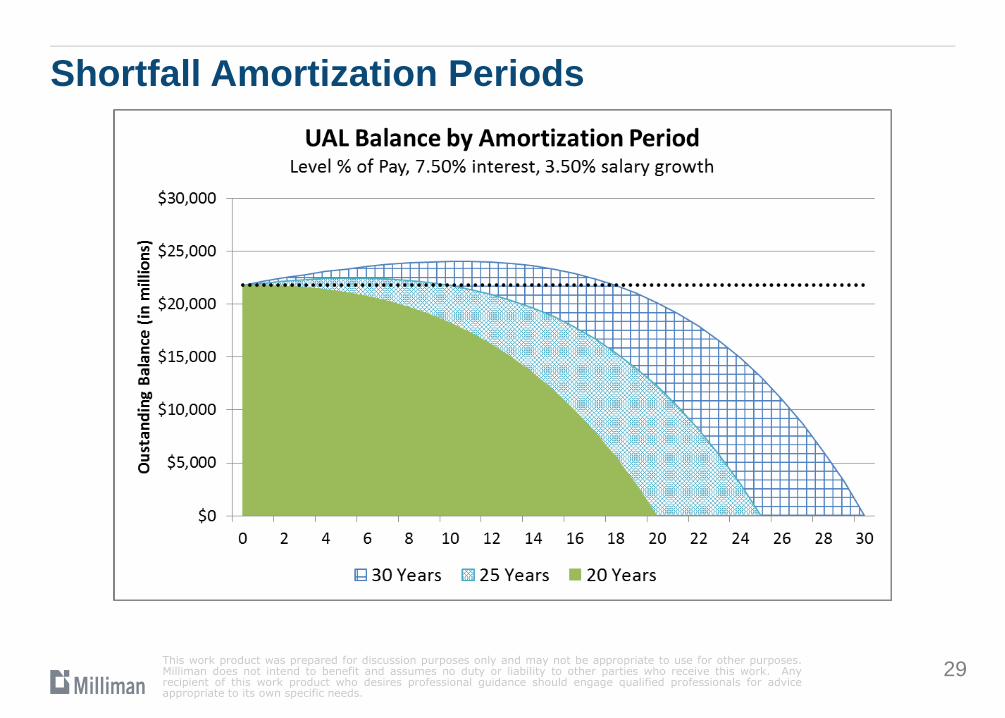
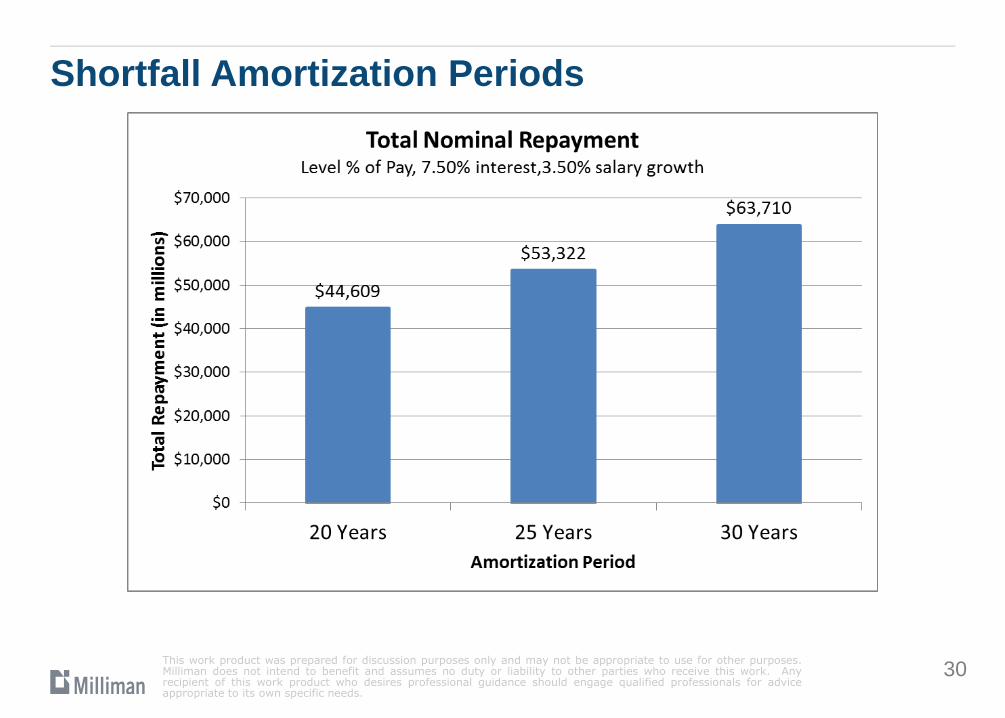
Shortfall Amortization Periods
A key part of contribution rate calculations is amortization of Tier 1 / Tier 2 shortfalls over twenty years as a level percentage of payroll
As part of changes made in a prior experience study, UAL as of December 31, 2013 was re-amortized over twenty years
Subsequent gains or losses, including loss as of December 31, 2015, amortized over twenty years from the rate-setting valuations in which they are recognized
Twenty years avoids significant negative amortization, where shortfall actually increases in the initial “pay down” years even if assumptions are met and contributions are made
The following slide illustrates pay down of a $22 billion shortfall over periods of 20, 25 or 30 years at current assumptions
This work product was prepared for discussion purposes only and may not be appropriate to use for other purposes. Milliman does not intend to benefit and assumes no duty or liability to other parties who receive this work. Any recipient of this work product who desires professional guidance should engage qualified professionals for advice appropriate to its own specific needs.
28
Shortfall Amortization Periods
This work product was prepared for discussion purposes only and may not be appropriate to use for other purposes. Milliman does not intend to benefit and assumes no duty or liability to other parties who receive this work. Any recipient of this work product who desires professional guidance should engage qualified professionals for advice appropriate to its own specific needs.
29
Shortfall Amortization Periods
This work product was prepared for discussion purposes only and may not be appropriate to use for other purposes. Milliman does not intend to benefit and assumes no duty or liability to other parties who receive this work. Any recipient of this work product who desires professional guidance should engage qualified professionals for advice appropriate to its own specific needs.
30
The Rate Collar
In 2005, the Board adopted an employer contribution rate smoothing method called the “rate collar”
After a major change in unfunded actuarial liability (UAL), the difference between the current contribution rate and the updated actuarially calculated rate can be large
The rate collar is a formulaic approach that spreads large employer contribution rate changes systematically across several biennia
It allows employers to see both:
An advanced estimate of the maximum base rate change per biennium
The currently estimated long-term (20-year) contribution rate on a current market value of assets basis
This work product was prepared for discussion purposes only and may not be appropriate to use for other purposes. Milliman does not intend to benefit and assumes no duty or liability to other parties who receive this work. Any recipient of this work product who desires professional guidance should engage qualified professionals for advice appropriate to its own specific needs.
31
Rate Collaring
The rate collar approach has three steps:
Calculate shortfall based on fair market asset values (excluding side accounts)
Calculate the actuarially determined UAL Rate based on shortfall amortization period and other key assumptions
Check the calculated overall rate (Normal Cost Rate plus UAL Rate) against the contribution rate currently in effect
If the actuarial rate change is too large, part of the calculated increase is “collared” and deferred to subsequent periods
The UAL Rate actually charged to employers is adjusted downward to reflect the rate collar’s effects
This work product was prepared for discussion purposes only and may not be appropriate to use for other purposes. Milliman does not intend to benefit and assumes no duty or liability to other parties who receive this work. Any recipient of this work product who desires professional guidance should engage qualified professionals for advice appropriate to its own specific needs.
32
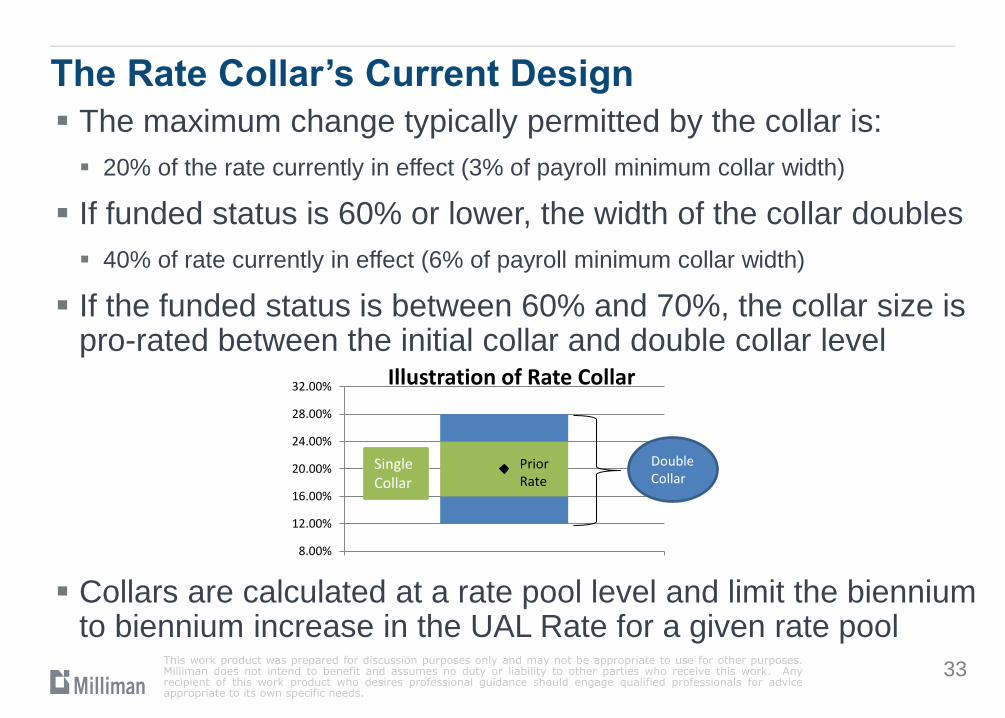
The Rate Collar’s Current Design
The maximum change typically permitted by the collar is:
20% of the rate currently in effect (3% of payroll minimum collar width)
If funded status is 60% or lower, the width of the collar doubles
40% of rate currently in effect (6% of payroll minimum collar width)
If the funded status is between 60% and 70%, the collar size is pro-rated between the initial collar and double collar level
Collars are calculated at a rate pool level and limit the biennium to biennium increase in the UAL Rate for a given rate pool
This work product was prepared for discussion purposes only and may not be appropriate to use for other purposes. Milliman does not intend to benefit and assumes no duty or liability to other parties who receive this work. Any recipient of this work product who desires professional guidance should engage qualified professionals for advice appropriate to its own specific needs.
8.00%
12.00%
16.00%
20.00%
24.00%
28.00%
32.00% Illustration of Rate Collar
Double Collar
Single Collar
Prior Rate
33
Agenda for July Meeting
Review demographic assumptions
Adopt all methods and assumptions for use in:
December 31, 2016 “advisory” actuarial valuation that estimates 2019-2021 contribution rates
December 31, 2017 “rate-setting” actuarial valuation that sets recommended 2019-2021 contribution rates for PERS Board adoption
This work product was prepared for discussion purposes only and may not be appropriate to use for other purposes. Milliman does not intend to benefit and assumes no duty or liability to other parties who receive this work. Any recipient of this work product who desires professional guidance should engage qualified professionals for advice appropriate to its own specific needs.
34
Caveats and Disclaimers
This presentation discusses actuarial methods and assumptions for use in the valuation of the Oregon Public Employees Retirement System (“PERS” or “the System”). For the most recent complete actuarial valuation results, including cautions regarding the limitations of use of valuation calculations, please refer to our formal Actuarial Valuation Report as of December 31, 2015 (“the Valuation Report”) published on September 27, 2016. The Valuation Report, including all supporting information regarding data, assumptions, methods, and provisions, is incorporated by reference into this presentation. The statements of reliance and limitations on the use of this material is reflected in the actuarial report and still apply to this presentation.
In preparing this presentation, we relied, without audit, on information (some oral and some in writing) supplied by the System’s staff, as well as capital market expectations provided by Callan and information presented to the Oregon Investment Council. This information includes, but is not limited to, statutory provisions, employee data, and financial information. We found this information to be reasonably consistent and comparable with information used for other purposes. The results depend on the integrity of this information. If any of this information is inaccurate or incomplete our results may be different and our calculations may need to be revised.
Milliman’s work product was prepared exclusively for Oregon PERS for a specific and limited purpose. It is a complex, technical analysis that assumes a high level of knowledge concerning PERS’ operations, and uses PERS’ data, which Milliman has not audited. It is not for the use or benefit of any third party for any purpose. To the extent that Milliman's work is not subject to disclosure under applicable public records laws, Milliman’s work may not be provided to third parties without Milliman's prior written consent. Milliman does not intend to benefit or create a legal duty to any third party recipient of its work product. Any third party recipient of Milliman’s work product who desires professional guidance should not rely upon Milliman’s work product, but should engage qualified professionals for advice appropriate to its own specific needs.
The consultants who worked on this assignment are pension actuaries. Milliman’s advice is not intended to be a substitute for qualified legal or accounting counsel. The signing actuaries are independent of the plan sponsors. We are not aware of any relationship that would impair the objectivity of our work.
On the basis of the foregoing, we hereby certify that, to the best of our knowledge and belief, this report is complete and accurate and has been prepared in accordance with generally recognized and accepted actuarial principles and practices. We are members of the American Academy of Actuaries and meet the Qualification Standards to render the actuarial opinion contained herein.
This work product was prepared for discussion purposes only and may not be appropriate to use for other purposes. Milliman does not intend to benefit and assumes no duty or liability to other parties who receive this work. Any recipient of this work product who desires professional guidance should engage qualified professionals for advice appropriate to its own specific needs.
35
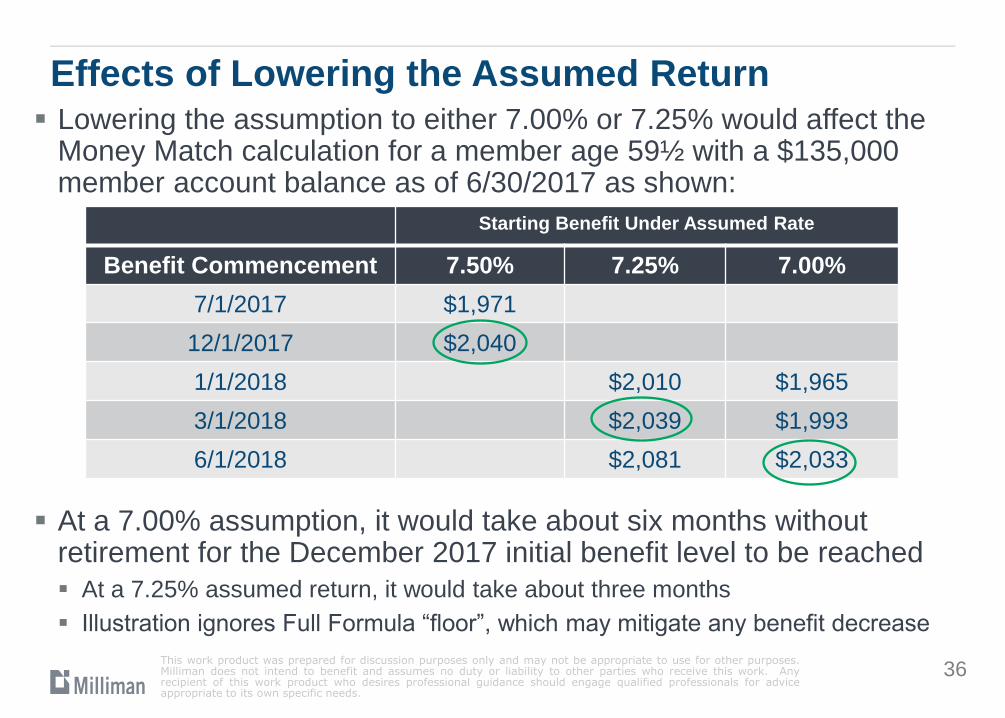
Effects of Lowering the Assumed Return Lowering the assumption to either 7.00% or 7.25% would affect the
Money Match calculation for a member age 59½ with a $135,000 member account balance as of 6/30/2017 as shown:
At a 7.00% assumption, it would take about six months without retirement for the December 2017 initial benefit level to be reached
At a 7.25% assumed return, it would take about three months
Illustration ignores Full Formula “floor”, which may mitigate any benefit decrease
This work product was prepared for discussion purposes only and may not be appropriate to use for other purposes. Milliman does not intend to benefit and assumes no duty or liability to other parties who receive this work. Any recipient of this work product who desires professional guidance should engage qualified professionals for advice appropriate to its own specific needs.
36
Starting Benefit Under Assumed Rate
Benefit Commencement 7.50% 7.25% 7.00%
7/1/2017 $1,971
12/1/2017 $2,040
1/1/2018 $2,010 $1,965
3/1/2018 $2,039 $1,993
6/1/2018 $2,081 $2,033
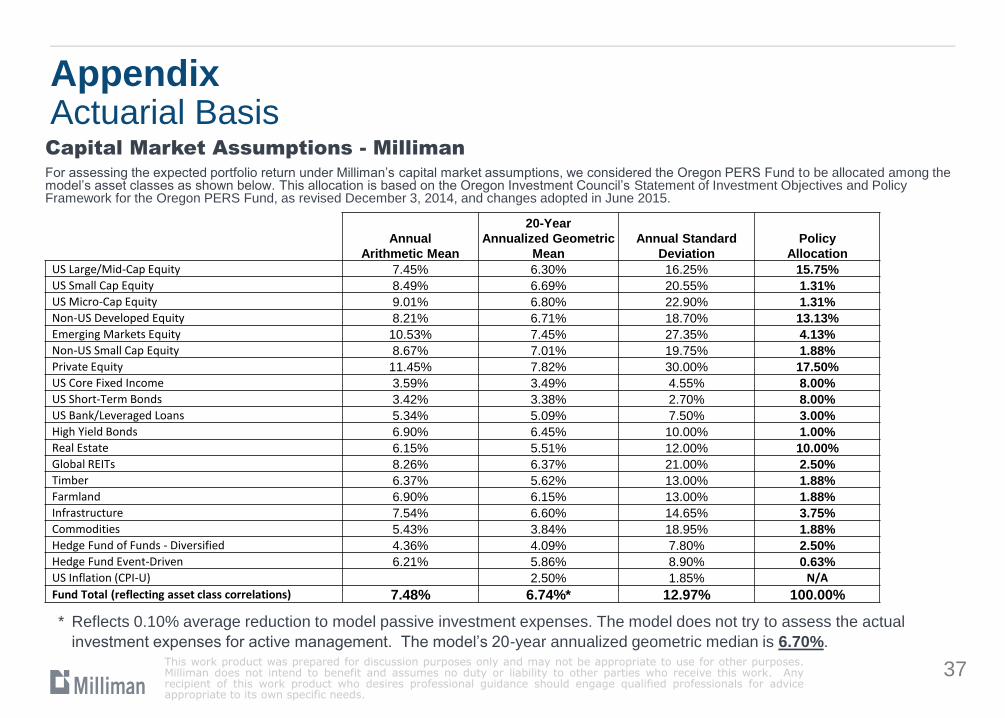
Appendix Actuarial Basis Capital Market Assumptions - Milliman
For assessing the expected portfolio return under Milliman’s capital market assumptions, we considered the Oregon PERS Fund to be allocated among the model’s asset classes as shown below. This allocation is based on the Oregon Investment Council’s Statement of Investment Objectives and Policy Framework for the Oregon PERS Fund, as revised December 3, 2014, and changes adopted in June 2015.
This work product was prepared for discussion purposes only and may not be appropriate to use for other purposes. Milliman does not intend to benefit and assumes no duty or liability to other parties who receive this work. Any recipient of this work product who desires professional guidance should engage qualified professionals for advice appropriate to its own specific needs.
Annual
Arithmetic Mean
20-Year
Annualized Geometric
Mean
Annual Standard
Deviation
Policy
Allocation
US Large/Mid-Cap Equity 7.45% 6.30% 16.25% 15.75%
US Small Cap Equity 8.49% 6.69% 20.55% 1.31%
US Micro-Cap Equity 9.01% 6.80% 22.90% 1.31%
Non-US Developed Equity 8.21% 6.71% 18.70% 13.13%
Emerging Markets Equity 10.53% 7.45% 27.35% 4.13%
Non-US Small Cap Equity 8.67% 7.01% 19.75% 1.88%
Private Equity 11.45% 7.82% 30.00% 17.50%
US Core Fixed Income 3.59% 3.49% 4.55% 8.00%
US Short-Term Bonds 3.42% 3.38% 2.70% 8.00%
US Bank/Leveraged Loans 5.34% 5.09% 7.50% 3.00%
High Yield Bonds 6.90% 6.45% 10.00% 1.00%
Real Estate 6.15% 5.51% 12.00% 10.00%
Global REITs 8.26% 6.37% 21.00% 2.50%
Timber 6.37% 5.62% 13.00% 1.88%
Farmland 6.90% 6.15% 13.00% 1.88%
Infrastructure 7.54% 6.60% 14.65% 3.75%
Commodities 5.43% 3.84% 18.95% 1.88%
Hedge Fund of Funds - Diversified 4.36% 4.09% 7.80% 2.50%
Hedge Fund Event-Driven 6.21% 5.86% 8.90% 0.63%
US Inflation (CPI-U) 2.50% 1.85% N/A
Fund Total (reflecting asset class correlations) 7.48% 6.74%* 12.97% 100.00%
* Reflects 0.10% average reduction to model passive investment expenses. The model does not try to assess the actual
investment expenses for active management. The model’s 20-year annualized geometric median is 6.70%.
37
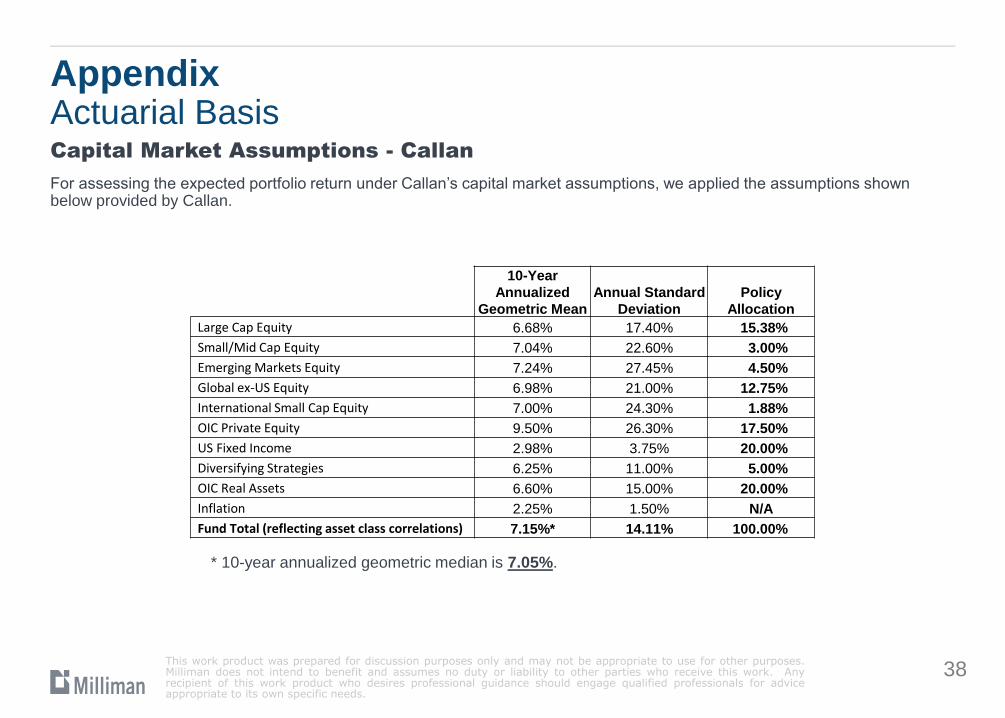
Appendix Actuarial Basis Capital Market Assumptions - Callan
For assessing the expected portfolio return under Callan’s capital market assumptions, we applied the assumptions shown below provided by Callan.
This work product was prepared for discussion purposes only and may not be appropriate to use for other purposes. Milliman does not intend to benefit and assumes no duty or liability to other parties who receive this work. Any recipient of this work product who desires professional guidance should engage qualified professionals for advice appropriate to its own specific needs.
10-Year
Annualized
Geometric Mean
Annual Standard
Deviation
Policy
Allocation
Large Cap Equity 6.68% 17.40% 15.38%
Small/Mid Cap Equity 7.04% 22.60% 3.00%
Emerging Markets Equity 7.24% 27.45% 4.50%
Global ex-US Equity 6.98% 21.00% 12.75%
International Small Cap Equity 7.00% 24.30% 1.88%
OIC Private Equity 9.50% 26.30% 17.50%
US Fixed Income 2.98% 3.75% 20.00%
Diversifying Strategies 6.25% 11.00% 5.00%
OIC Real Assets 6.60% 15.00% 20.00%
Inflation 2.25% 1.50% N/A
Fund Total (reflecting asset class correlations) 7.15%* 14.11% 100.00%
38
* 10-year annualized geometric median is 7.05%.
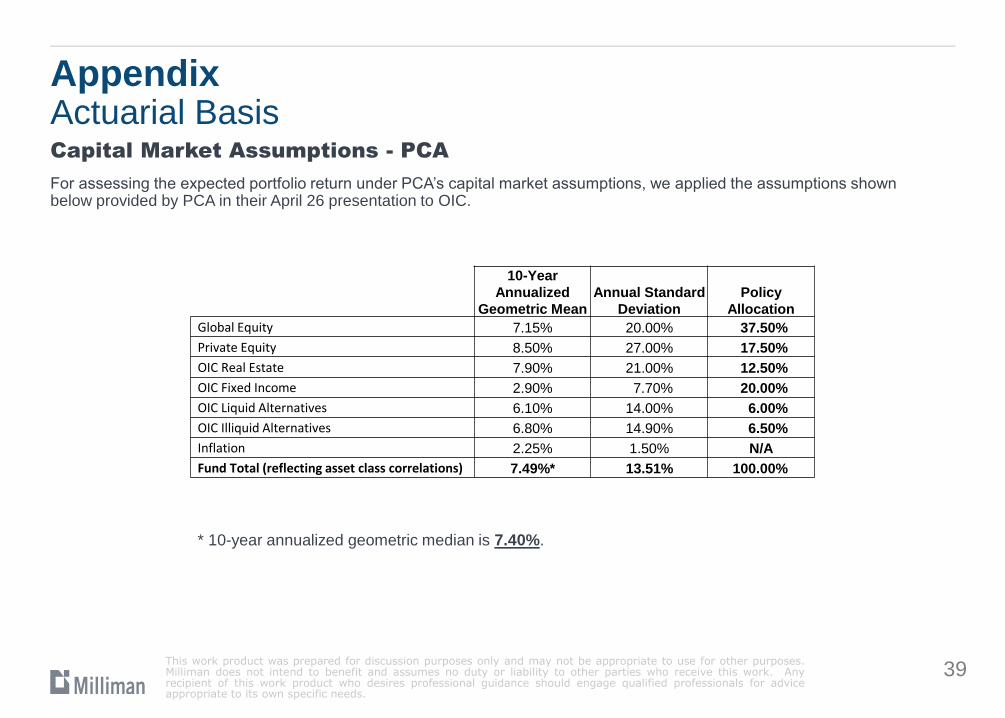
Appendix Actuarial Basis Capital Market Assumptions - PCA
For assessing the expected portfolio return under PCA’s capital market assumptions, we applied the assumptions shown below provided by PCA in their April 26 presentation to OIC.
This work product was prepared for discussion purposes only and may not be appropriate to use for other purposes. Milliman does not intend to benefit and assumes no duty or liability to other parties who receive this work. Any recipient of this work product who desires professional guidance should engage qualified professionals for advice appropriate to its own specific needs.
10-Year
Annualized
Geometric Mean
Annual Standard
Deviation
Policy
Allocation
Global Equity 7.15% 20.00% 37.50%
Private Equity 8.50% 27.00% 17.50%
OIC Real Estate 7.90% 21.00% 12.50%
OIC Fixed Income 2.90% 7.70% 20.00%
OIC Liquid Alternatives 6.10% 14.00% 6.00%
OIC Illiquid Alternatives 6.80% 14.90% 6.50%
Inflation 2.25% 1.50% N/A
Fund Total (reflecting asset class correlations) 7.49%* 13.51% 100.00%
39
* 10-year annualized geometric median is 7.40%.
Appendix Actuarial Basis
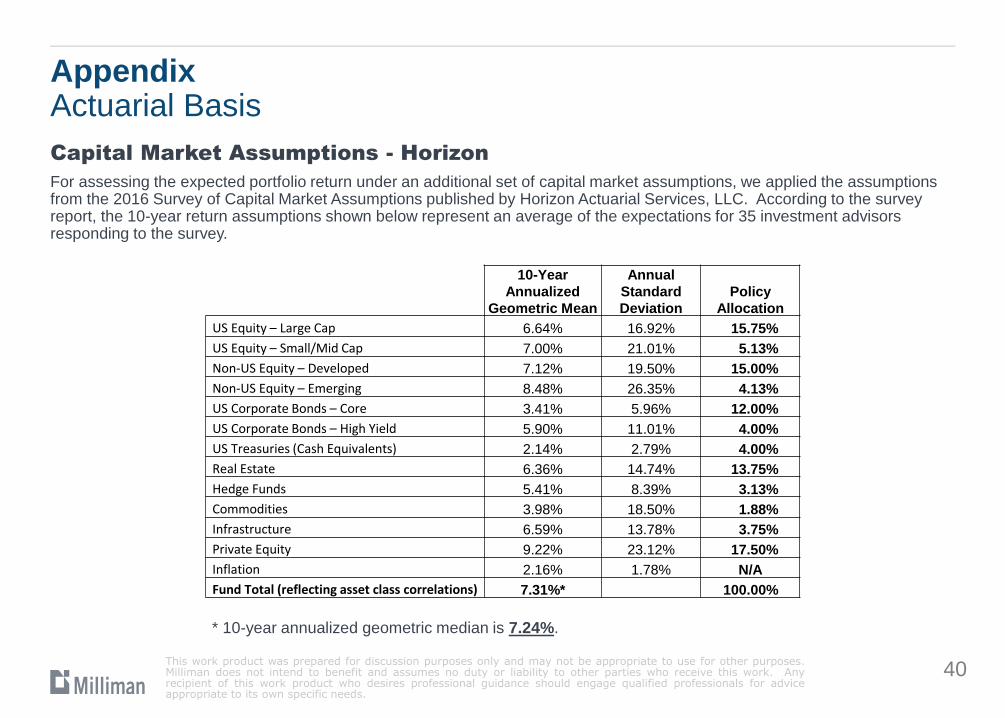
Capital Market Assumptions - Horizon
For assessing the expected portfolio return under an additional set of capital market assumptions, we applied the assumptions from the 2016 Survey of Capital Market Assumptions published by Horizon Actuarial Services, LLC. According to the survey report, the 10-year return assumptions shown below represent an average of the expectations for 35 investment advisors responding to the survey.
This work product was prepared for discussion purposes only and may not be appropriate to use for other purposes. Milliman does not intend to benefit and assumes no duty or liability to other parties who receive this work. Any recipient of this work product who desires professional guidance should engage qualified professionals for advice appropriate to its own specific needs.
10-Year
Annualized
Geometric Mean
Annual
Standard
Deviation
Policy
Allocation
US Equity – Large Cap 6.64% 16.92% 15.75%
US Equity – Small/Mid Cap 7.00% 21.01% 5.13%
Non-US Equity – Developed 7.12% 19.50% 15.00%
Non-US Equity – Emerging 8.48% 26.35% 4.13%
US Corporate Bonds – Core 3.41% 5.96% 12.00%
US Corporate Bonds – High Yield 5.90% 11.01% 4.00%
US Treasuries (Cash Equivalents) 2.14% 2.79% 4.00%
Real Estate 6.36% 14.74% 13.75%
Hedge Funds 5.41% 8.39% 3.13%
Commodities 3.98% 18.50% 1.88%
Infrastructure 6.59% 13.78% 3.75%
Private Equity 9.22% 23.12% 17.50%
Inflation 2.16% 1.78% N/A
Fund Total (reflecting asset class correlations) 7.31%* 100.00%
* 10-year annualized geometric median is 7.24%.
40
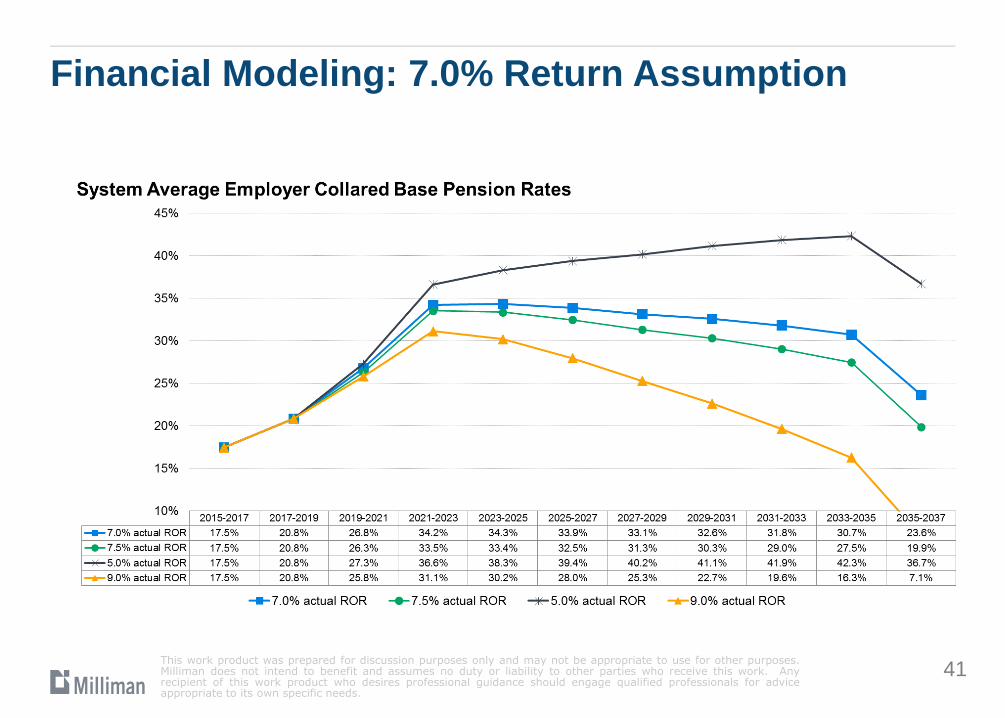
Financial Modeling: 7.0% Return Assumption
This work product was prepared for discussion purposes only and may not be appropriate to use for other purposes. Milliman does not intend to benefit and assumes no duty or liability to other parties who receive this work. Any recipient of this work product who desires professional guidance should engage qualified professionals for advice appropriate to its own specific needs.
41
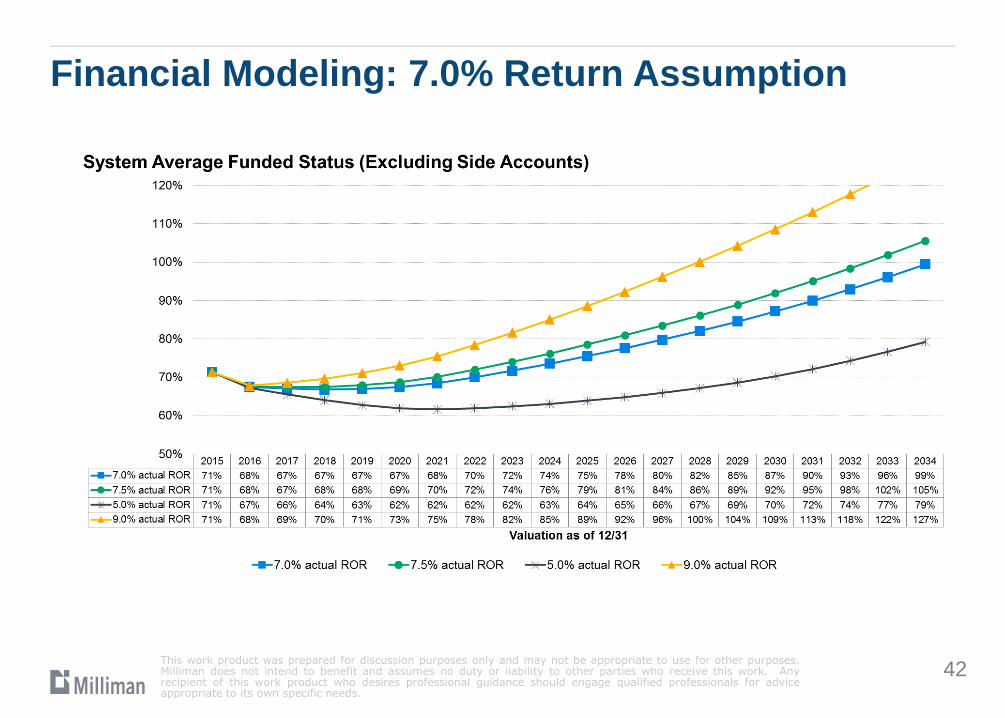
Financial Modeling: 7.0% Return Assumption
This work product was prepared for discussion purposes only and may not be appropriate to use for other purposes. Milliman does not intend to benefit and assumes no duty or liability to other parties who receive this work. Any recipient of this work product who desires professional guidance should engage qualified professionals for advice appropriate to its own specific needs.
42
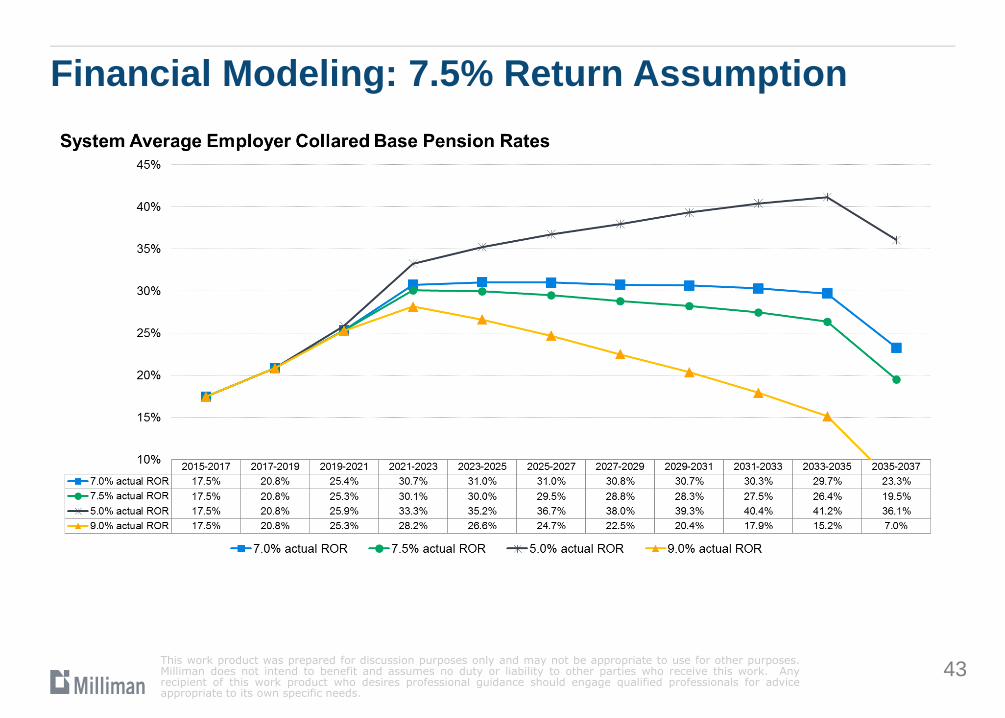
Financial Modeling: 7.5% Return Assumption
This work product was prepared for discussion purposes only and may not be appropriate to use for other purposes. Milliman does not intend to benefit and assumes no duty or liability to other parties who receive this work. Any recipient of this work product who desires professional guidance should engage qualified professionals for advice appropriate to its own specific needs.
43
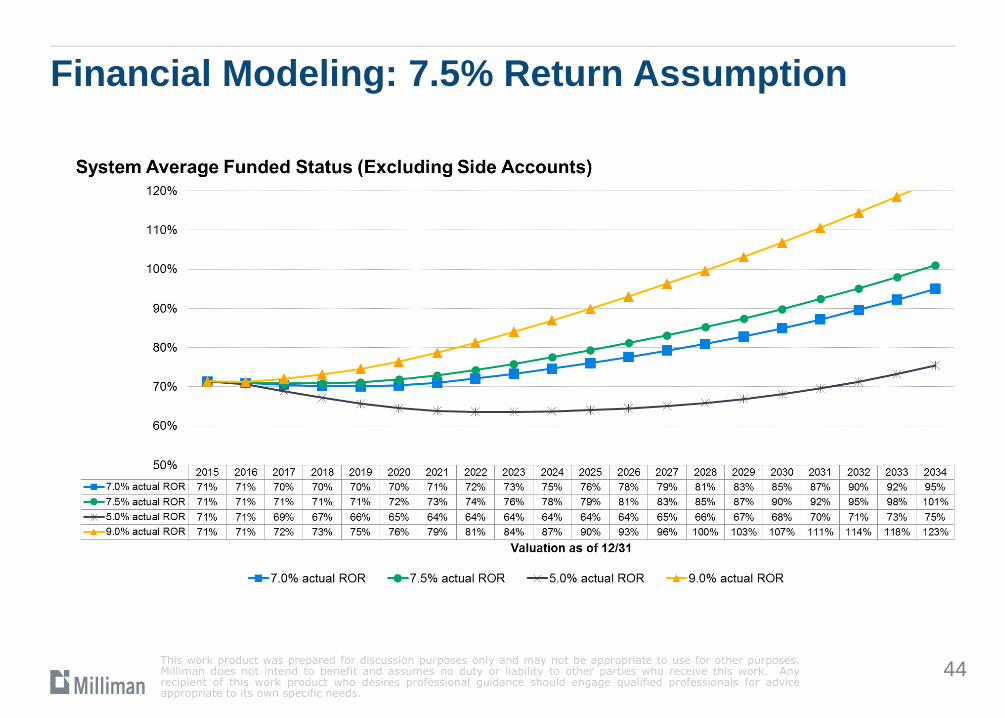
Financial Modeling: 7.5% Return Assumption
This work product was prepared for discussion purposes only and may not be appropriate to use for other purposes. Milliman does not intend to benefit and assumes no duty or liability to other parties who receive this work. Any recipient of this work product who desires professional guidance should engage qualified professionals for advice appropriate to its own specific needs.
44