economic assumptions and interactions with … · economic assumptions and interactions with the...
TRANSCRIPT
7
ECONOMIC ASSUMPTIONS AND INTERACTIONS WITH THE BUDGET

9
2. ECONOMIC ASSUMPTIONS AND INTERACTIONS WITH THE BUDGET
This chapter presents the economic assumptions that underlie the Administration’s Fiscal Year 2019 Budget.1 It describes the recent performance of the U.S. economy, explains the Administration’s projections for key mac-roeconomic variables, compares them with forecasts prepared by other prominent institutions and discusses the uncertainty inherent in producing an eleven-year forecast.
After contracting by more than 4 percent over 2007Q4 to 2009Q2, the United States economy has experienced stable but relatively modest growth, especially when com-pared with past recoveries. From the trough in the second quarter of 2009, it took about two years for the economy to recover to its previous output peak, much longer than in the other post-World War II recoveries. Over the first three years of recoveries from previous postwar recessions, average output growth averaged 4.5 percent annually. In the first three years following the most recent recession, average annual growth was only about 2.3 percent.
The disappointing recovery has motivated this Administration’s aggressive economic strategy, two key elements of which are cutting taxes and reforming the tax code along with reducing the burden of Federal regu-lations. The Administration’s efforts succeeded on both of these fronts in its first year, with the passage of the Tax Cut and Jobs Act in December 2017 and the elimina-tion of scores of unnecessary regulations under Executive Orders 13771 and 13777. In addition, the Administration is pursuing policies to encourage domestic energy de-velopment and investments in infrastructure, reform welfare programs to encourage work, establish paid fam-ily leave for new parents, negotiate more attractive trade agreements, and reduce Federal budget deficits. Taken together, these actions should encourage investment by American firms, stimulate productivity growth, and slow the expected decline in the labor force participation rate, leading to stronger growth in output and putting more Americans to work.
This chapter proceeds as follows:• The first section reviews the recent performance of
the U.S. economy, examining a broad array of eco-nomic outcomes.
• The second section provides a detailed exposition of the Administration’s economic forecast for the FY 2019 Budget, discussing how a number of macro-economic variables are expected to evolve over the years 2018 to 2028.
• The third section compares the forecast of the Ad-ministration with those prepared by the Congressio-
1 Economic performance, unless otherwise specified, is generally dis-cussed in terms of calendar years. Budget figures are discussed in terms of fiscal years.
nal Budget Office, the Federal Open Market Com-mittee of the Federal Reserve, and the Blue Chip panel of private sector forecasters.
• The fourth section discusses the sensitivity of the Administration’s projections of Federal receipts and outlays to fluctuations in the main macroeconomic variables discussed in the forecast.
• The fifth section considers the errors and possible biases2 in past Administration forecasts, compar-ing them with the errors in forecasts produced by the Congressional Budget Office, and the Blue Chip panel of private professional forecasters. The sixth section uses information on past accuracy of Admin-istration forecasts to provide a sense of the uncer-tainty associated with the Administration’s current forecast of the budget balance.
Recent Economic Performance3
The U.S. economy continued to exhibit robust growth in the fourth quarter of 2017, growing at 2.6 percent af-ter having grown 3.1 and 3.2 percent in the second and third quarter, respectively. The first quarter had lacklus-ter growth at 1.2 percent. For the four quarters ending December 2017, real Gross Domestic Product (GDP) growth averaged 2.5 percent. In contrast, during the four quarters of 2016, real GDP grew by 1.8 percent. This came on the heels of real GDP growing at 2.0 percent during 2015, and an average growth rate of 2.1 percent (fourth quarter-on-fourth quarter) since 2010. Among the demand components of GDP, real consumer spend-ing has accounted for 76 percent of the demand growth in 2017, with consumption of nondurables and services con-tributing 54 percent and consumption of durable goods contributing the remaining 22 percent. Gross private domestic investment contributed 22 percent to real GDP growth, government consumption and gross investment have been slightly positive and net exports have made a negative contribution of 3 percent to real GDP growth. On the supply side, weak labor productivity growth lim-ited overall growth during 2017, as it has over the past several years. Over the four quarters through 2017Q4, nonfarm productivity increased at 1.1 percent compared to 0.8 percent a year ago. Productivity growth has been relatively sluggish since the end of 2007, increasing by 1.2 percent at an annual rate; over the past two years, through 2017Q4, labor productivity (output per hour) in
2 As discussed later in this chapter, “bias” here is defined in the sta-tistical sense and refers to whether previous Administrations’ forecasts have tended to make positive or negative forecast errors on average.
3 The statistics in this section are based on information available in late January 2018.
10 ANALYTICAL PERSPECTIVES
the nonfarm business sector has increased just 1.0 per-cent at an annual rate. These rates are notably slower than the rate of 2.6 percent annual rate observed over the period from 1994Q4 through 2007Q4 and the long run av-erage of 2.1 percent during the post-World War II period from 1947 to 2016.
Labor Markets.—Labor markets continued to improve in 2017 across a broad array of metrics. The unemploy-ment rate continued to decline, falling from 5.0 percent at the end of 2015 to 4.7 percent at the end of 2016, and further to 4.1 percent in January of 2018, the lowest level since December 2000, and well below the long-term aver-age of 5.8 percent. During the 12 months of 2017, the labor force participation rate averaged 62.8 percent, up from 62.7 percent in 2015 but about the same as in 2016. Although the participation rate has stabilized somewhat following a steep decline since 2000, demographic forces are expected to exert continued downward pressure as the baby boom generation continues retiring in large numbers. The proportion of the labor force employed part-time for economic reasons has fallen to 3.1 percent in December 2017, well below its peak of over 6.0 percent during the Great Recession. Furthermore, the proportion of the labor force unemployed for longer than 27 weeks has fallen to 0.9 percent from a peak of nearly 4.4 percent.
In spite of these improvements, several metrics sug-gest that the labor market has not regained the ground it had lost. Compared with the last business cycle peak at the end of 2007, the proportion of the labor force working part-time for economic reasons and the proportion unem-ployed for more than 27 weeks are still elevated, as are the shares of the working-age population only marginally attached to the labor force or too discouraged to look for work. The aging of the baby boom cohorts into retirement does not explain the drop in the labor force participation rates for prime-age men and women (age 25-54). From 2007 to 2017, the participation rate for prime-age men (aged 20-54) fell 2.2 percentage points from 2007 to 2017, while the rate for prime-age women fell 0.4 percentage point. Real average hourly wages for production and non-supervisory workers have grown only 0.7 percent at an annual rate during the 10 years since 2007. In December 2017, the employment-to-population ratio for Americans aged between 25 and 54 years old was still 0.6 percent-age point below where it was at the start of the “Great Recession.”
Housing.—The effect of the housing market on the broader economy was mixed in 2017. House prices, as measured by the Federal Housing Finance Agency’s (FHFA) purchase-only index, were 6.5 percent higher in November 2017 than in November 2016. Higher house prices help fortify household balance sheets and support personal consumption expenditures. They also encourage further activity in the housing sector, with sales volumes rising for both new and existing homes. Despite the ris-ing house prices, measures of new construction edged up only slightly or were roughly flat. The number of housing starts decreased from an annual rate of about 1.33 million in October 2016 to 1.29 million in October 2017. Building permits increased 2.4 percent over the same period. And
residential fixed investment increased 2.3 percent over the four quarters ending in December 2017.
Some weaknesses still remain in the housing mar-ket, however. As of November 2017, while the FHFA house-price index was about 13.1 percent higher than its pre-crisis peak, the S&P-Case Shiller index was only about 6 percent above its previous apex. Homeownership rates steadily declined since the recession began and af-ter matching the lowest rate on record in the middle of 2016, started edging up in 2017.
Consumption.—Consumer spending was a primary driver of demand growth in 2017, growing by 2.8 percent over the four quarters ending December 2017. At close to 70 percent of the economy, consumption is essential to overall growth. Consumption growth was spread over a number of different categories, including motor vehicles and parts (4.5 percent), furnishings and household equip-ment (9.5 percent), recreational goods and vehicles (9.3 percent), food and beverages (3.0 percent), medical care (2.6 percent), and financial services and insurance (3.4 percent).
Investment.—For the four quarters ending in December 2017, growth in nonresidential fixed invest-ment was strong, coming in at 6.3 percent relative to 0.7 percent during the year-earlier period. Equipment spend-ing was up 8.8 percent, spending on structures was up 3.7 percent, and spending on intellectual property products increased 4.8 percent. Growth in overall private fixed investment (residential and nonresidential) was 5.4 per-cent compared with virtually zero growth over the four quarters ending December 2016, and 2.4 percent the year prior.
Government.—Overall demand growth by the govern-ment sector has been 0.7 percent over the four quarters ending in December 2017. State and local spending grew 0.5 percent, while Federal purchases were up 1.1 percent. The Federal deficit as a percentage of GDP increased to 3.5 percent in fiscal year 2017 from 3.2 percent in fiscal year 2016. While increasing deficits might be expected to lead to higher interest rates and subsequent crowding out of private investment, the low interest rate environment in recent years has mitigated this potentially negative force.
Monetary Policy.—After holding the nominal Federal funds rate near zero for seven years, the Federal Open Market Committee of the Federal Reserve raised the tar-get range for the Federal funds rate by 25 basis points at the end of 2015. After a moderate pause, the Federal Reserve continued the normalization of monetary policy, with a 25 basis point increase in each meeting held in December 2016, March 2017, June 2017, and December 2017. In its December policy statement, the FOMC characterized as “solid” the job gains and the rising rate of economic activity with expectations for continued strengthening of labor markets, as well as rates of infla-tion around the 2.0 percent target in the medium term. The yield on the 10-year Treasury note has also increased recently, from an average of 1.6 percent in the third quar-ter of 2016 to an average of 2.4 percent during the fourth quarter of 2017.
2. ECONOMIC ASSUMPTIONS AND INTERACTIONS WITH THE BUDGET 11
Oil and Natural Gas Supply.—After reaching a post-financial crisis peak above $100 per barrel, crude oil prices began to tumble in mid-2014. They continued to fall in 2015 and bottomed out around $30 in early 2016. Prices have since rebounded, rising above the $50 mark in late 2016 where they have stayed in the latter half of 2017. Higher oil prices act as a kind of tax on consum-ers’ purchasing power, so their net decline from $100 per barrel in early 2014 to above $50 per barrel raised dispos-able incomes, which has supported consumer spending. With new technology such as hydraulic fracturing, U.S. oil producers have emerged as important swing producers in
global oil markets, helping to lower prices and moderate price fluctuations. Domestic production of crude oil for the year ending September 2017 averaged about 9.0 mil-lion barrels per day (mbd), up from 8.9 mbd in calendar year 2016 and 7.5 mbd in calendar year 2013, although down from 9.4 million barrels per day in 2015 (calendar year). The decline from 2015 likely reflects the decline in oil prices. Production of natural gas has averaged about 89.2 billion cubic feet per day in the year ending September 2017, down 0.6 percent from year-earlier pro-duction levels, but 13.4 percent higher than in the year ending September 2013.
Actual2016
Projections
2017 2018 2019 2020 2021 2022 2023 2024 2025 2026 2027 2028
Gross Domestic Product (GDP):
Levels, Dollar Amounts in Billions:Current Dollars �������������������������������������������������� 18,624 19,372 20,262 21,263 22,345 23,482 24,672 25,923 27,234 28,598 30,001 31,461 32,991Real, Chained (2009) Dollars ���������������������������� 16,716 17,090 17,601 18,157 18,727 19,296 19,875 20,471 21,085 21,705 22,320 22,945 23,588Chained Price Index (2009=100), Annual
Average �������������������������������������������������������� 111�4 113�4 115�1 117�1 119�3 121�7 124�1 126�6 129�2 131�8 134�4 137�1 139�9
Percent Change, Fourth Quarter over Fourth Quarter:Current Dollars �������������������������������������������������� 3�4 4�1 4�7 5�1 5�1 5�1 5�1 5�1 5�1 5�0 4�9 4�9 4�9Real, Chained (2009) Dollars ���������������������������� 1�8 2�5 3�1 3�2 3�1 3�0 3�0 3�0 3�0 2�9 2�8 2�8 2�8Chained Price Index (2009=100) ����������������������� 1�5 1�6 1�6 1�8 1�9 2�0 2�0 2�0 2�0 2�0 2�0 2�0 2�0
Percent Change, Year over Year:Current Dollars �������������������������������������������������� 2�8 4�0 4�6 4�9 5�1 5�1 5�1 5�1 5�1 5�0 4�9 4�9 4�9Real, Chained (2009) Dollars ���������������������������� 1�5 2�2 3�0 3�2 3�1 3�0 3�0 3�0 3�0 2�9 2�8 2�8 2�8Chained Price Index (2009=100) ����������������������� 1�3 1�7 1�6 1�7 1�9 2�0 2�0 2�0 2�0 2�0 2�0 2�0 2�0
Incomes, Billions of Current Dollars:Domestic Corporate Profits ������������������������������������� 1,679 1,753 1,893 1,985 2,050 2,060 2,047 2,035 2,043 2,048 2,041 2,049 2,046Employee Compensation ����������������������������������������� 9,979 10,320 10,750 11,225 11,774 12,408 13,104 13,843 14,622 15,438 16,291 17,160 18,092Wages and Salaries ������������������������������������������������ 8,085 8,365 8,713 9,094 9,550 10,058 10,620 11,217 11,844 12,506 13,195 13,902 14,642Other Taxable Income 2 ������������������������������������������� 4,427 4,576 4,793 5,068 5,386 5,704 6,053 6,398 6,738 7,072 7,360 7,683 7,943
Consumer Price Index (All Urban): 3
Level (1982–1984 = 100), Annual Average ������������� 240�0 245�1 250�2 255�1 260�7 266�7 272�7 278�9 285�2 291�7 298�3 305�1 312�0Percent Change, Fourth Quarter over Fourth
Quarter ��������������������������������������������������������������� 1�8 2�1 1�9 2�0 2�3 2�3 2�3 2�3 2�3 2�3 2�3 2�3 2�3Percent Change, Year over Year ������������������������������ 1�3 2�1 2�1 2�0 2�2 2�3 2�3 2�3 2�3 2�3 2�3 2�3 2�3
Unemployment Rate, Civilian, Percent:Fourth Quarter Level ����������������������������������������������� 4�7 4�1 3�8 3�7 3�8 3�9 4�1 4�2 4�4 4�5 4�8 4�8 4�8Annual Average ������������������������������������������������������� 4�9 4�4 3�9 3�7 3�8 3�9 4�0 4�2 4�3 4�5 4�7 4�8 4�8
Federal Pay Raises, January, Percent:Military 4 ������������������������������������������������������������������� 1�3 2�1 2�4 2�6 N/A N/A N/A N/A N/A N/A N/A N/A N/ACivillian 5 ������������������������������������������������������������������ 1�3 2�1 1�9 0�0 N/A N/A N/A N/A N/A N/A N/A N/A N/A
Interest Rates, Percent:91-Day Treasury Bills 6 �������������������������������������������� 0�3 0�9 1�5 2�3 2�9 3�0 3�0 2�9 2�9 2�9 2�9 2�9 2�910-Year Treasury Notes ������������������������������������������� 1�8 2�3 2�6 3�1 3�4 3�6 3�7 3�7 3�6 3�6 3�6 3�6 3�6
N/A=Not Available1 Based on information available as of mid-November 2017�2 Rent, interest, dividend, and proprietors’ income components of personal income�3 Seasonally adjusted CPI for all urban consumers�4 Percentages apply to basic pay only; percentages to be proposed for years after 2019 have not yet been determined�5 Overall average increase, including locality pay adjustments� Percentages to be proposed for years after 2019 have not yet been determined�6 Average rate, secondary market (bank discount basis)�* 0�05 percent or less�
Table 2–1. ECONOMIC ASSUMPTIONS 1
(Calendar Years, Dollar Amounts in Billions)
12 ANALYTICAL PERSPECTIVES
External Sector.—Real exports grew 4.9 percent over the last four quarters ending in December 2017, while real imports grew 4.6 percent. Net exports made less of a negative contribution to real GDP growth in 2017 than in 2016. Worldwide, 2017 is projected to have been a bet-ter year for economic growth than 2016. According to the International Monetary Fund’s World Economic Outlook, October 2017, the advanced economies were poised to grow by 2.2 percent (year over year) in 2017 versus 1.7 percent in 2016. The emerging and developing econo-mies were expected to collectively grow by 4.6 percent in 2017 versus 4.3 percent in 2016.4 Many large emerging market countries (with the exception of India) have expe-rienced lower growth rates, relative to the past, in recent years, while Brazil and Russia went through recessions in 2015-16. These developments, as well as a strengthening dollar, have contributed to the soft performance of U.S. ex-ports. Looking ahead, the faster global growth expected by the IMF and other forecasters, and better trade agree-ments will support U.S. export performance.
Economic Projections
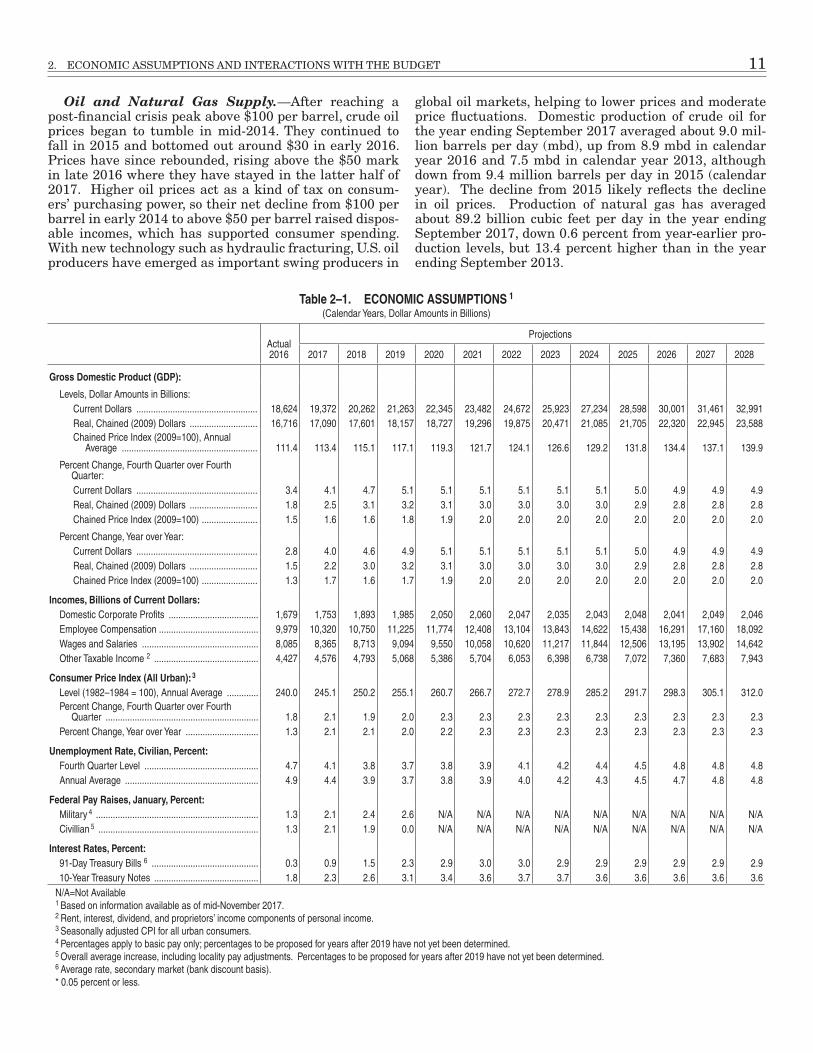
The Administration’s economic forecast is based on information available as of mid-November 2017. The forecast informs the Fiscal Year 2019 Budget and rests on the central assumption that all of the President’s policy proposals will be enacted. The Administration’s projec-tions are reported in Table 2-1 and summarized below.
Real GDP.—In mid-November, when the forecast was finalized, the Administration projected that real GDP growth would average 2.5 percent during the four quar-ters of 2017. It appears that 2017 growth was in line with expectations. The pace of growth is projected to increase to 3.1 percent over the four quarters of 2018. The enact-ment of tax reform and the Administration’s additional policies for cutting regulation, building infrastructure, reforming health care, and boosting domestic energy pro-duction are expected to improve the supply side of the U.S. economy to allow these growth rates. As for demand, lower taxes and an expected pick up in global growth in 2017 and 2018 should bolster demand for American goods and services.5
Medium and Long-Run Growth.—In the medium term the rate of real GDP growth is expected to remain strong at 3.0 percent as the effects of growth-enhancing
4 Besides the U.S.A. the other advanced economies are: Australia, Austria, Belgium, Canada, Cyprus, Czech Republic, Denmark, Estonia, Finland, France, Germany, Greece, Hong Kong SAR, Iceland, Ireland, Israel, Italy, Japan, Korea, Latvia, Lithuania, Luxembourg, Macao SAR, Malta, Netherlands, New Zealand, Norway, Portugal, Puerto Rico, San Marino, Singapore, Slovak Republic, Slovenia, Spain, Sweden, Switzer-land, Taiwan, Province of China, and the United Kingdom.
5 For estimates on productivity enhancing and economic growth ef-fects of tax and regulation policies, see: The Growth Effects of Corpo-rate Tax Reform and Implications for Wages, The Council of Economic Advisers October 2017, https://www.whitehouse.gov/sites/whitehouse.gov/files/images/Corporate%20Tax%20Reform%20and%20Growth%20Final.pdf; The Growth Potential of Deregulation, The Council of Eco-nomic Advisers October 2, 2017,https://www.whitehouse.gov/sites/whitehouse.gov/files/documents/The%20Growth%20Potential%20of%20Deregulation_1.pdf
policies play out in terms of an increasing capital stock per employed worker and consequently higher labor productivity growth. As the economy settles into a new steady state with higher capital stock per worker, the an-nual rate of real GDP growth is expected to edge down to a pace of 2.8 percent by 2026. While expected GDP growth of 2.8 percent per year at the end of the forecast is below the average growth rate seen in the post-World War II period, it is consistent with present-day and expected demographic trends for the U.S.
Unemployment.—As of January 2018, the unem-ployment rate stood at 4.1 percent. The Administration expects the unemployment rate to decrease as a result of increasing business investment and higher real GDP growth, reaching a low of 3.7 percent in 2019. After that, the forecast assumes that it will rise back toward 4.8 percent, a rate roughly consistent with stable inflation. Theory suggests that when the unemployment rate is at this rate, pressures on inflation are broadly in balance, so that inflation neither creeps up nor down.
Interest Rates.—As growth increases, the Admin-istration expects that interest rates will begin to rise to values more consistent with historical experience. The rate on the 91-day Treasury bill is expected to increase from 0.9 percent in 2017 to 3.0 percent in 2021 and then taper down to 2.9 percent in the last 6 years of the fore-cast window. The interest rate on the 10-year Treasury note is expected to rise in a similar fashion, from 2.3 per-cent in 2017 to 3.6 percent in the long run. Economic theory suggests that real GDP growth rates and interest rates are positively correlated, so interest rates are ex-pected to be propelled higher by the stronger growth that the Administration anticipates.
Inflation.—Since the onset of the financial crisis, inflation, whether measured by the GDP price index, the Consumer Price Index (CPI), or the price index for Personal Consumption Expenditures (PCE), has been subdued compared with the post-World War II average. This observation holds even when looking at the “core” indexes that exclude volatile food and energy prices. The Administration expects CPI inflation to rise 1.9 percent in 2018 (on a fourth quarter-over-fourth quarter basis), before rising to 2.3 percent in the long run. The GDP price index is forecast to rise by 1.6 percent in 2018 (on a fourth-quarter-over-fourth-quarter basis) and, with stronger aggregate demand for goods and labor, rise by 2021 to 2.0 percent where it is expected to stay through the longer term.
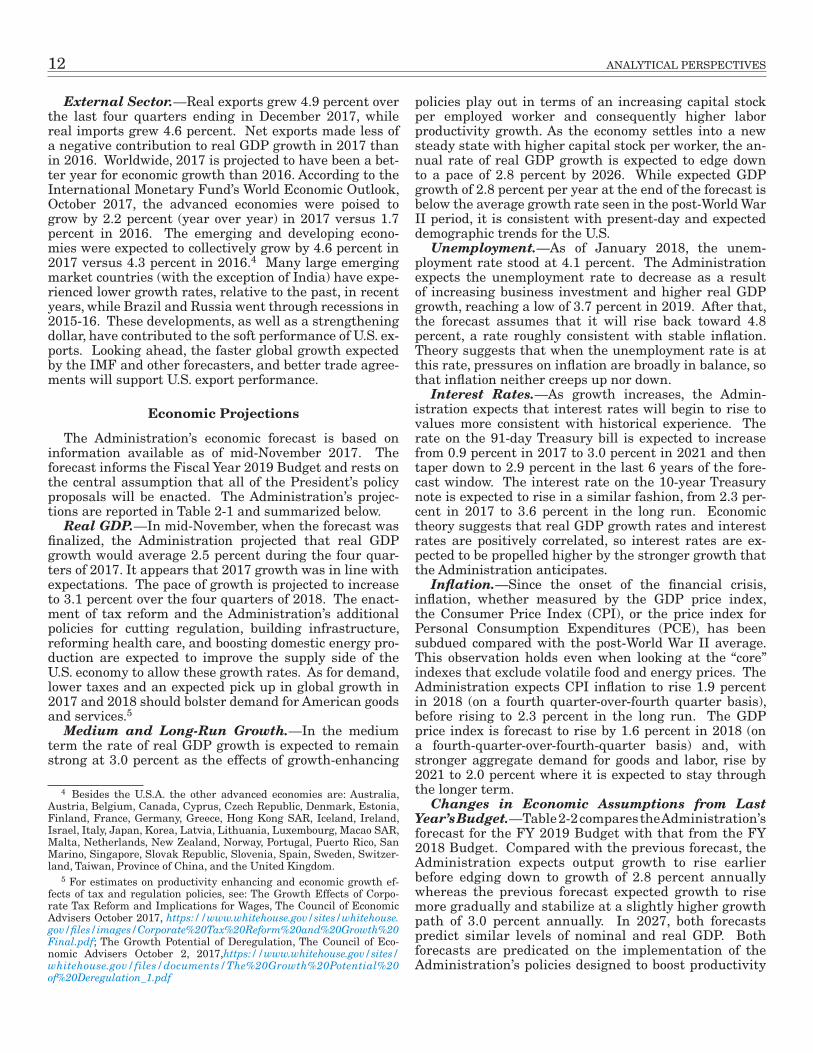
Changes in Economic Assumptions from Last Year’s Budget.—Table 2-2 compares the Administration’s forecast for the FY 2019 Budget with that from the FY 2018 Budget. Compared with the previous forecast, the Administration expects output growth to rise earlier before edging down to growth of 2.8 percent annually whereas the previous forecast expected growth to rise more gradually and stabilize at a slightly higher growth path of 3.0 percent annually. In 2027, both forecasts predict similar levels of nominal and real GDP. Both forecasts are predicated on the implementation of the Administration’s policies designed to boost productivity
2. ECONOMIC ASSUMPTIONS AND INTERACTIONS WITH THE BUDGET 13
and labor force participation. These include deregulation, tax reform, an improved fiscal outlook, and inducements for infrastructure investment, which should boost invest-ment and bolster the incentives to work and save. The Administration’s expectations for inflation differ little from the previous forecast, except for lower CPI inflation in the near term in light of the fact that price pressures in the economy have been remarkably contained despite falling unemployment and higher economic growth. The forecast for the unemployment rate is also broadly similar, although the 2019 Budget projections have the unemployment rate dropping to a trough of 3.7 percent, lower than was previously expected, but the unemploy-ment rate in both projections gradually edges up to 4.8 percent, the rate at which inflation pressures are broad-ly balanced in the long term. On the 91-day Treasury bill rate, the 2019 Budget expects it to rise more rapidly in the near term before settling at a steady state rate. The steady-state Treasury bill rate in the latter half of the forecast window is expected to be below that of the 2018 Budget. The yield on the 10-year Treasury note is lower at all points of the forecast horizon relative to the 2018 Budget. This lowering of the yield, relative to the 2018 Budget projection in the near term, is largely driven by lower long-term interest rates observed in the recent data. Over the medium term, the yield rises rap-
idly to levels consistent with the steady state annual GDP growth projection of 2.8 percent in contrast to the 3.0 percent growth forecast in the 2018 Budget.
Comparison with Other Forecasts
For some additional perspective on the Administration’s forecast, this section compares it with forecasts prepared by the Congressional Budget Office (CBO), the Federal Open Market Committee of the Federal Reserve (FOMC), and the Blue Chip panel of private-sector forecasters. There are some important differences to bear in mind when making such a comparison.
The most important difference between these fore-casts is that they make different assumptions about the implementation of the Administration’s policies. As al-ready noted, the Administration’s forecast assumes full implementation of these proposals. At the opposite end of the spectrum, CBO produces a forecast that assumes no changes to current law. It is not clear to what extent the FOMC participants and the Blue Chip panel incorporate policy implementation in their respective outlooks. The Blue Chip panel, in particular, compiles a large number of private-sector forecasts, which are marked by consider-able heterogeneity across individual forecasters and their policy expectations.
2017 2018 2019 2020 2021 2022 2023 2024 2025 2026 2027
Nominal GDP:2018 Budget Assumptions 1 ����������������������������������������������� 19,419 20,291 21,253 22,313 23,442 24,628 25,874 27,183 28,558 30,003 31,5222019 Budget Assumptions ������������������������������������������������� 19,372 20,262 21,263 22,345 23,482 24,672 25,923 27,234 28,598 30,001 31,461
Real GDP (2009 Dollars):2018 Budget Assumptions 1 ����������������������������������������������� 17,093 17,508 17,978 18,504 19,059 19,631 20,220 20,826 21,451 22,095 22,7582019 Budget Assumptions ������������������������������������������������� 17,090 17,601 18,157 18,727 19,296 19,875 20,471 21,085 21,705 22,320 22,945
Real GDP (Percent Change): 2
2018 Budget Assumptions 1 ����������������������������������������������� 2�3 2�4 2�7 2�9 3�0 3�0 3�0 3�0 3�0 3�0 3�02019 Budget Assumptions ������������������������������������������������� 2�2 3�0 3�2 3�1 3�0 3�0 3�0 3�0 2�9 2�8 2�8
GDP Price Index (Percent Change): 2
2018 Budget Assumptions 1 ����������������������������������������������� 1�9 2�0 2�0 2�0 2�0 2�0 2�0 2�0 2�0 2�0 2�02019 Budget Assumptions ������������������������������������������������� 1�7 1�6 1�7 1�9 2�0 2�0 2�0 2�0 2�0 2�0 2�0
Consumer Price Index (All-Urban; Percent Change): 2
2018 Budget Assumptions ������������������������������������������������� 2�6 2�3 2�3 2�3 2�3 2�3 2�3 2�3 2�3 2�3 2�32019 Budget Assumptions ������������������������������������������������� 2�1 2�1 2�0 2�2 2�3 2�3 2�3 2�3 2�3 2�3 2�3
Civilian Unemployment Rate (Percent): 3
2018 Budget Assumptions ������������������������������������������������� 4�6 4�4 4�6 4�7 4�8 4�8 4�8 4�8 4�8 4�8 4�82019 Budget Assumptions ������������������������������������������������� 4�4 3�9 3�7 3�8 3�9 4�0 4�2 4�3 4�5 4�7 4�8
91-Day Treasury Bill Rate (Percent): 3
2018 Budget Assumptions ������������������������������������������������� 0�8 1�5 2�1 2�6 2�9 3�0 3�0 3�1 3�1 3�1 3�12019 Budget Assumptions ������������������������������������������������� 0�9 1�5 2�3 2�9 3�0 3�0 2�9 2�9 2�9 2�9 2�9
10-Year Treasury Note Rate (Percent): 3
2018 Budget Assumptions ������������������������������������������������� 2�7 3�3 3�4 3�8 3�8 3�8 3�8 3�8 3�8 3�8 3�82019 Budget Assumptions ������������������������������������������������� 2�3 2�6 3�1 3�4 3�6 3�7 3�7 3�6 3�6 3�6 3�6
1 Adjusted for July 2017 NIPA Revisions2 Calendar Year over Calendar Year3 Calendar Year Average
Table 2–2. COMPARISON OF ECONOMIC ASSUMPTIONS IN THE 2018 AND 2019 BUDGETS (Calendar Years, Dollar Amounts in Billions)
14 ANALYTICAL PERSPECTIVES
A second difference is the publication dates of the various forecasts. While the forecast put out by the Administration is based on actual data available in mid-November, the Blue Chip long-term forecast is based on their October Survey, the FOMC projections were released on December 13, and the CBO forecast was pub-lished much earlier, in June of 2017.
In spite of these differences, the forecasts share several attributes. All of them project a further short-run decline in unemployment, followed by a rise back toward a rate consistent with stable inflation. They all forecast a rise in inflation, followed by a stable path at its long-run rate.
Finally, they all foresee a gradual rise in interest rates over the course of the forecast horizon. What separates the Administration’s forecast from those of the other bod-ies is their respective views on real output growth.
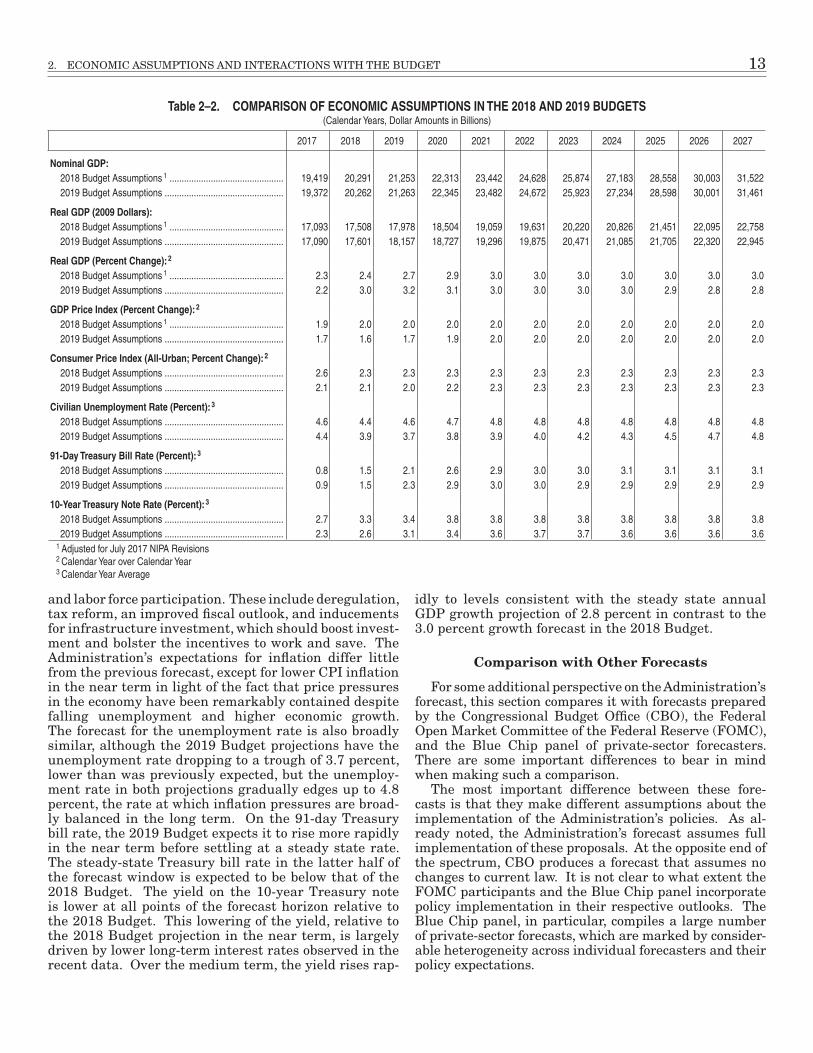
Real GDP.—The Administration forecasts a higher path for real GDP growth compared with the CBO, FOMC, and Blue Chip forecasts throughout the forecast period af-ter 2017. After 2017, the Administration’s forecast diverges from the other forecasts, with a growth rate 0.6 percentage point faster than the next fastest in 2018 and 0.7 percent-age point faster than the others at the end of the forecast window. This reflects the Administration’s expectation
2017 2018 2019 2020 2021 2022 2023 2024 2025 2026 2027 2028
Nominal GDP:2019 Budget ��������������������������������������������������������� 19,372 20,262 21,263 22,345 23,482 24,672 25,923 27,234 28,598 30,001 31,461 32,991CBO ���������������������������������������������������������������������� 19,310 20,118 20,847 21,566 22,378 23,262 24,186 25,150 26,150 27,191 28,273 N/ABlue Chip �������������������������������������������������������������� 19,351 20,105 20,950 21,830 22,725 23,657 24,626 25,661 26,739 27,862 29,032 30,251
Real GDP (Year-over-Year):2019 Budget ��������������������������������������������������������� 2�2 3�0 3�2 3�1 3�0 3�0 3�0 3�0 2�9 2�8 2�8 2�8CBO ���������������������������������������������������������������������� 2�1 2�2 1�7 1�4 1�7 1�9 1�9 1�9 1�9 1�9 1�9 N/ABlue Chip �������������������������������������������������������������� 2�2 2�4 2�1 2�1 2�0 2�0 2�1 2�1 2�1 2�1 2�1 2�1
Real GDP (Fourth Quarter-over-Fourth Quarter):2019 Budget ��������������������������������������������������������� 2�5 3�1 3�2 3�1 3�0 3�0 3�0 3�0 2�9 2�8 2�8 2�8CBO ���������������������������������������������������������������������� 2�2 2�0 1�5 1�5 1�8 1�9 1�9 1�9 1�9 1�9 1�9 N/ABlue Chip �������������������������������������������������������������� 2�3 2�3 2�1 2�1 2�0 2�0 2�1 2�1 2�1 2�1 2�1 2�1Federal Reserve Median Projection ��������������������� 2�5 2�5 2�1 2 ----------------------------------------------1�8 longer run----------------------------------------------
GDP Price Index: 1
2019 Budget ��������������������������������������������������������� 1�7 1�6 1�7 1�9 2�0 2�0 2�0 2�0 2�0 2�0 2�0 2�0CBO ���������������������������������������������������������������������� 1�8 2�0 1�9 2�0 2�0 2�0 2�0 2�0 2�1 2�1 2�1 N/ABlue Chip �������������������������������������������������������������� 1�7 1�9 2�1 2�1 2�1 2�1 2�1 2�1 2�1 2�1 2�1 2�1
Consumer Price Index (CPI-U): 1
2019 Budget ��������������������������������������������������������� 2�1 2�1 2�0 2�2 2�3 2�3 2�3 2�3 2�3 2�3 2�3 2�3CBO ���������������������������������������������������������������������� 2�3 2�2 2�3 2�4 2�4 2�4 2�4 2�4 2�4 2�4 2�4 N/ABlue Chip �������������������������������������������������������������� 2�1 1�9 2�3 2�3 2�3 2�3 2�3 2�3 2�3 2�3 2�3 2�3
Unemployment Rate: 2
2019 Budget ��������������������������������������������������������� 4�4 3�9 3�7 3�8 3�9 4�0 4�2 4�3 4�5 4�7 4�8 4�8CBO ���������������������������������������������������������������������� 4�4 4�2 4�4 4�7 4�9 5�0 4�9 4�9 4�9 4�9 4�9 N/ABlue Chip �������������������������������������������������������������� 4�4 4�1 4�2 4�3 4�4 4�5 4�5 4�6 4�6 4�6 4�6 4�6Federal Reserve Median Projection 3 ������������������� 4�1 3�9 3�9 4 ----------------------------------------------4�6 longer run----------------------------------------------
Interest Rates: 2
91-Day Treasury Bills (discount basis):2019 Budget ��������������������������������������������������� 0�9 1�5 2�3 2�9 3�0 3�0 2�9 2�9 2�9 2�9 2�9 2�9CBO ���������������������������������������������������������������� 0�9 1�5 2�2 2�6 2�8 2�8 2�8 2�8 2�8 2�8 2�8 N/ABlue Chip �������������������������������������������������������� 0�9 1�7 2�4 2�7 2�8 2�8 2�8 2�8 2�9 2�9 2�9 2�9
10-Year Treasury Notes:2019 Budget ��������������������������������������������������� 2�3 2�6 3�1 3�4 3�6 3�7 3�7 3�6 3�6 3�6 3�6 3�6CBO ���������������������������������������������������������������� 2�4 2�8 3�2 3�5 3�6 3�7 3�7 3�7 3�7 3�7 3�7 N/ABlue Chip �������������������������������������������������������� 2�3 2�8 3�4 3�5 3�5 3�6 3�6 3�7 3�7 3�7 3�7 3�7
Sources: Administration; CBO, An Update to the Budget and Economic Outlook: 2017 to 2027, June 2017; October 2017 Blue Chip Economic Indicators, Aspen Publishers, Inc�; Federal Reserve Open Market Committee, December 13, 2017
N/A=Number is not available�1 Year-over-Year Percent Change2 Annual Averages, Percent3 Median of Fourth Quarter Values
Table 2–3. COMPARISON OF ECONOMIC ASSUMPTIONS (Calendar Years)
2. ECONOMIC ASSUMPTIONS AND INTERACTIONS WITH THE BUDGET 15
of full implementation of its policy proposals, while other forecasters are unlikely to be operating under the same as-sumption. The CBO in particular is constrained to assume a continuation of current law in its forecast, which in the case of its June 2017 forecast was prepared prior to the enactment of the Tax Cuts and Jobs Act.
Unemployment.—On the unemployment rate, the Administration’s expectations are largely aligned with those of the other forecasters. Along with the Administration, all forecasters expect further declines in unemployment in 2018. After 2018 other forecasters expect the unemployment rate to rise gradually while
the Administration believes that because of its policies there is more room for the economy to grow and for the unemployment rate to decrease. After 2019, all forecast-ers project a gradual uptick in the unemployment rate to their respective estimates of the long-term rate (4.8 per-cent for the Administration, 4.9 percent for the CBO, and 4.6 percent for the FOMC and the Blue Chip panel).
Interest Rates.—There are not significant differenc-es in the outlooks for interest rates. For both short- and long-term rates, all forecasters agree that they will tend to gradually rise, the Treasury bill rate is expected to rise to a steady-state level of around 2.9 percent and the 10-
Budget Effect2018 2019 2020 2021 2022 2023 2024 2025 2026 2027 2028
Total of Budget Effects: 2018-
2028
Real Growth and Employment:
Budgetary effects of 1 percent lower real GDP growth:(1) For calendar year 2018 only, with real GDP recovery in
2018–2019: 1
Receipts �������������������������������������������������������������������������������� –16�1 –25�5 –13�1 –2�1 0�2 0�2 0�2 0�2 0�2 0�2 0�2 –55�7Outlays ��������������������������������������������������������������������������������� 8�4 18�9 9�2 3�0 2�8 2�8 2�7 2�8 2�8 2�9 2�9 59�1
Increase in deficit (+) ������������������������������������������������������� 24�5 44�4 22�3 5�1 2�6 2�6 2�6 2�6 2�6 2�7 2�8 114�7
(2) For calendar year 2018 only, with no subsequent recovery: 1
Receipts �������������������������������������������������������������������������������� –16�1 –33�7 –39�4 –41�7 –43�7 –46�0 –48�3 –50�8 –53�6 –56�3 –58�9 –488�3Outlays ��������������������������������������������������������������������������������� 8�4 23�0 23�8 25�3 27�2 29�0 31�0 33�2 35�3 37�4 40�5 314�1
Increase in deficit (+) ������������������������������������������������������� 24�5 56�6 63�2 67�0 70�9 75�0 79�3 83�9 88�9 93�7 99�4 802�4
(3) Sustained during 2018–2028, with no change in unemployment:Receipts �������������������������������������������������������������������������������� –16�1 –50�0 –91�3 –137�5 –187�1 –241�6 –300�8 –364�7 –436�3 –511�3 –590�3 –2,927�2Outlays ��������������������������������������������������������������������������������� 0�0 0�5 2�4 5�5 9�4 14�2 20�0 27�2 35�6 45�2 56�6 216�6
Increase in deficit (+) ������������������������������������������������������� 16�1 50�6 93�7 143�0 196�4 255�8 320�9 391�9 471�9 556�6 646�9 3,143�7
Inflation and Interest Rates:
Budgetary effects of 1 percentage point higher rate of:(4) Inflation and interest rates during calendar year 2018
only:Receipts �������������������������������������������������������������������������������� 17�2 33�9 36�4 37�1 39�0 41�0 43�1 45�2 47�7 50�1 52�4 443�0Outlays ��������������������������������������������������������������������������������� 25�6 50�0 45�7 45�2 45�0 44�8 43�0 44�1 43�3 45�1 47�0 478�8
Increase in deficit (+) ������������������������������������������������������� 8�4 16�1 9�4 8�1 6�0 3�8 –0�1 –1�1 –4�4 –5�0 –5�4 35�8
(5) Inflation and interest rates, sustained during 2018–2028:Receipts �������������������������������������������������������������������������������� 17�2 51�7 91�0 134�2 181�8 234�3 292�1 355�2 426�6 502�3 583�3 2,869�7Outlays ��������������������������������������������������������������������������������� 23�7 73�3 120�9 170�6 225�9 279�9 332�7 395�3 456�5 522�8 601�8 3,203�4
Increase in deficit (+) ������������������������������������������������������� 6�5 21�6 29�9 36�4 44�1 45�6 40�6 40�1 29�9 20�5 18�5 333�7
(6) Interest rates only, sustained during 2018–2028:Receipts �������������������������������������������������������������������������������� 1�1 2�5 3�1 3�5 3�8 4�0 4�3 4�6 4�9 5�2 5�4 42�4Outlays ��������������������������������������������������������������������������������� 11�5 38�1 62�0 83�9 105�2 126�1 143�9 160�4 175�0 189�7 204�1 1,299�8
Increase in deficit (+) ������������������������������������������������������� 10�4 35�6 58�9 80�4 101�5 122�1 139�6 155�8 170�1 184�6 198�7 1,257�5(7) Inflation only, sustained during 2018–2028:
Receipts �������������������������������������������������������������������������������� 16�0 49�1 87�8 130�7 177�9 230�0 287�5 350�3 421�3 496�7 577�4 2,824�6Outlays ��������������������������������������������������������������������������������� 12�2 35�1 58�8 86�7 120�8 154�0 189�2 235�5 282�2 334�1 398�9 1,907�5
Decrease in deficit (–) ������������������������������������������������������ –3�9 –13�9 –29�0 –44�0 –57�1 –76�0 –98�3 –114�8 –139�1 –162�6 –178�5 –917�1
Interest Cost of Higher Federal Borrowing:(8) Outlay effect of 100 billion increase in borrowing in
2018 ...................................................................................... 0�7 2�1 3�0 3�4 3�5 3�5 3�6 3�7 3�8 3�9 4�1 35�31 The unemployment rate is assumed to be 0�5 percentage point higher per 1 percent shortfall in the level of real GDP�
Table 2–4. SENSITIVITY OF THE BUDGET TO ECONOMIC ASSUMPTIONS (Fiscal Years; In Billions Of Dollars)
16 ANALYTICAL PERSPECTIVES
year Treasury note yield is expected to lie between 3.6 percent and 3.7 percent.
Inflation.—Expectations for inflation are similar across the Administration, the CBO, and the Blue Chip. The CBO expects a CPI inflation rate of 2.4 percent in the long run, while the Administration and the Blue Chip ex-pect a 2.3 percent long run rate. For the GDP price index, the three forecasts also exhibit little disagreement, other than a marginally higher long-run rate from the Blue Chip panel and CBO.
Sensitivity of the Budget to Economic Assumptions
Federal spending and tax collections are heavily influ-enced by developments in the economy. Tax receipts are a function of growth in incomes for households and firms. Spending on social assistance programs may rise when the economy enters a downturn, while increases in spend-ing on Social Security and other programs are dependent on consumer price inflation. A robust set of projections for macroeconomic variables assists in budget planning, but unexpected developments in the economy have ripple effects for Federal spending and revenues. This section seeks to provide an understanding of the magnitude of
the effects that unforeseen changes in the economy can have on the budget.
To make these assessments, the Administration relies on a set of rules of thumb that can predict how certain spending and revenue categories will react to a change in a given subset of macroeconomic variables, holding almost everything else constant. These rules of thumb provide a sense of the broad changes one would expect after a given development, but they cannot anticipate how policy mak-ers would react and potentially change course in such an event. For example, if the economy were to suffer an un-expected recession, the rules of thumb suggest that tax revenues would decline and that spending on programs such as unemployment insurance would go up. In such a situation, however, policy makers might cut tax rates to stimulate the economy, and such behavior would not be accounted for by the historical relationships captured by these rules of thumb.
Another caveat is that it is often unrealistic to suppose that one macroeconomic variable might change while others would remain constant. Most macroeconomic variables interact with each other in complex and subtle ways. These are important considerations to bear in mind when examining Table 2-4.
REAL GDP ERRORS
2-Year Average Annual Real GDP Growth Administration CBO Blue ChipMean Error ��������������������������������������������������������������������������������������������������������������������� 0�2 –0�1 –0�1Mean Absolute Error ������������������������������������������������������������������������������������������������������ 1�2 1�0 1�1Root Mean Square Error ����������������������������������������������������������������������������������������������� 1�5 1�3 1�4
6-Year Average Annual Real GDP GrowthMean Error ��������������������������������������������������������������������������������������������������������������������� 0�4 0�1 0�1Mean Absolute Error ������������������������������������������������������������������������������������������������������ 1�1 1�0 0�9Root Mean Square Error ����������������������������������������������������������������������������������������������� 1�3 1�2 1�1
INFLATION ERRORS
2-Year Average Annual Change in the GDP Price Index Administration CBO Blue ChipMean Error ��������������������������������������������������������������������������������������������������������������������� 0�3 0�3 0�4Mean Absolute Error ������������������������������������������������������������������������������������������������������ 0�7 0�7 0�7Root Mean Square Error ����������������������������������������������������������������������������������������������� 0�9 0�9 0�8
6-Year Average Annual Change in the GDP IndexMean Error ��������������������������������������������������������������������������������������������������������������������� 0�4 0�5 0�7Mean Absolute Error ������������������������������������������������������������������������������������������������������ 0�6 0�8 0�9Root Mean Square Error ����������������������������������������������������������������������������������������������� 0�8 1�0 1�0
INTEREST RATE ERRORS
2-Year Average 91-Day Treasury Bill Rate Administration CBO Blue ChipMean Error ��������������������������������������������������������������������������������������������������������������������� 0�3 0�5 0�6Mean Absolute Error ������������������������������������������������������������������������������������������������������ 1�0 0�9 1�0Root Mean Square Error ����������������������������������������������������������������������������������������������� 1�2 1�3 1�2
6-Year Average 91-Day Treasury Bill RateMean Error ��������������������������������������������������������������������������������������������������������������������� 0�9 1�4 1�5Mean Absolute Error ������������������������������������������������������������������������������������������������������ 1�4 1�5 1�6Root Mean Square Error ����������������������������������������������������������������������������������������������� 1�7 1�8 1�9
Table 2–5. FORECAST ERRORS, JANUARY 1982–PRESENT
2. ECONOMIC ASSUMPTIONS AND INTERACTIONS WITH THE BUDGET 17
For real growth and employment:• The first panel in the table illustrates the effect on
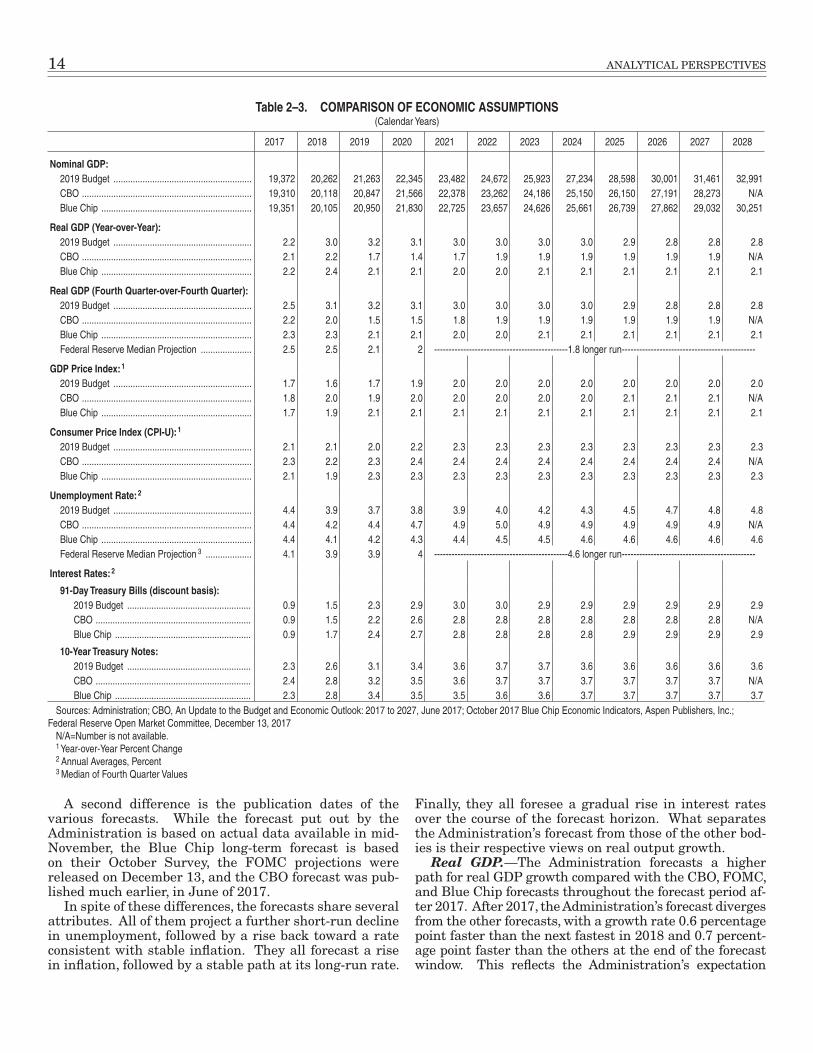
the deficit resulting from a one percentage point reduction in real GDP growth, relative to the Ad-ministration’s forecast, in 2018 that is followed by a subsequent recovery in 2019 and 2020. The un-employment rate is assumed to be half a percentage point higher in 2018 before returning to the base-line level in 2019 and 2020. The table shows that receipts would temporarily be somewhat lower and outlays would temporarily be higher. The long run effect on the budget deficit would be an increase of $114.7 billion over the eleven-year forecast horizon due to lower receipts and higher interest payments resulting from higher short-run deficits.
• The next panel in the table reports the effect of a re-duction of one percentage point in real GDP growth in 2018 that is not subsequently made up by faster growth in 2019 and 2020. Consistent with this out-put path, the rate of unemployment is assumed to rise by half a percentage point relative to that as-sumed in the Administration’s forecasts. Here, the effect on the budget deficit is more substantial, as receipts are lowered in every year of the forecast, while outlays rise gradually over the forecast win-dow. This is because unemployment will be higher, leading to lower tax revenues and higher outlays on unemployment insurance, as well as higher interest payments that follow from increased short-run defi-cits.
• The third panel in the table shows the impact of a GDP growth rate that is permanently reduced by one percentage point, while the unemployment rate is not affected. This is the sort of situation that would arise if, for example, the economy were hit by a permanent decline in productivity growth. In this case, the effect on the budget deficit is large, with receipts being reduced substantially throughout the forecast window and outlays rising due to higher interest payments. The accumulated effect over the eleven-year horizon is an additional $3.1 trillion of deficits.
For inflation and interest rates:• The fourth panel in Table 2-4 shows the effect on
the Budget in the case of a one percentage point higher rate of inflation and a 1 percentage point higher nominal interest rate in 2018. Both inflation and interest rates return to their assumed levels in 2019. This would result in a permanently higher price level and nominal GDP over the course of the forecast horizon. The effect on the Budget deficit would be fairly modest, as receipts would increase slightly less than outlays over the eleven years. This is because revenues, interest payments, and nondis-cretionary outlays rise with inflation while discre-tionary outlays are assumed fixed. Over the years from 2018-2028, the budget deficit would increase by about $36 billion.
• The fifth panel in the table illustrates the effects on the budget deficit of an inflation rate and an inter-est rate one percentage point higher than projected in every year of the forecast. The overall effect on the deficit over the forecast is $334 billion accumulated as both receipts, interest payments, and mandatory outlays (on Social Security and Federal pensions rise with inflation while discretionary outlays are pre-sumed to be fixed. It is still important to note, how-ever, that faster inflation implies that the real value of Federal discretionary spending would be eroded.
• The next panel reports the effect on the deficit re-sulting from an increase in interest rates in every year of the forecast, with no accompanying increase in inflation. The result is a much higher accumulat-ed deficit, as the Federal Government would have to make much higher interest payments on its debt. Receipts would be slightly higher as households would pay higher taxes on interest income.
• The seventh panel in the table reports the effect on the budget deficit of an inflation rate one percentage point higher than projected in every year of the fore-cast window, while the interest rate remains as fore-cast. In this case, the result is a much smaller deficit over the eleven years of the forecast relative to the baseline. Permanently higher inflation results in much higher revenues over the next eleven years, which helps to reduce interest payments on debt.
Current Year Estimate
Budget Year Estimate
Estimate for Budget Year Plus:
One Year (BY + 1)
Two Years (BY + 2)
Three Years (BY + 3)
Four Years (BY + 4)
Average Difference 1 ���������������������������������������������������������������� –0�8 0�2 1�1 1�7 2�1 2�5Average Absolute Difference 2 ������������������������������������������������� 1�1 1�4 2�2 2�8 3�4 3�7Standard Deviation ������������������������������������������������������������������ 1�0 2�0 2�8 3�3 3�5 3�5Root Mean Squared Error ������������������������������������������������������� 1�3 2�0 3�0 3�7 4�0 4�2
1 A positive number represents an overestimate of the surplus or an underestimate of the deficit� A negative number represents an overestimate of the deficit or an underestimate of the surplus�
2 Average absolute difference is the difference without regard to sign
Table 2–6. DIFFERENCES BETWEEN ESTIMATED AND ACTUAL SURPLUSES OR DEFICITS FOR FIVE-YEAR BUDGET ESTIMATES SINCE 1986 (AS A PERCENT OF GDP)
18 ANALYTICAL PERSPECTIVES
Outlays rise due to higher cost-of-living increases on items such as Social Security, though not so much as to offset the revenue increases.
• Finally, the table shows the effect on the budget defi-cit if the Federal government were to borrow an ad-ditional $100 billion in 2018, while all of the other projections remain constant. Outlays rise over the forecast window by an accumulated $35 billion, due to higher interest payments.
These simple approximations that inform the sensitiv-ity analysis are symmetric. This means that the effect of, for example, a one percentage point higher rate of growth over the forecast horizon would be of the same magnitude as a one percentage point reduction in growth, though with the opposite sign.
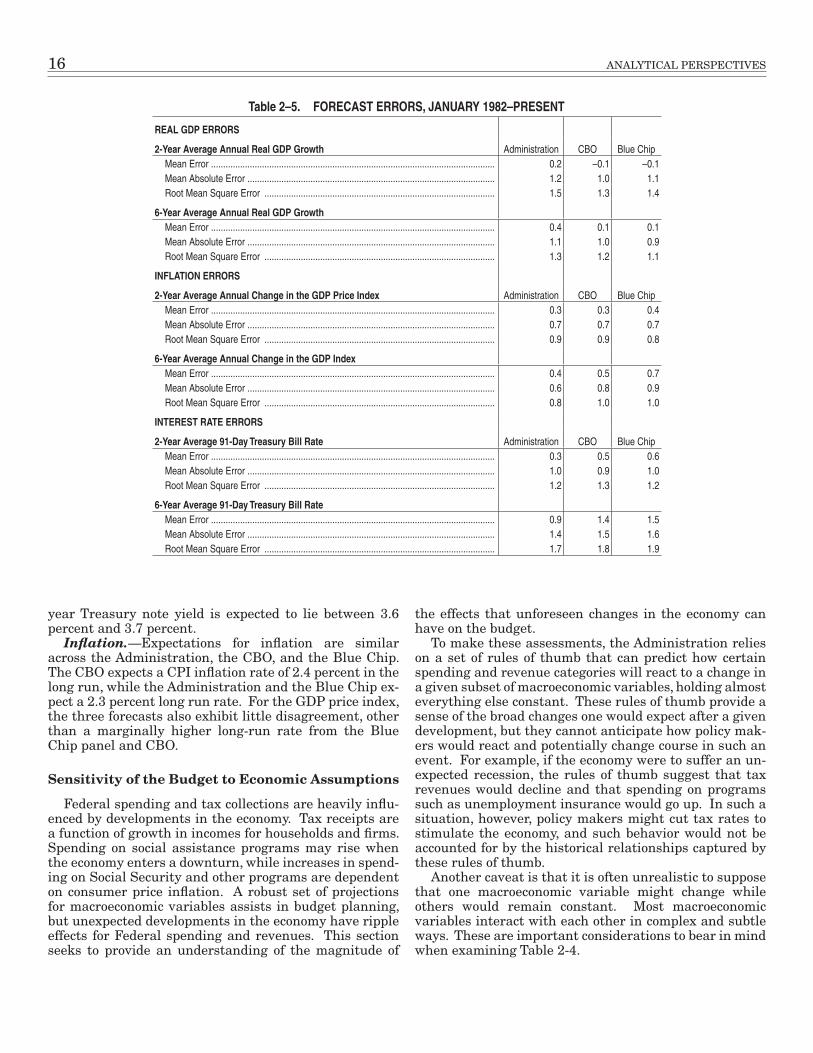
Forecast Errors for Growth, Inflation, and Interest Rates
As with any forecast, the Administration’s projections will not be fully accurate. It is impossible to foresee ev-ery eventuality over a one–year horizon, much less ten or more years. This section evaluates the historical accu-racy of the forecasts of past Administrations for real GDP, inflation, and short-term interest rates, especially as com-pared with the accuracy of forecasts produced by the CBO or Blue Chip panel. For this exercise, forecasts produced by all three entities going as far back as the Fiscal Year 1983 Budget are compared with realized values of these important variables.
The results of this exercise are reported in Table 2-5 and contain three different measures of accuracy. The first is the average forecast error. When a forecaster has an average forecast error of zero, it may be said that the forecast has historically been unbiased, in the sense that realized values of the variables have not been systemati-cally above or below the forecasted value. The second is the average absolute value of the forecast error, which of-fers a sense of the magnitude of errors. Even if the past forecast errors average to zero, the errors may have been of a very large magnitude, with both positive and nega-tive values. Finally, the table reports the square root of the mean of squared forecast error (RMSE). This metric applies an especially harsh penalty to forecasting systems prone to large errors. The table reports these measures of accuracy at both the 2-year and the 6-year horizons, thus evaluating the relative success of different forecasts in the short run and in the medium term.
For real GDP growth rates, at both the 2-year and 6-year horizons, the mean forecast error suggests that all of the forecasts (Administration, the CBO, and the Blue Chip panel) have been broadly unbiased, with small aver-age errors close to zero. The mean absolute error and the RMSE both suggest that the Administration’s past fore-casts have tended to make slightly larger errors than the others. This could be due to partial adoption of the vari-ous Administrations’ proposed policies in the past.
When it comes to inflation, there is more evidence of some systematic bias in all three forecasts. The mean er-
rors at the 2- and 6-year horizons are all positive and larger than the errors in projecting real GDP growth. This implies that the Administration, the CBO, and the Blue Chip have expected faster inflation than ultimately materialized. A closer look at the data reveals that the errors were largest in the 1980s, as the U.S. economy shifted from a period of high inflation in the 1970s to a period of more moderate price rises. The mean absolute error and the RMSE met-rics imply that the errors in the Administration’s inflation forecast have tended to be of equal or smaller magnitude than those of the CBO or Blue Chip panel.
Finally, on interest rates, the story is similar to that for inflation. All of the forecasts have historically projected interest rates that were higher than what later occurred, probably because they expected higher inflation as shown above. Across the three forecasters, the Administration has generally made errors of lesser magnitude than the other two.
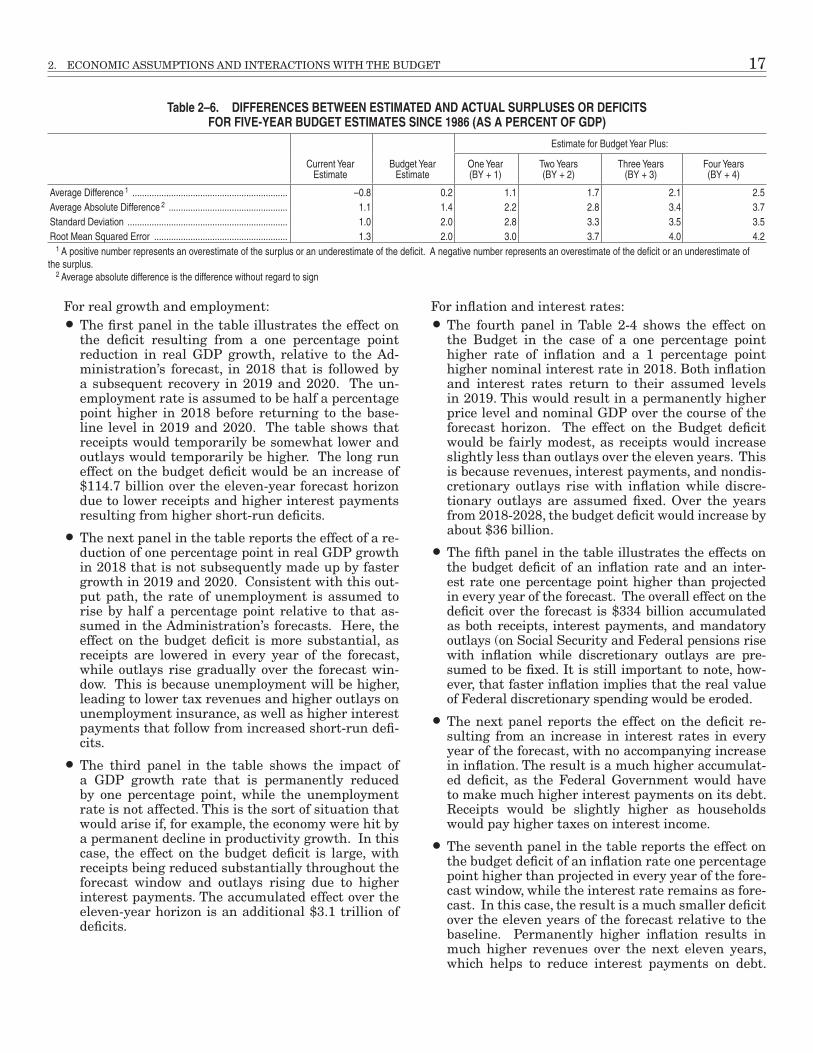
Uncertainty and the Deficit Projections
This section assesses the accuracy of past Budget fore-casts for the deficit or surplus, measured at different time horizons. The results of this exercise are reported in Table 2-6, where the average error, the average absolute error, and the RMSE (as well as the standard deviation of the forecast error) are reported.
In the table, a negative number means that the Federal Government ran a greater surplus than was expected, while a positive number in the table indicates a smaller surplus or a larger deficit. In the current year in which the Budget is published, the Administration has tended to understate the surplus (or, equivalently, overstate the deficit). For every year beyond the current year, however, the historical pattern has been for the budget deficit to be larger than the Administration expected. One possible reason for this is that past Administrations’ policy pro-posals have not all been implemented. The forecast errors tend to grow with the time horizon, which is not surpris-ing given that there is much greater uncertainty in the medium run about both the macroeconomic situation and the specific details of policy enactments.
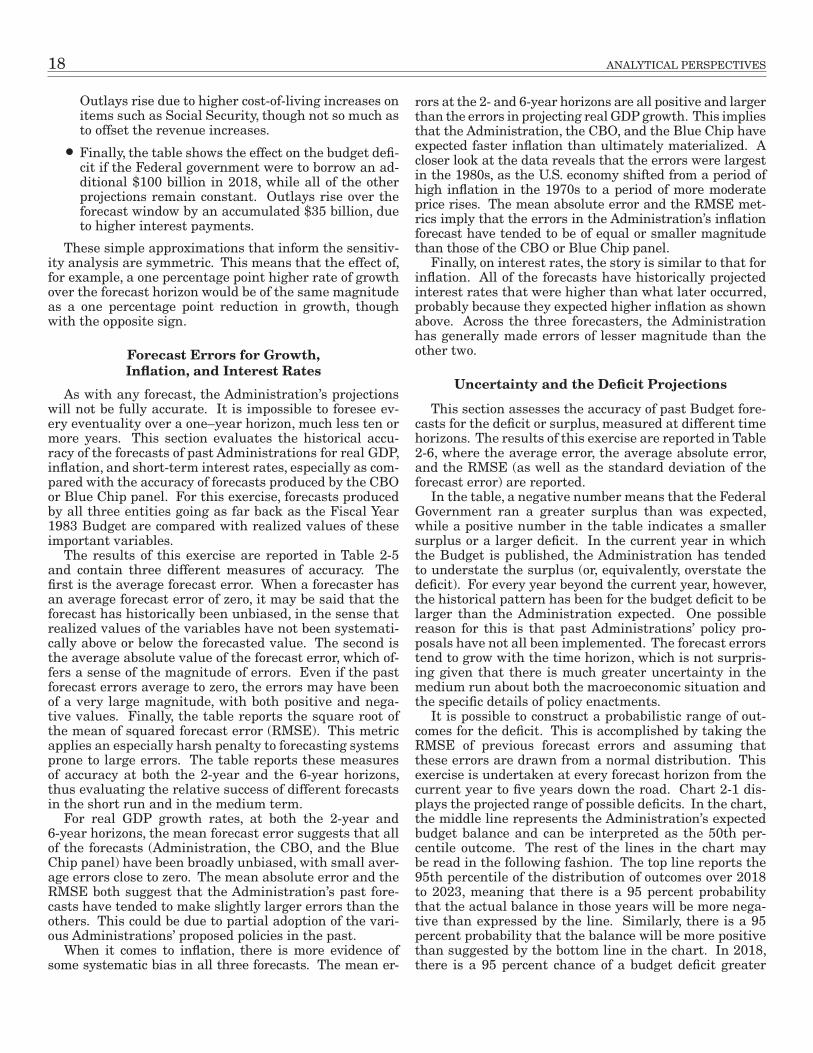
It is possible to construct a probabilistic range of out-comes for the deficit. This is accomplished by taking the RMSE of previous forecast errors and assuming that these errors are drawn from a normal distribution. This exercise is undertaken at every forecast horizon from the current year to five years down the road. Chart 2-1 dis-plays the projected range of possible deficits. In the chart, the middle line represents the Administration’s expected budget balance and can be interpreted as the 50th per-centile outcome. The rest of the lines in the chart may be read in the following fashion. The top line reports the 95th percentile of the distribution of outcomes over 2018 to 2023, meaning that there is a 95 percent probability that the actual balance in those years will be more nega-tive than expressed by the line. Similarly, there is a 95 percent probability that the balance will be more positive than suggested by the bottom line in the chart. In 2018, there is a 95 percent chance of a budget deficit greater
2. ECONOMIC ASSUMPTIONS AND INTERACTIONS WITH THE BUDGET 19
than 2.0 percent of GDP. By 2023, there is only a 5 per-cent chance of a budget deficit greater than 9.9 percent of
GDP. In addition, the chart reports that there is a signifi-cant probability of a budget surplus by 2023.
-12
-10
-8
-6
-4
-2
0
2
4
6
2018 2019 2020 2021 2022 2023
Chart 2-1. Range of Uncertainty for the Budget Deficit
Percent of GDP Percentiles:
95th
90th
75th
DeficitForecast
25th
5th
10th
