economic benefits from air transport in the indian ocean ... · pdf fileeconomic benefits from...
TRANSCRIPT

n
Economic Benefits from Air Transport in the Indian Ocean
Islands

Indian Ocean Islands report
2
Acknowledgements
Oxford Economics gratefully acknowledge the help that we received from the
International Air Transport Association (IATA) in preparation of this report.
Through a survey conducted by IATA many organisations across the aviation
industry supplied us with data that has formed an integral part of our analysis.
We would like to thank all these organisations for their generosity in supplying
this data, without which this report could not have been written.
A note on the data reported in the report
Unless otherwise stated, the numbers reported in this report relate to the
calendar year 2009.
Oxford Economics 2011
v1.2

Indian Ocean Islands report
3
Contents
Facts & figures .......................................................................................... 4
1 Consumer benefits for passengers and shippers ......................... 6
1.1 Consumer benefits ..................................................................................... 6
1.2 Estimated consumer benefits ..................................................................... 7
2 Enabling long-term economic growth ............................................ 8
2.1 Connectivity ................................................................................................ 8
2.2 Catalytic effects – tourism .......................................................................... 9
2.2.1 Mauritius............................................................................................. 9
2.2.2 Maldives ........................................................................................... 10
2.2.3 Seychelles ........................................................................................ 11
2.3 Catalytic effects – trade............................................................................ 11
3 Economic footprint ........................................................................ 13
3.1 The aviation sector and its economic footprint ........................................ 13
3.2 Mauritius ................................................................................................... 16
3.3 Maldives ................................................................................................... 17
3.4 Seychelles ................................................................................................ 18
3.5 Tax contribution ........................................................................................ 19
3.6 Investment and productivity ..................................................................... 20
4 Conclusion ..................................................................................... 21
Annex: Our methods .............................................................................. 22
Benefits to passengers and shippers ........................................................... 22
Connectivity Index ........................................................................................ 22
Benefits to tourism ........................................................................................ 22
Economic footprint ........................................................................................ 23
Exchange rates ............................................................................................ 23
Passenger and freight volumes .................................................................... 24
Mauritius ....................................................................................................... 24
Maldives ....................................................................................................... 25
Seychelles .................................................................................................... 26

Indian Ocean Islands report
4
Facts & figures
The economic benefits of aviation in the Indian Ocean Islands
Air transport to and from Mauritius, Seychelles and the Maldives (hereafter referred to collectively as the
Indian Ocean Islands) creates three distinct types of economic benefit. Typically, studies such as this
focus on the „economic footprint‟ of the industry, measured by its contribution to GDP, jobs and tax
revenues generated by the sector and its supply chain. But the economic value created by the industry is
more than that. The principal benefits are created for the customer, the passenger or shipper using the air
transport service. In addition, the connections created between cities and markets represent an important
infrastructure asset that generates benefits, in the case of the Indian Ocean Islands, primarily through
enabling the development of their tourism sectors.
1. Aviation’s economic footprint
Contribution to GDP in the Indian Ocean Islands
The aviation sector contributes $338 million (3.1%) to GDP in the Indian Ocean Islands region. This total
comprises:
$196 million directly contributed through the output of the aviation sector (airlines, airports and
ground services);
$47 million indirectly contributed through the aviation sector‟s supply chain; and
$96 million contributed through the spending by the employees of the aviation sector and its supply
chain.
Major employer
The aviation sector supports 22,000 (2.9%) jobs in the Indian Ocean Islands region. This total comprises:
12,000 jobs directly supported by the aviation sector;
3,000 jobs indirectly supported through the aviation sector‟s supply chain; and
7,000 jobs supported through the spending by the employees of the aviation sector and its supply
chain.
Tourism
Through the catalytic effects of tourism, the aviation sector facilitates further benefits to the economies of
the Indian Ocean Islands, in the region of $2.6 billion (24.1%) of GDP and 164,000 (21.7%) jobs. This total
comprises:
$1.4 billion and 88,000 jobs directly supported in the tourism sector;
$809 million and 48,000 jobs indirectly supported through the tourism sector‟s supply chain; and
$431 million and 29,000 jobs supported through the spending by the employees of the tourism sector
and its supply chain.
Including these tourism impacts, the air transport sector supports over 27% of GDP and almost a quarter
of employment in the Indian Ocean Islands region.

Indian Ocean Islands report
5
High productivity jobs
The average air transport services employee in the Indian Ocean Islands region generates $21,682 in
GVA annually, which is nearly 50% more productive than the average.
Contribution to public finances
The aviation sector pays nearly $29 million in tax. Taxes paid by aviation firms and employees contribute
around $24 million towards this figure, with passenger departure taxes in Mauritius and value added taxes
in the Seychelles contributing an additional $5 million in government revenue. It is estimated that an
additional $11 million of government revenue is raised via the aviation sector‟s supply chain and $23
million through taxation of the activities supported by the spending of employees of both the aviation sector
and its supply chain.
2. Consumer benefits for passengers and shippers
From visiting family and friends to shipping high value products, 5 million passengers and 77,000 tonnes of
freight travelled to, from and within the Indian Ocean Islands region.
Air passengers resident in the Indian Ocean Islands region comprise approximately 1.5 million of the
passenger total. For the 5 million passenger flights in total, passengers paid $2.6 billion (inclusive of tax)
for air travel, with domestic residents paying around $793 million. This expenditure is likely to significantly
understate the value passengers actually attach to the flights they use (see Section 1). Calculations by
Oxford Economics suggest the value of the benefit to travellers from flying, in excess of their expenditure,
is worth $1.6 billion a year ($489 million for Domestic residents).
Air transport is crucial for the distribution of high value to weight products. Air freight may only account for
0.5% of the tonnage of global trade with the rest of the world, but in value terms it makes up around 34.6%
of the total.
Shippers pay airlines $271 million annually to carry 77,000 tonnes of freight to and from the Indian Ocean
Islands region. The benefit to shippers, in excess of this expenditure, is estimated as $113 million. Based
on the share of exports in total merchandise trade, we estimate that domestic shippers receive less than
half of this benefit ($38 million).
This report describes these channels in more detail.
Section 1 quantifies the benefits of air travel for air passengers and air freight shippers.
Section 2 examines the way in which the aviation sector acts as an enabler of long-term economic growth
through connectivity, which helps to boost the catalytic effects of both tourism and trade.
Section 3 analyses the economic footprint of the aviation sector - the airlines and the ground-based
infrastructure - to quantify the value of its output and the jobs it supports in the Indian Ocean Islands.

Indian Ocean Islands report
6
1 Consumer benefits for passengers and shippers
The aviation sector – comprising the airlines together with the airports, air navigation and other essential
grounds services that make up the air transport infrastructure - carries over 5 million passengers1 and 77,000
tonnes of air freight to, from and within the Indian Ocean Islands region.
Among the many reasons that people and businesses use air transport, people rely on it for holidays and
visiting friends and family; while businesses use air transport for meeting clients and for the speedy and
reliable delivery of mail and goods often over great distances. For this reason, the air transport network
has been called the Real World Wide Web2.
The most important economic benefit generated by air transport is the value generated for its consumers,
passengers and shippers. Passengers spent $2.6 billion (inclusive of tax) on air travel in 2009 and
shippers spent $271 million on the transportation of air cargo3. With its speed, reliability and reach there is
no close alternative to air transport for many of its customers. This means that many are likely to value air
services higher than what might be suggested by their expenditure on these services. But this economic
value will vary from flight to flight, and from consumer to consumer, making it difficult to measure.
1.1 Consumer benefits
The value of consumer benefit varies because as you fly more often, the value you attach to each
additional flight will in general fall. As frequent flyers know, the more they fly, the less excited they get
when they step on a plane. There comes a point when the fare exceeds the value we place on taking an
additional flight, and we choose instead to spend our money on other things. For this reason the air fares
that we are willing-to-pay do not reflect the value we place on air transport so much as the value we place
on the last flight we have flown. Much the same applies to the market as a whole. Air fares reflect the
value placed on the service by the marginal passengers - those who would forgo the flight were prices to
rise - and not the value that passengers as a whole place on air transport services.
For this reason, valuing the consumer benefits for air passengers and air freight shippers cannot be
inferred simply from observed fares and shipping charges. In addition to the fares paid, we need an idea of
how the passengers and shippers value air transport other than at the margin. Unfortunately there is no
readily available data on this, and so we must rely instead on judgement, informed by economic theory, to
guide us. Economics tells us that the estimated benefits hinge on the sensitivity of demand to changes in
fares – the price elasticity of demand. Estimates of prices elasticities are available from previous research.
Economic theory also tells us that price elasticities will fall as we move away from the margin, but it offers
less guidance on how much they may fall by. This matters, because lower the price elasticity – the less
sensitive passengers are to a change in price – the higher the consumer benefit.
It follows that taxation of air travel or cargo directly reduces the economic benefit of all passengers and
shippers, as well as, at the margin, stopping a number of people travelling and stopping a number of
shippers using air cargo services.
1 This is a count of passengers on domestic flights as well as passengers arriving and departing on international flights. Each
passenger connecting to another flight at a domestic airport is counted once on their arriving flight and again on their departing flight. 2 ‟Aviation – The Real World Wide Web„, by Oxford Economics. Available at http://www.oxfordeconomics.com/samples/airbus.pdf
3 Passenger spending based on fares from IATA‟s PaxIS database plus estimates for taxes and surcharges paid. Cargo spending
based on freight rates from IATA‟s CargoIS database.

Indian Ocean Islands report
7
1.2 Estimated consumer benefits
Given its sensitivity to our assumption about how price elasticities vary, we have taken a very conservative
assumption that probably understates the true benefits (see Annex). With this in mind, we calculate that
air passengers and shippers valued the air transport services they used, from all airlines serving the Indian
Ocean Islands region, at $4.2 billion and $385 million respectively. Air passengers paid $2.6 billion for air
travel and shippers $271 million for air freight. This means that the consumer benefits derived on top of
that measured by expenditure on travel and shipments were about $1.6 million for passengers and $113
million for shippers.
The total benefits accruing to passengers using the air transport system in the Indian Ocean Islands region
will include those related to residents and non-residents as well as passengers already being accounted
for under the benefits associated with the economy at the other end of international routes. Applying
estimates for each country indicates that approximately 31% of passengers using air transport services to,
from and within the Indian Ocean Islands region were domestic residents. As for the share of freight
shipped by firms based in the Indian Ocean Islands region, data is not readily available. To give a broad
indication we have used instead the share of exports in total merchandise trade. This is estimated to be
33% of the total trade in goods in 20094. From this we estimate that, out of the consumer benefits
generated by domestic air transport and on top of that measured by expenditure, the citizens of the Indian
Ocean Islands derived $489 million in value and shippers around $38 million in value.
4 Oxford Economics Global Macroeconomic Model

Indian Ocean Islands report
8
2 Enabling long-term economic growth
2.1 Connectivity
The air transport network has been called the Real World Wide Web5. Chart 2.1 gives an idea of how
extensive the air transport network is for the Indian Ocean Islands. In 2010 there were 24, 10 and 17 routes
connecting Mauritius, Seychelles and the Maldives respectively to urban agglomerations around the world.
Chart 2.1: Connectivity, 2010 Chart 2.2: Foreign direct investment and
connectivity
Source : IATA
Source : IATA, Oxford Economics
These linkages represent the „connectivity‟ of the Indian Ocean Islands with major cities and markets
around the world. Connectivity reflects the range, frequency of service, the economic importance of
destinations and the number of onward connections available through each country‟s aviation network.
Improvements in connectivity achieved in recent decades has brought benefits to users of air transport
services by: reducing time spent in transit, increasing the frequency of service, allowing for shorter waiting
times and better targeting of departure and arrival times; and improving the quality of service, such as
reliability, punctuality and quality of the travel experience.
A number of these city-pair connections have point-to-point services, where passenger flow density is
sufficient to make the economics work. However, many of the city-pair connections that make up the
Indian Ocean Islands‟ connectivity to overseas markets can only be served by airlines aggregating flows
from a number of origins through a hub airport in order to generate a sufficiently dense flow of passengers.
Improvements in connectivity have been accompanied by a steady fall in the cost of air transport services.
The cost of air transport services, in real terms, has fallen by around 1% a year over the past 40 years,
contributing to the rapid expansion in the volume of trade seen over this period6. Air transport has also
steadily become more competitive relative to other modes of transport. For example, it is estimated that its
5 ‟Aviation – The Real World Wide Web„, by Oxford Economics. Available at http://www.oxfordeconomics.com/samples/airbus.pdf
6 See Swan (2007), „Misunderstandings about Airline Growth‟, Journal of Air Transport Management, 13, 3-8, and Baier and Bergstrand
(2001), „The growth of world trade: tariffs, transport costs and income similarity‟, Journal of International Economics, 53:1, 1-27.
0%
50%
100%
150%
200%
250%
0.0 0.5 1.0 1.5 2.0 2.5 3.0 3.5 4.0 4.5
FDI stock as % GDP
Connectivity per $billion of GDP (PPP)
Maldives
Line of best fit
Seychelles
Mauritius

Indian Ocean Islands report
9
relative cost has been falling by around 2.5% a year since the 1990s7. As its relative cost has fallen, air
shipments have become increasingly important for international trade.
Apart from the benefits to direct users of air transport services, the largest economic benefit of increased
connectivity comes through its impact on the long term performance of the wider economy. For the Indian
Ocean Islands, this has been most apparent through the development of their tourism sectors.
Improved connectivity can also enhance an economy‟s performance by making it easier for firms to invest
outside their home country, which is known as foreign direct investment (FDI). Improved connectivity may
favour inward investment as increased passenger traffic and trade that accompanies improved connectivity
can lead to a more favourable environment for foreign firms to operate in. Chart 2.2 plots the total value of
FDI built up in individual countries in relation to their GDP against an index of connectivity (produced by
IATA), that measures the availability of flights, weighted by the importance of each of the destinations
served. The chart shows that countries with higher connectivity (measured relative to their GDP), are in
general more successful at attracting foreign direct investment. This is emphasised by the upward sloping
line that confirms the statistical relationship between greater connectivity and greater FDI.
2.2 Catalytic effects – tourism
Air transport lies at the heart of global business and tourism. Through its speed, convenience and
affordability, air transport has expanded the possiblities of world travel for tourists and business travellers
alike, allowing an ever greater number of people to experience diversity of geography, climate, culture and
markets.
Tourism, predominantly for leisure purposes, makes a significant contribution to the economies of each
Indian Ocean Island, with foreign visitors spending nearly $2.3 billion in the region in 20098. Almost all of
this expenditure is contributed by passengers arriving by air, with over 97% of inbound tourists arriving by
this form of travel in each country9.
2.2.1 Mauritius
When only considering the contribution linked to the spending of foreign visitors arriving by air, Oxford
Economics estimates that in 2009 the travel and tourism industry directly employed 48,000 people and
supported indirectly through its supply chain a further 28,000 jobs. A further 17,000 people were
supported through the household spending of those people directly and indirectly employed by the travel
and tourism sector.
Through the spending of those foreign visitors who travelled by air, the travel and tourism industry directly
contributed MUR 26.3 billion to the Mauritian economy (GDP), MUR 15.7 billion indirectly through the
output it supports down its supply chain and a further MUR 8.8 billion through the induced effects of
consumer spending (a total impact representing 17.9% of Mauritian GDP).
7 See Hummels (2007), „Transportation Costs and International Trade in the Second Era of Globalisation‟, Journal of Economic
Perspectives, 21.3, Summer. 8 Based on IMF statistics
9 Includes foreign visitors arriving on both domestic and foreign carriers
Indian Ocean Islands report
10
Chart 2.3: Travel and tourism’s contribution to
GDP and Employment in Mauritius
Source : Oxford Economics
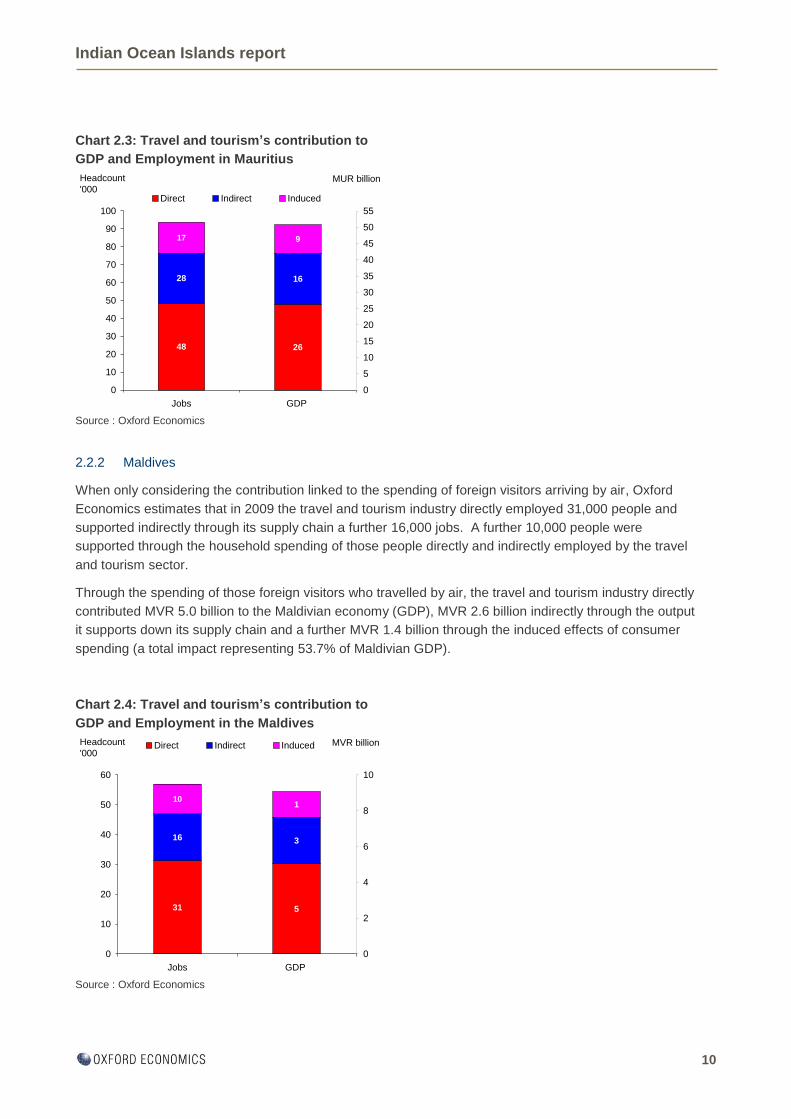
2.2.2 Maldives
When only considering the contribution linked to the spending of foreign visitors arriving by air, Oxford
Economics estimates that in 2009 the travel and tourism industry directly employed 31,000 people and
supported indirectly through its supply chain a further 16,000 jobs. A further 10,000 people were
supported through the household spending of those people directly and indirectly employed by the travel
and tourism sector.
Through the spending of those foreign visitors who travelled by air, the travel and tourism industry directly
contributed MVR 5.0 billion to the Maldivian economy (GDP), MVR 2.6 billion indirectly through the output
it supports down its supply chain and a further MVR 1.4 billion through the induced effects of consumer
spending (a total impact representing 53.7% of Maldivian GDP).
Chart 2.4: Travel and tourism’s contribution to
GDP and Employment in the Maldives
Source : Oxford Economics
31
16
10
5
3
1
0
10
20
30
40
50
60
Jobs GDP
0
2
4
6
8
10
Direct Indirect InducedHeadcount
'000MVR billion
48
28
17
26
16
9
0
10
20
30
40
50
60
70
80
90
100
Jobs GDP
0
5
10
15
20
25
30
35
40
45
50
55
Direct Indirect Induced
Headcount
'000MUR billion

Indian Ocean Islands report
11
2.2.3 Seychelles
When only considering the contribution linked to the spending of foreign visitors arriving by air, Oxford
Economics estimates that in 2009 the travel and tourism industry directly employed 8,200 people and
supported indirectly through its supply chain a further 4,500 jobs. A further 2,000 people were supported
through the household spending of those people directly and indirectly employed by the travel and tourism
sector.
Through the spending of those foreign visitors who travelled by air, the travel and tourism industry directly
contributed SCR 2.5 billion to the Seychelles economy (GDP), SCR 1.5 billion indirectly through the output
it supports down its supply chain and a further SCR 0.6 billion through the induced effects of consumer
spending (a total impact representing 42.8% of GDP in the Seychelles).
Chart 2.5: Travel and tourism’s contribution to
GDP and Employment in the Seychelles
Source : Oxford Economics
2.3 Catalytic effects – trade
Compared to other modes of transport, air freight is fast and reliable over great distances. However, these
benefits come with a cost attached. Consequently, it is mostly used to deliver goods that are light,
compact, perishable, time sensitive or that have a high unit value.
These key characteristics of air freight are most apparent in the data on the modes of transport used in
world trade. For example, data on the weight (volume) and value of goods carried by air, sea and land
transport is available for global trade. While air accounts for just 0.5% of the tonnage of global trade
(Chart 2.6), air freight makes up 35% of the value of global trade.
8.2
4.5
1.9
2.5
1.5
0.6
0
2
4
6
8
10
12
14
16
Jobs GDP
0.0
0.5
1.0
1.5
2.0
2.5
3.0
3.5
4.0
4.5
5.0
Direct Indirect Induced
Headcount
'000SCR billion

Indian Ocean Islands report
12
Chart 2.6: Proportion global trade transported
by air
Chart 2.7: Regional distribution air freight
(tonnes)
Source : The Colography Group10
, Oxford Economics Source : IATA, Oxford Economics
As with passenger services, air freight operations make up an essential part of the global transport
network. Air freight‟s global reach is clearly illustrated from Chart 2.7. Measured in terms of tonnage
carried to and from the Indian Ocean Islands, 46% is linked to trade with the Middle East and Africa, 32%
is linked with Europe and the remaining 23% is linked with the Asia Pacific region.
10 „Global Cargo Market Projections for 2006‟, The Colography Group, Inc. (2005)
Asia Pacific,
23%
Middle East
and Africa,
46%
Europe, 32%
0.5%
34.6%
0%
5%
10%
15%
20%
25%
30%
35%
40%
Volume Value

Indian Ocean Islands report
13
3 Economic footprint
Sections 1 and 2 have looked at the benefits of air transport services for its customers, and the longer-term
benefits that accrue through increasing connectivity. In this section we turn to the domestic resources that
the aviation sector currently deploys to deliver its services, together with the domestic goods and services
consumed by the workers who depend on the sector for their employment. We call the value added and
jobs supported by this economic activity the aviation sector‟s „economic footprint‟.
The resources deployed by the aviation sector are measured by its Gross Value Added (GVA). GVA is
calculated either as the output created by the sector less the cost of purchased inputs (net output
measure), or by the sum of profits and wages (before tax) generated from the sector‟s economic activity
(income measure). The two approaches are equivalent. Using either approach, by adding the GVA of all
firms in the economy, one derives an estimate for the economy‟s overall output (GDP)11
. We refer to this
as the sector‟s direct contribution to GDP.
From this direct contribution, the sector‟s economic footprint is calculated by adding to it the output (and
jobs) supported through two other channels, which we refer to as the indirect and the induced
contributions. The indirect contribution measures the resources deployed by the aviation sector through
using domestically produced goods and services produced by other firms – i.e. the resources used through
its supply chain. The GVA generated through the indirect and direct channels supports jobs both in the
aviation sector and in its supply chain. The workers whose employment depends on this activity in turn
spend their wages on goods and services. The induced contribution is the value of the domestic goods
and services purchased by this workforce. Taken together, these three channels give the aviation sector‟s
economic footprint in terms of GVA and jobs.
The aviation sector contributes to the economy in two other ways. Through the taxes levied on GVA
(recall that it is equal to the sum of profits and wages), the aviation sector supports the public finances, and
the public services that depend on them. Second, through its investment and its use of advanced
technology, the aviation sector generates more GVA per employee than the economy as a whole, raising
the overall productivity of the economy. These issues are discussed at the end of this section.
3.1 The aviation sector and its economic footprint
The sector is comprised of two distinct types of activity:
- Airlines transporting people and freight.
- Ground-based infrastructure that includes the airport facilities, the services provided for
passengers on-site at airports, such as baggage handling, ticketing and retail and catering
services, together with essential services provided off-site, such as air navigation and air
regulation.
The aviation sector supports GDP and the employment in The Indian Ocean Islands through four distinct
channels. These channels are:
- Direct – the output and employment of the firms in the aviation sector.
11 It is only true to an approximation that GVA is equal to the sum of profit and wages, or that the sum of GVA across firms equals
GDP. The difference in each case, however, is small enough for us to proceed as if the equalities do in fact hold. The differences are explained in the Annex to this report.

Indian Ocean Islands report
14
- Indirect – the output and employment supported through the aviation sector‟s The Indian Ocean
Islands based supply chain.
- Induced – employment and output supported by the spending of those directly or indirectly
employed in the aviation sector.
- Catalytic – spillover benefits associated with the aviation sector. Some of these include the
activity supported by the spending of foreign visitors travelling to The Indian Ocean Islands via air,
and the level of trade directly enabled by the transportation of merchandise.
Table 3.1: Aviation’s contribution of output and jobs to the Indian Ocean Islands
Source : IATA, Oxford Economics
The table above reports the economic
contribution of the airlines and airports for each
of the four channels. Contributions are
reported both in terms of GDP and
employment. In the following pages we look in
turn at the aviation sector in each individual
country, and describe their economic
contribution in more detail.
The way that we build up the aviation sector‟s
economic footprint is also illustrated in Figure
3.1. The top panel shows the two activities that
comprise the aviation sector: air transport
services and the airports and ground-based
infrastructure. The panel below represents their
supply chains with boxes that list the most
important inputs purchased by each activity.
The third panel from the top describes the
induced contribution that comes through the
spending by workers of both the aviation sector
and its supply chain – represented by the arrows that link this panel with the panels above. The bottom
panel, entitled „economic footprint‟, reports the total GVA, jobs and tax contribution. These totals are the
sum of the numbers reported in the panels above.
Chart 3.1: The Indian Ocean Islands Jobs and
Output supported by the aviation sector
Source : IATA, Oxford Economics
Direct Indirect Induced Total % of whole
economy
Contribution to GDP (USD million)
Airlines 51 8 25 83 0.8%
Airports and Ground Services 145 39 71 255 2.3%
Total 196 47 96 338 3.1%
Catalytic (tourism) 1,407 809 431 2,647 24.1%
Total including catalytic 1,602 856 527 2,985 27.2%
Contribution to employment (000s)
Airlines 4 1 2 6 0.8%
Airports and Ground Services 8 3 5 16 2.1%
Total 12 3 7 22 2.9%
Catalytic (tourism) 88 48 29 164 21.7%
Total including catalytic 100 51 36 187 24.6%
12
7
164
3196
9647
2,647
0
20
40
60
80
100
120
140
160
180
200
Jobs
0
500
1000
1500
2000
2500
3000
Direct Indirect Induced CatalyticHeadcount
'000$ million
GDP

Indian Ocean Islands report
15
Figure 3.1: The aviation sector in the Indian Ocean Islands12
12 For a definition of GVA please refer to the Annex. Totals may not sum due to rounding.
The Aviation SectorIn this study is defined as -
Locally-based AirlinesDomestic & International passenger &
freight services
Ground-based Infrastructure- All on-site activities at Airports- ANSP- Regulators
Direct Contribution of the aviation sector = GVA, employment and tax generated by the aviation sector. = GVA= $0.20 Billion Employment= 12,000 Jobs Tax= $0.03 Billion
The Aviation Sector’s Supply ChainPurchases by the aviation sector of domestically produced goods & services from firms outside the aviation sector.
Locally-based Airlines- Aviation Fuel- Catering- Repair + Maintenance- Ticketing + Distribution (e.g. Travel Agents, CRS etc.)- Freight Forwarding
- Aircraft Financing
- Other Finance + Business Services
Ground-based Infrastructure- Finance- Construction + Facilities management - Electricity + Water supply
Non-airside supply chain- Food + Drink- Business + Marketing Services- Computing
Indirect Contribution of the aviation sector = GVA, employment and tax generated by the aviation sector’s supply chain. = GVA= $0.05 Billion Employment= 3,000 Jobs Tax= $0.01 Billion
Induced SpendingSpending by employees of the aviation sector & its supply chain on domestically produced goods & services.
Induced Contribution of the aviation sector = GVA, employment and tax generated by the spending of employees of the aviation sector & its supply chain. = GVA= $0.10 Billion Employment= 7,000 Jobs Tax= $0.02 Billion
Economic FootprintEconomic footprint = Sum of Direct, Indirect and Induced Contributions. = GVA = $0.34 Billion Employment = 22,000 jobs Tax = $0.06 Billion

Indian Ocean Islands report
16
3.2 Mauritius
Airlines registered in Mauritius carry 1.1 million passengers and 27,000 tonnes of freight a year to and
from Mauritius. More than 10,000 scheduled international flights depart the Mauritius annually, destined
for 28 airports in 16 countries. Domestically, more than 2,600 flights make over 180,000 seats available
to passengers annually, destined to 2 airports.
Among the many reasons that people and businesses use air transport, people rely on it for holidays and
visiting friends and family; while businesses use air transport for meeting clients and for the speedy and
reliable delivery of mail and goods often over great distances. The air transport network, the “Real World
Wide Web”, offers practical, fast and reliable transport across the globe. The regions which travellers fly
to and from underline its global reach (see Chart 3.2).
Airlines need ground-based infrastructure to operate. This infrastructure includes the facilities at Sir
Seewoosagur Ramgoolam (SSR) Airport, Mauritius‟ only international airport, that directly serve
passengers, such as baggage handling, ticketing, retail and catering outlets. Less visible are the essential
services which are sometimes provided off-site, such as air navigation and air regulation.
SSR International Airport handles approximately 2.4 million passengers and 37,000 tonnes of freight
annually.
Chart 3.2: Regional distribution of scheduled
passenger trips originating in Mauritius
Chart 3.3: Jobs and output supported by the
aviation sector in Mauritius
Source : IATA Source : IATA, Oxford Economics
The Aviation sector in Mauritius (comprising the airlines as well as the airport and ground-based
infrastructure) directly employs 8,000 people, and support through their supply chains a further 2,000 jobs.
Examples of these supply-chain jobs include those in the distribution sector delivering aviation fuel; jobs in
the catering sector and construction workers building or maintaining facilities at airports. A further 4,000
jobs are supported through the household spending of those employed by the sector and its supply chain.
The Aviation sector directly contributes around MUR 3.5 billion to the Mauritian economy (GDP). The
sector contributes indirectly another MUR 0.8 billion through the output it supports down its supply chain. A
further MUR 1.7 billion comes from the spending of the employees or those firms in the sector and its
supply chains.
Overall, the Aviation sector contributes MUR 6.0 billion to the economy (2.1% of GDP) and supports
around 13,000 jobs in Mauritius.
Europe, 47%
Asia and Pacific
Region, 17%
North America,
0.4%
Africa and
Middle East,
32%
Domestic, 4%
Central and
South America,
0.4% 7.8
3.5
1.7
3.5
1.7
0.8
0
2
4
6
8
10
12
14
Jobs
0
1
2
3
4
5
6
7
Direct Indirect InducedHeadcount
'000MUR billion
GDP

Indian Ocean Islands report
17
3.3 Maldives
Airlines registered in the Maldives carry 900,000 passengers and 500 tonnes of freight a year to and from
Maldives. More than 8,600 scheduled international flights depart Maldives annually, destined for 19
airports in 13 countries. Domestically, 12,000 flights make more than 450,000 seats available to
passengers annually destined to 5 airports.
Among the many reasons that people and businesses use air transport, people rely on it for holidays and
visiting friends and family; while businesses use air transport for meeting clients and for the speedy and
reliable delivery of mail and goods often over great distances. The air transport network, the “Real World
Wide Web”, offers practical, fast and reliable transport across the globe. The regions which travellers fly
to and from underline its global reach (see Chart 3.2).
Airlines need ground-based infrastructure to operate. This infrastructure includes the facilities at Malé
Airport, also called Ibrahim Nasir International Airport (MLE) and a second airport in the south called Gan
International Airport (GAN). Both of these airports directly serve passengers, such as baggage handling,
ticketing, retail and catering outlets. Less visible are the essential services which are sometimes provided
off-site, such as air navigation and air regulation.
In total approximately 2.6 million passengers and 32,000 tonnes of freight is handled annually at Male
International Airport.
Chart 3.4: Regional distribution of scheduled
passenger trips originating in the Maldives
Chart 3.5: Maldivian jobs and output supported
by the aviation sector13
Source : IATA Source : IATA, Oxford Economics
The Aviation sector in the Maldives (comprising the airlines as well as the airport and ground-based
infrastructure) directly employs 2,100 people, and support through their supply chains a further 1,500 jobs.
Examples of these supply-chain jobs include those in the distribution sector delivering aviation fuel; jobs in
the catering sector and construction workers building or maintaining facilities at airports. A further 2,800
jobs are supported through the household spending of those employed by the sector and its supply chain.
The Aviation sector directly contributes around MVR 737 million to the Maldivian economy (GDP). The
sector contributes indirectly another MVR 189 million through the output it supports down its supply chain.
13 Totals may not sum due to rounding
Europe, 38%
Asia and Pacific
Region, 46%
North America,
0.1%
Africa and
Middle East, 1%
Domestic, 15%
Central and
South America,
0.3%
2.1
2.8
1.5
0.7
0.4
0.2
0
1
2
3
4
5
6
7
Jobs
0
0.2
0.4
0.6
0.8
1
1.2
1.4
Direct Indirect InducedHeadcount
'000MVR billion
GDP

Indian Ocean Islands report
18
A further MVR 360 million comes from the spending of the employees or those firms in the sector and its
supply chains.
Overall, the Aviation sector contributes MVR 1.3 billion to the economy (7.6% of GDP) and supports
around 6,300 jobs in the Maldives.
3.4 Seychelles
Airlines registered in Seychelles carry 242,000 passengers and 6,000 tonnes of freight a year to and from
Seychelles. More than 1,600 scheduled international flights depart the Seychelles annually, destined for
12 airports in 10 countries. Domestically, more than 9,800 flights make over 250,000 seats available to
passengers annually, destined to 2 airports.
Among the many reasons that people and businesses use air transport, people rely on it for holidays and
visiting friends and family; while businesses use air transport for meeting clients and for the speedy and
reliable delivery of mail and goods often over great distances. The air transport network, the “Real World
Wide Web”, offers practical, fast and reliable transport across the globe. The regions which travellers fly
to and from underline its global reach (see Chart 3.2).
Airlines need ground-based infrastructure to operate. This infrastructure includes the facilities at Victoria
Airport, Seychelles‟ only international airport, that directly serve passengers, such as baggage handling,
ticketing, retail and catering outlets. Less visible are the essential services which are sometimes provided
off-site, such as air navigation and air regulation.
In total approximately 524 thousand passengers and 8,000 tonnes of freight is handled annually at
Victoria International Airport.
Chart 3.6: Regional distribution of scheduled
passenger trips originating in the Seychelles
Chart 3.7: Jobs and output supported by the
aviation sector in the Seychelles14
Source : IATA Source : IATA, Oxford Economics
The Aviation sector in Seychelles (comprising the airlines as well as the airport and ground-based
infrastructure) directly employs 1,200 people, and support through their supply chains a further 200 jobs.
Examples of these supply-chain jobs include those in the distribution sector delivering aviation fuel; jobs in
14 Totals may not sum due to rounding.
Europe, 40%
Asia and Pacific
Region, 12%
North America,
0.5%
Africa and
Middle East,
19%
Domestic, 29%
Central and
South America,
0.2%
1.2
0.4
0.2
0.22
0.11
0.06
0.0
0.2
0.4
0.6
0.8
1.0
1.2
1.4
1.6
1.8
2.0
Jobs
0
0.1
0.2
0.3
0.4
Direct Indirect InducedHeadcount
'000SCR billion
GDP

Indian Ocean Islands report
19
the catering sector and construction workers building or maintaining facilities at airports. A further 400 jobs
are supported through the household spending of those employed by the sector and its supply chain.
The Aviation sector directly contributes around SCR 225 million to the Seychelles economy (GDP). The
sector contributes indirectly another SCR 55 million through the output it supports down its supply chain. A
further SCR 110 million comes from the spending of the employees or those firms in the sector and its
supply chains. Overall, the Aviation sector contributes SCR 390 million to the economy (3.6% of GDP)
and supports around 1,900 jobs in the Seychelles.
3.5 Tax contribution
Aviation makes a substantial contribution to the public finances. In this section we estimate the
corporation tax paid by aviation companies, the income tax paid by their employees, social security
payments (both employer and employee contributions), and the revenue collected through aviation taxes.
These estimates reflect the direct tax payments of the aviation sector. We also provide an indication of the
taxes paid by the aviation sector‟s supply chain and taxes raised through induced spending channels.
They do not include increases in the overall tax base of the Indian Ocean Islands economies driven by
aviation‟s contribution to investment and productivity growth in the wider economy.
Table 3.2: Aviation makes a substantial contribution to tax in the Indian Ocean Islands region15
Source: Oxford Economics, IATA
The aviation sector contributed $24 million in taxes through corporation tax and the income and social
security contributions (both employee and employer contributions). This contribution is likely to increase
further, as the sector recovers following a number of difficult years where many firms suffered losses. Air
passengers paid a further $5 million in passenger departure taxes in Mauritius and value added taxes in
the Seychelles, bringing the total tax contribution to nearly $29 million. Very indicatively, it is estimated
that a further $34 million of government revenue is raised via taxation through the indirect ($11 million) and
induced ($23 million) channels.
As discussed in section 2.2, tourism forms an integral part of the economies of the Indian Ocean Islands.
In addition to its contribution to GDP and employment, the sector is a vital source of public finances.
Based on an economy wide average tax level, it is estimated that the tourism sector contributes $330
15 Indirect and Induced Tax contribution is approximated by applying an economy wide average tax figure (as a proportion of GDP) to
the Indirect and Induced GVA estimates, using data from the Oxford Economics Global Macroeconomic Model.
USD million USD million
Taxes on Aviation Sector's GVA 24
Comprised of:
Corporation Tax 9
Income Tax & Social Security payments 15
Passenger departure and value added tax 5
Aviation sector's direct tax contribution 29
Tax generated through the aviation sector's indirect & induced impact 34
Total tax attributable to the aviation sector's economic footprint 63

Indian Ocean Islands report
20
million in taxation through direct channels, $190 million through its indirect channels and a further $100
million through the induced expenditure of those employed directly and indirectly by the sector.
3.6 Investment and productivity
Apart from these transformative effects on the wider economy, air transport services – the airlines, airports
and ancillary services, such as air traffic control – form a capital intensive sector that invests heavily in
aircraft systems and other advanced technology.
Table 3.3: Investment by the aviation sector Table 3.4: Labour productivity in the aviation
sector
Source: IATA, Oxford Economics
Source: IATA, Oxford Economics
Table 3.3 reports the investment intensity of the aviation sector, as measured by its investment as a
proportion of GVA. Investment in air transport services in the Indian Ocean Islands is equal to 20.2%.
Table 3.4 provides an indication of the productivity of the aviation sector versus the rest of the economy.
Measured as GVA per employee in USD, the combined productivity of air transport services in Indian
Ocean Islands (the airlines and the ground-based infrastructure excluding retail and catering services at
airports and tourism) is estimated to be $21,682. This is nearly 50% higher than that for the average
productivity for the region as a whole ($14,473). This high level of productivity implies that were the
resources currently employed in the aviation sector redeployed elsewhere in the economy, then this would
be accompanied by a fall in overall output and income. For example, if productivity in the aviation sector
was the same as the average productivity for the economy as a whole, then the level of GDP in the Indian
Ocean Islands would be around 0.2% lower than it is (about USD 19 million in current prices).
Productivity (GVA per
employee)
Air transport services $21,682
Indian Ocean Economy $14,473
Investment as % value of
output
Air transport services 20.2
Indian Ocean Economy 29.1

Indian Ocean Islands report
21
4 Conclusion
This study has described and quantified a number of channels through which aviation in the Indian Ocean
Islands region generates important economic benefits for its customers and the wider economy.
Studies of this kind usually focus on the „economic footprint‟ of the industry, the GDP and jobs supported
by the industry and its supply chain. We provide the latest estimates for these metrics. But the economic
value created by the industry is more than that. It is not just jobs that are threatened if government policies
are badly designed. The welfare of voting citizens and the effectiveness of infrastructure critical to the
country‟s long-term success are also at risk.
The welfare of travelling citizens has been conservatively quantified in this study. Not all customers of
airlines serving the Indian Ocean Islands airports are residents, but an estimated 31% are. They currently
get an economic benefit estimated to be worth $489 million. Indicatively, 33% of the shippers using air
freight services are domestic companies. Taxing air transport directly reduces the welfare of these
residents and businesses.
The study has also shown what a critical asset the air transport network is in the Indian Ocean Islands, to
business and the wider economy. Connectivity between cities and markets boosts productivity and
provides a key infrastructure on which modern globalized businesses depend. Many of these city-pair
connections are dependent on hub airports through which to generate the traffic density necessary to
sustain them. All airlines supplying services at The Indian Ocean Islands airports contribute to generating
these wider economic benefits, primarily through boosting the tourism sector. These „supply-side‟ benefits
are hard to measure but are easily illustrated by the experience of the volcanic ash cloud, which closed
much of European airspace for a week in early 2010. Travellers were stranded. Globalized supply chains
and just-in-time manufacturing processes came to a halt.
More readily measured is the „economic footprint‟ supported, mostly, by the activities of national airlines.
Domestic-based airlines were responsible for carrying approximately 45% of both passengers and freight.
The wages, profits and tax revenues created by these airlines flows through the domestic economy,
generating multiplier effects on national income or GDP. The economic benefits for the Indian Ocean
Islands region created by non-domestic airlines are to be found in customer welfare and in the part these
airlines play in providing the connectivity infrastructure between the Indian Ocean Islands and overseas
cities and markets.
Aviation has a significant footprint in the economies of the India Ocean Islands region, supporting 3.1% of
GDP and 22,000 jobs or 2.9% of the regional workforce. Including the sector‟s contribution to the tourism
industry, these figures rise to 27.2% of GDP and 187,000 jobs or 24.6% of the workforce.
Also significant is the fact that these are high productivity jobs. The annual value added (or GVA) by each
employee in air transport services in the Indian Ocean Islands region is $21,682, nearly 50% higher than
the average of $14,473.
Tax revenues from aviation are substantial. Domestic-based aviation companies paid $24 million annually
in direct taxes and social security payments, while passengers paid $5 million in air passenger departure
and value added taxes. It is estimated that an additional $11 million of government revenue is raised via
the aviation sector‟s supply chain and $23 million through taxation of the activities supported by the
spending of employees of both the aviation sector and its supply chain.
All together these points demonstrate that aviation provides significant economic benefits to the economies
of the Indian Ocean Islands and its citizens, some of which are unique and essential to the operation of
modern economies.

Indian Ocean Islands report
22
Annex: Our methods
Benefits to passengers and shippers
In Section 1, we report estimates for the monetary benefits that air transport customers receive through the
services provided by the aviation sector. These estimates are based on the economic concept of consumer
surplus, the difference between the passengers‟ or shippers‟ willingness-to-pay and the actual airfare or
freight rate they face. In order to calculate the overall consumer surplus for the various fare types and for
freight, we need three pieces of information: (1) data on passenger numbers, freight tonnage and their
respective average fares and freight charge; (2) an estimate of how sensitive passenger numbers and
freight tonnage are to changes in fares and freight, known as the elasticity of demand; and (3) an
assumption about customers‟ willingness to pay (airfare and freight charges), reflected through an
assumption about the shape of the market demand curve.
The calculations are based on 2009 data on total passenger numbers and freight tonnage arriving and
departing from domestic airports, together with the average fare and freight charge, broken down by the
following market segments: first class, business class, economy, economy discount, and freight. The data
are provided by IATA.
We apply an estimate for the elasticity of demand for each market segment. These indicate the percentage
change in demand that would follow a one percent change in the average fare, or freight charge. We draw
on the findings of several recent studies that investigate elasticities of demand for air transport, to choose
elasticities for each market segment that we believe are reasonable16
. The passenger elasticities vary
across islands depending on the regional distribution of air passengers for each island: they average -0.51
for first class and business, and -0.6 for economy. The freight elasticity is -1.2.
Based on these inputs, we calculate consumer surplus based on the approach proposed by Brons, Pels,
Nijkamp, and Rietveld (2002) that assumes that the demand curve for each market segment has a constant
elasticity of demand17
.
Connectivity Index
The connectivity index is a measure of the quality of a country‟s air transport network that reflects both the
volume of passenger traffic and the importance of the destinations served. For every destination country for
which there are direct services, an estimate of total passenger seat capacity is derived from data on the
frequencies of service and the available seats per flight. From this underlying data, an index is constructed
by attaching a weight to each destination. This weight reflects the relative importance of the destination in
the global air transport network, measured by the number of seats available for passengers from that airport
relative to Atlanta, the largest airport. The connectivity index will therefore have a higher value, the more
destinations are served, the higher the frequency of services, the larger the number of available seats per
flight and the greater the relative importance of the destinations served.
Benefits to tourism
In quantifying the benefits from Travel & Tourism (T&T) we were seeking to capture the spending by tourists
and businesses on accommodation, food etc outside of their airfare (which forms part of our estimate of the
16 „Estimating Air Travel Demand Elasticities‟, by InterVISTAS Consulting Inc (2007). Available at http://www.iata.org/whatwedo/Documents/economics/Intervistas_Elasticity_Study_2007.pdf
17 See http://www.ecad-aviation.de/fileadmin/documents/Konferenzbeitraege/Braun_Klophaus_Lueg-Arndt_2010_WCTR.pdf

Indian Ocean Islands report
23
direct calculation). In doing this we relied heavily on the Oxford Economics Travel & Tourism model
prepared on behalf of the World Travel & Tourism Council (WTTC) which simulates Tourism Satellite
Account (TSA) data across over 180 countries. From the model we obtained an estimate of the level of
value-added created by foreign visitors, and assigned a share of this to the aviation industry based on the
share of foreign visitor arrivals travelling by air. We then used coefficients within the model to divide this
between T&T providers (direct) and their supply chain (indirect). Finally, we attributed a share of the total
induced effect to the aviation industry by dividing our estimates of aviation-related direct and indirect GDP
by total T&T direct and indirect GDP. It should be noted that this is a gross measure of the benefit from
tourism and therefore does not account for the spending which is effectively “lost” when domestic residents
travel abroad by air.
Economic footprint
In Section 3 we report the contribution that the aviation sector makes to the economy. The contribution is
measured in terms of the value of the sector‟s output and the number of people it employs. For each
measure, the contribution is built up from three components: direct, indirect, and induced.
The direct output component is measured by Gross Value Added (GVA). GVA is measured either as the
firm or industry sales revenue less purchases from other companies, or equivalently, as the sum of
employee compensation and gross operating surplus, measured before the deduction of depreciation,
interest charges and taxation. In this report we treat gross operating surplus as equivalent to gross
operating profit, however, the two concepts differ slightly with the former including income from land and a
technical adjustment for the change in stock valuation. GVA differs from Gross Domestic Product (GDP) in
the price used to value goods and services. GVA is measured at producer prices that reflect the price at the
„factory gate‟ together with cost of distribution. GDP is measured at market prices that reflect the price paid
by the consumer. The two prices differ by the taxes less subsidies levied on the goods or services.
The indirect output component is measured using an Input-Output table that reports how industries use the
output of other industries in the process of production, and how their final output is used, e.g. in final
domestic consumption, changes in stocks or exports. For many countries, Input-Output tables are available
as part of the national accounts. As Input-Output tables describe how an industry uses the output of other
industries as inputs in the production of its goods or service, they describe its full supply chain – its direct
suppliers, those industries that supply its direct suppliers, and so on. This is reported as the indirect output
component.
The Input-Output table reports how much of final output is sold in the domestic economy. Using similar
methods as that used to derive the indirect output component, the Input-Output table can be used to
estimate how much spending on completed goods (known as final domestic consumption) is supported
through the employees of the industry and its full supply chain. This is reported as the induced output
component. Based on analysis at Oxford Economics, the ratio of induced output to the sum of direct and
indirect output is capped at 30%.
The three output components – direct, indirect, and induced – are converted to their respective employment
components, using an estimate for the average labour productivity (GVA per employee) for the economy.
Exchange rates
For the purposes of presenting consolidated figures in USD, the following 2009 annual average exchange
rates have been applied where appropriate:
MUR-USD: 31.96 MVR-USD: 12.80 SCR-USD: 13.61

Indian Ocean Islands report
24
Passenger and freight volumes
Passenger and freight traffic is accounted for in different ways across the industry supply chain, depending
on the focus of the operator and the purpose of analysis. For example, airlines generally count the number
of passengers who board their aircraft, whereas airports often count the number of passengers arriving or
departing their airport – which in some cases can lead to totals significantly larger than those reported by
airlines, despite referring to the same inherent volume of passengers. The table below outlines the main
passenger and freight volumes referred to in this report. In particular, it shows how the numbers used in the
calculation of consumer benefit and the economic footprint were derived.
Mauritius
Passenger numbers 2009 Millions Millions
Number of passengers arriving or departing Mauritian
airports (A)2.4
Less domestic arrivals at Mauritian airports (due double
counting)-0.1
1.1 Carried by Mauritian airlines (C)
0.44 Mauritian residents (D)
Freight tonnes 2009 Thousands Thousands
27 Carried by Mauritian airlines (F)
10 Carried by non-Mauritian airlines
Number of passengers on aircraft flying to, from or within
Mauritius (B)2.3
Tonnes of freight carried on aircraft flying to, from or within
Mauritius (E)37
Millions Use in report Source
ANumber of passengers arriving
or departing Mauritian airports2.4
Overall indicator of passenger arrivals and departures
handled by airports in Mauritius.Airports of Mauritius Co Ltd
B
Number of passengers on
aircraft flying to, from or within
Mauritius
2.3Overall indicator of airline passenger traffic associated with
the Mauritian market.Airports of Mauritius Co Ltd
CPassengers carried by Mauritian
registered airlines1.1
Overall indicator of passenger output „performed‟ by airlines
in the scope of the economic footprint analysis in Section 3
of this report
Air Mauritius
D
Number of Mauritian residents on
flights flying to, from or within
Mauritius
0.44Basis for calculation of passenger consumer surplus
accruing to Mauritian economy.Estimate based on 19% of 2.3 million passengers (B)
Thousands Use in report Source
E
Tonnes of freight carried on
aircraft flying to, from or within
Mauritius
37Overall indicator of freight loaded and unloaded at airports
in Mauritius.The Mauritius Chamber of Commerce and Industry
FTonnes of freight uplifted by
Mauritian registered airlines27
Overall indicator of freight output „performed‟ by airlines in
the scope of the economic footprint analysis in Section 3 of
this report
Air Mauritius
Freight measure
Passenger measure

Indian Ocean Islands report
25
Maldives
Thousands Use in report Source
ANumber of passengers arriving or
departing Maldivian airports2.59
Overall indicator of passenger arrivals and departures
handled by airports in Maldives.
Derived from 2 million passenger figure (B), but doubles
the count of domestic passengers to account for both
their arrival and departure at a Maldivian airport.
BNumber of passengers on aircraft
flying to, from or within Maldives2.17
Overall indicator of airline passenger traffic associated
with the Maldivian market.Maldivian Government Statistics
CPassengers carried by Maldivian
registered airlines0.92
Overall indicator of passenger output „performed‟ by
airlines in the scope of the economic footprint analysis
in Section 3 of this report
Maldivian Government Statistics
D
Number of Maldivian residents on
flights flying to, from or within
Maldives
1.00Basis for calculation of passenger consumer surplus
accruing to Maldivian economy.Estimate based on 50% of 2 million passengers (B)
Thousands Use in report Source
E
Tonnes of freight carried on
aircraft flying to, from or within
Maldives
32.0Overall indicator of freight loaded, unloaded and transit at
airports in Maldives.Maldivian Government Statistics
FTonnes of freight uplifted by
Maldivian registered airlines0.5
Overall indicator of freight output „performed‟ by airlines in
the scope of the economic footprint analysis in Section
3 of this report
Maldivian Government Statistics
Passenger measure
Freight measure
Passenger numbers 2009 Millions Millions
Number of passengers arriving or departing
Maldivian airports (A)2.6
Less domestic arrivals at Maldivian airports
(due double counting)-0.4
0.9 Carried by Maldivian airlines (C)
1.0 Maldivian residents (D)
Freight tonnes 2009 Thousands Thousands
0.5 Carried by Maldivian airlines (F)
31.5 Carried by non-Maldivian airlines
Number of passengers on aircraft flying to,
from or within Maldives (B)2.2
Tonnes of freight carried on aircraft flying to,
from or within Maldives (E)32.0

Indian Ocean Islands report
26
Seychelles
Thousands Use in report Source
ANumber of passengers arriving
or departing Seychelles airports609
Overall indicator of passenger arrivals and departures handled
by airports in Seychelles.Seychelles Civil Aviation Authority
B
Number of passengers on
aircraft flying to, from or within
Seychelles
524Overall indicator of airline passenger traffic associated with the
Seychelles market.Seychelles Civil Aviation Authority
CPassengers carried by
Seychelles registered airlines242
Overall indicator of passenger output „performed‟ by airlines in
the scope of the economic footprint analysis in Section 3 of
this report
Seychelles Civil Aviation Authority
D
Number of Seychelles residents
on flights flying to, from or within
Seychelles
97Basis for calculation of passenger consumer surplus accruing
to Seychelles economy.Seychelles Civil Aviation Authority
Thousands Use in report Source
E
Tonnes of freight carried on
aircraft flying to, from or within
Seychelles
8Overall indicator of freight loaded and unloaded at airports in
Seychelles.Seychelles Civil Aviation Authority
FTonnes of freight uplifted by
Seychelles registered airlines6
Overall indicator of freight output „performed‟ by airlines in the
scope of the economic footprint analysis in Section 3 of this
report
Seychelles Civil Aviation Authority
Freight measure
Passenger measure
Passenger numbers 2009 Thousands Thousands
Number of passengers arriving or departing
Seychelles airports (A)609
Less domestic arrivals at Seychelles airports
(due double counting)-85
242 Carried by Seychelles airlines (C)
97 Seychelles residents (D)
Freight tonnes 2009 Thousands Thousands
6 Carried by Seychelles airlines (F)
2 Carried by non-Seychelles airlines
Number of passengers on aircraft flying to,
from or within Seychelles (B)524
Tonnes of freight carried on aircraft flying to,
from or within Seychelles (E)8


OXFORD
Abbey House, 121 St Aldates
Oxford, OX1 1HB, UK
Tel: +44 1865 268900
LONDON
Broadwall House, 21 Broadwall
London, SE1 9PL, UK
Tel: +44 207 803 1400
BELFAST
Lagan House, Sackville Street
Lisburn, BT27 4AB, UK
Tel: +44 28 9266 0669
NEW YORK
817 Broadway, 10th Floor
New York, NY 10003, USA
Tel: +1 646 786 1863
PHILADELPHIA
303 Lancaster Avenue, Suite 1b
Wayne PA 19087, USA
Tel: +1 610 995 9600
SINGAPORE
No.1 North Bridge Road
High Street Centre #22-07
Singapore 179094
Tel: +65 6338 1235
PARIS
9 rue Huysmans
75006 Paris, France
Tel: + 33 6 79 900 846
email: [email protected]
www.oxfordeconomics.com