economic computation and economic cybernetics … - andrei tudorel (t).pdf · economic computation...
TRANSCRIPT

Economic Computation and Economic Cybernetics Studies and Research, Issue 4/2017, Vol. 51
________________________________________________________________
19
Professor Tudorel ANDREI, PhD
E-mail: [email protected]
The Bucharest University of Economic Studies
Professor Bogdan OANCEA, PhD
E-mail: [email protected]
Assistant professor Andreea MIRICA, PhD
E-mail: [email protected]
ACTION AGAINST INCOME DISCRIMINATION. CASE STUDY:
ROMA MINORITY IN ROMANIA
Abstract. The Roma identity significantly influences their welfare levels in
Southeast Europe. This paper analyses income differences among the most three important ethnic groups in Romania, with a particular focus on the Roma minority
in order to propose best policies in addressing income discrimination. In order to
achieve its aim, the research considers several social and economic characteristics of a person gathered from two data sets: Population and Housing Census 2011 and
the tax record data from 2013. Five different methods were used in order to assess
wage discrimination. The variables included in our model explain 75% of the
differences in the average income between the Roma and Romanians and Roma and Magyars, respectively. The effect of educational attainment on the wages of
Roma is much lower than in the case of other minorities. Out of all three ethnic
groups, Roma register the highest birth rate, lowest educational level and incomes. Keywords: income, discrimination, Roma, minority, decomposition.
JEL Classification: J15, O15, D31
1. Introduction
“White workers $24: Colored Workers $20” said a job advertisement in 1927; these kind of ads were not uncommon (Ashenfelter, 1969). People may be
treated unfairly in many situations but that may not be always against the law,
whether the law is not comprehensive enough or the case is not an actual
discrimination. For example, Kelley and Evans (2015) theory suggests that pay differences between outgroup and dominant group may come about because
prejudiced members of the dominant group are paid too much, not because
outgroup members are paid too little.

Tudorel Andrei, Bogdan Oancea, Andreea Mirica _________________________________________________________________
20
Roma people are one of the largest ethnic group in the European Union
and among the most deprived, facing discrimination, social exclusion, unequal
access to employment and education. It has been demonstrated that wage level is positively associated with integration and assimilation of ethnic groups (Drydakis,
2012). To achieve significant progress towards Roma integration, it is crucial to
ensure that national, regional and local integration policies focus on Roma in a clear and specific way, and address the needs of Roma with explicit measures to
prevent and compensate for disadvantages they face (European Commission 2011).
The aim of this paper is to assess discrimination from the perspective of income against Roma, as one of the most important minority group in Romania.
This kind of discrimination is assessed through a statistical decomposition analysis,
first introduced by Oaxaca (1973) and Blinder (1973). It has been broadly applied
since then, in assessing income discrimination based on personal characteristics such as race, ethnicity, gender, age, education or work experience (see for example
Pereira and Galego 2011). The technique has recently been used to assess wage
discrimination of Roma but only using surveys at regional level (O’Higgins 2015). However, analyzing factors affecting wage differentials with a particular focus on
Roma, is mandatory to be done within the specific context of a country, as people
generally named Roma are very heterogeneous, as there are the places they are living in, a regional study on Roma being therefore limited (O’Higgins, 2015).
Also, using data from the Population and Housing Census provides more accurate
information about the Roma compared to surveys as it is difficult to identify Roma
based upon distinctive characteristics such as appearance, language or family name (Revenga et.al. 2002), thus designing appropriate surveys being very difficult.
The paper is organized as follows: the first section describes the data and
variables included in the analysis, the third section presents the results of the regression model assessing which factors affect wage differentials; next, the results
of several income decomposition models are provided; last, best policies in
addressing wage discrimination are stated along with main conclusions.
2. Data
Within the context, briefly described above, a strong analysis of the
differences among average monthly income levels between ethnic groups in Romania with regard to educational attainment, work experience and gender is
needed. This paper analyses these differences with a particular focus on the Roma
minority. Also, several other variables were included: marital status, number of employment contracts for which a person gained income, a binary variable stating
if the person uses the internet or not, number of children, number of persons within
the household, area of residency and a binary variable stating if the person works in
non-financial companies or not. All these variables form a puzzle in analyzing differences among average monthly income levels, either directly or indirectly.
In order to analyze the differences among average monthly income levels
between ethnic groups, considering several social and economic characteristics of a

Action against Income Discrimination. Case Study: Roma Minority in Romania __________________________________________________________________
21
person, two data sets were used. First, the data obtained at the Population and
Housing Census in 2011 were considered; second, data about monthly income, number of contracts and occupation were gathered from the tax record database for
2013. Questionnaires used for gathering census information are available on the
http://www.recensamantromania.ro/en/questionnaires/. The two databases were
aggregated using the Personal Identification Code, registered for each person for both the Census as well as the tax record database. In order to estimate regression
parameters, records for Magyars, Romanians and Roma with a monthly average
gross income between 800 and 8000 RON (181.0364 – 1810.364 EUR, at average exchange rate for 2013 of 1 EUR = 4.419 RON, according to
http://www.bnr.ro/Exchange-Rates--3727.aspx) were used. Only people aged 15-65
were considered. One should note that the three ethnic groups represent 92.65% of the population of Romania; Magyars, Romanians and Roma represent 91.55% of
the total number of persons obtaining a monthly average income between 800 and
8000 RON and 63.2% of the total number of persons that obtained income. Also,
the share of persons that obtained an income between 800 and 8000 RON to the total number of persons that obtained an income is 75%. Furthermore in 2013, the
minimum income level set by law was on average 800 RON. Additionally, Roma
persons represent 0.07% among those who obtain an income greater than 8000 RON. Thus the interval 800-8000 RON was chosen as reference interval. For the
purpose of the research it is important to analyze the biggest share of Roma
population, not the ones affected by extremes, such as severe poverty or very high
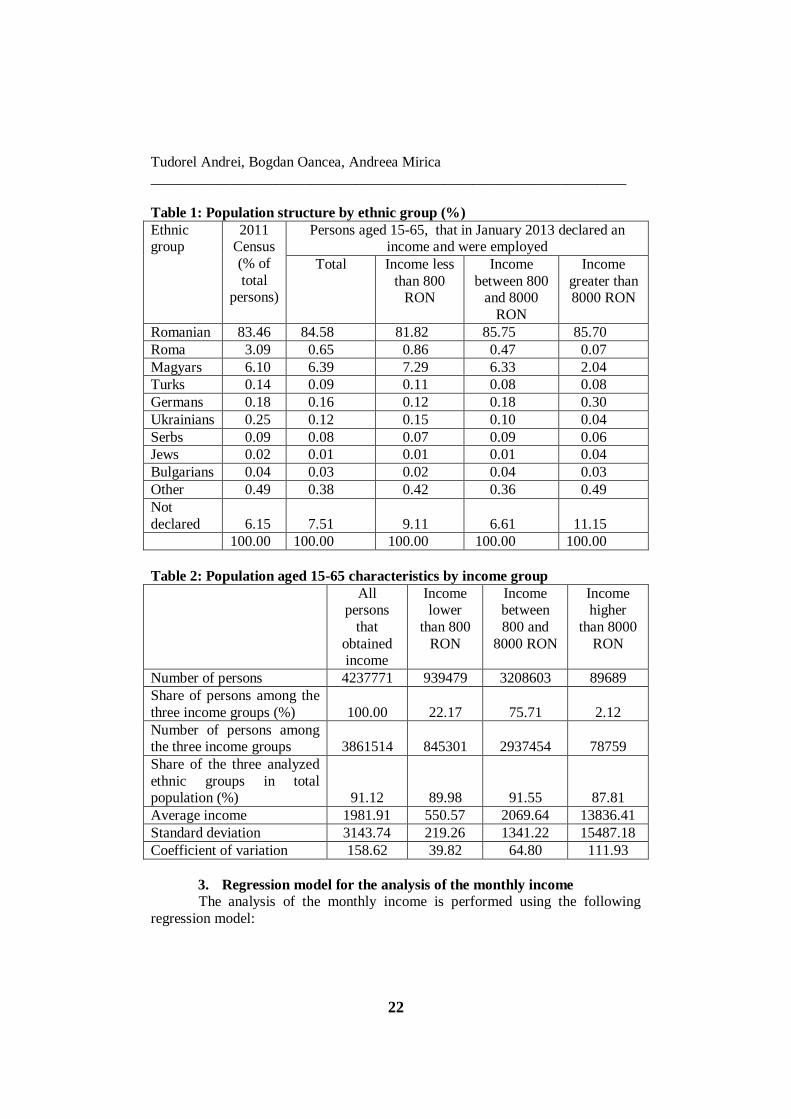
incomes. Table 1 presents the population structure by ethnic group as registered in
the 2011 Census as well as by 2013 level of income. Overall population
characteristics as well as by ethnic group, are presented in table 2. The results reveal several important facts:
● The share of Ukrainians, Serbs, Jews and Bulgarians and other ethnic
groups is similar at the 2011 Census and among persons who obtained an
income between 800-8000 RON (181.0364 – 1810.364 EUR). ● The share of Roma people in the total population is considerably higher
than the share of Roma people obtaining an income. Discrepancies are
even higher for this ethnic group if one accounts for the 8000 RON income
threshold: Roma people represent 3.09% of the total population of Romania; their share among those who obtain an income is 0.65%.
One should note that the persons who did not declare data at the 2011
Census represent 6.15% of the total population of Romania and 11.15% of the total persons that obtained an average monthly income higher than 8000. For these
persons, statistical questionnaires for the Census were mostly completed using
administrative data; yet, no information with regard to the ethnic group could be
retrieved.
Tudorel Andrei, Bogdan Oancea, Andreea Mirica _________________________________________________________________
22
Table 1: Population structure by ethnic group (%)
Ethnic group
2011 Census
(% of
total persons)
Persons aged 15-65, that in January 2013 declared an income and were employed
Total Income less
than 800 RON
Income
between 800 and 8000
RON
Income
greater than 8000 RON
Romanian 83.46 84.58 81.82 85.75 85.70
Roma 3.09 0.65 0.86 0.47 0.07
Magyars 6.10 6.39 7.29 6.33 2.04
Turks 0.14 0.09 0.11 0.08 0.08
Germans 0.18 0.16 0.12 0.18 0.30
Ukrainians 0.25 0.12 0.15 0.10 0.04
Serbs 0.09 0.08 0.07 0.09 0.06
Jews 0.02 0.01 0.01 0.01 0.04
Bulgarians 0.04 0.03 0.02 0.04 0.03
Other 0.49 0.38 0.42 0.36 0.49
Not
declared 6.15 7.51 9.11 6.61 11.15
100.00 100.00 100.00 100.00 100.00
Table 2: Population aged 15-65 characteristics by income group
All persons
that
obtained income
Income lower
than 800
RON
Income between
800 and
8000 RON
Income higher
than 8000
RON
Number of persons 4237771 939479 3208603 89689
Share of persons among the
three income groups (%) 100.00 22.17 75.71 2.12
Number of persons among the three income groups 3861514 845301 2937454 78759
Share of the three analyzed
ethnic groups in total population (%) 91.12 89.98 91.55 87.81
Average income 1981.91 550.57 2069.64 13836.41
Standard deviation 3143.74 219.26 1341.22 15487.18
Coefficient of variation 158.62 39.82 64.80 111.93
3. Regression model for the analysis of the monthly income
The analysis of the monthly income is performed using the following
regression model:

Action against Income Discrimination. Case Study: Roma Minority in Romania __________________________________________________________________
23
𝑙𝑛𝑊 = 𝑋�� (1)
The dependent variable represents the logarithmic monthly income declared in 2013. The independent variables represent several characteristics of a
person. All variables are described in table 3.
Table 3: Variable description
Variable Explanation Data source and observation
W Income Tax Record Data
Edu Educational level: 7 – tertiary level, 6
– postsecondary and non-tertiary level, 5 – upper secondary level, 4 –
professional level, 3 – lower
secondary level, 2 – primary level, 1 – no education or other particular
situations including illiterate
2011 Census, Question
26, Statistical questionnaire “P”
(Persons)
Exp Work experience Defined based on
question 4 with regard to the person’s age,
questions 26 and 27 from
Statistical questionnaire “P” (Persons) with regard
to the level of education
and several data
transformations: age – (14+NS). NS is the
number of school years
over the age of 15, calculated as follows:
tertiary level – 9 years,
postsecondary and non-tertiary level – 5 years,
secondary level – 4 years,
professional level – 2
years, other levels – 0 years.
Sex Gender: 1 – males, 0 – females 2011 Census, Question 3,
Statistical questionnaire “P” (Persons)
Marital_status Marital status: 1 – unmarried, widow
or divorced, 0 – married, 9 – not
declared
2011 Census, Question 5,
Statistical questionnaire
“P” (Persons)

Tudorel Andrei, Bogdan Oancea, Andreea Mirica _________________________________________________________________
24
N_contracts Number of employment contracts for
which a person gained income
D112 Declaration
Internet_user 1– the person uses the internet, 0 – the person does not use the internet, 9
– not declared
2011 Census, Question 29, Statistical
questionnaire “P”
(Persons)
Children Number of children 2011 Census, Statistical questionnaire “G”
(Household)
H_persons Number of persons within household 2011 Census, Statistical questionnaire “G”
(Household)
Sect Binary variable: 1 – person works in
non-financial companies, 0 – otherwise (public administration,
NGOs)
2011 Census, Question
36, Statistical questionnaire “P”
(Persons)
Ethnic Ethnic group 2011 Census, Question
23, Statistical questionnaire “P”
(Persons)
Residency Residency: 2-Urban area 1-Rural area 2011 Census, Question 15, Statistical
questionnaire “P”
(Persons)
The variable describing the ethnic group was used in order to split the
population by ethnicity. The study considers three ethnic groups, the most
important in Romania: Romanians, Roma, and Magyars. For several variables used in defining the model above, the average value at population level as well as by
ethnic group was computed. The results, presented in table 4 reveal several
important characteristics of each ethnic group:
● Roma people have lower income than other ethnic groups; ● Roma population is younger than the population in other ethnic groups: the
average age for Roma, with regard to persons 15-65 years old is lower with
2.6 years compared to the Romanians and with 2.3 years lower compared
to the Magyars;
● Males registered higher incomes than females at population level as well as by each ethnic group. For Roma, 58.8% of those who reported an income,
are males;
● The overall educational level is lower for Roma than for other ethnic
groups. Most people in this group successfully completed at most the lower secondary level of education; over 20% of the population in this group
hasn’t completed any level of education and 14% are illiterate. The data

Action against Income Discrimination. Case Study: Roma Minority in Romania __________________________________________________________________
25
considering the higher educational level for persons aged 10 and over was
registered at the 2011 Census and are presented in table 5; one should consider that table 5 takes into account population above 10 years old, as
this provides a more relevant picture on the educational attainment of
ethnic groups especially for Roma, which usually register low educational
attainment at all age levels. ● Roma ethnic group registered the highest number of children per family:
100 persons that obtain an income care for 87 children; with regard to the
Romanians, 100 persons that obtain an income care for 57 children, while
for Magyars, 100 persons that obtain an income care for 63 children; thus, the average number of persons in a household where at least one person
provides an income is 4.9 for Roma and 3.4 for Romanian and Magyar;
● Lower income levels as well as lower educational attainment for Roma
determine a lower access rate to the Internet: 64% of the persons in Romanian and Magyar ethnic groups compared to 23.7% of the persons in
the Roma group that obtain an income use the internet.
Table 4: Average values for all variables in the model by ethnic group, data
source: designed by the authors Variable Total Romanian Roma Magyar
W 2033.8 2055.5 1317.9 1693.6
Edu 5.436148 5.465788 3.55872 5.175331
Exp 26.28390 26.53952 23.93136 26.24448
N_contracts 1.076767 1.077212 1.035502 1.065049
Sex 0.513443 0.512193 0.587675 0.512922
Marital_status 0.292288 0.27 6735 0.363863 0.306956
Internet_user 0.636969 0.634769 0.237109 0.646167
Children 0.571145 0.574741 0.87365 0.628887
Residency 1.517557 1.519103 1.919681 1.671552
H_persons 3.325191 3.387132 4.891604 3.400068
Sect 0.784785 0.778016 0.803591 0.809812
Table 5: Population characteristics by educational level, data sources:
(1) 2011 Census, volume II, page 504, (2) designed by the authors
Population over 10 years
tertiary level
postsecondary and non-tertiary level
secondary level
primary level
no education illiterate
Number of persons (1)
Total 18022221 2591021 574043 11759627 2556286 541244 245387
Romanian 15222069 2254966 503958 9982366 2101700 379079 153221
Magyar 1119988 114470 37354 822101 122939 23124 9020
Roma 477715 3397 994 213582 163231 96511 67480
Share of persons by educational level and ethnic group (%) (2)
Total 100.00 14.38 3.19 65.25 14.18 3.00 1.36
Romanian 100.00 14.81 3.31 65.58 13.81 2.49 1.01
Magyar 100.00 10.22 3.34 73.40 10.98 2.06 0.81
Roma 100.00 0.71 0.21 44.71 34.17 20.20 14.13

Tudorel Andrei, Bogdan Oancea, Andreea Mirica _________________________________________________________________
26
Share of persons belonging to a certain ethnic group within the total number of persons have a certain educational level (%) (2)
Romanian 84.46 87.03 87.79 84.89 82.22 70.04 62.44
Magyar 6.21 4.42 6.51 6.99 4.81 4.27 3.68
Roma 2.65 0.13 0.17 1.82 6.39 17.83 27.50
The parameters for the regression model (1) were estimated for the entire
population as well as for the three ethnic groups. Table 6 presents the results. As one can observe the coefficients of each variable have the same sign across all
ethnic groups, yet, the level is very different. Comparing the three ethnic groups,
one can observe the following: ● The educational level has approximately the same positive effect on the
income level for the Magyar (14.6%) and Romanian (16%) ethnic groups;
yet, due to the low educational level of the Roma population, the effect on
the income is two times lower (7.8%); ● The number of employment contracts for which a person gained income
has a positive effect on the income level; for the persons in Roma ethnic
group the coefficient registered was 0.17, four times higher than for
Romanians or Magyars; ● Male persons obtained a higher income than female persons among all
three ethnic groups;
● As the parameter of the variable describing the number of children is
negative, one can deduce that persons with a higher number of children
generally obtain lower income; ● Across all three ethnic groups, married persons obtain higher revenues
compared to unmarried persons;
● Persons that usually access the internet have 11.06% higher income that
those who do not; the results are the same for all three ethnic groups as
well as for the entire population. ● Area of residency negatively influences the income level, as people living
in urban areas gain increased incomes compared to those living in rural
areas.
Table 6: Regression model coefficients and characteristics by ethnic group;
source: designed by the authors
Variable Total Romanian Roma Magyar
Edu 0.159393(656.36) 0.162501(632.11) 0.077740(27.55) 0.146173(157.88)
Exp 0.014781(105.27) 0.015718(102.20) 0.0100440(7.72) 0.0120290(24.58)
Exp^2 -0.000144(-56.64) -0.000153(-55.26) -0.000159(-6.16) -0.000099(-10.93)
N_contracts 0.0494861(52.21) 0.0466640(48.31) 0.1705320(6.80) 0.0692560(10.82)
SEX 0.088018(113.06) 0.094075(111.31) 0.092444(11.61) 0.0900620(32.61)
Marital_status -0.020405(-29.68) -0.019187(-25.53) -0.019009(-2.94) -0.0218680(-9.31)
Internet_user 0.105266(162.20) 0.112634(160.79) 0.090934(10.13) 0.0924520(42.19)
Children -0.034511(-85.61) -0.033783(-76.48) -0.024142(-11.49) -0.022166(-15.64)
Residency -0.032328 (-101.78) -0.029855(-87.52) -0.003659(-1.22) -0.021272(-20.44)

Action against Income Discrimination. Case Study: Roma Minority in Romania __________________________________________________________________
27
H_persons -0.014217(-69.46) -0.015080(-65.37) -0.002360(-1.95) -0.0080790(-9.64)
Sect -0.008255(-12.59) -0.0248800(33.33) 0.108123(14.74) -0.066877(-26.81)
C 6.297581(2218.15) 6.259144(2113.69) 6.417303(192.77) 6.279077(567.56)
𝑅2 0.231 0.236 0.185 0.235
n 3208603 2722052 14816 200586
*t-values in brackets
Using the results of the regression model (1), as well as the average of each
variable by ethnic group, the following relationship was defined:
𝑙𝑛𝑊𝑖 = 𝑋��𝛽��, 𝑖 = 𝐴, 𝑅𝑂, 𝑅𝑂𝑀, 𝑀𝐴 (2)
��𝑖is the average of each variable used for defining the regression model for the
overall population and by each ethnic group (A – overall population, RO –
Romanian group, ROM – Roma group, MA – Magyar group). After estimating parameters for each population, one must establish whether or not
they significantly differ from one another. Specifically, the following relationship
must be tested for each pair of ethnic groups ��𝑖 = ��𝑗, 𝑖, 𝑗 = 𝑅𝑜, 𝑅𝑜𝑚, 𝐻𝑢 𝑎𝑛𝑑 𝑖 ≠
𝑗. In order to compute a statistical test, the following elements of the first
regression model were considered:
● SSR – sum of squared errors obtained after estimating regression model (1)
using data for both ethnic groups;
● 𝑆𝑆𝑅𝑖 – sum of squared errors obtained after estimating regression model
(1) using data one ethnic group;
● 𝑆𝑆𝑅𝑖𝑗 = 𝑆𝑆𝑅𝑖 + 𝑆𝑆𝑅𝑗 𝑖, 𝑗 = 𝑅𝑜, 𝑅𝑜𝑚, 𝐻𝑢 𝑎𝑛𝑑 𝑖 ≠ 𝑗
𝐹 =(𝑆𝑆𝑅 − 𝑆𝑆𝑅𝑖𝑗)/𝑝
𝑆𝑆𝑅𝑖𝑗/(𝑛𝑖 + 𝑛𝑗 − 2𝑝)→ 𝐹(𝑝, 𝑛𝑖 + 𝑛𝑗 − 2𝑝)
p – Number of regression parameters for model 1
𝑛𝑖 – Number of observations at each ethnic group
F is defined under the hypothesis of lack of structural change (𝐻0).
Table 7 presents the values for F and 𝑃𝑟𝑜𝑏 𝐹(𝑝, 𝑛𝑖 + 𝑛𝑗 − 2𝑝) which are
used in order to analyse parameters’ stability among two ethnic groups. As one can
observe, different profiles for the three ethnic groups can be defined. Thus, next,
income decomposition among ethnic groups is performed emphasizing the influence of differences among ethnic groups and positive discrimination.

Tudorel Andrei, Bogdan Oancea, Andreea Mirica _________________________________________________________________
28
Table 7: Structural changes analysis among all three ethnic groups F Value
(above main diagonal)
Romanian Roma Magyar
Prob𝐹(𝑝, 𝑛𝑖 + 𝑛𝑗 − 2𝑝)
(under main diagonal)
Romanian - 140.47 1027.36
Roma 0.00 - 172.16
Magyar 0.00 0.00 -
4. Income difference decomposition among two ethnic groups
For each compared ethnic group, regression parameters are different
depending on the values of different variables. For two ethnic groups, 𝛽�� and 𝛽�� are
the regression model parameters. 𝛽∗is the regression model (1) parameter obtained
if there is no positive or negative discrimination between ethnic groups considering
income differences. This parameter is calculated using the two parameters estimated for the two ethnic groups based on the following relationship:
��∗ = Ω𝑝(��𝑖 − ��𝑗) + ��𝑗 (3)
In the third relationship, Ω𝑝 is a squared matrix of order p, which can have
different forms:
● Ω𝑝 = I𝑝whereI𝑝 is the unit matrix of order p. This decomposition method
was proposed by Oaxaca (1973) and it assumes that there is positive discrimination only in favor of the second group (not the first one). In this
case ��∗ = ��𝑖 . This decomposition technique has become a basic tool for
studying racial and gender wage differentials and discrimination, and it has
been allowed in court litigation on discrimination (Ashenfelter and Oaxaca 1987).
● Ω𝑝 = O𝑝whereO𝑝 is the zero matrix of order p. This method, also
proposed by Oaxaca (1973) was used in order to assess if there is positive
discrimination only in favor of the first group (not the second one) within
each comparison. In this case ��∗ = ��𝑗 ;
● Ω𝑝 = 1
2I𝑝is the decomposition proposed by Reimers (1983). This method
was chosen because it takes into account the possibility of selectivity bias
in the observed wage sample. ��∗is the average of the two parameters
estimated for the two ethnic groups, ��∗ =1
2(��𝑖 + ��𝑗).
● Ω𝑝 = 𝑛𝑖
𝑛𝑖+𝑛𝑗I𝑝is the decomposition proposed by Cotton (1988) which
yields more nearly accurate estimates of the components of the wage
differential than other methods. 𝑛𝑖is the number of persons in the first
group and 𝑛𝑗 is the number of persons in the second group. ��∗ is the

Action against Income Discrimination. Case Study: Roma Minority in Romania __________________________________________________________________
29
weighted average of the two parameters estimated for the two ethnic
groups, ��∗ =𝑛𝑖
𝑛𝑖+𝑛𝑗��𝑖 +
𝑛𝑗
𝑛𝑖+𝑛𝑗��𝑗;
● Ω𝑝 = (𝑋𝑋 ′)−1
(𝑋𝑖𝑋𝑖′)was proposed by Oaxaca and Ranson (1994). X is the
matrix containing all values for the characteristics of each ethnic group. This technique is similar to Neumark’s (1988) and a generalization of the
method proposed by Cotton (1988).
Using the linear regression model (3) and the ��∗ parameter, the differences
between two ethnic groups considering the average income are decomposed using
the following relationship:
𝑙𝑛𝑊𝑖 − 𝑙𝑛𝑊𝑗
= 𝑋��(𝛽�� − 𝛽∗) + 𝑋��(𝛽∗ − 𝛽��) + (𝑋�� − 𝑋��)𝛽∗= 𝐷𝑖 + 𝐷𝑗 + 𝐻𝑖𝑗i,j=A,RO,
ROM, HU𝑖 ≠ 𝑗 (4)
𝐷𝑖 is the positive discrimination in favour of group i, 𝐷𝑗 is the positive
discrimination in favour of group j and 𝐻𝑖𝑗 measures the differences in the average
income between the two ethnic groups due to the differences of the average values
of the characteristics considered for comparing the two ethnic groups.
Considering that regression model (3) estimated for each ethnic group has a constant different from 0, then the fourth relationship becomes:
𝑙𝑛𝑊𝑖 − 𝑙𝑛𝑊𝑗
= [𝐷1𝑖 + 𝐷2𝑖] + [𝐷1𝑗 + 𝐷2𝑗] + 𝐻𝑖𝑗i,j=A,RO, ROM, HU𝑖 ≠ 𝑗 (5)
𝐷1𝑖 is the positive or negative discrimination that affects a person in the first ethnic
group due to the factors that are not included in the model, 𝐷2𝑖 is the positive or negative discrimination that affects a person in the first ethnic group due to the
factors that are included in the model, 𝐷1𝑗 is the positive or negative discrimination
that affects a person in the second ethnic group due to the factors that are not
included in the model, 𝐷2𝑗 is the positive or negative discrimination that affects a
person in the second ethnic group due to the factors that are included in the model. Given the decomposition formula for the difference in the average income between
two ethnic groups presented in the fifth relationship, one can obtain the
decomposition formula for the difference caused directly by the variables used to define the regression model 1:
[ 𝑙𝑛𝑊𝑖 − 𝐷1𝑖] − [𝑙𝑛𝑊𝑗
− 𝐷1𝑗] = 𝐷2𝑖 + 𝐷2𝑗 + 𝐻𝑖𝑗 i,j=A,RO, ROM, HU𝑖 ≠ 𝑗 (6)
As stated above, five different estimation methods were used for the ��∗
parameter (identified in the scintific literature). The results of each method are
presented in table 8 and 9; for each pair of ethnic groups: 𝐷2𝑖 , 𝐷2𝑗 , 𝐻𝑖𝑗 , 𝐷2𝑖 + 𝐷2𝑗 in
absolute values (table 9), as well as relative values to the 𝐷2𝑖 + 𝐷2𝑗 + 𝐻𝑖𝑗, which
Tudorel Andrei, Bogdan Oancea, Andreea Mirica _________________________________________________________________
30
represents the income exclusively determined by the variables included in the
model (table 8).
Table 9 also presents the results obtained due to the analysis of the diffenrences in the income level among ethnic groups based of the fourth
relationship, thus evaluating the discrimination due to the variables included in the
model as well as other factors. For each pair, values for all terms of relationship
four are presented separatly (𝐷2𝑖 , 𝐷2𝑗 , 𝐷2𝑖 + 𝐷2𝑗 and𝐻𝑖𝑗). As a consequence,
differences in the average income of each ethnic group are revealed with regard to:
𝐷1𝑖, the discrimination that affects the first ethnic group due to the factors that are
not included in the model, 𝐷2𝑖,the discrimination that affects the first ethnic group
due to the factors that are included in the model, 𝐷1𝑗 , the discrimination that affects
the second ethnic group due to the factors that are not included in the model, 𝐷2𝑗 is
the discrimination that affects the second ethnic group due to the factors that are
included in the model and 𝐻𝑖𝑗 the differences in the average income between the
two ethnic groups due to the differences of the average values of the characteristics
considered for comparing the two ethnic groups. The results obtained through equation 5 emphasize the following:
Relatively similar results were obtained for the Magyar and Romanian
ethnic groups with regard to the share of income determined by the
variables included in the first model. Less than 30% of the differences in the average income between Magyars and Romanians is explained through
the dissimilarities between the two ethnic groups considering the
independent variables in the regression model.
All five models produced relatively close values for differences in the
average income between the two ethnic groups due to the differences of the
average values of the characteristics considered for comparing the two
ethnic groups, expressed through 𝐻𝑖𝑗 in the fifth relationship;
All five models revealed significant differences between the average
income of the Romanian and Roma ethnic groups as well as of Magyar and
Roma ethnic groups due to the variables included in the regression model
(1). Overall, 75% of the differences in the average income between the compared ethnic groups are explained through the differences in the
groups’ socio-economic profile;
Comparing the Romanian and Roma group, with regard to the differences
due to the positive discrimination for one of the groups, one can observe a balanced situation: 18.9% of the differences in the income level for the two
ethnic groups is explained through the positive discrimination for the
Romanian group, while 15.3% of the differences in the income level for
the two ethnic groups is explained through the positive discrimination for the Roma group;
The results are different when analyzing the Romanian and Magyar
groups: positive discrimination of the Magyars explained 50% of the

Action against Income Discrimination. Case Study: Roma Minority in Romania __________________________________________________________________
31
income difference while positive discrimination of the Romanians, only
25%;
Interesting results were obtained when the Roma and Magyar groups were
examined: positive discrimination of the Magyars explained 25% of the
income difference while positive discrimination of the Roma, only 1.6%;
Table 8: Evaluating relative differences among ethnic groups as result of
model variables
Method Compared groups
Discrimination in favor of the first
group
Discrimination in favor of the second group
Differences due to
different productiviti
es
Total discrimination
Total differences
OAXACA 1
Romanian VS Roma
0.00 21.96 78.04 21.96 100.00
Romanian VS Magyar
0.00 72.96 27.04 72.96 100.00
Magyar VS Roma
0.00 5.41 94.59 5.41 100.00
OAXAC
A 2
Romanian
VS Roma
62.34 0.00 37.66 62.34 100.00
Romanian VS Magyar
75.05 0.00 24.95 75.05 100.00
Magyar VS Roma
45.61 0.00 54.39 45.61 100.00
Reimers Romanian
VS Roma
31.17 10.98 57.85 42.15 100.00
Romanian VS Magyar
37.53 36.48 25.99 74.01 100.00
Magyar VS Roma
22.81 2.71 74.49 25.51 100.00
Cotton Romanian
VS Roma
0.34 21.84 77.82 22.18 100.00
Romanian VS Magyar
5.15 67.95 26.90 73.10 100.00
Magyar VS Roma
42.48 0.37 57.15 42.85 100.00
Neumark Romanian
VS Roma
0.88 21.52 77.60 22.40 100.00
Romanian VS Magyar
3.78 68.93 27.28 72.72 100.00
Magyar VS Roma
14.59 -0.66 86.07 13.93 100.00

Tudorel Andrei, Bogdan Oancea, Andreea Mirica _________________________________________________________________
32
Table 9: Evaluating differences among ethnic groups using regression model 2 and relationships 3 and 4
Method Compared groups Discrimination in
favor of the first group
Discrimination in
favor of the second group
Differences
due to different
productivities
Explained
discrimination
Unexplained
discrimination
Total
discrimination
Differences
due to the model
variables
Total
differences
𝐷1𝑖 𝐷2𝑖 𝐷1𝑗 𝐷2𝑗 𝐻𝑖𝑗 𝐷2𝑖 + 𝐷2𝑗 𝐷1𝑖 + 𝐷1𝑗 (8)+(9) (7)+(8) (7)+(10)
(1) (2) (3) (4) (5) (6) (7) (8) (9) (10) (11) (12)
OAXACA 1 Romanian VS
Roma 0.0000 0.0000 -0.1663 0.117174 0.41639 0.117174 -0.1663 -0.04913 0.53356 0.36726
Romanian VS
Magyar 0.0000 0.0000 -
0.02807 0.150672 0.055847 0.150672 -0.02807 0.122602 0.20652 0.17845
Magyar VS Roma 0.0000 0.0000 -
0.13823 0.017703 0.309342 0.017703 -0.13823 -0.12053 0.32705 0.18882
OAXACA 2 Romanian VS Roma -0.1663 0.332623 0.00000 0.00000 0.200941 0.332623 -0.1663 0.166323 0.53356 0.36726
Romanian VS Magyar
-0.02807 0.154999 0.00000 0.00000 0.051521 0.154999 -0.02807 0.126929 0.20652 0.17851
Magyar VS Roma
-
0.13823 0.149173 0.00000 0.00000 0.177871 0.149173 -0.13823 0.010943 0.32704 0.18881
Reimers Romanian VS
Roma
-
0.08315 0.166311 -
0.08315 0.058587 0.308665 0.224898 -0.1663 0.058598 0.53356 0.36726
Romanian VS
Magyar
-
0.01404 0.077499 -
0.01404 0.075336 0.053684 0.152835 -0.02808 0.124755 0.20652 0.17844
Magyar VS Roma -
0.06911 0.074587 -
0.06911 0.008851 0.243607 0.083438 -0.13822 -0.05478 0.32705 0.18883
Cotton Romanian VS Roma -0.0009 0.001801 -0.1654 0.11654 0.415223 0.118341 -0.1663 -0.04796 0.53356 0.36726
Romanian VS Magyar
-0.00193 0.010638
-0.02614 0.140331 0.05555 0.150969 -0.02807 0.122899 0.20652 0.17845
Magyar VS Roma
-
0.12872 0.138913
-
0.00951 0.001218 0.186914 0.140131 -0.13823 0.001901 0.32705 0.18882

Action against Income Discrimination. Case Study: Roma Minority in Romania __________________________________________________________________
33
Neumark Romanian VS
Roma -0.0047 0.004677 -
0.16159 0.114833 0.414054 0.11951 -0.16629 -0.04678 0.53356 0.36727
Romanian VS
Magyar 0.00069 0.007816 -
0.02876 0.142356 0.056347 0.150172 -0.02807 0.122106 0.20652 0.17845
Magyar VS Roma -0.0523 0.047717 -
0.08593 -0.00217 0.281496 0.045547 -0.13823 -0.09268 0.32704 0.18881

Economic Computation and Economic Cybernetics Studies and Research, Issue 4/2017, Vol. 51
________________________________________________________________
34
5. Conclusions
This paper analyzed the differences in wages considering three major ethnic groups in Romania with focus on the Roma minority. The results are a
strong basis for policies addressing wages discrimination with regard to ethnicity.
Also, they provide strong incentives on the areas that should be treated with particular attention in order to increase wages.
First, out of all three ethnic groups, Roma register the highest number of
children per family, lowest educational level and incomes. High birth rates result in
a young population, yet, several alarming facts are to be emphasized considering health reproduction in Roma women: high infant mortality and perinatal death
rates, premature births and low birth weight babies, abortion as an acceptable way
of contraception (Ringold, 2000). With regard to contraception, Nikolic and Djikanovic (2015) emphasized that Roma women rely mostly on traditional ways
of contraception. In addressing these issues, as well as all other health issues the
Roma community is facing, public policies should focus on emphasizing the role
of preventive health care (WHO Regional Office for Europe, 2013) which besides vaccination and adopting a healthy lifestyle, should also include promoting modern
contraception. Considering increasing educational attainment, an inclusive
approach on education is needed so that all children can have access to high quality education especially in those counties in Romania where educational attainment is
very low (Dascălu et al, 2016). This is particularly necessary at tertiary level, as
higher education is a solution to address unemployment in Romania increasing labor force participation, especially in the case of metropolitan Roma people
(Andrei et al. 2016) and women (Andrei et al.2010).
Second, variables included in our model explains 75% of the differences in
the average income between the Roma and Romanians and Roma and Magyars, respectively. Also, the effect of educational attainment on the wages of Roma is
much lower than in the case of other minorities. Most of the public efforts
considering Roma inclusion aimed at “eliminating discrimination and closing the unacceptable gaps between Roma and the rest of society” (Decade of Roma
Inclusion Secretariat Foundation, 2015) considering employment, education, health
and housing, gender inequality and poverty. Third, considering wages with regard to gender, marital status, number of
children, access to the internet and area of residency similar results were obtained
for all ethnic groups. Thus, these issues must be addressed in a broad sense, but
also taking into account ethnic group’s cultural particularities. Male persons obtained a higher income than female persons. Thus,
reducing gender pay gaps and improving access to financial resources is

Action against Income Discrimination. Case study: Roma Minority in Romania
mandatory, as these gap may have important negative consequences on women’s life quality especially after retirement.
Married persons obtain higher revenues compared to unmarried persons.
As, single mothers are one of the most vulnerable group within this category, policies addressing wage differentials should primarly focus on the.
Persons that usually access the internet have 11.06% higher income that
those who do not; the results are the same for all three ethnic groups as well as for
the entire population. Thus, strengthening efforts in order to increase internet usage especially in areas where using the internet is relatively easy will help reduce wage
gaps.
Area of residency negatively influences the income level, as people living in urban areas gain increased incomes compared to those living in rural areas. This
is of great relevance from the perspective of the objectives of social and inclusive
growth of the Europe 2020 Strategy. Efficient ways in addressing low income levels in rural areas from Romania are needed.
REFERENCES
[1] Andrei, T., Teodorescu, D., Oancea, B. &Iacob, A. (2010), Evolution of
Higher Education in Romania During the Transition Period. Procedia-Social
and Behavioral Sciences, 9, 963-967; [2] Andrei, T., Mirică, A., Teodorescu, D. &Dascălu, E. D. (2016), Main
Determinants of Labor Force Participation in the Case of Metropolitan Roma
People. Journal for Economic Forecasting, (3), 144-163;
[3] Ashenfelter, O. (1969), Changes in Labor Market Discrimination over Time. Systems Analysis and Labor Market Working paper #14;
[4] Ashenfelter O., Oaxaca R. (1987),The Economics of Discrimination:
Economists Enter the Courtroom. American Economic Review 77 (2): 321–325; [5] Blinder A.S. (1973), Wage Discrimination: Reduced Form and Structural
Estimates. Journal of Human Resources 8:436–455;
[6] Cotton, J. (1988), On the Decomposition of Wage Differentials. Review of Economics & Statistics 70(2), 236-243;
[7] Dascalu, E. D., Mirica, A. &Mincu-Radulescu, I. (2016), Pursuing Higher
Education: Privileged or Free Access in Romania?.Romanian Statistical Review,
64(3), 3-18; [8] Decade of Roma Inclusion Secretariat Foundation, (2015) News. Roma
Inclusion Index 2015.http://www.romadecade.org/news/roma-inclusion-index-
2015/9810 Accessed 11 February 2016; [9] Drydakis N. (2012), Ethnic Identity and Immigrants’ wages in Greece.
International Journal of Intercultural Relations 36:389– 402.
doi:10.1016/j.ijintrel.2011.09.002;

Tudorel Andrei, Bogdan Oancea, Andreea Mirică
______________________________________________________________
36
[10] European Commission (2011), An EU Framework for National Roma
Integration Strategies up to 2020;
[11] Kelley J, Evans MDR (2015), Prejudice, Exclusion and Economic
Disadvantage: A Theory. Sociological Theory 33(3): 201–233. doi:
10.1177/0735275115603091;
[12] Neumark D. (1988), Employers' Discriminatory Behavior and the
Estimation of Wage Discrimination. The Journal of Human Resources 23(3): 279–295;
[13] Nikolic Z, Djikanovic B. (2015), Differences in the Use of Contraception
between Roma and Non-Roma Women in Serbia. Journal of Public Health 37(4):581-589. doi: 10.1093/pubmed/fdu096;
[14] National Bank of Romania. Exchange Ratehttp://www.bnr.ro/Exchange-
Rates--3727.aspx accessed 24 February 2016’ [15] National Institute of Statistics Romania.Population and Housing Census
Questionnairehttp://www.recensamantromania.ro/en/questionnaires/;
[16] Oaxaca R.L. (1973) Male-Female Wage Differentials in Urban Labor
Markets. International Economic Review 14 (3): 693–709. [17] Oaxaca R.L., Ranson M.R. (1994), On Discrimination and the
Decomposition of Wage Differentials; Journal of Econometircs 61:5-21;
[18] O’Higgins N. (2015), Ethnicity and Gender in the Labour Market in
Central and South-Eastern Europe. Cambridge Journal of Economics 39:631–
654. doi:10.1093/cje/bev002;
[19] Pereira J., Galego A. (2011), Regional Wage Differentials in Portugal:
Static and Dynamic Approaches. Papers in Regional Science 90(3): 529-548. doi:
10.1111/j.1435-5957.2010.00328.x;
[20] Reimers C.W. (1983), Labor Market Discrimination against Hispanic and
Black Men. The Review of Economics and Statistics 65(4): 570–579; [21] Ringold D. (2000), Roma and the Transition in Central and Eastern
Europe: Trends and Challenges. The World Bank;
[22] Romanian Parliament (2015), Law proposal on civil partnership. http://www.cdep.ro/pls/proiecte/upl_pck.proiect?idp=14867 Accessed 11 February
2016;
[23] Revenga A., Ringold D., Tracy W.M. (2002), Poverty and Ethnicity: A
cross-country Study of Roma Poverty in Central Europe. World Bank Technical Paper no. 531;
[24] The World Bank (2013),Inequality in focus ;Volume 2 Number 2 August
2013; http://www.worldbank.org/content/dam/Worldbank/document/Poverty%20docume
nts/Inequality-In-Focus-0813.pdf Accessed 25 February 2015
[25] WHO Regional Office for Europe (2013), Roma Health Mediation in
Romania: Case Study. Roma Health Case Study Series, No. 1.