economic cost of type 1 diabetes in australia
TRANSCRIPT

Economic Cost of Type 1 Diabetes in Australia
April, 2021

Format Background… > Picture or texture fill > Set to one of the dark or mid gradient options
1 A word from our CEO 03
2 Executive Summary 04
3 Australians with Type 1 Diabetes 06
4 Economic Cost of Type 1 Diabetes 13
5 Impact of New Treatments & Technologies 18
6 Appendix 23
Table of Contents
A word from our CEOIt is more than 10 years since there has been an accurate picture of type one diabetes (T1D) in Australia, including its incidence, impact and cost. As the leading global funder of T1D research we are pleased to be able to share this information publicly. We hope it will drive debate and discussion of the findings, which clearly show the need to address the significant burden this chronic disease creates.
Our report shows that the burden of T1D is not just carried by the T1D community. Increased incidence produces a significant financial cost also borne by wider society, making it incumbent on us all not to think of T1D as solely an issue for those living with T1D. A disease growing at this rate, with such a significant proportion being younger Australians, deserves greater recognition, understanding, and investment. Finding solutions to the challenges of T1D benefits not just those living with it and their families, but wider society as well.
Solutions must start with understanding the scale of the problem and this report adds contemporary and accurate information to the T1D debate. I would like to pass on my thanks to Accenture for their diligent work and the many members of the T1D community who shared their stories to bring life to the analysis.
T1D is complex, chronic and complicated. 2021 marks 100 years since the discovery of insulin, a significant and lifechanging milestone that has changed and saved millions of lives around the world. And while we strive to continue to learn more about T1D, for today’s patients there is a simple truth that this report highlights – increasing access to technology will improve health outcomes and reduce the financial burden. As a society, we owe it not only to these patients but to ourselves to find ways to increase access to this technology.
We hope this report is illuminating for you and helps shape your understanding of T1D in Australia today.

Format Background… > Picture or texture fill > Set to one of the dark or mid gradient options
Type 1 Diabetes (T1D) is a chronic autoimmune condition which impairs the body’s ability to manage blood
glucose. T1D is not linked to lifestyle factors, and currently there is no prevention or cure.
There are currently approximately 127,000 Australians living with T1D. Around 3,000 new cases of T1D are
diagnosed each year, mostly in children, making T1D one of the most serious and common chronic diseases of
childhood.
The impact of T1D on individuals’ and families' lives is
extensive. As of today, 40% of individuals have developed complications such as a blindness,
amputation, neuropathy or cardiovascular disease as a result of having T1D.
T1D and the associated health complications place a high cost on individuals, families, governments and the
economy. In 2020, T1D cost $2.9 billion through healthcare costs, reduced wellbeing, lower employment
and additional care. This equates to $51 billion over the life of the individuals who currently have T1D.
The majority of this cost is driven by complications. The
average annual cost of T1D for individuals with no complications is ~$9,000. This annual cost increases to
~$32,000 should the individual develop a severe T1D-
related complication –such as blindness or chronic kidney disease. This cost can increase further should an
individual have multiple severe complications. Given current complication prevalence, the average annual
cost of T1D is $22,000 per person.
Emerging treatment options and technologies can
reduce the cost of T1D. Access to continuous glucose monitors (CGMs) and pump technologies can minimise
the risk of complications and emergencies, reducing average lifetime costs by 14% and yielding a benefit
cost ratio of 1.5. In addition, drug therapies and screening can identify individuals not yet clinically
diagnosed, providing treatments to delay the onset and preventing emergencies from occurring at diagnosis.
Commitment from both the public and private sector will be critical to reducing the cost of T1D, ensuring
individuals can access treatments and technologies which enable them to manage the disease, reduce
complications, emergencies and participate in society to a greater extent.
Executive Summary
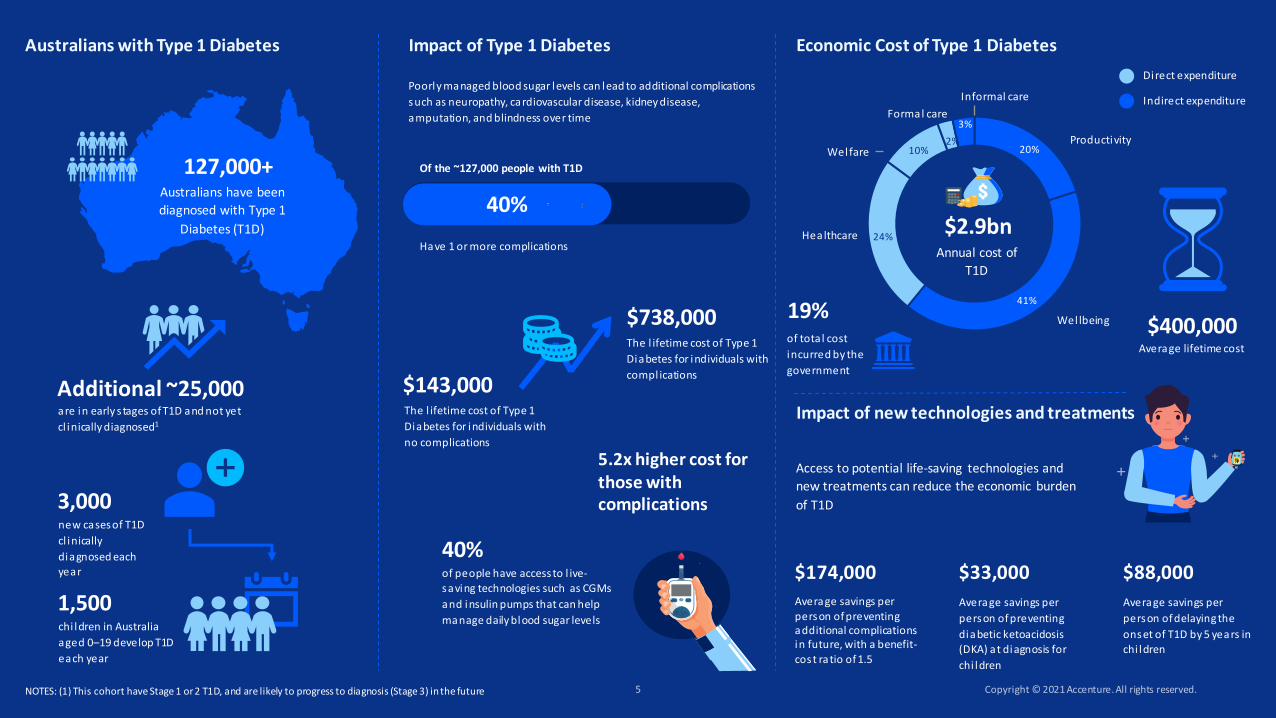
127,000+Australians have been
diagnosed with Type 1
Diabetes (T1D)
new cases of T1D
cl inically
diagnosed each year
3,000
chi ldren in Australia
aged 0–19 develop T1D
each year
1,500
are in early s tages of T1D and not yet
cl inically diagnosed1
Additional ~25,000
Poorly managed blood sugar levels can lead to additional complications
such as neuropathy, cardiovascular disease, kidney disease,
amputation, and blindness over time
Of the ~127,000 people with T1D
Have 1 or more complications
40%
Access to potential life-saving technologies and
new treatments can reduce the economic burden
of T1D
Average savings per person of preventing additional complications in future, with a benefit-
cost ratio of 1.5
$174,000
Average savings per
person of preventing
diabetic ketoacidosis (DKA) at diagnosis for
chi ldren
$33,000
Average savings per
person of delaying the
onset of T1D by 5 years in chi ldren
$88,000
Australians with Type 1 Diabetes
20%
41%
24%
10%2%
3%
Annual cost of
T1D
$2.9bn
Productivity
Wellbeing
Healthcare
Welfare
Formal care
Informal care
Direct expenditure
Indirect expenditure
Average lifetime cost
$400,000
40%of people have access to l ive-saving technologies such as CGMs
and insulin pumps that can help
manage daily blood sugar levels
Impact of Type 1 Diabetes Economic Cost of Type 1 Diabetes
Impact of new technologies and treatmentsThe l ifetime cost of Type 1
Diabetes for individuals with
no complications
$143,000
The l ifetime cost of Type 1
Diabetes for individuals with
compl ications
$738,000of total cost
incurred by the
government
19%
5.2x higher cost for those with complications
NOTES: (1) This cohort have Stage 1 or 2 T1D, and are likely to progress to diagnosis (Stage 3) in the future

Format Background… > Picture or texture fill > Set to one of the dark or mid gradient options
Approximately 127,000Australians are clinically diagnosed and living with Type 1 Diabetes, almost half of whom suffer from additional complications like neuropathy or cardiovascular disease

Format Background… > Picture or texture fill > Set to one of the dark or mid gradient options
Approximately 127,000 Australians have been clinically diagnosed with Type 1 Diabetes, with an additional ~25,000 individuals who are in early stages of T1D but not yet clinically diagnosed
Type 1 Diabetes (T1D) is a lifelong autoimmune disease that usually occurs in childhood but can be diagnosed at any age. T1D occurs when the immune system attacks cells in the pancreas that produce insulin. Insulin is required by the body to turn blood sugar (glucose) into energy. Since people with T1D cannot produce insulin naturally, they must take it either through daily injections or from an insulin pump. 1 The exact cause of T1D is unknown – it is considered to be triggered by genetic and environmental factors.2
There are approximately 127,000 Australians living with T1D diabetes. This group accounts for ~10% of all people with diabetes in Australia.
3,000 new cases of T1D are diagnosed each year. With 6 new cases diagnosed every day, Australia has one of the highest rates of Type 1 Diabetes in the world.1
This number does not account for who have are not yet clinically diagnosed. The progression of T1D occurs in 3 stages. Stages 1 & 2 are pre-symptomatic; Stage 3 is when clinical diagnosis takes place. Based on global estimates3, an additional 25,000 individuals are currently in Stages 1-26, and will be clinically diagnosed in the future.
25,000 124,0003,000
Stage 3 - Prevalence
Stage 1-2 - Triggered, butnot yet clinically diagnosed
Stage 3 - New Incidences
Australians at-risk (Stages 1-2)3 and diagnosed (Stage 3)4,5 with T1D in 2020
Estimated number of individuals in Stages 1-3, 2020
1: JDRF2: Diabetes Australia3: Estimated based on Fr1da-/Fr1da-Plus-Study in Bavaria: Early Detection for Early Care of Type 1 Diabetes; Staging Pre-symptomatic Type 1 Diabetes 4:NDSS (Diabetes Map 2020). Note - This breakdown only includes ‘reported and NDSS registered’ cases, and therefore may not be wholistic (NDSS)5: AIHW – Diabetes Report, CVD 82 20206: Stage 1 represents individuals who have developed two or more Type 1 Diabetes–associated islet autoantibodies but have normal blood glucose levels. Stage 2 includes individuals with two or more islet autoantibodies but have now progressed to the development of glucose into lerance. Stage 3 is when clinical diagnosis occurs and manifestations of the typical clinical symptoms and signs of T1D, which may include polyuria, polydipsia, weight loss, fatigue, diabetic ketoacidosis (DKA), and others (American Diabetes Association)
~3,000 new cases diagnosed every year
In 2020 ~127,000 individuals have a clinical T1D diagnosis
~124,000 individuals diagnosed with T1D prior to 2020
25,000 individuals have early stages of T1D but are not yet clinically diagnosed
Format Background… > Picture or texture fill > Set to one of the dark or mid gradient options
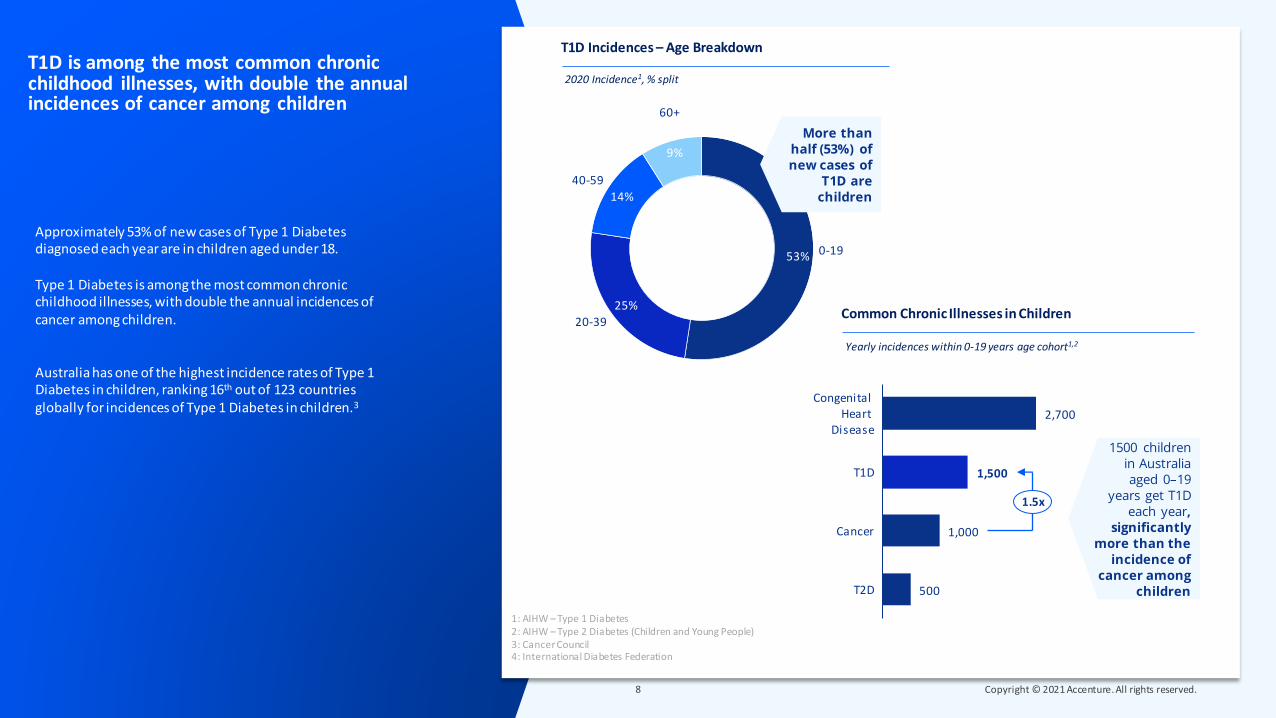
Approximately 53% of new cases of Type 1 Diabetes diagnosed each year are in children aged under 18.
Type 1 Diabetes is among the most common chronic childhood illnesses, with double the annual incidences of cancer among children.
Australia has one of the highest incidence rates of Type 1 Diabetes in children, ranking 16th out of 123 countries globally for incidences of Type 1 Diabetes in children.3
T1D is among the most common chronic childhood illnesses, with double the annual incidences of cancer among children
1: AIHW – Type 1 Diabetes2: AIHW – Type 2 Diabetes (Children and Young People)3: Cancer Council4: International Diabetes Federation
T1D Incidences – Age Breakdown
2020 Incidence1, % split
53%
25%
14%
9%
60+
0-19
20-39
40-59
1500 children in Australia aged 0–19
years get T1D each year,
significantly more than the
incidence of cancer among
children
Common Chronic Illnesses in Children
Yearly incidences within 0-19 years age cohort1,2
More than half (53%) of new cases of
T1D are children
2,700
1,500
1,000
500
Cancer
Congenital Heart
Disease
T1D
T2D
1.5x

Format Background… > Picture or texture fill > Set to one of the dark or mid gradient options
Case Study
Providing round the clock care for kids with T1D can take a significant toll on mental, social, and economic outcomes for parents
Mark and Hayley are parents to Benjamin (11 years old) and James (8 years old), both diagnosed with T1D when they were 4 years and 3 years old, respectively.
“It was emotionally quite hard to come to terms with. Our hearts broke when Ben was diagnosed; it shattered with James, grieving for healthy carefree childhood that you anticipated. It definitely took a toll on our relationship in the first few years when we were learning to adapt. We were highly anxious and only focused on the kids’ welfare”
Mark and Hayley had to very quickly learn to deliver medical care for their kids. With two young boys with T1D, the workload is doubled –meal preparation, food-carb counting, blood glucose testing, insulin administration, organising and going to appointments with specialists.
“It is groundhog day every day - there are times when even with the same management process, both boys will react quite differently due to stress, hormones, insulin, and exercise. We often feel like we are playing the role of medical professionals for our kids. The fear of losing them is always bubbling just below the surface”
It takes a lot of time and effort to ensure that both boys experience a normal, carefree childhood. 90% of management of T1D related activities in children is either done or overseen by parents, often requiring one parent to be a full time carer. “We don’t stray away from our circle too much. We never have a drink together in case of having to give injections or go to hospital. If they become unwell, it takes a day or two to be well enough to go back to school.” Hayley has been able to find work which she can do from home and that has flexible hours, however many parents of T1D kids don’t get that opportunity and often can’t go back to workforce for this reason.

Format Background… > Picture or texture fill > Set to one of the dark or mid gradient options
Diabetic ketoacidosis (DKA) and dangerously low blood sugar levels, or hypoglycaemia (hypos), are serious and often common side-effects of T1D, occurring when a person’s blood sugar levels get too high or too low.
DKA occurs when blood sugar levels are very high and insulin levels are low. Without enough insulin, the body begins to break down fat as fuel, producing a build-up of acids in the bloodstream called ketones, leading to a DKA, if left untreated. Severe incidences of DKA often lead to emergency hospitalisations and, in some cases, can have devastating consequences resulting in diabetic coma or even death. Each year there are approximately 14,400 cases of DKA caused by T1D, resulting in emergency hospitalisations. DKA is especially common at diagnosis when many people are unaware of their diabetic condition.
Hypoglycaemia is a condition that occurs when a person's blood sugar levels drop too low. Impact of hypos range from sweating and palpations to more severe effects such as coma and even sudden cardiac death. Cumulative long-term occurrence of hypos in young children can have a significant impact on intellectual function. Severe Hypoglycaemia is defined as requiring the assistance of another person, and it is estimated that ~50% of cases will contact EMS,1 and of those ~20% will require hospital admission and ongoing hospitalisation.2
There are nearly 60,000 cases of severe Hypoglycemia annually not requiring hospitalisation
1: Wang, et al. Diabetes Care, ‘Frequency of Severe Hypoglycemia Requiring Emergency Treatment’ 2003.2: Villani, et al. Diabetologia, ‘Outcomes of people with severe hypoglycaemia requiring prehospital emergency medical services’ 2019.
64,000
32,500
6,700
Severe Hypoglycemia Cases(Annually)
Estimated Severe Hypoglycemia Cases
(EMS Contacted)
Estimated Severe Hypoglycemia Cases
(Requiring Hopsitalisation)
Distribution of the ~64,000 cases of severe hypoglycemia in 2020
Breakdown of Severe Hypoglycaemia Cases1
We estimate that of the 64,000 annual cases of Severe
Hypoglycemia, ~32,500 contact Emergency Services.
Of these, ~6,700 require hospitalisation, with the remainder
treated on-site

Format Background… > Picture or texture fill > Set to one of the dark or mid gradient options
Over time, consistently high blood glucose levels can affect all bodily systems, leading to serious health complications such as neuropathy (nerve pain)1, cardiovascular disease, and nephropathy (chronic kidney disease), and in some cases foot amputations and blindness.
Of the 127,000 people with T1D, 40% have developed additional complications of T1D, with neuropathy and foot ulcers making up 46% of all complication.
Long-term complications can require an individual to make significant life changes. Complications such as chronic kidney disease or vision impairment can not only increase an individual’s healthcare costs by 5.2x but also have an impact on productivity. Individuals with complications on average require additional 10.5 more days off work each year and are four times more likely to be unemployed.3
For women, pre-existing T1D can also increases risk of miscarriage, stillbirth and birth defects during pregnancies. T1D increases the risk of diabetic ketoacidosis, eye problems, pregnancy-induced high blood pressure and preeclampsia. 1% of live births in Australia are affected by pre-existing diabetes.4
40% of people have developed long-term complications due to T1D, with neuropathy the most common complication
1: Also includes foot ulcers2: Australian National Diabetes Audit (ANDA), Annual Report, 2019 3: See Appendix for Methodology. Estimations primarily based upon: • Wellbeing – Disability Weightings (WHO & GBD); Healthcare – AIHW (Disease Expenditure Data Tables 2016); Productivity – Burden of Disease on the
Ability to Work (2013) & ABS; Gov Tax & Welfare – NDSS, Services Australia, Productivity Commission; Care – Services Australia, DiabCost (2009) & ABS4: IDF Atlas, 2019 Edition
60%
14%
14%
12%
0 Complications
3+ Complications
1 Complication
2 Complications
Distribution of 127,000 cases in 2020
Long-term Complications2
5
7
40
46
2
Neuropathy
Cardiovascular
Nephropathy
Amputation
Blindness
40% of people with T1D are suffering from one or more long-term complications, with neuropathy & foot ulcers as the most common complications
Format Background… > Picture or texture fill > Set to one of the dark or mid gradient options
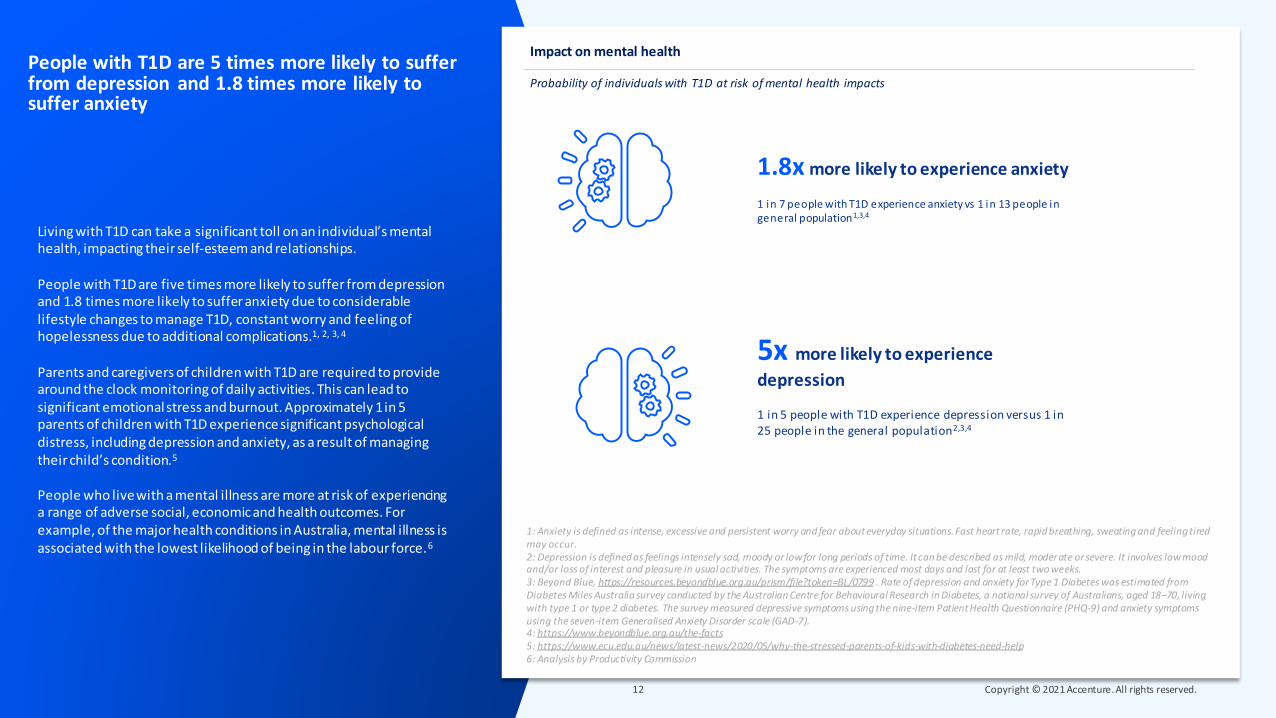
Living with T1D can take a significant toll on an individual’s mental health, impacting their self-esteem and relationships.
People with T1D are five times more likely to suffer from depression and 1.8 times more likely to suffer anxiety due to considerable lifestyle changes to manage T1D, constant worry and feeling of hopelessness due to additional complications.1, 2, 3, 4
Parents and caregivers of children with T1D are required to provide around the clock monitoring of daily activities. This can lead to significant emotional stress and burnout. Approximately 1 in 5 parents of children with T1D experiencesignificant psychological distress, including depression and anxiety, as a result of managing their child’s condition.5
People who live with a mental illness are more at risk of experiencing a range of adverse social, economic and health outcomes. For example, of the major health conditions in Australia, mental illness is associated with the lowest likelihood of being in the labour force.6
People with T1D are 5 times more likely to suffer from depression and 1.8 times more likely to suffer anxiety
1: Anxiety is defined as intense, excessive and persistent worry and fear about everyday situations. Fast heart rate, rapid breathing, sweating and feeling tired may occur.2: Depression is defined as feelings intensely sad, moody or low for long periods of time. It can be described as mild, moderate or severe. It involves low mood and/or loss of interest and pleasure in usual activities. The symptoms are experienced most days and last for at least two weeks. 3: Beyond Blue, https://resources.beyondblue.org.au/prism/file?token=BL/0799 . Rate of depression and anxiety for Type 1 Diabetes was estimated from Diabetes Miles Australia survey conducted by the Australian Centre for Behavioural Research in Diabetes, a national survey of Australians, aged 18–70, living with type 1 or type 2 diabetes. The survey measured depressive symptoms using the nine-item Patient Health Questionnaire (PHQ-9) and anxiety symptoms using the seven-item Generalised Anxiety Disorder scale (GAD-7). 4: https://www.beyondblue.org.au/the-facts5: https://www.ecu.edu.au/news/latest-news/2020/05/why-the-stressed-parents-of-kids-with-diabetes-need-help6: Analysis by Productivity Commission
Probability of individuals with T1D at risk of mental health impacts
Impact on mental health
5x more likely to experience
depression
1 in 5 people with T1D experience depression versus 1 in 25 people in the general population2,3,4
1.8x more likely to experience anxiety
1 in 7 people with T1D experience anxiety vs 1 in 13 people in general population1,3,4

Format Background… > Picture or texture fill > Set to one of the dark or mid gradient options
The 127,000 people living with Type 1 Diabetes today cost the Australian economy approximately $2.9 bn annually

Format Background… > Picture or texture fill > Set to one of the dark or mid gradient options
0.3(5%)
0.7(28%)
0.6(22%)
1.2(38%)
T1D costs the economy a total of $2.9 bn annually through a range of direct and indirect costs.
Direct costs result from providing health care, formal care, income support and welfare payments to people with T1D. This places a heavy burden on government resources as well as the Australian taxpayer. Direct costs are estimated at $1 bn annually, accounting for ~36% of total annual costs.
The majority of this direct cost (51%) falls to the Federal Government. State governments bears 11% of direct costs, while individuals and private payers incur the remaining 37% of direct costs.
T1D also imposes indirect costs of $1.9 bn on the economy. A key contributor to this cost is the impact on wellbeing (41%). Impact on wellbeing is estimated as $0.2 bn economic cost incurred due to early mortality (reduced average life expectancy of ~10 years) and $0.9 bn due to years of healthy life lost because of living with T1D and other complications.
The remaining 23% of costs, equating to $0.7 bn, are productivity loss and informal care costs incurred by individuals and caregivers due to increased unemployment and absenteeism.
People living with Type 1 Diabetes today cost the Australian economy ~$2.9 bn annually Annual costs for 127,000 cases, $bn
Total annual costs of T1D in Australia
Welfare Formal carecare
2.9
Healthcare
Total
1.2(41%)
0.3(10%)
0.7(24%)
0.1(2%)
0.6(20%)
Productivity Wellbeing
0.1(3%)
Informalcare
See Appendix for Methodology. Estimations primarily based upon: • Wellbeing – Disability Weightings (WHO & GBD); Healthcare – AIHW (Disease Expenditure Data Tables 2016); Productivity – Burden of Disease on the Ability to
Work (2013) & ABS; Gov Tax & Welfare – NDSS, Services Australia, Productivity Commission; Care – Services Australia, DiabCost (2009) & ABS
Direct Costs Indirect Costs
direct expenditure on healthcare (e.g. hospital costs)
cost of unemployment and disability
benefits
cost of Government
carers ’ payment
cost of unemployment
and absenteeism
impact of disability on individuals'
l ives and years of l i fe lost
va lue of time of care by fami ly and
friends
Format Background… > Picture or texture fill > Set to one of the dark or mid gradient options
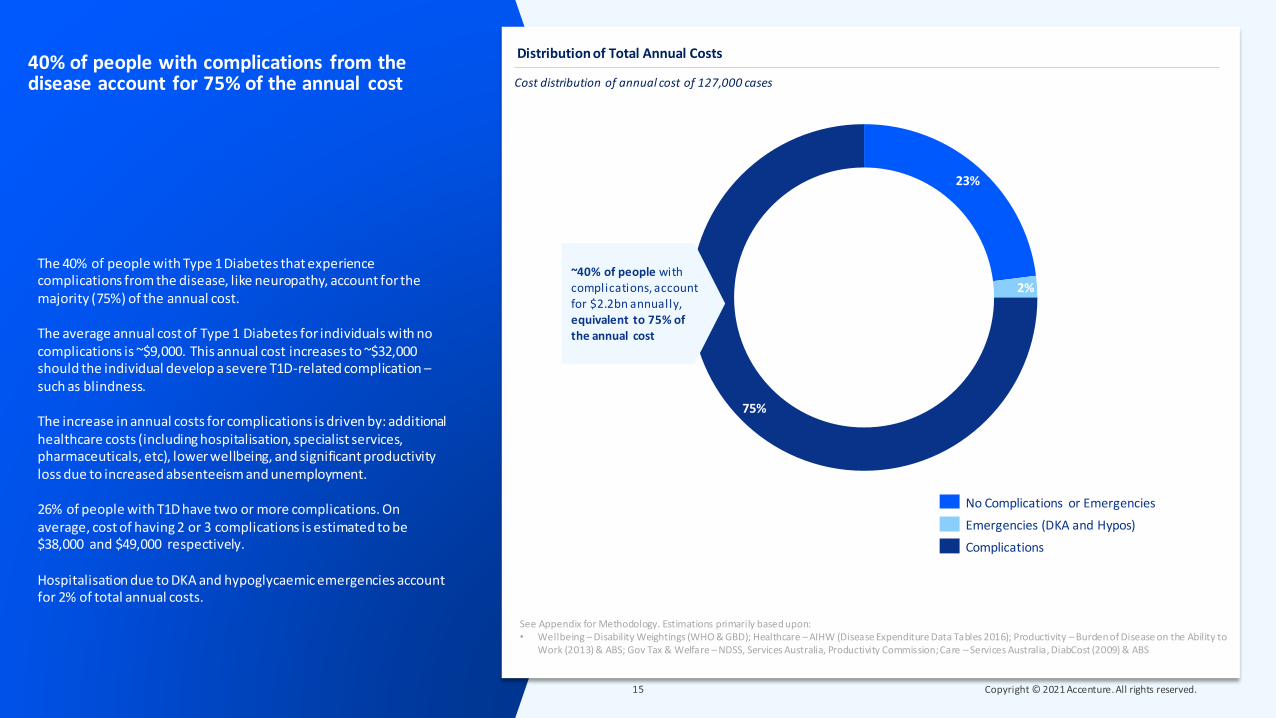
The 40% of people with Type 1 Diabetes that experience complications from the disease, like neuropathy, account for the majority (75%) of the annual cost.
The average annual cost of Type 1 Diabetes for individuals with no complications is ~$9,000. This annual cost increases to ~$32,000 should the individual develop a severe T1D-related complication –such as blindness.
The increase in annual costs for complications is driven by: additional healthcare costs (including hospitalisation, specialist services, pharmaceuticals, etc), lower wellbeing, and significant productivity loss due to increased absenteeism and unemployment.
26% of people with T1D have two or more complications. On average, cost of having 2 or 3 complications is estimated to be $38,000 and $49,000 respectively.
Hospitalisation due to DKA and hypoglycaemic emergencies account for 2% of total annual costs.
40% of people with complications from the disease account for 75% of the annual cost Cost distribution of annual cost of 127,000 cases
Distribution of Total Annual Costs
23%
2%
75%
~40% of people with complications, account for $2.2bn annually,equivalent to 75% of the annual cost
No Complications or Emergencies
Emergencies (DKA and Hypos)
Complications
See Appendix for Methodology. Estimations primarily based upon: • Wellbeing – Disability Weightings (WHO & GBD); Healthcare – AIHW (Disease Expenditure Data Tables 2016); Productivity – Burden of Disease on the Ability to
Work (2013) & ABS; Gov Tax & Welfare – NDSS, Services Australia, Productivity Commission; Care – Services Australia, DiabCost (2009) & ABS
Format Background… > Picture or texture fill > Set to one of the dark or mid gradient options
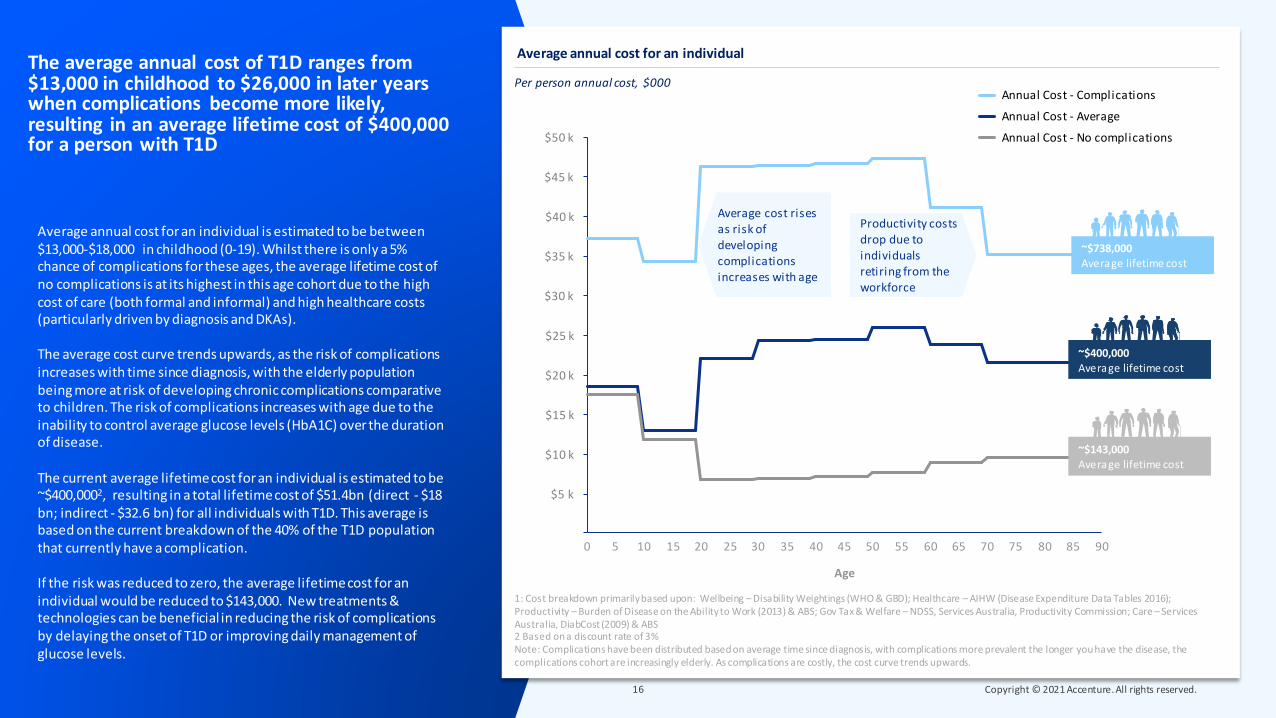
Average annual cost for an individual is estimated to be between $13,000-$18,000 in childhood (0-19). Whilst there is only a 5% chance of complications for these ages, the average lifetime cost of no complications is at its highest in this age cohort due to the high cost of care (both formal and informal) and high healthcare costs (particularly driven by diagnosis and DKAs).
The average cost curve trends upwards, as the risk of complications increases with time since diagnosis, with the elderly population being more at risk of developing chronic complications comparative to children. The risk of complications increases with age due to the inability to control average glucose levels (HbA1C) over the duration of disease.
The current average lifetime cost for an individual is estimated to be ~$400,0002, resulting in a total lifetime cost of $51.4bn (direct - $18 bn; indirect - $32.6 bn) for all individuals with T1D. This average is based on the current breakdown of the 40% of the T1D population that currently have a complication.
If the risk was reduced to zero, the average lifetime cost for an individual would be reduced to $143,000. New treatments & technologies can be beneficial in reducing the risk of complications by delaying the onset of T1D or improving daily management of glucose levels.
The average annual cost of T1D ranges from $13,000 in childhood to $26,000 in later years when complications become more likely, resulting in an average lifetime cost of $400,000 for a person with T1D
Per person annual cost, $000
Average annual cost for an individual
10
$35 k
0 2015
$15 k
5 25 35 8030 6540 5045 55 60 70 75 85 90
$5 k
$10 k
$40 k
$20 k
$25 k
$30 k
$45 k
$50 k
Age
~$400,000Average lifetime cost
1: Cost breakdown primarily based upon: Wellbeing – Disability Weightings (WHO & GBD); Healthcare – AIHW (Disease Expenditure Data Tables 2016); Productivity – Burden of Disease on the Ability to Work (2013) & ABS; Gov Tax & Welfare – NDSS, Services Australia, Productivity Commission; Care – Services Australia, DiabCost (2009) & ABS2 Based on a discount rate of 3%Note: Complications have been distributed based on average time since diagnosis, with complications more prevalent the longer you have the disease, the complications cohort are increasingly elderly. As complications are costly, the cost curve trends upwards.
Annual Cost - Complications
Annual Cost - Average
Annual Cost - No complications
~$143,000Average lifetime cost
~$738,000Average lifetime cost
Average cost rises as risk of developing complications increases with age
Productivity costs drop due to individuals retiring from the workforce

Format Background… > Picture or texture fill > Set to one of the dark or mid gradient options
Case Study
Even with access to public health services, the recommended standard of care required to manage T1D can cost an individual significant proportion of their income
Kristi was diagnosed with T1D in March 1985 at age 11. She has had T1D for 36 years. Additionally, she developed diabetic retinopathy 25 years ago. In the last 10 years, it has impaired her vision to the point that she has had to stop driving. Additionally, Kristi also suffers from renal complications. Her kidney function is at 16%. She is under the care of an endocrinologist and kidney specialist. At this stage, a high-risk virus or illness could push it to the point where she may require kidney transplant. She also has some nerve damage in her stomach and bottom of feet, that causes regular gastric reflux and pain.
“Management of T1D when I was first diagnosed was a lot harder, relying on finger pricks and multiple daily injections. The last 8 years, I have been able to use a CGM and pump to improve management. I pay ~$220 per month for private insurance to get access to a pump and pay for a CGM out of pocket” This is not the case for many individuals who cannot afford these technologies.
The clinical care guide for managing T1D recommends seeing a team of professionals such as diabetes educator, dietician, dentists, and specialists such as an endocrinologist every 3 months. These services are difficult to get through public system and cost-prohibitive through private channels. Often, people have to take a whole day off from work or home to sit and wait to see a professional. “If I followed the management plan recommended for individuals living with T1D, the costs would be exorbitant. Even cutting corners where I can, I pay ~$1500 per month out of pocket for private health insurance, medications for managing my T1D and complications, CGM and consumables.
As a taxpayer, Kristi is frustrated that the government hasn’t come up with a fair health care scheme that makes care for T1D affordable for everyone. “If your income is above $65,000, you don’t qualify for a health care card and you can’t get access to a CGM from the government. You have to shell out ~$6000 per year out of pocket which is ~9% of your income on just one device.”

Format Background… > Picture or texture fill > Set to one of the dark or mid gradient options
Access to potential life-saving technologies and new treatments can reduce costs by ~14% and improve quality of life

Format Background… > Picture or texture fill > Set to one of the dark or mid gradient options
Researchers have identified that access to continuous glucose monitoring devices (CGMs) and insulin pumps can help individuals have a tighter control of their glucose levels, reducing the risk of long-term complications and the significant cost that results.1
Access to these technologies is out of reach for many Australians, at a cost of $6,500 per year (~$2,500 for an insulin pump and pump consumables, and ~$4,000 for a CGM). Under the government’s CGM initiative, young adults under 21 years, or adults over 21 with concessional status, can get access to a free CGM. Alternatively, the JDRF-administered Insulin Pump Program provides pumps to families who have children under 18 years of age with T1D, and meet the financial and clinical eligibility requirements. Due to current eligibility criteria, only 45% of individuals have CGM access and 28% have access to a pump.2
Providing more Australians with access to this effective treatment could deliver a significant benefit that outweighs the cost. Providing CGM and pump access costs ~$120,0004 for each individual over their lifetime but can save $174,000 in lifetime costs due to reduced complications and their significant impact on lives. This results in a net saving of $54,000, or a benefit-cost ratio of 1.5.
Expanding the access to young Australians between age 20-30, who are just entering the workforce and typically unable to afford private insurance5, could achieve a net economic benefit of $312m
Access to continuous glucose monitoring device (CGM) and insulin pumps can help individuals reduce their risk of developing complications, saving $54,000 per person
NPV lifetime cost of additional CGMs & pumps4 vs lifetime benefit of reducing risk of complications3
Per person lifetime cost vs benefit of providing CGM & Insulin pump to an individual
120,000
174,000
Benefit of CGMs & Insulin PumpsCost of CGMs & Insulin Pumps
$54,000
This represents a net saving of $54,000 per person, a 14% cost reduction from average l ifetime cost of $400,000.
1: CGM improved glycemic control in Type 1 Diabetes - https://diabetes.acponline.org/archives /2019/10/11/2.htm2: Department of Health, Minister Hunt (2020), ’58,000 type 1 diabetic to have free access to new glucose monitoring device’ANDA (2019), Annual Report3: Average blood glucose (HbA1C) levels for an individual with no access to technology is typically >8.6%. 6.5% - 6.9% is considered the recommended target glucose levels associated with
lower risks of complications and short-term emergencies.1 Reducing mean HbA1C levels from >8.6% to the target can achieve a saving of $174,000 in lifetime costs. See Appendix for detailed methodology.4: 2019 Prosthesis List (Cost of Pumps & Pump consumables), Diabetes Australia (Cost of CGMs)5: https://www.aihw.gov.au/repo rts/australias-health/private-health-insuranc e. Estimated ~6500 adults with T1D between age 20-30 without CGM & pump
Benefit-cost ratio of 1.5

Format Background… > Picture or texture fill > Set to one of the dark or mid gradient options
Tameeka was diagnosed with Type 1 Diabetes in 2003 at the age of 11. “I was fortunate to have medical professionals in my family who helped me with early diagnosis and intervention. Often, people are diagnosed only after they’ve been hospitalised due to a diabetic emergency”
It was a significant lifestyle shift for Tameeka. “I quickly learnt to deal with getting multiple injections every day, discussing and planning my daily meals with my parents, often sitting out of physical and social activities at school due to fluctuating sugar levels. Spontaneity went out of life.”
At the age of 13, Tameeka took complete responsibility of managing her T1D. “I spend an hour out of my day every day actively managing T1D – meal prepping for the day, blood glucose testing 5-6 times a day, carbohydrate counting after each meal to calculate insulin amounts needed. Every meal I eat required precise mathematical calculation of carbohydrate intake. And lastly, finding space to administer the insulin injection when not at home.” These tasks and regular activities can take much longer when there is a hypo episode.
Tameeka went on an insulin pump at age 14. “For me, insulin pumps and CGM when both worked together gave normalcy to my life. I was free to do more activities with less anxiety.”
Tameeka had to give up both CGM and insulin pump recently when she could no longer afford to pay for private health insurance. On CGM and a pump, she was able to keep her HbA1c levels between 5.6% and 6.3% (almost in non diabetic category) and now she averages between 7.7% and 9.1%. “Since giving up my CGM, my sleep has been massively impacted. Without the CGM, I find myself waking up out of fear and anxiety of sugar levels fluctuating dangerously while I’m asleep”
Case Study
Tameeka lost access to a pump and CGM which reduces her ability to manage T1D

Format Background… > Picture or texture fill > Set to one of the dark or mid gradient options
Emerging treatments are showing promising signs of preventing acute emergencies or delaying the onset of T1D, with the potential to significantly reduce the lifetime cost of T1D for children and young adults aged 0-19
PREVENTING DKA AT DIAGNOSIS:39% of new incidences of T1D every year (~912 individuals) are diagnosed when an individual suffers diabetic ketoacidosis (DKA)1, requiring emergency care.2 53% of these cases are children aged 0-19. DKA leads to costly hospitalisations and significant disruptions in peoples lives.
Population-based screening for children can identify those not yet clinically diagnosed with Stage 1 or 2 of T1D. Once identified, at-risk children can undergo regular follow-ups to monitor their progression to T1D, reducing the incidences of DKA at diagnosis from 479 (31%) to 76 (5%) incidences annually.2,3,4 Preventing DKA at diagnosis is associated with reducing the risk of recurring DKA and long-term complications. This can resulting in lifetime cost reduction of up to ~$33,000 per person. This estimate is a gross savings estimate and does not factor in cost of treatment. More information is needed on costs to estimate net savings.
DELAYING THE ONSET of T1D:Early identification of at-risk individuals can not only reduce the risk of DKA but also allow individuals in stages 1-2 to start monitoring early, and potentially opt for new therapies that can delay the onset of T1D.
Emerging drug therapies currently in clinical trials, such as Teplizumab have successfully proven to delay the onset of T1D.5 Administering such a therapy to at-risk children within stages 1-2, can delay the onset of T1D by 3-5 years. This could result in lifetime cost reduction of up to $88,000 per person. This estimate is a gross savings estimate and does not factor in cost of treatment. Commitment from government and private sector is required to progress this area of research and uncover the full benefit potential of this treatment.
Lifetime costs of an individual aged 0-19 associated with no delay, delay by 3 years, delay by 5 years
Per person benefit of delaying the onset of T1D by 3-5 years6,7
535,000 481,000 447,000
Delay by 3 yearsNo Delay Delay by 5 years
$88,000
1: Ampt, et al. ‘Using population data to understand the epidemiology and risk factors for diabetic ketoacidosis in Australian child ren with type 1 diabetes’ (2019); Queensland Government, ‘Reducing DKA at diagnosis of type 1 diabetes in children’ (2020)2: Benefits Calculation: ~900 incidences of DKA occur at T1D diagnosis. ~500 of these DKA’s at diagnosis are attributed to th e 0-19 age cohort, with ~400 preventable through screening and follow-up. 3: Hekkala, et al. ‘Ketoacidosis at diagnosis of Type 1 Diabetes: Effect of prospective studies with newborn genetic screening and follow up of risk children’ Pediatric Diabetes (2017).4: Larsson, et al. ‘Reduced Prevalence of DKA at Diagnosis of Type 1 Diabetes in Young Children Participating in Longitudinal Follow-Up’ American Diabetes Association (2011).
5: JDRF, https://www.diabetes wa.com.au/res earch-rev iew-immunotherapy-drug-teplizumab-can-delay-type-1-diab etes-onset-up-to-3-years-in-children-and-adults-at-high-risk/6: See Appendix for detailed methodology.7: This estimate is a gross savings estimate and does not factor in cost of treatment. More information is needed on costs to es timate net savings.
535,000 502,000
Li fetime cost with DKA at diagnosis
Li ftime cost without DKA at diagnosis
$33,000
Average lifetime costs for an individual aged 0-19 with vs without DKA at diagnosis
Per person benefit of reducing DKA at diagnosis6,7
Preventing DKA at diagnosis can result in a
lifetime cost saving of $33,000 per person
Delaying the onset by 5 years can achieve a
lifetime saving of ~$88,000 per person
Format Background… > Picture or texture fill > Set to one of the dark or mid gradient options
About Accenture
Accenture is a leading global professional services company, providing a broad range of services and solutions in strategy, consulting, digital, technology and operations. Combining unmatched experience and specialised skills across more than 40 industries and all business functions — underpinned by the world’s largest delivery network — Accenture works at the intersection of business and technology to help clients improve their performance and create sustainable value for their stakeholders. Visit us at www.accenture.com
About JDRF
JDRF is the leading supporter of Type 1 Diabetes (T1D) research in the world.
Our vision? A world without Type 1 Diabetes. JDRF has transformed the understanding of this disease and been a part of every breakthrough in T1D care in the last 45 years. We drive innovation, demand action and stand with everyone facing life with T1D. Visit us at www.jdrf.org.au
Disclaimer
This document is intended for general informational purposes only. The analysis in this report was commissioned by JDRF and prepared by Accenture on behalf of JDRF.
Views and opinions expressed in this document are based on Accenture’s knowledge and understanding of its area of business, markets and technology. Accenture does not provide medical, legal, regulatory, audit, or tax advice, and this document does not constitute advice of any nature. While the information in this document has been prepared in good faith, Accenture disclaims, to the fullest extent permitted by applicable law, any and all liability for the accuracy and completeness of the information in this document and for any acts or omissions made based on such information. Opinions expressed herein are subject to change without notice.
This document may make references to third party names, trademarks or copyrights that may be owned by others. Any third-party names, trademarks or copyrights contained in this document are the property of their respective owners.
Copyright© 2021 Accenture. All rights reserved. Accenture and its logo are trademarks of Accenture

Format Background… > Picture or texture fill > Set to one of the dark or mid gradient options
Appendix: Methodology

Format Background… > Picture or texture fill > Set to one of the dark or mid gradient options
The following methodology was used to estimate economic cost of Type 1 Diabetes in Australia
Category Cost components
Total cases of T1D in 2020
Age Complication Status
AbsenteeismProductivity Costs
UnemploymentTaxation Loss (Income Tax)
Efficiency Loss (Tax & Welfare)
Years of Life Lost (YLL)
Wellbeing CostsYears of Life Impacted
by Disability (YLD)Type 1 Diabetes Disability
WeightingComplications Disability
Weighting
Additional Costs of Managing Complications
Healthcare Costs T1D Underlying Healthcare Costs
Disability Support Pension (Severe Cases)
Welfare CostsJobSeeker Payment (Caused by
T1D)
Formal Care Costs
Formal Care (Carers Payment)
Informal Care (Family & Friends)
Informal Care Costs
Direct Costs
Number of cases
Indirect Costs
Format Background… > Picture or texture fill > Set to one of the dark or mid gradient options
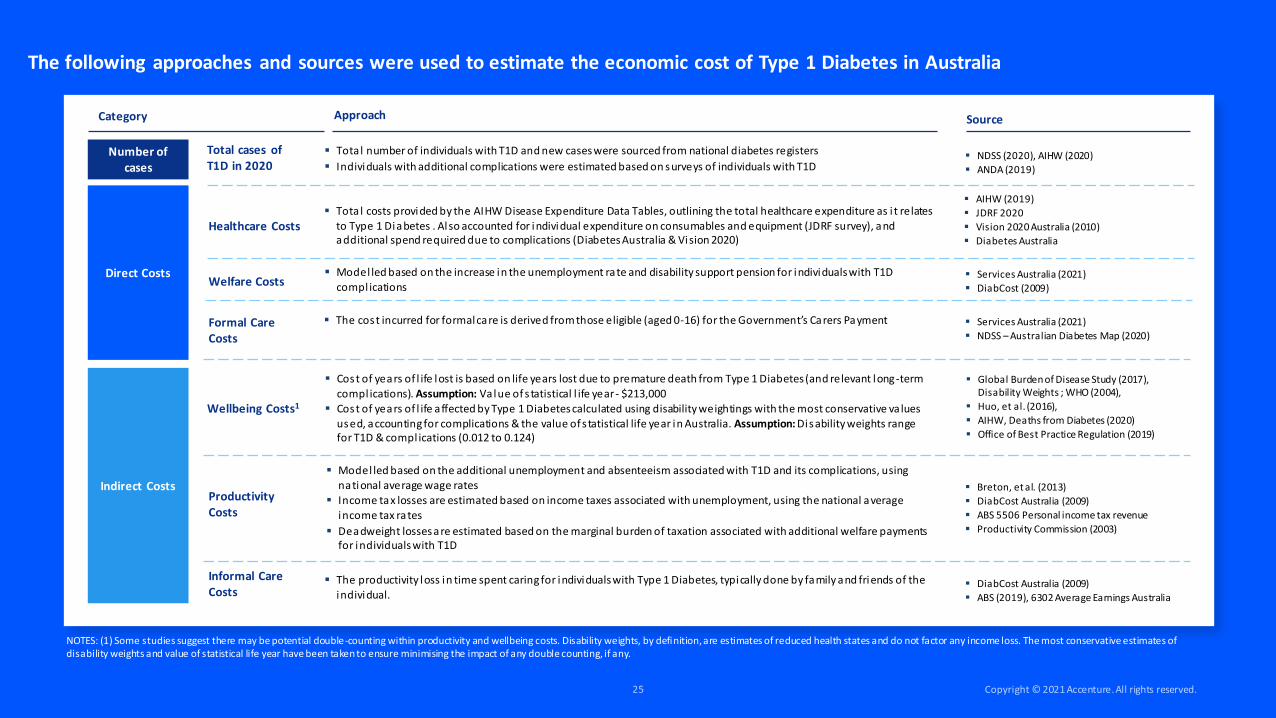
The following approaches and sources were used to estimate the economic cost of Type 1 Diabetes in Australia
Category Approach
Total cases of T1D in 2020
Productivity Costs
Wellbeing Costs1
Healthcare Costs
Welfare Costs
Formal Care Costs
Informal Care Costs
Direct Costs
Number of cases
Indirect Costs
Source
▪ Total number of individuals with T1D and new cases were sourced from national diabetes registers
▪ Individuals with additional complications were estimated based on surveys of individuals with T1D▪ NDSS (2020), AIHW (2020)
▪ ANDA (2019)
▪ Tota l costs provided by the AIHW Disease Expenditure Data Tables, outlining the total healthcare expenditure as i t relates
to Type 1 Diabetes . Also accounted for individual expenditure on consumables and equipment (JDRF survey), and additional spend required due to complications (Diabetes Australia & Vision 2020)
▪ AIHW (2019)
▪ JDRF 2020
▪ Vision 2020 Australia (2010)
▪ Diabetes Australia
▪ Model led based on the increase in the unemployment rate and disability support pension for individuals with T1D compl ications
▪ Services Australia (2021)
▪ DiabCost (2009)
▪ The cost incurred for formal care is derived from those eligible (aged 0-16) for the Government’s Carers Payment ▪ Services Australia (2021)
▪ NDSS – Australian Diabetes Map (2020)
▪ Cost of years of l ife lost is based on life years lost due to premature death from Type 1 Diabetes (and relevant long-term compl ications). Assumption: Value of s tatistical l ife year - $213,000
▪ Cost of years of l ife affected by Type 1 Diabetes calculated using disability weightings with the most conservative va lues used, accounting for complications & the value of s tatistical life year in Australia. Assumption: Disability weights range for T1D & compl ications (0.012 to 0.124)
▪ Global Burden of Disease Study (2017), Disability Weights ; WHO (2004),
▪ Huo, et al. (2016),
▪ AIHW, Deaths from Diabetes (2020)
▪ Office of Best Practice Regulation (2019)
▪ Model led based on the additional unemployment and absenteeism associated with T1D and its complications, using national average wage rates
▪ Income tax losses are estimated based on income taxes associated with unemployment, using the national average
income tax rates
▪ Deadweight losses are estimated based on the marginal burden of taxation associated with additional welfare payments for individuals with T1D
▪ Breton, et al. (2013)
▪ DiabCost Australia (2009)
▪ ABS 5506 Personal income tax revenue
▪ Productivity Commission (2003)
▪ The productivity loss in time spent caring for individuals with Type 1 Diabetes, typically done by family and friends of the individual.
▪ DiabCost Australia (2009)
▪ ABS (2019), 6302 Average Earnings Australia
NOTES: (1) Some studies suggest there may be potential double-counting within productivity and wellbeing costs. Disability weights, by definition, are estimates of reduced health states and do not factor any income loss. The most conservative estimates of disability weights and value of statistical life year have been taken to ensure minimising the impact of any double counting, if any.

Format Background… > Picture or texture fill > Set to one of the dark or mid gradient options
The following methodology was used to model benefits of new treatments and technologies for T1D
Case Study:
CGMs & Pumps
Expected number of new complications/emergencies per
individual without pumps and CGMs
Expected number of new complications/emergencies per
individual with pumps and CGMs
Additional cost of complications and emergencies
Cost of pumps and CGMs
Benefit Scenario 1:
Reduction in DKA at Diagnosis
Expected lifetime cost per individual with DKA at diagnosis
Expected lifetime cost per individual without DKA at diagnosis
Benefit Scenario 2:
Delay Stage 3 T1D Diagnosis
Expected lifetime cost for individuals with T1D
Expected lifetime cost for individuals with T1D, delayed by 3 / 5 years

Format Background… > Picture or texture fill > Set to one of the dark or mid gradient options
Case Study: CGMs & Pumps
Category Approach Source
The following approaches and sources were used to model benefits of new treatments and technologies for T1D
▪ Tauschmann (2020)Emergencies Reduction
▪ The combined use of CGM’s and Pumps is tied to a reduction in emergencies (incl. diabetic ketoacidosis, hyperglycemia and hypoglycemia – requiring hospitalisation) which occur when individuals Hba1c levels reach extremities (both high and low).
▪ NDSS (2020), ‘Continuous glucose monitoring fact sheet’
▪ Medtronic (2021), ‘How much does an insulin pump cost?’Cost of Implementation
▪ In order to achieve the benefits in complication and emergency reduction, the cohort must be provided with both CGM’s and Pumps. Commercial prices have been sourced to be conservative.
Complication Incidence Reduction
▪ Reduction in complication incidences is implied with a lower average Hba1c level. Complication probability multiples are used to show the shift in complication incidence with varied Hba1c levels.
▪ Lind et al (2019), Miller et al (2018)
▪ Perth Children’s Hospital (2018)
▪ Health Facts – HbA1c; Pop-Busui (2010)
▪ ‘DCCT and EDIC Studies in Type 1 Diabetes: Lessons for Diabetic Neuropathy Regarding Metabolic Memory and Natural History’
Benefit Scenario 1: Reduction in DKA at Diagnosis
Benefit Scenario 2: Delay Stage 3 T1D Diagnosis
Reduction in lifetime costs1
▪ Reduction in DKA is based on undertaking screening & prospective follow-ups, which has been shown to significantly reduce DKA at diagnosis, as well as reducing the risk of DKA’s over the first four years since diagnosis.
▪ In addition, this reduction in DKA (both at diagnosis and over the first four years since diagnosis) have been shown to reduce future total complications each year through a lower average Hba1c level.
▪ Lifetime costs reductions are based on the avoided hospitalization costs and reduction in the future likelihood of complications
▪ Queensland Government Clinical Excellence (2020)
▪ Aampt, et al. (2019)
▪ Hekkala, et al. (2017)
▪ Hammersen, et al. (2021)
▪ Fredheim, et al. (2013)
▪ Duca, et al. (2018)
▪ Shalitin, et al. (2017)
Delay in lifetime costs1
▪ Using the cost estimations in the model, the benefits of a 3-year and 5-year delay are represented as a cost of $0 for those years, comparative to the baseline, with the rest of their life expectancy populated with the average annual cost for that age cohort.
▪ These figures are then brought back to todays terms through the present value formula. The variance between the baseline and the 3-year and 5-year delay is the total lifetime benefit achieved through the delay.
▪ Insel, et al. (2015)
▪ JDRF, (2020)
▪ AIHW (2019)
▪ Vision 2020 Australia (2010)
▪ Diabetes Australia
Cost of complications and emergencies1
▪ Costs of complications have been modelled based on the lifetime health costs of the range of complications associated with T1D and weighted based on the prevalence.
▪ Costs of emergencies (DKA and Severe Hypoglycemia) are based on the costs of hospitalisation.
NOTES: (1) Lifetime costs have been modelled as a present value over the expected remaining life of individuals at a discountrate of 3%. This is the standard rate used for health economic analysis.