economic data collection program catcher vessel report ... · economic data collection program...
TRANSCRIPT

Economic Data Collection Program
Catcher Vessel Report (2009-2015)
Erin Steiner, Marie Guldin, Amanda Warlick, Lisa Pfeiffer
National Marine Fisheries Service
Northwest Fisheries Science Center1
June 2, 2017
1 For questions or comments, please contact the EDC Program at [email protected].

CATCHER VESSELS
2015
Economic Data Collection (EDC)West Coast Ground�sh TrawlCatch Share Program
Astoria: $17.4M 33 vessels
SHORESIDE PARTICIPATIONTotal value of catch share ground�sh landings
Vessel ports
Brookings
Coos Bay
Crescent City
Eureka
Fort Bragg
Monterey
Morro Bay
Newport: $8.0M 21 vessels
South & central Washington, Puget Sound: $4.2M
13 vessels
San Francisco:
ALASKA PARTICIPATION
Alaska: $39.7M25 vessels
$7.0M16 vessels
AT-SEA PARTICIPATION
At-sea: $5.4M14 vessels
Santa Barbara
$3.9M18 vessels
$2.0M12 vessels
69 ft average length29% are < 60 ft 42% are 60-80 ft 29% are > 80 ft
Fuel useGround�sh trawl: 302 gal/dayPaci�c whiting: 816 gal/dayVessel fuel capacity: 13.9K galTotal fuel cost: $52.3K
Engine: 713 hp Vessel market value: $1.5MReplacement value: $3.1M
Captain compensation: $69.8K31% of vessels owner operated
at least some of the time
Crew size: 2.6Crew member compensation: $42.8K
AvgDays
at Sea
42.4 54.4 12.5 35.2 25.3
31.7
26.8
28.8 70.3 23.1123.7
At-sea Paci�c whitingShoreside Paci�c whiting
Non-whiting midwaterDTS trawl (with trawl endorsement)
Non-whiting, non-DTS trawl (with trawl endorsement)
Ground�sh �xed gear (with trawl endorsement)
Ground�sh �xed gear (with �xed gear endorsement)
CrabShrimp
Other �sheriesAlaska
ECONOMIC SUMMARY*
Vessel Average$485.9K revenue$304.9K variable costs$181.0K variable cost net revenue$132.1K �xed costs$48.9K total cost net revenue
$5.5K variable cost net revenue per day
Fleet-wide Totals97 vessels$47.1M revenue$17.6M variable cost net revenue$4.7M total cost net revenue
FISHERY PARTICIPATION
CATCH SHARE FISHERIES
Vessels
1422135146
18
10
52471925
Total Landings(1000s mt)
27.9 57.3 2.0 10.6 5.4
0.9
0.4
0.3 18.3 0.2112.5
Observer cost: $17.5K Food cost: $3.4K
*Note that some off-board costs are not collected. Therefore reported net revenue is an overestimate of actual net revenue.
AVERAGE VESSEL IN CATCH SHARE FISHERIES
www.nwfsc.noaa.gov/edc/reports
1% Multiple gears
12% Pot only5% Longline only
82% Trawl only
Catcher Vessel Sector: 2015 Highlights
In 2015, the fifth year of the catch share program, there were 97 catcher vessels that participated in the West
Coast groundfish trawl catch share program (catch share program).
• Catcher vessels generated $62.9 million in income and 825 jobs from deliveries of fish caught in the catch
share program.
• Catcher vessels spent an average of 58 days fishing in the catch share program and spent an average of 77
additional days fishing in non-catch share fisheries, including fishing in Alaska.
• West Coast catcher vessels deliver to ports in Washington, Oregon, California, and to mothership at-sea; the
two ports with the highest landings in 2015 were Astoria and Newport, both in Oregon.
• An average of 2.6 crew members worked aboard each West Coast catcher vessel, each earning an average
compensation of $42,800.
• In 2015, 31% of vessels were owner-operated at least part of the year.
• The average ex-vessel revenue per vessel from participation in the catch share program was $486,000.
• Average catch shares variable cost net revenue (ex-vessel revenue minus variable costs) per vessel was
$181,000, and the fleet-wide variable cost net revenue was $17.6 million.
• Average total cost net revenue (ex-vessel revenue minus variable costs and fixed costs) per vessel was $48,900
and the fleet-wide total cost net revenue was $4.74 million.
• Between 2011 and 2015, average variable cost net revenue was between 2.0% and 21.3% lower when quota
costs and earnings were included.
Infographic created by Su Kim, Scientific Communications Office, Northwest Fisheries Science Center.
2

Report Contents
Catcher Vessel Sector: 2015 Highlights 2
Acknowledgments 5
Report Introduction 6
Overview 8
Report 40
List of Tables 43
List of Figures 47
1 Catcher Vessel Data Summaries 51
1 Introduction . . . . . . . . . . . . . . . . . . . . . . . . . . . . . . . . . . . . . . . . . . . . . . 51
2 Survey Response Rates . . . . . . . . . . . . . . . . . . . . . . . . . . . . . . . . . . . . . . . . 55
3 Vessel Participation on the West Coast and in Alaska . . . . . . . . . . . . . . . . . . . . . . . . 57
4 Home Port . . . . . . . . . . . . . . . . . . . . . . . . . . . . . . . . . . . . . . . . . . . . . . . 61
5 Vessel Physical Characteristics . . . . . . . . . . . . . . . . . . . . . . . . . . . . . . . . . . . . 73
6 Vessel Fuel Use, Speed, and Crew Size . . . . . . . . . . . . . . . . . . . . . . . . . . . . . . . . 81
7 At-Sea Deliveries and Shoreside Landings . . . . . . . . . . . . . . . . . . . . . . . . . . . . . . 100
8 Revenues . . . . . . . . . . . . . . . . . . . . . . . . . . . . . . . . . . . . . . . . . . . . . . . . 104
9 Costs . . . . . . . . . . . . . . . . . . . . . . . . . . . . . . . . . . . . . . . . . . . . . . . . . . 107
10 Crew Share System . . . . . . . . . . . . . . . . . . . . . . . . . . . . . . . . . . . . . . . . . . 114
3

2 Catcher Vessel Data Analysis 116
11 Days at Sea by Fishery . . . . . . . . . . . . . . . . . . . . . . . . . . . . . . . . . . . . . . . . 116
12 Cost Disaggregation . . . . . . . . . . . . . . . . . . . . . . . . . . . . . . . . . . . . . . . . . . 128
13 Net Economic Benefits . . . . . . . . . . . . . . . . . . . . . . . . . . . . . . . . . . . . . . . . 131
14 Economic Performance: Cost, Revenue, and Net Revenue Rates . . . . . . . . . . . . . . . . . . 171
Appendix 179
A Cost Disaggregation 179
4 CATCHER VESSEL REPORT
Acknowledgments
The Economic Data Collection (EDC) Program and EDC Reports reflect collaboration and coordination of
individuals across the West Coast. There are numerous people to thank for their contributions to this effort.
We would like to acknowledge the efforts of all the Northwest Fisheries Science Center (NWFSC) economists and
NWFSC Fishery Resource Analysis and Monitoring Data Team who provided a wide range of input into survey
design, implementation, analysis, and technical support. The group worked together in an effort to distribute high
quality data in a timely fashion. A special thanks to Todd Lee, Abigail Harley, and Lily Hsueh for assistance in the
development of these reports. We thank Su Kim of the NWFSC Scientific Communications Office for producing
the infographics in these reports.
We appreciate the efforts of the Northwest Regional Office for support in the EDC Program development, outreach,
and communication efforts. The Permit Office staff was particularly instrumental in ensuring compliance with the
mandatory participation requirements.
The Northwest Division of the Office of Law Enforcement (OLE) and the National Oceanic and Atmospheric
Administration (NOAA) Office of General Council helped extensively with many aspects of the EDC Program
development and enforcement. They continue to collaborate with the EDC Program to ensure compliance. We
thank the NWFSC Scientific Data Management staff for building the administrative tracking system and database,
and the NWFSC Fishery Resource Analysis and Monitoring Data Team for continued support.
We thank PacFIN and AKFIN staff for providing access to important landings, permit, and vessel data. The staff
at ODFW, WDFW, and CDFW also contributed with data used for the fielding of the baseline data collection.
Other data and assistance with data interpretation were provided by the At-sea Hake Observer Program and the
West Coast Observer Program.
We thank the Pacific Fishery Management Council and advisory bodies for their valuable comments on the EDC
reports and data.
Finally, we thank the members of the West Coast fishing industry who met with us to discuss the development
and implementation of data collection processes. We appreciate the time and effort of each participant that will
continue to help improve the program in the coming years.
5 CATCHER VESSEL REPORT

Report Introduction
About the Report
The US West Coast groundfish fishery takes place off the coasts of Washington, Oregon and California, and
comprises over 90 different species of fish. Fish are harvested both commercially and recreationally. The commercial
fishery has four components: limited entry with a trawl endorsement, limited entry with a fixed gear endorsement,
open access, and tribal. In January 2011, the West Coast Limited Entry Groundfish Trawl fishery transitioned to
the West Coast Groundfish Trawl Catch Share Program. The catch share program consists of cooperatives for
the at-sea mothership (including catcher vessels and motherships) and catcher-processor fleets, and an individual
fishing quota (IFQ) program for the shorebased trawl fleet.1
The Economic Data Collection (EDC) Program is a mandatory component of the West Coast Groundfish Trawl
Catch Share Program, collecting information annually from all catch share participants: catcher-processors, catcher
vessels, motherships, first receivers, and shorebased processors. The EDC information is used to monitor the
economic effects of the catch share program, and consists of data on operating costs, revenues, and vessel and
processing facility characteristics.
This report summarizes information collected from the West Coast catcher vessel fleet. The EDC reports are also
produced for the other sectors, and currently cover the years 2009 to 2015. The 2009 and 2010 data were collected
in 2011 to provide a baseline of pre-catch share information. There is a one-year lag in collecting the EDC data to
allow companies to close their accounting books. Thus, 2015 data were collected from May to September 2016.
The EDC reports are updated annually to disseminate the data and contextualize its interpretation. The reports
also serve as a catalyst for feedback on the data collected and its analysis. The scope of these reports continues to
expand and the methods are refined with each publication.
The report is composed of three major sections. The first section, Catcher Vessel Overview (beginning on page
8), is an in-depth summary that contains descriptive analyses focusing on activities during 2015. The second
section, Catcher Vessel Data Summaries (beginning on page 51), provides tables of all of the data collected from
2009 to 2015, with a detailed discussion of the methods used to summarize the data. The third section, Catcher
Vessel Data Analysis (beginning on page 116), contains information about cost disaggregation and calculations of
net revenue and economic performance. The data that form the basis for this report are confidential and must
be aggregated or not shown so that individual responses are protected. More information about EDC Program
administration, the EDC forms, data quality controls, data processing, and safeguarding confidential information
can be found in the EDC Administration and Operations Report.2
Background - Economic Data Collection and West Coast Groundfish Trawl Catch Share
Program
The economic benefits of the West Coast groundfish trawl fishery and the distribution of these benefits were
expected to change under the West Coast groundfish trawl catch share program. To monitor these changes,
the Pacific Fishery Management Council (PFMC) proposed the implementation of the mandatory collection of
1 Information about the Catch Share Program is available at http://www.westcoast.fisheries.noaa.gov/fisheries/groundfish_catch_
shares/.
2 Economic Data Collection Program, Administration and Operations Report available at: http://www.nwfsc.noaa.gov/edc.
6 CATCHER VESSEL REPORT

economic data. Using data collected from industry participants, the EDC Program monitors whether the goals of
the catch share program have been met.
Many of the PFMC’s goals for the catch share program are economic in nature. These goals include: provide for a
viable, profitable, and efficient groundfish fishery; increase operational flexibility; minimize adverse effects from an
IFQ program on fishing communities and other fisheries to the extent practical; promote measurable economic and
employment benefits through the harvesting, processing, distribution, and support sectors of the industry; provide
quality product for the consumer; and, increase safety in the fishery.
The EDC Program is also intended to help meet the Magnuson-Stevens Fishery Conservation and Management
Act (MSA) requirement to determine whether a catch share program is meeting its goals, and whether there are
any necessary modifications of the program to meet those goals. The data submitted to and analyzed by the
EDC Program will be fundamental to the formal 5-year review of the catch share program required under the
MSA.
Monitoring the economic effects of a catch share program requires a variety of economic data and analyses. The
primary effects of a catch share program can be captured in two broad types of economic analysis: 1) economic
performance measures, and 2) regional economic impact analysis. Both of these require information on the costs
and earnings of harvesters and processors.
Economic performance measures include: costs, earnings, and profitability (net revenue); economic efficiency;
capacity measures; economic stability; net benefits to society; distribution of net benefits; product quality;
functioning of the quota market; incentives to reduce bycatch; market power; and, spillover effects in other fisheries.
Some of these measures are presented in this report, while others would require more specific and involved analysis
using EDC data.
Regional economic impact analysis measures the effects of the program on regional economies. The catch share
program will likely affect different regional economies in different ways. Regional economic modeling involves
tracking the expenditures of all businesses, households, and institutions within a given geographic region to arrive
at the effects on income and employment. On the West Coast, the Northwest Fishery Science Center’s IO-PAC
model3 is used to estimate regional economic impacts using data from both the EDC survey forms and the voluntary
cost earnings survey as model inputs.4
3 Leonard, J., and P. Watson. 2011. Description of the input-output model for Pacific Coast fisheries. U.S. Dept. Commer., NOAA
Tech. Memo. NMFS-NWFSC-111, 64 p.
4 For more information on cost earnings survey data collection process, see the Administration and Operations Report Draft Report
(May 2016).
7 CATCHER VESSEL REPORT

OVERVIEW
Management context
In January 2011, the West Coast limited entry groundfish trawl fishery transitioned to the West Coast Groundfish
Trawl Catch Share Program. The catch share program consists of cooperatives for the at-sea mothership (including
catcher vessels and motherships) and catcher-processor fleets, and an individual fishing quota (IFQ) program for
the shorebased trawl fleet. The vessels participating in the IFQ program deliver shoreside to buyers and processors
with first receiver site licenses and at-sea vessels deliver to mothership vessels.
Federal buybackprogram
IFQprogram
0
50
100
150
200
2000
2001
2002
2003
2004
2005
2006
2007
2008
2009
2010
2011
2012
2013
2014
2015
Num
ber
of v
esse
ls
Figure 1: Number of catcher vessels participating in the At-sea and
Shoreside limited entry trawl groundfish fisheries (2000-2010) and the
number of vessels participating in the West Coast Groundfish Trawl Catch
Share Program (2011-2015).
The PFMC and the National Marine
Fisheries Service (NMFS) are responsible
for managing the West Coast Groundfish
Trawl fishery. The Pacific Coast Groundfish
Fishery Management Plan contains the
current rules for managing the fishery,
and its amendments give a history of
the changes that have occurred. One
major milestone was the limited entry
(license limitation) program, which was
established in 1994 and intended to address
over-capitalization and restrict further entry
into the groundfish fishery. In 2003, there
was an industry-funded buyback program,
designed to further decrease overcapacity
in the fishery.1 The result of the buyback
program was a decrease in the number of
active vessels from 213 in 2003 to 134 in
2004 (Figure 1). The number of vessels
participating in the limited entry trawl
fishery ranged from 129 to 143 between
2004 (post-buyback program) and 2010 (pre-catch share program). In 2011, the first year of the catch share
program, the number decreased to 113, with the lowest number of vessels to date in 2015 (97 vessels).
The NMFS has mandatory rebuilding plans that limit bycatch for species that are designated “overfished.” There
are two rockfish species that remain designated as overfished as of 2015: Pacific ocean perch and darkblotched
rockfish. In 2011, widow rockfish was taken off the overfished list.2 As a result, the annual catch limit (ACL) for
widow rockfish was raised starting in 2013.
1 68 FR 42613, available at www.federalregister.gov/articles/2003/07/18/03-18344/magnuson-stevens-act-provisions-fishing-
capacity-reduction-program-pacific-coast-groundfish-fishery.
2 NMFS 2011. Status of the widow rockfish resource in 2011: http://www.pcouncil.org/wp-content/uploads/Widow_2011_
Assessment.pdf.
8

Prior to 2011, the fishery was managed with a system that included trip and landings limits, area restrictions,
seasonal closures, and gear restrictions. Many of these measures were developed to assist in the rebuilding of seven
species that are caught as targets or bycatch in the groundfish fishery and were declared overfished by 2003. The
catch share program was designed to alleviate the restrictive, inflexible nature of trip and landings limits, which
limited the landings of groundfish species by two-month periods. Landings limits tend to encourage discarding,
which can be detrimental to the rebuilding of overfished species. Under the catch share program, vessels holding a
limited entry trawl permit were allocated individual quota shares.
$0.00
$0.50
$1.00
2011 2012 2013 2014 2015Year
Ave
rage
quo
ta p
rice
(201
5 $)
SpeciesSablefish NorthPetrale soleSablefish SouthWidow rockfishYellowtail rockfishPacific whiting
Number of trades2040
60
(a) Quota prices for IFQ target species.
$0.00
$0.50
$1.00
$1.50
$2.00
$2.50
$3.00
2011 2012 2013 2014 2015Year
Ave
rage
quo
ta p
rice
(201
5 $)
SpeciesCanary rockfishPacific halibutPacific ocean perchDarkblotched rockfish
Number of trades1020
(b) Quota prices for IFQ bycatch species.
Figure 2: Quota prices for IFQ target and bycatch
species with the highest number of transactions per year.
The size of the circle represents the number of trades
included in the price calculation.
Quota shares were allocated for 30 different groundfish
species and rockfish complexes to permit owners based on
their historical participation.3 Annually, the quota shares
are converted into quota pounds, which are then used by
vessels to harvest fish within the catch share program. The
quota shares and quota pounds are transferable through lease
arrangements and sale, and are infinitely divisible.4 The catch
share program allows vessels to catch their quota at any time
during the season. One hundred percent at-sea observer
coverage – another feature of the program – ensures that all
catch, including discards, is counted against a vessel’s quota
pounds.
Just as all quota for target species are allocated to individuals,
so are quota for the overfished species. If an individual is
unable to cover catch of overfished species with their existing
quota, they are prohibited from fishing. In response to the
consequences related to catching a species without available
quota, some vessels have formed risk pools. The risk pools
minimize the risk of needing to prematurely end the fishing
season by pooling quota of overfished species with other quota
owners. The participants in some risk pools are contractually
obligated to follow a set of fishing guidelines, and if the
guidelines are followed, any catch of overfished species is
covered by the pooled quota and the individual can continue
fishing.
Within the catch share program, there are various ways that
quota pounds can be traded. The types of trades most
frequently recorded are self-trades, other, cash sales, and
barter. The “other” category includes cases such as transfers
involving risk pools and arrangements where there is no
predetermined price, but instead the payment is a percentage of the ex-vessel value of the landed fish. Barter
transactions generally refer to a “quota for quota” trade, where individuals trade quota they do not plan to fish
themselves. In 2015, petrale sole quota was traded the most frequently ($0.35 per pound), followed by northern
sablefish quota (North of 36 ° N) ($1.11), widow rockfish ($0.15), and southern sablefish quota (South of 36 ° N)
3 Additional information on the regulations, including the Federal Register notice, can be found at the West Coast Region website:
www.westcoast.fisheries.noaa.gov/fisheries/groundfish_catch_shares/.
4 There was a moratorium on transfers of quota share percentages (permanent transfers of allocation) until January 1, 2015.
OVERVIEW 9 CATCHER VESSEL REPORT
($0.18)(Figure 2a). The price paid for southern sablefish quota (South of 36 ° N) was only 16% of the price for the
northern quota. There were 2.3 times more trades for southern sablefish in 2015 compared to 2014, the highest
number of trades since 2011. There were no single species trades for whiting quota in 2015.5
At−seaPacific whiting
ShoresidePacific whiting
$0.00
$0.05
$0.10
$0.15
Pric
e (2
015
$/lb
)
2010
2012
2014
2010
2012
2014
0
100
200
Land
ings
and
unh
arve
sted
sec
tor
allo
catio
n (m
illio
ns o
f lbs
)
Unharvested
Catch
At−seaPacific whiting
ShoresidePacific whiting
$0.00
$0.05
$0.10
$0.15
Pric
e (2
015
$/lb
)
2010
2012
2014
2010
2012
2014
0
100
200
Land
ings
and
unh
arve
sted
sec
tor
allo
catio
n (m
illio
ns o
f lbs
)
Unharvested
Catch
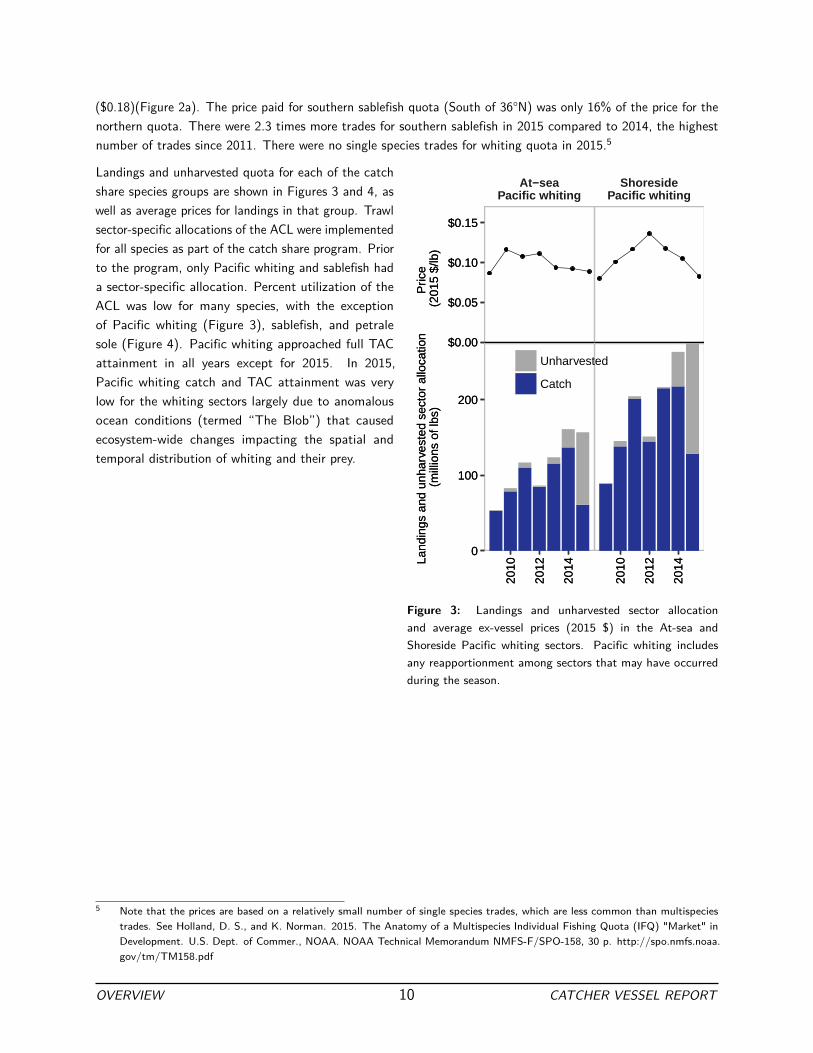
Figure 3: Landings and unharvested sector allocation
and average ex-vessel prices (2015 $) in the At-sea and
Shoreside Pacific whiting sectors. Pacific whiting includes
any reapportionment among sectors that may have occurred
during the season.
Landings and unharvested quota for each of the catch
share species groups are shown in Figures 3 and 4, as
well as average prices for landings in that group. Trawl
sector-specific allocations of the ACL were implemented
for all species as part of the catch share program. Prior
to the program, only Pacific whiting and sablefish had
a sector-specific allocation. Percent utilization of the
ACL was low for many species, with the exception
of Pacific whiting (Figure 3), sablefish, and petrale
sole (Figure 4). Pacific whiting approached full TAC
attainment in all years except for 2015. In 2015,
Pacific whiting catch and TAC attainment was very
low for the whiting sectors largely due to anomalous
ocean conditions (termed “The Blob”) that caused
ecosystem-wide changes impacting the spatial and
temporal distribution of whiting and their prey.
5 Note that the prices are based on a relatively small number of single species trades, which are less common than multispecies
trades. See Holland, D. S., and K. Norman. 2015. The Anatomy of a Multispecies Individual Fishing Quota (IFQ) "Market" in
Development. U.S. Dept. of Commer., NOAA. NOAA Technical Memorandum NMFS-F/SPO-158, 30 p. http://spo.nmfs.noaa.
gov/tm/TM158.pdf
OVERVIEW 10 CATCHER VESSEL REPORT

0.0
2.5
5.0
7.5
10.0
0
25
50
75
100
Sablefish North Sablefish South Thornyheads Petrale sole
Dover sole Arrowtooth flounder All other flatfish All other fish
2010
2012
2014
2010
2012
2014
2010
2012
2014
2010
2012
2014
2010
2012
2014
2010
2012
2014
2010
2012
2014
2010
2012
2014
Unharvested
Unharvested (Est)
Discards
Landings
Land
ings
, dis
card
s, a
nd u
nhar
vest
ed s
ecto
r al
loca
tion
(mill
ions
of l
bs)
Figure 4: Landings (dark blue), Discards (light blue), and Unharvested (grey) trawl sector allocation of non-whiting
groundfish species (millions of lbs). If carryover was made available for a specific quota category, the total weight
was deducted from the original year and added to the following year (2011-2015). Except for sablefish, there was no
trawl-specific quota in 2009 and 2010; for context, Unharvested (Est) (light grey) was calculated for 2009 and 2010 as
Optimal Yield ×
2011 Trawl Sector Allocation
2011 Annual Catch Limit
− Landings − Discards by stock or complex.
OVERVIEW 11 CATCHER VESSEL REPORT

Catcher Vessel Sector Description
In 2015, the fifth year of the catch share program, there were 97 catcher vessels that participated in the program.
These include both catcher vessels that deliver shoreside and those that deliver to at-sea motherships.6 Catcher
vessels generated $62.9 million in income and 825 jobs from deliveries of fish caught in the catch share program.7
These vessels caught about 61% of all catch share fish (the catcher-processor sector caught the remainder) and
31% of all fish caught commercially on the West Coast.
The catcher vessels that fished in 2015 ranged from 44 feet to 141 feet in length and employed between one
and four crew members. The total fleet-wide number of days spent fishing in the limited entry groundfish trawl
fishery has decreased from 9,000 during the pre-catch share period (2009-2010) to 5,480 in 2015. There were 60
vessels that fished in 2009 and/or 2010 that did not fish in 2015. Of those vessels, 20 stopped fishing on the West
Coast completely, and 40 continued fishing in other fisheries (e.g., shrimp, crab, tuna, and California halibut).
Despite the exit of some vessels from the catch share program, there were 17 vessels that fished in 2015 but did
not fish in the trawl fishery in 2009 or 2010. Of those “new” vessels, 13 fish in the Groundfish fixed gear with
trawl endorsement fishery.
The two ports with the highest catch share landings in 2015 were Astoria and Newport, Oregon (Table 1). Astoria
received 74.5 million pounds of catch share fish, worth $17.4 million and Newport received 45.9 million pounds,
worth $8 million. All Washington ports combined, received 35 million pounds, worth $4.2 million. All of the
California ports combined received 10.3 million pounds, worth $9 million. Fourteen vessels delivered 61 million
pounds of fish to at-sea motherships, worth $5.4 million. Compared to 2014, the deliveries in the at-sea whiting
fishery and deliveries to Washington ports decreased the most, as a result of low whiting catches. Southern Oregon
and Northern California actually saw slight increases in 2015 compared to 2014.
Table 1: Deliveries by port area. Total ex-vessel revenue, landings weight, and number of vessels delivering to each port
area for all catch share fisheries in 2015. Some vessels make deliveries in multiple ports, and each vessel is counted in every
port where catch is delivered. Delivery port areas by fishery are not shown to protect confidential information.
Revenue
(millions of $)
Landings
(millions of lbs)
Number of
vessels
At-sea 5.4 60.9 14
Washington state 4.2 35.0 13
Astoria, Oregon 17.4 74.5 33
Newport, Oregon 8.0 45.9 21
Southern Oregon 3.9 5.0 18
Northern California 7.0 8.9 16
Santa Barbara, Morro Bay, Monterey, San Francisco, CA 2.0 1.4 12
6 Vessels can participate in both the shoreside and at-sea fisheries.
7 Note that these impacts do not include the complementary impacts associated with the shorebased buyers and processors, nor the
mothership vessels. Leonard, J., and P. Watson. 2011. Description of the input-output model for Pacific Coast fisheries. U.S.
Dept. Commer., NOAA Tech. Memo. NMFS-NWFSC-111, 64 p.
OVERVIEW 12 CATCHER VESSEL REPORT

Fishery Participation
For the purposes of this report, the catch share program is divided into the following six fisheries:
• At-sea Pacific whiting fishery
• Shoreside Pacific whiting fishery
• Non-whiting midwater trawl fishery8
• Dover sole, thornyheads, and sablefish (DTS) trawl with trawl endorsement fishery
• Non-whiting, non-DTS trawl with trawl endorsement fishery
• Groundfish fixed gear with trawl endorsement fishery
Most vessels participate in more than one of these fisheries. In addition to the catch share fisheries, most vessels
also fish in Alaska or participate in state-managed fisheries (primarily shrimp and crab). A few vessels participate
in other federally managed fisheries including the Groundfish fixed gear with fixed gear endorsement, salmon, and
tuna fisheries. Participation in these other fisheries is more common for the shoreside non-whiting vessels, while
fishing in Alaska is more common for the At-sea and Shoreside Pacific whiting vessels. The Groundfish fixed gear
with trawl endorsement fishery is the result of a “gear switching” provision that allows either for vessels with trawl
quota to fish with fixed gear (pots or longlines) or for vessels that traditionally fished with fixed gear to lease or
purchase trawl quota and fish with fixed gear. Fixed gear is primarily used to target sablefish. The At-sea and
Shoreside Pacific whiting fisheries are the highest volume fisheries.
Regulations prohibit fishing with midwater trawl gear prior to May 1. The At-sea and Shoreside Pacific whiting
fisheries occur between late May and October (Figure 5). The DTS trawl and Non-whiting non-DTS trawl fisheries
occur year-round. Vessels that fish with both trawl permits and fixed gear permits tend to use the fixed gear permits
during the Primary sablefish fishery (one component of the Groundfish fixed gear with fixed gear endorsement
fishery) from April 1 through October 31, and then transfer a trawl permit onto their boat once they have finished
fishing in that fishery. The opening of the crab season varies by state based on pre-season crab condition testing,
but generally begins in December or January and lasts until March. The 2015/2016 crab season was declared a
commercial fishery failure in California, as a result of "a massive and persistent toxic algal bloom of phytoplankton
caused Dungeness crab [...] to accumulate dangerous level of domoic acid".9 Shrimp is caught between April and
October. Salmon, halibut, and tuna are caught in much lower volumes throughout the year and are not shown in
the figure.
8 In 2011, widow rockfish, one of the two main targets in the non-whiting midwater trawl fishery (the other is yellowtail rockfish),
was taken off the overfished list. As a result, the annual catch limit for widow rockfish was increased in the 2013/2014 Biennial
Harvest Specification. Vessels only began targeting widow in 2012.
9 Disaster determination letter for California Dungeness Crab and Rock Crab, 2015-2016. http://www.fisheries.noaa.gov/sfa/
management/disaster/determinations/67_ca_crab/request.pdf
OVERVIEW 13 CATCHER VESSEL REPORT

At−sea Pacific whiting
Shoreside Pacific whiting
Non−whiting midwater trawl
DTS trawl with trawl endorsement
Non−whiting, non−DTS trawl with trawl endorsement
Groundfish fixed gear with trawl endorsement
Crab
Shrimp
testtest
30.2M lbs●
12M lbs●
1.2M lbs●
1.4M lbs●
0.5M lbs●
0.2M lbs●
0.2M lbs●
2.1M lbs●
Mar Jun Sep Dectesttest
0 5 10 15 20Total revenue (millions of $)
Figure 5: Landings by fishery and week (y-axis varies across fisheries) (left) and total ex-vessel revenue (millions of $)
(right) in each fishery in 2015. Red points represent highest landing (millions of pounds) by fishery. Data are not shown for
weeks where there were less than three vessels fishing or if one vessel represented more than 90% of landings weight or
revenue.
Economic Indicators
The EDC Program tracks economic indicators by compiling information submitted by participants about expenses
and revenue and how those figures change over time. Pre-catch share data for the 2009 and 2010 operating
years were submitted in 2011 and have been averaged to calculate “baseline” conditions within the fishery to
which subsequent years of data can be compared. Values reported in the Overview are inflation-adjusted 2015
dollars.
The EDC Program measures the net economic benefits of the catch share program by reporting two types of net
revenue. The first is variable cost net revenue, which is revenue minus variable costs. The second is total cost net
revenue, which is revenue minus both variable and fixed costs.10 To provide a complete picture of the changes
that have occurred, both net revenue figures are presented at two scales: Average net revenue (Figure 6) is the
value generated by a typical vessel, while fleet-wide net revenue (Figure 7) represents the total value generated by
the fishery. Both figures only include revenues and costs associated with the catch share program. It is important
to note that the EDC forms only capture costs that are directly related to vessel fishing operations, and do not
include other expenses such as vehicles or office expenses that may be related to the fishing business. Therefore,
the net revenue reported here is an overestimate of the true net revenue.11
10 See Figure 9 for a description of which costs are considered variable costs and which costs are considered fixed costs.
11 See Section 13 of the Data Summaries for more information.
OVERVIEW 14 CATCHER VESSEL REPORT
Average Net Revenue
Variable cost net revenue Total cost net revenue
2009
2010
2011
2012
2013
2014
2015
2009
2010
2011
2012
2013
2014
2015
0
200
400
600
Ave
rage
cat
ch s
hare
s (t
hous
ands
of 2
015
$)
Variable costsVariable cost net revenue
Fixed costsTotal cost net revenue
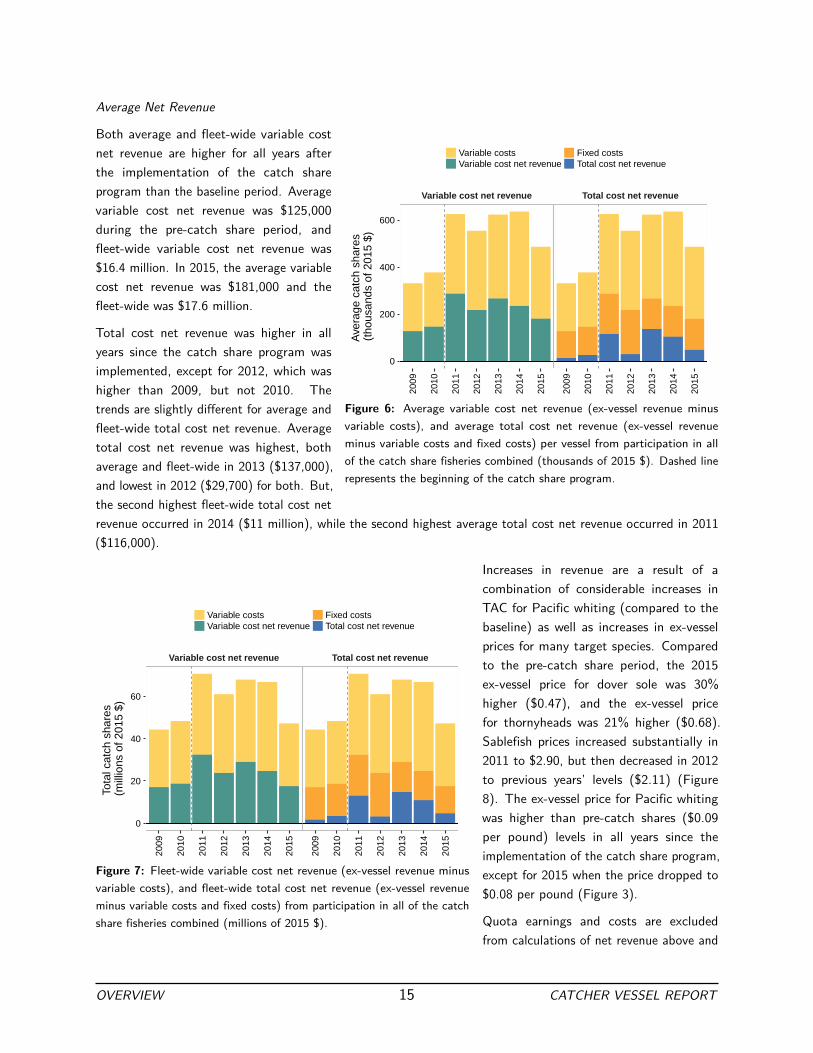
Figure 6: Average variable cost net revenue (ex-vessel revenue minus
variable costs), and average total cost net revenue (ex-vessel revenue
minus variable costs and fixed costs) per vessel from participation in all
of the catch share fisheries combined (thousands of 2015 $). Dashed line
represents the beginning of the catch share program.
Both average and fleet-wide variable cost
net revenue are higher for all years after
the implementation of the catch share
program than the baseline period. Average
variable cost net revenue was $125,000
during the pre-catch share period, and
fleet-wide variable cost net revenue was
$16.4 million. In 2015, the average variable
cost net revenue was $181,000 and the
fleet-wide was $17.6 million.
Total cost net revenue was higher in all
years since the catch share program was
implemented, except for 2012, which was
higher than 2009, but not 2010. The
trends are slightly different for average and
fleet-wide total cost net revenue. Average
total cost net revenue was highest, both
average and fleet-wide in 2013 ($137,000),
and lowest in 2012 ($29,700) for both. But,
the second highest fleet-wide total cost net
revenue occurred in 2014 ($11 million), while the second highest average total cost net revenue occurred in 2011
($116,000).
Variable cost net revenue Total cost net revenue
2009
2010
2011
2012
2013
2014
2015
2009
2010
2011
2012
2013
2014
2015
0
20
40
60
Tota
l cat
ch s
hare
s (m
illio
ns o
f 201
5 $)
Variable costsVariable cost net revenue
Fixed costsTotal cost net revenue
Figure 7: Fleet-wide variable cost net revenue (ex-vessel revenue minus
variable costs), and fleet-wide total cost net revenue (ex-vessel revenue
minus variable costs and fixed costs) from participation in all of the catch
share fisheries combined (millions of 2015 $).
Increases in revenue are a result of a
combination of considerable increases in
TAC for Pacific whiting (compared to the
baseline) as well as increases in ex-vessel
prices for many target species. Compared
to the pre-catch share period, the 2015
ex-vessel price for dover sole was 30%
higher ($0.47), and the ex-vessel price
for thornyheads was 21% higher ($0.68).
Sablefish prices increased substantially in
2011 to $2.90, but then decreased in 2012
to previous years’ levels ($2.11) (Figure
8). The ex-vessel price for Pacific whiting
was higher than pre-catch shares ($0.09
per pound) levels in all years since the
implementation of the catch share program,
except for 2015 when the price dropped to
$0.08 per pound (Figure 3).
Quota earnings and costs are excluded
from calculations of net revenue above and
OVERVIEW 15 CATCHER VESSEL REPORT

throughout this report for reasons related
to both economic theory and data limitations. Leasing costs should not be included in calculations of net benefits
because leasing constitutes a rent transfer of which there is no opportunity cost outside of the fishery. The data
available do not allow for the allocation of costs to a specific fishery or calendar year (from the fiscal year reported
on the EDC form); and quota lease revenue is not collected from quota share owners not involved with an actively
participating vessel. Additionally, many quota trades are non-cash transactions and therefore cannot be included
in the calculations. Despite these limitations, net revenue including quota was calculated to examine how these
additional earnings and costs affect average operational performance measures currently reported. For all catch
shares, the variable cost net revenue when quota was included was between 2.2% and 21.3% less than the variable
cost net revenue when it was not included. For whiting vessels, the difference in variable cost net revenue when
including quota versus not including quota was largest in 2015 (10% less), and for groundfish vessels, the difference
was highest in 2015 (29% less). Including quota lease earnings increased the average revenue for all catch share
participation by fiscal year between 2.3% and 6.5% than the ex-vessel revenue alone over the time period 2011 to
2015.12
$0
$1
$2
$3
1995 2000 2005 2010 2015
Pric
e (2
015
$/lb
)
SablefishPetrale soleYellowtail rockfish
Widow rockfishDover soleArrowtooth flounder
Figure 8: Ex-vessel prices (2015 $) for top species from 1994
to 2015.
Average Costs
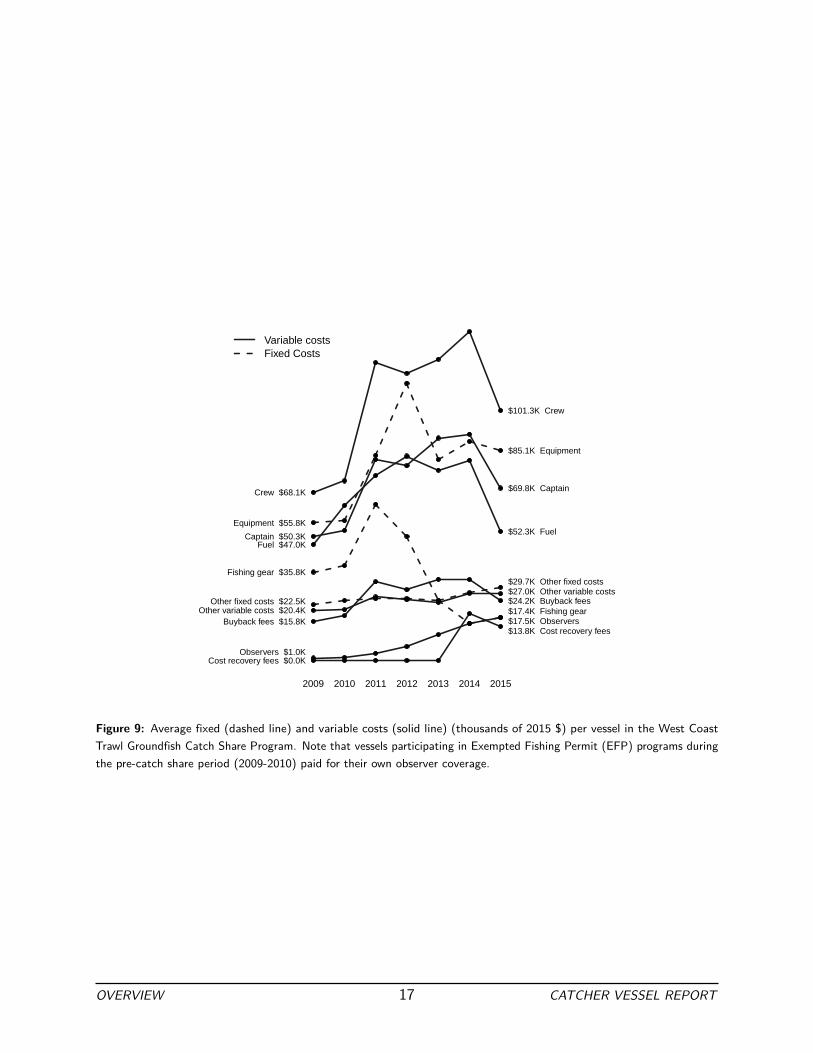
In all years (2009-2015), the highest variable cost
categories were crew and captain compensation and
fuel (Figure 9). The highest fixed costs were vessel
and on-board equipment. Fixed costs do not vary
as directly with the level of fish harvest as much as
variable costs. Costs per vessel have increased for nearly
all cost categories, with the largest increases coming
from equipment, captain and crew compensation, and
fuel. Fleet-wide fixed costs were highest in 2011 and
2012, at $19.4 million and $20.6 million, but have since
decreased to below pre-catch share levels. The lowest
total fixed costs occurred in 2015 ($12.8 million) as
a result of a decrease in fleet size. In addition to the
costs we have defined as variable and fixed, 64 vessels spent an average of $61,800 on the purchase or lease of
quota in 2015, slightly less than the average cost in 2014 ($63,400).
As with net revenue, costs in 2015 differ from the other four years of the catch share program. Average crew
and captain wages both decreased 24% between 2014 and 2015 as a result of decreased net revenue across the
catch share program. There was also a decrease in fuel costs (36%) between 2014 and 2015 as a result of a 13%
decrease in the number of days fishing as well as a slight decrease in fuel prices. Cost recovery fees were lower in
2015 than 2014 because of the lower ex-vessel revenue.
12 Transactions from purchase or sale of quota shares are not included because there are too few observations.
OVERVIEW 16 CATCHER VESSEL REPORT
Buyback fees $15.8K
Captain $50.3K
Cost recovery fees $0.0K
Crew $68.1K
Equipment $55.8K
Fishing gear $35.8K
Fuel $47.0K
Observers $1.0K
Other fixed costs $22.5KOther variable costs $20.4K
$24.2K Buyback fees
$69.8K Captain
$13.8K Cost recovery fees
$101.3K Crew
$85.1K Equipment
$17.4K Fishing gear
$52.3K Fuel
$17.5K Observers
$29.7K Other fixed costs$27.0K Other variable costs
2009 2010 2011 2012 2013 2014 2015
Variable costsFixed Costs
Figure 9: Average fixed (dashed line) and variable costs (solid line) (thousands of 2015 $) per vessel in the West Coast
Trawl Groundfish Catch Share Program. Note that vessels participating in Exempted Fishing Permit (EFP) programs during
the pre-catch share period (2009-2010) paid for their own observer coverage.
OVERVIEW 17 CATCHER VESSEL REPORT

One significant change resulting from the implementation of the catch share program was a shift to 100% observer
coverage with partial industry funding. Prior to catch shares, there was approximately 20% observer coverage,
paid for by NMFS. In order to lessen the cost of transitioning to the required 100% observer coverage, catcher
vessels received a maximum subsidy of $328.50 per day in 2011 and 2012. This subsidy decreased in 2013 to
$256 per day and in 2014 to $216 per day. The subsidy in 2015 was $108, but 2015 was also the first year where
exempted fishing permits were issued to test Electronic Monitoring (EM) as an alternative. There were several
alternative funding mechanisms used to subsidize the EM equipment and monitoring. Catcher vessels spent an
average of $17,500 on observers and electronic monitoring while operating in the catch share program in 2015
(Figure 9). In 2011, observer costs represented 0.9% of total variable costs, and increased to 6.3% in 2015. Note
that as observer subsidies have decreased over time, the average expenses per vessel have increased and new costs
associated with electronic monitoring have been introduced.
As noted above, most vessels participate in more than one fishery within the catch share program, as well as state
and federally-managed fisheries that are not part of the catch share program. More details about each fishery and
the economics of vessels participating in each fishery are included in the fishery-specific summaries in the following
section.
Fishery Summaries
At-sea Pacific whiting
Landings weight Revenue
2009
2010
2011
2012
2013
2014
2015
2009
2010
2011
2012
2013
2014
2015
0
25
50
75
100
Com
posi
tion
(%)
Pacific whiting
Dover sole
Thornyheads
Sablefish
Petrale sole
Semi pelagic rockfish
Other quota species
Non−quota groundfish
Other species
Figure 10: The species composition of catch (left) and revenue (right)
in the At-sea Pacific whiting fishery (%). Dashed line represents the
beginning of the catch share program.
Fourteen vessels participated in the At-sea
Pacific whiting fishery in 2015. These
vessels delivered to three motherships as
part of a single fishing cooperative. This
fishery targets Pacific whiting (99.7% of
total landings by weight) and has very
low bycatch (Figure 10). Although the
bycatch rate is extremely low, the total
weight of bycatch was 422,000 pounds in
2015. The majority of this catch consisted
of rockfish, coastal pelagics, and sharks,
skates and rays. Not all species caught in
this fishery must be “covered” with quota,
but of the quota species, the most common
were yellowtail rockfish (190,000 pounds),
widow rockfish (37,900 pounds), rougheye
rockfish (14,950 pounds), and splitnose
rockfish (7,357 pounds).
Revenue
Participation in the At-sea Pacific whiting fishery resulted in $5.36 million in ex-vessel revenue in 2015 (Figure
11 (top)). Vessels that participated in the At-sea Pacific whiting fishery also earned revenue fishing in Alaska
(62.7% of total revenue) and fishing in the Shoreside Pacific whiting fishery (18.6% of total revenue). In 2015, all
but two of the participants in the At-sea Pacific whiting fishery also fished in Alaska and most also fished in the
OVERVIEW 18 CATCHER VESSEL REPORT

0
20
40
60
2009 2010 2011 2012 2013 2014 2015
Tota
l rev
enue
(m
illio
ns o
f $)
Alaska
Other
Shrimp
CrabGroundfish fixed gear with trawl endorsement
Non−whiting, non−DTS trawl with trawl endorsementDTS trawl with trawl endorsement
Non−whiting midwater trawl
Shoreside Pacific whiting
At−sea Pacific whiting
0
5
10
15
20
2009 2010 2011 2012 2013 2014 2015
# of
ve
ssel
s
0
5
10
15
20
Figure 11: Total ex-vessel revenue earned by vessels that participated in the At-sea Pacific whiting fishery (black outline) by
fishery (millions of 2015 $) (top) and number of vessels that participated in each fishery (bottom). Dashed line represents
the beginning of the catch share program.
*Some values are suppressed to protect confidential data.
Shoreside Pacific whiting fishery (Figure 11 (bottom)). In 2009 through 2011, there were some vessels that also
fished in the bottom trawl fisheries (DTS trawl with trawl endorsement and Non-whiting, non-DTS trawl with
trawl endorsement fisheries), but there has been nearly no participation by At-sea Pacific whiting vessels since
2012. With the exception of 2015, total revenue has been higher since the implementation of the catch share
program, mainly due to an increase in the catch limit for Pacific whiting and Alaska pollock (for those vessels that
fish in Alaska). In 2015, total revenue for the at-sea whiting fleet was 42.7% less than pre-catch shares levels, a
result of a decrease in Alaska and West Coast earnings.
Average Net Revenue
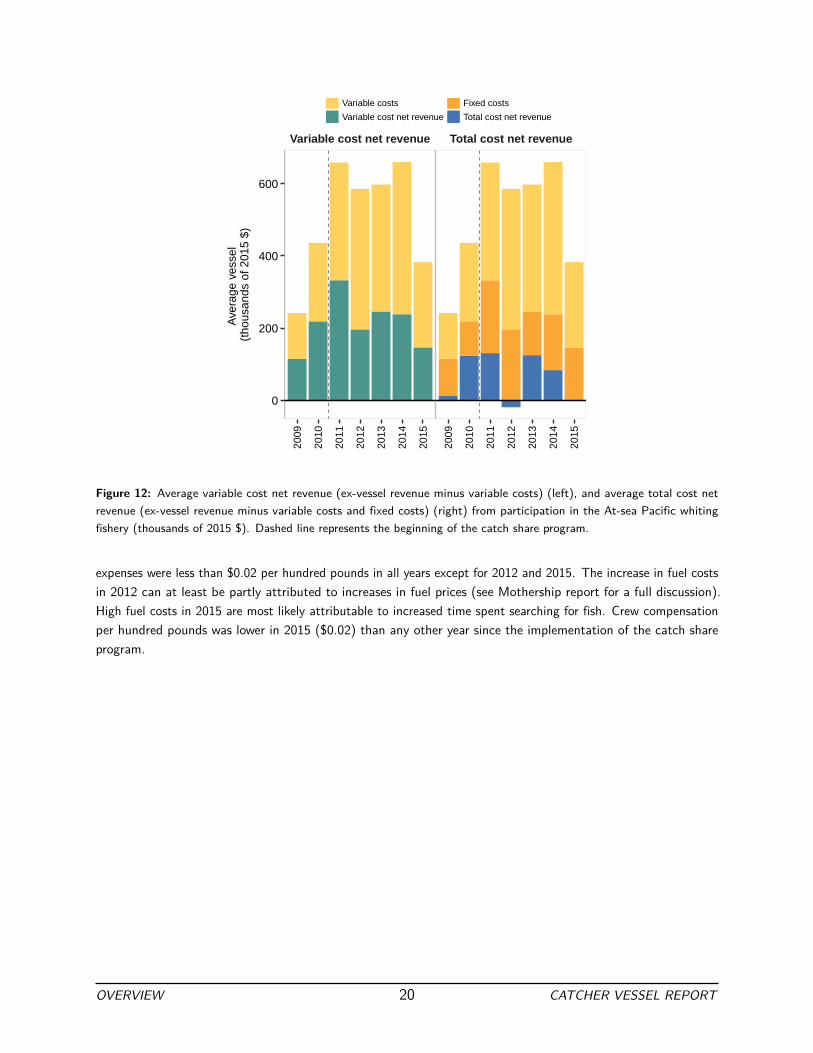
Average revenue from participating in the At-sea Pacific whiting fishery was $383,000, average variable cost net
revenue was $147,000, and average total cost net revenue was $1,080 in 2015 (Figure 12). The revenue and net
revenue figures correlate closely to the volume of Pacific whiting allocated to the mothership sector, except for
2015. The average ex-vessel revenue and variable cost net revenue per vessel in 2015 was lower than any year
since the catch share program was implemented. The ex-vessel revenue in 2015 was 42% less than 2014, and the
variable cost net revenue was 38% less. The total cost net revenue in 2015 was lower than either of the pre-catch
share years, but still higher than 2012 when average total cost net revenue was -$18,700.
Average Costs
The single largest cost in 2015 was for vessel and on-board equipment ($88,700 per vessel), followed by fuel
($72,800), and crew ($69,100) (Figure 13). The total amount spent on fuel, crew compensation, and captain
compensation nearly doubled between 2009 and 2014, but decreased between 42% (fuel) and 66% (crew payments)
between 2014 and 2015. On a per unit basis (not shown in the figure), crew compensation decreased from $1.90
per hundred pounds delivered to mothership vessels in 2014 to $1.57 per hundred pounds in 2015, while captain
compensation only decreased from $1.17 per hundred pounds delivered to $1.11 per hundred pounds in 2015. Fuel
OVERVIEW 19 CATCHER VESSEL REPORT
Variable cost net revenue Total cost net revenue
2009
2010
2011
2012
2013
2014
2015
2009
2010
2011
2012
2013
2014
2015
0
200
400
600
Ave
rage
ves
sel
(tho
usan
ds o
f 201
5 $)
Variable costs
Variable cost net revenue
Fixed costs
Total cost net revenue
Figure 12: Average variable cost net revenue (ex-vessel revenue minus variable costs) (left), and average total cost net
revenue (ex-vessel revenue minus variable costs and fixed costs) (right) from participation in the At-sea Pacific whiting
fishery (thousands of 2015 $). Dashed line represents the beginning of the catch share program.
expenses were less than $0.02 per hundred pounds in all years except for 2012 and 2015. The increase in fuel costs
in 2012 can at least be partly attributed to increases in fuel prices (see Mothership report for a full discussion).
High fuel costs in 2015 are most likely attributable to increased time spent searching for fish. Crew compensation
per hundred pounds was lower in 2015 ($0.02) than any other year since the implementation of the catch share
program.
OVERVIEW 20 CATCHER VESSEL REPORT

Buyback fees $7.8K
Captain $25.1K
Cost recovery fees $0.0K
Crew $46.9KEquipment $50.9K
Fishing gear $33.8K
Food $2.3K
Fuel $40.6K
Observers $0.0K
Other fixed costs $17.0K
Other variable costs $3.6K
$15.6K Buyback fees
$48.6K Captain
$3.8K Cost recovery fees
$69.1K Crew
$88.7K Equipment
$22.3K Fishing gear
$3.3K Food
$72.8K Fuel
$8.8K Observers
$34.8K Other fixed costs
$14.4K Other variable costs
2009 2010 2011 2012 2013 2014 2015
Variable costsFixed Costs
Figure 13: Average fixed (dashed line) and variable costs (solid line) per vessel in the At-sea Pacific whiting fishery(thousands
of 2015 $).
OVERVIEW 21 CATCHER VESSEL REPORT

Shoreside Pacific whiting
Landings weight Revenue
2009
2010
2011
2012
2013
2014
2015
2009
2010
2011
2012
2013
2014
2015
0
25
50
75
100
Com
posi
tion
(%)
Pacific whiting
Dover sole
Thornyheads
Sablefish
Petrale sole
Semi pelagic rockfish
Other quota species
Non−quota groundfish
Other species
Figure 14: The species composition of catch (left) and revenue (right)
in the Shoreside Pacific whiting fishery (%). Dashed line represents the
beginning of the catch share program.
Twenty-two vessels participated in the
Shoreside Pacific whiting fishery in 2015.
This fishery targets mainly Pacific whiting
(97.9% of total landings by weight, Figure
14). In 2015, the bycatch rate in the
Shoreside Pacific whiting fishery (2.1%) was
higher than the At-sea fishery, amounting
to 2.77 million pounds. The majority of
the bycatch consisted of rockfish, sardines,
sharks, skates and rays, and shad. Not
all species caught in this fishery must
be “covered” with quota, but of the
quota species, the most common were
widow rockfish (661,000 pounds), yellowtail
rockfish (205,000 pounds), and splitnose
rockfish (189,000 pounds).
Revenue
Participation in the Shoreside Pacific
whiting fishery resulted in $9.98 million in
total ex-vessel revenue in 2015 (Figure 15 (top)). Vessels that participated in the Shoreside Pacific whiting fishery
0
20
40
60
2009 2010 2011 2012 2013 2014 2015
Tota
l rev
enue
(m
illio
ns o
f $)
Alaska
Other
Shrimp
CrabGroundfish fixed gear with trawl endorsement
Non−whiting, non−DTS trawl with trawl endorsementDTS trawl with trawl endorsement
Non−whiting midwater trawl
Shoreside Pacific whiting
At−sea Pacific whiting
0
10
20
30
2009 2010 2011 2012 2013 2014 2015
# of
ve
ssel
s
0
10
20
30
Figure 15: Total ex-vessel revenue earned by vessels that participated in the Shoreside Pacific whiting fishery (black outline)
by fishery (millions of 2015 $) (top) and number of vessels that participated in each fishery (bottom). Dashed line represents
the beginning of the catch share program.
*Some values are suppressed to protect confidential data.
OVERVIEW 22 CATCHER VESSEL REPORT

Variable cost net revenue Total cost net revenue
2009
2010
2011
2012
2013
2014
2015
2009
2010
2011
2012
2013
2014
2015
0
250
500
750
1000
Ave
rage
ves
sel
(tho
usan
ds o
f 201
5 $)
Variable costs
Variable cost net revenue
Fixed costs
Total cost net revenue
Figure 16: Average variable cost net revenue (ex-vessel revenue minus variable costs) (left), and average total cost net
revenue (ex-vessel revenue minus variable costs and fixed costs) (right) from participation in the Shoreside Pacific whiting
fishery (thousands of 2015 $). Dashed line represents the beginning of the catch share program.
also earned revenue from fishing in Alaska (45.8% of total revenue) and fishing in the At-sea Pacific whiting fishery
(12.7% of total revenue). The total revenue earned by Shoreside Pacific whiting vessels was lower than any year
since 2009. This was a result of decreases in total ex-vessel revenue on the West Coast and in Alaska, and a
decrease in the total number of vessels fishing in the fishery. The number of Shoreside Pacific whiting vessels
decreased from an average of 28 vessels since the catch share program was implemented (2011-2014) to 22 in
2015.
Average Net Revenue
Average revenue from participating in the Shoreside Pacific whiting fishery was $454,000, average variable cost
net revenue was $146,000, and average total cost net revenue was -$120,000 in 2015 (Figure 16). Total cost net
revenue was negative for the first time since the catch share program was implemented. The increases in ex-vessel
revenue during the first four years of the catch share program was a result of an increase in the catch limit for
Pacific whiting, especially in 2011, and steadily increasing ex-vessel prices paid by first receivers to the shoreside
fleet. Ex-vessel revenue, variable cost net revenue, and total cost net revenue were all highest in 2013 from a
combination of a high catch limit and relatively low fuel costs.
Average Costs
The single largest cost in 2015 was for vessel and on-board equipment ($212,000 per vessel), followed by crew
($93,600), and fuel ($83,700) (Figure 17). The average amount spent on vessel and on-board equipment in 2015
was nearly triple compared to the pre-catch share period; and crew compensation and captain compensation in
2014 were five times the amount spent in 2009 and 2010. However, crew and compensation dropped 54% between
OVERVIEW 23 CATCHER VESSEL REPORT
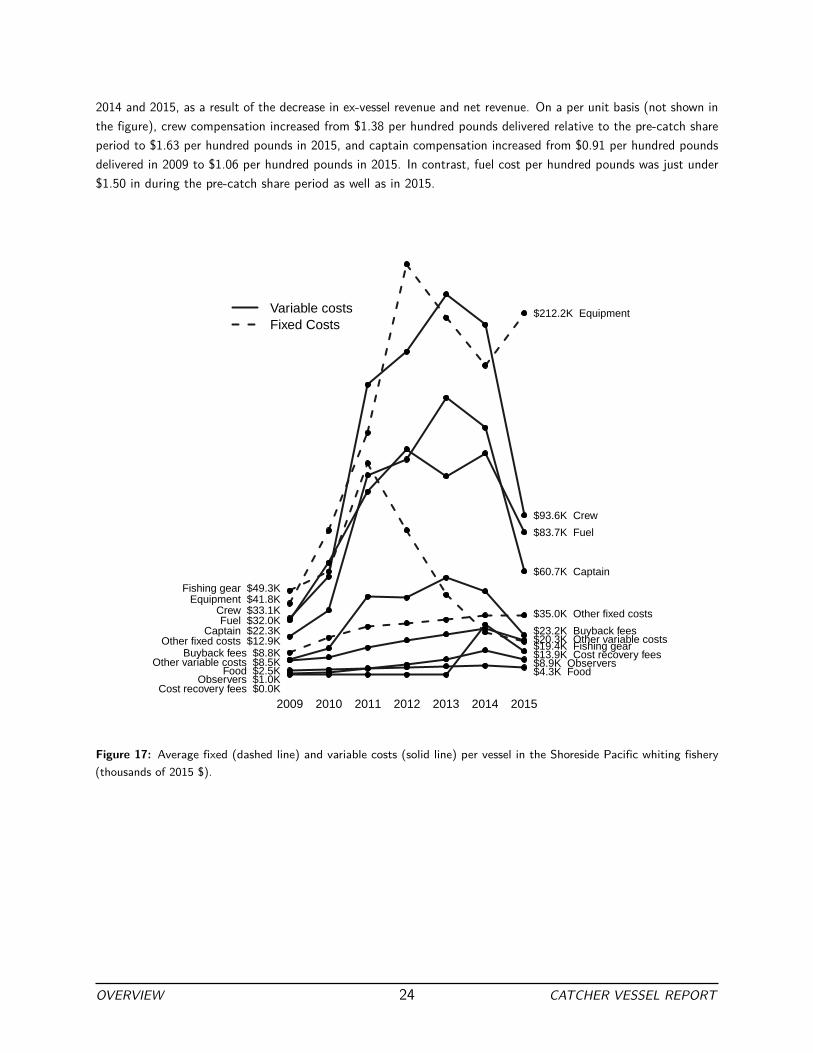
2014 and 2015, as a result of the decrease in ex-vessel revenue and net revenue. On a per unit basis (not shown in
the figure), crew compensation increased from $1.38 per hundred pounds delivered relative to the pre-catch share
period to $1.63 per hundred pounds in 2015, and captain compensation increased from $0.91 per hundred pounds
delivered in 2009 to $1.06 per hundred pounds in 2015. In contrast, fuel cost per hundred pounds was just under
$1.50 in during the pre-catch share period as well as in 2015.
Buyback fees $8.8K
Captain $22.3K
Cost recovery fees $0.0K
Crew $33.1KEquipment $41.8K
Fishing gear $49.3K
Food $2.5K
Fuel $32.0K
Observers $1.0K
Other fixed costs $12.9K
Other variable costs $8.5K
$23.2K Buyback fees
$60.7K Captain
$13.9K Cost recovery fees
$93.6K Crew
$212.2K Equipment
$19.4K Fishing gear
$4.3K Food
$83.7K Fuel
$8.9K Observers
$35.0K Other fixed costs
$20.3K Other variable costs
2009 2010 2011 2012 2013 2014 2015
Variable costsFixed Costs
Figure 17: Average fixed (dashed line) and variable costs (solid line) per vessel in the Shoreside Pacific whiting fishery
(thousands of 2015 $).
OVERVIEW 24 CATCHER VESSEL REPORT

Non-whiting midwater trawl
Landings weight Revenue
2012
2013
2014
2015
2012
2013
2014
2015
0
25
50
75
100
Com
posi
tion
(%)
Pacific whiting
Dover sole
Thornyheads
Sablefish
Petrale sole
Semi pelagic rockfish
Other quota species
Non−quota groundfish
Other species
Figure 18: The species composition of catch (left) and revenue (right) in
the Non-whiting midwater trawl (%). Vessels did not begin participating
in this fishery until 2012.
Vessels only began participating in the
Non-whiting midwater trawl fishery in
2012, as a result of increased quota for
widow rockfish. In 2015, thirteen vessels
participated. This fishery targets mainly
yellowtail rockfish (58% of catch) and
widow rockfish (24% of catch in 2015)
using midwater trawl gear. This is the
same gear used to target Pacific whiting.
Yellowtail rockfish constituted the largest
revenue source (70% of revenue in 2015),
followed by widow rockfish (24%) (Figure
18).
Revenue
The ex-vessel revenue from participating
in the Non-whiting midwater trawl fishery
makes up a small share (11.3%) of total
revenue for those vessels. Vessels that
participated in the Non-whiting midwater
trawl fishery also earned revenue from the Shoreside Pacific whiting fishery (23.5% of revenue) as well as both
bottom trawl fisheries (29.1%) (Figure 19). In 2015, there were four vessels that participated in both the
Non-whiting midwater trawl fishery as well as in Alaska.
Average Net Revenue
Average revenue from participating in the Non-whiting midwater trawl fishery was $135,000, average variable
cost net revenue was $58,100, and average total cost net revenue was $37,500 in 2015 (Figure 20). In 2015, the
average ex-vessel revenue was higher than the previous three years. This was at least partially a result of vessels
seeking new fishing opportunities when the whiting fishery was less profitable.
Average Costs
The single largest cost in 2015 was for crew compensation ($26,700 per vessel), followed by captain compensation
($20,400), and vessel and on-board equipment ($10,600) (Figure 21).
OVERVIEW 25 CATCHER VESSEL REPORT

0
5
10
2009 2010 2011 2012 2013 2014 2015
Tota
l rev
enue
(m
illio
ns o
f $)
Alaska
Other
Shrimp
CrabGroundfish fixed gear with trawl endorsement
Non−whiting, non−DTS trawl with trawl endorsementDTS trawl with trawl endorsement
Non−whiting midwater trawl
Shoreside Pacific whiting
At−sea Pacific whiting
0
5
10
2009 2010 2011 2012 2013 2014 2015
# of
ve
ssel
s
0
5
10
Figure 19: Total ex-vessel revenue earned by vessels that participated in the non-whiting midwater trawl fishery (black
outline) by fishery (millions of 2015 $) (top) and number of vessels that participated in each fishery (bottom). Vessels did
not begin participating in this fishery until 2012.
*Some values are suppressed to protect confidential data.
Variable cost net revenue Total cost net revenue
2012
2013
2014
2015
2012
2013
2014
2015
0
50
100
Ave
rage
ves
sel
(tho
usan
ds o
f 201
5 $)
Variable costs
Variable cost net revenue
Fixed costs
Total cost net revenue
Figure 20: Average variable cost net revenue (ex-vessel revenue minus variable costs) (left), and average total cost net
revenue (ex-vessel revenue minus variable costs and fixed costs) (right) from participation in the Non-whiting midwater
trawl (thousands of 2015 $). Vessels did not begin participating in this fishery until 2012.
OVERVIEW 26 CATCHER VESSEL REPORT

Buyback fees $2.6K
Captain $8.8K
Cost recovery fees $0.0K
Crew $8.2K
Equipment $5.0K
Fishing gear $1.7K
Food $0.6K
Fuel $10.3K
Observers $0.8K
Other fixed costs $2.1KOther variable costs $2.1K
$7.0K Buyback fees
$20.4K Captain
$4.2K Cost recovery fees
$26.7K Crew
$10.6K Equipment
$3.9K Fishing gear$1.1K Food
$9.5K Fuel
$4.0K Observers
$6.2K Other fixed costs
$4.1K Other variable costs
2012 2013 2014 2015
Variable costsFixed Costs
Figure 21: Average fixed (dashed line) and variable costs (solid line) per vessel in the Non-whiting midwater trawl fishery
(thousands of 2015 $).
OVERVIEW 27 CATCHER VESSEL REPORT
DTS trawl with trawl endorsement
Landings weight Revenue
2009
2010
2011
2012
2013
2014
2015
2009
2010
2011
2012
2013
2014
2015
0
25
50
75
100
Com
posi
tion
(%)
Pacific whiting
Dover sole
Thornyheads
Sablefish
Petrale sole
Semi pelagic rockfish
Other quota species
Non−quota groundfish
Other species
Figure 22: The species composition of catch (left) and revenue (right) in
the DTS trawl with trawl endorsement fishery (%). Dashed line represents
the beginning of the catch share program.
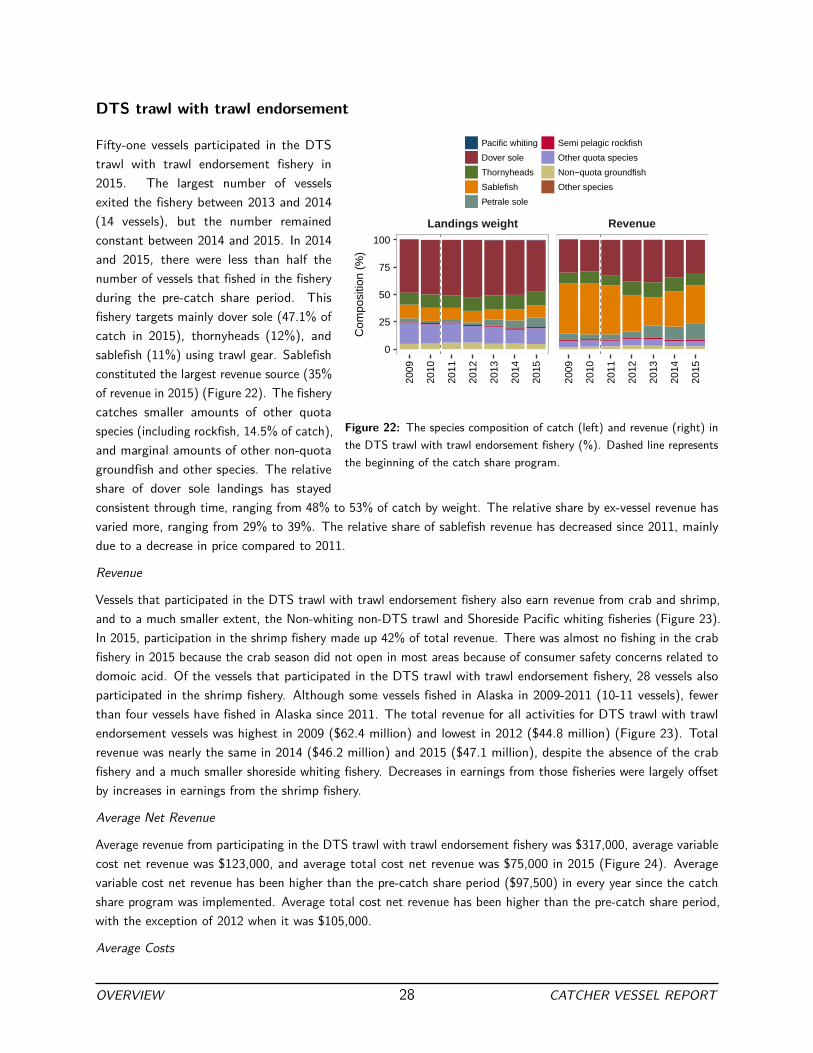
Fifty-one vessels participated in the DTS
trawl with trawl endorsement fishery in
2015. The largest number of vessels
exited the fishery between 2013 and 2014
(14 vessels), but the number remained
constant between 2014 and 2015. In 2014
and 2015, there were less than half the
number of vessels that fished in the fishery
during the pre-catch share period. This
fishery targets mainly dover sole (47.1% of
catch in 2015), thornyheads (12%), and
sablefish (11%) using trawl gear. Sablefish
constituted the largest revenue source (35%
of revenue in 2015) (Figure 22). The fishery
catches smaller amounts of other quota
species (including rockfish, 14.5% of catch),
and marginal amounts of other non-quota
groundfish and other species. The relative
share of dover sole landings has stayed
consistent through time, ranging from 48% to 53% of catch by weight. The relative share by ex-vessel revenue has
varied more, ranging from 29% to 39%. The relative share of sablefish revenue has decreased since 2011, mainly
due to a decrease in price compared to 2011.
Revenue
Vessels that participated in the DTS trawl with trawl endorsement fishery also earn revenue from crab and shrimp,
and to a much smaller extent, the Non-whiting non-DTS trawl and Shoreside Pacific whiting fisheries (Figure 23).
In 2015, participation in the shrimp fishery made up 42% of total revenue. There was almost no fishing in the crab
fishery in 2015 because the crab season did not open in most areas because of consumer safety concerns related to
domoic acid. Of the vessels that participated in the DTS trawl with trawl endorsement fishery, 28 vessels also
participated in the shrimp fishery. Although some vessels fished in Alaska in 2009-2011 (10-11 vessels), fewer
than four vessels have fished in Alaska since 2011. The total revenue for all activities for DTS trawl with trawl
endorsement vessels was highest in 2009 ($62.4 million) and lowest in 2012 ($44.8 million) (Figure 23). Total
revenue was nearly the same in 2014 ($46.2 million) and 2015 ($47.1 million), despite the absence of the crab
fishery and a much smaller shoreside whiting fishery. Decreases in earnings from those fisheries were largely offset
by increases in earnings from the shrimp fishery.
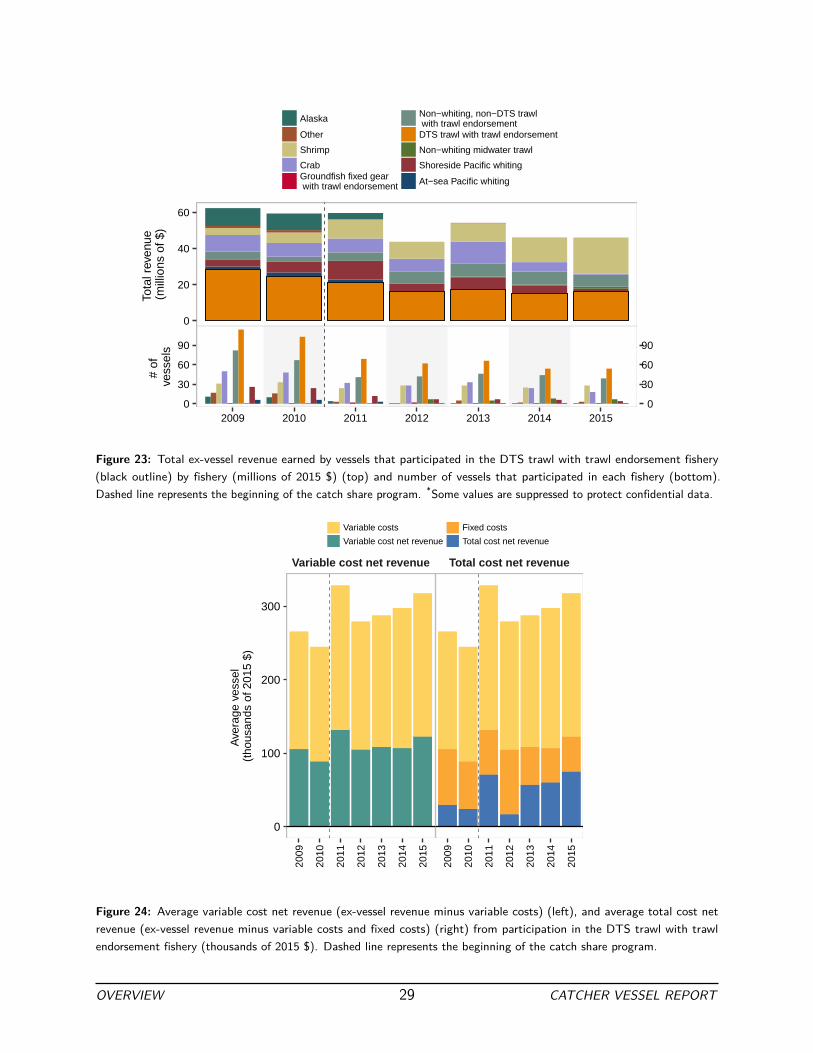
Average Net Revenue
Average revenue from participating in the DTS trawl with trawl endorsement fishery was $317,000, average variable
cost net revenue was $123,000, and average total cost net revenue was $75,000 in 2015 (Figure 24). Average
variable cost net revenue has been higher than the pre-catch share period ($97,500) in every year since the catch
share program was implemented. Average total cost net revenue has been higher than the pre-catch share period,
with the exception of 2012 when it was $105,000.
Average Costs
OVERVIEW 28 CATCHER VESSEL REPORT
0
20
40
60
2009 2010 2011 2012 2013 2014 2015
Tota
l rev
enue
(m
illio
ns o
f $)
Alaska
Other
Shrimp
CrabGroundfish fixed gear with trawl endorsement
Non−whiting, non−DTS trawl with trawl endorsementDTS trawl with trawl endorsement
Non−whiting midwater trawl
Shoreside Pacific whiting
At−sea Pacific whiting
0
30
60
90
2009 2010 2011 2012 2013 2014 2015
# of
ve
ssel
s
0
30
60
90
Figure 23: Total ex-vessel revenue earned by vessels that participated in the DTS trawl with trawl endorsement fishery
(black outline) by fishery (millions of 2015 $) (top) and number of vessels that participated in each fishery (bottom).
Dashed line represents the beginning of the catch share program.
*Some values are suppressed to protect confidential data.
Variable cost net revenue Total cost net revenue
2009
2010
2011
2012
2013
2014
2015
2009
2010
2011
2012
2013
2014
2015
0
100
200
300
Ave
rage
ves
sel
(tho
usan
ds o
f 201
5 $)
Variable costs
Variable cost net revenue
Fixed costs
Total cost net revenue
Figure 24: Average variable cost net revenue (ex-vessel revenue minus variable costs) (left), and average total cost net
revenue (ex-vessel revenue minus variable costs and fixed costs) (right) from participation in the DTS trawl with trawl
endorsement fishery (thousands of 2015 $). Dashed line represents the beginning of the catch share program.
OVERVIEW 29 CATCHER VESSEL REPORT

The single largest cost in 2015 was for crew compensation ($67,400 per vessel) followed by captain compensation
($50,600) (Figure 25). Average fuel and equipment expenses were both just over $24,000. The cost per pound in
the DTS trawl with trawl endorsement fishery has experienced very few increases since the implementation of the
catch share program. In 2015, the average cost per pound for crew was 23% higher than during the pre-catch
share period and captain wage costs were 17% higher. The largest percentage decrease was average cost per
pound on fishing gear (53% decrease) from $0.04 during the pre-catch share period to $0.02 in 2015.
Buyback fees $13.2K
Captain $43.2K
Cost recovery fees $0.0K
Crew $55.5K
Equipment $40.2K
Fishing gear $18.4K
Food $2.9K
Fuel $31.5K
Observers $0.0K
Other fixed costs $17.2K
Other variable costs $12.9K
$15.8K Buyback fees
$50.6K Captain
$9.6K Cost recovery fees
$67.4K Crew
$24.4K Equipment
$8.7K Fishing gear
$1.6K Food
$24.3K Fuel
$13.5K Observers$14.7K Other fixed costs
$12.2K Other variable costs
2009 2010 2011 2012 2013 2014 2015
Variable costsFixed Costs
Figure 25: Average fixed (dashed line) and variable costs (solid line) per vessel in the DTS trawl with trawl endorsement
fishery (thousands of 2015 $).
OVERVIEW 30 CATCHER VESSEL REPORT

Non-whiting, non-DTS trawl with trawl endorsement
Landings weight Revenue
2009
2010
2011
2012
2013
2014
2015
2009
2010
2011
2012
2013
2014
2015
0
25
50
75
100
Com
posi
tion
(%)
Pacific whiting
Dover sole
Thornyheads
Sablefish
Petrale sole
Semi pelagic rockfish
Other quota species
Non−quota groundfish
Other species
Figure 26: The species composition of catch (left) and revenue (right)
in the Non-whiting, non-DTS trawl with trawl endorsement fishery (%).
Dashed line represents the beginning of the catch share program.
Forty-six vessels participated in the
Non-whiting, non-DTS trawl with trawl
endorsement fishery in 2015. Overall, this
fishery has a lower value (Figure 5) than
the other catch share fisheries. Vessels
in this fishery target mostly petrale sole
(28.4%), other quota species (27.2%), and
dover sole (22%). The most common “other
quota species” are Pacific cod, arrowtooth
flounder, and rex sole. Non-quota
groundfish are also caught in relatively large
volumes (Figure 26).
Revenue
Participation in the Non-whiting, non-DTS
trawl with trawl endorsement fishery makes
up a minor portion of total revenue for
participants in that fishery (Figure 27) in
most years. However in 2015, as a result
of the closure of the crab fishery and very
little participation in the Shoreside Pacific whiting fishery, vessels earned 24% of their total revenue from the
Non-whiting, non-DTS trawl with trawl endorsement fishery. These vessels also participate in the DTS trawl with
trawl endorsement, shrimp, and crab fisheries. A few vessels fished in Alaska in the early years of the program, but
since 2013, none of the Non-whiting, non-DTS trawl vessels have fished in Alaska (Figure 27). In 2015, 67% of
total revenue came from participation in the shrimp and DTS trawl with trawl endorsement fisheries.
Average Net Revenue
The average revenue, variable cost net revenue and total cost net revenue from participating in the Non-whiting,
non-DTS trawl with trawl endorsement fishery have steadily increased since the implementation of the catch share
program. Average revenue was $188,000, variable cost net revenue was $70,800, and total cost net revenue was
$47,800 in 2015 (Figure 28). Both net revenue measures were greater in the catch shares years, variable cost net
revenue increased 6 fold between the pre-catch share period and 2015, and total cost net revenue was less than
zero during the pre-catch share period.
Average Costs
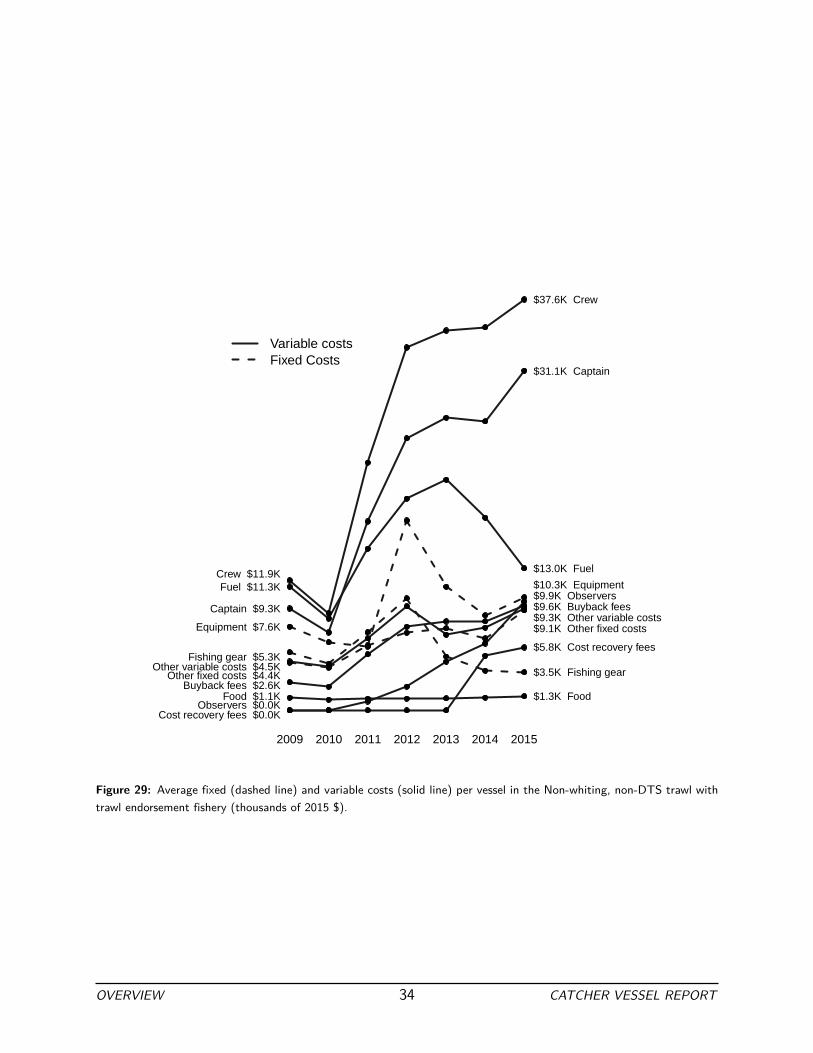
The largest expense in 2015 was for crew compensation ($37,600 per vessel), followed by captain compensation
($31,000), and fuel ($13,000). Costs on crew compensation and captain compensation per pound increased by
35% and 41%, respectively, in 2015 compared to the pre-catch share period. In contrast, the cost per pound for
fuel decreased 51% between the pre-catch share period and 2015.
OVERVIEW 31 CATCHER VESSEL REPORT

0
10
20
30
40
2009 2010 2011 2012 2013 2014 2015
Tota
l rev
enue
(m
illio
ns o
f $)
Alaska
Other
Shrimp
CrabGroundfish fixed gear with trawl endorsement
Non−whiting, non−DTS trawl with trawl endorsementDTS trawl with trawl endorsement
Non−whiting midwater trawl
Shoreside Pacific whiting
At−sea Pacific whiting
0
25
50
75
2009 2010 2011 2012 2013 2014 2015
# of
ve
ssel
s
0
25
50
75
Figure 27: Total ex-vessel revenue earned by vessels that participated in the Non-whiting, non-DTS trawl with trawl
endorsement fishery (black outline) by fishery (top) and number of vessels that participated in each fishery (bottom).
Dashed line represents the beginning of the catch share program.
*Some values are suppressed to protect confidential data.
OVERVIEW 32 CATCHER VESSEL REPORT

Variable cost net revenue Total cost net revenue
2009
2010
2011
2012
2013
2014
2015
2009
2010
2011
2012
2013
2014
2015
0
50
100
150
Ave
rage
ves
sel
(tho
usan
ds o
f 201
5 $)
Variable costs
Variable cost net revenue
Fixed costs
Total cost net revenue
Figure 28: Average variable cost net revenue (ex-vessel revenue minus variable costs) (left), and average total cost net
revenue (ex-vessel revenue minus variable costs and fixed costs) (right) from participation in the Non-whiting, non-DTS
trawl with trawl endorsement fishery (thousands of 2015 $). Dashed line represents the beginning of the catch share
program.
OVERVIEW 33 CATCHER VESSEL REPORT
Buyback fees $2.6K
Captain $9.3K
Cost recovery fees $0.0K
Crew $11.9K
Equipment $7.6K
Fishing gear $5.3K
Food $1.1K
Fuel $11.3K
Observers $0.0K
Other fixed costs $4.4KOther variable costs $4.5K
$9.6K Buyback fees
$31.1K Captain
$5.8K Cost recovery fees
$37.6K Crew
$10.3K Equipment
$3.5K Fishing gear
$1.3K Food
$13.0K Fuel
$9.9K Observers
$9.1K Other fixed costs$9.3K Other variable costs
2009 2010 2011 2012 2013 2014 2015
Variable costsFixed Costs
Figure 29: Average fixed (dashed line) and variable costs (solid line) per vessel in the Non-whiting, non-DTS trawl with
trawl endorsement fishery (thousands of 2015 $).
OVERVIEW 34 CATCHER VESSEL REPORT
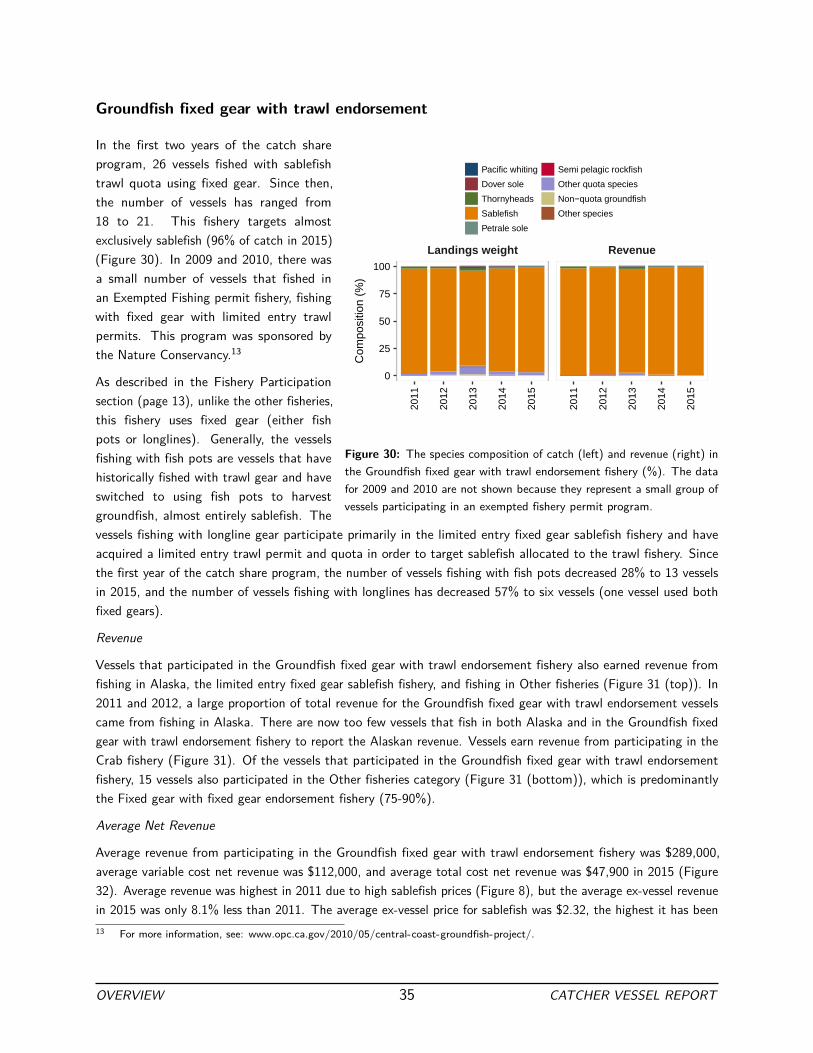
Groundfish fixed gear with trawl endorsement
Landings weight Revenue
2011
2012
2013
2014
2015
2011
2012
2013
2014
2015
0
25
50
75
100
Com
posi
tion
(%)
Pacific whiting
Dover sole
Thornyheads
Sablefish
Petrale sole
Semi pelagic rockfish
Other quota species
Non−quota groundfish
Other species
Figure 30: The species composition of catch (left) and revenue (right) in
the Groundfish fixed gear with trawl endorsement fishery (%). The data
for 2009 and 2010 are not shown because they represent a small group of
vessels participating in an exempted fishery permit program.
In the first two years of the catch share
program, 26 vessels fished with sablefish
trawl quota using fixed gear. Since then,
the number of vessels has ranged from
18 to 21. This fishery targets almost
exclusively sablefish (96% of catch in 2015)
(Figure 30). In 2009 and 2010, there was
a small number of vessels that fished in
an Exempted Fishing permit fishery, fishing
with fixed gear with limited entry trawl
permits. This program was sponsored by
the Nature Conservancy.13
As described in the Fishery Participation
section (page 13), unlike the other fisheries,
this fishery uses fixed gear (either fish
pots or longlines). Generally, the vessels
fishing with fish pots are vessels that have
historically fished with trawl gear and have
switched to using fish pots to harvest
groundfish, almost entirely sablefish. The
vessels fishing with longline gear participate primarily in the limited entry fixed gear sablefish fishery and have
acquired a limited entry trawl permit and quota in order to target sablefish allocated to the trawl fishery. Since
the first year of the catch share program, the number of vessels fishing with fish pots decreased 28% to 13 vessels
in 2015, and the number of vessels fishing with longlines has decreased 57% to six vessels (one vessel used both
fixed gears).
Revenue
Vessels that participated in the Groundfish fixed gear with trawl endorsement fishery also earned revenue from
fishing in Alaska, the limited entry fixed gear sablefish fishery, and fishing in Other fisheries (Figure 31 (top)). In
2011 and 2012, a large proportion of total revenue for the Groundfish fixed gear with trawl endorsement vessels
came from fishing in Alaska. There are now too few vessels that fish in both Alaska and in the Groundfish fixed
gear with trawl endorsement fishery to report the Alaskan revenue. Vessels earn revenue from participating in the
Crab fishery (Figure 31). Of the vessels that participated in the Groundfish fixed gear with trawl endorsement
fishery, 15 vessels also participated in the Other fisheries category (Figure 31 (bottom)), which is predominantly
the Fixed gear with fixed gear endorsement fishery (75-90%).
Average Net Revenue
Average revenue from participating in the Groundfish fixed gear with trawl endorsement fishery was $289,000,
average variable cost net revenue was $112,000, and average total cost net revenue was $47,900 in 2015 (Figure
32). Average revenue was highest in 2011 due to high sablefish prices (Figure 8), but the average ex-vessel revenue
in 2015 was only 8.1% less than 2011. The average ex-vessel price for sablefish was $2.32, the highest it has been
13 For more information, see: www.opc.ca.gov/2010/05/central-coast-groundfish-project/.
OVERVIEW 35 CATCHER VESSEL REPORT

0
5
10
15
2009 2010 2011 2012 2013 2014 2015
Tota
l rev
enue
(m
illio
ns o
f $)
Alaska
Other
Shrimp
CrabGroundfish fixed gear with trawl endorsement
Non−whiting, non−DTS trawl with trawl endorsementDTS trawl with trawl endorsement
Non−whiting midwater trawl
Shoreside Pacific whiting
At−sea Pacific whiting
0
10
20
2009 2010 2011 2012 2013 2014 2015
# of
ve
ssel
s
0
10
20
Figure 31: Total ex-vessel revenue earned by vessels that participated in the Groundfish fixed gear with trawl endorsement
fishery (black outline) by fishery (millions of 2015 $) (top) and number of vessels that participated in each fishery (bottom).
*Some values are suppressed to protect confidential data.
Variable cost net revenue Total cost net revenue
2011
2012
2013
2014
2015
2011
2012
2013
2014
2015
0
100
200
300
Ave
rage
ves
sel
(tho
usan
ds o
f 201
5 $)
Variable costs
Variable cost net revenue
Fixed costs
Total cost net revenue
Figure 32: Average variable cost net revenue (ex-vessel revenue minus variable costs) (left), and average total cost net
revenue (ex-vessel revenue minus variable costs and fixed costs) (right) from participation in the Groundfish fixed gear with
trawl endorsement fishery (thousands of 2015 $). Dashed line represents the beginning of the catch share program.
OVERVIEW 36 CATCHER VESSEL REPORT

since 2011 ($2.90). The total cost net revenue in 2015 was higher than 2011 as a result of lower average costs
associated with vessel and on-board equipment in 2015.
Average Costs
The largest cost in 2015 was crew compensation ($71,100 per vessel), followed by vessel and on-board equipment
($26,900), and captain compensation ($26,900) (Figure 33). Unlike the trawl fisheries, fixed gear vessels use less
fuel, but incur costs on bait that is not required in the trawl fishery. Compared to the DTS trawl with trawl
endorsement fishery that spent $710 per day on fuel, the fixed gear vessels only spent $445 per day. In 2015, the
average expenses on bait were $18,100 per vessel, or $546 per day.
Bait $15.4KBuyback fees $15.5K
Captain $30.7K
Cost recovery fees $0.0K
Crew $67.7K
Equipment $88.6K
Fishing gear $27.1K
Food $3.9K
Fuel $15.6K
Observers $1.6K
Other fixed costs $9.8KOther variable costs $10.7K
$18.1K Bait
$15.6K Buyback fees
$26.9K Captain
$9.4K Cost recovery fees
$71.1K Crew
$26.9K Equipment
$16.3K Fishing gear
$1.5K Food
$13.9K Fuel
$10.1K Observers
$20.7K Other fixed costs
$12.1K Other variable costs
2011 2012 2013 2014 2015
Variable costsFixed Costs
Figure 33: Average fixed (dashed line) and variable costs (solid line) per vessel in the Groundfish fixed gear with trawl
endorsement fishery (thousands of 2015 $). The costs for 2009 and 2010 are not shown here because they were collected
from a small group of vessels participating in an exempted fishing permit fishery.
OVERVIEW 37 CATCHER VESSEL REPORT

Regional Analysis
In addition to examining how the catch share program is affecting vessels by fishery, it is also important to
understand how the effects of the catch share program are being experienced in different regions along the coast.
For the purposes of this analysis, we analyze vessels by state: Washington (includes a very small number of vessels
that listed Alaska as their home port), Oregon (Newport, Astoria, Tillamook, Brookings, Coos Bay) and California
(Crescent City, Eureka, Fort Bragg, San Francisco, Monterey, Morro Bay). Similar to the rest of the Overview,
vessels are included in the analysis for a specific year if they fished with a limited entry trawl permit in that year.
Vessels were assigned to a state based on the home port declared on their EDC form.
Washington
The number of vessels with a home port in Washington has remained very consistent, ranging from 16 vessels
(2012, 2013, 2015) to 19 vessels (2009) (Figure 34). In 2015, there were 16 vessels, nine of which fished in Alaska,
a decline from 11 in 2010 and 2011 and 10 in 2013 and 2014.
0
20
40
60
80
2010 2012 2014
Num
ber
of c
atch
sha
re v
esse
ls
Oregon
California
Washington and Alaska
Figure 34: Number of catcher vessels participating in the catch share
fisheries by home port region.
In Washington, the majority of EDC
vessels’ earnings come from Alaska. Since
the beginning of the EDC Program, the
highest proportion of revenue from Alaska
occurred in 2009 (67% of total revenue),
a result of low West Coast revenue in the
years leading up to the implementation
of the catch share program. Total West
Coast earnings for these vessels was lowest
in 2009 ($6.46 million) and highest in
2012 and 2014 when total revenue was
approximately $20 million in both years. In
addition to Alaska revenue, trawl vessels in
Washington earn a significant proportion
of their income from the whiting fisheries
(both at-sea and shoreside). In 2015, as a
result of low catch in the whiting fisheries,
Washington vessels total earnings on the
West Coast were less than half ($10.2
million) the revenue from the previous
year. The total revenue from the DTS
trawl fishery has steadily decreased from
$2.09 million during the pre-catch share
period to $410,000 in 2015. At its highest,
the DTS trawl fishery made up 13% of
revenue (2009), but has been less than 2% since 2013.
The average total cost net revenue from participation in West Coast fisheries for Washington vessels was $173,000,
a large increase over the pre-catch share period ($5,150). The average total cost net revenue for these vessels was
highest in 2013 ($351,000). This large increase is mostly a result of higher revenue from whiting resulting from
increases in the TAC compared to the pre-catch share period.
OVERVIEW 38 CATCHER VESSEL REPORT
Oregon
In 2015, there were 62 vessels that fished in the catch share fisheries with home ports in Oregon, 12 of which
also fished in Alaska (Figure 34). This was a 18% decrease from the 76 vessels during the pre-catch share period
(Figure 34). There had been a steady decrease in the number of Oregon vessels fishing in catch share fisheries
since 2009, however, in 2015, there were three more vessels that fished compared to 2014.
The vessels that have their home port in Oregon receive a large portion of their income from fishing in Alaska, but
they also earn much more income from West Coast activities compared to Washington vessels. In contrast to
Washington vessels, only 19% of Oregon vessels go to Alaska. In 2015, fishing in Alaska made up 20% of total
revenue, a decrease from the pre-catch share period of 31%. Similar to Washington, this decrease in total share of
revenue from Alaska is a result of relative increases in West Coast revenue. In 2009, total West Coast earnings
for these vessels was $34.4 million compared to $62.7 million and $59.7 million in 2013 and 2014, respectively.
The total West Coast revenue for Oregon vessels in 2015 ($56.1 million) was lower than any other year since the
implementation of the catch share program, with the exception of 2012. In 2015, 28% of West Coast earnings
came from shrimp, followed by the DTS trawl with trawl endorsement fishery (15%), and the shoreside whiting
fishery (10%).
The average total cost net revenue for Oregon vessels increased compared to the pre-catch share period. It was
highest in 2013 ($265,000), a 7 fold increase compared to the pre-catch share period. Total cost net revenue in
2015 was 25% less than 2014, but still 115% higher than pre-catch share levels.
California
In 2015, there were 19 vessels with home ports in California, representing a 46% decrease from the 36 vessels
during the pre-catch share period and a 32% decrease from 2014 (Figure 34). Total ex-vessel revenue has increased
17% for these vessels between the pre-catch share period and 2014, but decreased 35% between 2014 and 2015.
This decrease was a result of a combination of a drop in number of vessels participating in the catch share program,
as well as the absence of the crab fishery in 2015. In most years, crab earnings represent between 20% (2009) and
41% (2012) of total earnings, but in 2015, crab earnings only made up 8% of total earnings (end of the 2014-2015
crab season).
Throughout the time period 2009-2015, ex-vessel revenue from crab and DTS trawl with trawl endorsement has
made up at least 60% of total revenue for California vessels. However, the relative importance of these fisheries
depends on the status of the crab fishery. During the pre-catch share period the DTS fishery was dominant, making
up 40-50% of total ex-vessel revenue for the vessels. This switched in 2012 and 2013 when crab earnings made up
almost 40% of total revenue. Crab earnings decreased 35% between 2013 and 2014 and then another 81% in 2015,
resulting in DTS earnings again dominating the ex-vessel revenue for California vessels. Earnings from fishing in
the DTS trawl with trawl endorsement fishery decreased from 2009 through 2012, but has steadily increased since.
Similarly, the Non-whiting, non-DTS trawl fishery decreased during the beginning of the catch share program, but
has steadily increased since 2012. In 2015, non-whiting catch share earnings (DTS trawl with trawl endorsement
and non-whiting, non-DTS trawl endorsement) represented 73% of total earnings of California vessels.
The average total cost net revenue per California vessel was higher than the pre-catch share period in all years
since the program was implemented, except for 2012 when total cost net revenue was only $3,030. This was the
result of a spike in average fixed costs per vessel in 2012 ($44,500 compared to $21,300) during the pre-catch share
period. Total cost net revenue was $91,000 in both 2011 and 2014, but decreased to $73,000 in 2015.
OVERVIEW 39 CATCHER VESSEL REPORT

Catcher Vessel Report
40 CATCHER VESSEL REPORT

CATCHER VESSEL REPORT
Contents
Catcher Vessel Sector: 2015 Highlights 2
Acknowledgments 5
Report Introduction 6
Overview 8
Report 40
List of Tables 43
List of Figures 47
1 Catcher Vessel Data Summaries 51
1 Introduction . . . . . . . . . . . . . . . . . . . . . . . . . . . . . . . . . . . . . . . . . . . . . . 51
1.1 Background . . . . . . . . . . . . . . . . . . . . . . . . . . . . . . . . . . . . . . . . . . 51
1.2 Understanding the report . . . . . . . . . . . . . . . . . . . . . . . . . . . . . . . . . . . 52
1.3 Purpose of the report . . . . . . . . . . . . . . . . . . . . . . . . . . . . . . . . . . . . . 53
1.4 Catcher vessel form administration . . . . . . . . . . . . . . . . . . . . . . . . . . . . . . 54
1.5 About the survey participants . . . . . . . . . . . . . . . . . . . . . . . . . . . . . . . . . 54
2 Survey Response Rates . . . . . . . . . . . . . . . . . . . . . . . . . . . . . . . . . . . . . . . . 55
3 Vessel Participation on the West Coast and in Alaska . . . . . . . . . . . . . . . . . . . . . . . . 57
3.1 Trips to Alaska . . . . . . . . . . . . . . . . . . . . . . . . . . . . . . . . . . . . . . . . 60
4 Home Port . . . . . . . . . . . . . . . . . . . . . . . . . . . . . . . . . . . . . . . . . . . . . . . 61
5 Vessel Physical Characteristics . . . . . . . . . . . . . . . . . . . . . . . . . . . . . . . . . . . . 73
5.1 Average market value, replacement value, vessel length, fuel capacity, and horsepower of
main engines . . . . . . . . . . . . . . . . . . . . . . . . . . . . . . . . . . . . . . . . . . 73
5.2 Vessel characteristics by whether the vessel fished on the West Coast and in Alaska, only
fished on the West Coast, only fished in Alaska, or did not fish . . . . . . . . . . . . . . . 79
6 Vessel Fuel Use, Speed, and Crew Size . . . . . . . . . . . . . . . . . . . . . . . . . . . . . . . . 81
41

6.1 Fuel use . . . . . . . . . . . . . . . . . . . . . . . . . . . . . . . . . . . . . . . . . . . . 81
6.2 Speed while fishing or steaming . . . . . . . . . . . . . . . . . . . . . . . . . . . . . . . . 88
6.3 Crew size . . . . . . . . . . . . . . . . . . . . . . . . . . . . . . . . . . . . . . . . . . . 92
7 At-Sea Deliveries and Shoreside Landings . . . . . . . . . . . . . . . . . . . . . . . . . . . . . . 100
7.1 At-sea deliveries . . . . . . . . . . . . . . . . . . . . . . . . . . . . . . . . . . . . . . . . 101
7.2 Shoreside landings . . . . . . . . . . . . . . . . . . . . . . . . . . . . . . . . . . . . . . . 102
8 Revenues . . . . . . . . . . . . . . . . . . . . . . . . . . . . . . . . . . . . . . . . . . . . . . . . 104
9 Costs . . . . . . . . . . . . . . . . . . . . . . . . . . . . . . . . . . . . . . . . . . . . . . . . . . 107
9.1 Variable costs . . . . . . . . . . . . . . . . . . . . . . . . . . . . . . . . . . . . . . . . . 108
9.2 Fixed costs . . . . . . . . . . . . . . . . . . . . . . . . . . . . . . . . . . . . . . . . . . . 109
9.3 Quota and permit costs on the West Coast . . . . . . . . . . . . . . . . . . . . . . . . . 113
9.4 Landings taxes and fees . . . . . . . . . . . . . . . . . . . . . . . . . . . . . . . . . . . . 114
10 Crew Share System . . . . . . . . . . . . . . . . . . . . . . . . . . . . . . . . . . . . . . . . . . 114
2 Catcher Vessel Data Analysis 116
11 Days at Sea by Fishery . . . . . . . . . . . . . . . . . . . . . . . . . . . . . . . . . . . . . . . . 116
11.1 Vessel participation in multiple fisheries . . . . . . . . . . . . . . . . . . . . . . . . . . . 120
12 Cost Disaggregation . . . . . . . . . . . . . . . . . . . . . . . . . . . . . . . . . . . . . . . . . . 128
12.1 West Coast portion of fixed costs . . . . . . . . . . . . . . . . . . . . . . . . . . . . . . . 129
13 Net Economic Benefits . . . . . . . . . . . . . . . . . . . . . . . . . . . . . . . . . . . . . . . . 131
13.1 Net revenue for all West Coast fishing activities . . . . . . . . . . . . . . . . . . . . . . . 133
13.2 Net revenue for West Coast catch share fisheries, crab, shrimp, and other fisheries . . . . 139
13.3 Net revenue including quota costs and earnings . . . . . . . . . . . . . . . . . . . . . . . 160
14 Economic Performance: Cost, Revenue, and Net Revenue Rates . . . . . . . . . . . . . . . . . . 171
14.1 All West Coast operations . . . . . . . . . . . . . . . . . . . . . . . . . . . . . . . . . . 172
14.2 All West Coast operations by vessel length . . . . . . . . . . . . . . . . . . . . . . . . . . 172
14.3 All West Coast operations by vessel home port state . . . . . . . . . . . . . . . . . . . . 176
Appendix 179
A Cost Disaggregation 179
42 CATCHER VESSEL REPORT
List of Tables
1 Deliveries by port area. . . . . . . . . . . . . . . . . . . . . . . . . . . . . . . . . . . . . . . . 12
2.1 Form status . . . . . . . . . . . . . . . . . . . . . . . . . . . . . . . . . . . . . . . . . . . . . 55
2.2 Number of forms, entities, and vessels by activity. . . . . . . . . . . . . . . . . . . . . . . . . . 56
3.1 Average days at sea. . . . . . . . . . . . . . . . . . . . . . . . . . . . . . . . . . . . . . . . . . 58
3.2 Total days at sea. . . . . . . . . . . . . . . . . . . . . . . . . . . . . . . . . . . . . . . . . . . 59
3.3 Trips to Alaska . . . . . . . . . . . . . . . . . . . . . . . . . . . . . . . . . . . . . . . . . . . . 60
4.1 Vessel home port. . . . . . . . . . . . . . . . . . . . . . . . . . . . . . . . . . . . . . . . . . . 61
4.2 Pacific whiting fishery days at sea by home port. . . . . . . . . . . . . . . . . . . . . . . . . . . 62
4.3 Non-whiting midwater trawl fishery days at sea by home port. . . . . . . . . . . . . . . . . . . 62
4.4 Groundfish with trawl gear fishery days at sea by home port. . . . . . . . . . . . . . . . . . . . 63
4.5 Groundfish with fixed gear fishery days at sea by home port. . . . . . . . . . . . . . . . . . . . 64
4.6 Groundfish fixed gear with a trawl permit fishery days at sea by home port. . . . . . . . . . . . 65
4.7 Groundfish fixed gear with a fixed gear permit fishery days at sea by home port. . . . . . . . . . 65
4.8 Shrimp fishery days at sea by home port. . . . . . . . . . . . . . . . . . . . . . . . . . . . . . . 66
4.9 Crab fishery days at sea by home port. . . . . . . . . . . . . . . . . . . . . . . . . . . . . . . . 67
4.10 Halibut fishery days at sea by home port. . . . . . . . . . . . . . . . . . . . . . . . . . . . . . . 68
4.11 Pacific halibut fishery days at sea by home port. . . . . . . . . . . . . . . . . . . . . . . . . . . 68
4.12 California halibut fishery days at sea by home port. . . . . . . . . . . . . . . . . . . . . . . . . 68
4.13 Salmon fishery days at sea by home port. . . . . . . . . . . . . . . . . . . . . . . . . . . . . . . 69
4.14 Tuna fishery days at sea by home port. . . . . . . . . . . . . . . . . . . . . . . . . . . . . . . . 69
4.15 Fishing in Alaska or other fisheries fishery days at sea by home port. . . . . . . . . . . . . . . . 70
4.16 Other West Coast Fisheries days at sea by home port. . . . . . . . . . . . . . . . . . . . . . . . 70
4.17 Chartering or research days at sea by home port. . . . . . . . . . . . . . . . . . . . . . . . . . . 71
4.18 Chartering, research, or tendering on the West Coast fishery days at sea by home port. . . . . . 71
4.19 Chartering, research, or tendering in Alaska fishery days at sea by home port. . . . . . . . . . . 72
4.20 Fishing in Alaska fishery days at sea by home port. . . . . . . . . . . . . . . . . . . . . . . . . 72
4.21 Steaming between West Coast and Alaska fishery days at sea by home port. . . . . . . . . . . . 73
5.1 Average vessel characteristics. . . . . . . . . . . . . . . . . . . . . . . . . . . . . . . . . . . . . 73
5.2 Haul outs . . . . . . . . . . . . . . . . . . . . . . . . . . . . . . . . . . . . . . . . . . . . . . . 78
5.3 Catcher vessels that processed at-sea. . . . . . . . . . . . . . . . . . . . . . . . . . . . . . . . 78
5.4 Average horsepower. . . . . . . . . . . . . . . . . . . . . . . . . . . . . . . . . . . . . . . . . . 79
5.5 Average replacement value. . . . . . . . . . . . . . . . . . . . . . . . . . . . . . . . . . . . . . 79
5.6 Average market value. . . . . . . . . . . . . . . . . . . . . . . . . . . . . . . . . . . . . . . . . 80
5.7 Average vessel fuel capacity. . . . . . . . . . . . . . . . . . . . . . . . . . . . . . . . . . . . . . 80
5.8 Average vessel length. . . . . . . . . . . . . . . . . . . . . . . . . . . . . . . . . . . . . . . . . 80
6.1 Daily fuel use. . . . . . . . . . . . . . . . . . . . . . . . . . . . . . . . . . . . . . . . . . . . . 82
43

6.2 Pacific whiting fishery fuel use. . . . . . . . . . . . . . . . . . . . . . . . . . . . . . . . . . . . 83
6.3 Groundfish with midwater trawl gear fishery fuel use. . . . . . . . . . . . . . . . . . . . . . . . 83
6.4 Groundfish with trawl gear fishery fuel use. . . . . . . . . . . . . . . . . . . . . . . . . . . . . . 83
6.5 Groundfish with fixed gear fishery fuel use. . . . . . . . . . . . . . . . . . . . . . . . . . . . . . 84
6.6 Groundfish fixed gear with a trawl permit fishery fuel use. . . . . . . . . . . . . . . . . . . . . . 84
6.7 Groundfish fixed gear with a fixed gear permit fishery fuel use. . . . . . . . . . . . . . . . . . . 84
6.8 Crab fishery fuel use. . . . . . . . . . . . . . . . . . . . . . . . . . . . . . . . . . . . . . . . . 85
6.9 Halibut fishery fuel use. . . . . . . . . . . . . . . . . . . . . . . . . . . . . . . . . . . . . . . . 85
6.10 Pacific halibut fishery fuel use. . . . . . . . . . . . . . . . . . . . . . . . . . . . . . . . . . . . 85
6.11 California halibut fishery fuel use. . . . . . . . . . . . . . . . . . . . . . . . . . . . . . . . . . . 86
6.12 Salmon fishery fuel use. . . . . . . . . . . . . . . . . . . . . . . . . . . . . . . . . . . . . . . . 86
6.13 Shrimp fishery fuel use. . . . . . . . . . . . . . . . . . . . . . . . . . . . . . . . . . . . . . . . 86
6.14 Tuna fishery fuel use. . . . . . . . . . . . . . . . . . . . . . . . . . . . . . . . . . . . . . . . . 87
6.15 Steaming between West Coast and Alaska fishery fuel use. . . . . . . . . . . . . . . . . . . . . 87
6.16 Average total fuel use. . . . . . . . . . . . . . . . . . . . . . . . . . . . . . . . . . . . . . . . . 87
6.17 Average speed. . . . . . . . . . . . . . . . . . . . . . . . . . . . . . . . . . . . . . . . . . . . . 88
6.18 Pacific whiting fishery fishing speed. . . . . . . . . . . . . . . . . . . . . . . . . . . . . . . . . 89
6.19 Groundfish with midwater trawl gear fishery fishing speed. . . . . . . . . . . . . . . . . . . . . 89
6.20 Groundfish with trawl gear fishery fishing speed. . . . . . . . . . . . . . . . . . . . . . . . . . . 89
6.21 California halibut fishery fishing speed. . . . . . . . . . . . . . . . . . . . . . . . . . . . . . . . 90
6.22 Salmon fishery fishing speed. . . . . . . . . . . . . . . . . . . . . . . . . . . . . . . . . . . . . 90
6.23 Shrimp fishery fishing speed. . . . . . . . . . . . . . . . . . . . . . . . . . . . . . . . . . . . . 90
6.24 Tuna fishery fishing speed. . . . . . . . . . . . . . . . . . . . . . . . . . . . . . . . . . . . . . 91
6.25 Steaming between West Coast and Alaska fishery fishing speed. . . . . . . . . . . . . . . . . . 91
6.26 Average crew size. . . . . . . . . . . . . . . . . . . . . . . . . . . . . . . . . . . . . . . . . . . 93
6.27 Pacific whiting fishery crew size. . . . . . . . . . . . . . . . . . . . . . . . . . . . . . . . . . . 94
6.28 Groundfish with midwater trawl gear fishery crew size. . . . . . . . . . . . . . . . . . . . . . . . 94
6.29 Groundfish with trawl gear fishery crew size. . . . . . . . . . . . . . . . . . . . . . . . . . . . . 94
6.30 Groundfish with fixed gear fishery crew size. . . . . . . . . . . . . . . . . . . . . . . . . . . . . 95
6.31 Groundfish fixed gear with a trawl permit fishery crew size. . . . . . . . . . . . . . . . . . . . . 95
6.32 Groundfish fixed gear with a fixed gear permit fishery crew size. . . . . . . . . . . . . . . . . . 95
6.33 Crab fishery crew size. . . . . . . . . . . . . . . . . . . . . . . . . . . . . . . . . . . . . . . . . 96
6.34 Halibut fishery crew size. . . . . . . . . . . . . . . . . . . . . . . . . . . . . . . . . . . . . . . 96
6.35 Pacific halibut fishery crew size. . . . . . . . . . . . . . . . . . . . . . . . . . . . . . . . . . . . 96
6.36 California halibut fishery crew size. . . . . . . . . . . . . . . . . . . . . . . . . . . . . . . . . . 97
6.37 Salmon fishery crew size. . . . . . . . . . . . . . . . . . . . . . . . . . . . . . . . . . . . . . . 97
6.38 Shrimp fishery crew size. . . . . . . . . . . . . . . . . . . . . . . . . . . . . . . . . . . . . . . 97
6.39 Tuna fishery crew size. . . . . . . . . . . . . . . . . . . . . . . . . . . . . . . . . . . . . . . . . 98
6.40 Steaming between West Coast and Alaska fishery crew size. . . . . . . . . . . . . . . . . . . . . 98
6.41 Average number of individuals employed. . . . . . . . . . . . . . . . . . . . . . . . . . . . . . . 99
6.42 Average number of individuals employed. . . . . . . . . . . . . . . . . . . . . . . . . . . . . . . 99
6.43 Total number of crew positions and individuals employed. . . . . . . . . . . . . . . . . . . . . . 99
7.1 Total shoreside landings and at-sea deliveries. . . . . . . . . . . . . . . . . . . . . . . . . . . . 100
7.2 At-sea landings and deliveries. . . . . . . . . . . . . . . . . . . . . . . . . . . . . . . . . . . . . 101
7.3 Shoreside landings and deliveries: groundfish. . . . . . . . . . . . . . . . . . . . . . . . . . . . 102
44 CATCHER VESSEL REPORT

7.4 Shoreside landings and deliveries: non-groundfish. . . . . . . . . . . . . . . . . . . . . . . . . . 103
8.1 Average annual revenue. . . . . . . . . . . . . . . . . . . . . . . . . . . . . . . . . . . . . . . . 105
9.1 Variable expenses. . . . . . . . . . . . . . . . . . . . . . . . . . . . . . . . . . . . . . . . . . . 108
9.2 Capitalized expenditures on vessel and on-board equipment, fishing gear, and processing equipment. 110
9.3 Expenses on vessel and on-board equipment, fishing gear, and processing equipment. . . . . . . 111
9.4 Capitalized expenditures and expenses on vessel and on-board equipment, fishing gear, and
processing equipment. . . . . . . . . . . . . . . . . . . . . . . . . . . . . . . . . . . . . . . . . 111
9.5 Other fixed expenses. . . . . . . . . . . . . . . . . . . . . . . . . . . . . . . . . . . . . . . . . 112
9.6 Depreciation. . . . . . . . . . . . . . . . . . . . . . . . . . . . . . . . . . . . . . . . . . . . . . 112
9.7 Quota and permit costs. . . . . . . . . . . . . . . . . . . . . . . . . . . . . . . . . . . . . . . . 113
9.8 Landings taxes. . . . . . . . . . . . . . . . . . . . . . . . . . . . . . . . . . . . . . . . . . . . 114
10.1 Frequency of crew share systems. . . . . . . . . . . . . . . . . . . . . . . . . . . . . . . . . . . 114
10.2 Percent of trips with owner-operated vessels. . . . . . . . . . . . . . . . . . . . . . . . . . . . . 115
10.3 Average crew shares when vessels were owner-operated. . . . . . . . . . . . . . . . . . . . . . . 115
10.4 Average crew shares when using a hired captain. . . . . . . . . . . . . . . . . . . . . . . . . . . 115
11.1 Average days at sea by fishery. . . . . . . . . . . . . . . . . . . . . . . . . . . . . . . . . . . . 118
11.2 Total days at sea by fishery. . . . . . . . . . . . . . . . . . . . . . . . . . . . . . . . . . . . . . 119
11.3 Participation in multiple fisheries. . . . . . . . . . . . . . . . . . . . . . . . . . . . . . . . . . . 120
12.1 All West Coast fixed costs. . . . . . . . . . . . . . . . . . . . . . . . . . . . . . . . . . . . . . 129
12.2 Summary of costs on the West Coast. . . . . . . . . . . . . . . . . . . . . . . . . . . . . . . . 130
13.1 Table of contents for net revenue tables. An EDC vessel is defined as any vessel that had a
limited entry trawl permit on the vessel in the designated year. A catch share vessel is any vessel
that participated in the West Coast Groundfish Trawl Catch Share Program at any time in the
designated year. . . . . . . . . . . . . . . . . . . . . . . . . . . . . . . . . . . . . . . . . . . . 133
13.2 West Coast average variable cost and total cost net revenue for EDC vessels. . . . . . . . . . . 134
13.3 West Coast average variable cost and total cost net revenue for catch share vessels. . . . . . . . 135
13.4 All catch shares (whiting and non-whiting groundfish) average variable cost and total cost net
revenue for catch share vessels. . . . . . . . . . . . . . . . . . . . . . . . . . . . . . . . . . . . 136
13.5 Whiting (shoreside and at-sea) average variable cost and total cost net revenue for catch share
vessels. . . . . . . . . . . . . . . . . . . . . . . . . . . . . . . . . . . . . . . . . . . . . . . . . 137
13.6 Groundfish (non-whiting) average variable cost and total cost net revenue for catch share vessels. 138
13.7 At-sea Pacific whiting fishery average variable cost and total cost net revenue. . . . . . . . . . . 140
13.8 Shoreside Pacific whiting fishery average variable cost and total cost net revenue. . . . . . . . . 141
13.9 Non-whiting midwater trawl fishery average variable cost and total cost net revenue. . . . . . . 142
13.10 DTS trawl with trawl endorsement fishery average variable cost and total cost net revenue. . . . 143
13.11 Non-whiting, non-DTS trawl with trawl endorsement fishery average variable cost and total cost
net revenue. . . . . . . . . . . . . . . . . . . . . . . . . . . . . . . . . . . . . . . . . . . . . . 144
13.12 Groundfish fixed gear with trawl endorsement fishery average variable cost and total cost net
revenue. . . . . . . . . . . . . . . . . . . . . . . . . . . . . . . . . . . . . . . . . . . . . . . . 145
13.13 Groundfish fixed gear with fixed gear endorsement fishery average variable cost and total cost net
revenue. . . . . . . . . . . . . . . . . . . . . . . . . . . . . . . . . . . . . . . . . . . . . . . . 146
13.14 Crab fishery average variable cost and total cost net revenue. . . . . . . . . . . . . . . . . . . . 147
13.15 Shrimp fishery average variable cost and total cost net revenue. . . . . . . . . . . . . . . . . . . 148
13.16 Other fisheries fishery average variable cost and total cost net revenue. . . . . . . . . . . . . . . 149
45 CATCHER VESSEL REPORT

13.17 All catch share (whiting and non-whiting groundfish) average variable cost and total cost net
revenue by survey year with and without quota revenue and quota costs. . . . . . . . . . . . . . 161
13.18 Whiting vessel average net revenue for all catch shares participation with quota earnings and
costs by survey year. . . . . . . . . . . . . . . . . . . . . . . . . . . . . . . . . . . . . . . . . . 165
13.19 Non-whiting groundfish vessel average net revenue for all catch shares participation with quota
earnings and costs by survey year. . . . . . . . . . . . . . . . . . . . . . . . . . . . . . . . . . . 169
14.1 Mean and median rates for all vessels that fished on the West Coast. . . . . . . . . . . . . . . . 172
14.2 Small vessel mean and median rates for West Coast operations. . . . . . . . . . . . . . . . . . . 173
14.3 Medium vessel mean and median rates for West Coast operations. . . . . . . . . . . . . . . . . 174
14.4 Large vessel mean and median rates for West Coast operations. . . . . . . . . . . . . . . . . . . 175
14.5 Washington mean and median rates for West Coast operations. . . . . . . . . . . . . . . . . . . 176
14.6 Oregon mean and median rates for West Coast operations. . . . . . . . . . . . . . . . . . . . . 177
14.7 California mean and median rates for West Coast operations. . . . . . . . . . . . . . . . . . . . 178
46 CATCHER VESSEL REPORT

List of Figures
1 Number of catcher vessels participating in the At-sea and Shoreside limited entry trawl groundfish
fisheries (2000-2010) and the number of vessels participating in the West Coast Groundfish Trawl
Catch Share Program (2011-2015). . . . . . . . . . . . . . . . . . . . . . . . . . . . . . . . . . 8
2 Quota prices for IFQ target and bycatch species with the highest number of transactions per year.
The size of the circle represents the number of trades included in the price calculation. . . . . . 9
3 Landings and unharvested sector allocation and average ex-vessel prices (2015 $) in the At-sea
and Shoreside Pacific whiting sectors. Pacific whiting includes any reapportionment among sectors
that may have occurred during the season. . . . . . . . . . . . . . . . . . . . . . . . . . . . . 10
4 Landings (dark blue), Discards (light blue), and Unharvested (grey) trawl sector allocation
of non-whiting groundfish species (millions of lbs). If carryover was made available for a
specific quota category, the total weight was deducted from the original year and added to
the following year (2011-2015). Except for sablefish, there was no trawl-specific quota in 2009
and 2010; for context, Unharvested (Est) (light grey) was calculated for 2009 and 2010 as
Optimal Yield ×
2011 Trawl Sector Allocation
2011 Annual Catch Limit
− Landings − Discards by stock or complex. . . 11
5 Landings by fishery and week (y-axis varies across fisheries) (left) and total ex-vessel revenue
(millions of $) (right) in each fishery in 2015. Red points represent highest landing (millions of
pounds) by fishery. Data are not shown for weeks where there were less than three vessels fishing
or if one vessel represented more than 90% of landings weight or revenue. . . . . . . . . . . . . 14
6 Average variable cost net revenue (ex-vessel revenue minus variable costs), and average total cost
net revenue (ex-vessel revenue minus variable costs and fixed costs) per vessel from participation
in all of the catch share fisheries combined (thousands of 2015 $). Dashed line represents the
beginning of the catch share program. . . . . . . . . . . . . . . . . . . . . . . . . . . . . . . . 15
7 Fleet-wide variable cost net revenue (ex-vessel revenue minus variable costs), and fleet-wide total
cost net revenue (ex-vessel revenue minus variable costs and fixed costs) from participation in all
of the catch share fisheries combined (millions of 2015 $). . . . . . . . . . . . . . . . . . . . . 15
8 Ex-vessel prices (2015 $) for top species from 1994 to 2015. . . . . . . . . . . . . . . . . . . . 16
9 Average fixed (dashed line) and variable costs (solid line) (thousands of 2015 $) per vessel in the
West Coast Trawl Groundfish Catch Share Program. Note that vessels participating in Exempted
Fishing Permit (EFP) programs during the pre-catch share period (2009-2010) paid for their own
observer coverage. . . . . . . . . . . . . . . . . . . . . . . . . . . . . . . . . . . . . . . . . . 17
10 The species composition of catch (left) and revenue (right) in the At-sea Pacific whiting fishery
(%). Dashed line represents the beginning of the catch share program. . . . . . . . . . . . . . 18
11 Total ex-vessel revenue earned by vessels that participated in the At-sea Pacific whiting fishery
(black outline) by fishery (millions of 2015 $) (top) and number of vessels that participated in
each fishery (bottom). Dashed line represents the beginning of the catch share program.
*Some
values are suppressed to protect confidential data. . . . . . . . . . . . . . . . . . . . . . . . . . 19
47
12 Average variable cost net revenue (ex-vessel revenue minus variable costs) (left), and average total
cost net revenue (ex-vessel revenue minus variable costs and fixed costs) (right) from participation
in the At-sea Pacific whiting fishery (thousands of 2015 $). Dashed line represents the beginning
of the catch share program. . . . . . . . . . . . . . . . . . . . . . . . . . . . . . . . . . . . . 20
13 Average fixed (dashed line) and variable costs (solid line) per vessel in the At-sea Pacific whiting
fishery(thousands of 2015 $). . . . . . . . . . . . . . . . . . . . . . . . . . . . . . . . . . . . 21
14 The species composition of catch (left) and revenue (right) in the Shoreside Pacific whiting fishery
(%). Dashed line represents the beginning of the catch share program. . . . . . . . . . . . . . 22
15 Total ex-vessel revenue earned by vessels that participated in the Shoreside Pacific whiting fishery
(black outline) by fishery (millions of 2015 $) (top) and number of vessels that participated in
each fishery (bottom). Dashed line represents the beginning of the catch share program.
*Some
values are suppressed to protect confidential data. . . . . . . . . . . . . . . . . . . . . . . . . 22
16 Average variable cost net revenue (ex-vessel revenue minus variable costs) (left), and average
total cost net revenue (ex-vessel revenue minus variable costs and fixed costs) (right) from
participation in the Shoreside Pacific whiting fishery (thousands of 2015 $). Dashed line represents
the beginning of the catch share program. . . . . . . . . . . . . . . . . . . . . . . . . . . . . . 23
17 Average fixed (dashed line) and variable costs (solid line) per vessel in the Shoreside Pacific
whiting fishery (thousands of 2015 $). . . . . . . . . . . . . . . . . . . . . . . . . . . . . . . . 24
18 The species composition of catch (left) and revenue (right) in the Non-whiting midwater trawl
(%). Vessels did not begin participating in this fishery until 2012. . . . . . . . . . . . . . . . . 25
19 Total ex-vessel revenue earned by vessels that participated in the non-whiting midwater trawl
fishery (black outline) by fishery (millions of 2015 $) (top) and number of vessels that participated
in each fishery (bottom). Vessels did not begin participating in this fishery until 2012.
*Some
values are suppressed to protect confidential data. . . . . . . . . . . . . . . . . . . . . . . . . . 26
20 Average variable cost net revenue (ex-vessel revenue minus variable costs) (left), and average total
cost net revenue (ex-vessel revenue minus variable costs and fixed costs) (right) from participation
in the Non-whiting midwater trawl (thousands of 2015 $). Vessels did not begin participating in
this fishery until 2012. . . . . . . . . . . . . . . . . . . . . . . . . . . . . . . . . . . . . . . . 26
21 Average fixed (dashed line) and variable costs (solid line) per vessel in the Non-whiting midwater
trawl fishery (thousands of 2015 $). . . . . . . . . . . . . . . . . . . . . . . . . . . . . . . . . 27
22 The species composition of catch (left) and revenue (right) in the DTS trawl with trawl
endorsement fishery (%). Dashed line represents the beginning of the catch share program. . . 28
23 Total ex-vessel revenue earned by vessels that participated in the DTS trawl with trawl endorsement
fishery (black outline) by fishery (millions of 2015 $) (top) and number of vessels that participated
in each fishery (bottom). Dashed line represents the beginning of the catch share program.
*Some
values are suppressed to protect confidential data. . . . . . . . . . . . . . . . . . . . . . . . . 29
24 Average variable cost net revenue (ex-vessel revenue minus variable costs) (left), and average total
cost net revenue (ex-vessel revenue minus variable costs and fixed costs) (right) from participation
in the DTS trawl with trawl endorsement fishery (thousands of 2015 $). Dashed line represents
the beginning of the catch share program. . . . . . . . . . . . . . . . . . . . . . . . . . . . . . 29
25 Average fixed (dashed line) and variable costs (solid line) per vessel in the DTS trawl with trawl
endorsement fishery (thousands of 2015 $). . . . . . . . . . . . . . . . . . . . . . . . . . . . . 30
26 The species composition of catch (left) and revenue (right) in the Non-whiting, non-DTS trawl
with trawl endorsement fishery (%). Dashed line represents the beginning of the catch share
program. . . . . . . . . . . . . . . . . . . . . . . . . . . . . . . . . . . . . . . . . . . . . . . 31
48 CATCHER VESSEL REPORT

27 Total ex-vessel revenue earned by vessels that participated in the Non-whiting, non-DTS trawl with
trawl endorsement fishery (black outline) by fishery (top) and number of vessels that participated
in each fishery (bottom). Dashed line represents the beginning of the catch share program.
*Some
values are suppressed to protect confidential data. . . . . . . . . . . . . . . . . . . . . . . . . . 32
28 Average variable cost net revenue (ex-vessel revenue minus variable costs) (left), and average total
cost net revenue (ex-vessel revenue minus variable costs and fixed costs) (right) from participation
in the Non-whiting, non-DTS trawl with trawl endorsement fishery (thousands of 2015 $). Dashed
line represents the beginning of the catch share program. . . . . . . . . . . . . . . . . . . . . . 33
29 Average fixed (dashed line) and variable costs (solid line) per vessel in the Non-whiting, non-DTS
trawl with trawl endorsement fishery (thousands of 2015 $). . . . . . . . . . . . . . . . . . . . 34
30 The species composition of catch (left) and revenue (right) in the Groundfish fixed gear with
trawl endorsement fishery (%). The data for 2009 and 2010 are not shown because they represent
a small group of vessels participating in an exempted fishery permit program. . . . . . . . . . . 35
31 Total ex-vessel revenue earned by vessels that participated in the Groundfish fixed gear with trawl
endorsement fishery (black outline) by fishery (millions of 2015 $) (top) and number of vessels
that participated in each fishery (bottom).
*Some values are suppressed to protect confidential
data. . . . . . . . . . . . . . . . . . . . . . . . . . . . . . . . . . . . . . . . . . . . . . . . . 36
32 Average variable cost net revenue (ex-vessel revenue minus variable costs) (left), and average total
cost net revenue (ex-vessel revenue minus variable costs and fixed costs) (right) from participation
in the Groundfish fixed gear with trawl endorsement fishery (thousands of 2015 $). Dashed line
represents the beginning of the catch share program. . . . . . . . . . . . . . . . . . . . . . . . 36
33 Average fixed (dashed line) and variable costs (solid line) per vessel in the Groundfish fixed gear
with trawl endorsement fishery (thousands of 2015 $). The costs for 2009 and 2010 are not
shown here because they were collected from a small group of vessels participating in an exempted
fishing permit fishery. . . . . . . . . . . . . . . . . . . . . . . . . . . . . . . . . . . . . . . . . 37
34 Number of catcher vessels participating in the catch share fisheries by home port region. . . . . 38
35 Market value and replacement value (millions of dollars) of all vessels that completed a survey . 74
36 Vessel length (feet) of all vessels that completed a survey . . . . . . . . . . . . . . . . . . . . . 75
37 Vessel fuel capacity (thousands of gallons) of all vessels that completed a survey . . . . . . . . 76
38 Horsepower of main engines of all vessels that completed a survey . . . . . . . . . . . . . . . . 77
39 Total landings by species group (thousands of metric tons) . . . . . . . . . . . . . . . . . . . . 104
40 Total ex-vessel shoreside revenue (millions of dollars) . . . . . . . . . . . . . . . . . . . . . . . 106
41 Participation in multiple fisheries - 2009. . . . . . . . . . . . . . . . . . . . . . . . . . . . . . . 121
42 Participation in multiple fisheries - 2010. . . . . . . . . . . . . . . . . . . . . . . . . . . . . . . 122
43 Participation in multiple fisheries - 2011. . . . . . . . . . . . . . . . . . . . . . . . . . . . . . . 123
44 Participation in multiple fisheries - 2012. . . . . . . . . . . . . . . . . . . . . . . . . . . . . . . 124
45 Participation in multiple fisheries - 2013. . . . . . . . . . . . . . . . . . . . . . . . . . . . . . . 125
46 Participation in multiple fisheries - 2014. . . . . . . . . . . . . . . . . . . . . . . . . . . . . . . 126
47 Participation in multiple fisheries - 2015. . . . . . . . . . . . . . . . . . . . . . . . . . . . . . . 127
48 Net revenue explanation . . . . . . . . . . . . . . . . . . . . . . . . . . . . . . . . . . . . . . . 131
49 West Coast average variable cost and total cost net revenue for EDC vessels. . . . . . . . . . . 134
50 West Coast average variable cost and total cost net revenue for catch share vessels. . . . . . . . 135
51 All catch shares (whiting and non-whiting groundfish) average variable cost and total cost net
revenue for catch share vessels. . . . . . . . . . . . . . . . . . . . . . . . . . . . . . . . . . . . 136
49 CATCHER VESSEL REPORT
52 Whiting (shoreside and at-sea) average variable cost and total cost net revenue for catch share
vessels. . . . . . . . . . . . . . . . . . . . . . . . . . . . . . . . . . . . . . . . . . . . . . . . . 137
53 Groundfish (non-whiting) average variable cost and total cost net revenue for catch share vessels. 138
54 At-sea Pacific whiting fishery variable cost net revenue and total cost net revenue. . . . . . . . 140
55 Shoreside Pacific whiting fishery variable cost net revenue and total cost net revenue. . . . . . . 141
56 Non-whiting midwater trawl fishery variable cost net revenue and total cost net revenue. . . . . 142
57 DTS trawl with trawl endorsement fishery variable cost net revenue and total cost net revenue. . 143
58 Non-whiting, non-DTS trawl with trawl endorsement fishery variable cost net revenue and total
cost net revenue. . . . . . . . . . . . . . . . . . . . . . . . . . . . . . . . . . . . . . . . . . . . 144
59 Groundfish fixed gear with trawl endorsement fishery variable cost net revenue and total cost net
revenue. . . . . . . . . . . . . . . . . . . . . . . . . . . . . . . . . . . . . . . . . . . . . . . . 145
60 Groundfish fixed gear with fixed gear endorsement fishery variable cost net revenue and total cost
net revenue. . . . . . . . . . . . . . . . . . . . . . . . . . . . . . . . . . . . . . . . . . . . . . 146
61 Crab variable cost net revenue and total cost net revenue. . . . . . . . . . . . . . . . . . . . . . 147
62 Shrimp variable cost net revenue and total cost net revenue. . . . . . . . . . . . . . . . . . . . 148
63 Other fisheries variable cost net revenue and total cost net revenue. . . . . . . . . . . . . . . . 149
64 Net revenue in all catch shares fisheries (whiting and non-whiting groundfish). . . . . . . . . . . 151
65 Net revenue in all whiting fisheries (shoreside and at-sea). . . . . . . . . . . . . . . . . . . . . . 152
66 Net revenue in all non-whiting groundfish fisheries (catch shares only). . . . . . . . . . . . . . . 153
67 Net revenue in the At-sea Pacific whiting fishery. . . . . . . . . . . . . . . . . . . . . . . . . . 154
68 Net revenue in the Shoreside Pacific whiting fishery. . . . . . . . . . . . . . . . . . . . . . . . . 155
69 Net revenue in the Non-whiting midwater trawl fishery. . . . . . . . . . . . . . . . . . . . . . . 156
70 Net revenue in the DTS trawl with trawl endorsement fishery. . . . . . . . . . . . . . . . . . . . 157
71 Net revenue in the Non-whiting, non-DTS trawl with trawl endorsement fishery. . . . . . . . . . 158
72 Net revenue in the Groundfish fixed gear with trawl endorsement fishery. . . . . . . . . . . . . . 159
73 All catch share (whiting and non-whiting groundfish) average net revenue with quota earnings
and costs by survey year. . . . . . . . . . . . . . . . . . . . . . . . . . . . . . . . . . . . . . . 162
74 All catch share (whiting and non-whiting groundfish) average net revenue without quota earnings
and costs by survey year. . . . . . . . . . . . . . . . . . . . . . . . . . . . . . . . . . . . . . . 163
75 Whiting vessel average net revenue for all catch shares participation with quota earnings and
costs by survey year. . . . . . . . . . . . . . . . . . . . . . . . . . . . . . . . . . . . . . . . . . 166
76 Whiting vessel average net revenue for all catch shares participation without quota earnings and
costs by survey year. . . . . . . . . . . . . . . . . . . . . . . . . . . . . . . . . . . . . . . . . . 167
77 Non-whiting groundfish vessel average net revenue for all catch shares participation with quota
earnings and costs by survey year. . . . . . . . . . . . . . . . . . . . . . . . . . . . . . . . . . . 170
78 Non-whiting groundfish vessel average net revenue for all catch shares participation without quota
earnings and costs by survey year. . . . . . . . . . . . . . . . . . . . . . . . . . . . . . . . . . . 171
50 CATCHER VESSEL REPORT

Catcher Vessel Data Summaries
1 Introduction
1.1 Background
The US West Coast groundfish fishery takes place off the coasts of Washington, Oregon and California, and
comprises over 90 different species of fish. Fish are harvested both commercially and recreationally. The commercial
fishery has four components: limited entry with a trawl endorsement, limited entry with a fixed gear endorsement,
open access, and tribal. In January 2011, the West Coast Limited Entry Groundfish Trawl fishery transitioned to
the West Coast Groundfish Trawl Catch Share Program. The catch share program consists of cooperatives for
the at-sea mothership (including catcher vessels and motherships) and catcher-processor fleets, and an individual
fishing quota (IFQ) program for the shorebased trawl fleet.1
The Economic Data Collection (EDC) Program2 was implemented as part of these new regulations to monitor
the economic effects of the catch share program. Annual economic data submissions are required from all fishery
participants: catcher vessels, motherships, catcher-processors, and first receivers and shorebased processors §50
CFR 660.114. Baseline, pre-catch share, data were submitted in 2011 for the 2009 and 2010 operating years. Data
for the first year the fishery operated under the catch share program (2011) were submitted in 2012. The most
recent data (2015) were collected in 2014.
This report summarizes the 2009-2015 EDC catcher vessel survey data. The EDC Program has enhanced the
quantity and quality of economic information available for analysis and the management of the West Coast
groundfish trawl fishery. Prior to the EDC Program, voluntary cost earnings surveys were available for 64% of the
shoreside catcher vessels with limited entry groundfish permits with trawl endorsements (trawl fleet) (2003-2004
collection3) and 57% of the fleet for the 2007-2008 collection.4 Moreover, no costs and earnings data were available
for catcher vessels that delivered to motherships.
1 Information about the Catch Share Program is available at http://www.westcoast.fisheries.noaa.gov/fisheries/groundfish_catch_
shares/.
2 Additional information on the EDC Program, including the EDC data collection forms can be found at www.nwfsc.noaa.gov/edc
3 Lian, C.E. 2010. West Coast limited entry groundfish trawl cost earnings survey protocols and results for 2004. U.S. Department
of Commerce, NOAA Technical Memorandum NMFS-NWFSC-107, 35 p.
4 Lian, C.E. 2012. West Coast limited entry groundfish cost earnings survey: Protocol and results for 2008. U.S. Department of
Commerce, NOAA Technical Memorandum NMFS-NWFSC-121, 62 p.
51

1.2 Understanding the report
It is important to remember that the information presented in this report is for all vessels that were required
to complete the EDC form, as described above. Throughout the report, these vessels are referred to as EDC
vessels. The EDC vessels include: 1) vessels that have historically participated in the trawl fishery and currently
still participate; 2) vessels that no longer participate in the trawl fishery but still have a limited entry trawl permit;
and 3) vessels that have not historically had a limited entry trawl permit, but have now obtained one to participate
in the gear switching program (use of fixed gear is allowed under the program).
The unit of analysis identified in the summary tables varies by the information summarized. There are three different
units of analysis, “entities”, “vessels”, and “participants”. An “entity” is defined as a unique combination of an
owner or lessee and vessel, whereas a “vessel” refers to all activities related to that vessel, regardless of the number
individuals who owned or leased the vessel. Therefore, multiple forms could be submitted for one vessel, because
there were multiple owners or lessees. Finally, “participants” refers to the individuals who actually completed the
report. Each summary table states whether the count of individuals represents entities or participants.
For each value displayed in the summary data tables, N is displayed. In most cases, N represents the number of
responses to the question that are not “NA” and not zero, unless noted otherwise. For example, in Table 9.1,
for the 96 vessels that had expenses on ice, the mean expense in 2012 was $6,400. Therefore, to calculate the
average expense for ice for the entire fleet, one would need to multiply the mean by 96 and then divide by the
total number of vessels (129).
The one major difference between the baseline forms (2009 and 2010) and 2011-current forms is that vessels
that did not fish during the survey period were only required to fill out the first few pages of the form during
the baseline collection. The vessels that did not fish in 2009 and 2010 only provided the vessel name, vessel ID,
home port, length of the vessel, fuel capacity, and horsepower of main engines, contact information, and permit
numbers. Starting with the 2011 forms, all participants have been required to complete the entire form to capture
information such as capital investments and earnings from lease or sale of quota or permits.
One last guideline when interpreting the aggregated data is the use of fiscal year. Although participants are
identified on a calendar year basis, they complete the form using information based on the fiscal year of the entity.
In previous reports, the data were reported by fiscal year. This report reallocates the costs reported on the form to
calendar year, primarily accomplished by using information from outside of the EDC Program (primarily fish tickets
and At-Sea Hake Observer Program data). For the seven years of data collected from catcher vessels, 91% of
entities used a fiscal year that is the same as the calendar year.
There is a 3-year lag for fully finalized EDC data, so data from the most recent displayed year (2015) should be
considered preliminary. EDC forms are submitted by September 1 each year for the previous fiscal year (FY2011
data are received in September of 2012), allowing companies to “close their books” and file taxes before completing
their EDC forms. The QA/QC process requires approximately 6 months. This means that 2011 EDC data were
available in March 2013; however, there is one additional complication. Participants submit data by fiscal year
which varies by company and may not completely overlap by calendar year. Although the reports are released at a
2-year lag, the data are not considered finalized until the following year once the complete set of data have been
received and processed. As a result, finalized calendar year 2015 data will not be available until Spring 2018.
In order to provide information about the level of variability within each measure reported, a symbol is presented
along with all means to indicate the range of the coefficient of variation. The stacked dots included in the tables
provide information about the coefficient of variation ( C V ) of the mean. We use the following scoring:
DATA SUMMARIES 52 CATCHER VESSEL REPORT
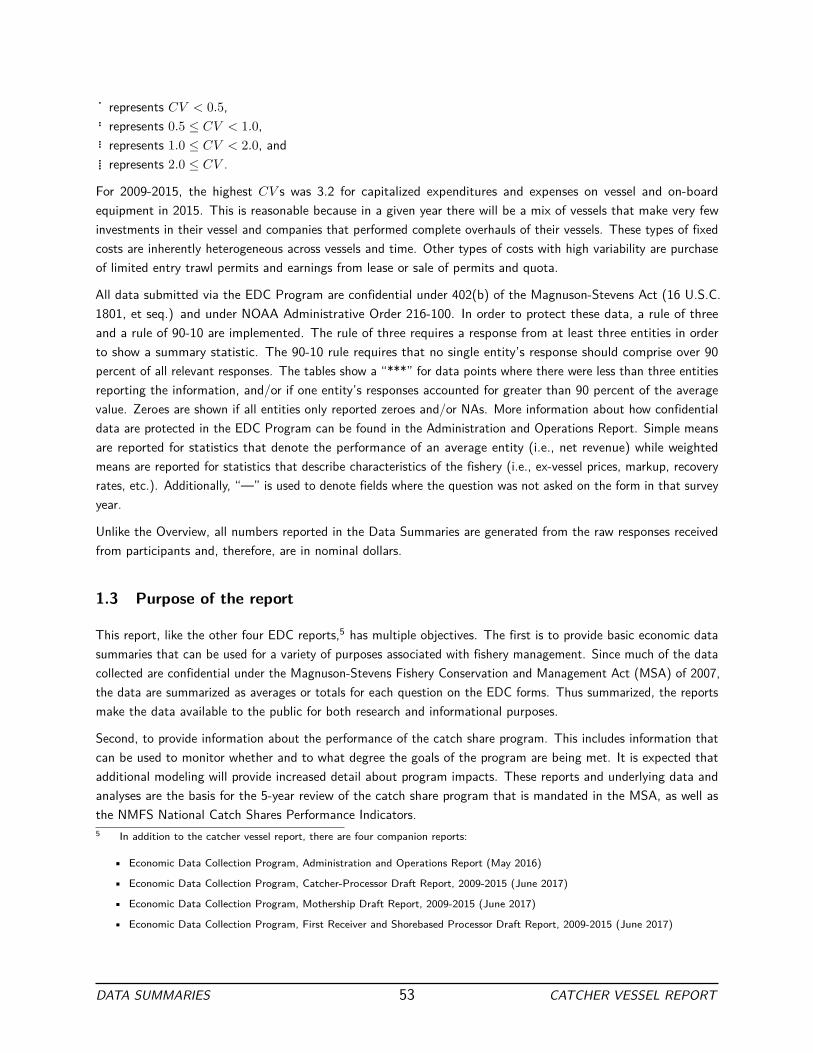
. represents C V < 0 . 5 ,
.. represents 0 . 5 ≤ C V < 1 . 0 ,
... represents 1 . 0 ≤ C V < 2 . 0 , and
.... represents 2 . 0 ≤ C V .
For 2009-2015, the highest C V s was 3.2 for capitalized expenditures and expenses on vessel and on-board
equipment in 2015. This is reasonable because in a given year there will be a mix of vessels that make very few
investments in their vessel and companies that performed complete overhauls of their vessels. These types of fixed
costs are inherently heterogeneous across vessels and time. Other types of costs with high variability are purchase
of limited entry trawl permits and earnings from lease or sale of permits and quota.
All data submitted via the EDC Program are confidential under 402(b) of the Magnuson-Stevens Act (16 U.S.C.
1801, et seq.) and under NOAA Administrative Order 216-100. In order to protect these data, a rule of three
and a rule of 90-10 are implemented. The rule of three requires a response from at least three entities in order
to show a summary statistic. The 90-10 rule requires that no single entity’s response should comprise over 90
percent of all relevant responses. The tables show a “***” for data points where there were less than three entities
reporting the information, and/or if one entity’s responses accounted for greater than 90 percent of the average
value. Zeroes are shown if all entities only reported zeroes and/or NAs. More information about how confidential
data are protected in the EDC Program can be found in the Administration and Operations Report. Simple means
are reported for statistics that denote the performance of an average entity (i.e., net revenue) while weighted
means are reported for statistics that describe characteristics of the fishery (i.e., ex-vessel prices, markup, recovery
rates, etc.). Additionally, “—” is used to denote fields where the question was not asked on the form in that survey
year.
Unlike the Overview, all numbers reported in the Data Summaries are generated from the raw responses received
from participants and, therefore, are in nominal dollars.
1.3 Purpose of the report
This report, like the other four EDC reports,5 has multiple objectives. The first is to provide basic economic data
summaries that can be used for a variety of purposes associated with fishery management. Since much of the data
collected are confidential under the Magnuson-Stevens Fishery Conservation and Management Act (MSA) of 2007,
the data are summarized as averages or totals for each question on the EDC forms. Thus summarized, the reports
make the data available to the public for both research and informational purposes.
Second, to provide information about the performance of the catch share program. This includes information that
can be used to monitor whether and to what degree the goals of the program are being met. It is expected that
additional modeling will provide increased detail about program impacts. These reports and underlying data and
analyses are the basis for the 5-year review of the catch share program that is mandated in the MSA, as well as
the NMFS National Catch Shares Performance Indicators.
5 In addition to the catcher vessel report, there are four companion reports:
• Economic Data Collection Program, Administration and Operations Report (May 2016)
• Economic Data Collection Program, Catcher-Processor Draft Report, 2009-2015 (June 2017)
• Economic Data Collection Program, Mothership Draft Report, 2009-2015 (June 2017)
• Economic Data Collection Program, First Receiver and Shorebased Processor Draft Report, 2009-2015 (June 2017)
DATA SUMMARIES 53 CATCHER VESSEL REPORT

Third, the reports serve as the basis for economic models that are used as part of the PFMC biennial specification
process for groundfish management. These models include the IO-PAC model,6 as well as estimates of revenue,
costs, and net revenue.
Lastly, and perhaps most importantly, the data reports are expected to provide a useful catalyst for feedback on
the data collected and its analysis.
The Administration and Operations Report describes the EDC Program administration and fielding of the surveys,
the EDC forms, data quality controls and quality checks and data processing, and safeguarding confidential
information. The other EDC reports provide basic data summaries of the catcher-processor, mothership, and first
receiver and shorebased processor forms.
1.4 Catcher vessel form administration
Completion of EDC forms is mandatory for participants in the catch share program. Any owner, lessee, or
charterer of a catcher vessel registered to a limited entry groundfish permit with a trawl endorsement (limited
entry trawl permit) is required to complete an EDC form §660.114(b)(1). For a permit owner, a limited entry
trawl permit application (including MS/CV-endorsed limited entry trawl permit) will not be considered complete
until the required EDC form for that permit owner associated with that permit is submitted, as specified at
§660.25(b)(4)(i). For a vessel owner, participation in the groundfish fishery (including, but not limited to, changes
in vessel registration, vessel account actions, or if own QS permit, issuance of annual QP or IBQ pounds) will
not be authorized until the required EDC form for that owner for that vessel is submitted, as specified, in part,
at §660.25(b)(4)(v) and §660.140(e). For a vessel lessee or charterer, participation in the groundfish fishery
(including, but not limited to, issuance of annual QP or IBQ pounds if own QS or IBQ) will not be authorized,
until the required EDC form for their operation of that vessel is submitted.
A calendar year is used to determine which vessels meet the criteria. For example, in 2016, data were collected
from all owners, lessees, and charters of a catcher vessel registered to a limited entry trawl permit during 2015.
The forms are fielded on this schedule in order to allow participants the time necessary to complete their taxes,
which may contain some information that is required on the EDC forms. Participants are identified using contact
information provided by the Northwest Regional Office - Permit Office (Permit Office).
If a form has missing information, or the information provided on the form is believed to be incorrect, EDC
Program staff attempt to contact the participant to correct the information. On occasion, the participant cannot
be reached or the participant cannot provide the missing information. In these cases, the missing or inaccurate
data are treated on a case-by-case basis during analysis as documented in the Administration and Operations
Report. Data are validated and verified with external data sources whenever possible. These data sources include
the Permit Office, state fish tickets, the At-Sea Hake Observer Program data, and the Coast Guard.
1.5 About the survey participants
The EDC catcher vessel participants are identified as any owner, lessee, or charterer of a vessel with a limited
entry trawl permit. This includes catcher vessels that deliver Pacific whiting to motherships at sea (At-sea whiting
fishery), catcher vessels that deliver whiting to shorebased facilities (Shorebased whiting fishery), and catcher
6 Leonard, J., and P. Watson. 2011. Description of the input-output model for Pacific Coast fisheries. U.S. Dept. Commer., NOAA
Tech. Memo. NMFS-NWFSC-111, 64 p.
DATA SUMMARIES 54 CATCHER VESSEL REPORT
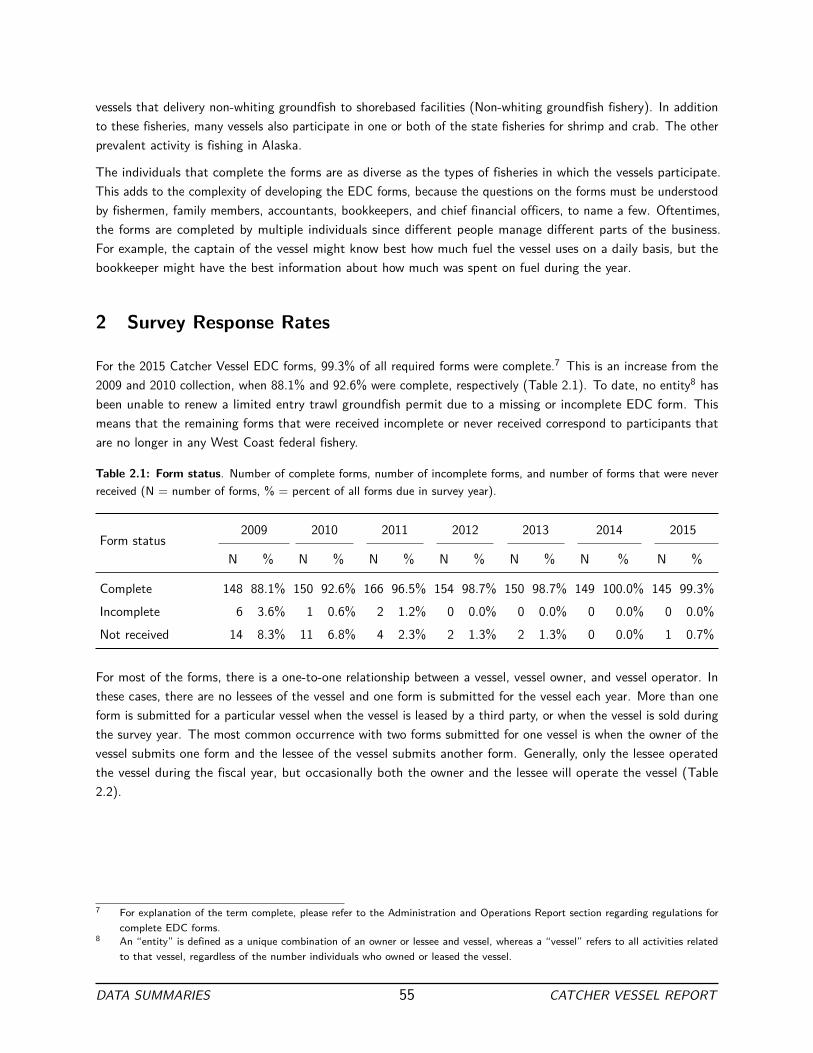
vessels that delivery non-whiting groundfish to shorebased facilities (Non-whiting groundfish fishery). In addition
to these fisheries, many vessels also participate in one or both of the state fisheries for shrimp and crab. The other
prevalent activity is fishing in Alaska.
The individuals that complete the forms are as diverse as the types of fisheries in which the vessels participate.
This adds to the complexity of developing the EDC forms, because the questions on the forms must be understood
by fishermen, family members, accountants, bookkeepers, and chief financial officers, to name a few. Oftentimes,
the forms are completed by multiple individuals since different people manage different parts of the business.
For example, the captain of the vessel might know best how much fuel the vessel uses on a daily basis, but the
bookkeeper might have the best information about how much was spent on fuel during the year.
2 Survey Response Rates
For the 2015 Catcher Vessel EDC forms, 99.3% of all required forms were complete.7 This is an increase from the
2009 and 2010 collection, when 88.1% and 92.6% were complete, respectively (Table 2.1). To date, no entity8 has
been unable to renew a limited entry trawl groundfish permit due to a missing or incomplete EDC form. This
means that the remaining forms that were received incomplete or never received correspond to participants that
are no longer in any West Coast federal fishery.
Table 2.1: Form status . Number of complete forms, number of incomplete forms, and number of forms that were never
received (N = number of forms, % = percent of all forms due in survey year).
Form status
2009 2010 2011 2012 2013 2014 2015
N % N % N % N % N % N % N %
Complete 148 88.1% 150 92.6% 166 96.5% 154 98.7% 150 98.7% 149 100.0% 145 99.3%
Incomplete 6 3.6% 1 0.6% 2 1.2% 0 0.0% 0 0.0% 0 0.0% 0 0.0%
Not received 14 8.3% 11 6.8% 4 2.3% 2 1.3% 2 1.3% 0 0.0% 1 0.7%
For most of the forms, there is a one-to-one relationship between a vessel, vessel owner, and vessel operator. In
these cases, there are no lessees of the vessel and one form is submitted for the vessel each year. More than one
form is submitted for a particular vessel when the vessel is leased by a third party, or when the vessel is sold during
the survey year. The most common occurrence with two forms submitted for one vessel is when the owner of the
vessel submits one form and the lessee of the vessel submits another form. Generally, only the lessee operated
the vessel during the fiscal year, but occasionally both the owner and the lessee will operate the vessel (Table
2.2).
7 For explanation of the term complete, please refer to the Administration and Operations Report section regarding regulations for
complete EDC forms.
8 An “entity” is defined as a unique combination of an owner or lessee and vessel, whereas a “vessel” refers to all activities related
to that vessel, regardless of the number individuals who owned or leased the vessel.
DATA SUMMARIES 55 CATCHER VESSEL REPORT

Table 2.2: Number of forms, entities, and vessels by activity. Number of required forms, entities that fished, vessels
that harvested, vessels that were leased, lease contracts, vessels that were fished by more than one entity, and vessels that
were sold during the annual survey qualifying period. An entity is defined as a unique combination of an owner or lessee
and vessel, whereas a vessel refers to all activities related to that vessel, regardless of the number of individuals who owned
or leased the vessel.
Activity 2009 2010 2011 2012 2013 2014 2015
Required forms 168 162 172 156 152 149 146
Entities that fished 133 130 143 133 127 130 126
Vessels that fished on the West Coast or Alaska 132 129 138 132 124 128 119
Vessels that fished on the West Coast 132 131 132 128 124 125 117
Vessels that fished in Alaska 27 28 28 25 24 24 21
Vessels that were leased 11 8 9 7 7 6 7
Lease contracts 12 9 9 7 7 6 7
Vessels fished by multiple entities 1 1 5 1 2 3 5
Vessels sold 1 8 8 3 7 3 7
DATA SUMMARIES 56 CATCHER VESSEL REPORT

3 Vessel Participation on the West Coast and in Alaska
Participants provide the total number of days at sea by fishery on the West Coast and in Alaska. They are
instructed to count partial days as full days. The current categories of West Coast fisheries are
• West Coast whiting trawl gear,
• West Coast midwater trawl gear,
• West Coast groundfish trawl gear,
• Groundfish fixed gear with trawl endorsement,
• Groundfish fixed gear with fixed gear endorsement,
• Shrimp,
• Crab,
• Pacific halibut,
• California halibut,
• Salmon,
• Tuna, and
• Other fisheries.
The categories on the EDC form remained unchanged from 2009-2013, but in response to feedback from participants
as well as changes in fishing behavior, several changes to the question have been made.
Starting with the 2014 form, two subfisheries were each split into two additional categories; “West Coast groundfish
fixed gear” was split out by permit endorsement (fixed gear or trawl); and “Halibut” was split into Pacific halibut
and California halibut. The first change was made in response to participant feedback that fuel use differs between
permit endorsements because there are different discard regulations for the two permit endorsements and thefore
fisher behavior changes according to the permit they are fishing. The Halibut fishery was changed because EDC
vessels fish in both the California halibut and Pacific halibut fisheries, but the original question was designed only
for the Pacific halibut fishery. The Pacific halibut is a fixed gear fishery and so reporting the speed while fishing
was not required, whereas the California halibut fishery is a trawl fishery and therefore participants need to provide
their speed while fishing.
Starting with the 2015 form, an additional fishery was added, “West Coast midwater trawl gear”. In 2012, vessels
began participating in the Non-whiting midwater trawl fishery. Historically there was a non-whiting midwater
groundfish fishery, targeting semi-pelagic rockfish such as yellowtail and widow rockfish. The fishery was shut
down after widow rockfish was declared overfished in 2001. In 2011, widow rockfish was taken off the overfished
list.9 As a result, a few vessels reentered the fishery in 2012, and the annual catch limit for widow rockfish was
raised starting in 2013. Between 2011 and 2015, the total quota for widow increased 4 fold from 755,000 pounds
to 3.13 million pounds. The annual catch limit was increased again for 2017. In contrast, yellowtail rockfish
quota, the other target species in the non-whiting midwater fishery, had remained relatively constant since the
9 NMFS 2011. Status of the widow rockfish resource in 2011: http://www.pcouncil.org/wp-content/uploads/Widow_2011_
Assessment.pdf.
DATA SUMMARIES 57 CATCHER VESSEL REPORT

implementation of the catch share program (6.49 million pounds), but was increased by approximately 50% in
2015 to 10.1 million pounds.
Participants also provide the days spent fishing in all Alaskan fisheries. In the 2009-2011 data collection, participants
provided the total number of days spent chartering or doing research on the West Coast and Alaska. combined.
Starting in 2012, participants were requested to provide separate days at sea for chartering and research in Alaska
and chartering and research on the West Coast.
Table 3.1: Average days at sea. Average days at sea by activity for EDC vessels (N = number of EDC vessels with
non-zero, non-NA responses. See above for explanations of changes to the data collection form across years.
Fishery
2009 2010 2011 2012 2013 2014 2015
Mean N Mean N Mean N Mean N Mean N Mean N Mean N
Pacific whiting 35.. 40 46 .. 41 59.. 33 65.. 29 67.. 30 79. 30 70.. 26
Non-whiting midwater trawl — — — — — — — — — — — — 13.. 15
Groundfish with trawl gear 68.. 103 59 .. 98 51.. 74 53.. 67 56.. 71 52.. 64 49.. 62
Groundfish with fixed gear 29. 7 63 .. 8 39.. 25 45.. 25 31.. 20 — — — —
Groundfish fixed gear with a
trawl permit
— — — — — — — — — — 29... 20 32.. 18
Groundfish fixed gear with a
fixed gear permit
— — — — — — — — — — 29.. 9 26.. 11
Shrimp 33.. 29 39.. 33 44.. 41 47.. 39 44.. 39 57.. 41 68.. 48
Crab 40.. 55 38.. 57 37 .. 65 35.. 64 36.. 66 39.. 64 26.. 56
Halibut 26.. 6 30.. 6 18 ... 6 23... 6 23.. 5 — — — —
Pacific halibut — — — — — — — — — — 0 2.. 4
California halibut — — — — — — — — — — 50. 4 43.. 3
Salmon 0 *** *** 19. 5 28.. 10 24.. 6 23.. 11 20.. 3
Tuna 14... 9 21.. 10 20 .. 5 16... 11 5 ... 6 7 .. 9 21... 9
Fishing in Alaska or other
fisheries
102.. 32 111 .. 31 — — — — — — — — — —
Fishing in Alaska — — — — 125 .. 36 110 .. 30 117.. 28 118.. 28 124.. 24
Steaming between West
Coast and Alaska
19. 30 19 . 32 19.. 33 18. 31 15. 30 16. 30 18. 27
Other West Coast Fisheries — — — — *** *** *** *** 21... 5 *** *** *** ***
Chartering or research 34.. 11 33.. 11 36 .. 12 — — — — — — — —
Chartering, research, or
tendering on the West Coast
— — — — — — 46... 7 52.. 9 63... 9 36.. 10
Chartering, research, or
tendering in Alaska
— — — — — — 43.. 5 60. 5 67. 7 57. 7
DATA SUMMARIES 58 CATCHER VESSEL REPORT
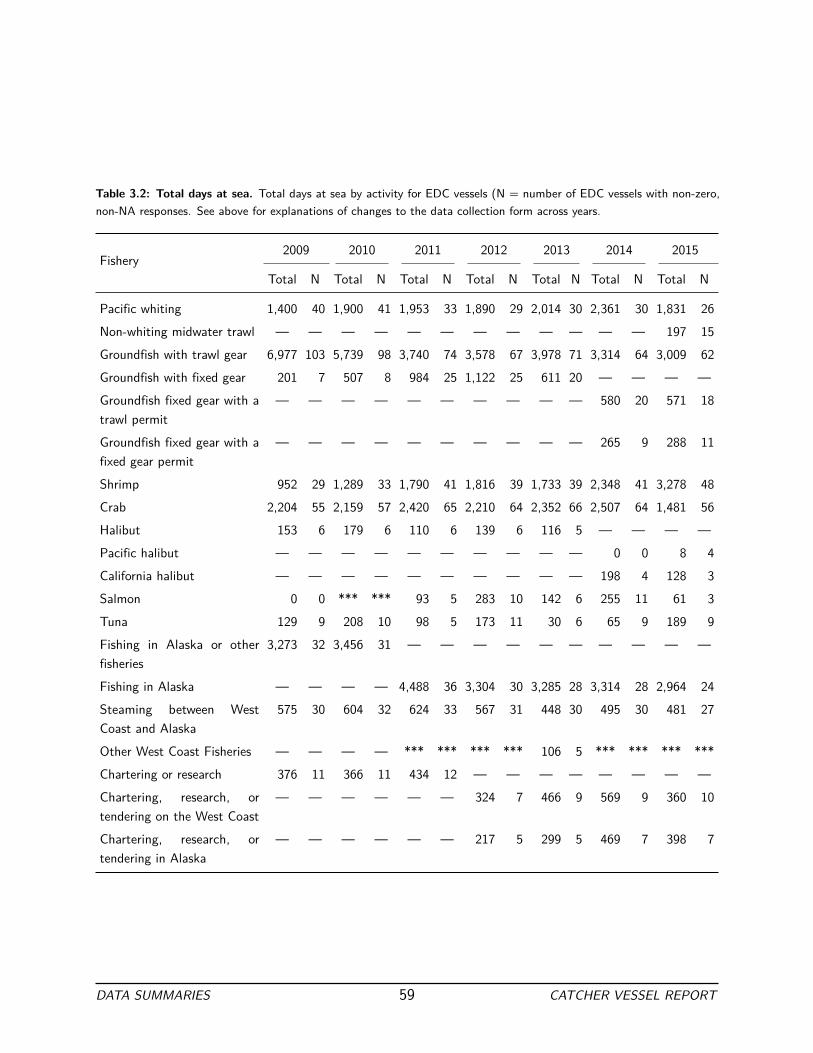
Table 3.2: Total days at sea. Total days at sea by activity for EDC vessels (N = number of EDC vessels with non-zero,
non-NA responses. See above for explanations of changes to the data collection form across years.
Fishery
2009 2010 2011 2012 2013 2014 2015
Total N Total N Total N Total N Total N Total N Total N
Pacific whiting 1,400 40 1,900 41 1,953 33 1,890 29 2,014 30 2,361 30 1,831 26
Non-whiting midwater trawl — — — — — — — — — — — — 197 15
Groundfish with trawl gear 6,977 103 5,739 98 3,740 74 3,578 67 3,978 71 3,314 64 3,009 62
Groundfish with fixed gear 201 7 507 8 984 25 1,122 25 611 20 — — — —
Groundfish fixed gear with a
trawl permit
— — — — — — — — — — 580 20 571 18
Groundfish fixed gear with a
fixed gear permit
— — — — — — — — — — 265 9 288 11
Shrimp 952 29 1,289 33 1,790 41 1,816 39 1,733 39 2,348 41 3,278 48
Crab 2,204 55 2,159 57 2,420 65 2,210 64 2,352 66 2,507 64 1,481 56
Halibut 153 6 179 6 110 6 139 6 116 5 — — — —
Pacific halibut — — — — — — — — — — 0 0 8 4
California halibut — — — — — — — — — — 198 4 128 3
Salmon 0 0 *** *** 93 5 283 10 142 6 255 11 61 3
Tuna 129 9 208 10 98 5 173 11 30 6 65 9 189 9
Fishing in Alaska or other
fisheries
3,273 32 3,456 31 — — — — — — — — — —
Fishing in Alaska — — — — 4,488 36 3,304 30 3,285 28 3,314 28 2,964 24
Steaming between West
Coast and Alaska
575 30 604 32 624 33 567 31 448 30 495 30 481 27
Other West Coast Fisheries — — — — *** *** *** *** 106 5 *** *** *** ***
Chartering or research 376 11 366 11 434 12 — — — — — — — —
Chartering, research, or
tendering on the West Coast
— — — — — — 324 7 466 9 569 9 360 10
Chartering, research, or
tendering in Alaska
— — — — — — 217 5 299 5 469 7 398 7
DATA SUMMARIES 59 CATCHER VESSEL REPORT

3.1 Trips to Alaska
The number of trips that were made between the West Coast and Alaska provide additional insight into the patterns
of participation. Table 3.3 shows the number of vessels that took up to four one-way trips to Alaska.
Table 3.3: Trips to Alaska . The number of EDC vessels making the given number of one-way trips between the West
Coast and Alaska.
Number of one-way trips 2009 2010 2011 2012 2013 2014 2015
1 0 3 1 1 2 1 0
2 21 19 25 23 24 24 22
3 1 2 1 1 1 2 1
4 5 6 3 3 1 1 3
DATA SUMMARIES 60 CATCHER VESSEL REPORT

4 Home Port
Vessel home port information is especially useful for understanding how the catch share program may affect
communities. Among other uses, home port is commonly used as a method for assigning economic activity
to communities. There are many ways to define home port, including the home port listed on Coast Guard
registrations and the port where the vessel made the most landings. Table 4.1 shows the number of entities
by home port according to information submitted by participants. Home ports provided on the EDC forms are
mapped to the IO-PAC port groupings.10 These port groupings are also consistent with those used in the PFMC’s
biennial groundfish management specification process. The ports with the highest concentration of EDC entities
are Newport, Astoria, and Coos Bay.
Table 4.1: Vessel home port. Number of entities by home port as reported on the EDC form (N = number of entities, %
= percent of total entities in survey year. An entity is defined as a unique combination of an owner or lessee and vessel,
whereas a vessel refers to all activities related to that vessel, regardless of the number individuals who owned or leased the
vessel).
Home port
2009 2010 2011 2012 2013 2014 2015
N % N % N % N % N % N % N %
Alaska *** *** *** *** 3 2% *** *** *** *** *** *** *** ***
Puget Sound 14 10% 14 10% 17 11% 13 9% 12 9% 15 11% 16 12%
South and central WA coast 4 3% 4 3% 4 3% 4 3% 4 3% 4 3% 3 2%
Astoria 20 14% 20 15% 26 17% 23 17% 23 17% 20 15% 24 19%
Tillamook 6 4% 6 4% 4 3% 5 4% *** *** 3 2% *** ***
Newport 23 16% 23 17% 25 17% 21 15% 23 17% 25 18% 28 22%
Coos Bay 20 14% 19 14% 19 13% 19 14% 17 13% 19 14% 18 14%
Brookings 7 5% 7 5% 8 5% 9 6% 8 6% 9 7% 9 7%
Crescent City 14 10% 14 10% 14 9% 12 9% 12 9% 10 7% 8 6%
Eureka 9 6% 9 7% 9 6% 7 5% 7 5% 8 6% 6 5%
Fort Bragg 7 5% 7 5% 7 5% 8 6% 7 5% 7 5% 6 5%
San Francisco 6 4% 8 6% 7 5% 7 5% 7 5% 6 4% 4 3%
Monterey 3 2% *** *** *** *** 4 3% *** *** 3 2% *** ***
Morro Bay 6 4% 4 3% 6 4% 6 4% 6 5% 5 4% 3 2%
In addition to understanding where vessels call their home port, it is important to examine how the home port
relates to particular fisheries. Tables 4.2 through 4.17 show the average days at sea by home port and fishery.
This provides information about how changes in management for a particular fishery could affect specific port
communities. For example, changes in the Shoreside Pacific whiting fishery could have a strong effect on Coos
Bay, but a change in the At-sea Pacific whiting fishery might not have a noticeable effect in that port.
10 Leonard, J., and P. Watson. 2011. Description of the input-output model for Pacific Coast fisheries. U.S. Dept. Commer., NOAA
Tech. Memo. NMFS-NWFSC-111, 64 p.
DATA SUMMARIES 61 CATCHER VESSEL REPORT

Table 4.2: Pacific whiting fishery days at sea by home port. Average number of days vessels participated in the Pacific
whiting fishery on the West Coast by home port reported on the EDC form (N = number of EDC vessels with non-zero,
non-NA responses). See description on page 57 for an explanation of EDC form changes (annotated with —) over time.
Home port
2009 2010 2011 2012 2013 2014 2015
Mean N Mean N Mean N Mean N Mean N Mean N Mean N
Alaska *** *** *** *** 0 0 *** *** *** *** *** ***
Puget Sound 29.4.. 10 51.5.. 12 66.5.. 8 67.7.. 7 67.1.. 8 69.2.. 9 55.5.. 8
South and central WA coast *** *** *** *** *** *** *** *** *** *** *** *** *** ***
Astoria 55.7.. 3 69.0.. 3 54.7. 3 *** *** *** *** *** *** 0
Tillamook *** *** *** *** 0 0 0 0 0
Newport 31.4. 16 42.8. 16 65.7. 15 64.9.. 14 67.6. 15 81.1. 15 76.0.. 14
Coos Bay 28.3. 3 *** *** *** *** *** *** 0 0 0
Brookings *** *** *** *** *** *** *** *** *** *** *** *** *** ***
Crescent City *** *** *** *** 0 0 0 0 0
Eureka *** *** *** *** 0 0 0 0 0
San Francisco *** *** *** *** *** *** *** *** 0 0 0
Table 4.3: Non-whiting midwater trawl fishery days at sea by home port. Average number of days vessels participated
in the Non-whiting midwater trawl fishery on the West Coast by home port reported on the EDC form (N = number of EDC
vessels with non-zero, non-NA responses). See description on page 57 for an explanation of EDC form changes (annotated
with —) over time.
Home port
2009 2010 2011 2012 2013 2014 2015
Mean N Mean N Mean N Mean N Mean N Mean N Mean N
Alaska — — — — — — — — — — — — *** ***
Puget Sound — — — — — — — — — — — — *** ***
South and central WA coast — — — — — — — — — — — — *** ***
Astoria — — — — — — — — — — — — 7.0 . 5
Newport — — — — — — — — — — — — 12.2.. 6
Brookings — — — — — — — — — — — — *** ***
DATA SUMMARIES 62 CATCHER VESSEL REPORT

Table 4.4: Groundfish with trawl gear fishery days at sea by home port. Average number of days vessels participated
in the Groundfish with trawl gear fishery on the West Coast by home port reported on the EDC form (N = number of EDC
vessels with non-zero, non-NA responses). See description on page 57 for an explanation of EDC form changes (annotated
with —) over time.
Home port
2009 2010 2011 2012 2013 2014 2015
Mean N Mean N Mean N Mean N Mean N Mean N Mean N
Alaska 0 0 *** *** *** *** 0 0 0
Puget Sound 77.8.. 5 45.6.. 5 44.5.. 4 *** *** *** *** *** *** *** ***
South and central WA
coast
112.2 .. 4 106.7.. 3 *** *** 93.0.. 3 92.7.. 3 74.7. 3 *** ***
Astoria 87.9. 18 85.1. 17 76.7. 17 89.9.. 15 98.5. 15 90.2.. 13 75.1.. 15
Tillamook 83.2.. 5 65.8.. 5 *** *** *** *** *** *** 0 0
Newport 56.0. 15 45.1.. 15 21.1.. 9 26.6.. 8 37.7.. 7 37.4.. 7 40.6.. 10
Coos Bay 52.2. 18 47.1.. 18 41.7.. 12 46.0.. 13 31.0.. 13 19.2.. 13 23.8.. 10
Brookings 55.0.. 7 59.1.. 7 46.5.. 6 55.2. 4 86.8.. 5 50.0.. 6 40.7.. 6
Crescent City 51.1. 7 43.7.. 6 22.7.. 3 29.5. 4 27.2. 4 33.3. 3 *** ***
Eureka 70.2. 8 57.0.. 8 48.9.. 8 43.0.. 7 51.0. 7 53.0.. 7 50.3.. 6
Fort Bragg 66.7. 7 56.7. 7 44.2.. 6 41.8. 5 48.3.. 6 49.2.. 6 51.0.. 5
San Francisco 44.6. 5 34.8.. 5 35.7.. 3 38.3. 3 56.7. 3 47.0. 3 *** ***
Monterey *** *** *** *** *** *** *** *** *** *** *** *** *** ***
Morro Bay *** *** *** *** 0 0 *** *** *** *** *** ***
DATA SUMMARIES 63 CATCHER VESSEL REPORT
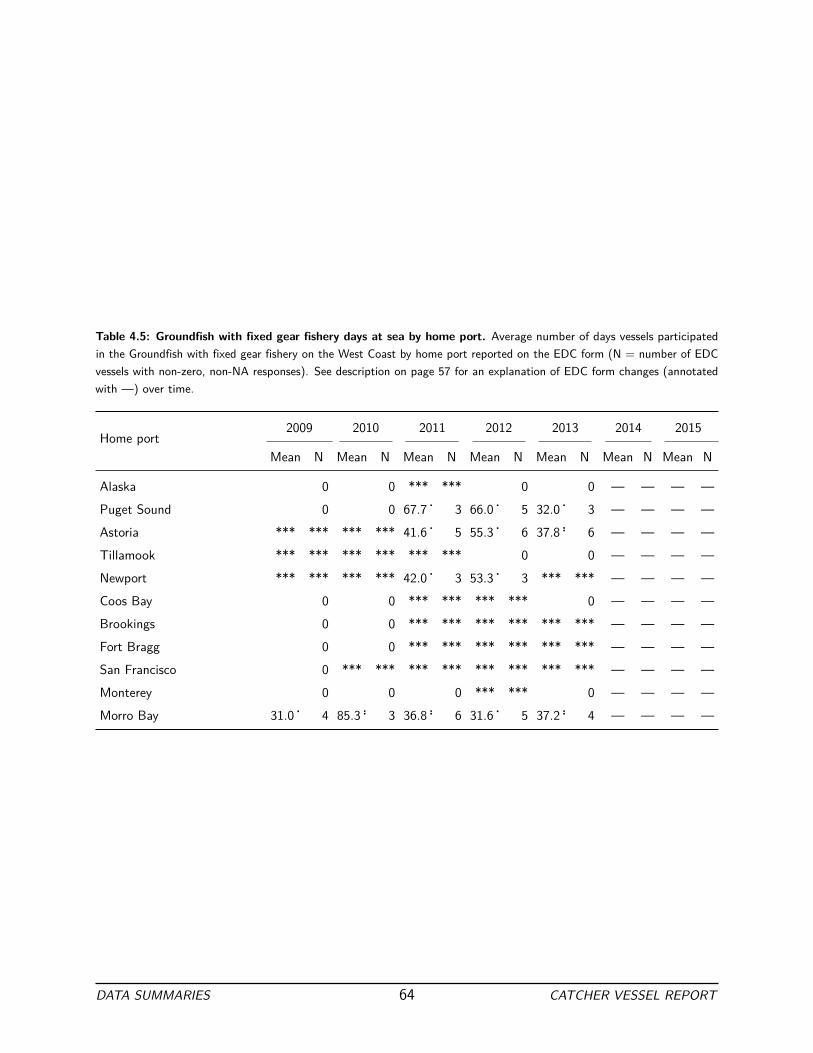
Table 4.5: Groundfish with fixed gear fishery days at sea by home port. Average number of days vessels participated
in the Groundfish with fixed gear fishery on the West Coast by home port reported on the EDC form (N = number of EDC
vessels with non-zero, non-NA responses). See description on page 57 for an explanation of EDC form changes (annotated
with —) over time.
Home port
2009 2010 2011 2012 2013 2014 2015
Mean N Mean N Mean N Mean N Mean N Mean N Mean N
Alaska 0 0 *** *** 0 0 — — — —
Puget Sound 0 0 67.7. 3 66.0. 5 32.0. 3 — — — —
Astoria *** *** *** *** 41.6. 5 55.3. 6 37.8.. 6 — — — —
Tillamook *** *** *** *** *** *** 0 0 — — — —
Newport *** *** *** *** 42.0. 3 53.3. 3 *** *** — — — —
Coos Bay 0 0 *** *** *** *** 0 — — — —
Brookings 0 0 *** *** *** *** *** *** — — — —
Fort Bragg 0 0 *** *** *** *** *** *** — — — —
San Francisco 0 *** *** *** *** *** *** *** *** — — — —
Monterey 0 0 0 *** *** 0 — — — —
Morro Bay 31.0. 4 85.3.. 3 36.8.. 6 31.6. 5 37.2.. 4 — — — —
DATA SUMMARIES 64 CATCHER VESSEL REPORT
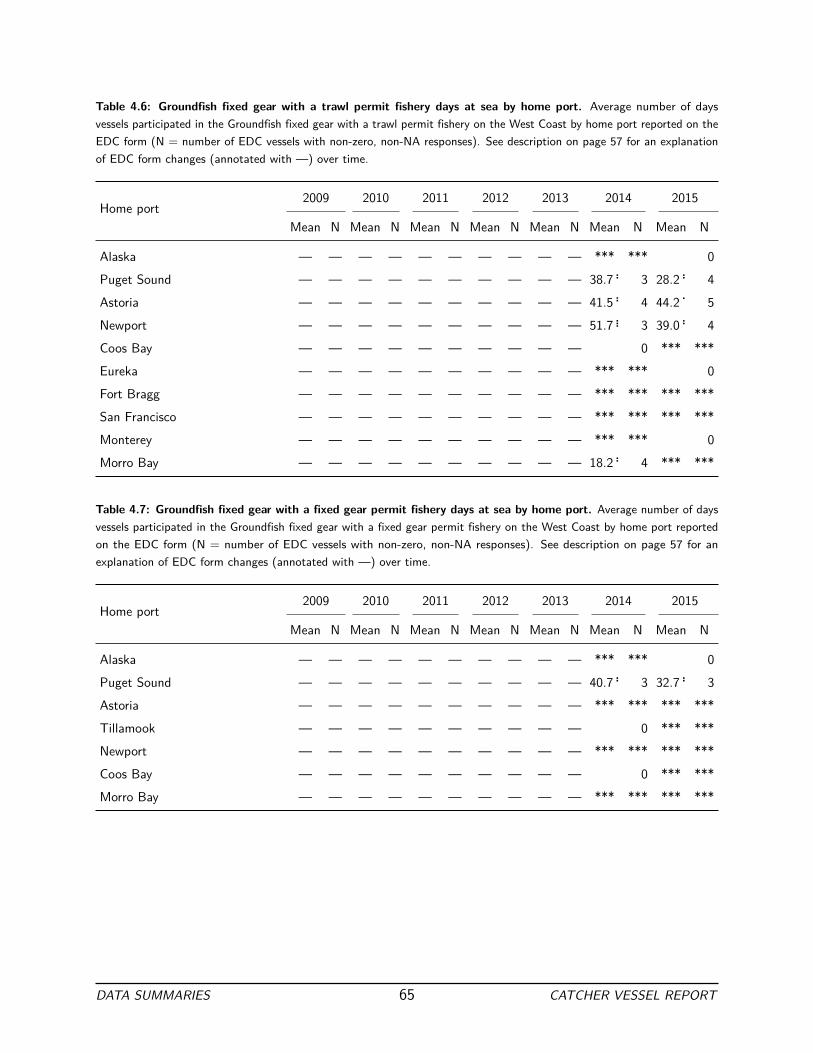
Table 4.6: Groundfish fixed gear with a trawl permit fishery days at sea by home port. Average number of days
vessels participated in the Groundfish fixed gear with a trawl permit fishery on the West Coast by home port reported on the
EDC form (N = number of EDC vessels with non-zero, non-NA responses). See description on page 57 for an explanation
of EDC form changes (annotated with —) over time.
Home port
2009 2010 2011 2012 2013 2014 2015
Mean N Mean N Mean N Mean N Mean N Mean N Mean N
Alaska — — — — — — — — — — *** *** 0
Puget Sound — — — — — — — — — — 38.7.. 3 28.2.. 4
Astoria — — — — — — — — — — 41.5.. 4 44.2. 5
Newport — — — — — — — — — — 51.7... 3 39.0.. 4
Coos Bay — — — — — — — — — — 0 *** ***
Eureka — — — — — — — — — — *** *** 0
Fort Bragg — — — — — — — — — — *** *** *** ***
San Francisco — — — — — — — — — — *** *** *** ***
Monterey — — — — — — — — — — *** *** 0
Morro Bay — — — — — — — — — — 18.2.. 4 *** ***
Table 4.7: Groundfish fixed gear with a fixed gear permit fishery days at sea by home port. Average number of days
vessels participated in the Groundfish fixed gear with a fixed gear permit fishery on the West Coast by home port reported
on the EDC form (N = number of EDC vessels with non-zero, non-NA responses). See description on page 57 for an
explanation of EDC form changes (annotated with —) over time.
Home port
2009 2010 2011 2012 2013 2014 2015
Mean N Mean N Mean N Mean N Mean N Mean N Mean N
Alaska — — — — — — — — — — *** *** 0
Puget Sound — — — — — — — — — — 40.7.. 3 32.7.. 3
Astoria — — — — — — — — — — *** *** *** ***
Tillamook — — — — — — — — — — 0 *** ***
Newport — — — — — — — — — — *** *** *** ***
Coos Bay — — — — — — — — — — 0 *** ***
Morro Bay — — — — — — — — — — *** *** *** ***
DATA SUMMARIES 65 CATCHER VESSEL REPORT

Table 4.8: Shrimp fishery days at sea by home port. Average number of days vessels participated in the Shrimp fishery
on the West Coast by home port reported on the EDC form (N = number of EDC vessels with non-zero, non-NA responses).
See description on page 57 for an explanation of EDC form changes (annotated with —) over time.
Home port
2009 2010 2011 2012 2013 2014 2015
Mean N Mean N Mean N Mean N Mean N Mean N Mean N
Alaska 0 0 0 *** *** 0 0 0
Puget Sound *** *** *** *** 0 0 0 *** *** *** ***
South and central WA
coast
0 *** *** 0 *** *** 0 *** *** *** ***
Astoria 45.3.. 3 56.8.. 4 60.2. 6 80.7. 3 69.8. 4 84.3. 3 100.0. 7
Tillamook *** *** *** *** *** *** *** *** *** *** *** *** *** ***
Newport 11.0. 3 *** *** 41.3.. 7 59.2.. 6 55.7.. 6 92.4. 5 63.8.. 6
Coos Bay 32.8.. 12 35.8.. 13 38.8.. 12 43.4.. 11 42.5. 12 45.6. 14 50.0. 13
Brookings *** *** 31.2... 4 52.5. 4 34.4.. 5 49.8.. 5 50.2.. 6 77.3. 7
Crescent City 29.8.. 4 49.8... 4 42.3.. 6 40.2.. 6 39.6. 5 39.2. 5 67.0.. 4
Eureka 28.5.. 4 26.5.. 4 28.5.. 4 35.5.. 4 18.5.. 4 47.8.. 4 55.3.. 3
Fort Bragg 0 0 0 0 0 0 *** ***
DATA SUMMARIES 66 CATCHER VESSEL REPORT
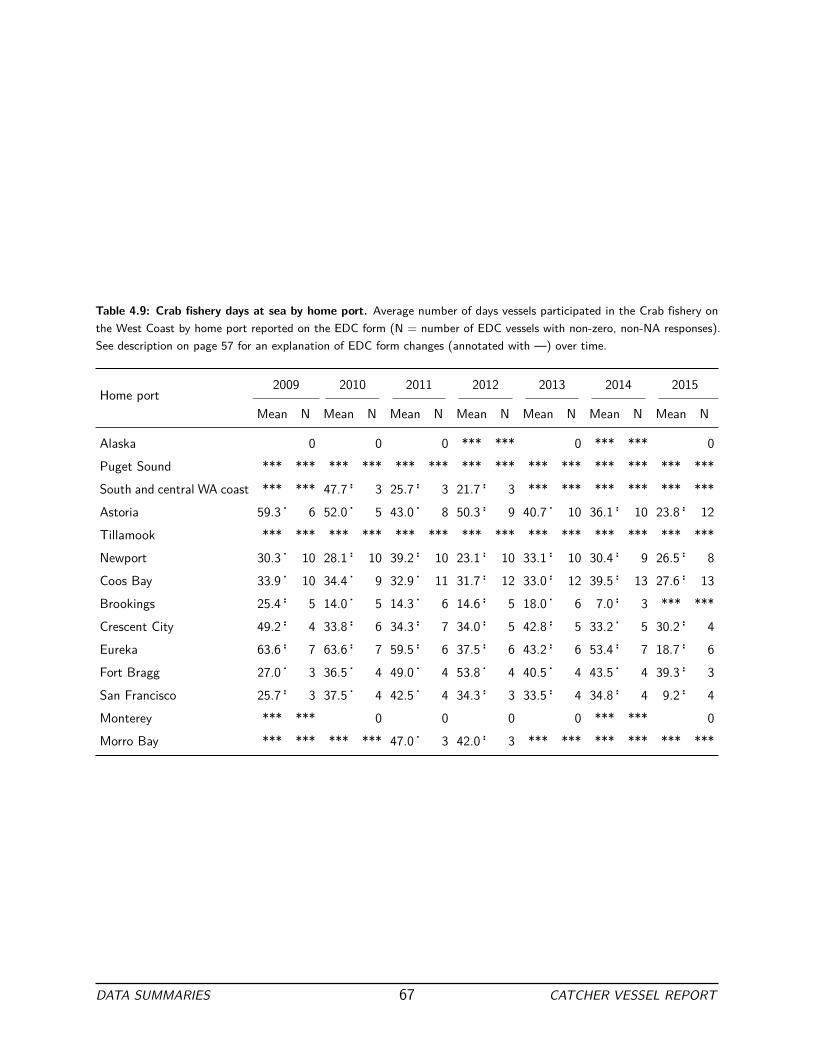
Table 4.9: Crab fishery days at sea by home port. Average number of days vessels participated in the Crab fishery on
the West Coast by home port reported on the EDC form (N = number of EDC vessels with non-zero, non-NA responses).
See description on page 57 for an explanation of EDC form changes (annotated with —) over time.
Home port
2009 2010 2011 2012 2013 2014 2015
Mean N Mean N Mean N Mean N Mean N Mean N Mean N
Alaska 0 0 0 *** *** 0 *** *** 0
Puget Sound *** *** *** *** *** *** *** *** *** *** *** *** *** ***
South and central WA coast *** *** 47.7.. 3 25.7.. 3 21.7.. 3 *** *** *** *** *** ***
Astoria 59.3. 6 52.0. 5 43.0. 8 50.3.. 9 40.7. 10 36.1.. 10 23.8.. 12
Tillamook *** *** *** *** *** *** *** *** *** *** *** *** *** ***
Newport 30.3. 10 28.1.. 10 39.2.. 10 23.1.. 10 33.1.. 10 30.4.. 9 26.5.. 8
Coos Bay 33.9. 10 34.4. 9 32.9. 11 31.7.. 12 33.0.. 12 39.5.. 13 27.6.. 13
Brookings 25.4.. 5 14.0. 5 14.3. 6 14.6.. 5 18.0. 6 7.0.. 3 *** ***
Crescent City 49.2.. 4 33.8.. 6 34.3.. 7 34.0.. 5 42.8.. 5 33.2. 5 30.2.. 4
Eureka 63.6.. 7 63.6.. 7 59.5.. 6 37.5.. 6 43.2.. 6 53.4.. 7 18.7.. 6
Fort Bragg 27.0. 3 36.5. 4 49.0. 4 53.8. 4 40.5. 4 43.5. 4 39.3.. 3
San Francisco 25.7.. 3 37.5. 4 42.5. 4 34.3.. 3 33.5.. 4 34.8.. 4 9.2.. 4
Monterey *** *** 0 0 0 0 *** *** 0
Morro Bay *** *** *** *** 47.0. 3 42.0.. 3 *** *** *** *** *** ***
DATA SUMMARIES 67 CATCHER VESSEL REPORT

Table 4.10: Halibut fishery days at sea by home port. Average number of days vessels participated in the Halibut fishery
on the West Coast by home port reported on the EDC form (N = number of EDC vessels with non-zero, non-NA responses).
See description on page 57 for an explanation of EDC form changes (annotated with —) over time.
Home port
2009 2010 2011 2012 2013 2014 2015
Mean N Mean N Mean N Mean N Mean N Mean N Mean N
Puget Sound 0 0 0 0 *** *** — — — —
Astoria 0 0 0 *** *** 0 — — — —
Newport *** *** *** *** *** *** *** *** *** *** — — — —
Coos Bay 0 0 *** *** 0 0 — — — —
San Francisco 26.7. 3 37.0.. 3 20.0.. 3 27.7... 3 20.7... 3 — — — —
Monterey *** *** *** *** 0 0 0 — — — —
Table 4.11: Pacific halibut fishery days at sea by home port. Average number of days vessels participated in the Pacific
halibut fishery on the West Coast by home port reported on the EDC form (N = number of EDC vessels with non-zero,
non-NA responses). See description on page 57 for an explanation of EDC form changes (annotated with —) over time.
Home port
2009 2010 2011 2012 2013 2014 2015
Mean N Mean N Mean N Mean N Mean N Mean N Mean N
Puget Sound — — — — — — — — — — 0 *** ***
Newport — — — — — — — — — — 0 *** ***
Coos Bay — — — — — — — — — — 0 *** ***
Table 4.12: California halibut fishery days at sea by home port. Average number of days vessels participated in the
California halibut fishery on the West Coast by home port reported on the EDC form (N = number of EDC vessels with
non-zero, non-NA responses). See description on page 57 for an explanation of EDC form changes (annotated with —)
over time.
Home port
2009 2010 2011 2012 2013 2014 2015
Mean N Mean N Mean N Mean N Mean N Mean N Mean N
Newport — — — — — — — — — — *** *** *** ***
San Francisco — — — — — — — — — — 55.7. 3 *** ***
DATA SUMMARIES 68 CATCHER VESSEL REPORT

Table 4.13: Salmon fishery days at sea by home port. Average number of days vessels participated in the Salmon fishery
on the West Coast by home port reported on the EDC form (N = number of EDC vessels with non-zero, non-NA responses).
See description on page 57 for an explanation of EDC form changes (annotated with —) over time.
Home port
2009 2010 2011 2012 2013 2014 2015
Mean N Mean N Mean N Mean N Mean N Mean N Mean N
Astoria 0 0 *** *** 0 0 0 0
Coos Bay 0 *** *** *** *** *** *** *** *** 26.7... 3 *** ***
Brookings 0 0 0 0 0 *** *** 0
Eureka 0 0 0 0 0 *** *** 0
Fort Bragg 0 *** *** *** *** 36.7... 3 *** *** *** *** *** ***
San Francisco 0 0 *** *** *** *** *** *** *** *** 0
Monterey 0 0 0 0 0 *** *** 0
Morro Bay 0 0 *** *** 21.2. 4 *** *** *** *** *** ***
Table 4.14: Tuna fishery days at sea by home port. Average number of days vessels participated in the Tuna fishery on
the West Coast by home port reported on the EDC form (N = number of EDC vessels with non-zero, non-NA responses).
See description on page 57 for an explanation of EDC form changes (annotated with —) over time.
Home port
2009 2010 2011 2012 2013 2014 2015
Mean N Mean N Mean N Mean N Mean N Mean N Mean N
Puget Sound 0 0 0 0 0 0 *** ***
South and central WA coast 0 *** *** 0 0 0 0 0
Astoria *** *** *** *** *** *** *** *** 0 0 *** ***
Tillamook 0 *** *** 0 *** *** 0 *** *** *** ***
Newport *** *** *** *** 0 *** *** *** *** *** *** *** ***
Coos Bay 3.3 . 3 *** *** 9.0.. 3 5.0 . 4 7.7 .. 3 4.8. 4 18.5... 4
Brookings 0 0 *** *** *** *** 0 *** *** 0
Crescent City 0 0 0 0 *** *** 0 0
Eureka *** *** *** *** 0 0 0 0 0
Fort Bragg *** *** *** *** 0 *** *** 0 0 0
Monterey 0 0 0 0 0 *** *** 0
DATA SUMMARIES 69 CATCHER VESSEL REPORT

Table 4.15: Fishing in Alaska or other fisheries fishery days at sea by home port. Average number of days vessels
participated in the Fishing in Alaska or other fisheries by home port reported on the EDC form (N = number of EDC vessels
with non-zero, non-NA responses). See description on page 57 for an explanation of EDC form changes (annotated with —)
over time.
Home port
2009 2010 2011 2012 2013 2014 2015
Mean N Mean N Mean N Mean N Mean N Mean N Mean N
Alaska *** *** *** *** — — — — — — — — — —
Puget Sound 108.3. 11 130.6. 10 — — — — — — — — — —
Astoria *** *** *** *** — — — — — — — — — —
Tillamook *** *** *** *** — — — — — — — — — —
Newport 107.9 .. 13 120.2.. 13 — — — — — — — — — —
Coos Bay *** *** *** *** — — — — — — — — — —
Brookings *** *** *** *** — — — — — — — — — —
San Francisco *** *** *** *** — — — — — — — — — —
Morro Bay *** *** *** *** — — — — — — — — — —
Table 4.16: Other West Coast Fisheries days at sea by home port. Average number of days vessels participated in the
Other West Coast Fisheries by home port reported on the EDC form (N = number of EDC vessels with non-zero, non-NA
responses). See description on page 57 for an explanation of EDC form changes (annotated with —) over time.
Home port
2009 2010 2011 2012 2013 2014 2015
Mean N Mean N Mean N Mean N Mean N Mean N Mean N
Puget Sound — — — — 0 0 0 0 *** ***
Crescent City — — — — 0 0 *** *** 0 0
Monterey — — — — 0 0 0 *** *** 0
Morro Bay — — — — *** *** *** *** 21.5... 4 0 0
DATA SUMMARIES 70 CATCHER VESSEL REPORT
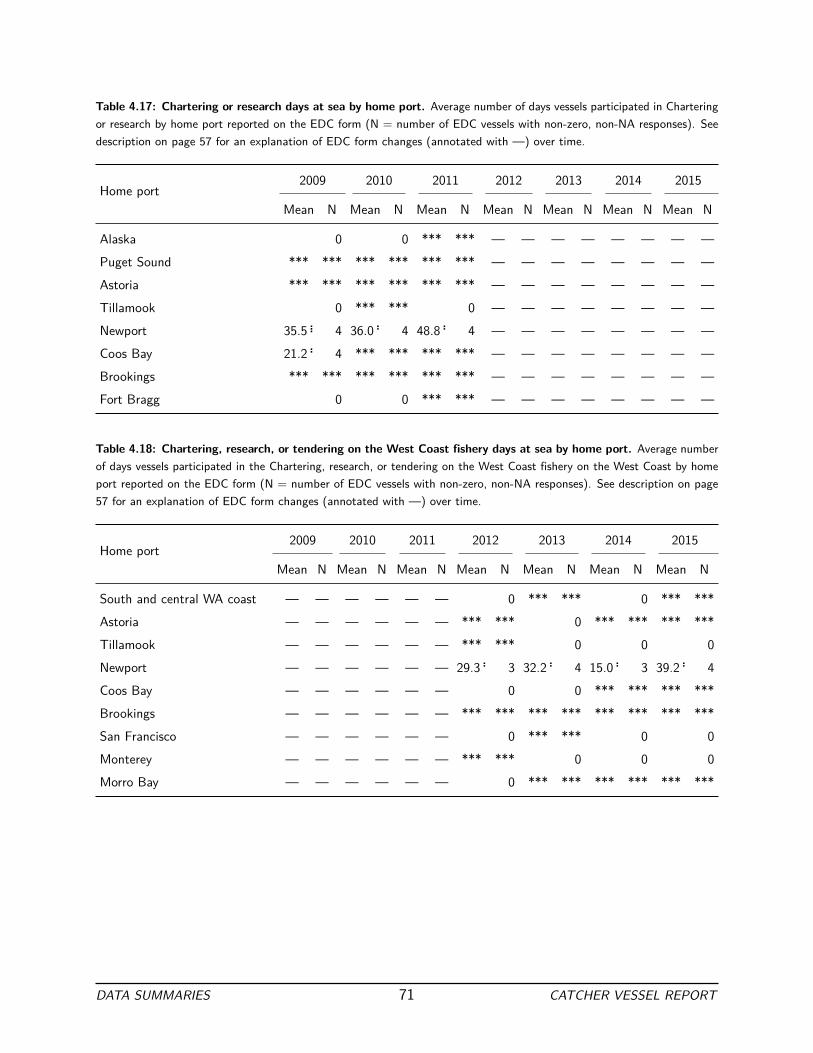
Table 4.17: Chartering or research days at sea by home port. Average number of days vessels participated in Chartering
or research by home port reported on the EDC form (N = number of EDC vessels with non-zero, non-NA responses). See
description on page 57 for an explanation of EDC form changes (annotated with —) over time.
Home port
2009 2010 2011 2012 2013 2014 2015
Mean N Mean N Mean N Mean N Mean N Mean N Mean N
Alaska 0 0 *** *** — — — — — — — —
Puget Sound *** *** *** *** *** *** — — — — — — — —
Astoria *** *** *** *** *** *** — — — — — — — —
Tillamook 0 *** *** 0 — — — — — — — —
Newport 35.5... 4 36.0.. 4 48.8.. 4 — — — — — — — —
Coos Bay 21.2.. 4 *** *** *** *** — — — — — — — —
Brookings *** *** *** *** *** *** — — — — — — — —
Fort Bragg 0 0 *** *** — — — — — — — —
Table 4.18: Chartering, research, or tendering on the West Coast fishery days at sea by home port. Average number
of days vessels participated in the Chartering, research, or tendering on the West Coast fishery on the West Coast by home
port reported on the EDC form (N = number of EDC vessels with non-zero, non-NA responses). See description on page
57 for an explanation of EDC form changes (annotated with —) over time.
Home port
2009 2010 2011 2012 2013 2014 2015
Mean N Mean N Mean N Mean N Mean N Mean N Mean N
South and central WA coast — — — — — — 0 *** *** 0 *** ***
Astoria — — — — — — *** *** 0 *** *** *** ***
Tillamook — — — — — — *** *** 0 0 0
Newport — — — — — — 29.3.. 3 32.2.. 4 15.0.. 3 39.2.. 4
Coos Bay — — — — — — 0 0 *** *** *** ***
Brookings — — — — — — *** *** *** *** *** *** *** ***
San Francisco — — — — — — 0 *** *** 0 0
Monterey — — — — — — *** *** 0 0 0
Morro Bay — — — — — — 0 *** *** *** *** *** ***
DATA SUMMARIES 71 CATCHER VESSEL REPORT

Table 4.19: Chartering, research, or tendering in Alaska fishery days at sea by home port. Average number of days
vessels participated in the Chartering, research, or tendering in Alaska by home port reported on the EDC form (N =
number of EDC vessels with non-zero, non-NA responses). See description on page 57 for an explanation of EDC form
changes (annotated with —) over time.
Home port
2009 2010 2011 2012 2013 2014 2015
Mean N Mean N Mean N Mean N Mean N Mean N Mean N
Puget Sound — — — — — — *** *** *** *** *** *** *** ***
Astoria — — — — — — 43.3. 3 *** *** 82.7. 3 63.0. 3
Tillamook — — — — — — *** *** *** *** *** *** 0
Newport — — — — — — 0 *** *** *** *** *** ***
Table 4.20: Fishing in Alaska fishery days at sea by home port. Average number of days vessels participated in the
Fishing in Alaska by home port reported on the EDC form (N = number of EDC vessels with non-zero, non-NA responses).
See description on page 57 for an explanation of EDC form changes (annotated with —) over time.
Home port
2009 2010 2011 2012 2013 2014 2015
Mean N Mean N Mean N Mean N Mean N Mean N Mean N
Alaska — — — — *** *** 0 *** *** *** *** *** ***
Puget Sound — — — — 141.6. 14 120.9. 10 117.1. 9 122.2. 10 131.0 . 10
Astoria — — — — *** *** *** *** 0 0 0
Tillamook — — — — *** *** *** *** *** *** *** *** 0
Newport — — — — 121.4.. 12 90.8.. 11 109.3 . 12 119.8.. 13 125.8 .. 12
Coos Bay — — — — *** *** *** *** 0 0 0
Brookings — — — — *** *** *** *** *** *** *** *** *** ***
San Francisco — — — — *** *** *** *** 0 0 0
DATA SUMMARIES 72 CATCHER VESSEL REPORT
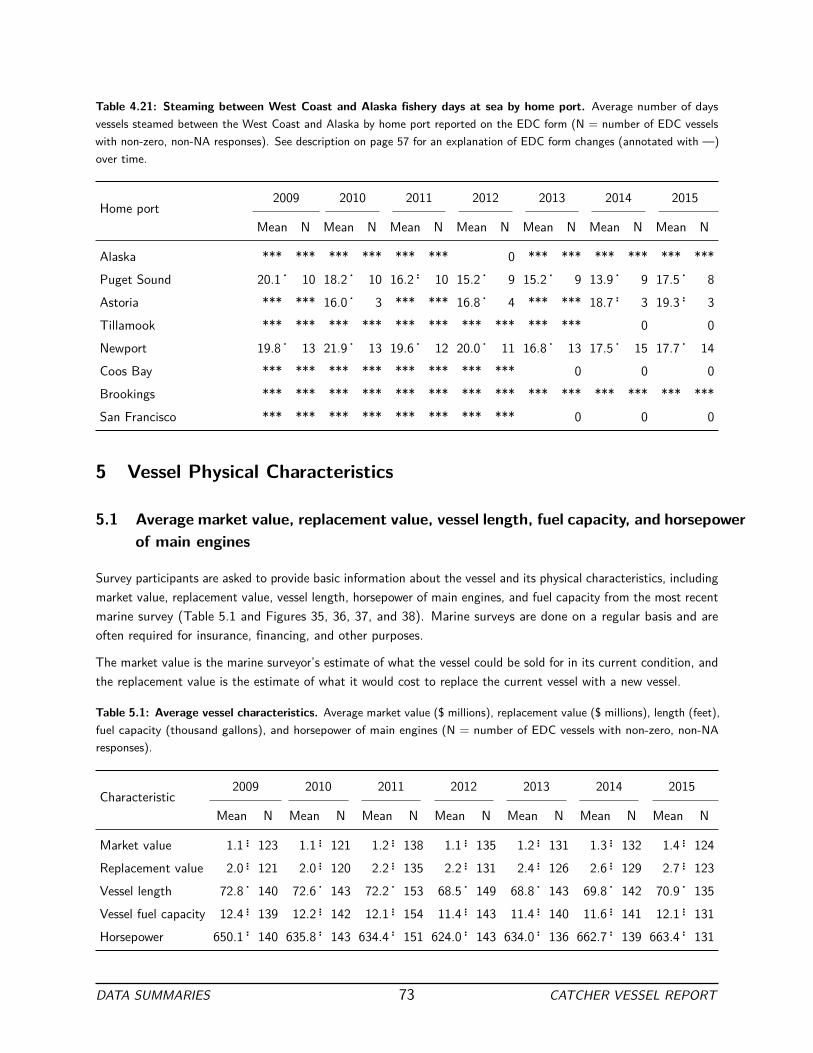
Table 4.21: Steaming between West Coast and Alaska fishery days at sea by home port. Average number of days
vessels steamed between the West Coast and Alaska by home port reported on the EDC form (N = number of EDC vessels
with non-zero, non-NA responses). See description on page 57 for an explanation of EDC form changes (annotated with —)
over time.
Home port
2009 2010 2011 2012 2013 2014 2015
Mean N Mean N Mean N Mean N Mean N Mean N Mean N
Alaska *** *** *** *** *** *** 0 *** *** *** *** *** ***
Puget Sound 20.1. 10 18.2. 10 16.2.. 10 15.2. 9 15.2. 9 13.9. 9 17.5. 8
Astoria *** *** 16.0. 3 *** *** 16.8. 4 *** *** 18.7.. 3 19.3.. 3
Tillamook *** *** *** *** *** *** *** *** *** *** 0 0
Newport 19.8. 13 21.9. 13 19.6. 12 20.0. 11 16.8. 13 17.5. 15 17.7. 14
Coos Bay *** *** *** *** *** *** *** *** 0 0 0
Brookings *** *** *** *** *** *** *** *** *** *** *** *** *** ***
San Francisco *** *** *** *** *** *** *** *** 0 0 0
5 Vessel Physical Characteristics
5.1 Average market value, replacement value, vessel length, fuel capacity, and horsepower
of main engines
Survey participants are asked to provide basic information about the vessel and its physical characteristics, including
market value, replacement value, vessel length, horsepower of main engines, and fuel capacity from the most recent
marine survey (Table 5.1 and Figures 35, 36, 37, and 38). Marine surveys are done on a regular basis and are
often required for insurance, financing, and other purposes.
The market value is the marine surveyor’s estimate of what the vessel could be sold for in its current condition, and
the replacement value is the estimate of what it would cost to replace the current vessel with a new vessel.
Table 5.1: Average vessel characteristics. Average market value ($ millions), replacement value ($ millions), length (feet),
fuel capacity (thousand gallons), and horsepower of main engines (N = number of EDC vessels with non-zero, non-NA
responses).
Characteristic
2009 2010 2011 2012 2013 2014 2015
Mean N Mean N Mean N Mean N Mean N Mean N Mean N
Market value 1.1 ... 123 1.1 ... 121 1.2... 138 1.1 ... 135 1.2... 131 1.3 ... 132 1.4 ... 124
Replacement value 2.0 ... 121 2.0 ... 120 2.2... 135 2.2 ... 131 2.4... 126 2.6 ... 129 2.7 ... 123
Vessel length 72.8. 140 72.6. 143 72.2. 153 68.5. 149 68.8. 143 69.8. 142 70.9. 135
Vessel fuel capacity 12.4... 139 12.2... 142 12.1... 154 11.4... 143 11.4... 140 11.6... 141 12.1... 131
Horsepower 650.1.. 140 635.8 .. 143 634.4.. 151 624.0.. 143 634.0.. 136 662.7.. 139 663.4 .. 131
DATA SUMMARIES 73 CATCHER VESSEL REPORT
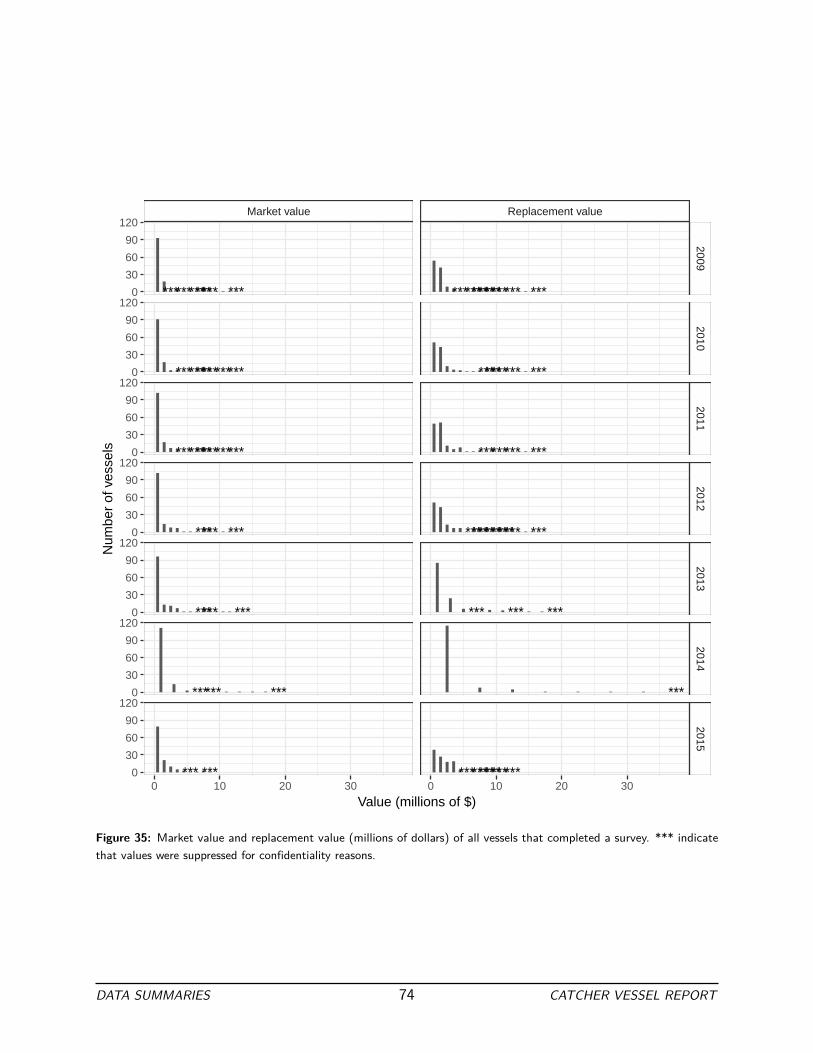
*************** ***
******************
******************
****** ***
****** ***
****** ***
*** ***
********************* ***
************ ***
********* ***
********************* ***
*** *** ***
***
******************
Market value Replacement value
20092010
20112012
20132014
2015
0 10 20 30 0 10 20 30
0
30
60
90
120
0
30
60
90
120
0
30
60
90
120
0
30
60
90
120
0
30
60
90
120
0
30
60
90
120
0
30
60
90
120
Value (millions of $)
Num
ber
of v
esse
ls
Figure 35: Market value and replacement value (millions of dollars) of all vessels that completed a survey. *** indicate
that values were suppressed for confidentiality reasons.
DATA SUMMARIES 74 CATCHER VESSEL REPORT

*** *** ***
*** ***
*** *** *** ***
*** *** *** *** ***
*** *** *** *** *** *** ***
*** *** *** ***
*** *** *** *** ***
20092010
20112012
20132014
2015
0 50 100 150
0
10
20
30
0
10
20
30
0
10
20
30
0
10
20
30
0
10
20
30
0
10
20
30
0
10
20
30
Vessel length (feet)
Num
ber
of v
esse
ls
Figure 36: Vessel length (feet) of all vessels that completed a survey. *** indicate that values were suppressed for
confidentiality reasons.
DATA SUMMARIES 75 CATCHER VESSEL REPORT

*** ***
*** ***
*** ***
*** ***
*** *** *** ***
*** *** *** ***
*** *** ***
20092010
20112012
20132014
2015
0 20 40 60
0
20
40
0
20
40
0
20
40
0
20
40
0
20
40
0
20
40
0
20
40
Vessel fuel capacity (thousands of gallons)
Num
ber
of v
esse
ls
Figure 37: Vessel fuel capacity (thousands of gallons) of all vessels that completed a survey. *** indicate that values were
suppressed for confidentiality reasons.
DATA SUMMARIES 76 CATCHER VESSEL REPORT

*** *** ***
***
*** *** ***
*** *** ***
***
*** *** ***
*** ***
20092010
20112012
20132014
2015
0 1000 2000 3000
0
20
40
60
80
0
20
40
60
80
0
20
40
60
80
0
20
40
60
80
0
20
40
60
80
0
20
40
60
80
0
20
40
60
80
Horsepower of main engines
Num
ber
of v
esse
ls
Figure 38: Horsepower of main engines of all vessels that completed a survey. *** indicate that values were suppressed for
confidentiality reasons.
DATA SUMMARIES 77 CATCHER VESSEL REPORT

Participants provide information about whether the vessel was hauled out (vessel was removed from the water
for maintenance and repairs). Each year, a significant portion of all active fishing vessels are hauled out. The
information shown below in Table 5.2 provides context that may be used to explain major costs associated with
vessel repair and maintenance.
Participants also note whether they process fish at-sea, which has increased over time (Table 5.3). The most
common occurrence of at-sea processing is heading and gutting sablefish before delivering the fish.
Table 5.2: Haul outs . Number (N) and percentage (%) of EDC vessels that hauled the vessel during the year.
Haul out
2009 2010 2011 2012 2013 2014 2015
N % N % N % N % N % N % N %
Yes 82 64% 65 50% 85 63% 81 63% 60 48% 79 63% 70 59%
No 46 36% 62 48% 49 37% 47 37% 63 51% 46 37% 48 41%
No response 0 0% 3 2% 0 0% 0 0% *** *** 0 0% 0 0%
Table 5.3: Catcher vessels that processed at-sea. Number (N) and percentage (%) of EDC vessels that processed or
headed and gutted fish on-board the vessel in survey year.
Processed at-sea
2009 2010 2011 2012 2013 2014 2015
N % N % N % N % N % N % N %
Yes 6 4.7% 7 5.4% 15 11.2% 17 13.3% 13 10.6% 14 11.1% 15 12.7%
No 122 95.3% 120 92.3% 117 87.3% 111 86.7% 108 87.8% 111 88.1% 89 75.4%
No response 0 0.0% 3 2.3% 2 1.5% 0 0.0% 2 1.6% 1 0.8% 14 11.9%
DATA SUMMARIES 78 CATCHER VESSEL REPORT
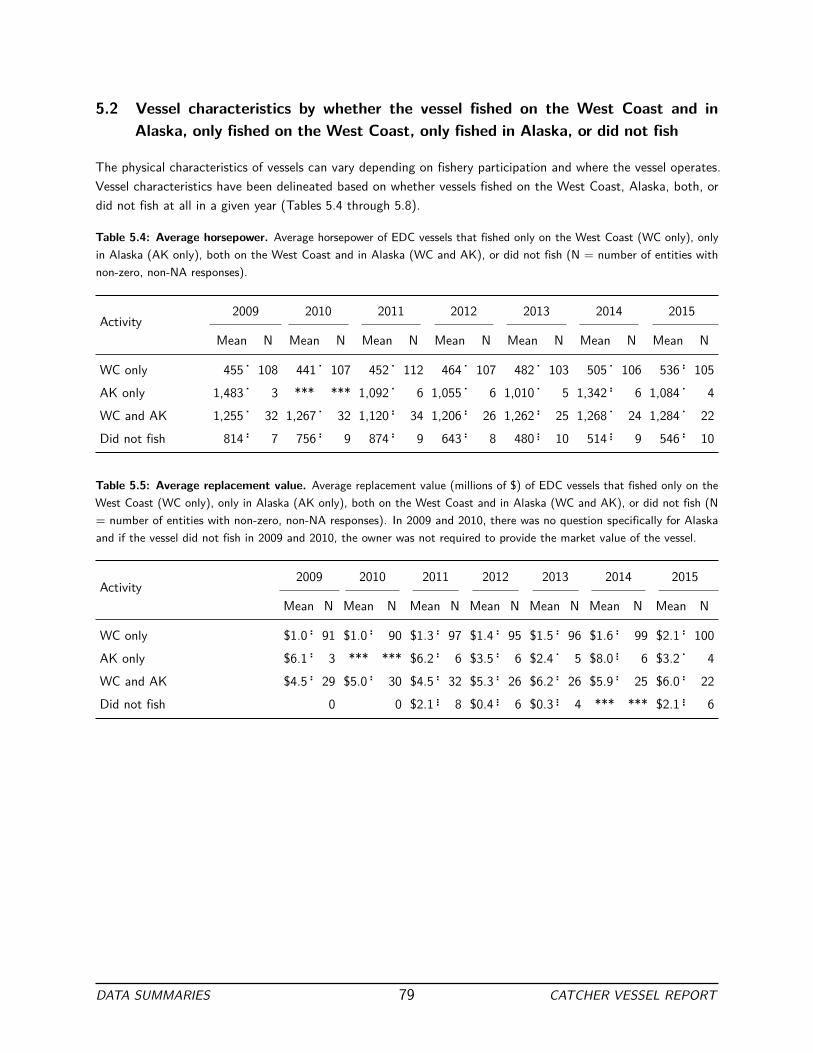
5.2 Vessel characteristics by whether the vessel fished on the West Coast and in
Alaska, only fished on the West Coast, only fished in Alaska, or did not fish
The physical characteristics of vessels can vary depending on fishery participation and where the vessel operates.
Vessel characteristics have been delineated based on whether vessels fished on the West Coast, Alaska, both, or
did not fish at all in a given year (Tables 5.4 through 5.8).
Table 5.4: Average horsepower. Average horsepower of EDC vessels that fished only on the West Coast (WC only), only
in Alaska (AK only), both on the West Coast and in Alaska (WC and AK), or did not fish (N = number of entities with
non-zero, non-NA responses).
Activity
2009 2010 2011 2012 2013 2014 2015
Mean N Mean N Mean N Mean N Mean N Mean N Mean N
WC only 455. 108 441 . 107 452. 112 464 . 107 482. 103 505 . 106 536.. 105
AK only 1,483. 3 *** *** 1,092. 6 1,055 . 6 1,010. 5 1,342.. 6 1,084. 4
WC and AK 1,255. 32 1,267 . 32 1,120.. 34 1,206 .. 26 1,262.. 25 1,268. 24 1,284. 22
Did not fish 814 .. 7 756.. 9 874.. 9 643 .. 8 480... 10 514 ... 9 546.. 10
Table 5.5: Average replacement value. Average replacement value (millions of $) of EDC vessels that fished only on the
West Coast (WC only), only in Alaska (AK only), both on the West Coast and in Alaska (WC and AK), or did not fish (N
= number of entities with non-zero, non-NA responses). In 2009 and 2010, there was no question specifically for Alaska
and if the vessel did not fish in 2009 and 2010, the owner was not required to provide the market value of the vessel.
Activity
2009 2010 2011 2012 2013 2014 2015
Mean N Mean N Mean N Mean N Mean N Mean N Mean N
WC only $1.0.. 91 $1.0.. 90 $1.3.. 97 $1.4.. 95 $1.5.. 96 $1.6.. 99 $2.1.. 100
AK only $6.1.. 3 *** *** $6.2.. 6 $3.5.. 6 $2.4. 5 $8.0... 6 $3.2. 4
WC and AK $4.5.. 29 $5.0.. 30 $4.5.. 32 $5.3.. 26 $6.2.. 26 $5.9.. 25 $6.0.. 22
Did not fish 0 0 $2.1... 8 $0.4... 6 $0.3... 4 *** *** $2.1... 6
DATA SUMMARIES 79 CATCHER VESSEL REPORT

Table 5.6: Average market value. Average market value (millions of $) if EDC vessels that fished only on the West Coast
(WC only), only in Alaska (AK only), both on the West Coast and in Alaska (WC and AK), or did not fish (N = number of
entities with non-zero, non-NA responses). In 2009 and 2010, if the vessel did not fish in 2009 and 2010, the owner was not
required to provide the replacement value of the vessel.
Activity
2009 2010 2011 2012 2013 2014 2015
Mean N Mean N Mean N Mean N Mean N Mean N Mean N
WC only $0.4.. 93 $0.4.. 91 $0.5... 98 $0.6... 98 $0.6.. 99 $0.7... 100 $1.0... 100
AK only $4.2.. 3 *** *** $3.9.. 6 $1.9.. 6 $1.5. 5 $4.6... 6 $1.9. 4
WC and AK $2.8.. 29 $3.3.. 30 $2.9.. 33 $3.1... 26 $3.7.. 26 $3.4.. 25 $3.4.. 22
Did not fish 0 0 $0.7... 9 $0.1... 7 $0.2.. 6 $0.2... 5 $1.3.... 7
Table 5.7: Average vessel fuel capacity. Average vessel fuel capacity (thousands of gallons) of EDC vessels that fished
only on the West Coast (WC only), only in Alaska (AK only), both on the West Coast and in Alaska (WC and AK), or did
not fish (N = number of entities with non-zero, non-NA responses).
Activity
2009 2010 2011 2012 2013 2014 2015
Mean N Mean N Mean N Mean N Mean N Mean N Mean N
WC only 6.6 .. 108 6.7.. 107 7.1.. 112 7.4 .. 107 7.9 .. 105 7.6.. 107 8.7.. 106
AK only 29.8.. 3 *** *** 33.5.. 6 18.5.. 6 15.0.. 5 22.2.. 6 21.5.. 4
WC and AK 28.7.. 32 31.2.. 32 24.3.. 34 27.4.. 26 29.1.. 26 29.6.. 25 28.3.. 22
Did not fish 26.4.. 6 14.1... 8 18.3.. 9 10.0... 8 5.4 .... 11 6.7.... 9 9.7... 10
Table 5.8: Average vessel length. Average length (feet) if EDC vessels that fished only on the West Coast (WC only),
only in Alaska (AK only), both on the West Coast and in Alaska (WC and AK), or did not fish (N = number of entities
with non-zero, non-NA responses).
Activity
2009 2010 2011 2012 2013 2014 2015
Mean N Mean N Mean N Mean N Mean N Mean N Mean N
WC only 65. 108 65. 107 65. 112 65 . 107 65. 106 66. 107 67. 108
AK only 98. 3 *** *** 98. 6 93 . 6 90. 4 104. 4 95. 4
WC and AK 98. 32 100. 32 93. 34 95 . 26 96. 26 95. 25 93. 22
Did not fish 81. 7 71. 9 70. 12 41 .. 14 41.. 13 44.. 12 54.. 13
DATA SUMMARIES 80 CATCHER VESSEL REPORT
6 Vessel Fuel Use, Speed, and Crew Size
6.1 Fuel use
Participants provide information about fuel use, which can be delineated according to fishery participation and
vessel size. There have been two changes to this question since the implementation of the survey. Through 2013,
participants were asked to report their average fuel use per day for all fishing for groundfish with fixed gear; starting
in 2014, participants were asked to provide average fuel use separately for fixed gear with a trawl permit and
fixed gear with a fixed gear permit. Similarly, in 2014, participants reported fuel use for Pacific halibut separately
from California halibut. Similarly, as a result of changes in fishing behavior, a new question was added in 2015,
requesting fuel use for the Non-whiting midwater fishery. More information about these changes can be found on
page 57.
DATA SUMMARIES 81 CATCHER VESSEL REPORT

Average fuel use per day by fishery
Table 6.1: Daily fuel use. Average daily fuel use (gallons per day) by fishery. See above for explanation of changes to the
data collection across years (N = number of EDC vessels with non-zero, non-NA responses). See above for an explanation
of EDC form changes (annotated with —) over time.
Activity
2009 2010 2011 2012 2013 2014 2015
Mean N Mean N Mean N Mean N Mean N Mean N Mean N
Pacific whiting 791 .. 39 822 .. 41 824 .. 33 814 .. 30 781 .. 32 741 . 31 792 . 29
Groundfish with midwater trawl
gear
— — — — — — — — — — — — 552 . 19
Groundfish with trawl gear 299 .. 104 305 .. 98 326 .. 81 321 .. 73 324 .. 76 327 .. 70 306 . 62
Groundfish with fixed gear 156 .. 8 143 .. 9 142 .. 26 168 .. 24 167 .. 21 — — — —
Groundfish fixed gear with a trawl
permit
— — — — — — — — — — 137 .. 20 175 .. 18
Groundfish fixed gear with a fixed
gear permit
— — — — — — — — — — 212 . 8 167 .. 11
Crab 173 .. 55 178 .. 56 170 .. 66 185 .. 65 196 .. 66 182 .. 66 189 .. 58
Halibut 271 .. 7 206 .. 6 141 ... 7 203 .. 6 152 ... 5 — — — —
Pacific halibut — — — — — — — — — — *** *** 132 .. 4
California halibut — — — — — — — — — — 160 ... 4 49.. 3
Salmon *** *** 39.. 4 70.. 5 45.. 10 46.. 5 49.. 11 48. 3
Shrimp 241 . 36 229. 36 223. 43 242 . 41 256 . 40 244 . 43 250. 49
Tuna 129 .. 15 120.. 14 78. 8 102 .. 12 109 .. 7 71.. 10 102.. 9
Steaming between West Coast
and Alaska
875 .. 28 871 .. 31 804 .. 31 817 .. 28 759 . 26 778 . 28 795 . 23
DATA SUMMARIES 82 CATCHER VESSEL REPORT

Average fuel use per day by fishery and vessel length class
Table 6.2: Pacific whiting fishery fuel use. Average fuel use (gallons per day) of vessels that fished in the Pacific whiting
fishery on the West Coast by length class of vessel (large vessel > 80 ft, 60 ft < medium vessels < = 80 ft, and small vessels
< = 60 ft) (N = number of EDC vessels with non-zero, non-NA responses). See above for an explanation of EDC form
changes (annotated with —) over time.
Vessel length category
2009 2010 2011 2012 2013 2014 2015
Mean N Mean N Mean N Mean N Mean N Mean N Mean N
Small vessel 0 0 *** *** 0 0 0 0
Medium vessel 399 . 9 407 . 9 396 . 5 481 . 5 487 . 5 487 . 5 598 . 4
Large vessel 908 .. 30 939 .. 32 924 .. 27 880.. 25 835 .. 27 790 . 26 823 . 25
Table 6.3: Groundfish with midwater trawl gear fishery fuel use. Average fuel use (gallons per day) of vessels that
fished in the Groundfish with midwater trawl gear fishery on the West Coast by length class of vessel (large vessel > 80
ft, 60 ft < medium vessels < = 80 ft, and small vessels < = 60 ft) (N = number of EDC vessels with non-zero, non-NA
responses). See above for an explanation of EDC form changes (annotated with —) over time.
Vessel length category
2009 2010 2011 2012 2013 2014 2015
Mean N Mean N Mean N Mean N Mean N Mean N Mean N
Small vessel — — — — — — — — — — — — *** ***
Medium vessel — — — — — — — — — — — — 444 . 8
Large vessel — — — — — — — — — — — — 678 . 10
Table 6.4: Groundfish with trawl gear fishery fuel use. Average fuel use (gallons per day) of vessels that fished in the
Groundfish with trawl gear fishery on the West Coast by length class of vessel (large vessel > 80 ft, 60 ft < medium vessels
< = 80 ft, and small vessels < = 60 ft) (N = number of EDC vessels with non-zero, non-NA responses). See above for an
explanation of EDC form changes (annotated with —) over time.
Vessel length category
2009 2010 2011 2012 2013 2014 2015
Mean N Mean N Mean N Mean N Mean N Mean N Mean N
Small vessel 180. 35 189. 30 241 .. 20 220 .. 19 224 .. 19 223 .. 18 202 . 16
Medium vessel 288. 48 289. 48 286. 45 304. 42 303 . 44 305 . 39 307 . 36
Large vessel 522. 21 516. 20 543. 16 541.. 12 543. 13 535 . 13 470 . 10
DATA SUMMARIES 83 CATCHER VESSEL REPORT

Table 6.5: Groundfish with fixed gear fishery fuel use. Average fuel use (gallons per day) of vessels that fished in the
Groundfish with fixed gear fishery on the West Coast by length class of vessel (large vessel > 80 ft, 60 ft < medium vessels
< = 80 ft, and small vessels < = 60 ft) (N = number of EDC vessels with non-zero, non-NA responses). See above for an
explanation of EDC form changes (annotated with —) over time.
Vessel length category
2009 2010 2011 2012 2013 2014 2015
Mean N Mean N Mean N Mean N Mean N Mean N Mean N
Small vessel 91. 6 84. 7 116.. 18 102 . 14 133 . 14 — — — —
Medium vessel *** *** *** *** 200 .. 7 231 . 8 235. 7 — — — —
Large vessel *** *** *** *** *** *** *** *** 0 — — — —
Table 6.6: Groundfish fixed gear with a trawl permit fishery fuel use. Average fuel use (gallons per day) of vessels that
fished in the Groundfish fixed gear with a trawl permit fishery on the West Coast by length class of vessel (large vessel > 80
ft, 60 ft < medium vessels < = 80 ft, and small vessels < = 60 ft) (N = number of EDC vessels with non-zero, non-NA
responses). See above for an explanation of EDC form changes (annotated with —) over time.
Vessel length category
2009 2010 2011 2012 2013 2014 2015
Mean N Mean N Mean N Mean N Mean N Mean N Mean N
Small vessel — — — — — — — — — — 98 .. 14 128 . 11
Medium vessel — — — — — — — — — — 227 . 6 247 . 6
Large vessel — — — — — — — — — — 0 *** ***
Table 6.7: Groundfish fixed gear with a fixed gear permit fishery fuel use. Average fuel use (gallons per day) of vessels
that fished in the Groundfish fixed gear with a fixed gear permit fishery on the West Coast by length class of vessel (large
vessel > 80 ft, 60 ft < medium vessels < = 80 ft, and small vessels < = 60 ft) (N = number of EDC vessels with non-zero,
non-NA responses). See above for an explanation of EDC form changes (annotated with —) over time.
Vessel length category
2009 2010 2011 2012 2013 2014 2015
Mean N Mean N Mean N Mean N Mean N Mean N Mean N
Small vessel — — — — — — — — — — 127 .. 3 112 . 6
Medium vessel — — — — — — — — — — 264 . 5 230 . 4
Large vessel — — — — — — — — — — 0 *** ***
DATA SUMMARIES 84 CATCHER VESSEL REPORT

Table 6.8: Crab fishery fuel use. Average fuel use (gallons per day) of vessels that fished in the Crab fishery on the West
Coast by length class of vessel (large vessel > 80 ft, 60 ft < medium vessels < = 80 ft, and small vessels < = 60 ft) (N =
number of EDC vessels with non-zero, non-NA responses). See above for an explanation of EDC form changes (annotated
with —) over time.
Vessel length category
2009 2010 2011 2012 2013 2014 2015
Mean N Mean N Mean N Mean N Mean N Mean N Mean N
Small vessel 96. 29 99. 29 99.. 33 97.. 31 101 .. 31 94.. 34 103 .. 29
Medium vessel 235. 20 239. 21 224. 26 250. 27 262. 26 254 . 25 252 . 22
Large vessel 342. 6 350. 6 303. 7 324. 7 330. 9 350 . 7 343 . 7
Table 6.9: Halibut fishery fuel use. Average fuel use (gallons per day) of vessels that fished in the Halibut fishery on the
West Coast by length class of vessel (large vessel > 80 ft, 60 ft < medium vessels < = 80 ft, and small vessels < = 60
ft) (N = number of EDC vessels with non-zero, non-NA responses). See above for an explanation of EDC form changes
(annotated with —) over time.
Vessel length category
2009 2010 2011 2012 2013 2014 2015
Mean N Mean N Mean N Mean N Mean N Mean N Mean N
Small vessel 100.. 4 50. 3 54 . 4 *** *** 82 . 3 — — — —
Medium vessel *** *** 363 . 3 258 .. 3 272 .. 4 *** *** — — — —
Large vessel *** *** 0 0 0 0 — — — —
Table 6.10: Pacific halibut fishery fuel use. Average fuel use (gallons per day) of vessels that fished in the Pacific halibut
fishery on the West Coast by length class of vessel (large vessel > 80 ft, 60 ft < medium vessels < = 80 ft, and small vessels
< = 60 ft) (N = number of EDC vessels with non-zero, non-NA responses). See above for an explanation of EDC form
changes (annotated with —) over time.
Vessel length category
2009 2010 2011 2012 2013 2014 2015
Mean N Mean N Mean N Mean N Mean N Mean N Mean N
Small vessel — — — — — — — — — — 0 93.. 3
Medium vessel — — — — — — — — — — *** *** 0
Large vessel — — — — — — — — — — 0 *** ***
DATA SUMMARIES 85 CATCHER VESSEL REPORT
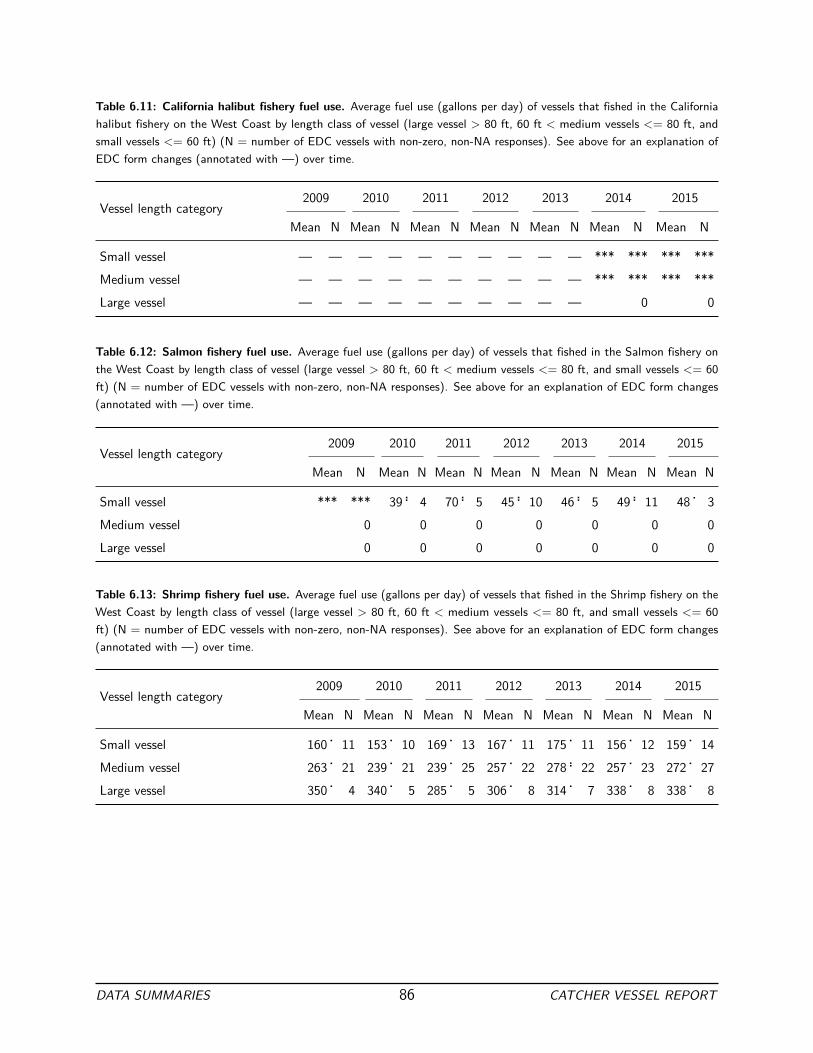
Table 6.11: California halibut fishery fuel use. Average fuel use (gallons per day) of vessels that fished in the California
halibut fishery on the West Coast by length class of vessel (large vessel > 80 ft, 60 ft < medium vessels < = 80 ft, and
small vessels < = 60 ft) (N = number of EDC vessels with non-zero, non-NA responses). See above for an explanation of
EDC form changes (annotated with —) over time.
Vessel length category
2009 2010 2011 2012 2013 2014 2015
Mean N Mean N Mean N Mean N Mean N Mean N Mean N
Small vessel — — — — — — — — — — *** *** *** ***
Medium vessel — — — — — — — — — — *** *** *** ***
Large vessel — — — — — — — — — — 0 0
Table 6.12: Salmon fishery fuel use. Average fuel use (gallons per day) of vessels that fished in the Salmon fishery on
the West Coast by length class of vessel (large vessel > 80 ft, 60 ft < medium vessels < = 80 ft, and small vessels < = 60
ft) (N = number of EDC vessels with non-zero, non-NA responses). See above for an explanation of EDC form changes
(annotated with —) over time.
Vessel length category
2009 2010 2011 2012 2013 2014 2015
Mean N Mean N Mean N Mean N Mean N Mean N Mean N
Small vessel *** *** 39 .. 4 70.. 5 45.. 10 46.. 5 49.. 11 48. 3
Medium vessel 0 0 0 0 0 0 0
Large vessel 0 0 0 0 0 0 0
Table 6.13: Shrimp fishery fuel use. Average fuel use (gallons per day) of vessels that fished in the Shrimp fishery on the
West Coast by length class of vessel (large vessel > 80 ft, 60 ft < medium vessels < = 80 ft, and small vessels < = 60
ft) (N = number of EDC vessels with non-zero, non-NA responses). See above for an explanation of EDC form changes
(annotated with —) over time.
Vessel length category
2009 2010 2011 2012 2013 2014 2015
Mean N Mean N Mean N Mean N Mean N Mean N Mean N
Small vessel 160. 11 153. 10 169. 13 167 . 11 175 . 11 156 . 12 159 . 14
Medium vessel 263. 21 239. 21 239. 25 257. 22 278 .. 22 257 . 23 272 . 27
Large vessel 350. 4 340. 5 285. 5 306. 8 314. 7 338 . 8 338 . 8
DATA SUMMARIES 86 CATCHER VESSEL REPORT
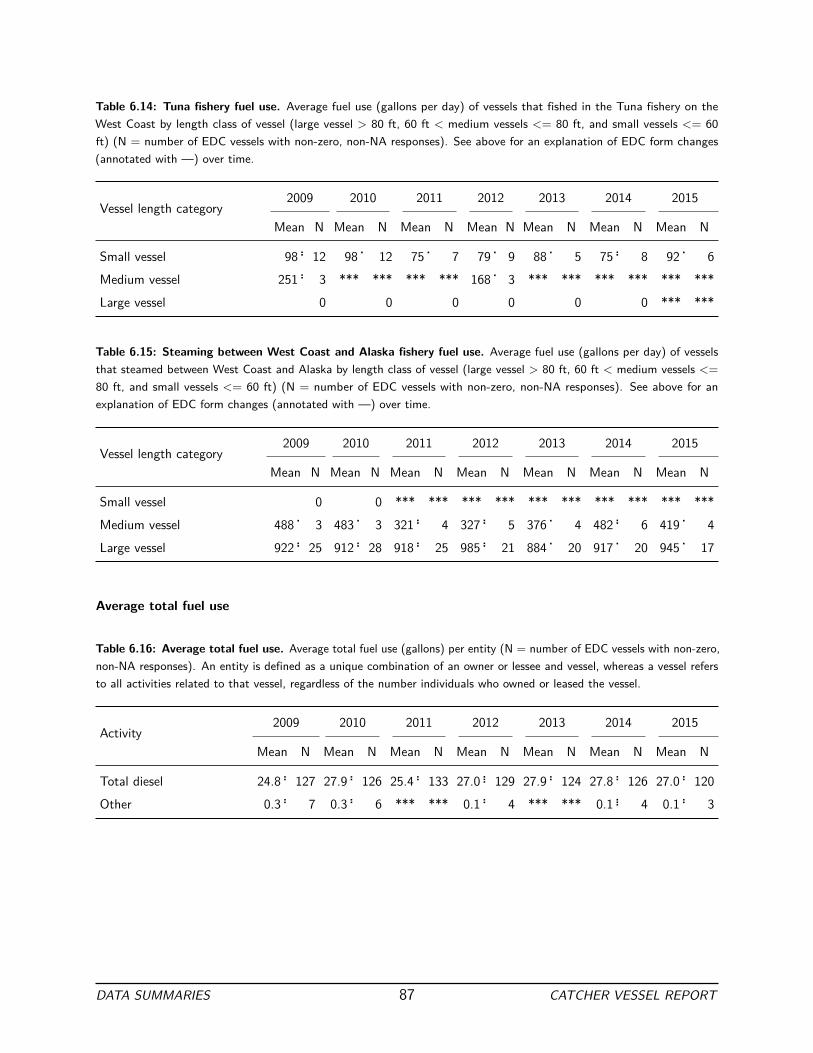
Table 6.14: Tuna fishery fuel use. Average fuel use (gallons per day) of vessels that fished in the Tuna fishery on the
West Coast by length class of vessel (large vessel > 80 ft, 60 ft < medium vessels < = 80 ft, and small vessels < = 60
ft) (N = number of EDC vessels with non-zero, non-NA responses). See above for an explanation of EDC form changes
(annotated with —) over time.
Vessel length category
2009 2010 2011 2012 2013 2014 2015
Mean N Mean N Mean N Mean N Mean N Mean N Mean N
Small vessel 98.. 12 98 . 12 75. 7 79. 9 88. 5 75.. 8 92 . 6
Medium vessel 251 .. 3 *** *** *** *** 168. 3 *** *** *** *** *** ***
Large vessel 0 0 0 0 0 0 *** ***
Table 6.15: Steaming between West Coast and Alaska fishery fuel use. Average fuel use (gallons per day) of vessels
that steamed between West Coast and Alaska by length class of vessel (large vessel > 80 ft, 60 ft < medium vessels < =
80 ft, and small vessels < = 60 ft) (N = number of EDC vessels with non-zero, non-NA responses). See above for an
explanation of EDC form changes (annotated with —) over time.
Vessel length category
2009 2010 2011 2012 2013 2014 2015
Mean N Mean N Mean N Mean N Mean N Mean N Mean N
Small vessel 0 0 *** *** *** *** *** *** *** *** *** ***
Medium vessel 488 . 3 483 . 3 321 .. 4 327 .. 5 376. 4 482.. 6 419 . 4
Large vessel 922 .. 25 912 .. 28 918 .. 25 985 .. 21 884. 20 917. 20 945 . 17
Average total fuel use
Table 6.16: Average total fuel use. Average total fuel use (gallons) per entity (N = number of EDC vessels with non-zero,
non-NA responses). An entity is defined as a unique combination of an owner or lessee and vessel, whereas a vessel refers
to all activities related to that vessel, regardless of the number individuals who owned or leased the vessel.
Activity
2009 2010 2011 2012 2013 2014 2015
Mean N Mean N Mean N Mean N Mean N Mean N Mean N
Total diesel 24.8.. 127 27.9.. 126 25.4.. 133 27.0... 129 27.9.. 124 27.8.. 126 27.0.. 120
Other 0.3 .. 7 0.3.. 6 *** *** 0.1 .. 4 *** *** 0.1... 4 0.1.. 3
DATA SUMMARIES 87 CATCHER VESSEL REPORT

6.2 Speed while fishing or steaming
Participants provide the average speed of the vessel while participating in each fishery (Table 6.17). This value is
only required for trawl fisheries, and therefore, no speed is provided for halibut, crab, or groundfish with fixed gear.
These data are delineated by fishery and vessel length class, as summarized in Tables 6.18 through 6.25. Speed
data are not available for all fisheries across all years due to changes in the survey data collection. Starting in
2014, participants began reporting average speed for California halibut, and in 2015 participants began reporting
fuel use for the Groundfish with midwater trawl gear fishery separately from Groundfish with trawl gear. More
information about these form changes can be found on page 57.
Average speed by fishery
Table 6.17: Average speed. Average speed (knots) by fishery. See above for explanation of changes to the data collection
across years (N = number of EDC vessels with non-zero, non-NA responses). See above for an explanation of EDC form
changes (annotated with —) over time.
Fishery
2009 2010 2011 2012 2013 2014 2015
Mean N Mean N Mean N Mean N Mean N Mean N Mean N
Pacific whiting 3.1 . 39 3.1. 41 3.2 . 33 3.1 . 30 3.4 . 32 3.3 . 31 3.3 . 29
Groundfish with midwater trawl
gear
— — — — — — — — — — — — 2.8 . 19
Groundfish with trawl gear 2.6 .. 104 2.6.. 98 2.8.. 80 2.7... 72 2.9 ... 72 2.8 ... 69 2.4 . 61
California halibut — — — — — — — — — — 2.8. 4 2.8 . 3
Salmon *** *** 2.5. 4 2.5. 5 2.8.. 10 2.6. 5 2.7 . 11 2.8 . 3
Shrimp 2.0 . 36 1.9. 36 2.7... 42 2.7... 40 2.1. 39 2.2 .. 43 2.2 . 49
Tuna 5.0 . 15 5.2. 15 5.2. 8 5.3. 12 5.5 . 7 6.2 . 10 5.4 . 9
Steaming between West Coast and
Alaska
9.0 . 28 9.0 . 30 8.9 . 31 9.0 . 28 9.0 . 26 9.2 . 26 9.0 . 23
Average speed by fishery and vessel length class
DATA SUMMARIES 88 CATCHER VESSEL REPORT

Table 6.18: Pacific whiting fishery fishing speed. Average speed (knots) of vessels that fished in the Pacific whiting
fishery on the West Coast by length class of vessel (large vessel > 80 ft, 60 ft < medium vessels < = 80 ft, and small vessels
< = 60 ft) (N = number of EDC vessels with non-zero, non-NA responses). See above for an explanation of EDC form
changes (annotated with —) over time.
Vessel length category
2009 2010 2011 2012 2013 2014 2015
Mean N Mean N Mean N Mean N Mean N Mean N Mean N
Small vessel 0 0 *** *** 0 0 0 0
Medium vessel 2.9 9 2.9 9 3.8 5 3.2 5 3.2 5 3.2 5 3.0 4
Large vessel 3.1 30 3.1 32 3.1 27 3.1 25 3.4 27 3.3 26 3.3 25
Table 6.19: Groundfish with midwater trawl gear fishery fishing speed. Average speed (knots) of vessels that fished in
the Groundfish with midwater trawl gear fishery on the West Coast by length class of vessel (large vessel > 80 ft, 60 ft <
medium vessels < = 80 ft, and small vessels < = 60 ft) (N = number of EDC vessels with non-zero, non-NA responses).
See above for an explanation of EDC form changes (annotated with —) over time.
Vessel length category
2009 2010 2011 2012 2013 2014 2015
Mean N Mean N Mean N Mean N Mean N Mean N Mean N
Small vessel — — — — — — — — — — — — *** ***
Medium vessel — — — — — — — — — — — — 2.7 8
Large vessel — — — — — — — — — — — — 2.9 10
Table 6.20: Groundfish with trawl gear fishery fishing speed. Average speed (knots) of vessels that fished in the
Groundfish with trawl gear fishery on the West Coast by length class of vessel (large vessel > 80 ft, 60 ft < medium vessels
< = 80 ft, and small vessels < = 60 ft) (N = number of EDC vessels with non-zero, non-NA responses). See above for an
explanation of EDC form changes (annotated with —) over time.
Vessel length category
2009 2010 2011 2012 2013 2014 2015
Mean N Mean N Mean N Mean N Mean N Mean N Mean N
Small vessel 2.8 35 2.9 30 2.6 20 2.1 19 2.2 18 2.2 17 2.5 15
Medium vessel 2.4 48 2.4 48 2.9 44 3.0 41 3.1 42 3.2 39 2.4 36
Large vessel 2.6 21 2.6 20 2.6 16 2.5 12 3.0 13 2.4 13 2.3 10
DATA SUMMARIES 89 CATCHER VESSEL REPORT

Table 6.21: California halibut fishery fishing speed. Average speed (knots) of vessels that fished in the California halibut
fishery on the West Coast by length class of vessel (large vessel > 80 ft, 60 ft < medium vessels < = 80 ft, and small vessels
< = 60 ft) (N = number of EDC vessels with non-zero, non-NA responses). See above for an explanation of EDC form
changes (annotated with —) over time.
Vessel length category
2009 2010 2011 2012 2013 2014 2015
Mean N Mean N Mean N Mean N Mean N Mean N Mean N
Small vessel — — — — — — — — — — *** *** *** ***
Medium vessel — — — — — — — — — — *** *** *** ***
Large vessel — — — — — — — — — — 0 0
Table 6.22: Salmon fishery fishing speed. Average speed (knots) of vessels that fished in the Salmon fishery on the West
Coast by length class of vessel (large vessel > 80 ft, 60 ft < medium vessels < = 80 ft, and small vessels < = 60 ft) (N =
number of EDC vessels with non-zero, non-NA responses). See above for an explanation of EDC form changes (annotated
with —) over time.
Vessel length category
2009 2010 2011 2012 2013 2014 2015
Mean N Mean N Mean N Mean N Mean N Mean N Mean N
Small vessel *** *** 2.5 4 2.5 5 2.8 10 2.6 5 2.7 11 2.8 3
Medium vessel 0 0 0 0 0 0 0
Large vessel 0 0 0 0 0 0 0
Table 6.23: Shrimp fishery fishing speed. Average speed (knots) of vessels that fished in the Shrimp fishery on the West
Coast by length class of vessel (large vessel > 80 ft, 60 ft < medium vessels < = 80 ft, and small vessels < = 60 ft) (N =
number of EDC vessels with non-zero, non-NA responses). See above for an explanation of EDC form changes (annotated
with —) over time.
Vessel length category
2009 2010 2011 2012 2013 2014 2015
Mean N Mean N Mean N Mean N Mean N Mean N Mean N
Small vessel 2.3 11 1.9 10 2.2 12 2.3 10 2.3 10 2.7 12 2.6 14
Medium vessel 1.8 21 1.9 21 3.0 25 3.2 22 2.0 22 2.1 23 2.0 27
Large vessel 1.9 4 2.0 5 1.9 5 1.9 8 2.0 7 2.0 8 2.0 8
DATA SUMMARIES 90 CATCHER VESSEL REPORT

Table 6.24: Tuna fishery fishing speed. Average speed (knots) of vessels that fished in the Tuna fishery on the West
Coast by length class of vessel (large vessel > 80 ft, 60 ft < medium vessels < = 80 ft, and small vessels < = 60 ft) (N =
number of EDC vessels with non-zero, non-NA responses). See above for an explanation of EDC form changes (annotated
with —) over time.
Vessel length category
2009 2010 2011 2012 2013 2014 2015
Mean N Mean N Mean N Mean N Mean N Mean N Mean N
Small vessel 4.9 12 5.1 12 5.1 7 5.1 9 5.6 5 6.3 8 5.4 6
Medium vessel 5.7 3 5.7 3 *** *** 5.8 3 *** *** *** *** *** ***
Large vessel 0 0 0 0 0 0 *** ***
Table 6.25: Steaming between West Coast and Alaska fishery fishing speed. Average speed (knots) of vessels that
steamed between West Coast and Alaska by length class of vessel (large vessel > 80 ft, 60 ft < medium vessels < = 80 ft,
and small vessels < = 60 ft) (N = number of EDC vessels with non-zero, non-NA responses). See above for an explanation
of EDC form changes (annotated with —) over time.
Vessel length category
2009 2010 2011 2012 2013 2014 2015
Mean N Mean N Mean N Mean N Mean N Mean N Mean N
Small vessel 0 0 *** *** *** *** *** *** *** *** *** ***
Medium vessel 9.0 3 8.7 3 8.5 4 8.4 5 8.1 4 8.5 5 7.3 4
Large vessel 9.0 25 9.1 27 9.0 25 9.1 21 9.1 20 9.4 20 9.3 17
DATA SUMMARIES 91 CATCHER VESSEL REPORT

6.3 Crew size
Participants submit information about crew size for each fishery in which they participate (Table 6.26). These data
provide information about the total number of jobs or positions on vessels; they do not reflect the total number of
individuals who worked as crew members in any given year. A new question was added for the 2013 data collection
that asks participants to provide the total number of individuals that worked on the vessel during the year (Table
6.41), also delineated by vessel length (Table 6.42). The total number of individuals employed across all vessels
serves as an upper bound of the total number of individuals employed in the fishery (Table 6.43).
Crew size data are not available for all fisheries across all years due to changes in fishery participation and the
survey data collection. Starting in 2014, participants were asked to provide average crew size for both fixed gear
with a trawl permit and fixed gear with a fixed gear permit rather than reporting them as combined. Similarly,
starting in 2014, participants report crew size for Pacific halibut separately from California halibut. Crew size is
reported by fishery and vessel length class in Tables 6.27 through 6.40. Similarly, as a result of changes in fishing
behavior, a new question was added in 2015, requesting crew size for the Non-whiting midwater fishery. More
information about these form changes can be found on page 57.
DATA SUMMARIES 92 CATCHER VESSEL REPORT

Average
crew
siz
e by
fishery
Table 6.26
: Average
crew
siz
e.
Average crew
siz
e (excluding
captain)
by
fishery. Se
e ab
ove for e
xplanatio
n of
changes to
the data
collection across
years (N
=
nu
mber
of ED
C vessels with
no
n-zero, n
on-N
A respon
ses). See ab
ove for an
explanation of
ED
C form
changes (ann
otated
with
—) over
tim
e.
Activ
ity
2009
2010
2011
2012
2013
2014
2015
Mean
N Mean
N Mean
N Mean
N Mean
N Mean
N Mean
N
Pacific
whiting
2.5
40
2.6
42
2.7
33
2.8
30
2.9
31
2.8
31
2.9
29
Grou
ndfish with
midwa
ter t
rawl
gear
—
—
—
—
—
—
—
—
—
—
—
—
2.6
19
Grou
ndfish with
tra
wl gear
2.0
104
2.0
98
2.0
81
2.1
73
2.1
75
2.1
70
2.1
60
Grou
ndfish with
fix
ed gear
1.9
8 2.0
8 2.6
26
2.8
24
2.7
20
—
—
—
—
Grou
ndfish fix
ed gear
with
a tra
wl perm
it —
—
—
—
—
—
—
—
—
—
2.4
20
2.9
18
Grou
ndfish fix
ed gear
with
a fix
ed gear
perm
it —
—
—
—
—
—
—
—
—
—
3.6
8 3.3
11
Crab
2.9
55
2.9
57
2.9
66
3.0
63
2.9
65
2.9
65
2.9
58
Halibut
1.8
7 1.6
6 1.9
7 2.1
6 2.5
4 —
—
—
—
Pacific
halibut
—
—
—
—
—
—
—
—
—
—
***
***
2.8
4 Ca
lifornia halibut
—
—
—
—
—
—
—
—
—
—
1.2
4 1.0
3 Sa
lmon
***
***
1.7
3 1.7
3 1.4
7 1.7
3 1.0
8 ***
***
Shrim
p 2.0
37
2.0
37
2.0
43
2.1
41
2.1
40
2.2
43
2.3
49
Tuna
1.5
15
1.6
14
1.5
7 1.6
11
1.9
7 1.3
9 1.7
9 Steaming between West C
oast
and Alaska
2.9
28
3.0
31
3.0
30
2.9
28
3.0
26
2.9
28
2.9
23
DATA SUMMARIES 93 CATCHER VESSEL REPORT
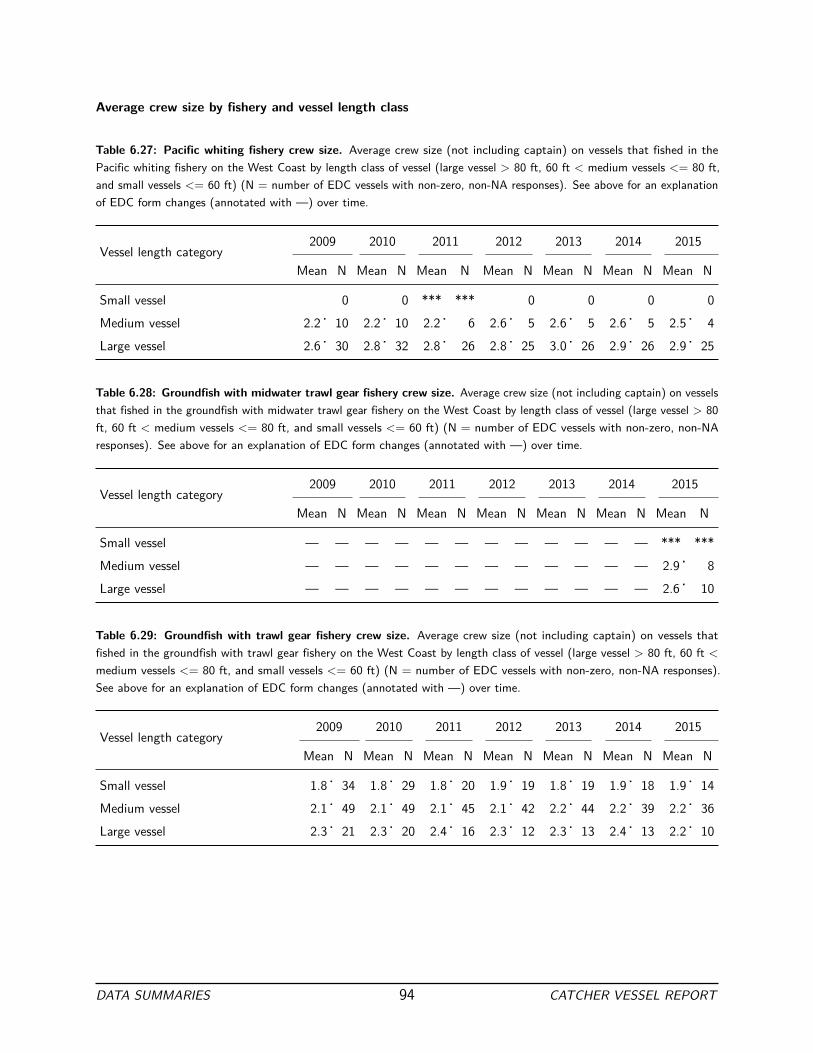
Average crew size by fishery and vessel length class
Table 6.27: Pacific whiting fishery crew size. Average crew size (not including captain) on vessels that fished in the
Pacific whiting fishery on the West Coast by length class of vessel (large vessel > 80 ft, 60 ft < medium vessels < = 80 ft,
and small vessels < = 60 ft) (N = number of EDC vessels with non-zero, non-NA responses). See above for an explanation
of EDC form changes (annotated with —) over time.
Vessel length category
2009 2010 2011 2012 2013 2014 2015
Mean N Mean N Mean N Mean N Mean N Mean N Mean N
Small vessel 0 0 *** *** 0 0 0 0
Medium vessel 2.2 . 10 2.2 . 10 2.2 . 6 2.6 . 5 2.6 . 5 2.6 . 5 2.5 . 4
Large vessel 2.6 . 30 2.8 . 32 2.8 . 26 2.8 . 25 3.0 . 26 2.9 . 26 2.9 . 25
Table 6.28: Groundfish with midwater trawl gear fishery crew size. Average crew size (not including captain) on vessels
that fished in the groundfish with midwater trawl gear fishery on the West Coast by length class of vessel (large vessel > 80
ft, 60 ft < medium vessels < = 80 ft, and small vessels < = 60 ft) (N = number of EDC vessels with non-zero, non-NA
responses). See above for an explanation of EDC form changes (annotated with —) over time.
Vessel length category
2009 2010 2011 2012 2013 2014 2015
Mean N Mean N Mean N Mean N Mean N Mean N Mean N
Small vessel — — — — — — — — — — — — *** ***
Medium vessel — — — — — — — — — — — — 2.9 . 8
Large vessel — — — — — — — — — — — — 2.6 . 10
Table 6.29: Groundfish with trawl gear fishery crew size. Average crew size (not including captain) on vessels that
fished in the groundfish with trawl gear fishery on the West Coast by length class of vessel (large vessel > 80 ft, 60 ft <
medium vessels < = 80 ft, and small vessels < = 60 ft) (N = number of EDC vessels with non-zero, non-NA responses).
See above for an explanation of EDC form changes (annotated with —) over time.
Vessel length category
2009 2010 2011 2012 2013 2014 2015
Mean N Mean N Mean N Mean N Mean N Mean N Mean N
Small vessel 1.8. 34 1.8. 29 1.8 . 20 1.9 . 19 1.8 . 19 1.9 . 18 1.9 . 14
Medium vessel 2.1. 49 2.1. 49 2.1. 45 2.1 . 42 2.2 . 44 2.2 . 39 2.2 . 36
Large vessel 2.3. 21 2.3. 20 2.4. 16 2.3. 12 2.3 . 13 2.4 . 13 2.2 . 10
DATA SUMMARIES 94 CATCHER VESSEL REPORT

Table 6.30: Groundfish with fixed gear fishery crew size. Average crew size (not including captain) on vessels that
fished in the groundfish with fixed gear fishery on the West Coast by length class of vessel (large vessel > 80 ft, 60 ft <
medium vessels < = 80 ft, and small vessels < = 60 ft) (N = number of EDC vessels with non-zero, non-NA responses).
See above for an explanation of EDC form changes (annotated with —) over time.
Vessel length category
2009 2010 2011 2012 2013 2014 2015
Mean N Mean N Mean N Mean N Mean N Mean N Mean N
Small vessel 1.3 .. 6 1.5.. 6 2.1. 18 2.1 .. 14 2.5 .. 13 — — — —
Medium vessel *** *** *** *** 3.6 . 7 3.5 . 8 3.1 . 7 — — — —
Large vessel *** *** *** *** *** *** *** *** 0 — — — —
Table 6.31: Groundfish fixed gear with a trawl permit fishery crew size. Average crew size (not including captain) on
vessels that fished in the groundfish fixed gear with a trawl permit fishery on the West Coast by length class of vessel (large
vessel > 80 ft, 60 ft < medium vessels < = 80 ft, and small vessels < = 60 ft) (N = number of EDC vessels with non-zero,
non-NA responses). See above for an explanation of EDC form changes (annotated with —) over time.
Vessel length category
2009 2010 2011 2012 2013 2014 2015
Mean N Mean N Mean N Mean N Mean N Mean N Mean N
Small vessel — — — — — — — — — — 2.1 .. 14 2.6 . 11
Medium vessel — — — — — — — — — — 3.2 .. 6 3.2 . 6
Large vessel — — — — — — — — — — 0 *** ***
Table 6.32: Groundfish fixed gear with a fixed gear permit fishery crew size. Average crew size (not including captain)
on vessels that fished in the groundfish fixed gear with a fixed gear permit fishery on the West Coast by length class of
vessel (large vessel > 80 ft, 60 ft < medium vessels < = 80 ft, and small vessels < = 60 ft) (N = number of EDC vessels
with non-zero, non-NA responses). See above for an explanation of EDC form changes (annotated with —) over time.
Vessel length category
2009 2010 2011 2012 2013 2014 2015
Mean N Mean N Mean N Mean N Mean N Mean N Mean N
Small vessel — — — — — — — — — — 2.7 .. 3 2.7 .. 6
Medium vessel — — — — — — — — — — 4.2 . 5 3.8 . 4
Large vessel — — — — — — — — — — 0 *** ***
DATA SUMMARIES 95 CATCHER VESSEL REPORT
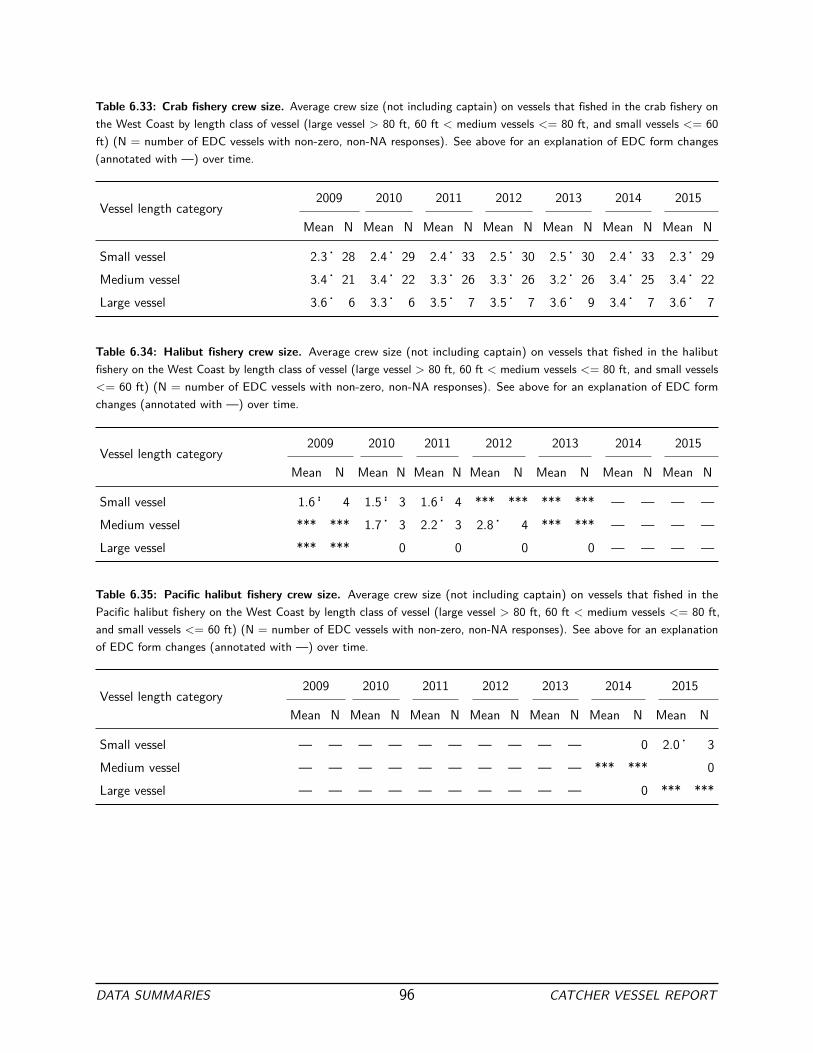
Table 6.33: Crab fishery crew size. Average crew size (not including captain) on vessels that fished in the crab fishery on
the West Coast by length class of vessel (large vessel > 80 ft, 60 ft < medium vessels < = 80 ft, and small vessels < = 60
ft) (N = number of EDC vessels with non-zero, non-NA responses). See above for an explanation of EDC form changes
(annotated with —) over time.
Vessel length category
2009 2010 2011 2012 2013 2014 2015
Mean N Mean N Mean N Mean N Mean N Mean N Mean N
Small vessel 2.3. 28 2.4. 29 2.4 . 33 2.5 . 30 2.5 . 30 2.4 . 33 2.3 . 29
Medium vessel 3.4. 21 3.4. 22 3.3. 26 3.3 . 26 3.2 . 26 3.4 . 25 3.4 . 22
Large vessel 3.6. 6 3.3. 6 3.5. 7 3.5 . 7 3.6 . 9 3.4 . 7 3.6 . 7
Table 6.34: Halibut fishery crew size. Average crew size (not including captain) on vessels that fished in the halibut
fishery on the West Coast by length class of vessel (large vessel > 80 ft, 60 ft < medium vessels < = 80 ft, and small vessels
< = 60 ft) (N = number of EDC vessels with non-zero, non-NA responses). See above for an explanation of EDC form
changes (annotated with —) over time.
Vessel length category
2009 2010 2011 2012 2013 2014 2015
Mean N Mean N Mean N Mean N Mean N Mean N Mean N
Small vessel 1.6 .. 4 1.5 .. 3 1.6 .. 4 *** *** *** *** — — — —
Medium vessel *** *** 1.7 . 3 2.2 . 3 2.8 . 4 *** *** — — — —
Large vessel *** *** 0 0 0 0 — — — —
Table 6.35: Pacific halibut fishery crew size. Average crew size (not including captain) on vessels that fished in the
Pacific halibut fishery on the West Coast by length class of vessel (large vessel > 80 ft, 60 ft < medium vessels < = 80 ft,
and small vessels < = 60 ft) (N = number of EDC vessels with non-zero, non-NA responses). See above for an explanation
of EDC form changes (annotated with —) over time.
Vessel length category
2009 2010 2011 2012 2013 2014 2015
Mean N Mean N Mean N Mean N Mean N Mean N Mean N
Small vessel — — — — — — — — — — 0 2.0. 3
Medium vessel — — — — — — — — — — *** *** 0
Large vessel — — — — — — — — — — 0 *** ***
DATA SUMMARIES 96 CATCHER VESSEL REPORT

Table 6.36: California halibut fishery crew size. Average crew size (not including captain) on vessels that fished in the
California halibut fishery on the West Coast by length class of vessel (large vessel > 80 ft, 60 ft < medium vessels < = 80 ft,
and small vessels < = 60 ft) (N = number of EDC vessels with non-zero, non-NA responses). See above for an explanation
of EDC form changes (annotated with —) over time.
Vessel length category
2009 2010 2011 2012 2013 2014 2015
Mean N Mean N Mean N Mean N Mean N Mean N Mean N
Small vessel — — — — — — — — — — *** *** *** ***
Medium vessel — — — — — — — — — — *** *** *** ***
Large vessel — — — — — — — — — — 0 0
Table 6.37: Salmon fishery crew size. Average crew size (not including captain) on vessels that fished in the salmon
fishery on the West Coast by length class of vessel (large vessel > 80 ft, 60 ft < medium vessels < = 80 ft, and small vessels
< = 60 ft) (N = number of EDC vessels with non-zero, non-NA responses). See above for an explanation of EDC form
changes (annotated with —) over time.
Vessel length category
2009 2010 2011 2012 2013 2014 2015
Mean N Mean N Mean N Mean N Mean N Mean N Mean N
Small vessel *** *** 1.7. 3 1.7. 3 1.4 . 7 1.7 . 3 1.0 . 8 *** ***
Medium vessel 0 0 0 0 0 0 0
Large vessel 0 0 0 0 0 0 0
Table 6.38: Shrimp fishery crew size. Average crew size (not including captain) on vessels that fished in the shrimp
fishery on the West Coast by length class of vessel (large vessel > 80 ft, 60 ft < medium vessels < = 80 ft, and small vessels
< = 60 ft) (N = number of EDC vessels with non-zero, non-NA responses). See above for an explanation of EDC form
changes (annotated with —) over time.
Vessel length category
2009 2010 2011 2012 2013 2014 2015
Mean N Mean N Mean N Mean N Mean N Mean N Mean N
Small vessel 1.8. 11 1.7. 10 1.9 . 13 2.1 . 11 2.0 . 11 2.1 . 12 2.1 . 14
Medium vessel 2.0. 22 2.0. 22 2.1. 25 2.0 . 22 2.2 . 22 2.3 . 23 2.3 . 27
Large vessel 2.1. 4 2.1. 5 2.0. 5 2.1 . 8 2.1 . 7 2.1 . 8 2.4 . 8
DATA SUMMARIES 97 CATCHER VESSEL REPORT

Table 6.39: Tuna fishery crew size. Average crew size (not including captain) on vessels that fished in the tuna fishery
on the West Coast by length class of vessel (large vessel > 80 ft, 60 ft < medium vessels < = 80 ft, and small vessels < =
60 ft) (N = number of EDC vessels with non-zero, non-NA responses). See above for an explanation of EDC form changes
(annotated with —) over time.
Vessel length category
2009 2010 2011 2012 2013 2014 2015
Mean N Mean N Mean N Mean N Mean N Mean N Mean N
Small vessel 1.5 . 11 1.6 . 11 1.4 . 6 1.8. 8 1.8 . 5 1.3. 7 1.3 . 6
Medium vessel 1.8 . 4 1.7 . 3 *** *** 1.3. 3 *** *** *** *** *** ***
Large vessel 0 0 0 0 0 0 *** ***
Table 6.40: Steaming between West Coast and Alaska fishery crew size. Average crew size (not including captain) on
vessels that steamed between West Coast and Alaska by length class of vessel (large vessel > 80 ft, 60 ft < medium vessels
< = 80 ft, and small vessels < = 60 ft) (N = number of EDC vessels with non-zero, non-NA responses). See above for an
explanation of EDC form changes (annotated with —) over time.
Vessel length category
2009 2010 2011 2012 2013 2014 2015
Mean N Mean N Mean N Mean N Mean N Mean N Mean N
Small vessel 0 0 *** *** *** *** *** *** *** *** *** ***
Medium vessel 3.0 . 3 3.0 . 3 3.2 . 4 2.6 . 5 2.8 . 4 2.5. 6 2.0 . 4
Large vessel 2.9 . 25 3.0 . 28 2.9 . 24 2.9 . 21 2.8 . 20 3.0. 20 2.9 . 17
DATA SUMMARIES 98 CATCHER VESSEL REPORT
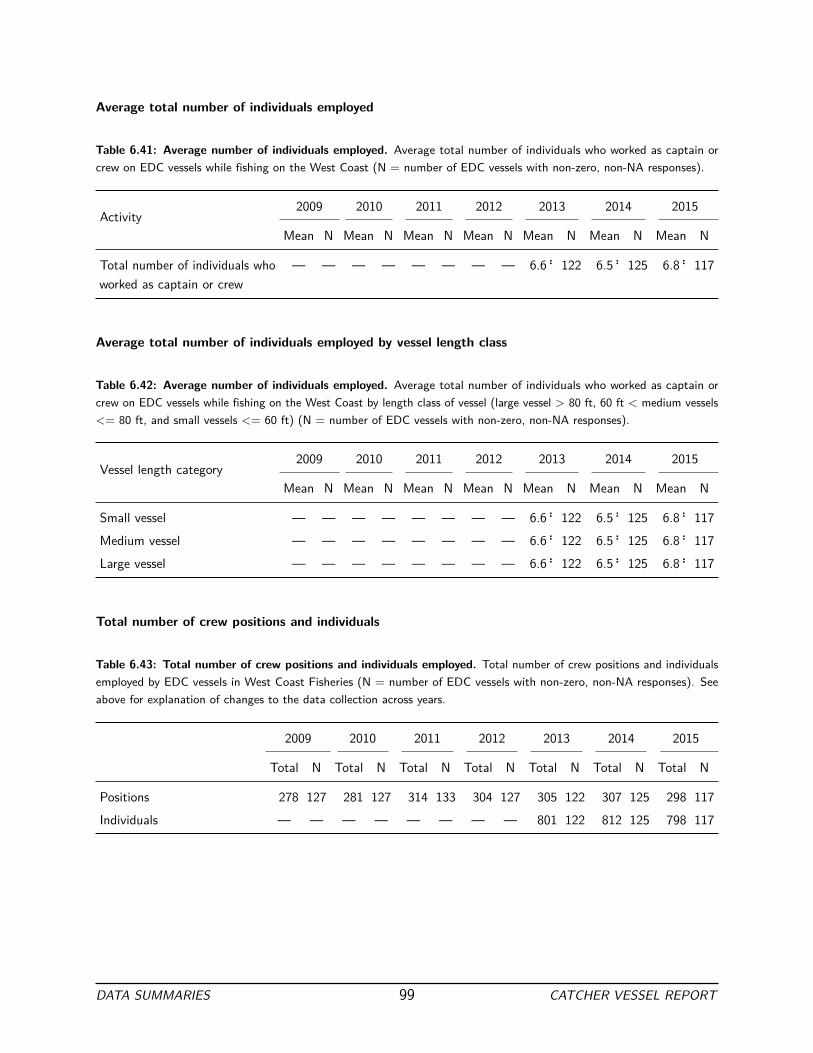
Average total number of individuals employed
Table 6.41: Average number of individuals employed. Average total number of individuals who worked as captain or
crew on EDC vessels while fishing on the West Coast (N = number of EDC vessels with non-zero, non-NA responses).
Activity
2009 2010 2011 2012 2013 2014 2015
Mean N Mean N Mean N Mean N Mean N Mean N Mean N
Total number of individuals who
worked as captain or crew
— — — — — — — — 6.6 .. 122 6.5.. 125 6.8 .. 117
Average total number of individuals employed by vessel length class
Table 6.42: Average number of individuals employed. Average total number of individuals who worked as captain or
crew on EDC vessels while fishing on the West Coast by length class of vessel (large vessel > 80 ft, 60 ft < medium vessels
< = 80 ft, and small vessels < = 60 ft) (N = number of EDC vessels with non-zero, non-NA responses).
Vessel length category
2009 2010 2011 2012 2013 2014 2015
Mean N Mean N Mean N Mean N Mean N Mean N Mean N
Small vessel — — — — — — — — 6.6 .. 122 6.5.. 125 6.8 .. 117
Medium vessel — — — — — — — — 6.6 .. 122 6.5.. 125 6.8 .. 117
Large vessel — — — — — — — — 6.6 .. 122 6.5.. 125 6.8 .. 117
Total number of crew positions and individuals
Table 6.43: Total number of crew positions and individuals employed. Total number of crew positions and individuals
employed by EDC vessels in West Coast Fisheries (N = number of EDC vessels with non-zero, non-NA responses). See
above for explanation of changes to the data collection across years.
2009 2010 2011 2012 2013 2014 2015
Total N Total N Total N Total N Total N Total N Total N
Positions 278 127 281 127 314 133 304 127 305 122 307 125 298 117
Individuals — — — — — — — — 801 122 812 125 798 117
DATA SUMMARIES 99 CATCHER VESSEL REPORT

7 At-Sea Deliveries and Shoreside Landings
Vessels in the catch share fishery participate in both shorebased and at-sea fisheries, with total landings summarized
in Table 7.1 and Figure 39. The only fishery for which vessels deliver at-sea is the whiting fishery. There is also a
shorebased whiting fleet. Information about the weight of landings or deliveries is not requested on the EDC forms
because this information is obtained from other sources.
Landings and deliveries information are primarily obtained from state fish ticket data and the At-Sea Hake Observer
Program database, respectively, accessed through PacFIN. The weight of landings and deliveries made while fishing
in Alaska are obtained from the EDC forms. Species composition is available for West Coast fisheries, but not
for Alaska fisheries. Alaska landings weights are provided here because they are used for cost disaggregation in
Section 9.
Table 7.1: Total shoreside landings and at-sea deliveries. Total landings and deliveries in West Coast at-sea and
shoreside fisheries and Alaska (thousands of round metric tons) (N = number of EDC vessels with non-zero, non-NA
responses).
Location
2009 2010 2011 2012 2013 2014 2015
Total N Total N Total N Total N Total N Total N Total N
At-sea 24.3 19 35.9 21 50.3 18 38.6 16 52.9 18 62.3 19 27.9 14
Shoreside 73.0 126 95.7 125 126.5 127 99.6 124 136.0 119 136.7 120 95.4 113
Alaska 81.9 27 94.2 28 101.0 27 90.3 25 99.1 24 102.9 24 88.7 21
Total landings 179.1 132 225.9 131 277.9 132 228.6 128 288.0 124 301.9 125 211.9 117
DATA SUMMARIES 100 CATCHER VESSEL REPORT

7.1
At-sea deliveries
The catcher v
essels that
deliver
at-se
a to
mothersh
ips o
n the West C
oast
target
Pa
cific
whiting
, with
very
little
bycatch (Table
7.2).
Table 7.2:
At-sea land
ings
and deliveries.
To
tal a
t-sea deliveries (m
etric
tons) by
species grou
p (N
=
nu
mber o
f EDC vessels with
no
n-zero, n
on-N
A respon
ses).
Species
grou
p 2009
2010
2011
2012
2013
2014
2015
Total
N To
tal
N To
tal
N To
tal
N To
tal
N To
tal
N To
tal
N
Arrowt
ooth
flo
under
1 19
3
20
7 18
2
16
3 18
2
19
1 14
Coastal p
elagics
***
***
0 14
14
10
10
15
86
16
20
16
24
13
English
sole
0 0
***
***
***
***
***
***
0 4
0 0
0 0
Pacific
halibut
0
13
1 13
0
5 0
7 0
12
0 8
***
***
Pacific
herring
0
11
***
***
***
***
***
***
***
***
0 14
0
9 Pa
cific
whiting
24,090
19
35,713
21
50,051
18
38,480
16
52,450
18
62,098
19
27,660
14
Rex sole
0 0
2 12
2
9 0
10
1 14
1
15
0 11
Rockfish
1 19
22
21
13
17
24
16
16
18
15
19
13
14
Sablefish
0
5 5
15
2 14
1
9 3
16
1 14
2
10
Salm
on
1 18
2
20
4 18
7
16
6 18
7
18
1 13
Sand
dab
0 0
0 0
0 0
0 0
***
***
0 0
0 3
Semi p
elagic rockfish
191
19
96
21
81
18
50
16
208
18
88 19
106
14
Sharks, skates a
nd rays
7
19
57
21
111
18
36
16
45
18
36 19
18
14
Squid
4 19
22
21
20
18
28
16
56
18
31
19
11
14
Thornyheads
0 0
0 9
1 9
1 10
6
15
2 16
2
13
Other
fla
tfish
0
4 ***
***
0 4
0 7
0 8
0 5
0 3
Other
grou
ndfish
0 0
0 0
0 5
0 5
0 6
0 10
***
***
Other
species
1
19
10
20
24
18
3 16
4
18
31 19
13
14
Total d
eliverie
s 24,296
19
35,934
21
50,330
18
38,643
16
52,885
18
62,333
19
27,851
14
DATA SUMMARIES 101 CATCHER VESSEL REPORT
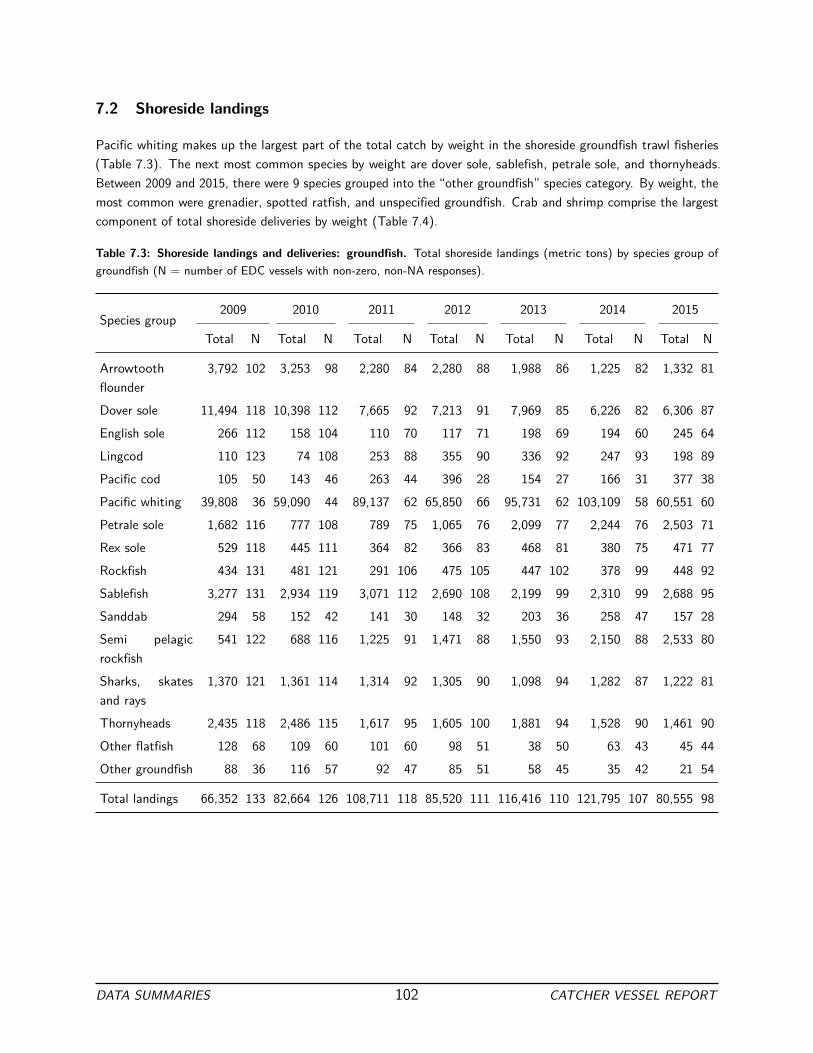
7.2 Shoreside landings
Pacific whiting makes up the largest part of the total catch by weight in the shoreside groundfish trawl fisheries
(Table 7.3). The next most common species by weight are dover sole, sablefish, petrale sole, and thornyheads.
Between 2009 and 2015, there were 9 species grouped into the “other groundfish” species category. By weight, the
most common were grenadier, spotted ratfish, and unspecified groundfish. Crab and shrimp comprise the largest
component of total shoreside deliveries by weight (Table 7.4).
Table 7.3: Shoreside landings and deliveries: groundfish. Total shoreside landings (metric tons) by species group of
groundfish (N = number of EDC vessels with non-zero, non-NA responses).
Species group
2009 2010 2011 2012 2013 2014 2015
Total N Total N Total N Total N Total N Total N Total N
Arrowtooth
flounder
3,792 102 3,253 98 2,280 84 2,280 88 1,988 86 1,225 82 1,332 81
Dover sole 11,494 118 10,398 112 7,665 92 7,213 91 7,969 85 6,226 82 6,306 87
English sole 266 112 158 104 110 70 117 71 198 69 194 60 245 64
Lingcod 110 123 74 108 253 88 355 90 336 92 247 93 198 89
Pacific cod 105 50 143 46 263 44 396 28 154 27 166 31 377 38
Pacific whiting 39,808 36 59,090 44 89,137 62 65,850 66 95,731 62 103,109 58 60,551 60
Petrale sole 1,682 116 777 108 789 75 1,065 76 2,099 77 2,244 76 2,503 71
Rex sole 529 118 445 111 364 82 366 83 468 81 380 75 471 77
Rockfish 434 131 481 121 291 106 475 105 447 102 378 99 448 92
Sablefish 3,277 131 2,934 119 3,071 112 2,690 108 2,199 99 2,310 99 2,688 95
Sanddab 294 58 152 42 141 30 148 32 203 36 258 47 157 28
Semi pelagic
rockfish
541 122 688 116 1,225 91 1,471 88 1,550 93 2,150 88 2,533 80
Sharks, skates
and rays
1,370 121 1,361 114 1,314 92 1,305 90 1,098 94 1,282 87 1,222 81
Thornyheads 2,435 118 2,486 115 1,617 95 1,605 100 1,881 94 1,528 90 1,461 90
Other flatfish 128 68 109 60 101 60 98 51 38 50 63 43 45 44
Other groundfish 88 36 116 57 92 47 85 51 58 45 35 42 21 54
Total landings 66,352 133 82,664 126 108,711 118 85,520 111 116,416 110 121,795 107 80,555 98
DATA SUMMARIES 102 CATCHER VESSEL REPORT

Table 7.4: Shoreside landings and deliveries: non-groundfish. Total shoreside landings (metric tons) by species group
of non-groundfish species (N = number of EDC vessels with non-zero, non-NA responses).
Species group
2009 2010 2011 2012 2013 2014 2015
Total N Total N Total N Total N Total N Total N Total N
California halibut 48 7 56 10 48 6 38 4 41 6 38 5 25 4
Coastal pelagics 1 32 4 26 24 30 46 30 126 26 314 26 257 27
Crab 2,572 78 2,315 76 2,658 89 2,045 76 3,990 79 1,832 73 330 60
Echinoderms 0 8 *** *** *** *** 0 8 0 6 *** *** 0 0
Pacific halibut 2 15 *** *** 6 25 5 25 4 30 2 27 11 28
Pacific herring 0 6 48 12 1 11 0 5 0 8 14 18 44 22
Salmon 1 30 17 35 33 31 37 37 34 34 46 38 16 37
Sharks, skates and
rays
1 26 32 44 7 52 21 41 3 22 6 27 17 35
Shrimp 5,323 34 7,515 40 12,921 43 11,710 39 13,163 38 17,122 41 18,265 47
Squid 34 63 118 51 18 45 25 41 19 36 31 39 41 31
Sturgeon 0 3 *** *** 0 0 0 0 0 0 0 0 0 0
Tuna 127 20 171 17 59 9 101 17 18 7 64 8 168 12
Other shellfish 3 33 2 32 1 32 2 25 2 24 2 20 3 23
Other species 68 59 31 59 13 64 154 63 81 63 56 58 163 52
Total landings 8,182 126 10,314 125 15,816 117 14,186 118 17,480 116 19,528 115 19,339 113
DATA SUMMARIES 103 CATCHER VESSEL REPORT

2015
2012 2013 2014
2009 2010 2011
Pac
ific
whi
ting
DT
S
Roc
kfis
h
Fla
tfish
Sha
rks,
ska
tes
and
rays
Cra
b
Hal
ibut
Shr
imp
Sal
mon
Tuna
Oth
er
Pac
ific
whi
ting
DT
S
Roc
kfis
h
Fla
tfish
Sha
rks,
ska
tes
and
rays
Cra
b
Hal
ibut
Shr
imp
Sal
mon
Tuna
Oth
er
Pac
ific
whi
ting
DT
S
Roc
kfis
h
Fla
tfish
Sha
rks,
ska
tes
and
rays
Cra
b
Hal
ibut
Shr
imp
Sal
mon
Tuna
Oth
er
0
25
50
75
100
0
25
50
75
100
0
25
50
75
100
Tota
l lan
ding
s (t
hous
ands
of m
etric
tons
)
Figure 39: Total landings by species group (thousands of metric tons).
8 Revenues
There are several sources of earnings for vessels on the West Coast. The primary source is revenue from sale of fish.
Ex-vessel revenue is available for all shoreside deliveries (Figure 40), but is not available for at-sea deliveries. EDC
data are used for all at-sea delivery revenues. Additionally, the EDC Program has information about revenue from
sale or lease of permits, quota shares, and quota pounds, and from other activities like chartering and research.
The full suite of earnings sources can be found in Table 8.1.
DATA SUMMARIES 104 CATCHER VESSEL REPORT

Table 8.1:
Average
annu
al revenu
e. Ann
ual a
verage
revenu
e (tho
usands
of
$)
for all c
ategories by
survey
year
(N
=
nu
mber of
ED
C vessels with
no
n-zero, n
on-N
A
respon
ses).
Activ
ity
2009
2010
2011
2012
2013
2014
2015
Mean
N Mean
N Mean
N Mean
N Mean
N Mean
N Mean
N
Alaska
shoreside lan
ding
s and
at-se
a deliveries
$1,227
.. 31
$1,321
.. 31
$1,841
.. 34
$1,836
.. 28
$1,681
.. 26
$1,680
.. 27
$1,587
.. 25
At-se
a deliveries
$308
... 20
$412
.. 20
$576
.. 18
$568
.. 16
$537
.. 19
$668
.. 18
$478
... 15
Shoreside deliveries
$382
.. 139
$404
.. 133
$660
.. 131
$629
.. 125
$805
.. 119
$773
.. 120
$703
.. 114
Sale
of qu
ota shares
***
***
0 ***
***
***
***
***
***
$726
... 4
$113
. 3
Lease of
qu
ota shares
0
0 $60..
11
$83...
12
$97..
5 $52...
18
$37..
13
Sale
of qu
ota po
unds
***
***
***
***
$54...
12
$20...
16
$40...
37
—
—
—
—
Lease of
qu
ota po
unds
0
***
***
$67...
48
$73....
41
$18...
10
—
—
—
—
Sale
or lea
se of
qu
ota po
unds
—
—
—
—
—
—
—
—
—
—
$31...
42
$35..
40
Sale
of West C
oast
lim
ited entry
tra
wl perm
its
0 $403
. 3
***
***
***
***
0 ***
***
0 Lease of
West C
oast
lim
ited entry
tra
wl perm
its
***
***
***
***
$82..
7 $39...
6 $52...
4 ***
***
***
***
Sale
of other p
ermits
$136
... 3
$85...
3 $181
... 5
***
***
0 —
—
—
—
Lease of
other p
ermits
***
***
***
***
$142
... 6
***
***
***
***
—
—
—
—
Sale
of West C
oast
lim
ited entry
fix
ed gear
perm
its
—
—
—
—
—
—
—
—
—
—
***
***
0 Lease of
West C
oast
lim
ited entry
fix
ed gear
perm
its
—
—
—
—
—
—
—
—
—
—
***
***
***
***
Leasing the vessel
—
—
—
—
—
—
***
***
***
***
—
—
—
—
Salm
on disaster
paym
ents
$26...
16
$2.
3 ***
***
0 0
0 0
Insurance settlem
ents
—
—
—
—
—
—
—
—
***
***
$41..
4 $116
... 8
Other
$89..
16
$117
.. 9
$135
... 11
$103
.. 8
$118
... 20
$91..
15
$213
... 11
Charterin
g or
lea
sing the vessel
$117
... 11
$157
... 11
$180
.. 13
—
—
—
—
$165
... 5
$329
... 3
Charterin
g, research, o
r tenderin
g on
the West C
oast
—
—
—
—
—
—
$163
.. 10
$85...
11
$143
.. 11
$147
.. 10
Charterin
g, research, o
r tenderin
g in
Alaska
—
—
—
—
—
—
$303
.. 3
$199
.. 7
$238
.. 5
$360
... 7
Average total revenue
$688
... 147
$768
... 141
$1,202
.. 142
$1,127
... 133
$1,285
.. 126
$1,254
.. 129
$1,143
.. 122
DATA SUMMARIES 105 CATCHER VESSEL REPORT

2015
2012 2013 2014
2009 2010 2011
Pac
ific
whi
ting
DT
S
Roc
kfis
h
Fla
tfish
Sha
rks,
ska
tes
and
rays
Cra
b
Hal
ibut
Shr
imp
Sal
mon
Tuna
Oth
er
Pac
ific
whi
ting
DT
S
Roc
kfis
h
Fla
tfish
Sha
rks,
ska
tes
and
rays
Cra
b
Hal
ibut
Shr
imp
Sal
mon
Tuna
Oth
er
Pac
ific
whi
ting
DT
S
Roc
kfis
h
Fla
tfish
Sha
rks,
ska
tes
and
rays
Cra
b
Hal
ibut
Shr
imp
Sal
mon
Tuna
Oth
er
0
10
20
30
40
0
10
20
30
40
0
10
20
30
40
Ex−
vess
el r
even
ue (
mill
ions
of $
)
Figure 40: Total ex-vessel shoreside revenue (millions of dollars).
DATA SUMMARIES 106 CATCHER VESSEL REPORT
9 Costs
This section summarizes data reported by participants on variable costs, fixed costs, total costs, and how those
costs are disaggregated to estimate the proportion of each cost that was incurred for West Coast fisheries.
For the purposes of the EDC Program, costs are divided into two categories, variable costs and fixed costs. Variable
costs vary with the level of fishery participation, and generally include items such as fuel and crew payments.
Fixed costs do not vary as directly with the level of fishery participation, and generally include items such as
vessel capital improvements. The designation of a cost as variable or fixed depends on many factors, including the
relevant time horizon and use of the data. While some costs would clearly be considered fixed ( e.g. , the purchase
of a new engine), others are more difficult to categorize as fixed versus variable. For the purposes of this report,
we consider the costs listed in the costs listed in Table 9.1 to be variable, and the costs listed in Tables 9.2, 9.3
and 9.5 to be fixed.
The EDC form collects both “capitalized expenditures” and “expenses” for vessel improvements and maintenance,
fishing gear, and processing equipment. This is because certain costs may be treated for tax accounting purposes
as either capitalized or expensed. Capitalized expenditures are depreciated over a number of years. Expensed items
are fully deducted as a cost for the year in which they occur. In an effort to reduce the reporting burden and
errors, these data are collected as they are reported in the business’ accounting system.
In order to conduct economic analyses of specific fisheries, it is important to have costs broken out by fishery.
For some costs, it may be feasible for participants to break out or track costs at the fishery level. However, for
most costs this is impossible, or would require additional burden to do so. During the EDC form development
process, a key issue was the determination of which costs could reasonably be broken out by fishery or groups of
fisheries. Each cost item was assigned to one or more fishery-group category based on how they are commonly
tracked by industry members: 1) used on West Coast fisheries only (West Coast Only); 2) used on the West Coast
and in other fisheries (Shared); and 3) used in all fisheries (All) regardless of whether they are used on the West
Coast.
Some costs that are required for economic analysis are not asked for on the EDC forms because they are available
through other sources, or can be calculated through fish ticket or permit office data. These include fish landings
taxes and fees.
Finally, there are a variety of costs that are associated with running a catcher vessel that are not requested on
the form because it is difficult to determine the share of the cost associated with the vessel. These costs include
items that can be used for activities other than fishing, or are too difficult to allocate to a particular vessel in a
multi-vessel company. These expenses include office space, pickup trucks, storage of equipment, professional fees,
and marketing. In general, the EDC forms aim to capture costs that are directly related to vessel maintenance and
fishing operations, and not costs that are related to activities or equipment off the vessel. For these reasons, the
EDC aggregated measures of costs (variable costs, fixed costs, and total costs) underestimate the true costs of
operating a business.
DATA SUMMARIES 107 CATCHER VESSEL REPORT

9.1 Variable costs
Variable costs were collected for all West Coast activities, including chartering or research. Unlike fixed costs,
variable costs are directly related to fishing operations, and therefore, it was possible for vessels to separate expenses
for activities on the West Coast from other activities. In all years, crew compensation made up the largest portion
of total variable expenses, followed by captain compensation, and fuel and lubrication (Table 9.1). Together, these
expenses made up 78.4% of all variable costs on the West Coast in 2015.
Table 9.1: Variable expenses. Average variable costs on the West Coast for EDC vessels (thousands of $) (N = number
of EDC vessels with non-zero, non-NA responses).
Expense category
2009 2010 2011 2012 2013 2014 2015
Mean N Mean N Mean N Mean N Mean N Mean N Mean N
Bait $9.4 66 $9.9 63 $14.9 74 $17.2 70 $18.2 69 $18.8 63 $13.9 52
Buyback fees $15.4 143 $18.2 139 $29.9 113 $27.6 109 $32.2 108 $32.4 105 $24.2 97
Captain $64.4 134 $69.0 128 $107.7 124 $108.4 116 $131.4 116 $131.4 117 $116.8 109
Communication $2.2 121 $2.6 114 $2.5 130 $2.4 125 $3.1 124 $3.2 123 $3.5 116
Cost recovery fees 0 0 0 0 0 $18.8 105 $13.8 97
Crew $82.5 142 $91.3 137 $146.1 134 $148.7 128 $172.9 122 $177.4 125 $155.9 118
Fishing association
dues
$4.0 85 $3.9 79 $6.0 94 $7.6 86 $8.0 87 $9.4 100 $9.7 98
Food $5.4 126 $5.6 119 $6.5 106 $7.1 91 $7.3 94 $6.9 95 $7.1 84
Freight $0.6 30 $0.7 26 $2.3 24 $1.1 23 $1.6 24 $1.3 23 $1.0 24
Fuel and lubrication $50.3 144 $68.8 136 $81.3 134 $92.5 129 $91.5 124 $94.3 125 $65.0 118
Ice $6.4 109 $5.7 104 $5.9 102 $6.4 96 $7.4 92 $10.2 90 $11.4 84
License fees *** *** $0.3 14 $3.3 129 $3.8 125 $3.5 122 $2.6 121 $3.5 116
Observers $5.2 23 $5.4 26 $3.0 102 $5.7 103 $10.4 106 $15.1 102 $17.9 95
Offloading $4.0 58 $4.6 53 $5.4 57 $8.0 38 $5.2 35 $5.0 38 $4.3 39
Supplies $8.6 110 $9.8 101 $5.9 100 $6.4 98 $6.9 94 $8.7 89 $8.7 86
Travel $1.7 47 $1.8 40 $1.7 28 $2.2 24 $2.1 29 $3.1 37 $3.2 33
Trucking of fish *** *** $1.4 13 $3.7 9 $4.5 6 $3.9 4 $4.2 8 $1.8 7
Washington fish
taxes
$3.0 21 $3.0 26 $5.6 31 $6.1 24 $7.4 22 $6.5 30 $6.4 30
Average total $235.2 144 $266.2 140 $385.5 136 $404.9 129 $463.8 124 $496.0 125 $419.3 118
DATA SUMMARIES 108 CATCHER VESSEL REPORT

9.2 Fixed costs
Costs on vessel and on-board equipment, fishing gear, and processing equipment
Survey participants are asked to provide capitalized expenditures (Table 9.2) and expenses (Table 9.3) for the
survey year associated with the following categories:
• New and used vessel and on-board equipment: Includes all electronics, safety equipment, and machinery not
used to harvest fish, but not fishing gear or processing equipment
• Fishing gear: Includes nets, doors, traps, pots, cables, and fishing machinery used for the West Coast fisheries
• Processing Equipment: Includes any equipment used to process or head and gut fish on-board the vessel
From 2009-2013, participants were asked to report capitalized expenditures and expenses separately (Tables 9.2
and 9.3). Beginning in 2014, the EDC survey was changed and participants now report total costs (capitalized
expenditures and expenses combined) 9.4). This information is reported in three tables to document exactly what
data were collected and how, a summary table of the West Coast portion of these costs is also available (first
three rows of Table 12.1).
DATA SUMMARIES 109 CATCHER VESSEL REPORT

Table 9.2:
Capita
lized
expe
nditu
res on
vessel
and on
-board
equipm
ent,
fishing
gear, a
nd processin
g equipm
ent.
Av
erage capitalized
expend
itures (tho
usands
of
$)
on vessel
and on
-board
equipm
ent, fishing
gear, a
nd processin
g equipm
ent.
See ab
ove for e
xplanatio
n of
changes to
the data
collection across
years,
and the resulting
new
summary in
Ta
ble 12.1
(N
=
nu
mber o
f EDC vessels with
no
n-zero, n
on-N
A respon
ses).
Expend
iture
category
2009
2010
2011
2012
2013
2014
2015
Mean
N Mean
N Mean
N Mean
N Mean
N Mean
N Mean
N
Vessel
and on
-board
equipm
ent in all
fisherie
s $69.5....
92 $63.6....
83
$71.3...
104
$148.3
.... 92
$111.7
... 78
—
—
—
—
Fishing gear
shared
between the West C
oast
and other fish
eries
$37.5...
32 $45.7...
29
$91.8..
29
$86.0..
16
$59.3..
11
—
—
—
—
Fishing gear
used
on
ly on
the West C
oast
$22.4...
83 $22.8...
75
$40.5...
94
$26.8...
81
$30.5...
34
—
—
—
—
Processin
g equipm
ent s
hared between the West C
oast
and other
fisherie
s 0
0 ***
***
0 ***
***
—
—
—
—
Processin
g equipm
ent u
sed on
ly on
the West C
oast
$20.5...
15 $22.2...
10
$3.0
... 7
***
***
***
***
—
—
—
—
Average total
$85.7...
114
$84.5....
101
$111.3
... 125
$165.3
.... 104
$111.9
... 93
—
—
—
—
DATA SUMMARIES 110 CATCHER VESSEL REPORT

Table 9.3:
Ex
penses
on
vessel
and on
-board
equipm
ent,
fishing
gear, and processin
g equipm
ent.
Av
erage expenses
(tho
usands
of
$)
on
vessel
and on
-board
equipm
ent, fishing
gear, a
nd processin
g equipm
ent.
See ab
ove for e
xplanatio
n of
changes to
the data
collection across
years, and the resulting
new
summary in
Ta
ble 12
.1
(N =
nu
mber o
f EDC vessels with
no
n-zero, n
on-N
A respon
ses).
Expense category
2009
2010
2011
2012
2013
2014
2015
Mean
N Mean
N Mean
N Mean
N Mean
N Mean
N Mean
N
Vessel
and on
-board
equipm
ent in all
fisherie
s $62.1
134
$57.4
125
$95.9
117
$98.0
116
$79.9
101
—
—
—
—
Fishing gear
shared
between the West C
oast
and other fish
eries
$34.2
44 $48.5
40
$95.7
35 $146.3
28
$141.7
16
—
—
—
—
Fishing gear
used
on
ly on
the West C
oast
$19.0
118
$20.7
109
$25.3
109
$35.8
106
$34.4
65
—
—
—
—
Processin
g equipm
ent shared
between
the West Co
ast and
other
fisherie
s 0
$0.9
9
$16.3
5 $10.3
4 $2.0
5
—
—
—
—
Average total
$82.7
146
$82.4
138
$128.0
136
$145.1
133
$111.3
113
—
—
—
—
Table 9.4:
Capita
lized
expe
nditu
res and expe
nses
on
vessel
and on
-board
equipm
ent,
fishing
gear, a
nd processin
g equipm
ent.
Av
erage expenses
(tho
usands
of
$)
on vessel
and on
-board
equipm
ent, fishing
gear, a
nd processin
g equipm
ent.
Beginn
ing in
2014, p
artic
ipants
repo
rted
combined capitalized
expend
itures and expenses, the
costs collected
in
the original
form
at can be
foun
d in
Ta
bles
9.2 and 9.3 (N
=
nu
mber o
f EDC vessels with
no
n-zero, n
on-N
A respon
ses).
Expense category
2009
2010
2011
2012
2013
2014
2015
Mean
N Mean
N Mean
N Mean
N Mean
N Mean
N Mean
N
Vessel
and on
-board
equipm
ent in all
fisherie
s —
—
—
—
—
—
—
—
—
—
$168.8
.... 102
$146.7
.... 105
Fishing gear
shared
between the West C
oast
and other fish
eries
—
—
—
—
—
—
—
—
—
—
$104.0
... 14
$74.2..
18
Fishing gear
used
on
ly on
the West C
oast
—
—
—
—
—
—
—
—
—
—
$36.5..
67
$40.2...
66
Processin
g equipm
ent s
hared between the West C
oast
and other fish
eries
—
—
—
—
—
—
—
—
—
—
0
0 Processin
g equipm
ent u
sed on
ly on
the West C
oast
—
—
—
—
—
—
—
—
—
—
***
***
$0.7
... 3
Average total
—
—
—
—
—
—
—
—
—
— $182.1
... 116
$170.2
.... 114
DATA SUMMARIES 111 CATCHER VESSEL REPORT

Other fixed costs
Table 9.5: Other fixed expenses. Average fixed expenses (thousands of $) on all other categories (N = number of EDC
vessels with non-zero, non-NA responses).
Expense
2009 2010 2011 2012 2013 2014 2015
Mean N Mean N Mean N Mean N Mean N Mean N Mean N
Insurance $33.3.. 134 $34.4.. 129 $37.6.. 131 $38.6.. 126 $42.0.. 122 $44.8 .. 124 $43.4.. 118
Lease of vessel $86.3.... 12 $107.7... 10 $89.9 ... 10 $65.9... 8 $95.2... 9 $94.9.... 9 $156.9... 8
Moorage $5.4... 144 $5.9... 134 $6.1... 139 $6.8... 132 $7.1... 127 $7.4... 129 $7.3.. 121
Average total $42.6... 147 $45.1... 140 $47.3 ... 141 $47.3... 133 $53.7... 128 $56.6 ... 130 $59.5... 122
Table 9.6: Depreciation. Average depreciation (thousands of $) taken during the survey year (N = number of EDC vessels
with non-zero, non-NA responses).
Expense
2009 2010 2011 2012 2013 2014 2015
Mean N Mean N Mean N Mean N Mean N Mean N Mean N
Depreciation $75.9... 101 $68.5.... 92 $107.1... 98 $103.5 ... 89 $92.0... 87 $84.5 ... 91 $99.7... 89
DATA SUMMARIES 112 CATCHER VESSEL REPORT

9.3
Quo
ta and pe
rmit costs on
the West Coast
EDC particip
ants
are asked to
provide inform
ation ab
out t
he costs r
elated to
pu
rchasin
g or
lea
sing perm
its, q
uota
shares, a
nd qu
ota po
unds. U
p un
til 2014,
particip
ants
we
re asked to
repo
rt total e
xpenses r
elated to
pu
rchase
of
qu
ota po
unds
separately
from
the expenses
relat
ed to
lea
se of
qu
ota po
unds. T
his
questio
n caused
confusion am
ong particip
ants
because they
use those term
s interchangeably.
Th
e change
in
the qu
estio
n form
at can be
seen
in
Ta
ble 9.7
where “—
” indicates y
ears
in wh
ich the qu
estio
n wa
s not
asked.
Table 9.7:
Quo
ta and pe
rmit costs.
Av
erage costs (tho
usands
of
$)
related to
lease and pu
rchase
of
qu
ota shares, q
uota
po
unds, a
nd lim
ited entry grou
ndfish perm
its.
See ab
ove for explanation of
changes to
the data
collection across
years (N
=
nu
mber o
f EDC vessels with
no
n-zero, n
on-N
A respon
ses).
Expense
2009
2010
2011
2012
2013
2014
2015
Mean
N Mean
N Mean
N Mean
N Mean
N Mean
N Mean
N
Purchase
of
tra
wl lim
ited entry
perm
it $28.9
8 ***
***
***
***
***
***
***
***
***
***
***
***
Lease of
tra
wl lim
ited entry
perm
it $15.7
9 $14.1
8 $25.4
11
$17.9
10
$10.1
7 $25.4
10
$8.8
11
Purchase
of
fix
ed gear
lim
ited entry
perm
it 0
0 ***
***
0 ***
***
***
***
0 Lease of
fix
ed gear
lim
ited entry
perm
it 0
0 ***
***
$101.4
5
$57.7
3 ***
***
$51.0
3 Pu
rchase
of
qu
ota shares
0
0 ***
***
***
***
***
***
***
***
***
***
Lease of
qu
ota shares
0
***
***
$22.1
3 $41.6
5 $97.0
9 $65.6
21 $50.9
15
Purchase
of
qu
ota po
unds
0
***
***
$16.5
16
$18.6
15
$26.8
9 —
—
—
—
Lease of
qu
ota po
unds
***
***
$35.1
6 $86.9
64
$67.3
60
$49.8
60
—
—
—
—
Purchase
or
lea
se of
qu
ota po
unds
—
—
—
—
—
—
—
—
—
—
$63.4
52 $61.8
64
Average total q
uota
and perm
it costs
$21.5
18 $30.0
24 $101.2
80
$65.3
80 $108.0
78
$70.4
78 $72.8
77
DATA SUMMARIES 113 CATCHER VESSEL REPORT
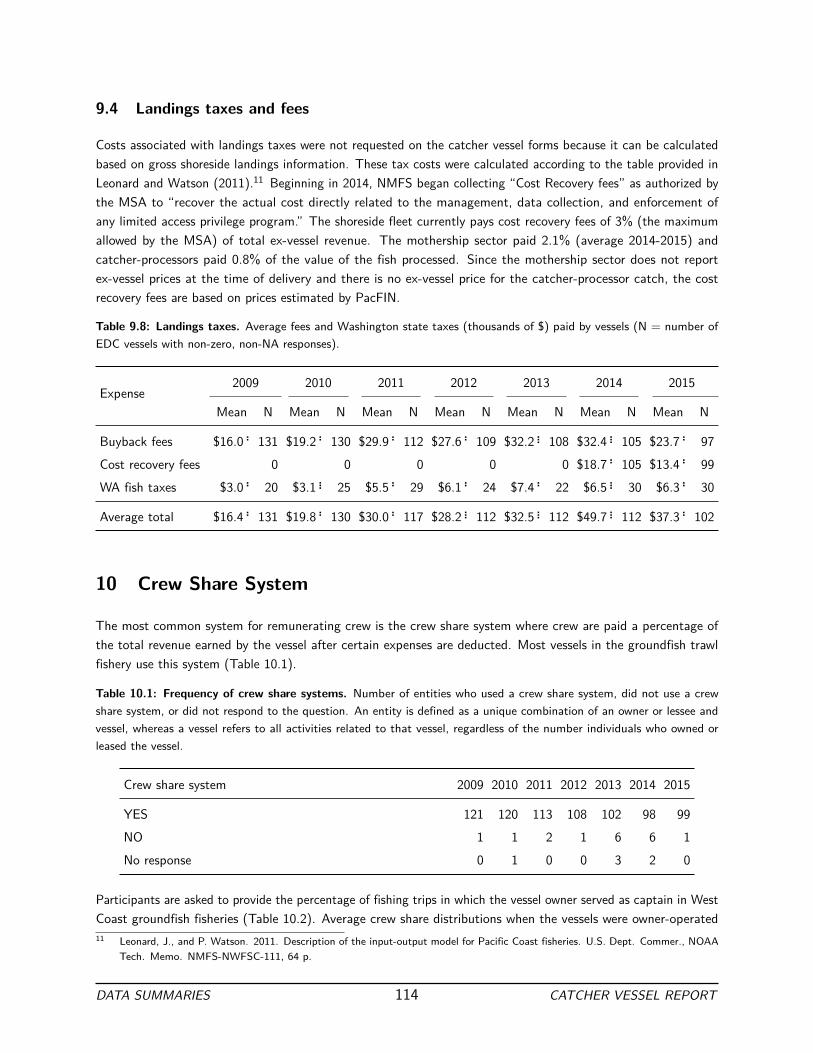
9.4 Landings taxes and fees
Costs associated with landings taxes were not requested on the catcher vessel forms because it can be calculated
based on gross shoreside landings information. These tax costs were calculated according to the table provided in
Leonard and Watson (2011).11 Beginning in 2014, NMFS began collecting “Cost Recovery fees” as authorized by
the MSA to “recover the actual cost directly related to the management, data collection, and enforcement of
any limited access privilege program.” The shoreside fleet currently pays cost recovery fees of 3% (the maximum
allowed by the MSA) of total ex-vessel revenue. The mothership sector paid 2.1% (average 2014-2015) and
catcher-processors paid 0.8% of the value of the fish processed. Since the mothership sector does not report
ex-vessel prices at the time of delivery and there is no ex-vessel price for the catcher-processor catch, the cost
recovery fees are based on prices estimated by PacFIN.
Table 9.8: Landings taxes. Average fees and Washington state taxes (thousands of $) paid by vessels (N = number of
EDC vessels with non-zero, non-NA responses).
Expense
2009 2010 2011 2012 2013 2014 2015
Mean N Mean N Mean N Mean N Mean N Mean N Mean N
Buyback fees $16.0.. 131 $19.2 .. 130 $29.9.. 112 $27.6 .. 109 $32.2... 108 $32.4... 105 $23.7.. 97
Cost recovery fees 0 0 0 0 0 $18.7.. 105 $13.4 .. 99
WA fish taxes $3.0.. 20 $3.1... 25 $5.5.. 29 $6.1.. 24 $7.4.. 22 $6.5... 30 $6.3.. 30
Average total $16.4.. 131 $19.8 .. 130 $30.0.. 117 $28.2 ... 112 $32.5... 112 $49.7... 112 $37.3.. 102
10 Crew Share System
The most common system for remunerating crew is the crew share system where crew are paid a percentage of
the total revenue earned by the vessel after certain expenses are deducted. Most vessels in the groundfish trawl
fishery use this system (Table 10.1).
Table 10.1: Frequency of crew share systems. Number of entities who used a crew share system, did not use a crew
share system, or did not respond to the question. An entity is defined as a unique combination of an owner or lessee and
vessel, whereas a vessel refers to all activities related to that vessel, regardless of the number individuals who owned or
leased the vessel.
Crew share system 2009 2010 2011 2012 2013 2014 2015
YES 121 120 113 108 102 98 99
NO 1 1 2 1 6 6 1
No response 0 1 0 0 3 2 0
Participants are asked to provide the percentage of fishing trips in which the vessel owner served as captain in West
Coast groundfish fisheries (Table 10.2). Average crew share distributions when the vessels were owner-operated
11 Leonard, J., and P. Watson. 2011. Description of the input-output model for Pacific Coast fisheries. U.S. Dept. Commer., NOAA
Tech. Memo. NMFS-NWFSC-111, 64 p.
DATA SUMMARIES 114 CATCHER VESSEL REPORT
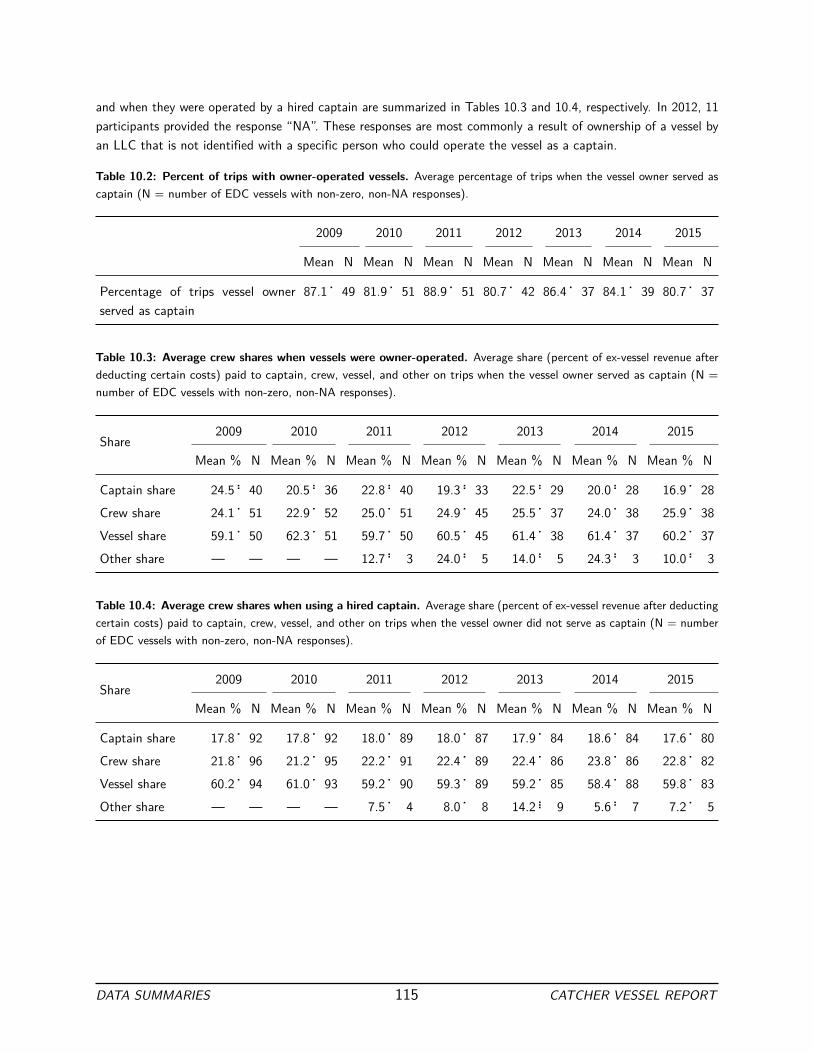
and when they were operated by a hired captain are summarized in Tables 10.3 and 10.4, respectively. In 2012, 11
participants provided the response “NA”. These responses are most commonly a result of ownership of a vessel by
an LLC that is not identified with a specific person who could operate the vessel as a captain.
Table 10.2: Percent of trips with owner-operated vessels. Average percentage of trips when the vessel owner served as
captain (N = number of EDC vessels with non-zero, non-NA responses).
2009 2010 2011 2012 2013 2014 2015
Mean N Mean N Mean N Mean N Mean N Mean N Mean N
Percentage of trips vessel owner
served as captain
87.1. 49 81.9. 51 88.9. 51 80.7. 42 86.4. 37 84.1. 39 80.7. 37
Table 10.3: Average crew shares when vessels were owner-operated. Average share (percent of ex-vessel revenue after
deducting certain costs) paid to captain, crew, vessel, and other on trips when the vessel owner served as captain (N =
number of EDC vessels with non-zero, non-NA responses).
Share
2009 2010 2011 2012 2013 2014 2015
Mean % N Mean % N Mean % N Mean % N Mean % N Mean % N Mean % N
Captain share 24.5.. 40 20.5.. 36 22.8.. 40 19.3.. 33 22.5.. 29 20.0.. 28 16.9. 28
Crew share 24.1. 51 22.9. 52 25.0. 51 24.9. 45 25.5. 37 24.0. 38 25.9. 38
Vessel share 59.1. 50 62.3. 51 59.7. 50 60.5. 45 61.4. 38 61.4. 37 60.2. 37
Other share — — — — 12.7.. 3 24.0.. 5 14.0.. 5 24.3.. 3 10.0.. 3
Table 10.4: Average crew shares when using a hired captain. Average share (percent of ex-vessel revenue after deducting
certain costs) paid to captain, crew, vessel, and other on trips when the vessel owner did not serve as captain (N = number
of EDC vessels with non-zero, non-NA responses).
Share
2009 2010 2011 2012 2013 2014 2015
Mean % N Mean % N Mean % N Mean % N Mean % N Mean % N Mean % N
Captain share 17.8. 92 17.8. 92 18.0. 89 18.0. 87 17.9. 84 18.6. 84 17.6. 80
Crew share 21.8. 96 21.2. 95 22.2. 91 22.4. 89 22.4. 86 23.8. 86 22.8. 82
Vessel share 60.2. 94 61.0. 93 59.2. 90 59.3. 89 59.2. 85 58.4. 88 59.8. 83
Other share — — — — 7.5 . 4 8.0 . 8 14.2... 9 5.6 .. 7 7.2 . 5
DATA SUMMARIES 115 CATCHER VESSEL REPORT

Catcher Vessel Data Analysis
The data summaries above provide important information about the vessels that participate in the catch share
program. To analyze the effect of the program on vessels, additional analysis is necessary. The following sections
combine the EDC data with additional data sources such as fish ticket data and observer data to calculate fishery
level costs and subsequently, net revenue. The final section presents these measures as rates in order to better
understand how changes observed are related to changes in TAC and fishing effort.
11 Days at Sea by Fishery
Although the data provided on the EDC forms provide most of the information necessary for examining fishery
participation, several of the days at sea need to be further split into subfisheries using information from state
fish tickets obtained from the PacFIN database, data collected by the At-Sea Hake Observer Program (A-SHOP)
obtained from the NORPAC database, and EDC data (ex-vessel revenue from at-sea deliveries).
The days at sea question remained constant from 2009-2013. For these years, the “West Coast whiting trawl gear
(not including other groundfish)” (whiting) days are split into At-sea Pacific whiting and Shoreside Pacific whiting
fisheries. The “West Coast groundfish trawl gear” days are split into Dover-thornyhead-sablefish (DTS) with trawl
gear and Non-whiting, non-DTS groundfish with trawl gear, and the “West Coast groundfish fixed gear” days are
split into Groundfish fixed gear with fixed gear endorsement and Groundfish fixed gear with trawl endorsement
fisheries.
Although the days at sea question was not changed until 2014, fishing behavior began changing in 2012. As
described in Section 3, the Non-whiting midwater trawl fishery resumed in 2012. Therefore, for three years
(2012-2014), the days were manually split using the whiting and groundfish trawl days reported on the forms.
Whether days at sea for the midwater trawl fishery were derived by subtracting from the reported days for whiting
or non-whiting groundfish was determined on a case by case basis because there were no specific instructions
about how to report this “new” fishery for participants. In 2015, the “West Coast midwater trawl gear” category
was added to the forms and can now be used as it is submitted.
The number of EDC participants fishing in “Other fisheries” (halibut, salmon, tuna, open access groundfish, fixed
gear groundfish without a limited entry permit) has decreased over time from a maximum of 27 in 2010 and 2012,
to 18 in 2014 and 2015. In terms of active catch share participants (or Limited Entry Trawl in 2009 and 2010), the
number dropped from 20 in 2009 and 2010 to 11 in 2015. Other fisheries with the highest total ex-vessel revenue
116
were tuna ($455,000 in 2015) and halibut ($337,000 in 2015). Tuna had the largest number of participating
vessels, ranging from 6 (2013) to 15 (2010).
Allocation of the reported days at sea into the subfisheries is a two-step process. First, ex-vessel revenue is used to
categorize each delivery into a subfishery (At-sea Pacific whiting, Shoreside Pacific whiting, Non-whiting midwater
trawl, DTS trawl with trawl endorsement, Non-whiting, non-DTS with trawl endorsement, Groundfish fixed gear
with trawl endorsement). Fish ticket data are used to designate each unique delivery to a fishery by compiling data
from the start date of the vessel’s fiscal year through one full year. A delivery is assigned to a particular fishery
based on the species or species group that resulted in the highest revenue for that delivery. For example, if a fish
ticket for a particular vessel on a specific day had a mix of rockfish and Pacific whiting, and the Pacific whiting
landings accounted for the majority of the revenue, then all landings associated with that trip are designated as
“Pacific whiting fishery”.
Once each landing/delivery is classified into a subfishery, the reported days at sea are distributed to the subfisheries
proportional to the ex-vessel revenue of landings/deliveries in each subfishery. The average and total fleet-wide
allocated days at sea in each of the subfisheries is summarized in Tables 11.1 and 11.2, respectively. Days at sea are
not available for all fisheries and all years due to changing conditions within the fishery and/or changes in survey
data collection. Vessels did not begin participating in the non-whiting midwater trawl fishery until 2012.
Landings weight was explored as an alternative to using revenue to classify deliveries by subfishery. We compared
the results of two approaches: using the highest revenue method versus the highest landings weight method for
designating the subfishery. The two methods resulted in identification of the same fishery for 95% of all cases.
Given that there were few differences in identification of the fisheries, revenue was selected over landings weight
because it is assumed to represent the target species more accurately.
DATA ANALYSIS 117 CATCHER VESSEL REPORT
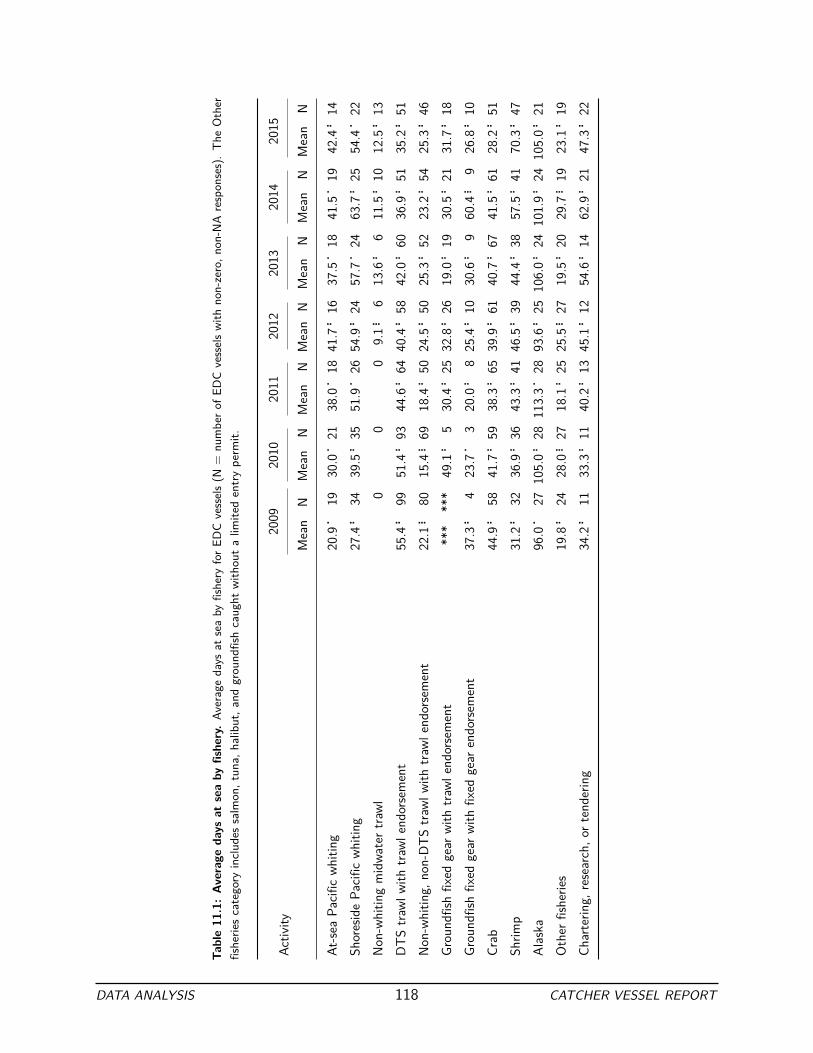
Table 11
.1: Average
days
at
sea by
fishery. Av
erage days
at
sea by
fishery
for E
DC vessels
(N
=
nu
mber o
f EDC vessels
with
no
n-zero, n
on-N
A respon
ses). Th
e Other
fisherie
s category
includ
es salm
on, tun
a, halibut, a
nd grou
ndfish caug
ht with
out a lim
ited entry perm
it.
Activ
ity
2009
2010
2011
2012
2013
2014
2015
Mean
N Mean
N Mean
N Mean
N Mean
N Mean
N Mean
N
At-se
a Pa
cific
whiting
20.9
. 19
30.0
. 21
38.0
. 18
41.7
.. 16
37.5
. 18
41.5
. 19
42.4
.. 14
Shoreside Pa
cific
whiting
27.4
.. 34
39.5
.. 35
51.9
. 26
54.9
.. 24
57.7
. 24
63.7
.. 25
54.4
. 22
Non-wh
iting
midwa
ter t
rawl
0
0 0
9.1...
6 13.6
.. 6
11.5
.. 10
12.5
.. 13
DTS tra
wl with
tra
wl endorse
ment
55.4
.. 99
51.4
.. 93
44.6
.. 64
40.4
.. 58
42.0
.. 60
36.9
.. 51
35.2
.. 51
Non-wh
iting
, non
-DTS
tra
wl with
tra
wl endorse
ment
22.1
... 80
15.4
... 69
18.4
.. 50
24.5
.. 50
25.3
.. 52
23.2
.. 54
25.3
.. 46
Grou
ndfish fix
ed gear
with
tra
wl endorse
ment
***
***
49.1
.. 5
30.4
.. 25
32.8
.. 26
19.0
.. 19
30.5
.. 21
31.7
.. 18
Grou
ndfish fix
ed gear
with
fix
ed gear
endorse
ment
37.3
.. 4
23.7
. 3
20.0
.. 8
25.4
.. 10
30.6
.. 9
60.4
... 9
26.8
.. 10
Crab
44.9
.. 58
41.7
.. 59
38.3
.. 65
39.9
.. 61
40.7
.. 67
41.5
.. 61
28.2
.. 51
Shrim
p 31.2
.. 32
36.9
.. 36
43.3
.. 41
46.5
.. 39
44.4
.. 38
57.5
.. 41
70.3
.. 47
Alaska
96.0
. 27
105.0..
28 113.3.
28 93.6
.. 25
106.0..
24 101.9..
24 105.0..
21
Other
fisherie
s 19.8
.. 24
28.0
... 27
18.1
.. 25
25.5
... 27
19.5
.. 20
29.7
... 19
23.1
.. 19
Charterin
g, research, o
r tenderin
g 34.2
.. 11
33.3
.. 11
40.2
.. 13
45.1
.. 12
54.6
.. 14
62.9
.. 21
47.3
.. 22
DATA ANALYSIS 118 CATCHER VESSEL REPORT
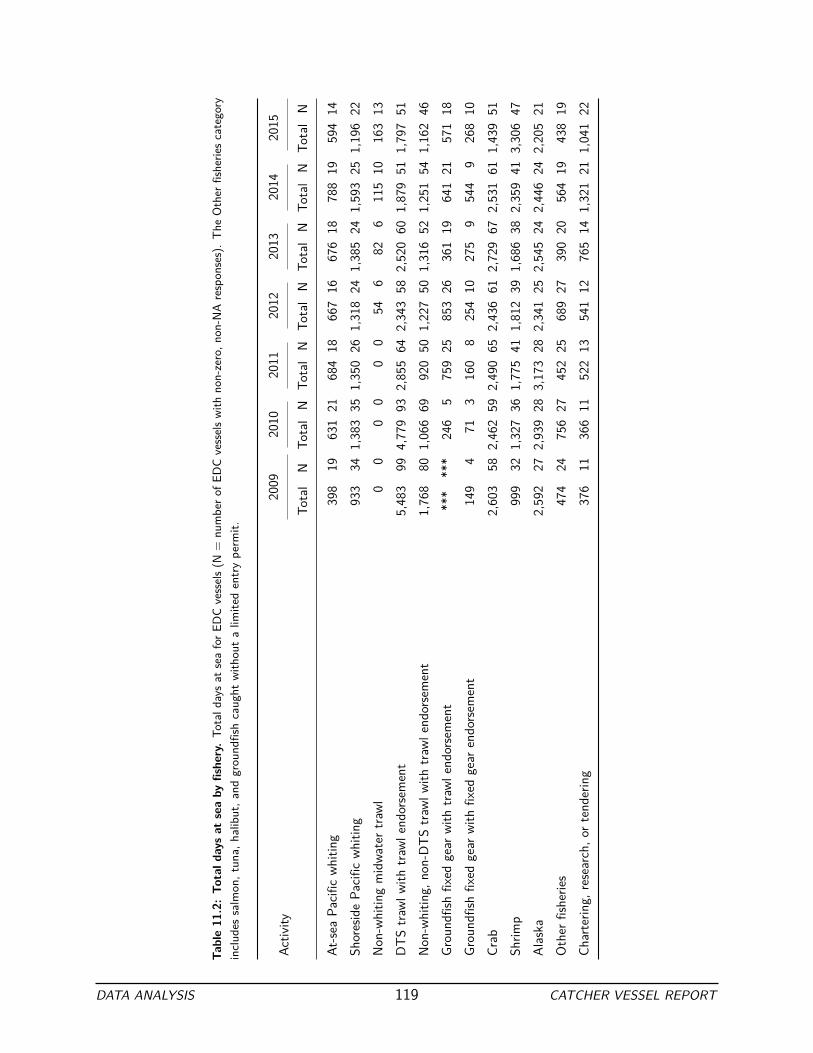
Table 11
.2: To
tal d
ays at
sea by
fishery. To
tal d
ays at
sea for E
DC vessels
(N
=
nu
mber o
f EDC vessels
with
no
n-zero, n
on-N
A respon
ses). Th
e Other
fisherie
s category
includ
es salm
on, tun
a, halibut, a
nd grou
ndfish caug
ht with
out a lim
ited entry perm
it.
Activ
ity
2009
2010
2011
2012
2013
2014
2015
Total
N To
tal
N To
tal
N To
tal
N To
tal
N To
tal
N To
tal
N
At-se
a Pa
cific
whiting
398
19
631
21
684
18
667
16
676
18
788
19
594
14
Shoreside Pa
cific
whiting
933
34 1,383
35 1,350
26 1,318
24 1,385
24 1,593
25 1,196
22
Non-wh
iting
midwa
ter t
rawl
0
0 0
0 0
0 54
6
82
6 115
10
163
13
DTS tra
wl with
tra
wl endorse
ment
5,483
99 4,779
93 2,855
64 2,343
58 2,520
60 1,879
51 1,797
51
Non-wh
iting
, non
-DTS
tra
wl with
tra
wl endorse
ment
1,768
80 1,066
69
920
50 1,227
50 1,316
52 1,251
54 1,162
46
Grou
ndfish fix
ed gear
with
tra
wl endorse
ment
***
***
246
5 759
25
853
26
361
19
641
21
571
18
Grou
ndfish fix
ed gear
with
fix
ed gear
endorse
ment
149
4 71
3
160
8 254
10
275
9 544
9 268
10
Crab
2,603
58 2,462
59 2,490
65 2,436
61 2,729
67 2,531
61 1,439
51
Shrim
p 999
32 1,327
36 1,775
41 1,812
39 1,686
38 2,359
41 3,306
47
Alaska
2,592
27 2,939
28 3,173
28 2,341
25 2,545
24 2,446
24 2,205
21
Other
fisherie
s 474
24
756
27
452
25
689
27
390
20
564
19
438
19
Charterin
g, research, o
r tenderin
g 376
11
366
11
522
13
541
12
765
14 1,321
21 1,041
22
DATA ANALYSIS 119 CATCHER VESSEL REPORT

11.1 Vessel participation in multiple fisheries
A key characteristic of vessels on the West Coast is participation in multiple fisheries. In 2015, only 11% of
all entities participated in just one fishery. There are several reason why a vessel would participate in several
fisheries. These reasons include maintaining employment throughout different seasonal fisheries and diversification
of participation to protect individuals or communities from variability in the abundance of target species. Table
11.3 and Figures 41 - 47 provide additional insight into the portfolio of fisheries in which vessels participate.
Table 11.3: Participation in multiple fisheries. Number of entities that participated in one or more fisheries by year (N
= number of entities, % = percent of total entities in survey year. An entity is defined as a unique combination of an
owner or lessee and vessel, whereas a vessel refers to all activities related to that vessel, regardless of the number individuals
who owned or leased the vessel).
Number of fisheries
2009 2010 2011 2012 2013 2014 2015
N % N % N % N % N % N % N %
1 9 7% 4 3% 8 6% 11 9% 6 5% 14 11% 13 11%
2 36 27% 43 33% 52 39% 44 34% 50 40% 52 39% 45 37%
3 53 40% 50 38% 44 33% 48 37% 41 33% 37 28% 36 29%
4 27 20% 25 19% 22 17% 19 15% 24 19% 21 16% 23 19%
4+ 8 6% 9 7% 6 5% 7 5% 5 4% 8 6% 6 5%
DATA ANALYSIS 120 CATCHER VESSEL REPORT

At−sea Pacific whiting
Shoreside Pacific whiting
Non−whiting midwater trawl
DTS trawl with trawl endorsement
Non−whiting, non−DTS trawl with trawl endorsement
Groundfish fixed gear with trawl endorsement
Groundfish fixed gear with fixed gear endorsement
Crab
Shrimp
Other fisheries
Alaska
Chartering or research
At−
sea
Pac
ific
whi
ting
Sho
resi
de P
acifi
c w
hitin
g
Non
−w
hitin
g m
idw
ater
traw
l
DT
S tr
awl w
ith tr
awl e
ndor
sem
ent
Non
−w
hitin
g, n
on−
DT
S tr
awl w
ith tr
awl e
ndor
sem
ent
Gro
undf
ish
fixed
gea
r w
ith tr
awl e
ndor
sem
ent
Gro
undf
ish
fixed
gea
r w
ith fi
xed
gear
end
orse
men
t
Cra
b
Shr
imp
Oth
er fi
sher
ies
Ala
ska
Cha
rter
ing
or r
esea
rch
Vessel activity
Ves
sel a
ctiv
ity
0
25
50
75
100
Number of vessels
Figure 41: Participation in multiple fisheries - 2009. Frequency of participation in multiple fisheries during 2009 fiscal
year.
DATA ANALYSIS 121 CATCHER VESSEL REPORT

At−sea Pacific whiting
Shoreside Pacific whiting
Non−whiting midwater trawl
DTS trawl with trawl endorsement
Non−whiting, non−DTS trawl with trawl endorsement
Groundfish fixed gear with trawl endorsement
Groundfish fixed gear with fixed gear endorsement
Crab
Shrimp
Other fisheries
Alaska
Chartering or research
At−
sea
Pac
ific
whi
ting
Sho
resi
de P
acifi
c w
hitin
g
Non
−w
hitin
g m
idw
ater
traw
l
DT
S tr
awl w
ith tr
awl e
ndor
sem
ent
Non
−w
hitin
g, n
on−
DT
S tr
awl w
ith tr
awl e
ndor
sem
ent
Gro
undf
ish
fixed
gea
r w
ith tr
awl e
ndor
sem
ent
Gro
undf
ish
fixed
gea
r w
ith fi
xed
gear
end
orse
men
t
Cra
b
Shr
imp
Oth
er fi
sher
ies
Ala
ska
Cha
rter
ing
or r
esea
rch
Vessel activity
Ves
sel a
ctiv
ity
0
25
50
75
100
Number of vessels
Figure 42: Participation in multiple fisheries - 2010. Frequency of participation in multiple fisheries during 2010 fiscal
year.
DATA ANALYSIS 122 CATCHER VESSEL REPORT
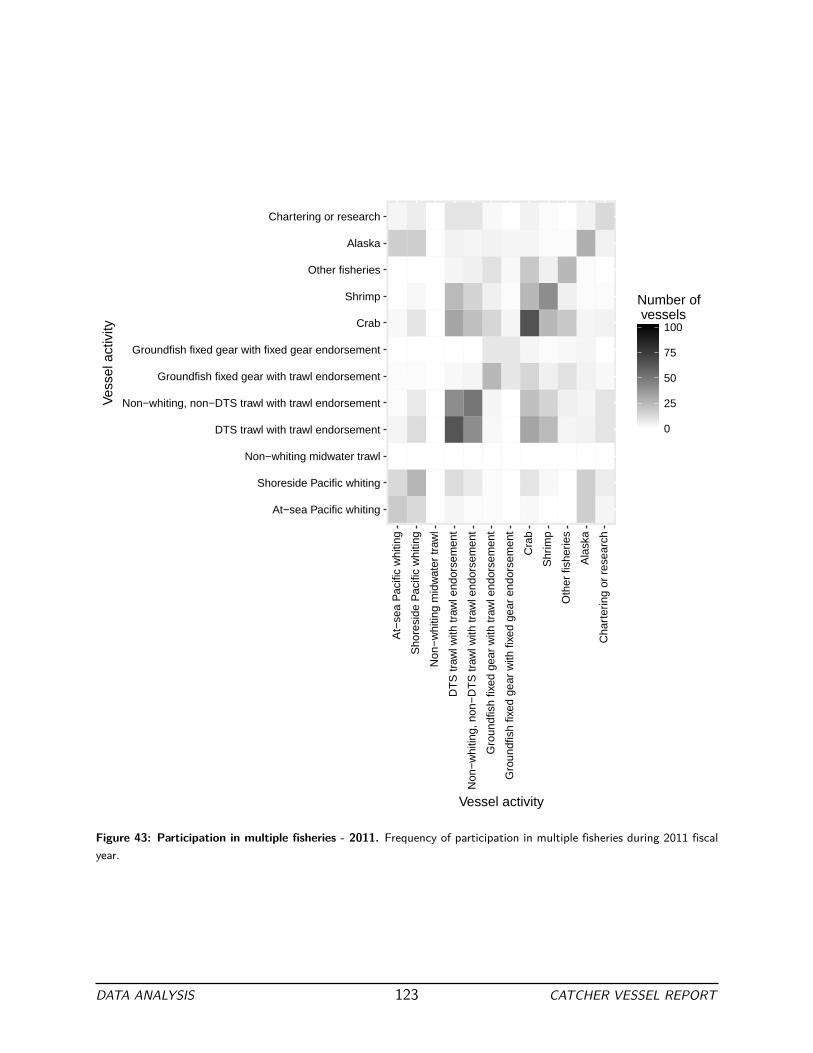
At−sea Pacific whiting
Shoreside Pacific whiting
Non−whiting midwater trawl
DTS trawl with trawl endorsement
Non−whiting, non−DTS trawl with trawl endorsement
Groundfish fixed gear with trawl endorsement
Groundfish fixed gear with fixed gear endorsement
Crab
Shrimp
Other fisheries
Alaska
Chartering or research
At−
sea
Pac
ific
whi
ting
Sho
resi
de P
acifi
c w
hitin
g
Non
−w
hitin
g m
idw
ater
traw
l
DT
S tr
awl w
ith tr
awl e
ndor
sem
ent
Non
−w
hitin
g, n
on−
DT
S tr
awl w
ith tr
awl e
ndor
sem
ent
Gro
undf
ish
fixed
gea
r w
ith tr
awl e
ndor
sem
ent
Gro
undf
ish
fixed
gea
r w
ith fi
xed
gear
end
orse
men
t
Cra
b
Shr
imp
Oth
er fi
sher
ies
Ala
ska
Cha
rter
ing
or r
esea
rch
Vessel activity
Ves
sel a
ctiv
ity
0
25
50
75
100
Number of vessels
Figure 43: Participation in multiple fisheries - 2011. Frequency of participation in multiple fisheries during 2011 fiscal
year.
DATA ANALYSIS 123 CATCHER VESSEL REPORT

At−sea Pacific whiting
Shoreside Pacific whiting
Non−whiting midwater trawl
DTS trawl with trawl endorsement
Non−whiting, non−DTS trawl with trawl endorsement
Groundfish fixed gear with trawl endorsement
Groundfish fixed gear with fixed gear endorsement
Crab
Shrimp
Other fisheries
Alaska
Chartering or research
At−
sea
Pac
ific
whi
ting
Sho
resi
de P
acifi
c w
hitin
g
Non
−w
hitin
g m
idw
ater
traw
l
DT
S tr
awl w
ith tr
awl e
ndor
sem
ent
Non
−w
hitin
g, n
on−
DT
S tr
awl w
ith tr
awl e
ndor
sem
ent
Gro
undf
ish
fixed
gea
r w
ith tr
awl e
ndor
sem
ent
Gro
undf
ish
fixed
gea
r w
ith fi
xed
gear
end
orse
men
t
Cra
b
Shr
imp
Oth
er fi
sher
ies
Ala
ska
Cha
rter
ing
or r
esea
rch
Vessel activity
Ves
sel a
ctiv
ity
0
25
50
75
100
Number of vessels
Figure 44: Participation in multiple fisheries - 2012. Frequency of participation in multiple fisheries during 2012 fiscal
year.
DATA ANALYSIS 124 CATCHER VESSEL REPORT

At−sea Pacific whiting
Shoreside Pacific whiting
Non−whiting midwater trawl
DTS trawl with trawl endorsement
Non−whiting, non−DTS trawl with trawl endorsement
Groundfish fixed gear with trawl endorsement
Groundfish fixed gear with fixed gear endorsement
Crab
Shrimp
Other fisheries
Alaska
Chartering or research
At−
sea
Pac
ific
whi
ting
Sho
resi
de P
acifi
c w
hitin
g
Non
−w
hitin
g m
idw
ater
traw
l
DT
S tr
awl w
ith tr
awl e
ndor
sem
ent
Non
−w
hitin
g, n
on−
DT
S tr
awl w
ith tr
awl e
ndor
sem
ent
Gro
undf
ish
fixed
gea
r w
ith tr
awl e
ndor
sem
ent
Gro
undf
ish
fixed
gea
r w
ith fi
xed
gear
end
orse
men
t
Cra
b
Shr
imp
Oth
er fi
sher
ies
Ala
ska
Cha
rter
ing
or r
esea
rch
Vessel activity
Ves
sel a
ctiv
ity
0
25
50
75
100
Number of vessels
Figure 45: Participation in multiple fisheries - 2013. Frequency of participation in multiple fisheries during 2013 fiscal
year.
DATA ANALYSIS 125 CATCHER VESSEL REPORT
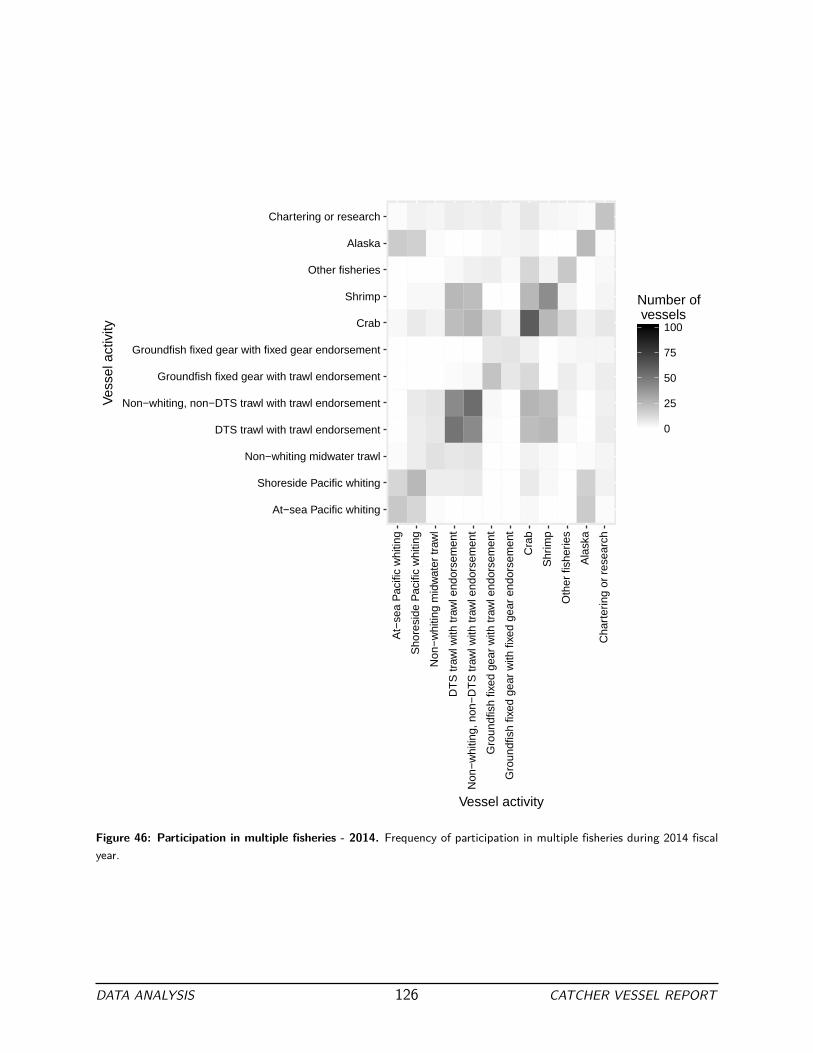
At−sea Pacific whiting
Shoreside Pacific whiting
Non−whiting midwater trawl
DTS trawl with trawl endorsement
Non−whiting, non−DTS trawl with trawl endorsement
Groundfish fixed gear with trawl endorsement
Groundfish fixed gear with fixed gear endorsement
Crab
Shrimp
Other fisheries
Alaska
Chartering or research
At−
sea
Pac
ific
whi
ting
Sho
resi
de P
acifi
c w
hitin
g
Non
−w
hitin
g m
idw
ater
traw
l
DT
S tr
awl w
ith tr
awl e
ndor
sem
ent
Non
−w
hitin
g, n
on−
DT
S tr
awl w
ith tr
awl e
ndor
sem
ent
Gro
undf
ish
fixed
gea
r w
ith tr
awl e
ndor
sem
ent
Gro
undf
ish
fixed
gea
r w
ith fi
xed
gear
end
orse
men
t
Cra
b
Shr
imp
Oth
er fi
sher
ies
Ala
ska
Cha
rter
ing
or r
esea
rch
Vessel activity
Ves
sel a
ctiv
ity
0
25
50
75
100
Number of vessels
Figure 46: Participation in multiple fisheries - 2014. Frequency of participation in multiple fisheries during 2014 fiscal
year.
DATA ANALYSIS 126 CATCHER VESSEL REPORT

At−sea Pacific whiting
Shoreside Pacific whiting
Non−whiting midwater trawl
DTS trawl with trawl endorsement
Non−whiting, non−DTS trawl with trawl endorsement
Groundfish fixed gear with trawl endorsement
Groundfish fixed gear with fixed gear endorsement
Crab
Shrimp
Other fisheries
Alaska
Chartering or research
At−
sea
Pac
ific
whi
ting
Sho
resi
de P
acifi
c w
hitin
g
Non
−w
hitin
g m
idw
ater
traw
l
DT
S tr
awl w
ith tr
awl e
ndor
sem
ent
Non
−w
hitin
g, n
on−
DT
S tr
awl w
ith tr
awl e
ndor
sem
ent
Gro
undf
ish
fixed
gea
r w
ith tr
awl e
ndor
sem
ent
Gro
undf
ish
fixed
gea
r w
ith fi
xed
gear
end
orse
men
t
Cra
b
Shr
imp
Oth
er fi
sher
ies
Ala
ska
Cha
rter
ing
or r
esea
rch
Vessel activity
Ves
sel a
ctiv
ity
0
25
50
75
100
Number of vessels
Figure 47: Participation in multiple fisheries - 2015. Frequency of participation in multiple fisheries during 2015 fiscal
year.
DATA ANALYSIS 127 CATCHER VESSEL REPORT
12 Cost Disaggregation
It is important to conduct economic analyses of specific fisheries. Many vessels and processors that participate in
the catch share program also participate in other fisheries, including fishing in Alaska. In order to perform analysis
at the West Coast, the catch share program, or fishery level, costs must be broken out by fishery. However, EDC
participants incur several types of costs that are aggregated across all fisheries. These are called “joint" costs in
the economics and accounting literature and include fixed costs ( e.g. , new vessel equipment), or variable costs
( e.g. , fuel). The former are joined by the nature of the costs themselves, while the latter are often joined due
to observational limitations. It is difficult to assign fixed costs to a particular fishery because the level of the
cost does not vary with business activity (at least over the short run). Many variable costs can theoretically be
tracked by fishery, but it would be difficult or costly to do so. For example, although an EDC participant could
theoretically set up a system to track expenditures on fuel by fishery, doing so would be costly.
Vessels report variable costs for West Coast activities only, but report fixed costs for all activities (including Alaska).
The following sections report the fixed costs that have been allocated using cost disaggregation to West Coast
activities (removing the portion of costs that have been allocated to Alaska activities).
DATA ANALYSIS 128 CATCHER VESSEL REPORT

12.1
West Coast
po
rtion of
fixed
costs
Table 12
.1: All West Coast
fixed
costs.
All fixed
costs (tho
usands
of
$)
on
the West Co
ast (N
=
nu
mber o
f EDC vessels with
no
n-zero, n
on-N
A respon
ses).
Expense
2009
2010
2011
2012
2013
2014
2015
Mean
N Mean
N Mean
N Mean
N Mean
N Mean
N Mean
N
Vessel
and on
-board
equipm
ent
$106.0
... 139
$94.3....
132
$145.6
... 128
$196.9
.... 127
$149.0
... 116
$167.5
.... 103
$146.7
.... 105
Fishing gear
$48.3...
141
$54.8...
132
$92.5...
136
$89.3...
128
$68.8...
91
$52.3...
75
$51.1...
78
Processin
g equipm
ent
$20.5...
15
$23.1...
10
$12.5...
9 $10.4...
4 $2.1
... 5
***
***
$0.7
... 3
Insurance
$23.1..
131
$24.5..
127
$26.5..
125
$28.6..
121
$30.6..
118
$32.5..
119
$33.9..
114
Lease of
vessel
$22.4..
12
$47.1...
10
$37.9..
10
$30.9..
7 $24.1..
8 $38.1..
8 $70.4...
8 Moorage
$3.7
.. 141
$4.0
.. 132
$4.4
.. 134
$5.0
... 127
$5.2
... 123
$5.6
.. 124
$5.8
.. 117
Average total
$174.6
... 147
$171.6
... 140
$250.8
... 142
$304.5
... 134
$218.7
... 128
$203.4
... 128
$202.5
.... 121
DATA ANALYSIS 129 CATCHER VESSEL REPORT

Table 12
.2: Su
mmary of
costs on
the West Coast. Av
erage capitalized
expend
itures and expenses
(tho
usands
of
$)
on
vessel
and on
-board
equipm
ent, fishing
gear,
and processin
g equipm
ent, other fixed
costs, and all v
ariable costs on
the West Co
ast (N
=
nu
mber o
f EDC vessels with
no
n-zero, n
on-N
A respon
ses).
Category
2009
2010
2011
2012
2013
2014
2015
Mean
N Mean
N Mean
N Mean
N Mean
N Mean
N Mean
N
Total c
osts
on
vessel
and on
-board
equipm
ent, fishing
gear, a
nd processin
g equipm
ent
$98.0...
144
$104.0
... 136
$163.4
... 134
$199.3
... 129
$145.1
... 119
$138.2
... 113
$138.9
.... 111
Total v
ariab
le costs
$219.4
.. 144
$251.2
.. 138
$362.1
.. 135
$380.5
.. 129
$434.4
.. 124
$451.5
.. 125
$386.4
.. 118
Total o
ther
fix
ed costs
$26.4..
144
$29.8..
138
$31.8..
135
$33.7..
128
$35.8..
124
$38.9..
125
$43.3..
118
Taxes a
nd fees
$15.9..
143
$18.7..
139
$29.8..
119
$28.2...
112
$32.5...
112
$49.7...
112
$38.7..
100
Average total c
osts
$359.6
.. 144
$396.6
.. 140
$578.1
.. 136
$637.7
.. 129
$638.8
.. 124
$659.8
.. 125
$593.2
.. 118
DATA ANALYSIS 130 CATCHER VESSEL REPORT

13 Net Economic Benefits
The level of net benefits generated by fishery participants indicates whether an operation is a viable ongoing
business, but there are numerous ways to calculate and assess net benefits depending on the data available,
including economic profit1 and net revenue . Economic profit is an indicator of the long-term viability of fishery
operations since it encapsulates all costs, including the opportunity cost of non-cash inputs, and can be used to
estimate whether there are incentives or disincentives to invest in capital or enter and leave the fishery. However,
calculations of economic profit are beyond the scope of these reports because the EDC Program does not collect
information on opportunity costs.
The EDC Program calculates a monetary, financial measure of a participant’s net cash flow by subtracting monetary
costs from gross revenue, which we call net revenue. The only costs that are included are those that are actually
paid or associated with a financial transaction. Net revenue therefore measures the annual financial well-being of a
participant’s operation and can be used to assess how changes in fishery management may affect monetary gains
or losses.
Figure 48: Composition and derivation of variable and total cost net
revenue used in the EDC Program analysis of revenue, costs, and economic
performance.
Net revenue is calculated two ways: using
only variable costs, and using variable
costs plus fixed costs (total costs).2 The
first calculation is called variable cost net
revenue, while the second is called total
cost net revenue (Figure 48). Variable
cost net revenue is useful for examining
changes in fishery operations that likely do
not affect fixed costs. For example, the
cost of processing an additional metric
ton of fish is most representative of the
true costs when only variable costs are
considered. Total cost net revenue is
generally a better measure of financial
gain or loss for an entire year, season, or
fishery.
There are two caveats associated with the
net revenue calculations in this report.
First, as noted in Section 4, there are
certain costs associated with operating a
vessel that are not requested on the EDC
form either because it is difficult to determine the share of the cost associated with the vessel, because costs pertain
to items used for activities other than catching or processing fish, or are too difficult to allocate to a particular
vessel in a multi-vessel company. These costs include office space, vehicles and transport trucks, storage of
equipment, professional fees, and income taxes. Therefore, the net revenue presented here is likely an overestimate
of true net revenue.
1 Whitmarsh D., James C., Pickering H., Neiland A. 2000. The profitability of marine commercial fisheries: a review of economic
information needs with particular reference to the UK. Marine Policy, Vol. 24(3), pp. 257-263.
2 See Section 9 for a more complete discussion of variable and fixed costs used in this report.
DATA ANALYSIS 131 CATCHER VESSEL REPORT

Second, the EDC forms do not collect information about financing costs of large purchases and investments.
Instead of using principal and interest payment information in calculations of net revenue, we therefore must
use the total costs associated with the purchases, repair, maintenance, or improvements. For example, if a new
engine is purchased, the total cost of the engine is used in the year that it was reported even though the actual
cash outlay, if it were financed, would only be the principal and interest payments. It is likely that many larger
capital costs, and perhaps some operating costs, are financed. This would mean that the actual cash outlays in a
particular year for those items would be less than what is used in the EDC net revenue calculation. This may
largely balance out over time because previously financed capital are also not included. Moreover, total cost net
revenue is expected to be representative of actual total cost net revenue only when averaged over many years and
across participants because relatively large capital costs only occur periodically.
DATA ANALYSIS 132 CATCHER VESSEL REPORT
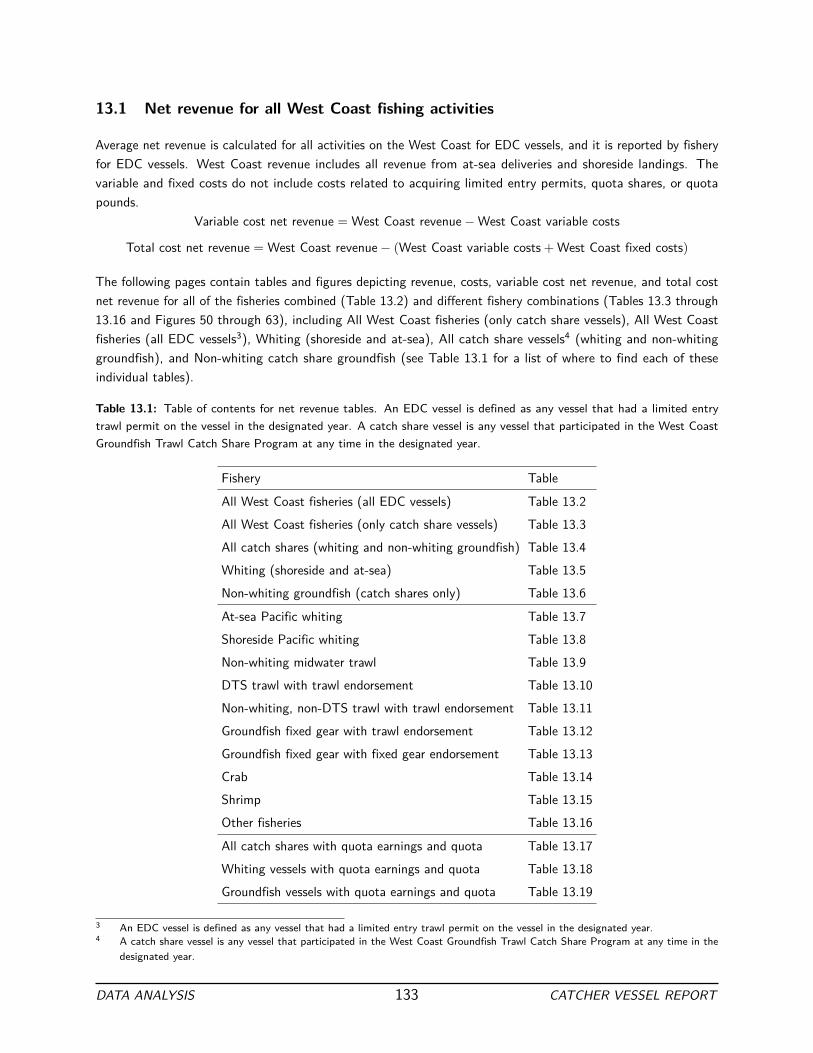
13.1 Net revenue for all West Coast fishing activities
Average net revenue is calculated for all activities on the West Coast for EDC vessels, and it is reported by fishery
for EDC vessels. West Coast revenue includes all revenue from at-sea deliveries and shoreside landings. The
variable and fixed costs do not include costs related to acquiring limited entry permits, quota shares, or quota
pounds.
Variable cost net revenue = West Coast revenue − West Coast variable costs
Total cost net revenue = West Coast revenue − ( West Coast variable costs + West Coast fixed costs )
The following pages contain tables and figures depicting revenue, costs, variable cost net revenue, and total cost
net revenue for all of the fisheries combined (Table 13.2) and different fishery combinations (Tables 13.3 through
13.16 and Figures 50 through 63), including All West Coast fisheries (only catch share vessels), All West Coast
fisheries (all EDC vessels3), Whiting (shoreside and at-sea), All catch share vessels4 (whiting and non-whiting
groundfish), and Non-whiting catch share groundfish (see Table 13.1 for a list of where to find each of these
individual tables).
Table 13.1: Table of contents for net revenue tables. An EDC vessel is defined as any vessel that had a limited entry
trawl permit on the vessel in the designated year. A catch share vessel is any vessel that participated in the West Coast
Groundfish Trawl Catch Share Program at any time in the designated year.
Fishery Table
All West Coast fisheries (all EDC vessels) Table 13.2
All West Coast fisheries (only catch share vessels) Table 13.3
All catch shares (whiting and non-whiting groundfish) Table 13.4
Whiting (shoreside and at-sea) Table 13.5
Non-whiting groundfish (catch shares only) Table 13.6
At-sea Pacific whiting Table 13.7
Shoreside Pacific whiting Table 13.8
Non-whiting midwater trawl Table 13.9
DTS trawl with trawl endorsement Table 13.10
Non-whiting, non-DTS trawl with trawl endorsement Table 13.11
Groundfish fixed gear with trawl endorsement Table 13.12
Groundfish fixed gear with fixed gear endorsement Table 13.13
Crab Table 13.14
Shrimp Table 13.15
Other fisheries Table 13.16
All catch shares with quota earnings and quota Table 13.17
Whiting vessels with quota earnings and quota Table 13.18
Groundfish vessels with quota earnings and quota Table 13.19
3 An EDC vessel is defined as any vessel that had a limited entry trawl permit on the vessel in the designated year.
4 A catch share vessel is any vessel that participated in the West Coast Groundfish Trawl Catch Share Program at any time in the
designated year.
DATA ANALYSIS 133 CATCHER VESSEL REPORT

Table 13.2: West Coast average variable cost and total cost net revenue for EDC vessels. Average total revenue,
variable costs, variable cost net revenue, fixed costs, and total cost net revenue (thousands of $) on the West Coast, for all
vessels that were required to submit an EDC form (N = number of EDC vessels with non-zero, non-NA responses).
2009 2010 2011 2012 2013 2014 2015
Mean N Mean N Mean N Mean N Mean N Mean N Mean N
Revenue $390 144 $447 138 $725 136 $683 129 $859 124 $832 125 $712 118
(Variable costs) ($235) 144 ($270) 138 ($385) 136 ($405) 129 ($464) 124 ($496) 125 ($419) 118
Variable cost
net revenue
$154 144 $177 138 $340 136 $278 129 $395 124 $336 125 $294 118
(Fixed costs) ($124) 144 ($132) 138 ($193) 136 ($233) 129 ($175) 124 ($164) 125 ($174) 118
Total cost net
revenue
$30 144 $44 138 $147 136 $46 129 $220 124 $173 125 $120 118
Revenue Variable cost net revenue Total cost net revenue
2009
2010
2011
2012
2013
2014
2015
2009
2010
2011
2012
2013
2014
2015
2009
2010
2011
2012
2013
2014
2015
0
250
500
750
Ave
rage
ves
sel
(tho
usan
ds o
f $)
RevenueVariable costsVariable cost net revenue
Fixed costsTotal cost net revenue
Figure 49: West Coast average variable cost and total cost net revenue for EDC vessels. Average total revenue,
variable costs, variable cost net revenue, fixed costs, and total cost net revenue on the West Coast, for EDC vessels. Dashed
line represents the beginning of the catch share program.
DATA ANALYSIS 134 CATCHER VESSEL REPORT
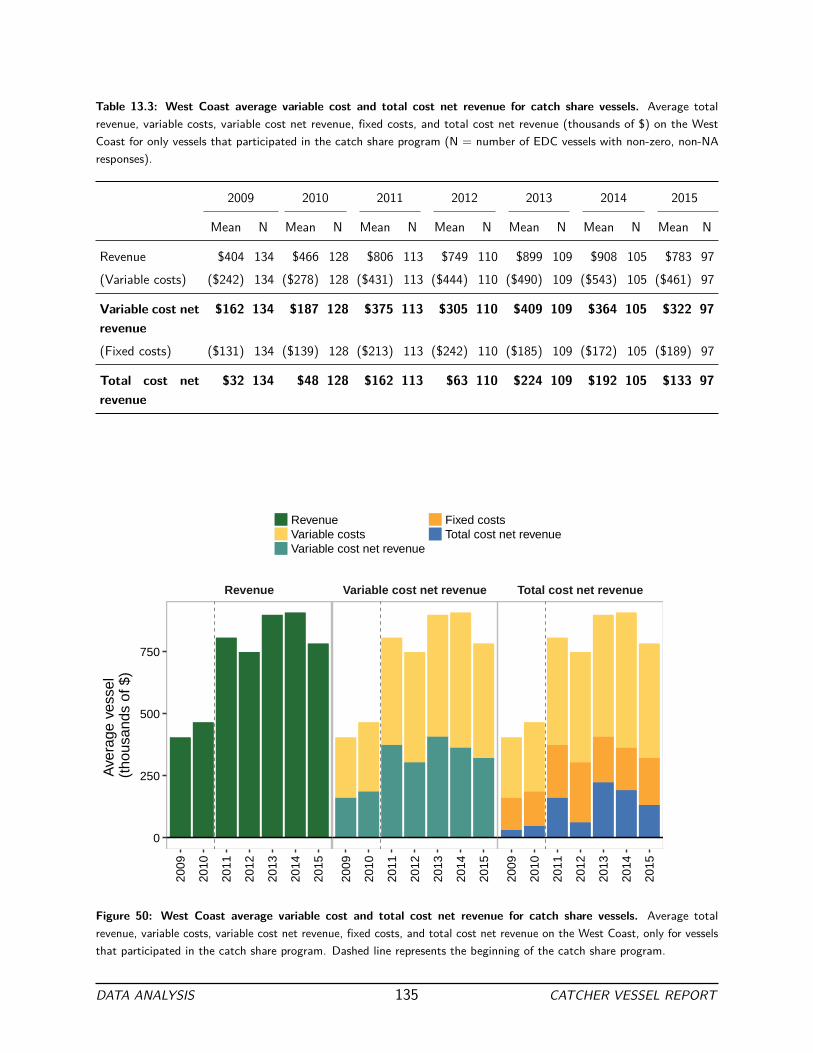
Table 13.3: West Coast average variable cost and total cost net revenue for catch share vessels. Average total
revenue, variable costs, variable cost net revenue, fixed costs, and total cost net revenue (thousands of $) on the West
Coast for only vessels that participated in the catch share program (N = number of EDC vessels with non-zero, non-NA
responses).
2009 2010 2011 2012 2013 2014 2015
Mean N Mean N Mean N Mean N Mean N Mean N Mean N
Revenue $404 134 $466 128 $806 113 $749 110 $899 109 $908 105 $783 97
(Variable costs) ($242) 134 ($278) 128 ($431) 113 ($444) 110 ($490) 109 ($543) 105 ($461) 97
Variable cost net
revenue
$162 134 $187 128 $375 113 $305 110 $409 109 $364 105 $322 97
(Fixed costs) ($131) 134 ($139) 128 ($213) 113 ($242) 110 ($185) 109 ($172) 105 ($189) 97
Total cost net
revenue
$32 134 $48 128 $162 113 $63 110 $224 109 $192 105 $133 97
Revenue Variable cost net revenue Total cost net revenue
2009
2010
2011
2012
2013
2014
2015
2009
2010
2011
2012
2013
2014
2015
2009
2010
2011
2012
2013
2014
2015
0
250
500
750
Ave
rage
ves
sel
(tho
usan
ds o
f $)
RevenueVariable costsVariable cost net revenue
Fixed costsTotal cost net revenue
Figure 50: West Coast average variable cost and total cost net revenue for catch share vessels. Average total
revenue, variable costs, variable cost net revenue, fixed costs, and total cost net revenue on the West Coast, only for vessels
that participated in the catch share program. Dashed line represents the beginning of the catch share program.
DATA ANALYSIS 135 CATCHER VESSEL REPORT

Table 13.4: All catch shares (whiting and non-whiting groundfish) average variable cost and total cost net revenue
for catch share vessels. Average total revenue, variable costs, variable cost net revenue, fixed costs, and total cost net
revenue (thousands of $) for all participation in the catch share (whiting and non-whiting groundfish) fisheries (N = number
of EDC vessels with non-zero, non-NA responses).
2009 2010 2011 2012 2013 2014 2015
Mean N Mean N Mean N Mean N Mean N Mean N Mean N
Revenue $300 134 $347 128 $587 113 $530 110 $605 109 $629 105 $486 97
(Variable costs) ($184) 134 ($211) 128 ($317) 113 ($322) 110 ($346) 109 ($395) 105 ($305) 97
Variable cost net
revenue
$116 134 $135 128 $270 113 $208 110 $259 109 $233 105 $181 97
(Fixed costs) ($104) 134 ($111) 128 ($161) 113 ($179) 110 ($126) 109 ($130) 105 ($132) 97
Total cost net
revenue
$12 134 $25 128 $109 113 $28 110 $133 109 $103 105 $49 97
Revenue Variable cost net revenue Total cost net revenue
2009
2010
2011
2012
2013
2014
2015
2009
2010
2011
2012
2013
2014
2015
2009
2010
2011
2012
2013
2014
2015
0
200
400
600
Ave
rage
ves
sel
(tho
usan
ds o
f $)
RevenueVariable costsVariable cost net revenue
Fixed costsTotal cost net revenue
Figure 51: All catch shares (whiting and non-whiting groundfish) average variable cost and total cost net revenue
for catch share vessels. Average total revenue, variable costs, variable cost net revenue, fixed costs, and total cost net
revenue for all participation in the catch share (whiting and non-whiting groundfish) fisheries. Dashed line represents the
beginning of the catch share program.
DATA ANALYSIS 136 CATCHER VESSEL REPORT

Table 13.5: Whiting (shoreside and at-sea) average variable cost and total cost net revenue for catch share vessels.
Average total revenue, variable costs, variable cost net revenue, fixed costs, and total cost net revenue (thousands of $) for
the whiting fisheries (shoreside and at-sea) (N = number of EDC vessels with non-zero, non-NA responses).
2009 2010 2011 2012 2013 2014 2015
Mean N Mean N Mean N Mean N Mean N Mean N Mean N
Revenue $234 41 $450 41 $1,095 31 $1,069 28 $1,286 29 $1,224 30 $590 26
(Variable costs) ($135) 41 ($254) 41 ($543) 31 ($642) 28 ($693) 29 ($763) 30 ($387) 26
Variable cost net
revenue
$99 41 $196 41 $552 31 $427 28 $593 29 $461 30 $203 26
(Fixed costs) ($121) 41 ($176) 41 ($342) 31 ($410) 28 ($305) 29 ($296) 30 ($304) 26
Total cost net revenue -$22 41 $20 41 $210 31 $17 28 $289 29 $165 30 -$101 26
Revenue Variable cost net revenue Total cost net revenue
2009
2010
2011
2012
2013
2014
2015
2009
2010
2011
2012
2013
2014
2015
2009
2010
2011
2012
2013
2014
2015
0
500
1000
Ave
rage
ves
sel
(tho
usan
ds o
f $)
RevenueVariable costsVariable cost net revenue
Fixed costsTotal cost net revenue
Figure 52: Whiting (shoreside and at-sea) average variable cost and total cost net revenue for catch share vessels.
Average total revenue, variable costs, variable cost net revenue, fixed costs, and total cost net revenue in whiting fisheries
(at-sea and shoreside). Dashed line represents the beginning of the catch share program.
DATA ANALYSIS 137 CATCHER VESSEL REPORT

Table 13.6: Groundfish (non-whiting) average variable cost and total cost net revenue for catch share vessels.
Average total revenue, variable costs, variable cost net revenue, fixed costs, and total cost net revenue (thousands of $) in
catch share groundfish fisheries (non-whiting) (N = number of EDC vessels with non-zero, non-NA responses).
2009 2010 2011 2012 2013 2014 2015
Mean N Mean N Mean N Mean N Mean N Mean N Mean N
Revenue $253 121 $233 111 $341 95 $319 89 $326 88 $353 83 $402 79
(Variable costs) ($158) 121 ($150) 111 ($200) 95 ($196) 89 ($200) 88 ($224) 83 ($247) 79
Variable cost net
revenue
$94 121 $83 111 $141 95 $123 89 $125 88 $128 83 $155 79
(Fixed costs) ($74) 121 ($63) 111 ($80) 95 ($93) 89 ($56) 88 ($57) 83 ($62) 79
Total cost net
revenue
$21 121 $21 111 $61 95 $30 89 $70 88 $71 83 $93 79
Revenue Variable cost net revenue Total cost net revenue
2009
2010
2011
2012
2013
2014
2015
2009
2010
2011
2012
2013
2014
2015
2009
2010
2011
2012
2013
2014
2015
0
100
200
300
400
Ave
rage
ves
sel
(tho
usan
ds o
f $)
RevenueVariable costsVariable cost net revenue
Fixed costsTotal cost net revenue
Figure 53: Groundfish (non-whiting) average variable cost and total cost net revenue for catch share vessels. Average
total revenue, variable costs, variable cost net revenue, fixed costs, and total cost net revenue in catch share groundfish
fisheries (non-whiting). Dashed line represents the beginning of the catch share program.
DATA ANALYSIS 138 CATCHER VESSEL REPORT

13.2 Net revenue for West Coast catch share fisheries, crab, shrimp, and other
fisheries
DATA ANALYSIS 139 CATCHER VESSEL REPORT

Table 13.7: At-sea Pacific whiting fishery average variable cost and total cost net revenue. Average total revenue,
variable costs, variable cost net revenue, fixed costs, and total cost net revenue (thousands of $) in the At-sea Pacific
whiting fishery (N = number of EDC vessels with non-zero, non-NA responses).
2009 2010 2011 2012 2013 2014 2015
Mean N Mean N Mean N Mean N Mean N Mean N Mean N
Revenue $220 19 $402 21 $619 18 $560 16 $581 18 $653 19 $383 14
(Variable costs) ($115) 19 ($200) 21 ($306) 18 ($372) 16 ($342) 18 ($417) 19 ($236) 14
Variable cost net
revenue
$105 19 $201 21 $313 18 $188 16 $239 18 $236 19 $147 14
(Fixed costs) ($92) 19 ($88) 21 ($190) 18 ($206) 16 ($117) 18 ($153) 19 ($146) 14
Total cost net revenue $12 19 $113 21 $123 18 -$18 16 $122 18 $83 19 $1 14
Revenue Variable cost net revenue Total cost net revenue
2009
2010
2011
2012
2013
2014
2015
2009
2010
2011
2012
2013
2014
2015
2009
2010
2011
2012
2013
2014
2015
0
200
400
600
Ave
rage
ves
sel
(tho
usan
ds o
f $)
RevenueVariable costsVariable cost net revenue
Fixed costsTotal cost net revenue
Figure 54: At-sea Pacific whiting fishery variable cost net revenue and total cost net revenue. Average total revenue,
variable costs, variable cost net revenue, fixed costs, and total cost net revenue in the at-sea Pacific whiting fishery. Dashed
line represents the beginning of the catch share program.
DATA ANALYSIS 140 CATCHER VESSEL REPORT

Table 13.8: Shoreside Pacific whiting fishery average variable cost and total cost net revenue. Average total revenue,
variable costs, variable cost net revenue, fixed costs, and total cost net revenue (thousands of $) in the Shoreside Pacific
whiting fishery (N = number of EDC vessels with non-zero, non-NA responses).
2009 2010 2011 2012 2013 2014 2015
Mean N Mean N Mean N Mean N Mean N Mean N Mean N
Revenue $160 34 $286 35 $877 26 $874 24 $1,118 24 $973 25 $454 22
(Variable costs) ($98) 34 ($177) 35 ($436) 26 ($501) 24 ($581) 24 ($599) 25 ($307) 22
Variable cost net revenue $61 34 $109 35 $442 26 $372 24 $538 24 $374 25 $146 22
(Fixed costs) ($95) 34 ($154) 35 ($276) 26 ($341) 24 ($280) 24 ($239) 25 ($267) 22
Total cost net revenue -$33 34 -$44 35 $166 26 $32 24 $257 24 $135 25 -$120 22
Revenue Variable cost net revenue Total cost net revenue
2009
2010
2011
2012
2013
2014
2015
2009
2010
2011
2012
2013
2014
2015
2009
2010
2011
2012
2013
2014
2015
0
250
500
750
1000
Ave
rage
ves
sel
(tho
usan
ds o
f $)
RevenueVariable costsVariable cost net revenue
Fixed costsTotal cost net revenue
Figure 55: Shoreside Pacific whiting fishery variable cost net revenue and total cost net revenue. Average total
revenue, variable costs, variable cost net revenue, fixed costs, and total cost net revenue in the shoreside Pacific whiting
fishery. Dashed line represents the beginning of the catch share program.
DATA ANALYSIS 141 CATCHER VESSEL REPORT

Table 13.9: Non-whiting midwater trawl fishery average variable cost and total cost net revenue. Average total
revenue, variable costs, variable cost net revenue, fixed costs, and total cost net revenue (thousands of $) in the Non-whiting
midwater trawl fishery (N = number of EDC vessels with non-zero, non-NA responses).
2009 2010 2011 2012 2013 2014 2015
Mean N Mean N Mean N Mean N Mean N Mean N Mean N
Revenue — — — — — — $50 6 $112 6 $92 10 $135 13
(Variable costs) — — — — — — ($32) 6 ($65) 6 ($60) 10 ($77) 13
Variable cost net revenue — — — — — — $18 6 $47 6 $32 10 $58 13
(Fixed costs) — — — — — — ($8) 6 ($15) 6 ($41) 10 ($21) 13
Total cost net revenue — — — — — — $9 6 $31 6 -$9 10 $38 13
Revenue Variable cost net revenue Total cost net revenue
2012
2013
2014
2015
2012
2013
2014
2015
2012
2013
2014
2015
0
50
100
Ave
rage
ves
sel
(tho
usan
ds o
f $)
RevenueVariable costsVariable cost net revenue
Fixed costsTotal cost net revenue
Figure 56: Non-whiting midwater trawl fishery variable cost net revenue and total cost net revenue. Average total
revenue, variable costs, variable cost net revenue, fixed costs, and total cost net revenue in the Non-whiting midwater trawl.
Vessels did not begin targeting non-whiting groundfish with midwater trawl gear until 2012. Dashed line represents the
beginning of the catch share program.
DATA ANALYSIS 142 CATCHER VESSEL REPORT
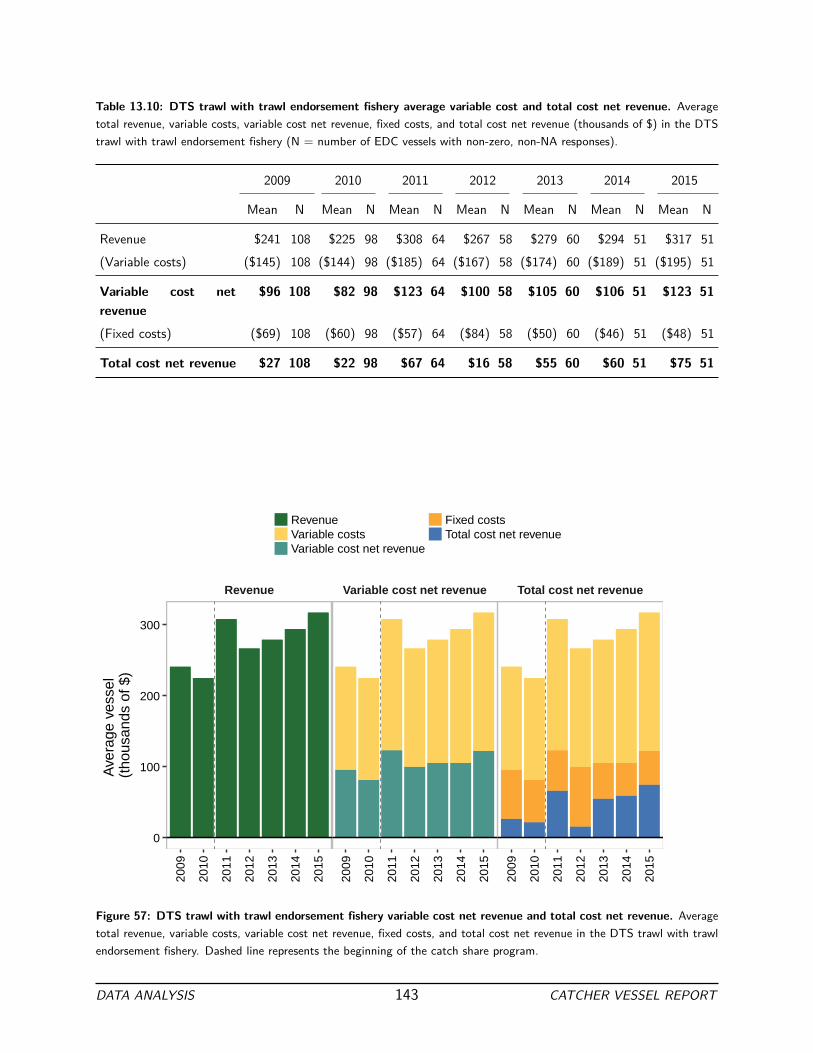
Table 13.10: DTS trawl with trawl endorsement fishery average variable cost and total cost net revenue. Average
total revenue, variable costs, variable cost net revenue, fixed costs, and total cost net revenue (thousands of $) in the DTS
trawl with trawl endorsement fishery (N = number of EDC vessels with non-zero, non-NA responses).
2009 2010 2011 2012 2013 2014 2015
Mean N Mean N Mean N Mean N Mean N Mean N Mean N
Revenue $241 108 $225 98 $308 64 $267 58 $279 60 $294 51 $317 51
(Variable costs) ($145) 108 ($144) 98 ($185) 64 ($167) 58 ($174) 60 ($189) 51 ($195) 51
Variable cost net
revenue
$96 108 $82 98 $123 64 $100 58 $105 60 $106 51 $123 51
(Fixed costs) ($69) 108 ($60) 98 ($57) 64 ($84) 58 ($50) 60 ($46) 51 ($48) 51
Total cost net revenue $27 108 $22 98 $67 64 $16 58 $55 60 $60 51 $75 51
Revenue Variable cost net revenue Total cost net revenue
2009
2010
2011
2012
2013
2014
2015
2009
2010
2011
2012
2013
2014
2015
2009
2010
2011
2012
2013
2014
2015
0
100
200
300
Ave
rage
ves
sel
(tho
usan
ds o
f $)
RevenueVariable costsVariable cost net revenue
Fixed costsTotal cost net revenue
Figure 57: DTS trawl with trawl endorsement fishery variable cost net revenue and total cost net revenue. Average
total revenue, variable costs, variable cost net revenue, fixed costs, and total cost net revenue in the DTS trawl with trawl
endorsement fishery. Dashed line represents the beginning of the catch share program.
DATA ANALYSIS 143 CATCHER VESSEL REPORT
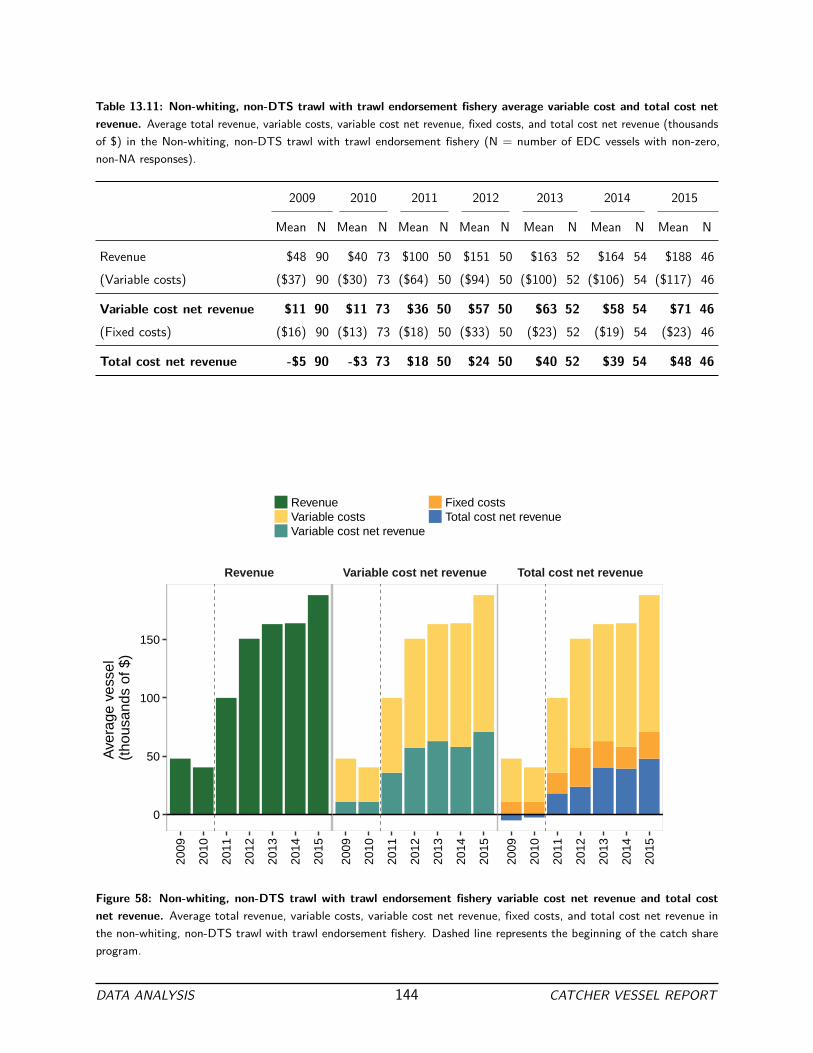
Table 13.11: Non-whiting, non-DTS trawl with trawl endorsement fishery average variable cost and total cost net
revenue. Average total revenue, variable costs, variable cost net revenue, fixed costs, and total cost net revenue (thousands
of $) in the Non-whiting, non-DTS trawl with trawl endorsement fishery (N = number of EDC vessels with non-zero,
non-NA responses).
2009 2010 2011 2012 2013 2014 2015
Mean N Mean N Mean N Mean N Mean N Mean N Mean N
Revenue $48 90 $40 73 $100 50 $151 50 $163 52 $164 54 $188 46
(Variable costs) ($37) 90 ($30) 73 ($64) 50 ($94) 50 ($100) 52 ($106) 54 ($117) 46
Variable cost net revenue $11 90 $11 73 $36 50 $57 50 $63 52 $58 54 $71 46
(Fixed costs) ($16) 90 ($13) 73 ($18) 50 ($33) 50 ($23) 52 ($19) 54 ($23) 46
Total cost net revenue -$5 90 -$3 73 $18 50 $24 50 $40 52 $39 54 $48 46
Revenue Variable cost net revenue Total cost net revenue
2009
2010
2011
2012
2013
2014
2015
2009
2010
2011
2012
2013
2014
2015
2009
2010
2011
2012
2013
2014
2015
0
50
100
150
Ave
rage
ves
sel
(tho
usan
ds o
f $)
RevenueVariable costsVariable cost net revenue
Fixed costsTotal cost net revenue
Figure 58: Non-whiting, non-DTS trawl with trawl endorsement fishery variable cost net revenue and total cost
net revenue. Average total revenue, variable costs, variable cost net revenue, fixed costs, and total cost net revenue in
the non-whiting, non-DTS trawl with trawl endorsement fishery. Dashed line represents the beginning of the catch share
program.
DATA ANALYSIS 144 CATCHER VESSEL REPORT

Table 13.12: Groundfish fixed gear with trawl endorsement fishery average variable cost and total cost net revenue.
Average total revenue, variable costs, variable cost net revenue, fixed costs, and total cost net revenue (thousands of $) in
the Groundfish fixed gear with trawl endorsement fishery (N = number of EDC vessels with non-zero, non-NA responses).
2009 2010 2011 2012 2013 2014 2015
Mean N Mean N Mean N Mean N Mean N Mean N Mean N
Revenue $67 3 $149 6 $294 26 $195 26 $145 19 $214 21 $289 18
(Variable costs) ($33) 3 ($70) 6 ($151) 26 ($112) 26 ($84) 19 ($128) 21 ($177) 18
Variable cost net revenue $34 3 $79 6 $143 26 $82 26 $61 19 $86 21 $112 18
(Fixed costs) ($23) 3 ($21) 6 ($118) 26 ($64) 26 ($32) 19 ($46) 21 ($64) 18
Total cost net revenue $11 3 $58 6 $25 26 $18 26 $29 19 $39 21 $48 18
Revenue Variable cost net revenue Total cost net revenue
2009
2010
2011
2012
2013
2014
2015
2009
2010
2011
2012
2013
2014
2015
2009
2010
2011
2012
2013
2014
2015
0
100
200
300
Ave
rage
ves
sel
(tho
usan
ds o
f $)
RevenueVariable costsVariable cost net revenue
Fixed costsTotal cost net revenue
Figure 59: Groundfish fixed gear with trawl endorsement fishery variable cost net revenue and total cost net revenue.
Average total revenue, variable costs, variable cost net revenue, fixed costs, and total cost net revenue in the groundfish
fixed gear with trawl endorsement fishery.
DATA ANALYSIS 145 CATCHER VESSEL REPORT

Table 13.13: Groundfish fixed gear with fixed gear endorsement fishery average variable cost and total cost net
revenue. Average total revenue, variable costs, variable cost net revenue, fixed costs, and total cost net revenue (thousands
of $) in the Groundfish fixed gear with fixed gear endorsement fishery (N = number of EDC vessels with non-zero, non-NA
responses).
2009 2010 2011 2012 2013 2014 2015
Mean N Mean N Mean N Mean N Mean N Mean N Mean N
Revenue $214 4 $254 3 $221 9 $162 10 $162 9 $201 9 $242 10
(Variable costs) ($141) 4 ($190) 3 ($93) 9 ($93) 10 ($99) 9 ($111) 9 ($142) 10
Variable cost net revenue $74 4 $64 3 $128 9 $69 10 $63 9 $90 9 $100 10
(Fixed costs) ($34) 4 ($36) 3 ($38) 9 ($46) 10 ($36) 9 ($36) 9 ($47) 10
Total cost net revenue $40 4 $29 3 $90 9 $23 10 $26 9 $54 9 $53 10
Revenue Variable cost net revenue Total cost net revenue
2009
2010
2011
2012
2013
2014
2015
2009
2010
2011
2012
2013
2014
2015
2009
2010
2011
2012
2013
2014
2015
0
100
200
Ave
rage
ves
sel
(tho
usan
ds o
f $)
RevenueVariable costsVariable cost net revenue
Fixed costsTotal cost net revenue
Figure 60: Groundfish fixed gear with trawl endorsement fishery variable cost net revenue and total cost net revenue.
Average total revenue, variable costs, variable cost net revenue, fixed costs, and total cost net revenue in the groundfish
fixed gear with fixed gear endorsement fishery. Dashed line represents the beginning of the catch share program.
DATA ANALYSIS 146 CATCHER VESSEL REPORT
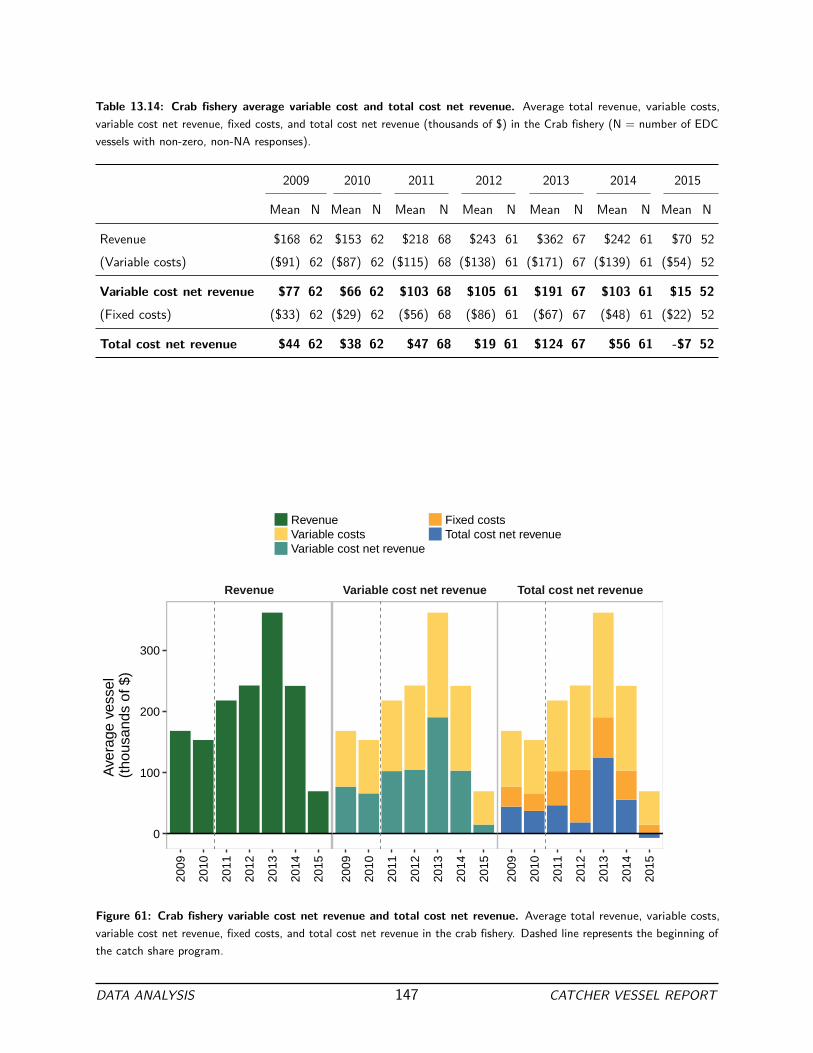
Table 13.14: Crab fishery average variable cost and total cost net revenue. Average total revenue, variable costs,
variable cost net revenue, fixed costs, and total cost net revenue (thousands of $) in the Crab fishery (N = number of EDC
vessels with non-zero, non-NA responses).
2009 2010 2011 2012 2013 2014 2015
Mean N Mean N Mean N Mean N Mean N Mean N Mean N
Revenue $168 62 $153 62 $218 68 $243 61 $362 67 $242 61 $70 52
(Variable costs) ($91) 62 ($87) 62 ($115) 68 ($138) 61 ($171) 67 ($139) 61 ($54) 52
Variable cost net revenue $77 62 $66 62 $103 68 $105 61 $191 67 $103 61 $15 52
(Fixed costs) ($33) 62 ($29) 62 ($56) 68 ($86) 61 ($67) 67 ($48) 61 ($22) 52
Total cost net revenue $44 62 $38 62 $47 68 $19 61 $124 67 $56 61 -$7 52
Revenue Variable cost net revenue Total cost net revenue
2009
2010
2011
2012
2013
2014
2015
2009
2010
2011
2012
2013
2014
2015
2009
2010
2011
2012
2013
2014
2015
0
100
200
300
Ave
rage
ves
sel
(tho
usan
ds o
f $)
RevenueVariable costsVariable cost net revenue
Fixed costsTotal cost net revenue
Figure 61: Crab fishery variable cost net revenue and total cost net revenue. Average total revenue, variable costs,
variable cost net revenue, fixed costs, and total cost net revenue in the crab fishery. Dashed line represents the beginning of
the catch share program.
DATA ANALYSIS 147 CATCHER VESSEL REPORT
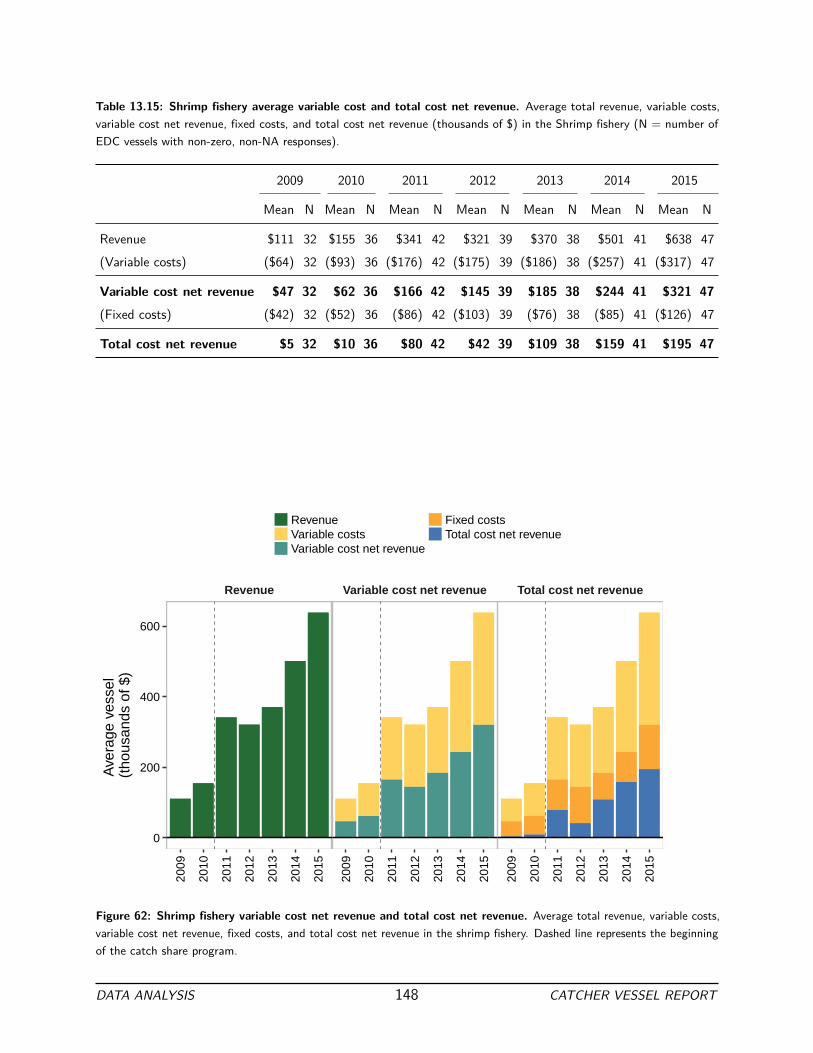
Table 13.15: Shrimp fishery average variable cost and total cost net revenue. Average total revenue, variable costs,
variable cost net revenue, fixed costs, and total cost net revenue (thousands of $) in the Shrimp fishery (N = number of
EDC vessels with non-zero, non-NA responses).
2009 2010 2011 2012 2013 2014 2015
Mean N Mean N Mean N Mean N Mean N Mean N Mean N
Revenue $111 32 $155 36 $341 42 $321 39 $370 38 $501 41 $638 47
(Variable costs) ($64) 32 ($93) 36 ($176) 42 ($175) 39 ($186) 38 ($257) 41 ($317) 47
Variable cost net revenue $47 32 $62 36 $166 42 $145 39 $185 38 $244 41 $321 47
(Fixed costs) ($42) 32 ($52) 36 ($86) 42 ($103) 39 ($76) 38 ($85) 41 ($126) 47
Total cost net revenue $5 32 $10 36 $80 42 $42 39 $109 38 $159 41 $195 47
Revenue Variable cost net revenue Total cost net revenue
2009
2010
2011
2012
2013
2014
2015
2009
2010
2011
2012
2013
2014
2015
2009
2010
2011
2012
2013
2014
2015
0
200
400
600
Ave
rage
ves
sel
(tho
usan
ds o
f $)
RevenueVariable costsVariable cost net revenue
Fixed costsTotal cost net revenue
Figure 62: Shrimp fishery variable cost net revenue and total cost net revenue. Average total revenue, variable costs,
variable cost net revenue, fixed costs, and total cost net revenue in the shrimp fishery. Dashed line represents the beginning
of the catch share program.
DATA ANALYSIS 148 CATCHER VESSEL REPORT
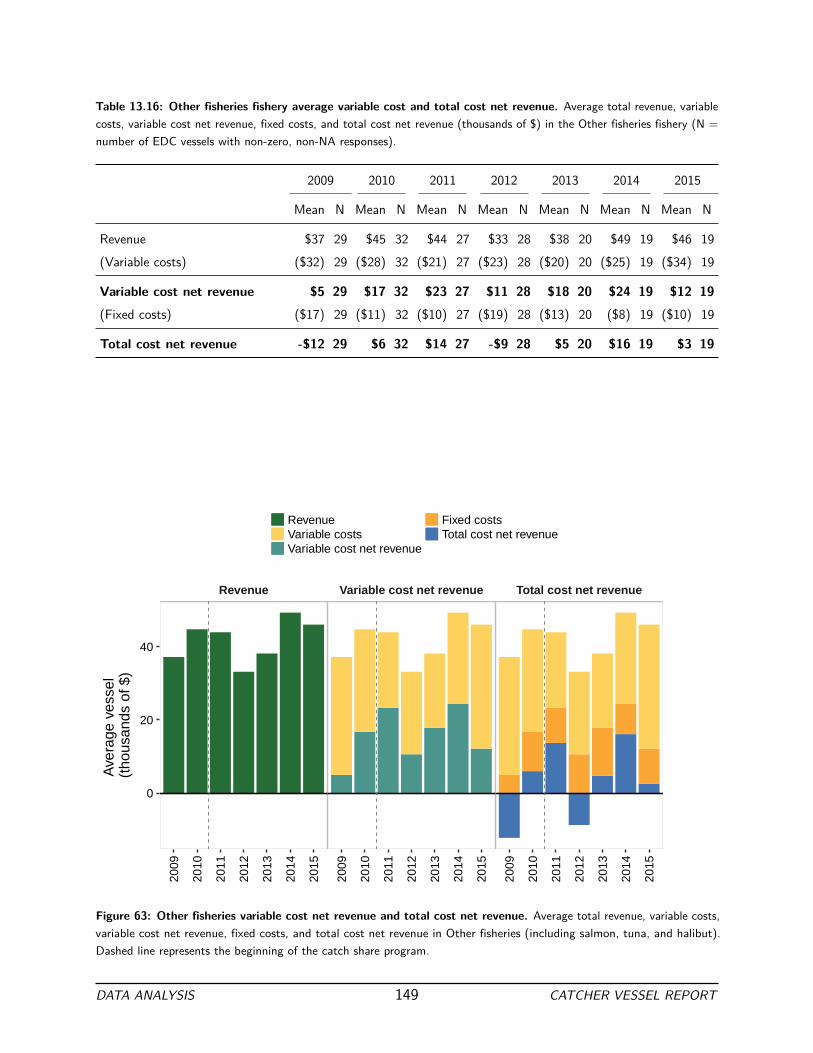
Table 13.16: Other fisheries fishery average variable cost and total cost net revenue. Average total revenue, variable
costs, variable cost net revenue, fixed costs, and total cost net revenue (thousands of $) in the Other fisheries fishery (N =
number of EDC vessels with non-zero, non-NA responses).
2009 2010 2011 2012 2013 2014 2015
Mean N Mean N Mean N Mean N Mean N Mean N Mean N
Revenue $37 29 $45 32 $44 27 $33 28 $38 20 $49 19 $46 19
(Variable costs) ($32) 29 ($28) 32 ($21) 27 ($23) 28 ($20) 20 ($25) 19 ($34) 19
Variable cost net revenue $5 29 $17 32 $23 27 $11 28 $18 20 $24 19 $12 19
(Fixed costs) ($17) 29 ($11) 32 ($10) 27 ($19) 28 ($13) 20 ($8) 19 ($10) 19
Total cost net revenue -$12 29 $6 32 $14 27 -$9 28 $5 20 $16 19 $3 19
Revenue Variable cost net revenue Total cost net revenue
2009
2010
2011
2012
2013
2014
2015
2009
2010
2011
2012
2013
2014
2015
2009
2010
2011
2012
2013
2014
2015
0
20
40
Ave
rage
ves
sel
(tho
usan
ds o
f $)
RevenueVariable costsVariable cost net revenue
Fixed costsTotal cost net revenue
Figure 63: Other fisheries variable cost net revenue and total cost net revenue. Average total revenue, variable costs,
variable cost net revenue, fixed costs, and total cost net revenue in Other fisheries (including salmon, tuna, and halibut).
Dashed line represents the beginning of the catch share program.
DATA ANALYSIS 149 CATCHER VESSEL REPORT

Net revenue variability for all catch shares participation and by fishery
There is high variability in economic performance among vessels that participate in the catch share program.
To display that variability while protecting confidential information, variable cost net revenue is calculated and
displayed by groups of three vessels (Figures 64 through 72). To calculate the three-vessel averages, the vessels
are ranked from lowest to highest by ex-vessel revenue, aggregated into groups of three and then the average costs
and net revenue are calculated for these aggregations of vessels. Total cost net revenue is not shown because
the fixed costs for one vessel in a group of three are often greater than 90% of the total fixed costs for all three
vessels, breaking the EDC Program “90-10 rule” for confidentiality.
DATA ANALYSIS 150 CATCHER VESSEL REPORT
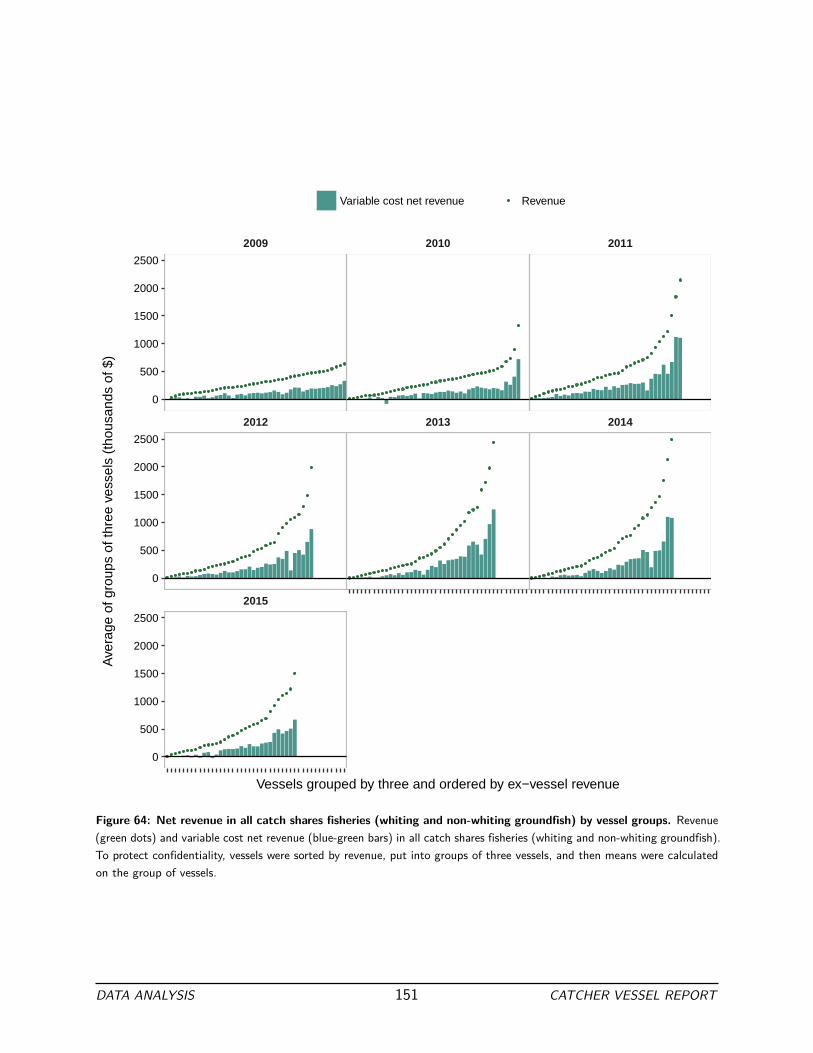
2015
2012 2013 2014
2009 2010 2011
0
500
1000
1500
2000
2500
0
500
1000
1500
2000
2500
0
500
1000
1500
2000
2500
Vessels grouped by three and ordered by ex−vessel revenue
Ave
rage
of g
roup
s of
thre
e ve
ssel
s (t
hous
ands
of $
)
Variable cost net revenue Revenue
Figure 64: Net revenue in all catch shares fisheries (whiting and non-whiting groundfish) by vessel groups. Revenue
(green dots) and variable cost net revenue (blue-green bars) in all catch shares fisheries (whiting and non-whiting groundfish).
To protect confidentiality, vessels were sorted by revenue, put into groups of three vessels, and then means were calculated
on the group of vessels.
DATA ANALYSIS 151 CATCHER VESSEL REPORT

2015
2012 2013 2014
2009 2010 2011
0
500
1000
1500
2000
2500
0
500
1000
1500
2000
2500
0
500
1000
1500
2000
2500
Vessels grouped by three and ordered by ex−vessel revenue
Ave
rage
of g
roup
s of
thre
e ve
ssel
s (t
hous
ands
of $
)
Variable cost net revenue Revenue
Figure 65: Net revenue in all whiting fisheries (shoreside and at-sea) by vessel groups. Revenue (green dots) and
variable cost net revenue (blue-green bars) in all catch shares fisheries (whiting and non-whiting groundfish). To protect
confidentiality, vessels were sorted by revenue, put into groups of three vessels, and then means were calculated on the
group of vessels.
DATA ANALYSIS 152 CATCHER VESSEL REPORT
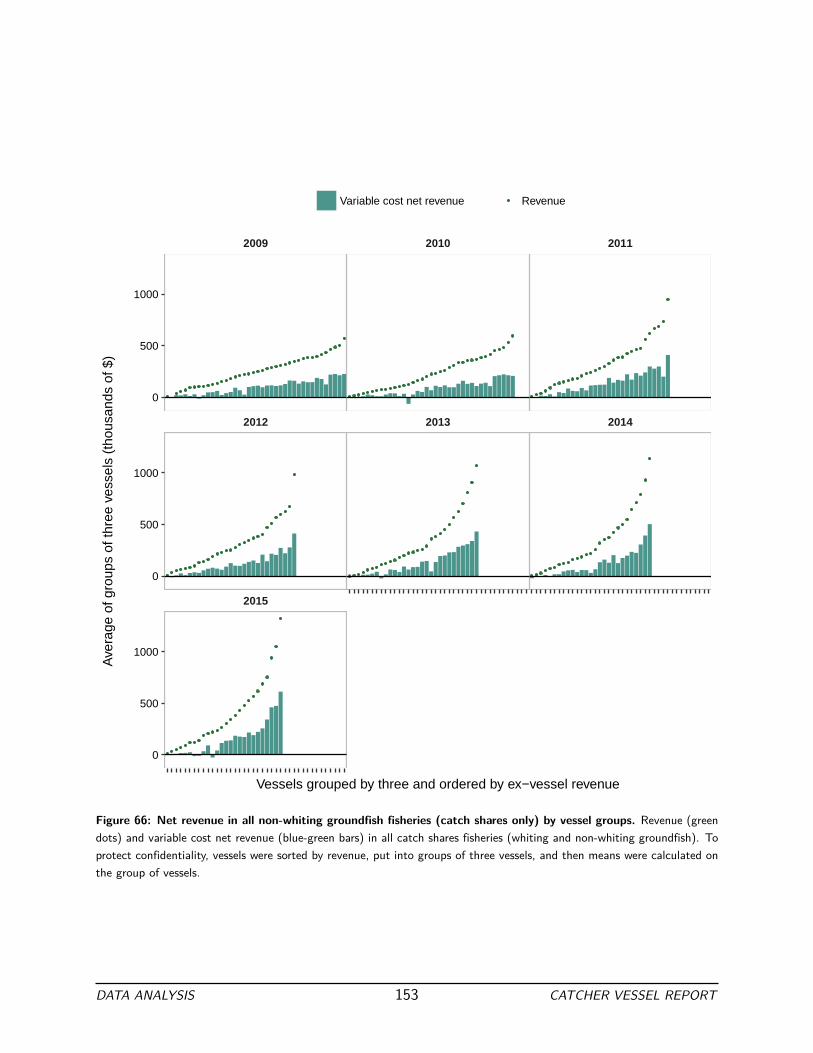
2015
2012 2013 2014
2009 2010 2011
0
500
1000
0
500
1000
0
500
1000
Vessels grouped by three and ordered by ex−vessel revenue
Ave
rage
of g
roup
s of
thre
e ve
ssel
s (t
hous
ands
of $
)
Variable cost net revenue Revenue
Figure 66: Net revenue in all non-whiting groundfish fisheries (catch shares only) by vessel groups. Revenue (green
dots) and variable cost net revenue (blue-green bars) in all catch shares fisheries (whiting and non-whiting groundfish). To
protect confidentiality, vessels were sorted by revenue, put into groups of three vessels, and then means were calculated on
the group of vessels.
DATA ANALYSIS 153 CATCHER VESSEL REPORT
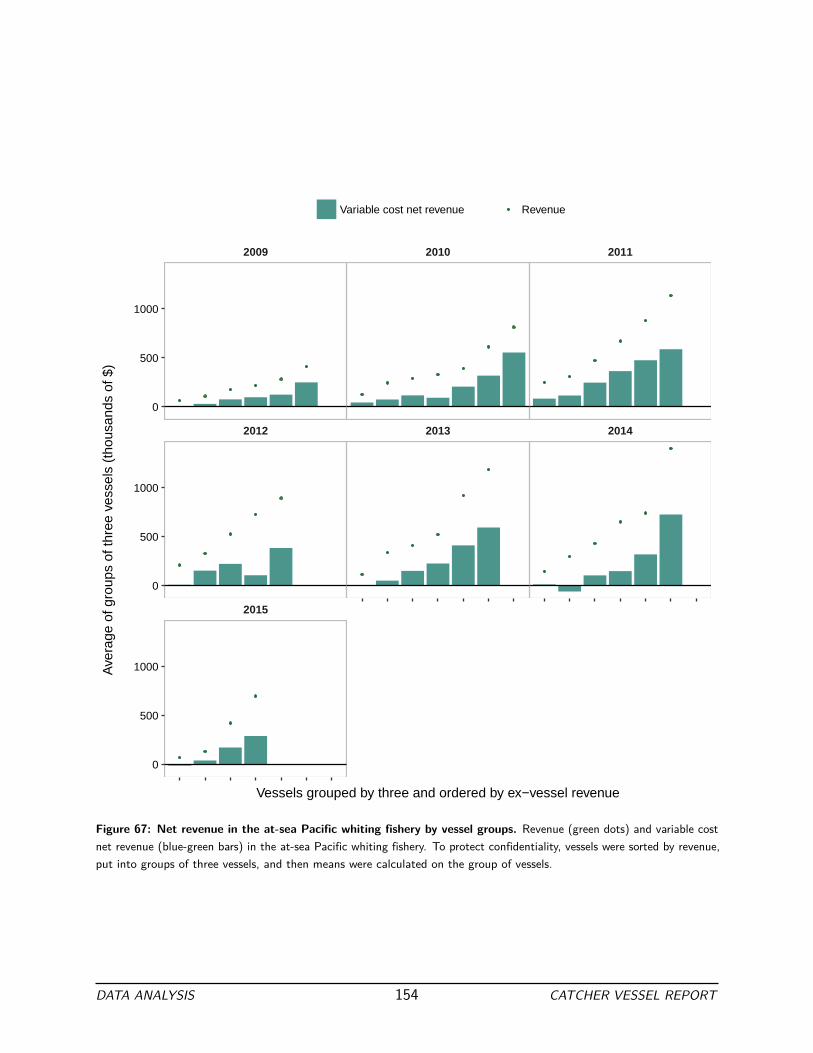
2015
2012 2013 2014
2009 2010 2011
0
500
1000
0
500
1000
0
500
1000
Vessels grouped by three and ordered by ex−vessel revenue
Ave
rage
of g
roup
s of
thre
e ve
ssel
s (t
hous
ands
of $
)
Variable cost net revenue Revenue
Figure 67: Net revenue in the at-sea Pacific whiting fishery by vessel groups. Revenue (green dots) and variable cost
net revenue (blue-green bars) in the at-sea Pacific whiting fishery. To protect confidentiality, vessels were sorted by revenue,
put into groups of three vessels, and then means were calculated on the group of vessels.
DATA ANALYSIS 154 CATCHER VESSEL REPORT

2015
2012 2013 2014
2009 2010 2011
0
500
1000
1500
0
500
1000
1500
0
500
1000
1500
Vessels grouped by three and ordered by ex−vessel revenue
Ave
rage
of g
roup
s of
thre
e ve
ssel
s (t
hous
ands
of $
)
Variable cost net revenue Revenue
Figure 68: Net revenue in the shoreside Pacific whiting fishery by vessel groups. Revenue (green dots) and variable
cost net revenue (blue-green bars) in the shoreside Pacific whiting fishery. To protect confidentiality, vessels were sorted by
revenue and means were calculated on groups of three vessels.
DATA ANALYSIS 155 CATCHER VESSEL REPORT

2014 2015
2012 2013
0
100
200
300
0
100
200
300
Vessels grouped by three and ordered by ex−vessel revenue
Ave
rage
of g
roup
s of
thre
e ve
ssel
s (t
hous
ands
of $
)
Variable cost net revenue Revenue
Figure 69: Net revenue in the Non-whiting midwater trawl fishery by vessel groups. Revenue (green dots) and variable
cost net revenue (blue-green bars) in the Non-whiting midwater trawl fishery. To protect confidentiality, vessels were sorted
by revenue and means were calculated on groups of three vessels.
DATA ANALYSIS 156 CATCHER VESSEL REPORT

2015
2012 2013 2014
2009 2010 2011
0
250
500
750
1000
0
250
500
750
1000
0
250
500
750
1000
Vessels grouped by three and ordered by ex−vessel revenue
Ave
rage
of g
roup
s of
thre
e ve
ssel
s (t
hous
ands
of $
)
Variable cost net revenue Revenue
Figure 70: Net revenue in the DTS trawl with trawl endorsement fishery by vessel groups. Revenue (green dots) and
variable cost net revenue (blue-green bars) in the DTS trawl with trawl endorsement fishery. To protect confidentiality,
vessels were sorted by revenue and means were calculated on groups of three vessels.
DATA ANALYSIS 157 CATCHER VESSEL REPORT
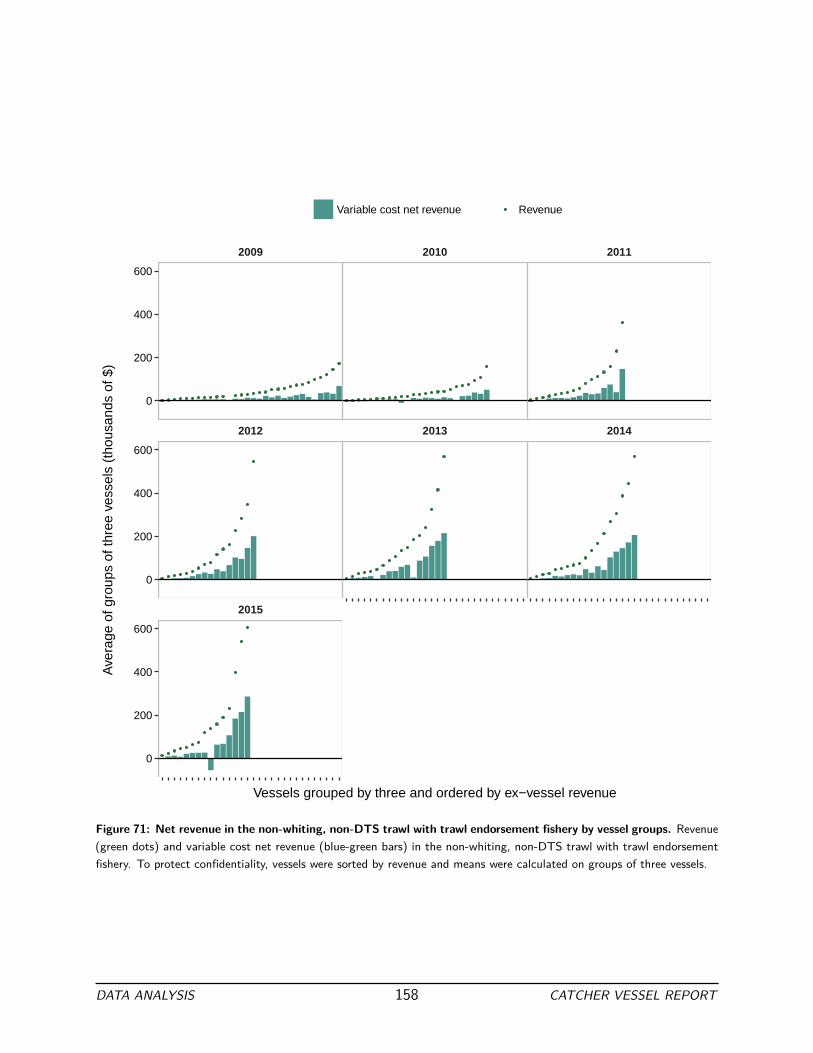
2015
2012 2013 2014
2009 2010 2011
0
200
400
600
0
200
400
600
0
200
400
600
Vessels grouped by three and ordered by ex−vessel revenue
Ave
rage
of g
roup
s of
thre
e ve
ssel
s (t
hous
ands
of $
)
Variable cost net revenue Revenue
Figure 71: Net revenue in the non-whiting, non-DTS trawl with trawl endorsement fishery by vessel groups. Revenue
(green dots) and variable cost net revenue (blue-green bars) in the non-whiting, non-DTS trawl with trawl endorsement
fishery. To protect confidentiality, vessels were sorted by revenue and means were calculated on groups of three vessels.
DATA ANALYSIS 158 CATCHER VESSEL REPORT

2014 2015
2011 2012 2013
0
200
400
600
800
0
200
400
600
800
Vessels grouped by three and ordered by ex−vessel revenue
Ave
rage
of g
roup
s of
thre
e ve
ssel
s (t
hous
ands
of $
)
Variable cost net revenue Revenue
Figure 72: Net revenue in the groundfish fixed gear with trawl endorsement fishery by vessel groups. Revenue (green
dots) and variable cost net revenue (blue-green bars) in the groundfish fixed gear with trawl endorsement fishery. To protect
confidentiality, vessels were sorted by revenue and means were calculated on groups of three vessels.
DATA ANALYSIS 159 CATCHER VESSEL REPORT

13.3 Net revenue including quota costs and earnings
The costs and earnings from quota are an important component of the economic health of the companies that fish
in the catch share program. The value of quota is theoretically equal to the profitability of the asset. In theory, a
quota owner will fish the quota if the profit they earn from fishing the quota is higher than the price they would
receive if they sold the quota. Net revenue including earnings and costs from quota will be less than net revenue
without considering quota transactions if quota is purchased from quota share owners not involved with an actively
participating vessel.
In the previous sections, we presented net revenue by fishery and calendar year. This was accomplished by using
cost disaggregation to allocate variable and fixed costs to each delivery. Unlike the other costs, there is no method
for allocating the financial cost of quota to individual deliveries because the source of quota used to cover an
individual delivery is not known. Therefore, this section is presented by fiscal year and for all catch share fisheries
combined rather than by calendar year by individual fishery. The figures are presented in pairs, the first of each
pair depicts the catch share net revenue without including quota revenues or costs and the second pair includes the
quota revenues and costs. The pairs are presented for all catch shares, all whiting vessels (includes all catch share
activity), and all non-whiting groundfish vessels. The categorization of whiting or non-whiting groundfish vessel is
mutually exclusive (if a vessel fished in both the whiting portion of the catch share program or the non-whiting
groundfish portion, they are classified as a whiting vessel).
DATA ANALYSIS 160 CATCHER VESSEL REPORT

All Catch
Sh
ares
Net
Revenue: Includ
ing qu
ota costs and earnings
Table 13
.17:
All catch share (w
hitin
g and no
n-whitin
g grou
ndfish)
average varia
ble cost
and total c
ost net revenu
e by
survey
year
with
and with
out qu
ota
revenu
e and qu
ota costs.
Average ex-vessel revenue, v
ariable cost
net r
evenue, a
nd total cost n
et revenu
e (tho
usands
of
$)
for a
ll participatio
n in
the catch share (w
hitin
g and no
n-whitin
g grou
ndfish)
fisherie
s by
survey
year
with
and with
out accoun
ting for qu
ota costs.
2009
2010
2011
2012
2013
2014
2015
With
With
out
With
With
out
With
With
out
With
With
out
With
With
out
With
With
out
With
With
out
Revenu
e $306.0
$306.0
$344.9
$344.9
$612.1
$578.0
$556.5
$521.6
$634.1
$616.6
$643.4
$628.9
$513.0
$499.5
Varia
ble cost
net r
evenue
$119.3
$119.3
$136.3
$136.3
$247.1
$264.8
$198.1
$202.5
$242.2
$267.0
$204.5
$233.9
$150.0
$185.8
Total c
ost n
et revenu
e $10.2
$10.2
$38.3
$38.3
$76.0
$93.8
$16.5
$20.9
$117.5
$142.3
$73.4
$102.9
$14.1
$49.9
DATA ANALYSIS 161 CATCHER VESSEL REPORT

Revenue Variable cost net revenue Total cost net revenue
2009
2010
2011
2012
2013
2014
2015
2009
2010
2011
2012
2013
2014
2015
2009
2010
2011
2012
2013
2014
2015
0
200
400
600
Fiscal Year
Ave
rage
sur
vey
year
quo
ta n
et r
even
ue (
thou
sand
s of
$)
Revenue
Quota revenue
Quota variable costs
Variable costs
Variable cost net revenue
Fixed costs
Total cost net revenue
Figure 73: All catch share (whiting and non-whiting groundfish) average net revenue with quota earnings and costs by survey year. Average ex-vessel revenue,
quota revenue, variable costs, variable quota costs, variable cost net revenue, fixed costs, and total cost net revenue for all participation in the catch share (whiting and
non-whiting groundfish) fisheries by survey year. There are too few observations to display fixed quota costs (purchase or sale of quota shares).
DATA ANALYSIS 162 CATCHER VESSEL REPORT

Revenue Variable cost net revenue Total cost net revenue
2009
2010
2011
2012
2013
2014
2015
2009
2010
2011
2012
2013
2014
2015
2009
2010
2011
2012
2013
2014
2015
0
200
400
600
Fiscal Year
Ave
rage
sur
vey
year
quo
ta n
et r
even
ue (
thou
sand
s of
$)
Revenue
Quota revenue
Quota variable costs
Variable costs
Variable cost net revenue
Fixed costs
Total cost net revenue
Figure 74: All catch share (whiting and non-whiting groundfish) average net revenue without quota earnings and
costs by survey year. Average ex-vessel revenue, variable costs, variable cost net revenue, fixed costs, and total cost net
revenue for all participation in the catch share fisheries (whiting and non-whiting groundfish) by survey year. Dashed line
represents the beginning of the catch share program.
DATA ANALYSIS 163 CATCHER VESSEL REPORT
Catch Shares Net Revenue for Whiting Vessels: Including quota costs and earnings
DATA ANALYSIS 164 CATCHER VESSEL REPORT

Table 13
.18:
Whitin
g vessel
average net revenu
e for all c
atch
shares
participation with
qu
ota earnings
and costs by
survey
year. Av
erage revenu
e, varia
ble cost
net revenu
e, and total c
ost net revenu
e (m
illions
of
$)
for all w
hitin
g vessels by
survey
year
with
and with
out qu
ota costs.
2009
2010
2011
2012
2013
2014
2015
With
With
out
With
With
out
With
With
out
With
With
out
With
With
out
With
With
out
With
With
out
Revenu
e $0.43
$0.43
$0.56
$0.56
$1.18
$1.15
$1.15
$1.12
$1.42
$1.41
$1.37
$1.35
$0.79
$0.77
Varia
ble cost
net r
evenue
$0.19
$0.19
$0.24
$0.24
$0.53
$0.57
$0.42
$0.44
$0.60
$0.66
$0.47
$0.51
$0.25
$0.28
Total c
ost n
et revenu
e $-0.00
$-0.00
$0.06
$0.06
$0.14
$0.18
$-0.02
$-0.01
$0.29
$0.35
$0.13
$0.17
$-0.10
$-0.07
DATA ANALYSIS 165 CATCHER VESSEL REPORT

Revenue Variable cost net revenue Total cost net revenue
2009
2010
2011
2012
2013
2014
2015
2009
2010
2011
2012
2013
2014
2015
2009
2010
2011
2012
2013
2014
2015
0.0
0.5
1.0
1.5
Fiscal Year
Ave
rage
sur
vey
year
quo
ta n
et r
even
ue (
mill
ions
of $
)
Quota revenue
Revenue
Quota variable costs
Variable costs
Variable cost net revenue
Fixed costs
Total cost net revenue
Figure 75: Whiting vessel average net revenue for all catch shares participation with quota earnings and costs by
survey year. Average ex-vessel revenue, quota revenue, variable costs, variable quota costs, variable cost net revenue, fixed
costs, and total cost net revenue for whiting vessel participation in the catch share fisheries (whiting and non-whiting
groundfish) by survey year. There are too few observations to display fixed quota costs (purchase or sale of quota shares).
Dashed line represents the beginning of the catch share program.
DATA ANALYSIS 166 CATCHER VESSEL REPORT

Revenue Variable cost net revenue Total cost net revenue
2009
2010
2011
2012
2013
2014
2015
2009
2010
2011
2012
2013
2014
2015
2009
2010
2011
2012
2013
2014
2015
0.0
0.5
1.0
1.5
Fiscal Year
Ave
rage
sur
vey
year
quo
ta n
et r
even
ue (
mill
ions
of $
)
Quota revenue
Revenue
Quota variable costs
Variable costs
Variable cost net revenue
Fixed costs
Total cost net revenue
Figure 76: Whiting vessel average net revenue for all catch shares participation without quota earnings and costs
by survey year. Average ex-vessel revenue, variable costs, variable cost net revenue, fixed costs, and total cost net revenue
for whiting vessel participation in the catch share fisheries (whiting and non-whiting groundfish) by survey year. Dashed line
represents the beginning of the catch share program.
DATA ANALYSIS 167 CATCHER VESSEL REPORT
Catch Shares Net Revenue for Non-whiting Groundfish Vessels: Including quota costs and earnings
DATA ANALYSIS 168 CATCHER VESSEL REPORT
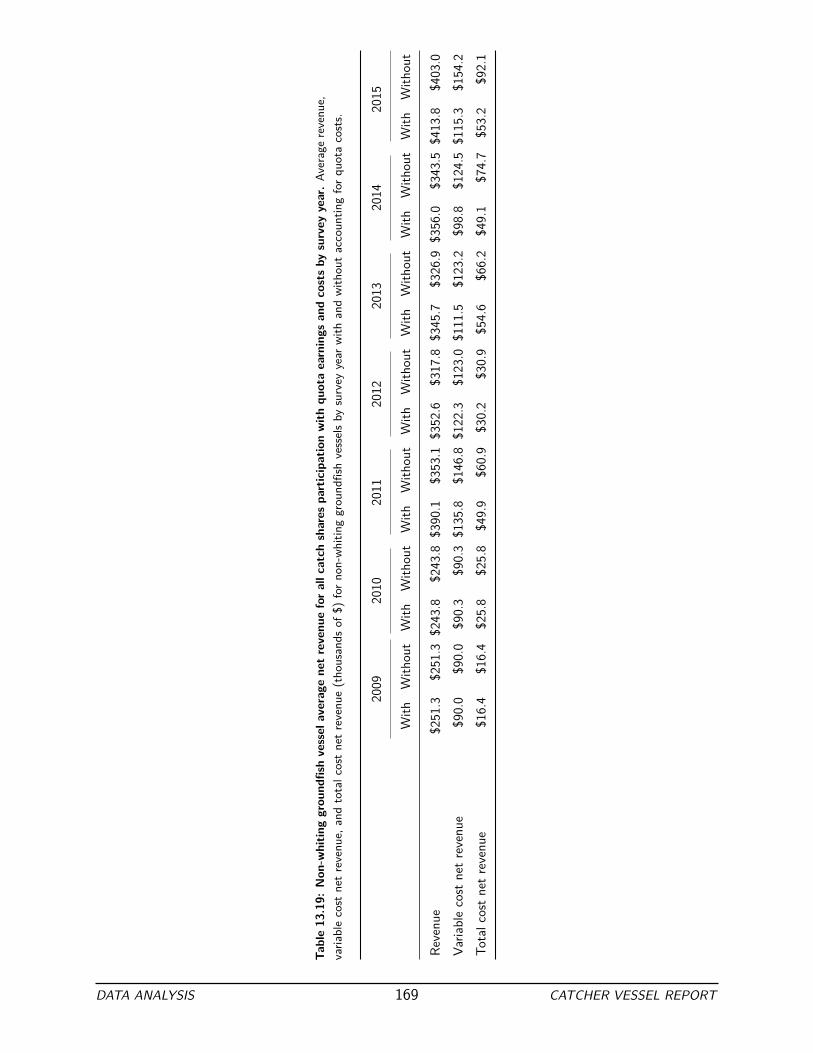
Table 13
.19:
Non
-whitin
g grou
ndfish vessel
average net revenu
e for all catch
shares
participation with
qu
ota earnings
and costs by
survey
year. Av
erage revenu
e,
varia
ble cost
net revenu
e, and total c
ost net revenu
e (tho
usands
of
$)
for no
n-whitin
g grou
ndfish vessels by
survey
year
with
and with
out accoun
ting for q
uota
costs.
2009
2010
2011
2012
2013
2014
2015
With
With
out
With
With
out
With
With
out
With
With
out
With
With
out
With
With
out
With
With
out
Revenu
e $251.3
$251.3
$243.8
$243.8
$390.1
$353.1
$352.6
$317.8
$345.7
$326.9
$356.0
$343.5
$413.8
$403.0
Varia
ble cost
net r
evenue
$90.0
$90.0
$90.3
$90.3
$135.8
$146.8
$122.3
$123.0
$111.5
$123.2
$98.8
$124.5
$115.3
$154.2
Total c
ost n
et revenu
e $16.4
$16.4
$25.8
$25.8
$49.9
$60.9
$30.2
$30.9
$54.6
$66.2
$49.1
$74.7
$53.2
$92.1
DATA ANALYSIS 169 CATCHER VESSEL REPORT
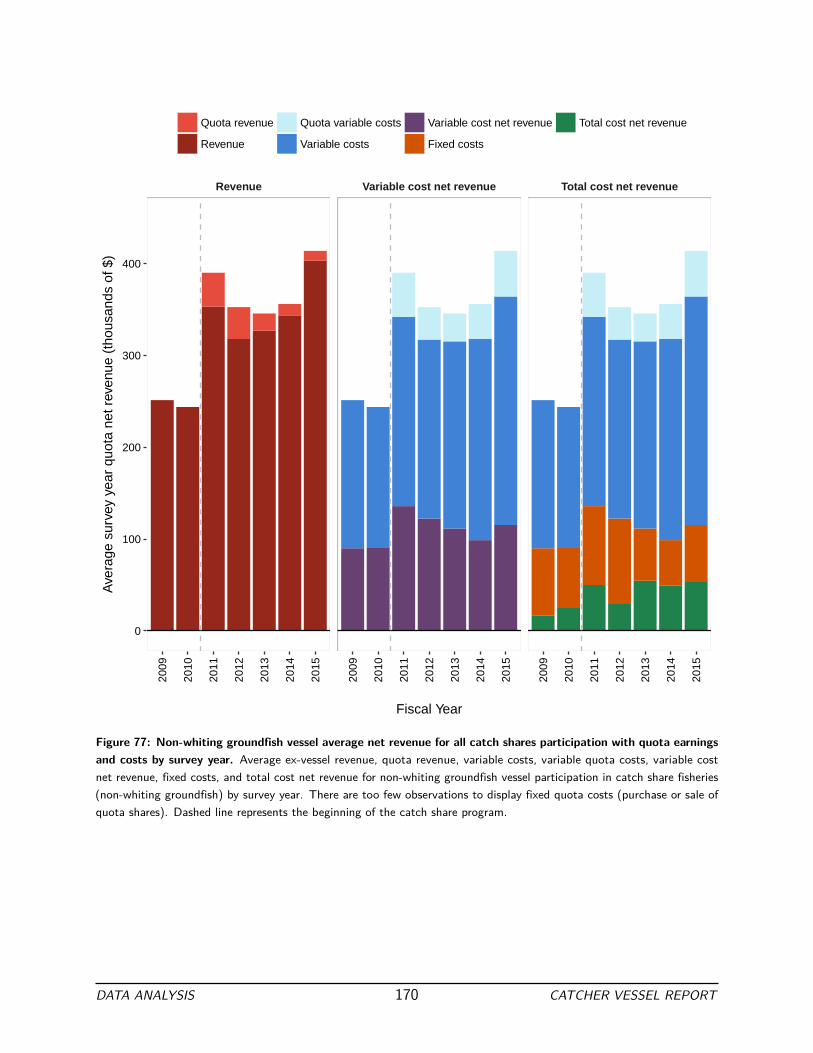
Revenue Variable cost net revenue Total cost net revenue
2009
2010
2011
2012
2013
2014
2015
2009
2010
2011
2012
2013
2014
2015
2009
2010
2011
2012
2013
2014
2015
0
100
200
300
400
Fiscal Year
Ave
rage
sur
vey
year
quo
ta n
et r
even
ue (
thou
sand
s of
$)
Quota revenue
Revenue
Quota variable costs
Variable costs
Variable cost net revenue
Fixed costs
Total cost net revenue
Figure 77: Non-whiting groundfish vessel average net revenue for all catch shares participation with quota earnings
and costs by survey year. Average ex-vessel revenue, quota revenue, variable costs, variable quota costs, variable cost
net revenue, fixed costs, and total cost net revenue for non-whiting groundfish vessel participation in catch share fisheries
(non-whiting groundfish) by survey year. There are too few observations to display fixed quota costs (purchase or sale of
quota shares). Dashed line represents the beginning of the catch share program.
DATA ANALYSIS 170 CATCHER VESSEL REPORT
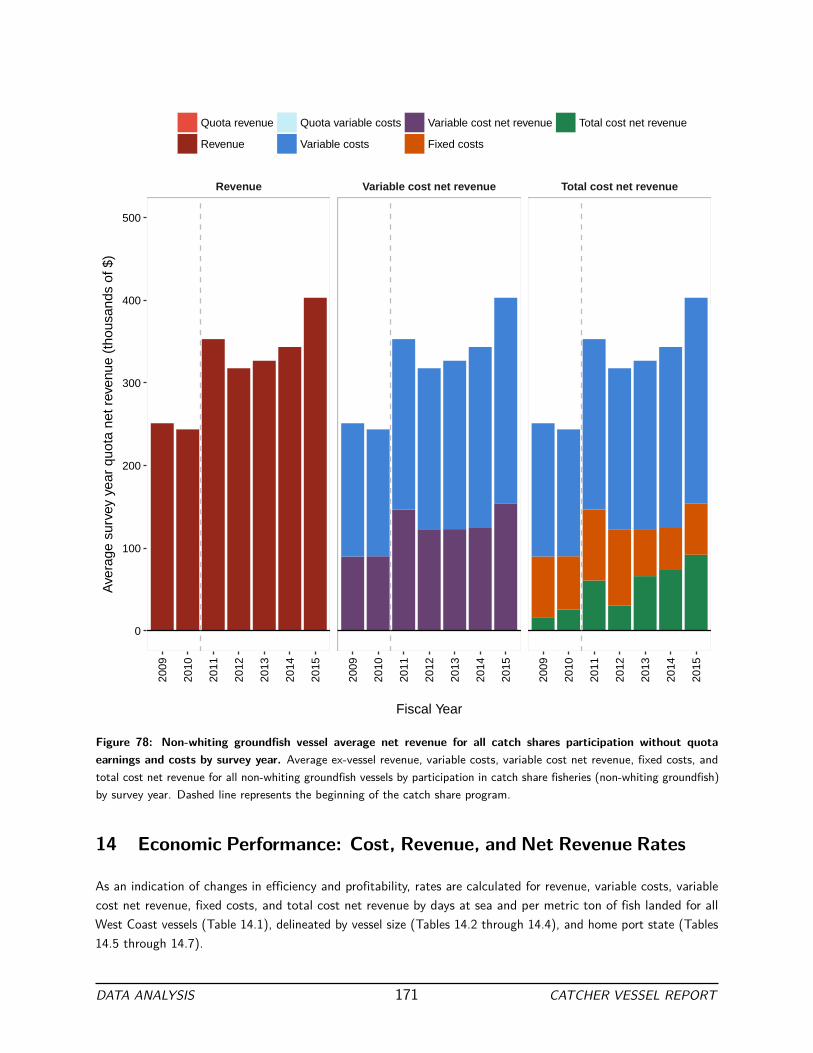
Revenue Variable cost net revenue Total cost net revenue
2009
2010
2011
2012
2013
2014
2015
2009
2010
2011
2012
2013
2014
2015
2009
2010
2011
2012
2013
2014
2015
0
100
200
300
400
500
Fiscal Year
Ave
rage
sur
vey
year
quo
ta n
et r
even
ue (
thou
sand
s of
$)
Quota revenue
Revenue
Quota variable costs
Variable costs
Variable cost net revenue
Fixed costs
Total cost net revenue
Figure 78: Non-whiting groundfish vessel average net revenue for all catch shares participation without quota
earnings and costs by survey year. Average ex-vessel revenue, variable costs, variable cost net revenue, fixed costs, and
total cost net revenue for all non-whiting groundfish vessels by participation in catch share fisheries (non-whiting groundfish)
by survey year. Dashed line represents the beginning of the catch share program.
14 Economic Performance: Cost, Revenue, and Net Revenue Rates
As an indication of changes in efficiency and profitability, rates are calculated for revenue, variable costs, variable
cost net revenue, fixed costs, and total cost net revenue by days at sea and per metric ton of fish landed for all
West Coast vessels (Table 14.1), delineated by vessel size (Tables 14.2 through 14.4), and home port state (Tables
14.5 through 14.7).
DATA ANALYSIS 171 CATCHER VESSEL REPORT
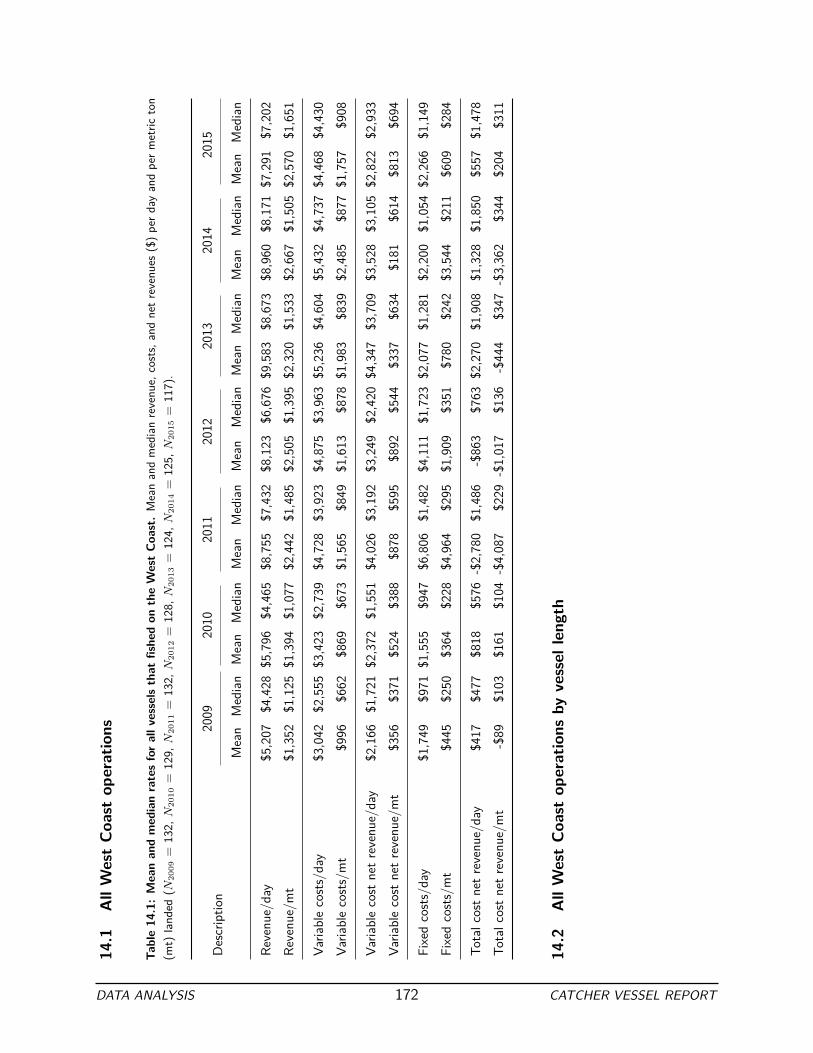
14.1
All West Coast
op
erations
Table 14
.1: Mean and median rates for all v
essels that
fished on
the West Coast. Mean and median revenu
e, costs, and net r
evenues ($) per d
ay and per m
etric
ton
(mt)
land
ed ( N
2009
= 132,
N
2010
= 129,
N
2011
= 132,
N
2012
= 128,
N
2013
= 124,
N
2014
= 125,
N
2015
= 117).
Descrip
tion
2009
2010
2011
2012
2013
2014
2015
Mean
Median
Mean
Median
Mean
Median
Mean
Median
Mean
Median
Mean
Median
Mean
Median
Revenu
e/day
$5,207
$4,428
$5,796
$4,465
$8,755
$7,432
$8,123
$6,676
$9,583
$8,673
$8,960
$8,171
$7,291
$7,202
Revenu
e/mt
$1,352
$1,125
$1,394
$1,077
$2,442
$1,485
$2,505
$1,395
$2,320
$1,533
$2,667
$1,505
$2,570
$1,651
Varia
ble costs/day
$3,042
$2,555
$3,423
$2,739
$4,728
$3,923
$4,875
$3,963
$5,236
$4,604
$5,432
$4,737
$4,468
$4,430
Varia
ble costs/mt
$996
$662
$869
$673
$1,565
$849
$1,613
$878
$1,983
$839
$2,485
$877
$1,757
$908
Varia
ble cost
net r
evenue/d
ay
$2,166
$1,721
$2,372
$1,551
$4,026
$3,192
$3,249
$2,420
$4,347
$3,709
$3,528
$3,105
$2,822
$2,933
Varia
ble cost
net r
evenue/m
t $356
$371
$524
$388
$878
$595
$892
$544
$337
$634
$181
$614
$813
$694
Fixed costs/day
$1,749
$971
$1,555
$947
$6,806
$1,482
$4,111
$1,723
$2,077
$1,281
$2,200
$1,054
$2,266
$1,149
Fixed costs/mt
$445
$250
$364
$228
$4,964
$295
$1,909
$351
$780
$242
$3,544
$211
$609
$284
Total c
ost n
et revenu
e/day
$417
$477
$818
$576
-$2,780
$1,486
-$863
$763
$2,270
$1,908
$1,328
$1,850
$557
$1,478
Total c
ost n
et revenu
e/mt
-$89
$103
$161
$104
-$4,087
$229
-$1,017
$136
-$444
$347
-$3,362
$344
$204
$311
14.2
All West Coast
op
erations
by
vessel
leng
th
DATA ANALYSIS 172 CATCHER VESSEL REPORT

Table 14
.2: Sm
all v
essel m
ean and median rates for West Coast
op
erations. Mean and median revenu
e, costs, and net revenu
e ($) per d
ay and per m
etric
ton (m
t)
harvested.
( N
2009
= 44, N
2010
= 44, N
2012
= 49, N
2013
= 47, N
2014
= 47, N
2015
= 42).
Descrip
tion
2009
2010
2011
2012
2013
2014
2015
Mean
Median
Mean
Median
Mean
Median
Mean
Median
Mean
Median
Mean
Median
Mean
Median
Revenu
e/day
$3,292
$2,842
$3,395
$3,243
$5,526
$4,608
$4,574
$3,522
$5,593
$4,712
$4,732
$4,642
$4,603
$4,222
Revenu
e/mt
$2,168
$1,629
$2,389
$1,820
$3,850
$4,080
$3,980
$4,303
$3,769
$3,216
$4,382
$3,159
$4,397
$2,774
Varia
ble costs/day
$1,836
$1,612
$1,875
$1,720
$3,108
$2,910
$2,714
$2,562
$2,938
$2,483
$3,058
$2,970
$2,864
$2,658
Varia
ble costs/mt
$1,175
$904
$1,317
$990
$2,850
$1,718
$2,645
$2,245
$3,895
$1,613
$5,102
$2,023
$3,087
$2,124
Varia
ble cost
net r
evenue/d
ay
$1,457
$1,054
$1,519
$1,291
$2,418
$2,169
$1,860
$1,511
$2,654
$1,978
$1,674
$1,713
$1,739
$1,291
Varia
ble cost
net r
evenue/m
t $993
$617
$1,072
$728
$1,000
$1,199
$1,335
$798
-$125
$1,114
-$720
$925
$1,310
$926
Fixed costs/day
$721
$592
$668
$587
$13,321
$1,073
$3,792
$958
$1,112
$838
$1,577
$575
$936
$658
Fixed costs/mt
$607
$354
$533
$363
$12,617
$609
$3,997
$805
$1,476
$486
$8,556
$439
$954
$726
Total c
ost n
et revenu
e/day
$735
$352
$851
$584
-$10,904
$1,025
-$1,932
$582
$1,542
$1,269
$97
$1,166
$803
$744
Total c
ost n
et revenu
e/mt
$386
$304
$540
$350
-$11,616
$508
-$2,662
$390
-$1,601
$638
-$9,276
$587
$355
$483
DATA ANALYSIS 173 CATCHER VESSEL REPORT

Table 14
.3: Medium
vessel
mean and median rates for West Coast
op
erations. Mean and median revenu
e, costs, and net revenu
e ($) per day and per metric
ton
(mt)
harvested.
( N
2009
= 54, N
2010
= 52, N
2012
= 55, N
2013
= 53, N
2014
= 53, N
2015
= 50).
Descrip
tion
2009
2010
2011
2012
2013
2014
2015
Mean
Median
Mean
Median
Mean
Median
Mean
Median
Mean
Median
Mean
Median
Mean
Median
Revenu
e/day
$4,473
$4,153
$4,546
$4,148
$7,508
$7,285
$7,162
$6,699
$8,429
$8,561
$8,236
$8,502
$8,328
$9,011
Revenu
e/mt
$1,217
$1,143
$1,272
$1,062
$2,139
$1,412
$2,251
$1,383
$2,160
$1,509
$2,517
$1,505
$2,323
$1,666
Varia
ble costs/day
$2,753
$2,497
$3,078
$2,716
$4,268
$4,091
$4,402
$3,962
$4,713
$4,440
$4,862
$4,779
$4,875
$4,698
Varia
ble costs/mt
$833
$708
$938
$674
$1,168
$813
$1,381
$871
$1,209
$801
$1,398
$867
$1,416
$927
Varia
ble cost
net r
evenue/d
ay
$1,720
$1,548
$1,469
$1,229
$3,241
$3,170
$2,759
$2,377
$3,716
$3,468
$3,374
$3,151
$3,453
$3,874
Varia
ble cost
net r
evenue/m
t $383
$354
$334
$407
$971
$586
$869
$556
$951
$655
$1,119
$617
$908
$739
Fixed costs/day
$1,335
$994
$1,317
$989
$2,015
$1,375
$2,978
$1,605
$1,763
$1,151
$1,827
$1,094
$1,686
$1,258
Fixed costs/mt
$400
$270
$390
$266
$560
$275
$951
$359
$519
$242
$788
$211
$600
$283
Total c
ost n
et revenu
e/day
$385
$424
$152
$545
$1,226
$1,490
-$218
$802
$1,952
$1,898
$1,548
$2,206
$1,768
$2,187
Total c
ost n
et revenu
e/mt
-$17
$105
-$56
$104
$411
$315
-$82
$209
$432
$406
$331
$419
$307
$462
DATA ANALYSIS 174 CATCHER VESSEL REPORT

Table 14
.4: Large vessel
mean and median rates for West Coast
op
erations. Mean and median revenu
e, costs, and net revenu
e ($) per d
ay and per m
etric
ton (m
t)
harvested.
( N
2009
= 37, N
2010
= 38, N
2012
= 32, N
2013
= 32, N
2014
= 32, N
2015
= 32).
Descrip
tion
2009
2010
2011
2012
2013
2014
2015
Mean
Median
Mean
Median
Mean
Median
Mean
Median
Mean
Median
Mean
Median
Mean
Median
Revenu
e/day
$8,551
$7,059
$10,073
$8,365
$15,046
$15,925
$14,522
$13,928
$16,660
$15,861
$15,885
$14,481
$9,327
$9,068
Revenu
e/mt
$432
$233
$399
$217
$1,008
$269
$715
$315
$513
$269
$471
$233
$718
$193
Varia
ble costs/day
$4,928
$4,798
$5,610
$5,295
$7,664
$7,372
$8,595
$7,860
$9,091
$7,800
$9,562
$8,365
$5,887
$6,123
Varia
ble costs/mt
$917
$125
$260
$133
$384
$137
$416
$189
$298
$140
$282
$162
$511
$146
Varia
ble cost
net r
evenue/d
ay
$3,624
$2,861
$4,463
$3,102
$7,382
$7,229
$5,928
$6,131
$7,569
$6,782
$6,323
$6,094
$3,440
$3,418
Varia
ble cost
net r
evenue/m
t -$484
$90
$140
$95
$623
$143
$299
$143
$215
$144
$189
$101
$207
$84
Fixed costs/day
$3,524
$2,022
$2,839
$1,956
$4,215
$3,471
$7,380
$2,968
$3,804
$2,985
$3,636
$2,278
$4,723
$1,440
Fixed costs/mt
$254
$78
$128
$66
$303
$86
$377
$111
$123
$52
$121
$42
$195
$53
Total c
ost n
et revenu
e/day
$99
$749
$1,624
$889
$3,167
$3,546
-$1,452
$1,858
$3,764
$3,460
$2,688
$3,510
-$1,283
$1,850
Total c
ost n
et revenu
e/mt
-$738
$38
$11
$36
$321
$75
-$78
$50
$91
$78
$68
$72
$12
$35
DATA ANALYSIS 175 CATCHER VESSEL REPORT

14.3
All West Coast
op
erations
by
vessel
ho
me po
rt state
Table 14
.5: Washing
ton mean and median rates for West Coast
op
erations. Mean and median revenu
e, costs, and net revenu
e ($) per d
ay and per m
etric
ton (m
t)
harvested.
( N
2009
= 16, N
2010
= 17, N
2012
= 15, N
2013
= 15, N
2014
= 18, N
2015
= 17).
Descrip
tion
2009
2010
2011
2012
2013
2014
2015
Mean
Median
Mean
Median
Mean
Median
Mean
Median
Mean
Median
Mean
Median
Mean
Median
Revenu
e/day
$6,638
$6,631
$8,548
$6,479
$13,062
$11,024
$13,545
$12,914
$14,991
$13,121
$14,494
$9,475
$7,986
$7,950
Revenu
e/mt
$487
$386
$564
$180
$2,101
$448
$1,865
$458
$1,484
$323
$2,136
$319
$2,369
$517
Varia
ble costs/day
$3,815
$4,521
$4,560
$3,871
$6,511
$5,922
$7,078
$6,599
$7,137
$6,858
$7,624
$6,335
$4,396
$4,334
Varia
ble costs/mt
$308
$227
$356
$109
$974
$238
$954
$228
$608
$180
$2,066
$194
$1,413
$274
Varia
ble cost
net r
evenue/d
ay
$2,823
$2,209
$3,988
$2,608
$6,551
$6,354
$6,467
$5,894
$7,854
$6,673
$6,870
$3,832
$3,590
$3,690
Varia
ble cost
net r
evenue/m
t $179
$140
$208
$93
$1,128
$156
$911
$230
$876
$194
$70
$115
$956
$243
Fixed costs/day
$2,242
$1,655
$2,105
$1,359
$3,814
$1,989
$4,819
$2,623
$3,114
$2,438
$3,703
$1,471
$1,828
$1,110
Fixed costs/mt
$159
$93
$172
$45
$406
$193
$471
$174
$398
$59
$781
$88
$617
$93
Total c
ost n
et revenu
e/day
$581
$611
$1,883
$1,020
$2,736
$3,464
$1,648
$1,570
$4,740
$3,407
$3,167
$2,948
$1,762
$1,288
Total c
ost n
et revenu
e/mt
$20
$26
$35
$56
$722
$80
$439
$56
$478
$136
-$711
$81
$339
$76
DATA ANALYSIS 176 CATCHER VESSEL REPORT
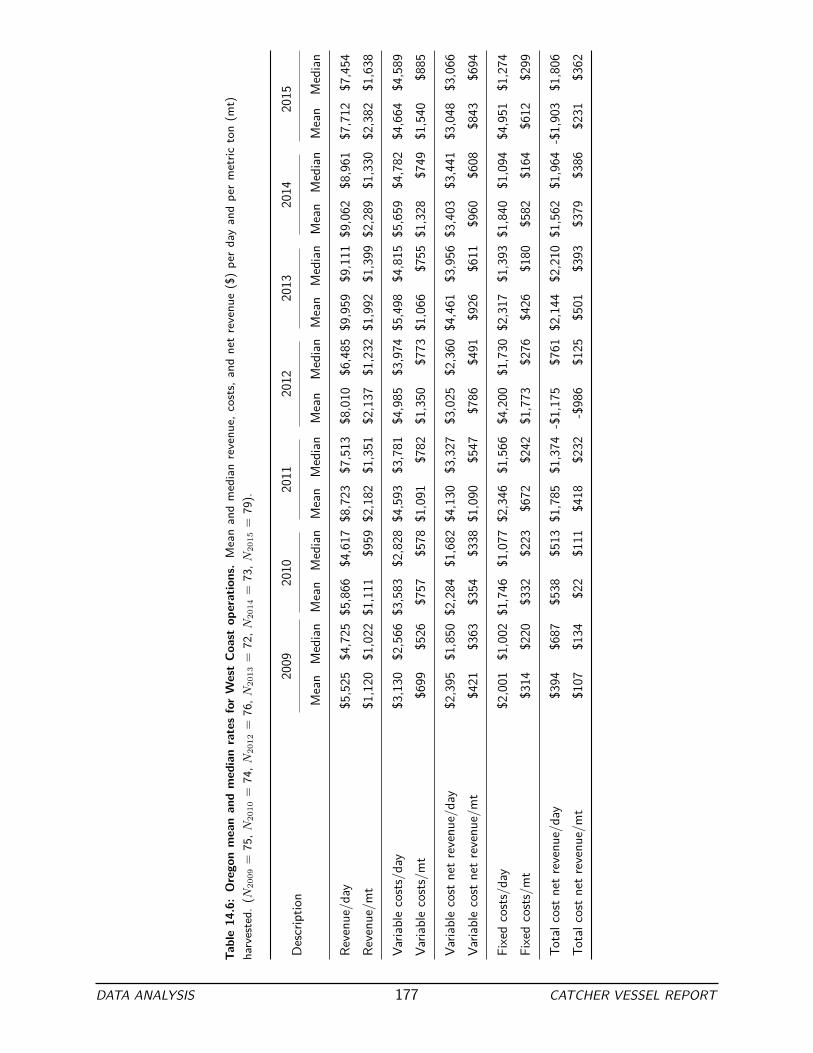
Table 14
.6: Orego
n mean and median rates for West Coast
op
erations. Mean and median revenu
e, costs,
and net revenu
e ($) per day and per metric
ton (m
t)
harvested.
( N
2009
= 75, N
2010
= 74, N
2012
= 76, N
2013
= 72, N
2014
= 73, N
2015
= 79).
Descrip
tion
2009
2010
2011
2012
2013
2014
2015
Mean
Median
Mean
Median
Mean
Median
Mean
Median
Mean
Median
Mean
Median
Mean
Median
Revenu
e/day
$5,525
$4,725
$5,866
$4,617
$8,723
$7,513
$8,010
$6,485
$9,959
$9,111
$9,062
$8,961
$7,712
$7,454
Revenu
e/mt
$1,120
$1,022
$1,111
$959
$2,182
$1,351
$2,137
$1,232
$1,992
$1,399
$2,289
$1,330
$2,382
$1,638
Varia
ble costs/day
$3,130
$2,566
$3,583
$2,828
$4,593
$3,781
$4,985
$3,974
$5,498
$4,815
$5,659
$4,782
$4,664
$4,589
Varia
ble costs/mt
$699
$526
$757
$578
$1,091
$782
$1,350
$773
$1,066
$755
$1,328
$749
$1,540
$885
Varia
ble cost
net r
evenue/d
ay
$2,395
$1,850
$2,284
$1,682
$4,130
$3,327
$3,025
$2,360
$4,461
$3,956
$3,403
$3,441
$3,048
$3,066
Varia
ble cost
net r
evenue/m
t $421
$363
$354
$338
$1,090
$547
$786
$491
$926
$611
$960
$608
$843
$694
Fixed costs/day
$2,001
$1,002
$1,746
$1,077
$2,346
$1,566
$4,200
$1,730
$2,317
$1,393
$1,840
$1,094
$4,951
$1,274
Fixed costs/mt
$314
$220
$332
$223
$672
$242
$1,773
$276
$426
$180
$582
$164
$612
$299
Total c
ost n
et revenu
e/day
$394
$687
$538
$513
$1,785
$1,374
-$1,175
$761
$2,144
$2,210
$1,562
$1,964
-$1,903
$1,806
Total c
ost n
et revenu
e/mt
$107
$134
$22
$111
$418
$232
-$986
$125
$501
$393
$379
$386
$231
$362
DATA ANALYSIS 177 CATCHER VESSEL REPORT

Table 14
.7: Califo
rnia
mean and median rates for West Coast
op
erations. Mean and median revenu
e, costs, and net revenu
e ($) per day and per metric
ton (m
t)
harvested.
( N
2009
= 43, N
2010
= 43, N
2012
= 43, N
2013
= 41, N
2014
= 39, N
2015
= 28).
Descrip
tion
2009
2010
2011
2012
2013
2014
2015
Mean
Median
Mean
Median
Mean
Median
Mean
Median
Mean
Median
Mean
Median
Mean
Median
Revenu
e/day
$4,250
$3,420
$4,799
$4,222
$7,162
$6,691
$6,607
$5,985
$6,329
$5,683
$6,463
$6,387
$5,717
$5,206
Revenu
e/mt
$1,945
$1,411
$2,067
$1,373
$2,796
$1,735
$3,235
$2,224
$3,027
$2,393
$3,538
$2,198
$2,682
$1,735
Varia
ble costs/day
$2,627
$2,594
$2,814
$2,583
$4,166
$3,593
$3,941
$3,323
$3,829
$3,474
$4,034
$3,719
$4,009
$3,909
Varia
ble costs/mt
$1,676
$877
$1,174
$882
$2,365
$1,029
$2,200
$1,215
$3,933
$1,293
$2,683
$1,382
$2,172
$1,242
Varia
ble cost
net r
evenue/d
ay
$1,622
$1,461
$1,985
$1,392
$2,996
$2,616
$2,667
$2,311
$2,500
$2,600
$2,430
$2,566
$1,708
$1,840
Varia
ble cost
net r
evenue/m
t $270
$546
$894
$545
$431
$769
$1,034
$769
-$906
$869
$855
$771
$510
$706
Fixed costs/day
$1,084
$915
$1,032
$814
$15,217
$1,300
$3,444
$1,592
$1,543
$924
$2,193
$868
$1,111
$932
Fixed costs/mt
$720
$448
$443
$310
$13,545
$471
$2,440
$773
$1,214
$443
$9,822
$347
$610
$345
Total c
ost n
et revenu
e/day
$538
$249
$953
$491
-$12,222
$1,286
-$777
$723
$957
$1,243
$237
$1,527
$597
$1,092
Total c
ost n
et revenu
e/mt
-$451
$82
$451
$205
-$13,114
$431
-$1,405
$252
-$2,120
$409
-$8,967
$460
-$100
$376
DATA ANALYSIS 178 CATCHER VESSEL REPORT

Cost Disaggregation
In order to conduct economic analyses of specific fisheries it is important to have costs broken out by fishery.
However, vessels participating in multiple fisheries incur costs that are aggregated across fisheries. These are
called joint costs in the economics and accounting literature. They may include fixed costs ( e.g. , a new engine),
or variable costs ( e.g. , fuel). The former are joined by the nature of the costs, while the latter are joined due to
observational limitations. It is difficult to assign fixed costs to a particular fishery because the level of the cost
does not vary with vessel participation (at least over the short run).
Some variable costs can be tracked by fishery, but would be costly to do so. For example, although a vessel could
theoretically set up a system to track fuel expenditures by fishery, doing so is rare among the EDC catcher vessels.
Moreover, some types of fuel use are inherently (by their nature) difficult to allocate, even if they are tracked. An
example is a vessel that fishes both on the West Coast and in Alaska. It is not obvious what proportion of the fuel
consumed while steaming between the fisheries should be allocated to the West Coast.
There are four methods available for cost disaggregation: 1) disaggregation by weight of shoreside landings and
at-sea deliveries; 2) disaggregation by value of shoreside landings and at-sea deliveries; 3) disaggregation by days
at sea; and, 4) disaggregation by a combination of the other three methods by cost category (“mixed method”).
The body of this report uses the “mixed method” for all cost disaggregation.
Use of these methods requires data from various sources. The total weight and ex-vessel revenue from shoreside
landings are obtained from fish ticket data. The total weight of at-sea deliveries is obtained from A-SHOP data,
and the ex-vessel revenue from at-sea deliveries in obtained from EDC data. The days at sea are also obtained
from EDC data. Landings and days at sea are allocated to specific fisheries using the methods described in Section
3: Vessel Participation on the West Coast and in Alaska.
Alaska landings and revenues obtained from EDC data were appended to the information extracted from the West
Coast fish ticket data. This was only done for operators who also operated the vessel on the West Coast. If a
vessel only participated in Alaska fisheries, the data were excluded from the analyses. If a vessel fished in Alaska,
but the operator of the vessel was different from the operator on the West Coast, the Alaska portion was also
excluded.
If the vessel was operated by more than one company during the fiscal year, the range of dates that are used
to pull the fish ticket records is adjusted. There are two cases when this would occur: the vessel was leased to
a different operator, or the vessel was sold mid-year to another company. In cases where the vessel was sold
mid-year, information from the Permit Office must be obtained to determine when the vessel was transferred to a
new company. Although both the Coast Guard and the Permit Office track vessel ownership information, we use
179

the Permit Office data as the authoritative source for this information. When the vessel transfers ownership, a
new record is made in the Permit Office database and so the dates of operation of the multiple companies can
be determined and used as the range of dates for pulling the fish ticket records. Occasionally, the paperwork for
vessel sales lags with the change in operation, additional information provided by the participant on the form or
other communications is used to adjust the fiscal year used to calculate total revenue to best correspond with
the information provided on the form. If the vessel was leased by the owner of the vessel, then the lease dates
provided on the EDC form are combined with the fiscal year data to pull the fish ticket records.
Once the total revenues from shoreside landings is calculated, it is then added to the other revenue categories
provided on the forms to generate the total revenue. Landings of species associated with zero revenue were
excluded entirely from the cost disaggregation analyses.
Listed below are the variables used to disaggregate each cost category for the “mixed" method:
• Costs were disaggregated using ex-vessel revenue for the following cost categories:
– Capitalized expenditures
– Crew wages
– Captain wages
– Travel
– Fishery association dues
– Fees
– Vessel and on-board equipment.
• Costs were disaggregated using at-sea deliveries and shoreside landings weight for the following cost categories:
– Bait (only aggregated to non-trawl fisheries)
– Offload fees
– Trucking expenses
– Fishing gear.
• Costs were disaggregated using days at sea for the following cost categories:
– Food
– Fuel
– Ice
– Insurance
– Other supplies
– Communications
– Lease of the vessel
– Moorage.
APPENDICES 180 CATCHER VESSEL REPORT

To understand the potential implications of the assumptions associated with the four methods of cost disaggregation,
the output of the different methods were examined by looking at the effect on average total cost net revenue on the
West Coast. Total cost net revenue by cost disaggregation type are presented in Tables A.1 (cost disaggregation
using ex-vessel revenue), Table A.2 (cost disaggregation using at-sea deliveries and shoreside landings),Table A.3
(cost disaggregation using days at sea) and A.4 (cost disaggregation using “mixed method").
Using landings and delivery weight resulted in allocating the largest variable and fixed costs to the West Coast
than any other method and therefore, the lowest total cost net revenue. The days at sea method resulted in the
highest total cost net revenue. Although the different methods resulted in different allocations of costs, Figure 79
shows that there were no major differences between the methods.
Table A.1: Net revenue using ex-vessel revenue for cost disaggregation. Total revenue, variable costs, variable cost
net revenue, fixed costs, and total cost net revenue (thousands of $) for all participation in the West Coast groundfish trawl
catch share program using ex-vessel revenue to disaggregate costs from other fisheries (N = number of EDC vessels with
non-zero, non-NA responses).
2009 2010 2011 2012 2013 2014 2015
Mean N Mean N Mean N Mean N Mean N Mean N Mean N
Revenue $311 123 $362 122 $587 112 $530 110 $605 109 $629 105 $486 97
(Variable costs) ($179) 123 ($203) 122 ($291) 112 ($312) 110 ($337) 109 ($366) 105 ($276) 97
Variable cost net
revenue
$132 123 $159 122 $295 112 $218 110 $268 109 $263 105 $210 97
(Fixed costs) ($110) 123 ($110) 122 ($155) 112 ($182) 110 ($135) 109 ($141) 105 ($135) 97
Total cost net
revenue
$22 123 $49 122 $140 112 $37 110 $133 109 $122 105 $75 97
APPENDICES 181 CATCHER VESSEL REPORT

Table A.2: Net revenue using at-sea deliveries and shoreside landings for cost disaggregation. Total revenue, variable
costs, variable cost net revenue, fixed costs, and total cost net revenue (thousands of $) for all participation in the West
Coast groundfish trawl catch share program using at-sea deliveries and shoreside landings to disaggregate costs from other
fisheries (N = number of EDC vessels with non-zero, non-NA responses).
2009 2010 2011 2012 2013 2014 2015
Mean N Mean N Mean N Mean N Mean N Mean N Mean N
Revenue $311 123 $362 122 $587 112 $530 110 $605 109 $629 105 $486 97
(Variable costs) ($200) 123 ($220) 122 ($309) 112 ($328) 110 ($366) 109 ($386) 105 ($284) 97
Variable cost net
revenue
$112 123 $141 122 $278 112 $202 110 $239 109 $242 105 $202 97
(Fixed costs) ($137) 123 ($132) 122 ($184) 112 ($204) 110 ($162) 109 ($162) 105 ($146) 97
Total cost net
revenue
-$25 123 $10 122 $94 112 -$2 110 $77 109 $80 105 $55 97
Table A.3: Net revenue using days at sea for cost disaggregation. Total revenue, variable costs, variable cost net
revenue, fixed costs, and total cost net revenue (thousands of $) for all participation in the West Coast groundfish trawl
catch share program using days at sea to disaggregate costs from other fisheries (N = number of EDC vessels with non-zero,
non-NA responses).
2009 2010 2011 2012 2013 2014 2015
Mean N Mean N Mean N Mean N Mean N Mean N Mean N
Revenue $311 123 $362 122 $587 112 $530 110 $605 109 $629 105 $486 97
(Variable costs) ($180) 123 ($200) 122 ($285) 112 ($305) 110 ($349) 109 ($362) 105 ($266) 97
Variable cost net
revenue
$131 123 $161 122 $302 112 $225 110 $256 109 $266 105 $219 97
(Fixed costs) ($107) 123 ($111) 122 ($148) 112 ($181) 110 ($134) 109 ($140) 105 ($136) 97
Total cost net
revenue
$24 123 $50 122 $154 112 $44 110 $121 109 $127 105 $84 97
APPENDICES 182 CATCHER VESSEL REPORT
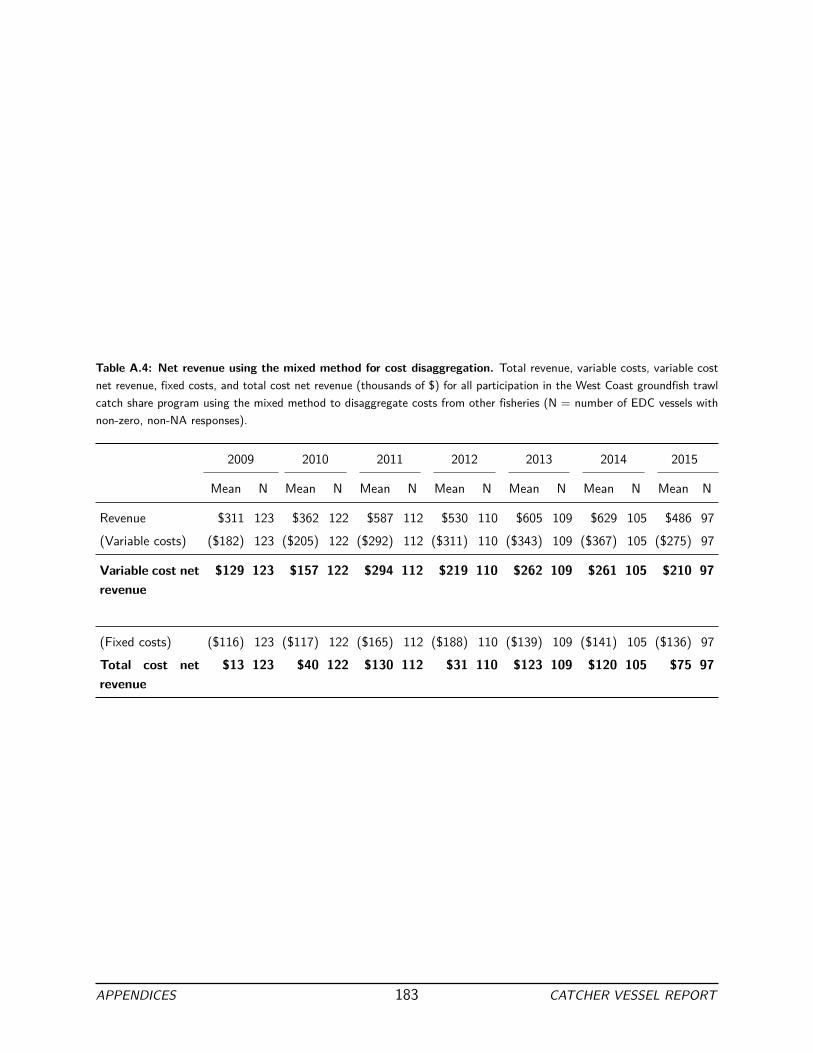
Table A.4: Net revenue using the mixed method for cost disaggregation. Total revenue, variable costs, variable cost
net revenue, fixed costs, and total cost net revenue (thousands of $) for all participation in the West Coast groundfish trawl
catch share program using the mixed method to disaggregate costs from other fisheries (N = number of EDC vessels with
non-zero, non-NA responses).
2009 2010 2011 2012 2013 2014 2015
Mean N Mean N Mean N Mean N Mean N Mean N Mean N
Revenue $311 123 $362 122 $587 112 $530 110 $605 109 $629 105 $486 97
(Variable costs) ($182) 123 ($205) 122 ($292) 112 ($311) 110 ($343) 109 ($367) 105 ($275) 97
Variable cost net
revenue
$129 123 $157 122 $294 112 $219 110 $262 109 $261 105 $210 97
(Fixed costs) ($116) 123 ($117) 122 ($165) 112 ($188) 110 ($139) 109 ($141) 105 ($136) 97
Total cost net
revenue
$13 123 $40 122 $130 112 $31 110 $123 109 $120 105 $75 97
APPENDICES 183 CATCHER VESSEL REPORT

Variable costs Fixed costs Total cost net revenue
20092010
20112012
20132014
2015
Day
s at
sea
Ex−
vess
el r
even
ue
Land
ings
and
del
iver
y w
eigh
t
Mix
ed: r
even
ue, w
eigh
t, da
ys
Day
s at
sea
Ex−
vess
el r
even
ue
Land
ings
and
del
iver
y w
eigh
t
Mix
ed: r
even
ue, w
eigh
t, da
ys
Day
s at
sea
Ex−
vess
el r
even
ue
Land
ings
and
del
iver
y w
eigh
t
Mix
ed: r
even
ue, w
eigh
t, da
ys
0.00.10.20.30.4
0.00.10.20.30.4
0.00.10.20.30.4
0.00.10.20.30.4
0.00.10.20.30.4
0.00.10.20.30.4
0.00.10.20.30.4
Ave
rage
ves
sel (
mill
ions
of $
)
Variable costs Fixed costs Total cost net revenue
Figure 79: Sensitivity analysis for cost disaggregation methods. Sensitivity analysis of cost disagreggation methods on
total cost net revenue for vessel operations in the catch share program (whiting and non-whiting groundfish). The three
methods are disaggregation by landings and delivery weight, days at sea, ex-vessel revenue, and “mixed" where costs are
disaggregated by one of the three methods depending on the type of cost.
APPENDICES 184 CATCHER VESSEL REPORT