economic development plan - delaware county, pennsylvania
TRANSCRIPT

Delaware County 2035 The Land | The People | The Places
Economic Development Plan Innovate | Diversify | Adapt
MARCH 2017


Economic Development Plan March 2017
Prepared By:
Delaware County Planning Department Court House and Government Center
201 West Front Street Media, PA 19063


[INSERT COUNTY COUNCIL RESOLUTION]


Economic Development Plan
i
Acknowledgements
Delaware County Council Mario Civera, Jr., Chairman Colleen P. Morrone, Vice Chairman John P. McBlain David J. White Michael F. Culp
County Executive Marianne Grace
Delaware County Planning Commission William C. Payne, Chairman Thomas J. Judge, Vice Chairman Kenneth J. Zitarelli, Secretary Kathy A. Bogosian Lorraine Bradshaw Cecile M. Charlton Patrick L. Patterson Christine Valerio
Planning Director Linda F. Hill
Delaware County Planning Department Justin Dula, AICP, Manager Samuel Haber, Principal Planner Rebecca Ross, AICP, Principal Planner Ryan T. Judge, Senior Planner


Economic Development Plan Table of Contents
iii
Table of Contents Chapter 1: Background ....................................................................................................... 1-1
Introduction .......................................................................................................................................... 1-1 Delaware County 2035 .................................................................................................................... 1-2 Growing from Within: A Blueprint for Growth in Delaware County ................................................ 1-4 Economic Development Plan ........................................................................................................... 1-5
Goals ..................................................................................................................................................... 1-7 Delaware County Profile ....................................................................................................................... 1-7 Economic Development Planning Efforts ........................................................................................... 1-23
Delaware County & Municipal Efforts ........................................................................................... 1-23 Economic Development Planning in the 21st Century .................................................................. 1-25
Looking Ahead .................................................................................................................................... 1-26
Chapter 2: Place-Based Development ................................................................................. 2-1 Overview ............................................................................................................................................... 2-1 Countywide ........................................................................................................................................... 2-1
Actions ............................................................................................................................................. 2-2 Mature Neighborhoods ........................................................................................................................ 2-3
Current Conditions .......................................................................................................................... 2-3 Outlook ............................................................................................................................................ 2-4 Actions ............................................................................................................................................. 2-5
Growing Suburbs .................................................................................................................................. 2-7 Current Conditions .......................................................................................................................... 2-7 Outlook ............................................................................................................................................ 2-8 Actions ............................................................................................................................................. 2-9
Central Places ..................................................................................................................................... 2-10 Current Conditions ........................................................................................................................ 2-10 Outlook .......................................................................................................................................... 2-12 Actions ........................................................................................................................................... 2-13
Activity Corridors ................................................................................................................................ 2-14 Current Conditions ........................................................................................................................ 2-14 Outlook .......................................................................................................................................... 2-15 Actions ........................................................................................................................................... 2-16
Chapter 3: Implementation Plan ......................................................................................... 3-1 Overview ............................................................................................................................................... 3-1
How the County Should Use This Plan ............................................................................................ 3-1 How Municipalities Should Use This Plan ........................................................................................ 3-1
Action Plan ............................................................................................................................................ 3-1 Roles and Responsibilities .................................................................................................................... 3-4
Municipalities .................................................................................................................................. 3-4 Delaware County ............................................................................................................................. 3-4
Implementation Partners and Support ................................................................................................. 3-5 Commonwealth of Pennsylvania ..................................................................................................... 3-5 Federal ............................................................................................................................................. 3-6 Institutions, Organizations, Businesses, and Utilities ...................................................................... 3-7

Economic Development Plan Table of Contents
iv
References ......................................................................................................................... R-1
Glossary of Acronyms ................................................................................. A-1
Glossary of Terms ....................................................................................... B-1
Data Sources for Mapping ........................................................................... C-1
Municipal Population Figures ...................................................................... D-1
Proposed Development in Delaware County ............................................... E-1
Major Employers ........................................................................................ F-1
List of Maps Map 1-1: Delaware County ........................................................................................................................ 1-1 Map 1-2: Character Areas and Central Places ......................................................................................... 1-10 Map 1-3: Total Population Change (1980-2010) ..................................................................................... 1-12 Map 1-4: Employment Density ................................................................................................................ 1-19 Map 1-5: Public Transit and Road Network ............................................................................................. 1-20 Map 1-6: Freight Assets ........................................................................................................................... 1-21
List of Tables Table 1-1: Municipalities with the Greatest Population Change ............................................................. 1-12 Table 1-2: Proposed Development in Delaware County .......................................................................... 1-13 Table 1-3: Delaware County - Race and Hispanic Origin .......................................................................... 1-16 Table 3-1: Action Plan ................................................................................................................................ 3-1 Table D-1: U.S. Census Population Figures for Delaware County Municipalities ..................................... D-1 Table E-1: Proposed Residential Units in Delaware County ...................................................................... E-1 Table E-2: Proposed Non-Residential Development in Delaware County ................................................. E-3
List of Charts Chart 1-1: Population by County .............................................................................................................. 1-11 Chart 1-2: Median Household Income ..................................................................................................... 1-14 Chart 1-3: Age Distribution of Delaware County ..................................................................................... 1-15 Chart 1-4: Educational Attainment .......................................................................................................... 1-17 Chart 1-5: Inflow/Outflow of Workers ..................................................................................................... 1-17 Chart 1-6: Delaware County Employment by Industry ............................................................................ 1-18


Economic Development Plan Chapter 1: Background
1-1
…
1 Background


Economic Development Plan Chapter 1: Background
1-1
Chapter 1: Background
INTRODUCTION The Economic Development Plan is a long-range strategy to build on the unique places of Delaware County by recognizing their needs and opportunities. It identifies and compiles information on trends in the economy at the local, regional, and national levels and connects these trends with the place types identified in the community framework of the County’s comprehensive plan, Delaware County 2035. This place-based approach is utilized because economic trends are interwoven with geography and the built environment. The plan provides a strategy for communities to build on their unique character while capitalizing on and adapting to changing economic trends. Delaware County is located in the southeast corner of Pennsylvania, immediately west of the City of Philadelphia. It is bordered by Chester, Montgomery, and Philadelphia Counties in Pennsylvania; Gloucester County, New Jersey; and New Castle County, Delaware (See Map 1-1). The five-county region, which includes Delaware, Bucks, Montgomery, Chester, and Philadelphia Counties, has a combined population of more than 3.8 million people. According to the 2010 Census, Delaware County is home to 558,979 people. It has a land area of 191 square miles, making it the second smallest county in the region, after Philadelphia County.
Map 1-1: Delaware County
Sources for all maps throughout this document can be found in the Appendix C: Map Data Sources

Economic Development Plan Chapter 1: Background
1-2
Delaware County features a strong and diverse economy that has undergone significant change over the last century. The County established itself primarily around the City of Philadelphia to the east and the agricultural uses that previously dominated the landscape through the first half of the twentieth century. The Delaware River was also a major influence in the growth of the County since its earliest settlements. After World War II, and through the second half of the twentieth century, the County experienced tremendous growth, particularly moving toward western Delaware County. Agricultural uses declined and the County’s economy shifted towards a manufacturing-based economy. As highway and transit expanded in the twentieth century, workers were able to live farther from their places of employment, leading to growth in suburbs dominated by residential uses. Today, the County’s economy is increasingly centered on the healthcare and service sectors while communities continue to compete to attract new residents. In response to today’s rapidly changing economy, the County developed two key planning documents: Growing from Within: A Blueprint for Growth in Delaware County, the County’s economic development strategy, and Delaware County 2035, the County’s comprehensive plan.
DELAWARE COUNTY 2035 Delaware County 2035 consists of a central Land Use Policy Framework Plan and number of related and interconnected, but more detailed, component plans. The Land Use Policy Framework Plan establishes an overall vision for the future of the County through the year 2035. It also sets policies for development, redevelopment, conservation, and economic initiatives. The plan provides the County’s 49 municipalities with a framework for the strategic use of public resources to improve the quality of life for all its residents. In accordance with the Pennsylvania Municipalities Planning Code (MPC), the plan “establishes objectives of the municipality concerning its future development, including, but not limited to, the location, character, and timing of future developments.” Some of the component plans – addressing additional planning-related elements within the County – have already been developed, such as the County Open Space, Recreation, and Greenway Plan; more are under development. Each component plan will use the same framework and build off of the land use policies laid out in the Framework Plan. Individual municipal plans serve as a basis for these policies. This Economic Development Plan will serve as the economic component plan of Delaware County 2035. The County Profile section of the Framework Plan is organized by the key themes of Delaware County:
The Land:
• A Range of Housing Options
• Natural Resources Protection
• Quality Community Services and Facilities o Health Care o Higher Education
• Utilities
The People
• Demographics o Aging in Place o Race, Ethnicity, and Diversity
• Energy
• Employment

Economic Development Plan Chapter 1: Background
1-3
The Places Delaware County 2035 recognizes the importance of supporting growth in the County through the celebration of community character - that is, the sum of essential qualities that makes each neighborhood and municipality a distinct place. The Delaware County 2035 community framework organized the diverse place types of the County into four Character Area types, which are broad areas with similar development patterns and characteristics, and four types of Central Places, which are community focal points that reinforce or establish a sense of place and character. The planning areas (or community framework) (see the Character Areas section for more detailed description of each) identified in the Framework Plan are:
Character Areas
• Mature Neighborhoods
• Growing Suburbs
• Open Space
• Greenways
Central Places
• Urbanized Center
• Town Center
• Neighborhood Center
• Activity Corridor The Land Use Framework chapter of the Framework Plan details prioritized objectives, policies, and actions that County and municipal decision makers can take to address their common issues and challenges. Recommendations are presented for each of the eight place types listed above. The plan also identifies place-making themes that were derived from the themes represented in the County’s municipal comprehensive plans. They address general goals for improvement across the County. Themes related to economic development include:
• Sustainable Development Patterns – development that meets the needs of the present without compromising the ability of future generations to meet their own needs. This also includes development which can be adapted for future uses and focuses on development around existing centers.
• Multimodal Transportation – a connected transportation system that supports pedestrians, public transit, bicycles, and motor vehicles.
• Community Investment and Revitalization – focusing investments on existing communities and infrastructure within each municipality; recognizing that our existing communities have provided valuable places to live, work, and shop for generations and should be valued for their importance within the region.
• Multi-municipal Partnerships – municipal partnerships on a variety of projects at a variety of levels from informal information sharing to formalized joint contracting. Working with neighboring communities allows for efficiencies of scale and coordinated development across municipal lines.
• Quality Community Facilities – municipalities strive to maintain strong community facilities, which include both publicly and privately maintained facilities, and to make use of existing facilities and services in developed areas where possible before expanding into areas that do not currently have those facilities provided. Adopting a “fix-it-first” policy conserves resources and ensures that the pace of development does exceed the ability of the community to support it.

Economic Development Plan Chapter 1: Background
1-4
• Historic and Natural Resource Protection – preserving historic and natural assets within the County’s landscape that have recreational, visual, cultural, environmental, or economic benefits.
• Community Character – planning for new construction within the context of existing landscapes and development while recognizing that with the growth of our region new development will in fact change the landscape of the County. New development and redevelopment should fit in with the existing or desired character of the community.
• Regional Economic Development – promoting long term and sustainable economic goals that help boost Delaware County’s position in a global future.
GROWING FROM WITHIN: A BLUEPRINT FOR GROWTH IN DELAWARE COUNTY Growing from Within: A Blueprint for Growth in Delaware County is the County’s 10-year economic development strategy. It establishes a strategic action plan for spurring economic growth by maximizing the current assets and opportunities in the County. The process involved detailed research and analysis and a stakeholder input process that included municipal surveys and focus group sessions to obtain input from the local business community and municipal representatives.
Emerging Themes and Opportunities The strategic plan identified three major themes and accompanying opportunities that emerged from research and stakeholder input. These serve as the “building blocks” for the County’s ten-year economic development strategy.
Strong Community Wellbeing
• A growing, diverse population
• Higher-than-average incomes
• Higher-than-average spending power
• Shortage of retail amenities
• A variety of housing price-points to accommodate all income levels
• Quality schools
• A strong, educated workforce
• Arts & culture and entertainment & leisure amenities
A Healthy, Diverse Economy
• A diverse industry mix
• Strong economic base and local attractiveness
• Innovation clusters and cluster opportunities
• Strong innovation partners
• A significant outflow of knowledge workers
Optimal Location and Access
• A robust transportation network
• Waterfront capacity

Economic Development Plan Chapter 1: Background
1-5
Strategic Planning Objectives Six strategic planning objectives were developed based on the themes and opportunities identified above. The objectives include actions intended to, “focus the County’s efforts on specific action items that will encourage County revitalization, brownfield redevelopment, workforce development, the growth of key industries, and improvements to the existing delivery system for County economic development services.” (Growing from Within, Pg. 53)
Strategic Planning Objectives 1. Develop a brand and marketing edge to maintain a competitive advantage 2. Develop countywide business retention and recruitment strategies 3. Establish commercial improvement zones to focus place-based investment 4. Repurpose vacant and underutilized properties and maximize Delaware Riverfront opportunities 5. Enhance global trade opportunities 6. Develop concurrent local strategies
ECONOMIC DEVELOPMENT PLAN As stated above, this document is a component plan of Delaware County 2035 and, as such, follows the framework that builds off the land use policies established in the Framework Plan. It also follows the economic growth strategy identified in Growing from Within. The intent of the Economic Development Component Plan is to serve as a guide and resource for countywide, multi-municipal, and municipal economic development planning efforts. It examines the policies and trends identified in the Land Use Policy Framework Plan with specific regard to economic development in the County. It is important to note that much of the plan implementation, particularly as related to planning and zoning, remains the responsibility of municipal officials. The County’s powers are limited to suggesting refinements to local actions that reflect the common issues, goals, and strategies shared by the municipalities. The Economic Development Component Plan serves to link the long-range policies of Delaware County 2035 and the County’s economic development strategy, Growing from Within. As the County’s comprehensive plan, Delaware County 2035 addresses a range of issues facing the County, including economic development. Growing from Within highlights immediate needs and opportunities specific to economic development, including improved business recruitment and retention strategies, workforce development, and place-based investment. This plan primarily focuses on developing a long-range, place-based investment strategy for the County. The research and analysis conducted for Growing from Within, in conjunction with the framework established in the Framework Plan, informed the goals and objectives established throughout this plan. To organize all of this information, this plan utilizes the organizational strategy of Character Areas and Central Places that was established in the Framework Plan.

Economic Development Plan Chapter 1: Background
1-6
Connection with Delaware County 2035 As a component of Delaware County 2035, it is important to consider how the Economic Development Plan correlates with and reinforces the County land use strategy established by the Framework Plan. Though not always identified directly, the place-making themes from the Framework Plan are an important underlying factor in much of the Economic Development Plan. The place types identified above, on the other hand, are utilized explicitly throughout this plan to frame the discussion of economic development within the context of Character Areas and Central Places. Using the place types to discuss economic development allows for an informed conversation regarding what is preferred and appropriate for the desired community characters identified in the Framework Plan The following are the countywide objectives from the Framework Plan which were identified as a result of the planning process for the comprehensive plan. The intent of this plan is to build upon the objectives established in that document with specific regard to economic development. As such, the Framework Plan objectives inform the specific goals, objectives, and actions of this Economic Development Plan.
Delaware County 2035: Land Use Policy Framework Plan Objectives LU 1: Create desirable places to live by ensuring that land resources are allocated for uses that will achieve the following:
• Accommodate and enhance established community character and planned growth;
• Support viable transportation and infrastructure systems;
• Include a range of housing options;
• Protect natural and historic resources;
• And provide for adequate community facilities.
LU 2: Encourage compatible land use, redevelopment, and revitalization that will protect the stability and enhance the character of Mature Neighborhoods.
LU 3: Encourage context-sensitive design and sustainable development and redevelopment.
LU 4: Preserve, connect, and expand greenways and open space to protect natural and historic resources, and promote healthy lifestyles.
LU 5: Improve land use compatibility and accommodate population growth, institutions, services, and culture to strengthen economic competitiveness. One series of policies and actions is presented for Urbanized Center, Town Center, and Neighborhood Center since they share a common objective.
LU 6: Promote economic redevelopment and development, while preserving community character and improving accessibility. (Delaware County Planning Department 2013)

Economic Development Plan Chapter 1: Background
1-7
GOALS As part of the planning process for the Economic Development Plan, three overarching goals were identified to guide economic development planning efforts in the County. They are the result of research and analysis of existing economic development needs and opportunities. They also take into account the objectives from the Framework Plan, along with their respective policies and actions, and the strategy and objectives detailed in Growing from Within. The goals of the Economic Development Plan are:
Goal 1: Innovate Innovate business recruitment and retention strategies to attract new employers.
Goal 2: Diversify Diversify the built-environment to attract a range of people and foster new businesses.
Goal 3: Adapt Adapt to and anticipate changing markets and needs of businesses.
The three goals identified in this plan stress an awareness that the economy is rapidly changing and the County needs to be willing to pivot with the market. They signify the need for a continued approach that adapts to the changing needs of the market and businesses to create sustained economic development in the 21st century. Thus, they serve as the basis for both discussion and recommendations made in this plan. The objectives and actions in the plan often relate to more than one, if not all, of the three goals. Therefore, objectives and actions are organized by Character Area, rather than by goal, and reflect the specific needs and opportunities discussed for each Character Area.
DELAWARE COUNTY PROFILE Current conditions in Delaware County provide the background and necessary context to understand the local economy and opportunities that may be available to advance economic development. The Delaware County Profile identifies the key assets that have contributed to the current economy of the County and utilizes the land use framework of Central Places and Character Areas of Delaware County 2035 to advance the goals, objectives and recommendations for economic development. An analysis of a demographic, social and economic indicators provides insight into current and future trends that will impact County economic development, and a review of County economic development initiatives and programs preceding this plan provide an understanding of what has been accomplished and what may beneficial for continued vitality and future growth. There are several key assets that influenced Delaware County’s historical development patterns and economic development. Perhaps the most important is the Delaware river, which has been a significant resource since the time of Native American settlement. Today, the river serves as a key port area for industry located along the riverfront. Other assets include Philadelphia International Airport, Interstates 95 and 476 (commonly referred to as the Blue Route), and Southeastern Pennsylvania Transportation Authority (SEPTA) surface routes, light rail, and regional rail. Owing to the unique mix of these development factors found in different parts of the County, the character of Delaware County’s communities varies widely.

Economic Development Plan Chapter 1: Background
1-8
As discussed above, the Framework Plan organizes the County into distinct planning areas with common characteristics. The community framework planning areas (Character Areas and Central Places) are used to meaningfully organize the long range planning policies. These area classifications are also extremely useful in discussing the history of growth and development patterns as well as economic development issues. Due to the common features of different Character Areas, they typically face similar economic development issues. It is important to note that these areas were designed to be self-identified by municipalities and those listed in the plan are not inclusive. The following are the Character Areas and Central Places, as defined in the Framework Plan:
Character Areas Mature Neighborhoods
• Underlying areas that are established and have realized most of their population, employment growth, and infrastructure build-out.
• Some are stable and thriving with affordable housing, access to transit, and a strong community identity.
• Some are experiencing population losses and deteriorating infrastructure systems.
• Over time, the prevalence of Mature Neighborhoods is moving toward the western boundary of the County.
• Revitalization opportunities exist in a variety of scales and locations.
Growing Suburbs
• Underlying areas that have undeveloped or agricultural land remaining and are experiencing or are forecast to experience population growth.
• Mostly residential with primarily single-family detached housing.
• Typically located in western Delaware County.
Open Space
• Underlying areas that either remain in a natural state or are used for agriculture; free from intensive development for residential, commercial, industrial, or institutional uses.
• Open space can be publicly or privately owned and may include: forest land, water bodies, wetlands, steep slopes, undeveloped coastal lands, cemeteries, parks, preserves, golf courses, abandoned railroad beds, and utility property.
Greenways
• A linear system of connected natural and man-made elements that function together for public benefit.
• As vegetated buffers, greenways can protect natural habitats, improve water quality, and reduce the impacts of flooding in floodplains.
• Proximity and access to Greenways has an impact on quality of life.
Central Places Urbanized Center
• A medium-to-large scale community consisting of a multiple-street central business district surrounded by mature residential neighborhoods.
• Land uses are mixed and consist of a range of scales and density.
• Well-connected street grid network, sidewalks, and mass transit.
• Transit-oriented developments may exist around regional rail lines and bus ways. Examples: 69th Street (Upper Darby/Millbourne), Chester City, Darby, Lansdowne, Media, Wayne

Economic Development Plan Chapter 1: Background
1-9
Town Center
• A small-scale community consisting of one main street or town square surrounded by neighborhoods.
• Land uses are mixed and mostly consist of small-scale, low-intensity businesses, services, and cultural resources that serve the community.
• Residential fabric typically consists of medium-size blocks with a range of building types, including apartments and single-family residences, promoting a walkable environment.
• Transit-oriented developments may exist around regional rail lines and bus ways. Examples: Boothwyn, Concord Ville, Havertown, Marcus Hook, Morton, Newtown Square, Parkside, Ridley Park, Swarthmore
Neighborhood Center
• An area at an intersection of roads and/or commuter rail/bus lines surrounded by neighborhoods.
• Typically has definable focal point and/or a mix of commercial, retail or civic uses.
• Often a walkable destination.
• Has a unique history or sense of a community within the larger neighborhood setting. Examples: Aldan, Aronmink, Aston Mills, Booths Corner, Chadds Ford, Collingdale, Gradyville, Secane, Sharon Hill, University Crossing (Chester), Wallingford
Activity Corridor
• A linear-shaped place flanking major transportation corridors or highway interchanges with intense development and where public transport facilities, mixed land uses, and people are centrally focused.
• Varied width, density, and design depending on the local context and underlying character.
• A variety of retail, social, and employment opportunities integrated with high density residential functions.
• Although some are auto-centric, Activity Corridors can become more walkable, connect to neighborhoods, and include attractive streetscapes. Examples: Highway Routes 1, 3, 13, 202, 252, 291, 320, 352, 452, and 491; Trolley Lines 101, 102, 11, and 13; Norristown High Speed Line
The two underlying Character Areas, Mature Neighborhoods and Growing Suburbs, have distinct differences that significantly affect the approach to economic development. Mature Neighborhoods (concentrated in the eastern and southern portions of the County) generally have smaller retail spaces set in more walkable neighborhoods, but they often have relatively high vacancy rates. Growing Suburbs (typically the western and northern portions of the County), on the other hand, typically have lower vacancy rates and mostly newer commercial development, but they are not generally walkable. The Central Places and Activity Corridors of the County tend to draw many features from the underlying Character Area.

Economic Development Plan Chapter 1: Background
1-10
Map 1-2: Character Areas and Central Places
Population Delaware County’s population peaked in 1970 at 603,465 and declined to 550,864 people in 2000. The County’s population increased to 558,979 in 2010 and is expected to experience slight growth to approximately 585,000 in the coming decades. The City of Philadelphia experienced its first population growth since 1950 in 2010. This is largely attributed to the desire of people to live in areas that are more walkable and transit accessible. On the contrary, Bucks, Chester, and Montgomery Counties have grown consistently since 1950. As shown in Chart 1-1, it is anticipated that Bucks, Chester, and Montgomery Counties’ populations will continue to increase through 2040. This is largely attributed to the amount of undeveloped land available in these areas. Montgomery County surpassed Delaware County in population in 1970, Bucks in the 1990s, and Chester County’s population is expected to exceed Delaware County’s within the next 10-15 years. According to the 2010 U.S. Census, 65.9% of the County’s population over the age of 16 participates in the labor force. This is slightly higher than the region, state, and country.

Economic Development Plan Chapter 1: Background
1-11
Chart 1-1: Population by County 1930-2040
Source: U.S. Census, compiled by DCPD 2016; DVRPC Population Forecasts 2016
Shifting Population 1980-2010 According to the United State Census Bureau, Delaware County’s overall population remained relatively stable between 1980 and 2010. Despite a few minor fluctuations, the population changed from 555,007 (1980) to 558,979 (2010), representing only a 0.2% increase. However, overall Countywide population figures do not reflect that a significant demographic shift in population occurred from the Mature Neighborhoods (eastern and southern municipalities) to the Growing Suburbs (northern, central, and western municipalities) (See Character Areas, p. 1-7). Between 1980 and 2010, most municipalities in the Mature Neighborhoods of the County had population declines in the single-digit percentage points. Swarthmore, Morton, and Millbourne Boroughs were the exceptions, as they had modest gains over 30 years. Chester Township (-31%), Chester City (-26%), Darby Township (-24%), Folcroft Borough (-20%), and Rutledge Borough (-16%) had the most significant percentage of population loss in Delaware County during that time period. The most extreme declines (double-digit) occurred between 1980 and 2000 in places such as Colwyn, Upland, Marcus Hook, Sharon Hill, and Darby Boroughs. Most, but not all, of these municipalities slowed or reversed these trends in the following decade. Refer to Table 1-1 for more information. The Growing Suburb municipalities of Bethel Township (261%), Edgmont Township (183%), Concord Township (168%), Thornbury Township (120%), and Chester Heights Borough (94%) had the most significant percentages of population growth in Delaware County during the period from 1980 to 2010 (See Table 1-1). Concord Township is unusual in that it grew steadily over this entire 30 year period. Others like Edgmont and Chester Heights grew rapidly from 1980 to 2000 (178% and 91%, respectively), but slowed over the last 10 years (1.8%, 2.0%). Bethel, Thornbury, Chadds Ford, Middletown, Aston, and Upper Chichester Townships also had significant 1980s and 90s growth followed by a post–2000 slowdown, but to a lesser extreme.
0
500,000
1,000,000
1,500,000
2,000,000
2,500,000
1930 1940 1950 1960 1970 1980 1990 2000 2010 2020 2030 2040
Delaware County Bucks County Chester County Montgomery County Philadelphia County
Population Forecast

Economic Development Plan Chapter 1: Background
1-12
Table 1-1: Municipalities with the Greatest Population Change 1980 to 2010
Population Losses Population Population Gains Population
Municipality 1980 2010 % Change Municipality 1980 2010
% Change
Chester Township 5,687 3,940 -30.72% Bethel Township 2,438 8,791 260.58%
Chester City 45,794 33,972 -25.82% Edgmont Township 1,410 3,987 182.77%
Darby Township 12,264 9,264 -24.46% Concord Township 6,437 17,231 167.69%
Folcroft Borough 8,231 6,606 -19.74% Thornbury Township 3,653 8,028 119.76%
Rutledge Borough 934 784 -16.06% Chester Heights Borough 1,302 2,531 94.39% Source: US Census, 1980 and 2010
When analyzing the movement of population within the County, percent change in population (by municipality) and the change in number of people should be weighed together. Refer to Appendix E, Municipal Population Figures for Delaware County municipalities, for a complete listing of population data by municipality.
Map 1-3: Total Population Change (1980-2010)

Economic Development Plan Chapter 1: Background
1-13
Current Subdivision and Land Development Activity Records since 2002 indicate that the high level of development activity experienced in Delaware County in the past continues today, although at a more moderate rate compared to the years leading up to 2008. Table 1-2 illustrates the total number of residential units reviewed by the County Planning Department between 2002 and 2015. The table indicates a tremendous number of proposed residential units from 2002 through 2006 before a significant downturn in 2007. Non-residential proposals in Delaware County peaked at over 3.8 million square feet in 2007 but saw a significant downturn in 2009. The decrease in proposals beginning in 2007 is evidence of the economic recession which affected the country between 2008 and 2010. The County has since rebounded, albeit at more moderate levels of development. It should be noted that the numbers presented in this table are for proposed developments reviewed by DCPD, and are not necessarily what has been or will be built. However, they can still serve as an indicator of development activity and trends. The figures also include redevelopment which was proposed on land previously developed.
Table 1-2: Proposed Development in Delaware County 2000 to 2015
Proposed
Year
Residential Units
Non-Residential Square Footage
2002 959 2,401,162
2003 1,413 1,286,956
2004 1,217 1,471,915
2005 2,132 2,635,509
2006 1,183 3,064,621
2007 629 3,876,008
2008 615 3,254,918
2009 343 900,810
2010 1,334 1,187,539
2011 221 1,069,066
2012 1,230 1,354,435
2013 837 717,084
2014 500 1,797,991
2015 712 2,671,058
Total 2002-2009 8,491 18,891,899
Total 2002-2015 13,327 27,689,072
Figures presented reflect proposed (not necessarily constructed) development.
Source: DCPD, 2016
Economic Development Plan Chapter 1: Background
1-14
In the years 2002-2015, Concord Township had the greatest number of both proposed residential units and proposed non-residential square footage in the County. Other Growing Suburbs comprised the remaining top tier of municipalities in terms of residential growth and development during this time period. See Appendix E for a completed list of proposed residential and non-residential development in Delaware County by municipality.
Demographics Delaware County is a developed county projected to experience steady, modest population growth in the coming decades. The County has become more diverse since reaching its population peak in the 1970s, with African-American, Asian, Hispanic, and other racial and ethnic groups comprising a larger percentage of the population. The population is also “aging in place” with long-time residents in older age groups remaining in the County, rather than retiring elsewhere. The County’s levels of educational attainment and median incomes are strong relative to Pennsylvania and the country as a whole, reflecting a workforce qualified to fill the well-paying jobs in the region.
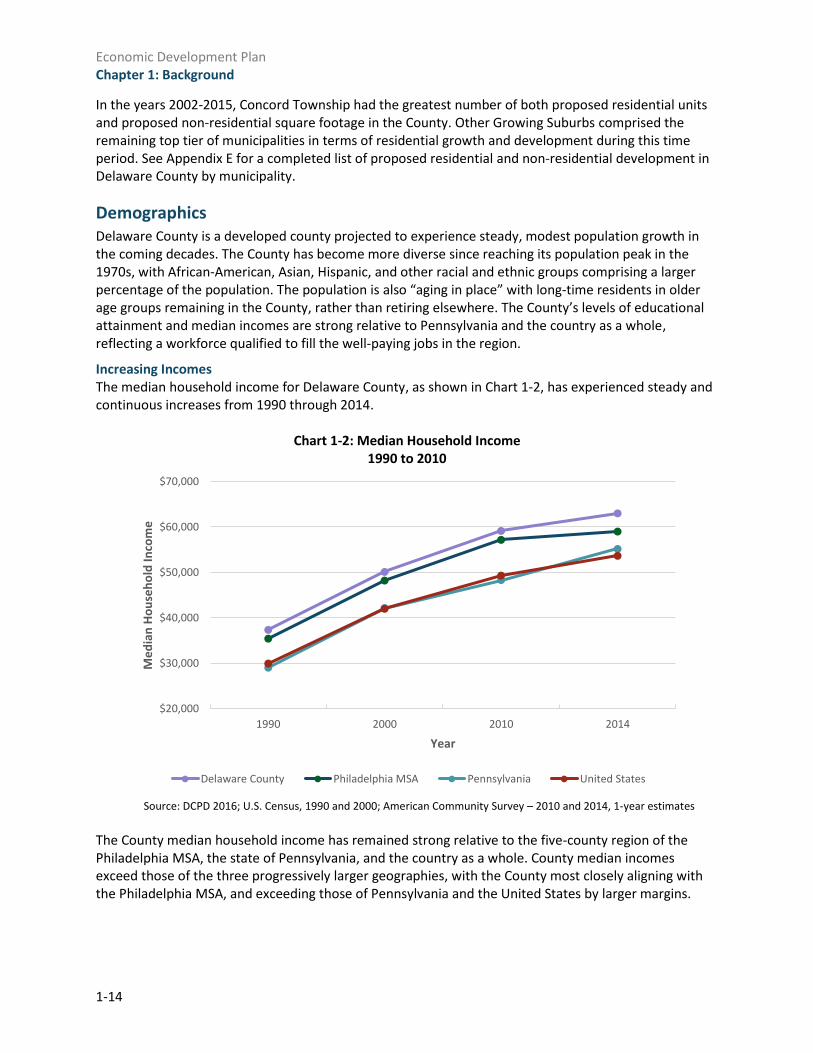
Increasing Incomes The median household income for Delaware County, as shown in Chart 1-2, has experienced steady and continuous increases from 1990 through 2014.
Chart 1-2: Median Household Income 1990 to 2010
Source: DCPD 2016; U.S. Census, 1990 and 2000; American Community Survey – 2010 and 2014, 1-year estimates
The County median household income has remained strong relative to the five-county region of the Philadelphia MSA, the state of Pennsylvania, and the country as a whole. County median incomes exceed those of the three progressively larger geographies, with the County most closely aligning with the Philadelphia MSA, and exceeding those of Pennsylvania and the United States by larger margins.
$20,000
$30,000
$40,000
$50,000
$60,000
$70,000
1990 2000 2010 2014
Me
dia
n H
ou
seh
old
Inco
me
Year
Delaware County Philadelphia MSA Pennsylvania United States

Economic Development Plan Chapter 1: Background
1-15
At the municipal level, median household incomes are the highest in municipalities comprised predominantly of Growing Suburbs in central and western Delaware County, while the Mature Neighborhoods and Urban Centers of older, established townships and boroughs in eastern and southern parts of the County have lower median household incomes. As noted earlier, there is variation in the condition of Mature Neighborhoods and Central Places, and some older neighborhoods and Urban and Town centers maintain high median incomes.
The County’s strong median household income is indicative of its proximity and access to well-paying jobs in the employment centers of Philadelphia and Montgomery Counties, as well as the strong County economic base that provides variety of skilled, well-paying jobs for residents.
Aging Population Delaware County is trending towards an aging population. Chart 1-3 shows that through the 1990s the largest age group as a percentage of total population was the 25-44 year old cohort. Through the 2000’s that percentage declined and as of the 2010 Census and through the 2014 ACS, it was surpassed by the 45-64 year old cohort as the largest age group, while the 25-44 year old demographic has continued to decrease.
The 20-24 year old age group decreased significantly in 2000, going from 7.4 percent of the County population to 5.9 percent, yet rebounded close to 1990 levels in 2010 and through 2014 although still slightly below 1990 levels. A slow but continuous decline in the 0-4 year old age group suggests that the County’s aging trends will continue, with decreasing numbers of new-borns aging into the general population. The decline in the 0-4 year age group in the County may reflect, in part, the current trend of a decrease in the average household size nationally.
The declines in the 20-24 year old and 25-44 year old age groups suggests the County is not retaining recent college graduates to remain or return to the County upon entering the workforce, and that more adults in their prime working years are not residing in the County. Although the percentages are lower compared to the state, the County does trend older than the United States as a whole.
Chart 1-3: Age Distribution of Delaware County 1990 to 2014
U.S. Census -1990 and 2000, and American Community Survey, 2104
7.0% 6.2% 6.1% 6.0%
19.3% 21.6% 20.7% 20.2%
7.4% 5.9% 7.1% 7.1%
31.1% 28.7% 24.4% 24.3%
19.6% 21.9% 27.5% 27.8%
15.5% 15.5% 14.3% 14.5%
0%
10%
20%
30%
40%
50%
60%
70%
80%
90%
100%
1990 2000 2010 2014
Pe
rce
nt
of
Po
pu
lati
on
0-4 5--19 20--24 25--44 45--64 65+

Economic Development Plan Chapter 1: Background
1-16
Racial and Ethnic Diversity Delaware County is becoming a more racially and ethnically diverse county. Though there can be issues in comparing changes in race and ethnicity over time due to changes in census recording, it is clear that Delaware County is becoming more diverse. Starting in the 1990s, the number of White individuals has decreased in real numbers and as a percentage of the overall population from a high of 86.5 percent to 72.0 percent as of the 2014 ACS. Concurrently, the number of Black or African American residents has significantly increased from 11.5 percent of the County population in 1990 to 20.5 percent in 2014. Residents of Asian descent as well as individuals identifying as two races have also been increasing during this timeframe. Hispanic and Latino ethnicity, while a relatively low overall percentage of the County population, has steadily risen from 5,998 individuals in 1990 to an estimated 18,273 residents in 2014, increasing since 1990.
Table 1-3: Delaware County - Race and Hispanic Origin 1990 to 2014
Source: U.S. Census -1990, 2000 and 2010, and American Community Survey, 2014
Diversity in all its forms, including racial and ethnic, is an attribute sought by companies and institutions when deciding where to locate and to open regional facilities and operations, and the increasing diversity in the County will be an attractive economic development asset moving forward.
Educational Attainment Delaware County compares well with Pennsylvania and the country as a whole in terms of educational attainment. The County exceeds the state percentage for a High School diploma by almost three percentage points and the U.S. by over five percentage points. The margins for Bachelor’s degree or higher attainment are even greater, with the County exceeding the state by over seven percentage points and the country as a whole by over six percentage points. The relatively high levels of educational attainment in the County are an asset in attracting new industries and businesses as well as in retaining companies and institutions currently operating in the area.
Year 1990 % 2000 % 2010 % 2014 % White Alone 473,741 86.5 442,449 80.3 405,233 72.0 401,730 72.0
Black or African American alone 61,394 11.2 79,981 14.5 110,260 20.0 114,783 20.5
American Indian and Alaska Native alone
609 0.0 609 1.0 874 2.0 661 1.0
Asian alone N/A N/A 18,103 3.3 26,277 5.0 27,939 5.0
Native Hawaiian and Other Pacific Islander
N/A N/A 100 0.0 145 0.0 70 0.0
Two or More Races N/A N/A 6,556 1.2 10,979 2.0 10,724 1.9
Other 12,516 2.3 3,066 6.0 5,211 9.0 4,868 9.0
Hispanic or Latino 5,998 1.1 8,368 1.5 16,537 3.0 18,273 3.3
Not Hispanic or Latino 541,653 99.0 542,496 98.5 542,442 97.0 542,502 96.7

Economic Development Plan Chapter 1: Background
1-17
Chart 1-4: Educational Attainment 2014
Source: U.S. Census Bureau, American Community Survey – 2014, 5-year estimates
Employment Chart 1-5 shows that a significant number of residents commute outside of the County for employment. According to the 2009-2013 American Community Survey, over 50,000 Delaware County residents work in Philadelphia while fewer than 20,000 Philadelphia residents work in Delaware County. A similar deficit of workers occurs in Montgomery County (nearly 30,000 Delaware County residents work in Montgomery County while fewer than 15,000 Montgomery County residents work in Delaware County). County residents also commute to Chester, Gloucester, and New Castle Counties for work, but a more balanced flow of workers exists with these counties. Employment location is heavily influenced by access to jobs. For instance, Center City Philadelphia, a major employment center in the country, is extremely accessible from Delaware County via public transit. This attracts a significant number of people who work in the City but choose to live in Delaware County.
Chart 1-5: Inflow/Outflow of Workers
Source: U.S. Census Bureau American Community Survey, 2009-2013 Five Year Estimates
91.9% 89.0% 86.3%
35.5%28.1% 29.3%
0.0%
10.0%
20.0%
30.0%
40.0%
50.0%
60.0%
70.0%
80.0%
90.0%
100.0%
Delaware County Pennsylvania United States
Pe
rce
nt
of
Po
pu
lati
on
High School Graduate or Higher Bachelor's Degree or Higher
-60,000 -50,000 -40,000 -30,000 -20,000 -10,000 0 10,000 20,000
Gloucester County
New Castle County
Montgomery County
Philadelphia County
Chester County
Other County Residents Commute to Delware County for Work
Delaware County Residents Commute to Other Counties for Work
New Ca
Gloucester Count

Economic Development Plan Chapter 1: Background
1-18
Industry Sector Mix As discussed in Growing from Within, a diverse mix of industry is crucial to a healthy economy. A diverse mix prevents the County from becoming dependent upon a single or very few industries. Chart 1-6 shows employment by industry sector in Delaware County. Employment in Delaware County is concentrated in the Healthcare and Social Assistance sector, which is a rapidly changing and growing sector. General Medicine and Surgical Hospitals account for approximately 20% of this sector in Delaware County. Over the last decade, many hospitals in Delaware County have developed satellite offices for many outpatient services. This allows greater access to healthcare in the County, while extending the providers market. Subsequently, it has led to greater competition among the providers. Educational Services accounts for 5.92% of employment in the County; this is likely due, in part, to the numerous post-secondary institutions located in Delaware County. For a more complete analysis of the industry sectors in Delaware County, see Growing from Within.
Chart 1-6: Delaware County Employment by Industry 2012
Source: EMSI, compiled by Delta Development Group, Inc. 2013.
Health Care and Social Assistance, 17.08%
Government, 11.17%
Retail Trade, 10.18%
Manufacturing, 7.07%
Accommodation and Food Services, 6.55%Professional, Scientific, and Technical Services, 6.16%
Educational Services (Private), 5.92%
Other Services (except Public Administration), 5.71%
Construction, 5.46%
Administrative and Support and Waste Management and
Remediation Services, 5.22%
Finance and Insurance, 4.92%
Transportation and Warehousing, 3.50%
Wholesale Trade, 2.98%
Arts, Entertainment, and Recreation, 2.53%
Management of Companies and Enterprises, 2.53% Other*, 3.02%

Economic Development Plan Chapter 1: Background
1-19
Major Employers and Employment Density When looking at the individual major employers in the County which represent this mix, the diversity of economic industries also comes through. The top employers represent a mix of manufacturing, medical, governmental, educational, and service employers. While the aerospace manufacturer Boeing is the largest single employer in Delaware County, it is followed by Crozer-Chester Medical Center, Delaware County government, Villanova University, and United Parcel Service. Major employers’ headquarters or primary facilities are largely centered along the transportation and road network, taking advantage of these County assets. The top 50 employers can be seen in Appendix F: Major Employers. When looking at the density of all jobs, the employment is centered on areas with higher density. This is intuitive because overall employment density includes service jobs and neighborhood retail which are required to be close to their customers. While some major employers such as manufacturers or educational institutions create a large central point of employment, others such as health care or government have their employees spread through multiple locations.
Map 1-4: Employment Density
Source: U.S. Census Bureau, Center for Economic Studies

Economic Development Plan Chapter 1: Background
1-20
Transportation Assets The transportation network plays an integral role in the economy of the County by providing for the movement of goods and people. Several major interstates and federal highways traverse Delaware County, including I-476, I-95, US 1, US 13, US 30, US 202, and US 322. The County is also served by a complete network of arterial, collector, and local roads. The network also includes a robust public transit network, consisting of SEPTA Regional Rail (Paoli-Thorndale Line, Media-Elwyn Line, and Wilmington Line); 11, 13, 101, and 102 trolleys; Norristown High Speed Line; and multiple bus routes. Map 1-3 shows the public transit and roadway network of the County.
Map 1-5: Public Transit and Road Network
Industry in the County benefits greatly from ports along the Delaware River and the robust rail freight network that provides access to areas across the country. A significant portion of the Philadelphia International Airport is located in Tinicum Township and is easily accessible from other parts of the County.

Economic Development Plan Chapter 1: Background
1-21
Map 1-6: Freight Assets
The complete transportation network in the County has been, and will continue to be, an important advantage in the economic development of Delaware County. The Delaware County Transportation Plan will address the transportation network, including the movement of freight, and identify a long-range strategy for the movement of people and goods. As with the Economic Development Plan, it is also a component of Delaware County 2035 and is currently under development.
National Trends Planning practice, demography, and economic research have identified the following progression in suburban growth and development, family composition and purchasing and consumption patterns. These trends provide background into the current state of the County, though are not always universally experienced by every community. During the post-war decades of the 1940’s, 50’s, 60’s and beyond the suburbs grew significantly and retail development expanded, while many family households were comprised of single-income earners. Today, there are more non-family households, and family households are more typically comprised of dual-income earners who work longer hours and are often willing to pay more for convenience. The ubiquity of the internet and the convenience of on-line shopping and door-to-door delivery has altered the retail landscape. Although physical stores are not in danger of becoming obsolete, technology enables consumers to make more informed choices. As a result, in-person shopping has evolved into more of a planned outing in which consumers are looking for an experience beyond the utilitarian purchase of goods.

Economic Development Plan Chapter 1: Background
1-22
As the suburbs continue to grow, larger retail spaces are evolving to serve a number of purposes that used to be met by traditional downtowns. Many new shopping centers are developed in a contemporary ‘town-center’ design to include civic amenities and public outdoor areas. Grocery stores are expanding to include food court or dining facilities. Traditional, enclosed malls may compete with this trend by redeveloping their physical structures to include more outdoor and civic spaces. Meanwhile, traditional downtowns are organizing events and undertaking marketing campaigns to emphasize their unique characters and the retail experience inherent in their design. Trends in office and industrial uses have followed a similar pattern. Many large corporations began to seek suburban office settings during the era of suburbanization, in an effort to accommodate growing numbers of employees and avoid higher urban land costs and taxes. However, relocations from urban centers to the suburbs have slowed in recent years and to remain competitive, suburban office parks are now frequently designed to create enhanced character in much the same way as new retail town centers or reconfigured malls. Office campuses for large employers often include amenities such as transit access, fitness centers, dining options, and landscaped grounds with outdoor walking facilities, trails, and other public spaces. Traditional downtowns compete by highlighting and enhancing these amenities. U.S. industry has been challenged by the shift to a service-based economy and competition from international trade. When industries close or relocate, large vacant or underutilized properties can be difficult and expensive to adapt for re-use. Additionally, industrial uses were at times displaced due to the demand for housing, which made residential uses more valuable. However, newer industrial uses may be able to co-exist more readily with residential and commercial areas. A new market sector known as production/distribution/repair, or PDR, as well as the “maker economy” has recently emerged, and a proliferation of small, specialized, light industrial startups are better able to utilize flexible or shared spaces in either former industrial sites and even in office parks of an appropriate size. The shift to a more flexible workforce is starting to be seen in non-industrial sectors. There has been a transition between the lifetime careers of past generations to jobs with multiple employers in the working lifetime of an individual. Trends point to an acceleration to even shorter term employment referred to as the “gig economy” as major employers outsource more and more services to remain flexible to market demands. The increasing of freelance consulting means more mobile employees, the best of which are in high demand.
Local Trends Delaware County has experienced national trends at the local level. Employment centers are spread throughout the County, but are particularly concentrated along the Delaware River, Interstate 476, and the Route 1 corridors. As with much of the Delaware Valley region, the County has shifted from a historically manufacturing-based economy to one increasingly centered on the health care and service sectors. As suburban development has expanded westward, businesses have followed, and the County now hosts a number of large-scale, big-box stores and retail centers with significant draws. New shopping centers in the County are being developed with more of a town-center design and are including mixed, residential uses, while older shopping areas are being redeveloped to include more contemporary designs and uses. Growing Suburbs tend to have more corporate retail chains than Mature

Economic Development Plan Chapter 1: Background
1-23
Neighborhoods, which tend to foster more small, independent businesses and startups owing to their smaller spaces and lower rents. This has led to a degree of geographic imbalance in the County, with some Mature Neighborhoods not well served by retail chains and supermarkets in particular. Conversely, some Growing Suburbs may be over developed with retail and may not have a balanced economic mix. There are over a dozen central business districts in the County – each having a distinct identity and contributing to sustainable living and modern business development. Mature Neighborhoods in Delaware County face a number of issues. Declining populations have diminished the tax base in some areas, leading to higher tax rates to support aging infrastructure and increased demand for services. Growing Suburbs are able to offer lower tax rates and newer infrastructure, but as development continues to expand westward, they may face some of the same issues as their older neighbors. Mature Neighborhoods also have trouble competing with Philadelphia, which may face similar tax rate and infrastructure issues, but benefits from the cachet of a cosmopolitan city center. Communities in Delaware County that have been successful in attracting residents and businesses have done so by marketing their unique attributes, or by making themselves destinations for arts, dining, or other distinctive activities. Since the recession of 2008, residential development has recovered at more moderate levels than in previous years. Many of the Mature Neighborhoods of the County are experiencing new infill development focused in Central Places. Much of the recent development in western Delaware County was built on former farmland and prime agricultural soils. The decrease in farmland over the years is a direct result of development pressure and rising land values. In many areas of the County, it has become more profitable to sell land for development than to continue farming it or preserving it as open space or with existing low density development.
ECONOMIC DEVELOPMENT PLANNING EFFORTS
DELAWARE COUNTY & MUNICIPAL EFFORTS Delaware County and its constituent municipalities have undertaken a variety of economic development planning efforts that have shaped the growth and development of the County. Some planning efforts have involved direct interventions related to specific economic development projects or unique place-based issues, while others have been more general initiatives that had indirect or secondary economic benefits. Understanding these initiatives can be helpful in understanding existing development patterns and future growth. Following the post-war years there was an informal, loosely defined network of economic development services and assistance in the County and limited economic development planning as housing and employment were expanding outwards from Philadelphia. Delaware County was experiencing rapid suburban development with new housing developments and employers locating in the County across a range of municipalities. During this time, the County’s Industrial Development Authority (IDA), Industrial Development Corporation (IDC), and Redevelopment Authority were formed based on enabling laws passed in the 1940s, 50s, and 60s. The County Economic Development Center provided in-kind personnel services to the IDA and IDC during this time.

Economic Development Plan Chapter 1: Background
1-24
During the 1970s and into the 1980s, economic development efforts focused on vocational education and workforce training to County residents. The Office of Employment and Training (OET) was formed as a public agency during this time to administer various employment training and education programs, and later expanded to include the formation of the Private Industry Council, which worked closely with County Council to administer new federal training programs. In 1984 the County prepared an Economic Development Plan Strategy which focused on the need to increase employment opportunities and foster the formation of a competitive business climate. In 1990, the County formed the Economic Development Oversight Board (EDOB) to oversee and coordinate economic development marketing and financial incentive programs that would encourage and facilitate the attraction and retention of businesses in the County. During the early 90s the Quality of Life 2000 (Q2) initiative was launched which brought together government, business, education, labor and civic leaders to identify issues critical to the future quality of life in the County. The Q2 process lead to the development of the 1992 Delaware County Economic Development Strategy and the formation of the County Commerce Center, which continues today as the oversight and coordinating agency for all economic development in the County. During the 1990s, the municipalities of central and western Delaware County began to allow for the build-out and expansion of local water and sewer infrastructure which enabled continued growth and economic development. Existing sewerage facilities serving the County varied significantly from east to west and continue in this pattern currently. Generally, Mature Neighborhoods in eastern Delaware County have complete sewer service, while portions of the Growing Suburbs of the County utilize on-lot septic systems or community sewer systems. The decision whether or not to extend sewage facilities to an area can have a significant impact on growth and development. To react to the competition from new development opportunities spurred by the expansion of sewer services, some Central Places, particularly Urban and Town Centers, began to study and develop strategies for revitalization and how they could encourage new investment and economic development. Delaware County established the Revitalization Program in the early 2000s with the goal of assisting Mature Neighborhoods and older Central Places in eastern and southern Delaware County in enhancing their economic viability and livability. Action plans for five Revitalization Planning Areas identified and analyzed the most pressing needs of each area; County Council allocated $1 million annually in General Fund revenue to projects identified as high priority. The Growing Suburbs of western and central Delaware County were designated as part of an Open Space Preservation program whose goal was to protect the most important remaining undeveloped lands in the twenty eligible municipalities in the northern and western parts of the County. In recent years, the County has utilized a variety of financial tools to encourage new economic development including the issuance of bonds to support components of various projects as well as tax incentives to attract new development. The Talen Energy Soccer Stadium, part of the Chester waterfront redevelopment, was financed in part by the issuance of County bonds. The County has also utilized funding from PennDOT and other state programs and agencies, as well as the federal Community Development Block Grant (CDBG) program to conduct economic development studies and allocate funding to strategic road, infrastructure, and community development projects which have enabled or enhanced economic development. Some key studies and projects funded include the 2015 Marcus Hook Sunoco Refinery Reuse Study, the 2007 Baltimore Avenue Corridor Revitalization Plan, and construction of the traffic ramps connecting the Commodore Barry Bridge to I-95 in Chester.

Economic Development Plan Chapter 1: Background
1-25
ECONOMIC DEVELOPMENT PLANNING IN THE 21ST CENTURY As a long-range planning document, this plan must consider the potential changes that may affect Delaware County in the 21st century. Thus far, this plan has discussed historical trends and the current economic landscape of the County; however, there are also shifts which may or may not, occur.
Shift to Central Places Across the country, the population has shifted back to city centers over the past 15 years. In Delaware County, this has generally materialized in a shift towards Central Places, such as Media Borough, which are serving as the cultural and economic centers of the County. These neighborhoods are desirable for their walkability, transit access, and mix of uses. It is anticipated that this trend will continue, rapidly changing the real estate market in the County. In fact, it is expected to affect the neighborhoods immediately surrounding the central business districts and many Mature Neighborhoods in the County, which will see a stronger market in the 21st century. These areas will be very desirable as people look for neighborhoods that are walkable and transit accessible.
Domestic Energy Growth It is anticipated that the recent growth in domestic energy production will continue in Delaware County, particularly if the infrastructure supporting this industry is enhanced to increase access to the Delaware River. As a result, it is likely that communities along the Delaware River will see more development pressure along the riverfront, and the river will see increased ship traffic. Consequently, the communities along the riverfront and I-95 will experience greater demand for housing and increased commercial use, particularly from service and restaurant businesses looking to capitalize on increased employment in the area.
Transportation Changes In recent years, transportation on demand has dramatically changed travel within urban areas; many people rely less on owning a car when a ride can be called through a mobile application. Simultaneously, walking and bicycling for transportation have increased in many areas. In the 21st century, it is likely that drastic changes in transportation methods will continue to disrupt the current system. The effects of such a systematic change on Delaware County are currently unknown; therefore, it is important to remain flexible.
Flexible Working Space Flexible working space in the County will offer a variety of businesses and individuals with the opportunity to grow and/or adapt to changing markets. These spaces, such as businesses accelerators, will provide individuals looking to start a company with the space necessary without a large financial outlay or the need to commit to a long-term lease. These opportunities will help to create a culture of innovation in the County that expands the economy into new markets. Additionally, maker spaces will provide space designed to create products or prototypes and often provide some training and basic tools. While heavy industry has left many areas of the County, these spaces will be repurposed for light industrial uses, such as shipping and receiving or assembling products. While the outcomes of these trends are unknown at this time, care should be taken to incorporate these, and as yet unforeseen, changes into shorter-term economic development plans in the County.

Economic Development Plan Chapter 1: Background
1-26
LOOKING AHEAD The County profile, along with the survey of current conditions, and review of local, national and twenty-first-century economic development planning trends were all used in shaping the goals, objectives and actions of this economic development plan. It is important to consider that economic development planning is an ongoing effort. As circumstances change, so should the objectives and efforts of individual municipalities. For that reason, Countywide goals and strategies, which address common issues and needs, are outlined in this plan. The objectives and actions established in this plan reflect the goals and strategies with regard to different Character Areas. As specific communities grow and adapt in the coming years, different objectives and actions may become more relevant to them.


Economic Development Plan Chapter 2: Place-Based Development
2-2
2 Place-Based Development


Economic Development Plan Chapter 2: Place-Based Development
2-1
Chapter 2: Place-Based Development
OVERVIEW Because the character of an area plays such an important role in economic development, this plan takes a place-based approach to identifying current conditions and improvement strategies. In this approach, the policies from both the Land Use Policy Framework Plan and Growing from Within are linked through the objectives and actions of this plan.
COUNTYWIDE While this plan emphasizes place-based economic development strategies, there are several coordinated economic development approaches recommended that are countywide in nature. These approaches involve County brand and marketing development, ongoing Countywide business retention and recruitment efforts, and the enhancement of global trade opportunities. These elements are detailed in Growing from Within in more detail. The branding and marketing of the County is an important component of retaining and attracting new businesses. Establishing an identity and highlighting the County as a strategic, high-value location for commercial enterprise will provide an advantage in retention and recruitment efforts, and help Delaware County remain competitive within the region and along the eastern seaboard. The County launched a branding and marketing initiative in 2015 entitled the Delco Edge, which redesigns and sharpens the focus on the many benefits to choosing Delaware County as a location for business, and highlights resources and opportunities for vocational and continuing education and job training. The County convention and visitor’s bureau has also rebranded and redesigned its website and publications to highlight County’s assets under the Destination Delco tagline. The County should also maintain and enhance current business recruitment and retention strategies. Communication should continue with business and industry to respond to expansion, workforce, and capital needs and to actively recruit targeted growth sectors based on available sites and facilities in appropriate areas. Web-based tools for site selection that highlight assistance opportunities available to
companies considering locating in the County should be maintained and expanded. The County should also look to enhance existing technology and innovation networks by partnering with research universities and collaborating with business and industry. The County should continue to identify and support efforts to enhance global trade. Increased international trade will boost the local economy and create new employment opportunities in a variety of sectors and industries. The County should look to refine its
Figure 2-1: The County's access to the Delaware River is an asset in attracting major industry and employment to the County.

Economic Development Plan Chapter 2: Place-Based Development
2-2
direct investment strategies, examine the usefulness and feasibility of foreign-trade zones or sub-zones, and continue to support efforts to maximize Delaware River Port capabilities. The burgeoning energy sector in Pennsylvania and the region may present a particularly attractive opportunity for Delaware County. The Marcus Hook Sunoco Refinery Reuse Study was an important first step in revitalizing this former industrial complex. The ancillary benefits of energy hub-related products can allow for a diverse economy including elements used in a range of consumer goods. Delaware County is already a regional leader in energy efficiency and renewable energy, both of which provide a strong economic benefit by employing local installers and contractors.
ACTIONS Objective ED 1 Support the economic competiveness of Delaware County’s communities through place-based
investment, promotion, and outreach.
Actions Delaware County will… ED 1.1 Preserve and promote the unique attributes that make the County a desirable place to
live and work. ED 1.2 Maintain and enhance business retention and recruitment through ongoing
communication and collaboration. ED 1.3 Partner with educational and other institutions to leverage economic development
opportunities. ED 1.4 Maximize the commercial and recreational potential of the Delaware River. ED 1.5 Foster investments that build on the County’s role as an energy and technology hub. ED 1.6 Coordinate economic development with municipal entities to improve consistency and
efficiency. Municipalities are encouraged to… ED 1.7 Develop multi-municipal comprehensive plans and zoning ordinances that take into
account larger trends and land-use issues beyond individual municipal boundaries. ED 1.8 Work cooperatively to plan and implement multi-municipal infrastructure, services, and
community facilities to improve economic efficiencies.

Economic Development Plan Chapter 2: Place-Based Development
2-3
MATURE NEIGHBORHOODS
CURRENT CONDITIONS Mature Neighborhoods are the established, developed communities of Delaware County. They range from colonial-era settlements and nineteenth-century towns to early twentieth- century streetcar suburbs, post-World War II housing communities, and the more recent suburban development of the 1960s and 1970s. These neighborhoods have realized most of their population, employment, and infrastructure growth and contain limited amounts of land for additional growth and new development. The amount of proposed development in Mature Neighborhoods has slowed significantly since the early 2000s, in some areas ceasing completely. Development in these areas principally occurs in the form of infill of unused or vacant sites or in the redevelopment or renovation of older properties, which may be located in revitalizing residential and commercial districts or have proximity to SEPTA transit or other transportation assets.
Building Stock and Density Building stock in Mature Neighborhoods is inherently older than in Growing Suburbs. A majority of the residential structures and commercial areas were built in the first half of the twentieth century and during the post-war housing boom of the 1950s and early 1960s. The lot and building sizes are frequently smaller than those found in newer suburban areas while the historic nature of the building stock exhibits architectural variety and traditional community design elements that provide a unique character to these neighborhoods. There are also a significant number of older institutional properties, such as schools and churches, some of which have recently closed. These properties are generally larger than is typical of Mature Neighborhoods and present a greater range of redevelopment opportunities. However, the age, design, and smaller square footage of older residences and commercial districts can necessitate significant investment in the maintenance and improvement of homes and the retrofitting of commercial buildings, which can be a disincentive for attracting new residents and businesses. As such, the median housing values in these areas are often lower than in those in the faster growing areas of the County. The density of Mature Neighborhoods, some areas with more than 10,000 people per square mile, is greater than that of Growing Suburbs and provides a large market for businesses.
The Delaware River
Historically, industrial development centered along the Delaware River, and it remains a crucial component of today’s regional economy. Many of the County’s key industries are capitalizing on it to connect with growing global trade. Sunoco Logistics in Marcus Hook Borough is utilizing pipelines to transport Marcellus Shale products from western Pennsylvania to its facility on the Delaware Riverfront. The port access allows Sunoco Logistics to export products directly onto large maritime vessels. Simultaneously, there has been significant interest in taking advantage of the scenic qualities of the Delaware River. Talen Energy Stadium, an 18,500-seat major league soccer stadium, and Harrah’s Casino and Racetrack were developed along the river in Chester City. In other areas, such as Marcus Hook, communities have improved waterfront parks. It will be important to balance these different uses along the river to maximize the potential benefit to communities.

Economic Development Plan Chapter 2: Place-Based Development
2-4
The higher density is due, at least in part, to the range of residential housing options, including a mix of attached, multi-family, and apartment dwellings. The smaller building sizes and more traditional, pedestrian-oriented design make Mature Neighborhoods well-suited locations for small to mid-size retail, service, and business establishments.
Transportation
Infrastructure The public transit infrastructure of Mature Neighborhoods is generally more developed than in Growing Suburbs. These areas are served by several SEPTA Regional Rail lines; the 11, 13, 101, and 102 trolley lines; the Norristown High Speed Line; and multiple bus routes. The public transit system provides far-reaching connections throughout the region, particularly to major employers in the City of Philadelphia. This transit system connects neighborhoods directly to a number of the Central Places in the County, which serve as local employment and entertainment centers. The convenient access to regional and local destinations helps to attract a diverse group of residents; however, the orientation toward Philadelphia makes transit connections between suburban destinations more difficult. The Mature Neighborhoods also have access to major regional economic assets, including the Delaware River and accompanying commercial ports, freight rail lines, and I-95 and I-476 (the Blue Route). Access to these major connections continues to attract a variety of uses and industrial centers and uses. However, roads in Mature Neighborhoods are generally smaller and provide less capacity for cars and commercial traffic, often leading to congestion, increased travel times, and more difficult access for commercial vehicles.
Other Factors A significant number of the County’s colleges, universities, and other secondary institutions are located in Mature Neighborhoods. This creates opportunities to develop incubation and shared services facilities, as well as research and design partnerships and programs with educational institutions that encourage the transfer of technology, medical, and design ideas to new business start-ups.
OUTLOOK Mature Neighborhoods are poised to attract a diverse group of businesses and residents in the coming decades. Their traditional neighborhood development patterns provide the unique community and town characteristics that developers are attempting to replicate in new developments. They can benefit from enhancing their existing character to better compete in the changing markets of the 21st century. The key attributes below describe the characteristics that will make Mature Neighborhoods of the future thrive.
Figure 2-2: The Wharf at Rivertown in Chester City was rehabilitated to include modern office space. It serves as a tremendous example of reuse of existing buildings to meet current market needs.

Economic Development Plan Chapter 2: Place-Based Development
2-5
Key Attributes Mature Neighborhoods of the future…
• Market their unique assets and community character;
• Contain flexible and affordable working spaces that maximize proximity to other businesses and institutions of higher learning to encourage innovative new enterprises;
• Capitalize on existing buildings by retrofitting them to meet changing market needs while maintaining their unique character;
• Incorporate infill development that is compatible with existing neighborhood form or a community-created vision of the neighborhood’s future;
• Conserve, enhance, and connect to open space and natural features without inhibiting new development or appropriate commercial use of waterways;
• Continue to support and grow industries that are thriving today;
• Provide a range of quality housing options for a variety of incomes and family types;
• Offer a range of travel options as part of a safe and complete multimodal transportation network; and
• Coordinate economic development with surrounding communities to improve consistency and cost efficiency.
ACTIONS Objective ED 2 Strengthen and preserve Mature Neighborhoods through investments and redevelopment that
foster their unique character.
Actions Delaware County will… ED 2.1 Develop guidelines for redeveloping and revitalizing commercial centers. ED 2.2 Foster innovation and emerging industries in existing industrial and commercial centers
and business districts. ED 2.3 Facilitate and assist neighborhood revitalization in a manner that supports the unique
character of the community. ED 2.4 Coordinate strategic investments in the transportation network to improve multimodal
connectivity. ED 2.5 Encourage access to and improvement of recreational and community facilities.
Municipalities are encouraged to… ED 2.6 Develop a long-range, community-centered vision. ED 2.7 Adopt zoning and other implementation measures to implement the long-range vision.
ED 2.8 Build on historic and unique character to enhance economic strength. ED 2.9 Promote and market their unique characteristics through outreach that highlights their
assets and takes advantage of changing demographic trends.

Economic Development Plan Chapter 2: Place-Based Development
2-6
ED 2.10 Prioritize the remediation of brownfields and the redevelopment of greyfields to
encourage reuse of sites. ED 2.11 Encourage buildings to be retrofitted in ways that meet changing market needs while
maintaining unique character. ED 2.12 Preserve existing affordable housing stock by encouraging rehabilitation or modification
of existing homes.

Economic Development Plan Chapter 2: Place-Based Development
2-7
GROWING SUBURBS
CURRENT CONDITIONS The Growing Suburbs of Delaware County still retain large areas of undeveloped or agricultural land and are experiencing, or are forecast to experience, population growth. The availability of undeveloped land makes these areas attractive for new development. In fact, the majority of new residential and commercial development proposed in Delaware County since 2000 has been located in Growing Suburbs. These areas are mostly residential with single-family detached housing on relatively large lots (three-quarters to one acre or more). Growing Suburbs are particularly prominent in the western and northern portions of the County, and were shaped by rapid growth as highway access increased and after zoning laws began segregating uses.
Building Stock and Density The building stock in Growing Suburbs is generally newer than in other parts of the County. Most commercial buildings were constructed with structural steel, which generally provides more flexibility for reuse than masonry or wood-frame structures that are more typical in Mature Neighborhoods. Structural steel construction allows for interior walls that are generally not load-bearing and can be adjusted or removed as business needs and markets change. Commercial buildings typically have designated areas for deliveries and interior storage space built into the design of the building, streamlining inventory management for businesses. Residential properties are not only newer, but also typically larger than in Mature Neighborhoods. However, these homes often lack the attention to traditional architectural detail and construction materials seen in Mature Neighborhoods. The vast majority of residential properties are single-family detached houses constructed of timber with one- or two-car attached garages. While the majority of buildings were recently constructed, there are many historic structures, such as old farmhouses, mills, and barns, dispersed throughout Growing Suburbs. Those that are not maintained as private residences are sometimes preserved as museums or historic sites, but many have been rehabilitated and used for office space, restaurants, or retail establishments. Growing Suburbs in the County typically develop in a lower density form than the Mature Neighborhoods of the County, generally ranging from 1,000 to 3,000 people per square mile. These areas are predominantly single-family detached housing with minimum lot sizes generally around three-quarters to one acre. This is often reflected in local zoning which favors single-family detached
Figure 2-3: Concordville Town Centre in Concord Township is a good example of a new shopping center that provides additional amenities for pedestrians.

Economic Development Plan Chapter 2: Place-Based Development
2-8
residential construction. Townhomes and apartment development are found in Growing Suburbs, but are commonly located along principal arterial highways and major collector roads, separated from single-family detached homes. Town Centers and Neighborhood Centers can be found in Growing Suburbs, including newly developed centers. Commercial development is denser around these Centers; however, residential density tends to be lower than in Mature Neighborhoods.
Transportation Infrastructure Growing Suburbs are more spread out than Mature Neighborhoods owing to their growth during the automobile age. Individual developments are not always connected to or even developed adjacent to each other, leading to greater travel distances between different areas. Arterial roads are typically larger to provide greater capacity for high projected demand. Commercial development is generally designed in an auto-centric fashion, with high parking ratios and limited pedestrian facilities and access to public transit and other alternative means of transportation. SEPTA is currently in the process of extending service on the Media-Elwyn regional rail line to Wawa. When completed, this extension will create quicker access to and from Center City Philadelphia for the central and western portions of the County. Growing Suburbs do however often have excellent roadway access, connecting to regional arterial highways and providing good access for trucks and freight movement. As development occurs without the density for transit options, congestion in Growing Suburbs will increase, which may make these areas less attractive for additional new growth.
Other Factors Despite rapid development, Growing Suburbs contain substantial amounts of open space, diverse recreational amenities, and areas of undisturbed, high-quality natural resources. They retain a more natural character and scenic quality, and these scenic and quality-of-life assets are important factors in helping Growing Suburbs remain vital and attractive locations to new residents and business. Growing Suburbs may take different approaches to addressing growth. Some are striving to preserve lower population densities on larger lots, while others are choosing to preserve remaining rural character by concentrating densities and preserving dedicated open space. Others are allowing more substantial, less restrained development that will eventually lead to a community build-out similar to more mature areas. Some primarily Growing Suburbs that contain pockets of Mature Neighborhoods are experiencing growth through the redevelopment of older neighborhoods. As development begins to slow down in Growing Suburbs, communities need to anticipate their changing needs and how to address them. Historically, many have relied on new development to increase tax revenue. Without significant new developments, communities need to determine methods to maintain a steady tax base for municipal services.
OUTLOOK Growing Suburbs have flourished over the past two decades, due in part to the combination of large amounts of open space and close proximity to the regional transportation network. The open space and accompanying recreation amenities contribute to a high quality of life. In order to remain competitive in the twenty-first century, Growing Suburbs will need to be diverse and adaptable to changing market trends. They also need to adapt to changing economic drivers as the amount of developable land decreases. The key attributes below describe the characteristics that will make Growing Suburbs of the future thrive.

Economic Development Plan Chapter 2: Place-Based Development
2-9
Key Attributes Growing Suburbs of the future…
• Provide a range of quality housing options for a variety of incomes and family types;
• Connect residents, employees, and customers to multiple transportation options;
• Develop around concentrated business and civic development in uniquely designed Central Places that build on existing infrastructure;
• Balance the demands of continued growth with the preservation of scenic and natural resources that serve as key assets to the quality of life in these communities;
• Have a stable tax base that does not rely on new growth for municipal operations;
• Incorporate development with the local rural-suburban character or a community-created vision of the neighborhood’s future; and
• Coordinate economic development with surrounding communities to improve consistency and cost efficiency.
ACTIONS Objective ED 3 Support Growing Suburbs as communities for regional growth while maintaining assets and
amenities that make them attractive places.
Actions Delaware County will… ED 3.1 Maintain a site selection database as a resource for new business recruitment. ED 3.2 Assist municipalities in guiding development to designated centers. ED 3.3 Develop guidelines for retrofitting commercial and office centers to make them more
walkable and attractive to changing markets. ED 3.4 Coordinate strategic investments in the transportation network to improve multimodal
connectivity. ED 3.5 Encourage the development of recreational and community facilities. Municipalities are encouraged to… ED 3.6 Create a long-range, community-centered vision. ED 3.7 Adopt zoning, official map, and other measures to direct development to desirable
locations. ED 3.8 Develop incentives to encourage high quality design of new development. ED 3.9 Diversify housing stock, particularly in areas close to employment and commercial
centers. ED 3.10 Diversify tax base to build economic resiliency.

Economic Development Plan Chapter 2: Place-Based Development
2-10
CENTRAL PLACES
CURRENT CONDITIONS Central Places are the distinct “downtown” areas of Delaware County. They range in size and intensity, but all are community focal points that reinforce or establish a sense of place and character. As previously mentioned, the Framework Plan organizes Central Places by scale: Urbanized Centers are the largest and act as employment centers and hubs for surrounding neighborhoods; Town Centers are smaller-scale districts typically consisting of a single main street; and Neighborhood Centers are often built around historic villages or the crossroads of two streets and serve as local shopping or dining destinations. Central Places are found in both Mature Neighborhoods and Growing Suburbs, taking on the underlying characteristics of the surrounding community.
Central Places are mixed-use areas, with retail, service, office, institutional, and civic uses mingled in one concentrated area. Residential dwelling units can also be found in Central Places, most often above first floor retail or office space. The mix of uses contributes to the steady activity levels throughout the day in these areas. Offices and other commercial space bring in visitors during the daytime hours, while residential units and restaurants increase foot traffic in the evening and weekend hours.
Building Stock and Density The age of buildings in Central Places varies significantly, but is generally older than average in the County. Individual lots are normally small and typically built up to the sidewalk edge with attached buildings on both sides. Multi-story buildings make the best use of land in these areas, with different uses occupying single buildings; however, the scale of the Central Place influences the size of buildings. While many buildings in Central Places have been around for decades, the uses have changed. The existing buildings, which contribute to the character of these areas, were often built with high-quality materials, similar to the Mature Neighborhoods. It is often financially beneficial to reuse existing structures and retrofit them for changing needs. However, reuse of existing buildings does present some constraints. While the smaller footprint of buildings may make space more financially feasible for new businesses, it makes it difficult for others to grow or larger business to locate. In some areas, businesses have had success joining the first floors of two separate buildings together to create larger spaces for restaurants or stores. Where Central Places have had new infill mixed in with older buildings, the most
Figure 2-4: Sellers Avenue in Ridley Park is a local example of smaller-scale Central Place, or "Neighborhood Center."

Economic Development Plan Chapter 2: Place-Based Development
2-11
successful cases have ensured that the new construction fit with the height, setback, materials, and general character of the existing development. While Central Places for the most part take on the characteristics of the underlying community character, they tend to be denser than the areas surrounding them. This is particularly true in Urbanized Centers due to the multi-story, mixed-use buildings where residential units are common. Town Centers typically have similar development to Urbanized Centers, but the intensity and number of structures is lower, leading to lower density. In Neighborhood Centers, however, the residential density is often significantly lower.
Transportation Infrastructure Central Places historically developed around intersections or end points of major transportation routes, including roadways and rail lines. Today, the transportation routes play a crucial role in the continued vitality of Central Places. Immediate access to public transportation increases the potential market area for commercial activities in Central Places and provides easy access to other destinations for residents. The traditional design of Central Places and proximity to public transit has created places that are walkable and pedestrian-oriented destinations drawing visitors from outside of the immediate market area. The crossroads that created the Central Place can also threaten its vitality as congestion increases. Some Central Places are bypassed either through formal transportation infrastructure or informally as drivers seek other routes to avoid the congestion.
Other Factors There is significant variation in the condition and outlook for Central Places. Some are located in areas where growth is stable or increasing and new development is occurring. These places may have active, well maintained centers with high commercial occupancy rates and urban residential development that
Figure 2-5: The John McClatchy Building in Upper Darby Township was renovated to include modern retail in the lower levels and office space on the upper floors. It is an excellent example of investment that preserves the character of a community while still addressing market needs.

Economic Development Plan Chapter 2: Place-Based Development
2-12
caters to a diverse mix of consumers and markets. Others have experienced some residential population and commercial tenancy loss, yet are in the process of revitalization, attracting new development and redeveloping or rehabilitating older buildings, transit facilities, and infrastructure. Still other Central Places have lost significant population and commercial vitality, and are looking for ways to improve their economic outlook through enhancing their existing assets and attracting new development or redevelopment to make them once again more vibrant communities. As the historic centers of commerce for their communities, Central Places are constantly seeking to adapt to retail and commercial trends. Historically constructed Central Places often have more retail capacity than is currently needed for their market areas because they were built during times of more local shopping. Central Places built during the auto-oriented shopping era are feeling the market shift toward internet retail preferences. Some Central Places have successfully shifted toward a placed-based retail approach that makes them a destination worth travelling to.
OUTLOOK Central Places historically developed as the hearts of communities, with business and major civic uses growing here. As such, the existing transportation network is well-connected with the surrounding communities. The existing infrastructure provides the opportunity for cost-effective growth and redevelopment, but Central Places must encourage diverse uses and programming to fully take advantage of their potential. The key attributes below describe the characteristics that will make Central Places of the future thrive.
Key Attributes Central Places of the future…
• Consist of walkable, connected places with vibrant street life;
• Encompass a mix of uses, including residential when appropriate, that serve the surrounding neighborhoods;
• Provide a range of quality housing options for a variety of incomes and family types;
• Continue to be hubs of community facilities and institutional and civic services while building on market opportunities from these uses;
• Build around existing infrastructure and maintain and improve the systems to remain effective and efficient;
• Incorporate infill development that fits with the existing neighborhood form or a community-created vision of the neighborhood’s future;
• Capitalize on existing buildings by retrofitting them to meet changing market needs while maintaining their unique character;
• Contain flexible and affordable working spaces that maximize proximity to other business and institutions of higher learning to encourage innovative new enterprises;
• Continue to support and grow industries that are thriving today;
• Protect valuable historic resources in ways that allow for sustainable use;
• Market their unique assets and community character; and
• Coordinate placemaking and economic development with surrounding communities to improve consistency and cost efficiency.

Economic Development Plan Chapter 2: Place-Based Development
2-13
ACTIONS Objective ED 4 Cultivate Central Places as mixed use destinations to live, work, and play.
Actions Delaware County will… ED 4.1 Identify commercial improvement zones in accordance with Growing from Within. ED 4.2 Develop design guidelines focused on improving the experience of residents and visitors
in Central Places. ED 4.3 Develop a Central Places model zoning ordinance to encourage development
appropriate with long-range vision plans. ED 4.4 Create a Central Business District improvement program. Municipalities are encouraged to…
ED 4.5 Create long-range vision plans to coordinate efforts amongst stakeholders. ED 4.6 Adopt zoning and other implementation measures to implement the long-range vision. ED 4.7 Enhance the appearance and attractiveness of streetscapes. ED 4.8 Develop business improvement districts when and where appropriate to promote and
manage improvement and marketing efforts.

Economic Development Plan Chapter 2: Place-Based Development
2-14
ACTIVITY CORRIDORS
CURRENT CONDITIONS Activity Corridors are linear-shaped places along major transportation corridors or highway interchanges with intense development. They travel through and take on the character of the different Character Areas around them. They typically contain a variety of retail, office, and service-oriented uses, and vary in width, density, and design depending on the local context and underlying character. In some cases, residential development may be found along Activity Corridors, although residential neighborhoods are typically adjacent to and between corridors. While serving a principally auto-oriented function, some Activity Corridors have proximity to transit which enhances their accessibility and makes them appropriate locations for employers.
Building Stock and Density The age of building stock along Activity Corridors typically corresponds with the surrounding community. There is a mix of commercial strip development with connected stores that share parking and large, single tenant buildings that occupy individual parcels. In Mature Neighborhoods, where buildings are generally older, properties are typically smaller with commercial strip malls relatively prevalent. Significantly more new buildings can be found in Growing Suburbs, typically occupied by larger, national retail companies. The building structures themselves are relatively simple single-story buildings developed specifically for large-scale commercial use. Activity Corridors in transition from Growing Suburbs to Mature Neighborhoods often have former residential buildings along the corridor that are now zoned commercial.
Activity Corridors are denser than their surrounding neighborhoods. Though primarily commercial, they can also contain multi-family residential. Activity corridors in transition from Growing Suburb to Mature Neighborhood often contain residential single-family homes that are zoned for other uses such as office
The Future of Shopping Centers There are a number of large retail centers located along Activity Corridors, ranging from commercial strip malls, such as The Village at Painters Crossing, to enclosed shopping malls, such as the Springfield Mall. Many of these were developed with auto-centric designs that limit the pedestrian experience. Over the last decade, however, the market has demanded shopping centers that serve more like Central Places. Some of the more traditional shopping centers in the County are being retrofitted to better address the new market needs while newer developments are incorporating them from the beginning. The Granite Run Mall in Middletown Township is currently undergoing significant rebuilding to better address new market demands. The mall will be almost entirely demolished and the site rebuilt with stores and restaurants that face outward onto pedestrian plazas and wider sidewalks. The renovations will also include new apartment buildings on site. The improvements to the site will make it more of a focal point for the community, similar to a true town center. The Brinton Lake Shopping Center in Concord Township was developed similar to a traditional commercial strip, but with many pedestrian amenities, such as wider sidewalks, enhanced crosswalks, street trees, and benches. These features make it more comfortable and appealing for shoppers to walk between shops.

Economic Development Plan Chapter 2: Place-Based Development
2-15
or commercial. These residential units along Activity Corridors are typically found in clusters with limited integration with surrounding commercial destinations. Most areas primarily serve residents driving to and from specific destinations. Activity Corridors are typically directly surrounded by significant residential areas, in both Mature Neighborhoods and Growing Suburbs.
Transportation Infrastructure Activity Corridors are generally very auto-centric areas, with high levels of traffic and limited pedestrian or bicycle amenities. SEPTA bus service is very prominent along most Corridors while several intersect with regional rail, trolley lines, or the Norristown High Speed Line. It is important to note that while most are auto-centric, there are several Activity Corridors in the County that developed around public transit lines, particularly along the SEPTA 101 Trolley. The access along Activity Corridors is one of the biggest drivers in investment, particularly from national retail companies. As consumers continue to trend toward more walkable shopping destinations, communities with Activity Corridors need to look for opportunities to improve the pedestrian experience.
Other Factors By the nature of their form, Activity Corridors often cross municipal boundaries and sometimes form the municipal boundary. The corridor itself is often the most recognizable aspect of a community. Successful efforts to brand or promote an Activity Corridor often require multi-municipal involvement to ensure that municipalities are not working at cross-purposes along the corridor. Some Activity Corridors are experiencing redevelopment in the form of new, freestanding establishments as well as the development of new town-center style shopping centers, with medium to high density residential part of or adjacent to these new developments. Activity Corridors, while principally developed, do contain opportunities for additional development and build-out, particularly as they intersect regional highways or transit infrastructure. They also contain the potential to accommodate some redesign to become more accessible spaces and destinations with more connections to surrounding areas and accommodations for pedestrian and other forms of alternative transportation.
OUTLOOK Activity Corridors take on many of the characteristics of the underlying Character Areas. As such, conditions vary across the different Activity Corridors. Because they are found along major transportation corridors, they are very accessible to drivers but may not be hospitable to users traveling on other modes. Increasing the safety for all users will help Activity Corridors to adjust to the desire for
Figure 2-6: Rothman Institute along Baltimore Pike in Middletown Township is an example of infill development along an Activity Corridor built closer to the street edge with pedestrian amenities.

Economic Development Plan Chapter 2: Place-Based Development
2-16
more walkable and enjoyable shopping destinations. The key attributes below describe the characteristics that will make Activity Corridors of the future thrive.
Key Attributes Activity Corridors of the future…
• Offer a range of travel options as part of a safe and complete multimodal transportation network;
• Connect to adjacent commercial developments and surrounding neighborhoods;
• Promote natural and historic assets near the corridor to create a sense of unique place;
• Encompass a mix of uses, including residential when appropriate, that serve the surrounding neighborhoods;
• Build around existing infrastructure and maintain and improve the systems to remain effective and efficient;
• Capitalize on existing buildings by retrofitting them to meet changing market needs and improve them to add character; and
• Coordinate placemaking and economic development with surrounding communities to improve consistency and cost efficiency.
ACTIONS Objective ED 5 Enhance Activity Corridors to improve community character and provide safe multimodal
connections that attract investment.
Actions Delaware County will… ED 5.1 Identify commercial improvement zones in accordance with Growing from Within. ED 5.2 Study and plan for potential improvements to existing commercial strips. ED 5.3 Develop design strategies to make Activity Corridors more complete, safer for all users,
and connected to surrounding neighborhoods. ED 5.4 Develop an Activity Corridor model zoning ordinance to encourage development
appropriate with long-range vision plans. ED 5.5 Encourage multi-municipal planning and zoning. Municipalities are encouraged to… ED 5.6 Create long-range vision plans to define desired community character and coordinate
efforts amongst stakeholders and municipalities. ED 5.7 Update zoning and take other measures to implement the long-range vision for the
Activity Corridor. ED 5.8 Work with neighboring municipalities along Activity Corridors for consistent and
coordinated improvement efforts.

3 Implementation Plan


Economic Development Plan Chapter 3: Implementation Plan
3-1
Chapter 3: Implementation Plan
OVERVIEW The purpose of this plan is to guide Delaware County and its municipalities in planning for a consistently strong level of economic development. In order to do so, the County and municipalities must work together to implement the actions identified in this plan. It requires a long-term, coordinated effort that involves consistent communication with the public.
HOW THE COUNTY SHOULD USE THIS PLAN As an implementing element of the County’s comprehensive plan, Delaware County 2035, this Economic Development Plan can be used to direct the County’s economic development projects and priorities. The objectives and actions listed throughout the plan provide the path for the County to meet the overarching goals of Innovate, Diversify, and Adapt.
HOW MUNICIPALITIES SHOULD USE THIS PLAN The Economic Development Plan is intended to serve as a resource for municipalities. Municipalities should reference this plan when developing their own comprehensive and economic development plans, and incorporate the countywide vision as appropriate. The actions listed throughout this plan, and compiled below, offer clear direction for municipalities to work toward the goals of this plan.
ACTION PLAN The actions detailed throughout this plan are intended to provide direction for Delaware County and its municipalities in implementing the County economic development vision. A full list of the objectives and corresponding actions, along with timing, can be found in Table 3-1.
Table 3-1: Action Plan OBJECTIVE
ED 1 Support the economic competiveness of Delaware County’s communities through place-based investment, promotion, and outreach.
ACTION Delaware County will…
ED 1.1 Preserve and promote the unique attributes that make the County a desirable place to live and work.
ED 1.2 Maintain and enhance business retention and recruitment through ongoing communication and collaboration.
ED 1.3 Partner with educational and other institutions to leverage economic development opportunities.
ED 1.4 Maximize the commercial and recreational potential of the Delaware River.
ED 1.5 Foster investments that build on the County’s role as an energy and technology hub.
ED 1.6 Coordinate economic development with municipal entities to improve consistency and efficiency.
ACTION Municipalities are encouraged to…
ED 1.7 Develop multi-municipal comprehensive plans and zoning ordinances that take into account larger trends and land-use issues beyond individual municipal boundaries.
ED 1.8 Work cooperatively to plan and implement multi-municipal infrastructure, services, and community facilities to improve economic efficiencies.
: Short Range (1-5 Years) : Medium Range (5-10 Years) : Ongoing

Economic Development Plan Chapter 3: Implementation Plan
3-2
OBJECTIVE
ED 2 Strengthen and preserve Mature Neighborhoods through investments and redevelopment that foster their unique character.
ACTION Delaware County will… ED 2.1 Develop guidelines for redeveloping and revitalizing commercial centers.
ED 2.2 Foster innovation and emerging industries in existing industrial and commercial centers and business districts.
ED 2.3 Facilitate and assist neighborhood revitalization in a manner that supports the unique character of the community.
ED 2.4 Coordinate strategic investments in the transportation network to improve multimodal connectivity.
ED 2.5 Encourage access to and improvement of recreational and community facilities.
ACTION Municipalities are encouraged to…
ED 2.6 Develop a long-range, community-centered vision.
ED 2.7 Adopt zoning and other implementation measures to implement the long-range vision
ED 2.8 Build on historic and unique character to enhance economic strength.
ED 2.9 Promote and market their unique characteristics through outreach that highlights their assets and takes advantage of changing demographic trends.
ED 2.10 Prioritize the remediation of brownfields and the redevelopment of greyfields to encourage reuse of sites.
ED 2.11 Encourage buildings to be retrofitted in ways that meet changing market needs while maintaining unique character.
ED 2.12 Preserve existing affordable housing stock by encouraging rehabilitation or modification of existing homes.
OBJECTIVE
ED 3
Support Growing Suburbs as communities for regional growth while maintaining current assets that make them attractive places.
ACTION Delaware County will…
ED 3.1 Maintain a site selection database as a resource for new business recruitment.
ED 3.2 Assist municipalities in guiding development to designated centers.
ED 3.3 Develop guidelines for retrofitting commercial and office centers to make them more walkable and attractive to changing markets.
ED 3.4 Coordinate strategic investments in the transportation network to improve multimodal connectivity.
ED 3.5 Encourage the development of recreational and community facilities.
ACTION Municipalities are encouraged to…
ED 3.6 Create a long-range, community-centered vision.
ED 3.7 Adopt zoning, official map, and other measures to direct development to desirable locations.
ED 3.8 Develop incentives to encourage high quality design of new development.
ED 3.9 Diversify housing stock, particularly in areas close to employment and commercial centers.
ED 3.10 Diversify tax base to build economic resiliency.
: Short Range (1-5 Years) : Medium Range (5-10 Years) : Ongoing

Economic Development Plan Chapter 3: Implementation Plan
3-3
OBJECTIVE
ED 4 Cultivate Central Places as mixed use destinations to live, work, and play.
ACTION Delaware County will… ED 4.1 Identify commercial improvement zones in accordance with Growing from Within.
ED 4.2 Develop design guidelines focused on improving the experience of residents and visitors in Central Places.
ED 4.3 Develop a Central Places model zoning ordinance to encourage development appropriate with long-range vision plans.
ED 4.4 Create a Central Business District improvement program.
ACTION Municipalities are encouraged to… ED 4.5 Create long-range vision plans to coordinate efforts amongst stakeholders.
ED 4.6 Adopt zoning and other implementation measures to implement the long-range vision.
ED 4.7 Enhance the appearance and attractiveness of streetscapes.
ED 4.8 Develop business improvement districts when and where appropriate to promote and manage improvement and marketing efforts.
OBJECTIVE
ED 5 Enhance Activity Corridors to improve community character and provide safe multimodal connections that attract investment.
ACTION Delaware County will… ED 5.1 Identify commercial improvement zones in accordance with Growing from Within.
ED 5.2 Study and plan for potential improvements to existing commercial strips.
ED 5.3 Develop design strategies to make Activity Corridors more complete, safer for all users, and connected to surrounding neighborhoods
ED 5.4 Develop an Activity Corridor model zoning ordinance to encourage development appropriate with long-range vision plans.
ED 5.5 Encourage multi-municipal planning and zoning.
ACTION Municipalities are encouraged to… ED 5.6 Create long-range vision plans to define desired community character and coordinate efforts
amongst stakeholders and municipalities.
ED 5.7 Update zoning and take other measures to implement the long-range vision for the Activity Corridor.
ED 5.8 Work with neighboring municipalities along Activity Corridors for consistent and coordinated improvement efforts.
: Short Range (1-5 Years) : Medium Range (5-10 Years) : Ongoing

Economic Development Plan Chapter 3: Implementation Plan
3-4
ROLES AND RESPONSIBILITIES The two primary implementers of this plan are the County and its municipalities. Other agencies and organizations can contribute as partners, informational resources, and as sources of technical assistance. It will take the combined efforts of many government agencies, organizations, officials, stakeholders, and motivated citizens to implement all the ideas and actions presented in this plan. This section will lay out roles of implementation and sources of assistance for the implementation of this Economic Development Plan.
MUNICIPALITIES The role of municipalities in economic development planning and implementation is significant. Municipalities establish long-range, community-centered visions for future growth and development through their comprehensive plans and implement plans through zoning and subdivision and land development (SALDO) ordinances. The goals and objectives of comprehensive plans and the parameters for development established through zoning and a municipal SALDO impact local development by establishing the type, location, timing, and intensity of new growth or redevelopment. Municipalities also have an impact on the economy through the development and maintenance of a community transportation system and infrastructure networks. Local governments can nurture community character through the preservation of unique local assets and the development of amenities such as parks and community facilities. Involvement at the municipal level requires participation by governing bodies, local planning commissions, and citizen committees and advisory boards focused on economic development.
DELAWARE COUNTY It is most likely that, under the leadership of Delaware County Council, the Planning Department and the Commerce Center will be responsible for the implementation of many of the action items in this plan.
Planning Department The Planning Department coordinates the development of the County’s comprehensive plan, including Delaware County 2035 and associated component plans. The Land Use Policy Framework Plan establishes and classifies the County into place-based Character Areas and Central Places which provide the framework for this Economic Development Plan. The Department also provides municipal outreach and community assistance services to help local governments develop municipal comprehensive plans, update zoning ordinances, and conduct special studies. The Department significantly impacts economic development in the County through the planning and administration of the County Transportation Improvement Program (TIP) and through working with municipalities to preserve local and regional natural and community resources and assets.
Commerce Center The Commerce Center is the County’s economic development coordinating agency, establishing a marketing and promotion presence through its website and outreach and marketing. The Commerce Center assists companies that are considering locating in Delaware County through the provision of market and site data, technical assistance and coordination with municipalities, and the provision of financial incentives and assistance where appropriate and feasible.

Economic Development Plan Chapter 3: Implementation Plan
3-5
The Commerce Center also works with existing County businesses to provide working capital, tax breaks, and other financial tools to help companies adapt to the changing economy and maintain a competitive edge. The Commerce Center is the main coordination point for working with numerous development authorities and boards. These include the Delaware County Economic Development Oversight Board (EDOB), the Delaware County Industrial Development Authority (IDA), the Delaware County Industrial Development Corporation (IDC), and the Delaware County Redevelopment Authority (RDA). Though each of these entities serve different functions, the Commerce Center serves as the single point-of-contact to help streamline and maximize their effective use in furthering economic development.
Delaware County Workforce Investment Board (WIB) The County Workforce Investment Board is a business-led board that works in partnership with Delaware County to provide job training, educational, employment, and networking resources and opportunities to County residents. The board ensures that County residences have the skills and training to fill new jobs in the service, healthcare, manufacturing, and technology fields, and to maintain an attractive and competitive workforce.
IMPLEMENTATION PARTNERS AND SUPPORT In addition to the County and its municipalities, many other organizations, agencies, and groups have a role to play in implementation of this plan. Some of them can provide technical assistance while others may be able to provide funding for projects. Existing organizations and programs detailed in the following sections can help to further the goals of this plan and help implement its action items.
COMMONWEALTH OF PENNSYLVANIA There are many agencies at the state level that can play a role in implementing the actions contained in this plan. The following is a list of state agencies available to provide funding and technical assistance for implementation of this plan:
Pennsylvania Department of Community and Economic Development (DCED) The Pennsylvania Department of Community and Economic Development (DCED) works to foster opportunities for Pennsylvania business to grow sustainably and for communities to succeed in a global economy. DCED can assist communities with identifying and applying for potential funding sources. They can also provide technical assistance, helping communities identify opportunities to implement the efforts identified in this plan and subsequent planning efforts. DCED funds the Main Street Program – administered by the Pennsylvania Downtown Center – which focuses on revitalizing older business districts through physical design improvements, as well as technical assistance in organizing, marketing, and promotion.
Commonwealth Financing Authority (CFA) The Commonwealth Financing Authority (CFA) was established in 2004 as an independent agency of the Department of Community and Economic Development to administer Pennsylvania’s economic stimulus packages. The CFA holds fiduciary responsibilities over the funding of programs and investments in Pennsylvania’s economic growth.

Economic Development Plan Chapter 3: Implementation Plan
3-6
Pennsylvania Infrastructure Investment Authority (PennVEST) The Pennsylvania Infrastructure Investment Authority (PennVEST) is a state authority that was established in 1988 with the purpose of improving water quality in Pennsylvania by providing low interest loans and grants for drinking water and wastewater capital improvement projects. As such, PennVEST can help communities finance infrastructure projects that may help facilitate desired levels of development and redevelopment.
Pennsylvania Department of Transportation (PennDOT) The Pennsylvania Department of Transportation (PennDOT) works with local governments, the private sector, planning partners, and others to maintain the state’s transportation network. They work to relieve traffic congestion, maintain the transportation network in a state of good repair, and foster the movement of goods. They also work to directly enhance the safety and capacity of alternative modes of transportation, particularly bicycling and pedestrian infrastructure, across the Commonwealth. Their work relates directly to many action items identified in this plan; as such, they are an important partner in implementation.
Pennsylvania Department of Environmental Protection (DEP) The Pennsylvania Department of Environmental Protection (DEP) works to protect the Commonwealth’s air, land, and water from pollution, and to provide for the health and safety of its citizens through a cleaner environment. They work with communities on numerous programs and can help municipalities plan for necessary infrastructure, including water and sewerage, to accommodate desired and appropriate growth in the County.
Pennsylvania Office of the Budget The Pennsylvania Office of the Budget administers The Redevelopment Assistance Capital Program (RACP), which provides grants for the acquisition and construction of regional economic, cultural, civic, recreational, and historical improvement projects. Projects are funded that can have a regional or multi-jurisdictional impact, and generate substantial increases in or maintain current levels of employment, tax revenues, or other measures of economic activity.
Team Pennsylvania Foundation Team Pennsylvania Foundation is a non-partisan, charitable non-profit created in 1997 to bridge the gap between government and the private sector by allowing both sides to partner for the betterment of the Commonwealth of Pennsylvania.
FEDERAL
Economic Development Administration (EDA) The Economic Development Administration (EDA) is the lead federal agency for promoting innovation and competitiveness and preparing various regions of America to compete in the international economy. The EDA Mid-Atlantic Division provides a variety of technical assistance, post-disaster recovery assistance, trade adjustment support, strategic planning, and research and evaluation capacity in the Philadelphia region.

Economic Development Plan Chapter 3: Implementation Plan
3-7
United States Department of Housing and Urban Development (HUD) The United States Department of Housing and Urban Development (HUD) works to promote homeownership, support community development, and increase access to affordable housing, free from discrimination. HUD works with federal and local partners through a variety of offices and initiatives, including Community Development Block Grants (CDBG). CDBG can be used by communities to fund a range of projects, including investment in infrastructure, planning, and community facilities that can align with community economic development goals.
United States Environmental Protection Agency (EPA) The United States Environmental Protection Agency (EPA) works to protect human health and the environment through developing and enforcing standards and regulations; allocating grants to state environmental programs, non-profits, educational institutions, and others; scientific research; and educating the public. The EPA has significant resources available for the assessment, cleanup, and reuse of brownfields. It provides both technical assistance and financial assistance.
INSTITUTIONS, ORGANIZATIONS, BUSINESSES, AND UTILITIES
Delaware County Chamber of Commerce The Delaware County Chamber of Commerce is a business membership and advocacy organization dedicated to enhancing businesses throughout the region, promoting the economic well-being of the County, strengthening the quality of life in the County, and preparing the workforce for future employment opportunities.
Delaware Valley Regional Planning Commission (DVRPC) The Delaware Valley Regional Planning Commission (DVRPC) is the Philadelphia region’s designated Metropolitan Planning Organization (MPO), which also conducts regional planning and offers a variety of funding programs for economic development projects. DVRPC completes a 20-year, long-range plan every four years and also manages the region’s Comprehensive Economic Development Strategy (CEDS) as required by the Economic Development Administration (EDA). DVRPC also hosts quarterly regional economic development forums and sponsors the Classic Towns program, which provides marketing and planning support to member communities.
Delaware River Port Authority (DRPA) The Delaware River Port Authority (DRPA) operates and maintains four bridges that cross the Delaware River, including the Commodore Barry Bridge. The Authority is also involved in transportation and economic development projects associated with these facilities.
Delaware County Community College (DCCC) Workforce Development and Community Education Division The Workforce Development and Community Education Division of the DCCC is a continuous improvement system initiative whereby education, training, and networking resources are provided to develop a skilled workforce in the County for targeted business, industry, government, and educational positions for individuals entering the workforce or transitioning from other careers.

Economic Development Plan Chapter 3: Implementation Plan
3-8
Widener University Small Business Development Center (WSBDC) The Widener University Small Business Development Center (WUSBDC) provides one-on-one consulting and educational services and seminars to new and existing businesses in southeastern Pennsylvania.
Chester Economic Development Authority (CEDA) The Chester Economic Development Authority has several programs to attract business and residential growth and development in the City of Chester. They have assembled the Overtown Revitalization Committee to encourage the revitalization of downtown Chester. The Keystone Opportunity Zone (KOZ), a state program, allows for investment within the zone to be exempted from State and local taxes to encourage redevelopment.
PECO Energy - Economic Development PECO, an Exelon Company, is the electronic utility provider for much of the greater Philadelphia region. PECO’s economic development division provides market and economic data, real estate and site selection services, and financial incentives for electric and energy services.
Economy League of Greater Philadelphia The Economy League is a consulting organization that provides research, analysis, and insights into the regional economy to enhance Philadelphia’s economic development. The league recently prepared the Greater Philadelphia Export Plan for expanding the amount of international exports from the Philadelphia region as well as the location and number of markets and countries to which Philadelphia-area companies export.
The Delaware Valley Industrial Resource Center (DVIRC) The Delaware Valley Industrial Resource Center is an economic development organization dedicated to enhancing the competiveness of the region’s manufacturing through consulting services, networking, training, and education.
Select Greater Philadelphia Select Greater Philadelphia is a business attraction and marketing organization for southeastern Pennsylvania, southern New Jersey, and northern Delaware that provides marketing and communications, business expansion, networking, and research services.

Economic Development Plan References
R-1
References
Delaware County Commerce Center. Growing from Within: A Blueprint for Growth in Delaware County. Media: Delaware County Commerce Center, 2013.
Delaware County Commerce Center. Marcus Hook Industrial Complex Economic Opportunity Reuse Study. Media: Delaware County Commerce Center, 2015.
Delaware County Planning Department. Delaware County 2035 Land Use Policy Framework Plan. Media: Delaware County, 2013.
Delaware Valley Regional Planning Commission. “Regional, County, and Municipal Population Forecasts, 2010-2040”. Philadelphia: Delaware Valley Regional Planning Commission, 2013.
Delaware Valley Regional Planning Commission. Baltimore Avenue Corridor Revitalization Plan. Philadelphia: Delaware Valley Regional Planning Commission, 2007.
EMSI. 2012. Delaware County Employment by Industry. Moscow: EMSI. Distributed by Delaware County Commerce Center.
U.S. Census Bureau. “ACS DEMOGRAPHIC AND HOUSING ESTIMATES 2010-2014 American Community Survey 5-Year Estimates.” 2014 American Community Survey 5-Year Estimates. http://factfinder.census.gov/faces/tableservices/jsf/pages/productview.xhtml?src=CF (accessed July 13, 2016).
U.S. Census Bureau. “Educational Attainment 2010-2014 American Community Survey 5-Year Estimates.” 2014 American Community Survey 5-Year Estimates. http://factfinder.census.gov/faces/tableservices/jsf/pages/productview.xhtml?src=CF (accessed July 13, 2016).
U.S. Census Bureau. “Median Household Income in the Past 12 Months (in 2010 Inflation-Adjusted Dollars.” 2010 American Community Survey 1-Year Estimates. http://factfinder.census.gov/faces/tableservices/jsf/pages/productview.xhtml?pid=ACS_10_1YR_S1903&prodType=table (accessed July 12, 2016).
U.S. Census Bureau. “Median Household Income in the Past 12 Months (in 2014 Inflation-Adjusted Dollars.” 2014 American Community Survey 1-Year Estimates. http://factfinder.census.gov/faces/tableservices/jsf/pages/productview.xhtml?pid=ACS_10_1YR_S1903&prodType=table (accessed July 12, 2016).
U.S. Census Bureau. “Residence County to Workplace County Flows for the United States and Puerto Rico Sorted by Residence Geography: 2006-2010.” American Community Survey 5-Year Estimates. https://www.census.gov/data/tables/2010/demo/metro-micro/commuting-employment-2010.html (accessed July 13, 2016_).
United States Census Bureau. “U.S. Decennial Census 1930 to 1990”. Washington, DC: U.S. Census Bureau.


[ADD COVER PAGE]
Appendices


Economic Development Plan Appendix A: Glossary of Acronyms
A-1
GLOSSARY OF ACRONYMS
CDBG – Community Development Block Grants CEDA – Chester Economic Development Authority CEDC – County Economic Development Center CFA – Commonwealth Financing Authority CRA – County Redevelopment Authority DCCC – Delaware County Community College DCED – Pennsylvania Department of Community and Economic Development DCPD – Delaware County Planning Department DEP – Pennsylvania Department of Environmental Protection DRPA – Delaware River Port Authority DVRPC - Delaware Valley Regional Planning Commission EDA – Economic Development Administration EDOB – Economic Development Oversight Board EPA – United States Environmental Protection Agency HUD – United States Department of Housing and Urban Development IDA – Industrial Development Authority IDC – Industrial Development Corporation KOZ – Keystone Opportunity Zone MPO – Metropolitan Planning Organization MSA – Metropolitan Statistical Area OET – Office of Employment and Training PennDOT – Pennsylvania Department of Transportation PennVest – Pennsylvania Infrastructure Investment Authority RACP – Redevelopment Assistance Capital Program SALDO – Subdivision and Land Development Ordinance SEPTA – Southeastern Pennsylvania Transit Authority WIB – Delaware County Workforce Investment Board


Economic Development Plan Appendix B: Glossary of Terms
B-1
GLOSSARY OF TERMS
AGING-IN-PLACE: The ability to live in one's own home and community safely, independently, and comfortably, regardless of age, income, or ability level. AGRICULTURAL: Land developed with crops, pastures, orchards, tree farms, or other agricultural uses. The farmstead and associated buildings are also agricultural. Single or double lot split-offs with house are included in the agricultural classification. BROWNFIELD: A former industrial or commercial site where future use is affected by real or perceived environmental contamination. BUSINESS IMPROVEMENT DISTRICT: A defined area within which businesses are required to pay an additional tax (or levy) in order to fund projects within the district's boundaries. The BID is often funded primarily through the levy but can also draw on other public and private funding streams. COMPREHENSIVE PLAN: A land use and growth management plan which establishes broad goals and criteria for municipalities to use in preparation of their comprehensive plans and land use regulations. GREYFIELD: Economically obsolescent, outdated, or underutilized lands such as older retail malls or strip centers that no longer attract adequate investment or tenants. INFILL: The use of land within a built-up area, typically for the reuse and repositioning of obsolete or underutilized buildings and sites. May involve a change of type or density of land use. KNOWLEDGE WORKER: A person whose job involves handling or using information to solve non-routine problems. LAND USE: Land use is characterized by the arrangements, activities, and inputs people undertake in a certain land cover type to produce, change, or maintain it. MODE OF TRANSPORTATION: A type of transportation or means of getting from one place to another, including train, trolley, bus, bicycle, walking, motorcycle, car, and van. Multimodal transportation refers to a connected transportation system that supports cars, bicycles, pedestrians, and public transit.
NATURAL RESOURCES: Assets such as soils, woodlands, wetlands, and agricultural lands, along with hydrologic features such as rivers, lakes, and streams, that occur naturally within the County’s landscape. This includes important habitat areas and the wildlife that they contain. Though sensitive to human disturbance, these resources have notable environmental, recreational, visual, and economic benefits, creating a needed balance between growth and their conservation. PLACE MAKING: An approach to community planning and redevelopment that emphasizes local community strengths and characteristics. This includes both physical characteristics, such as parks, housing styles, and transportation, as well as less concrete elements such as special event programming.

Economic Development Plan Appendix B: Glossary of Terms
B-2
REVITALIZATION: The renewal and improvement of older commercial and residential areas through any of a series of actions or programs that support and facilitate private and public investment. This community investment can include (but is not limited to) activities and programs designed to improve neighborhoods; strengthen existing businesses; attract new businesses; encourage quality renovation and new construction; enhance public spaces and pedestrian amenities; ensure safe, efficient, and convenient traffic flow; and contribute to the social and economic vitality of the area. STREETSCAPES: Refers to urban roadway design and conditions as they impact street users and nearby residents. Streetscaping recognizes that streets are places where people engage in various activities, including but not limited to motor vehicle travel. Streetscapes are an important component of the public realm (public spaces where people interact), which help define a community’s aesthetic quality, identity, economic activity, health, social cohesion, and opportunity, not just its mobility. TRANSIT ORIENTED DEVELOPMENT: Compact, pedestrian and biking-friendly, mixed-use development containing medium-to-high density residential, office, and retail uses within walking distance of certain rail transit stations. Well planned TOD should incorporate good design principles and an appropriate mix of uses around rail transit stations to promote transit use and create vibrant neighborhood centers at these locations. UNDEVELOPED/UNIMPROVED LAND: Vacant land areas are areas that are undeveloped and not clearly wooded, nor agricultural, nor developed. WORKFORCE DEVELOPMENT: An economic development approach that attempts to enhance a region's economic stability and prosperity by focusing on people rather than businesses. ZONING ORDINANCE: A document adopted by municipal governments that classifies all land into residential, commercial, industrial, planned development, and/or overlay districts. It describes in detail the permitted density and uses allowed in each zoning district and that lists the specific regulations that govern each land use.

Economic Development Plan Appendix C: Data Sources for Mapping
C-1
DATA SOURCES FOR MAPPING
Map 1-1: Delaware County Delaware County Planning Department Map 1-2: Character Areas and Central Places Delaware County Planning Department Map 1-3: Total Population Change (1980-2010) Delaware County Planning Department Map 1-4: Employment Density OnTheMap; U.S.Census Bureau, Center for Economic Studies. 2014 Map 1-5: Public Transit and Road Network Public Transit Network; Southeastern Pennsylvania Transit Authority (SEPTA) Road Network; Delaware County Planning Department Map 1-6: Freight Assets Freight Network; Delaware Valley Regional Planning Commission (DVRPC) Pipeline Network; United States Department of Transportation (US DOT), National Pipeline Mapping System (NPMS)


Economic Development Plan Appendix D: Municipal Population Figures
D-1
MUNICIPAL POPULATION FIGURES
Table D-1: U.S. Census Population Figures for Delaware County Municipalities 1980 to 2010
Municipality
Population Population Change % Population Change
1980 1990 2000 2010 1980-2000
2000-2010
1980-2010
1980-2000
2000-2010
1980-2010
Aldan Borough 4,671 4,549 4,313 4,152 -358 -161 -519 -7.7% -3.7% -11.1%
Aston Township 14,530 15,080 16,203 16,592 1,673 389 2,062 11.5% 2.4% 14.2%
Bethel Township 2,438 3,330 6,421 8,791 3,983 2,370 6,353 163.4% 36.9% 260.6%
Brookhaven Borough 7,912 8,567 7,985 8,006 73 21 94 0.9% 0.3% 1.2%
Chadds Ford Township 2,057 3,118 3,170 3,640 1,113 470 1,583 54.1% 14.8% 77.0%
Chester City 45,794 41,856 36,854 33,972 -8,940 -2,882 -11,822 -19.5% -7.8% -25.8%
Chester Heights Borough 1,302 2,273 2,481 2,531 1,179 50 1,229 90.6% 2.0% 94.4%
Chester Township 5,687 5,399 4,604 3,940 -1,083 -664 -1,747 -19.0% -14.4% -30.7%
Clifton Heights Borough 7,320 7,111 6,779 6,652 -541 -127 -668 -7.4% -1.9% -9.1%
Collingdale Borough 9,539 9,175 8,664 8,786 -875 122 -753 -9.2% 1.4% -7.9%
Colwyn Borough 2,851 2,613 2,453 2,546 -398 93 -305 -14.0% 3.8% -10.7%
Concord Township 6,437 6,933 9,933 17,231 4,802 7,298 10,794 74.6% 73.5% 167.7%
Darby Borough 11,513 11,140 10,299 10,687 -1,214 388 -826 -10.5% 3.8% -7.2%
Darby Township 12,264 10,955 9,622 9,264 -2,642 -358 -3,000 -21.5% -3.7% -24.5%
East Lansdowne Borough 2,806 2,691 2,586 2,668 -220 82 -138 -7.8% 3.2% -4.9%
Eddystone Borough 2,555 2,446 2,442 2,410 -113 -32 -145 -4.4% -1.3% -5.7%
Edgmont Township 1,410 2,735 3,918 3,987 2,508 69 2,577 177.9% 1.8% 182.8%
Folcroft Borough 8,231 7,506 6,978 6,606 -1,253 -372 -1,625 -15.2% -5.3% -19.7%
Glenolden Borough 7,633 7,260 7,476 7,153 -157 -323 -480 -2.1% -4.3% -6.3%
Haverford Township 52,349 49,848 48,498 48,491 -2,741 -7 -3,858 -5.2% 0.0% -7.4%
Lansdowne Borough 11,891 11,712 11,044 10,620 -847 -424 -1,271 -7.1% -3.8% -10.7%
Lower Chichester Twp. 3,784 3,660 3,591 3,469 -193 -122 -315 -5.1% -3.4% -8.3%
Marcus Hook Borough 2,638 2,546 2,314 2,397 -324 83 -241 -12.3% 3.6% -9.1%
Marple Township 23,642 23,123 23,737 23,428 95 -309 -214 0.4% -1.3% -0.9%
Media Borough 6,119 5,957 5,533 5,327 -586 -206 -792 -9.6% -3.7% -12.9%
Middletown Township 12,463 14,130 16,064 15,807 3,601 -257 3,344 28.9% -1.6% 26.8%
Millbourne Borough 652 831 943 1,159 291 216 507 44.6% 22.9% 77.8%
Morton Borough 2,412 2,851 2,715 2,669 303 -46 257 12.6% -1.7% 10.7%
Nether Providence Twp. 12,730 13,229 13,456 13,706 726 250 976 5.7% 1.9% 7.7%
Newtown Township 11,775 11,366 11,700 12,216 -75 516 441 -0.6% 4.4% 3.7%
Norwood Borough 6,647 6,162 5,985 5,890 -662 -95 -757 -10.0% -1.6% -11.4%
Parkside Borough 2,464 2,369 2,267 2,328 -197 61 -136 -8.0% 2.7% -5.5%
Prospect Park Borough 6,593 6,764 6,594 6,454 1 -140 -139 0.0% -2.1% -2.1%
Radnor Township 27,676 28,703 30,878 31,531 3,202 653 3,855 11.6% 2.1% 13.9%
Ridley Park Borough 7,889 7,592 7,196 7,002 -693 -194 -887 -8.8% -2.7% -11.2%
Ridley Township 33,771 31,169 30,791 30,768 -2,980 -23 -3,003 -8.8% -0.1% -8.9%
Rose Valley Borough 1,038 982 944 913 -94 -31 -125 -9.1% -3.3% -12.0%
Rutledge Borough 934 843 860 784 -74 -76 -150 -7.9% -8.8% -16.1%

Economic Development Plan Appendix D: Municipal Population Figures
D-2
Table D-1: U.S. Census Population Figures for Delaware County Municipalities (cont.) 1980 to 2010
Municipality
Population Population Change % Population Change
1980 1990 2000 2010 1980-2000
2000-2010
1980-2010
1980-2000
2000-2010
1980-2010
Sharon Hill Borough 6,221 5,771 5,468 5,697 -753 229 -524 -12.1% 4.2% -8.4%
Springfield Township 25,326 24,160 23,677 24,211 -1,649 534 -1,115 -6.5% 2.3% -4.4%
Swarthmore Borough 5,950 6,157 6,170 6,194 220 24 244 3.7% 0.4% 4.1%
Thornbury Township 3,653 4,728 7,093 8,028 2,134 935 4,375 58.4% 13.2% 119.8%
Tinicum Township 4,291 4,440 4,353 4,091 62 -262 -200 1.4% -6.0% -4.7%
Trainer Borough 2,056 2,271 1,901 1,828 -155 -73 -228 -7.5% -3.8% -11.1%
Upland Borough 3,458 3,334 2,977 3,239 -481 262 -219 -13.9% 8.8% -6.3%
Upper Chichester Twp. 14,377 15,004 16,842 16,738 2,465 -104 2,361 17.1% -0.6% 16.4%
Upper Darby Township 84,054 81,177 81,821 82,795 -2,233 974 -1,259 -2.7% 1.2% -1.5%
Upper Providence Twp. 9,477 9,727 10,509 10,142 1,032 -367 665 10.9% -3.5% 7.0%
Yeadon Borough 11,727 11,980 11,762 11,443 35 -319 -284 0.3% -2.7% -2.4%
COUNTY TOTALS 112,518 111,994 111,860 118,849 -3,033 8,115 3,972 -0.5% 1.5% 0.7%
Source: U.S. Census Bureau

Economic Development Plan Appendix E: Proposed Development in Delaware County
E-1
PROPOSED DEVELOPMENT IN DELAWARE COUNTY
Table E-1: Proposed Residential Units in Delaware County
2002 to 2015
Municipality Number of Proposed Residential Units
2002 2003 2004 2005 2006 2007 2008 2009 2010 2011 2012 2013 2014 2015 2002-15
Aldan Borough 0 1 1 3 0 0 0 1 0 0 0 0 0 0 6
Aston Township 30 186 79 209 15 9 1 1 284 0 0 0 0 0 814
Bethel Township 71 60 556 6 9 4 2 1 101 0 59 12 0 2 883
Brookhaven Borough 1 3 0 164 18 5 85 2 2 0 0 5 1 3 289
Chadds Ford Township 21 82 6 4 0 1 2 0 0 0 2 0 0 0 118
Chester City 0 2 28 144 13 70 4 73 5 64 0 0 0 0 403
Chester Heights Borough 11 0 68 0 0 0 0 0 21 1 0 0 34 78 213
Chester Township 0 0 0 0 0 0 0 71 48 71 0 0 0 0 190
Clifton Heights Borough 0 0 0 3 5 0 0 2 140 0 10 0 0 0 160
Collingdale Borough 0 0 2 4 4 0 0 0 0 0 0 0 0 0 10
Colwyn Borough 0 0 0 0 0 0 0 0 0 0 0 0 0 0 0
Concord Township 135 217 79 61 770 4 381 11 0 6 505 165 173 7 2,514
Darby Borough 0 0 0 0 0 0 0 0 0 0 0 0 0 0 0
Darby Township 0 4 0 1 8 34 2 2 0 1 4 0 0 0 56
East Lansdowne Borough 0 0 0 0 0 0 0 0 0 0 0 0 0 0 0
Eddystone Borough 0 0 0 0 0 0 0 0 0 0 2 0 0 0 2
Edgmont Township 34 27 37 23 23 24 5 0 5 3 1 2 2 2 188
Folcroft Borough 6 4 0 6 0 2 0 0 0 0 0 0 0 0 18
Glenolden Borough 0 2 0 2 1 0 0 1 0 0 2 0 0 0 8
Haverford Township 31 14 7 15 3 306 6 3 7 19 5 11 7 12 446
Lansdowne Borough 41 0 0 0 2 0 0 0 4 0 0 0 0 0 47
Lower Chichester Township 0 0 0 0 0 1 0 0 0 0 0 0 0 0 1
Marcus Hook Borough 1 0 0 0 14 0 0 0 0 0 0 0 0 0 15
Marple Township 44 34 33 8 8 18 4 2 59 0 152 144 1 15 522

Economic Development Plan Appendix E: Proposed Development in Delaware County
E-2
Table E-1: Proposed Residential Units in Delaware County (cont.)
2002 to 2015
Municipality Number of Proposed Residential Units
2002 2003 2004 2005 2006 2007 2008 2009 2010 2011 2012 2013 2014 2015 2002-15
Media Borough 13 21 5 13 2 2 3 0 0 22 16 26 1 24 148
Middletown Township 223 82 36 626 22 3 0 22 136 139 13 335 3 316 1,956
Millbourne Borough 0 0 0 0 0 0 0 0 0 0 0 0 0 0 0
Morton Borough 3 2 0 8 3 0 0 1 0 0 8 0 0 0 25
Nether Providence Township 5 2 17 172 26 6 1 3 0 4 7 0 0 0 243
Newtown Township 1 229 3 152 18 8 0 26 449 0 390 41 2 148 1,467
Norwood Borough 0 0 2 0 4 0 0 0 0 80 0 0 0 0 86
Parkside Borough 0 0 0 0 0 0 0 0 0 0 0 0 0 0 0
Prospect Park Borough 1 3 12 6 4 0 0 0 5 3 4 0 0 0 38
Radnor Township 12 10 32 82 4 4 19 0 0 14 24 13 150 9 373
Ridley Park Borough 2 6 12 6 2 3 3 0 0 0 8 2 5 1 50
Ridley Township 4 11 11 50 48 2 5 9 49 0 11 86 0 52 338
Rose Valley Borough 0 0 0 0 45 0 0 0 0 5 0 0 0 0 50
Rutledge Borough 0 0 0 0 0 1 0 0 0 0 0 0 0 0 1
Sharon Hill Borough 0 4 2 4 6 0 1 0 3 0 0 0 0 0 20
Springfield Township 8 26 65 31 2 1 0 2 3 1 7 2 2 7 157
Swarthmore Borough 1 0 3 0 0 0 0 0 0 0 0 2 0 0 6
Thornbury Township 88 14 11 86 38 0 1 2 6 0 8 33 39 24 350
Tinicum Township 2 0 3 33 5 4 0 1 0 0 0 0 0 0 48
Trainer Borough 8 0 0 0 30 18 12 0 0 0 0 0 0 0 68
Upland Borough 0 128 64 114 0 0 0 0 2 0 2 0 0 0 310
Upper Chichester Township 66 39 32 63 14 86 35 85 0 0 0 2 0 6 428
Upper Darby Township 72 108 8 22 0 0 6 2 0 26 3 2 68 1 318
Upper Providence Township 24 92 3 11 14 13 4 0 5 0 1 2 12 5 186
Yeadon Borough 0 0 0 0 3 0 33 22 0 0 0 0 0 0 58
Delaware County 959 1,413 1,217 2,132 1,183 629 615 345 1,334 459 1,244 885 500 712 13,327 Note: Figures presented reflect proposed (not constructed) development
Source: DCPD, 2016

Economic Development Plan Appendix E: Proposed Development in Delaware County
E-3
Table E-2: Proposed Non-Residential Development in Delaware County
2002 to 2015
Municipality Proposed Nonresidential Building Area in Square Feet by Year
2002 2003 2004 2005 2006 2007 2008 2009 2010 2011 2012 2013 2014 2015 2002-15
Aldan Borough 0 0 10,160 0 0 0 0 0 0 0 0 0 0 0 10,160
Aston Township 17,778 51,163 106,245 0 1,200 152,820 147,230 0 14,942 15,470 0 12,160 8,137 10,000 537,145
Bethel Township 6,869 6,869 28,400 109,560 300 79,804 6,600 2,984 166,140 8,572 0 0 0 2,425 418,523
Brookhaven Borough 2,610 0 0 15,038 7,772 3,607 1,440 0 0 0 0 68,000 170,474 270,311 539,252
Chadds Ford Township 75,148 37,340 46,600 140,065 25,280 76,982 10,492 0 14,341 0 0 7,890 99,688 18,410 552,236
Chester City 281,728 83,720 424,266 473,115 27,924 55,154 134,489 45,869 43,791 52,706 9,998 45,306 40,050 21,720 1,739,836
Chester Heights Borough 0 325 0 0 282,700 102,700 0 0 5,600 0 0 6,340 302,800 0 700,465
Chester Township 283,362 131,454 0 9,600 301,914 59,800 607,011 24,614 44,800 0 0 0 0 0 1,462,555
Clifton Heights Borough 0 2,100 0 9,992 0 2,160 0 0 12,890 0 735 0 0 3,824 31,701
Collingdale Borough 37,709 0 0 1,000 0 0 85 0 0 0 0 0 9,100 0 47,894
Colwyn Borough 0 0 0 0 0 0 0 0 0 0 1,904 0 0 0 1,904
Concord Township 262,319 64,863 141,032 166,409 794,904 1,243,340 1,120,535 226,053 3,824 150,458 300,283 211,855 46,400 211,808 4,944,083
Darby Borough 15,468 13,057 0 0 0 0 21,522 43,814 0 0 3,825 0 0 0 97,686
Darby Township 142,680 29,712 63,666 1,500 24,975 4,950 0 0 0 7,650 0 0 0 0 275,133
East Lansdowne Borough 0 0 0 0 0 0 0 0 0 0 0 0 0 0 0
Eddystone Borough 0 95,000 0 2,172 0 9,600 0 0 130,676 34,617 0 114,697 0 0 386,762
Edgmont Township 58,005 0 0 110,030 248,288 46,678 1,000 0 19,400 4,085 0 0 0 0 487,486
Folcroft Borough 1,985 0 3,000 0 49,675 44,300 76,800 5,495 0 2,180 0 0 0 0 183,435
Glenolden Borough 12,150 3,329 0 0 0 0 2,230 0 0 0 0 8,100 0 0 25,809
Haverford Township 12,438 17,000 105,048 0 87,630 0 85,473 26,226 147,380 223,586 1,157 10,836 62,400 4,450 783,624
Lansdowne Borough 0 0 0 0 0 2,800 0 0 27,897 0 0 0 2,010 0 32,707
Lower Chichester Twp 0 0 81,000 0 0 12,000 153,900 9,375 0 0 0 0 175,600 6,900 438,775
Marcus Hook Borough 0 10,500 0 0 0 6,000 30,000 0 0 3,150 0 0 0 28,885 78,535
Marple Township 26,180 1,680 38,133 11,658 10,317 62,850 12,157 6,556 2,980 471 2,560 2,240 7,595 76,075 261,452
Media Borough 19,769 2,364 11,616 18,410 124,191 4,974 99,777 720 10,173 65,364 6,099 0 7,045 0 370,502
Middletown Township 384,729 22,774 49,453 84,411 58,067 1,438,019 38,261 0 38,437 215,786 4,809 40,200 6,125 447,656 2,828,727

Economic Development Plan Appendix E: Proposed Development in Delaware County
E-4
Table E-2: Proposed Non-Residential Development in Delaware County (cont.)
2002 to 2015
Municipality Proposed Nonresidential Building Area in Square Feet by Year
2002 2003 2004 2005 2006 2007 2008 2009 2010 2011 2012 2013 2014 2015 2002-15
Millbourne Borough 0 0 0 0 1,800 0 0 0 484 0 120 0 0 0 2,404
Morton Borough 0 0 0 0 0 4,780 0 0 0 0 0 0 0 0 4,780
Nether Providence Twp 10,938 0 12,437 15,357 0 97,075 0 7,341 32,460 0 29,051 0 936 0 205,595
Newtown Township 44,519 5,842 21,800 523,956 513,772 210,769 33,928 42,582 198,301 57,520 4,720 0 43,243 32,255 1,733,207
Norwood Borough 2,040 0 0 0 0 0 0 0 0 0 0 0 0 0 2,040
Parkside Borough 0 0 0 0 0 0 0 0 0 0 0 0 0 0 0
Prospect Park Borough 2,000 0 0 0 11,153 0 0 2,157 0 0 0 0 0 0 15,310
Radnor Township 63,604 233,161 214,223 495,698 110,005 4,351 145,011 19,802 83,714 47,080 272,202 34,717 646,497 915,866 3,285,931
Ridley Park Borough 0 0 0 46,737 0 0 0 1,584 0 0 0 0 0 0 48,321
Ridley Township 27,015 31,025 18,563 22,400 45,644 16,414 129,185 3,160 15,936 20,210 124,195 26,583 55,309 20,469 556,108
Rose Valley Borough 0 0 0 0 0 0 0 0 0 0 0 0 0 0 0
Rutledge Borough 0 0 0 0 0 0 0 0 0 0 0 0 0 0 0
Sharon Hill Borough 4,285 0 0 98,520 0 0 0 0 0 24,472 280 0 448 0 128,005
Springfield Township 110,651 16,642 13,346 24,438 4,000 63,413 306,486 94,519 22,069 14,400 64,017 7,052 35,374 39,650 816,057
Swarthmore Borough 55,000 65,000 0 0 0 0 0 0 0 0 0 90,678 47,203 20,045 277,926
Thornbury Township 300 0 3,750 0 4,370 0 0 130,886 0 0 0 0 0 0 139,306
Tinicum Township 23,775 61,737 15,085 115,290 57,412 53,815 55,649 12,723 0 0 447,036 730 3,600 560 847,412
Trainer Borough 0 0 0 0 84,390 28,001 0 0 0 2,900 0 0 0 34,885 150,176
Upland Borough 195,100 0 0 0 30,277 0 0 0 0 0 8,400 0 0 0 233,777
Upper Chichester Twp 48,844 235,230 27,000 82,628 103,056 7,763 0 151,339 63,535 7,332 59,558 0 11,939 19,500 817,724
Upper Darby Township 144,474 54,469 15,159 34,025 41,751 2,510 34,790 11,574 87,683 98,093 13,408 30,301 4,940 21,097 594,274
Upper Providence Twp 27,690 10,600 21,933 23,500 6,912 0 734 31,346 0 3,700 0 0 10,990 0 137,405
Yeadon Borough 0 0 0 0 4,800 0 0 0 0 9,180 0 1,200 0 0 15,180
Delaware County 2,401,162 1,286,956 1,471,915 2,635,509 3,064,479 3,897,429 3,254,785 900,719 1,187,453 1,068,982 1,354,357 718,885 1,797,991 2,206,791 27,247,413
Note: Figures presented reflect proposed (not constructed) development
Source: DCPD, 2016

Economic Development Plan Appendix F: Major Employers
F-1
MAJOR EMPLOYERS
Table F-1: Delaware County Top 50 Employers 3rd Quarter 2015
Note: Federal and State Government Entities Aggregated; State Government includes all state employment except Pennsylvania State University, SEPTA, System of Higher Education, PA College of Technology, and PHEAA. Source: Pennsylvania Center for Workforce Information & Analysis: https://www.workstats.dli.pa.gov/Products/Top50/Pages/default.aspx
Rank Name of Employer Rank Name of Employer
1 The Boeing Company 26 Crozer Keystone Health Network
2 Crozer-Chester Medical Center 27 Garnet Valley School District
3 Delaware County 28 Ridley School District
4 Villanova University 29 Melmark Inc. 5 United Parcel Service Inc. 30 Delaware County Intermediate Unit
6 AmeriHealth Mercy Services LLC 31 Lincoln National Life Insurance Co. 7 Wawa Inc. 32 Radnor Township School District
8 Federal Government 33 Rose Tree Media School District
9 Sap Of America Inc. 34 Interboro School District
10 Elwyn 35 Haverford College
11 Mercy Catholic Medical Center 36 Home Depot USA Inc. 12 Upper Darby School District 37 Comcast Cablevision Corp (PA) 13 Giant Food Stores LLC 38 Chichester School District
14 Harrah’s Chester Downs Management Co 39 Marple Newtown School District
15 Acme Markets Inc. 40 Southeast Delco School District
16 State Farm Mutual Automobile Ins Co 41 Southeastern Pa Transportation Authority
17 State Government 42 Target Corporation
18 Widener University 43 Maris Grove Inc. 19 Riddle Memorial Hospital 44 Heartland Employment Services LLC
20 Delaware County Memorial Hospital 45 Pennsylvania CVC Pharmacy LLC
21 Swarthmore College 46 Neumann University
22 Wal-Mart Associates Inc. 47 William Penn School District
23 Delaware County Community College 48 Kimberly Clark Pa LLC
24 School District Of Haverford Township 49 Philadelphia Freedom Valley YMCA
25 The Arthur Jackson Company 50 Community Education Center Inc.