economic, energy, and subcontract report - nrel · economic, energy, and environmental benefits of...
TRANSCRIPT

National Renewable Energy Laboratory Innovation for Our Energy Future
A national laboratory of the U.S. Department of EnergyOffice of Energy Efficiency & Renewable Energy
NREL is operated by Midwest Research Institute ● Battelle Contract No. DE-AC36-99-GO10337
Economic, Energy, and Environmental Benefits of Concentrating Solar Power in California L. Stoddard, J. Abiecunas, and R. O'Connell Black & Veatch Overland Park, Kansas
In Collaboration with the Interfaith Environmental Council and the Coalition on the Environment and Jewish Life of Southern California Los Angeles, California
Subcontract Report NREL/SR-550-39291 April 2006
Economic, Energy, and Environmental Benefits of Concentrating Solar Power in California May 2005 – April 2006 L. Stoddard, J. Abiecunas, and R. O'Connell Black & Veatch Overland Park, Kansas
NREL Technical Monitor: M. Mehos Prepared under Subcontract No. AEK-5-55036-01 Reviewed by: Tim Carmichael, Coalition for Clean Air Los Angeles, California
Ralph Cavanagh, Natural Resources Defense Council San Francisco, California
Mary Nichols, UCLA Institute of the Environment Los Angeles, California
Lee Wallach, Coalition on the Environment and Jewish Life and Interfaith Environmental Council
Ryan Wiser, Lawrence Berkeley National Laboratory Berkeley, California
Subcontract Report NREL/SR-550-39291 April 2006
National Renewable Energy Laboratory 1617 Cole Boulevard, Golden, Colorado 80401-3393 303-275-3000 • www.nrel.gov
Operated for the U.S. Department of Energy Office of Energy Efficiency and Renewable Energy by Midwest Research Institute • Battelle
Contract No. DE-AC36-99-GO10337
NOTICE
This report was prepared as an account of work sponsored by an agency of the United States government. Neither the United States government nor any agency thereof, nor any of their employees, makes any warranty, express or implied, or assumes any legal liability or responsibility for the accuracy, completeness, or usefulness of any information, apparatus, product, or process disclosed, or represents that its use would not infringe privately owned rights. Reference herein to any specific commercial product, process, or service by trade name, trademark, manufacturer, or otherwise does not necessarily constitute or imply its endorsement, recommendation, or favoring by the United States government or any agency thereof. The views and opinions of authors expressed herein do not necessarily state or reflect those of the United States government or any agency thereof.
Available electronically at http://www.osti.gov/bridge
Available for a processing fee to U.S. Department of Energy and its contractors, in paper, from:
U.S. Department of Energy Office of Scientific and Technical Information P.O. Box 62 Oak Ridge, TN 37831-0062 phone: 865.576.8401 fax: 865.576.5728 email: mailto:[email protected]
Available for sale to the public, in paper, from: U.S. Department of Commerce National Technical Information Service 5285 Port Royal Road Springfield, VA 22161 phone: 800.553.6847 fax: 703.605.6900 email: [email protected] online ordering: http://www.ntis.gov/ordering.htm
This publication received minimal editorial review at NREL
Printed on paper containing at least 50% wastepaper, including 20% postconsumer waste
NREL CA Solar Benefits Contents
Contents Executive Summary .......................................................................................................ES-1 1.0 Introduction.......................................................................................................... 1-1 2.0 CSP Technology Assessment .............................................................................. 2-1
2.1 Description of Technologies .................................................................... 2-2 2.2 Commercial Status of Technologies ........................................................ 2-3 2.3 Technology Selection for Benefits Analysis............................................ 2-4
3.0 California CSP Resource Assessment ................................................................. 3-1 4.0 Deployment of CSP Plants in California ............................................................. 4-1 5.0 Economic Impacts of CSP in California.............................................................. 5-1
5.1 Economic Impacts Model ........................................................................ 5-1 5.2 Input Data for the Model.......................................................................... 5-3
5.2.1 Estimation of California-Supplied Goods and Services............ 5-4 5.2.2 Costs Versus Deployment Year............................................... 5-10
5.3 Base Case Economic Impacts Analysis Results .................................... 5-10 5.4 Economic Impacts Sensitivity Analysis................................................. 5-15 5.5 Fiscal Impacts ........................................................................................ 5-18
6.0 Cost and Value of CSP Energy............................................................................ 6-1
6.1 The Market Price Referent....................................................................... 6-1 6.2 Cost of Energy Calculations .................................................................... 6-2 6.3 The Time of Delivery Value of CSP Energy ........................................... 6-5
7.0 Environmental and Hedging Benefits.................................................................. 7-1
7.1 Reduction in Criteria and CO2 Air Emissions ......................................... 7-1 7.2 Hedging Impact of CSP on Natural Gas Prices ....................................... 7-2
7.2.1 Natural Gas Use in the United States ........................................ 7-2 7.2.2 Natural Gas Use in California ................................................... 7-3 7.2.3 Natural Gas Prices and Price Volatility..................................... 7-5 7.2.4 The Hedging Impact of CSP Deployment in California ........... 7-6
April 21, 2006 TC-1

NREL CA Solar Benefits Contents
Contents (Continued) 8.0 Conclusions.......................................................................................................... 8-1 Appendix A Technology Assessment
Tables Table ES-1 Power Plant Characteristics .........................................................................1 Table ES-2 Delivered Levelized Energy Cost and Economic Impacts for CSP
and Gas Technologies in 2015 ($2005) .......................................................3 Table 3-1 Concentrating Solar Power Technical Potential ...................................... 3-1 Table 4-1 Deployment Scenarios ............................................................................. 4-3 Table 5-1 CSP Plant Capital Cost Breakdowns, 2005 $1,000 ................................. 5-5 Table 5-2 CSP O&M Cost Breakdowns, 2005 $1,000............................................. 5-5 Table 5-3 Combined Cycle and Simple Cycle Plant Assumptions .......................... 5-6 Table 5-4 Conventional Combustion Turbine Power Generation Capital
Cost Breakdowns, 2005 $1,000 ............................................................... 5-6 Table 5-5 Conventional Combustion Turbine Power Generation O&M
Cost Breakdowns, 2005 $1,000 ............................................................... 5-7 Table 5-6 Base Case Breakdown of Expenditures in Southern California,
percent...................................................................................................... 5-8 Table 5-7 Base Case Direct and Indirect Economic Impacts of One
100 MW CSP Plant in 2008 ($2005) ..................................................... 5-11 Table 5-8 Total Economic Impacts of One CSP or Conventional Plant in
2008 per 100 MW ($2005) .................................................................... 5-12 Table 5-9 Total Present Value of CSP Development for Two Deployment
Scenarios ($2005) .................................................................................. 5-14 Table 5-10 Material Expenditures in California Sensitivity Criteria, percent ......... 5-16 Table 6-1 Financial Assumptions for Cost of Energy Calculations......................... 6-3 Table 6-2 Levelized Cost Comparison..................................................................... 6-4 Table 7-1 Emissions Reduction by CSP Plants........................................................ 7-2
Figures Figure ES-1 California Electric Power Sector, Annual Average Natural Gas
Prices, $ per Mcf ..........................................................................................3 Figure 2-1 CSP Systems ............................................................................................ 2-1 Figure 3-1 Direct Normal Radiation Solar Resource Land Greater Than
1 Percent Slope Excluded ........................................................................ 3-2
April 21, 2006 TC-2
NREL CA Solar Benefits Contents
Figures (Continued) Figure 4-1 California Renewable Portfolio Standard ................................................ 4-2 Figure 5-1 Base Case Employment Impact Comparison......................................... 5-13 Figure 5-2 CSP Low and High Deployment Scenarios ........................................... 5-13 Figure 5-3 Low and High Deployment Scenarios Total Impact to Earnings
and Employment .................................................................................... 5-15 Figure 5-4 Construction Economic Impacts Sensitivity Analysis for
100 MW CSP Plant................................................................................ 5-17 Figure 5-5 Construction Economic Impacts Sensitivity Analysis of Low and
High CSP Deployment Scenarios .......................................................... 5-18 Figure 6-1 Conceptual Generation Scenario with Storage ........................................ 6-5 Figure 7-1 Historic and Forecast Natural Gas Demand by Sector (NPC
2002) ........................................................................................................ 7-3 Figure 7-2 Breakdown of US Capacity Additions by On-Line Date (MW).............. 7-4 Figure 7-3 California’s Natural Gas Sources for 2004.............................................. 7-4 Figure 7-4 California Electric Power Sector, Annual Average Natural Gas
Prices, $ per MCF .................................................................................... 7-5 Figure 7-5 Generation Sources for California Electricity in 2004 ............................ 7-7 Figure 7-6 Annual Variation in Renewable Energy Project Capacity Factors.......... 7-8 Figure 7-7 Effect of CSP Deployment on Statewide Generation Cost
(Current Portfolio with $7.00/MMBtu gas = 100)................................... 7-9
April 21, 2006 TC-3

NREL CA Solar Benefits Executive Summary
Executive Summary This study provides a summary assessment of concentrating solar power (CSP) and its potential economic return, energy supply impact, and environmental benefits for the State of California. Emphasis was placed on in-state economic impact in terms of direct and indirect employment created by the manufacture, installation, and operation of CSP plants. The environmental impact of CSP relative to natural gas fueled counterparts was studied. The value of CSP as a hedge against natural gas price increases and volatility was also analyzed. Black & Veatch chose a 100 MW parabolic trough plant with 6 hours of storage as the representative CSP plant to focus the results of the study. Cumulative deployment scenarios of 2,100 MW and 4,000 MW between 2008 and 2020 were assumed. Based on estimates provided by the National Renewable Energy Laboratory (NREL), future CSP technology improvements were incorporated into the study by assuming that 150 MW and 200 MW plants would be constructed starting in 2011 and 2015, respectively. The NREL estimates include reduced installed costs over time as a result of technology learning and increased construction efficiency. The levelized cost of electric production was calculated for each CSP plant. There are indications that recently bid trough plants may have somewhat lower capital costs than those used in this report; however, these data are not publicly available. Overall, while lower capital costs can somewhat lower the economic impact in California, the decrease is not expected to significantly change the conclusions of this report. Currently (and for the foreseeable future), natural gas fueled combustion turbine based power plants are the most frequent choice for new power plants in California. As suggested in Table ES-1, the utility electric supply needs served by simple cycle and combined cycle plants tend to be those that might be served by CSP with storage. Thus, these two gas technologies are identified as conventional technology benchmarks for comparison of CSP competitiveness and economic impacts.
Table ES-1 Power Plant Characteristics
Typical Size Typical Duty Capacity Factor
Simple Cycle 85 MW Peaking 10 percent
Combined Cycle 500 MW Intermediate 40 percent
CSP with 6 Hours Storage 100 to 200 MW Intermediate or Peaking 40 percent
April 21, 2006 ES-1

NREL CA Solar Benefits Executive Summary
A comparison of the levelized cost of energy (LCOE) revealed that the LCOE of $148 per MWh for the first CSP plants installed in 2009 is competitive with the simple cycle combustion turbine at an LCOE of $168 per MWh, assuming that the temporary 30 percent Investment Tax Credit is extended. The LCOE for the CSP plant is higher than the $104 per MWh LCOE of the combined cycle combustion turbine plant.1 The economic impacts of CSP construction and operation were estimated with standard economic tools. Black & Veatch used the Regional Input-Output Modeling System (RIMS II) developed and maintained by the US Bureau of Economic Analysis. This analysis revealed that each 100 MW of CSP results in 94 permanent operations and maintenance jobs compared to 56 and 13 for combined cycle and simple cycle combustion turbine plants, respectively. In terms of economic return, for each 100 MW of installed capacity, the CSP plant was estimated to create about $628 million in impact to gross state output compared to an impact of about $64 million for the combined cycle plant and $47 million for the simple cycle plant. The higher CSP state economic impacts are due, in part, to the greater capital and operating costs of CSP plants. However, irrespective of plant cost, it should be noted that a greater percentage of each CSP investment dollar is returned to California in economic benefits. For each dollar spent on the installation of CSP plants, there is a total impact (direct plus indirect impacts) of about $1.40 to gross state output for each dollar invested compared to roughly $0.90 to $1.00 for each dollar invested in natural gas fueled generation. For plants installed in the latter stages of the deployment scenarios, CSP cost reductions become evident and the solar technology becomes a potentially competitive choice for both peaking and intermediate duty cycles. As shown in Table ES-2, CSP plants installed in 2015 are projected to exhibit a delivered LCOE of $115/MWh,2 compared with $168/MWh for the simple cycle combustion turbine and $104/MWh for combined cycle plants. At a natural gas price of about $8 per MMBtu, the LCOE of CSP and the combined cycle plants at 40 percent capacity factor are equal.3 Note that this analysis does not assume improvements to combustion turbine power generation technology, which were outside the scope of this study. However, assuming that improvements to combustion turbine power generation efficiency and cost are likely to be modest, the LCOE of CSP in 2015 is likely to be competitive with combustion turbine power generation technologies.
1 These prices use the California Market Price Referent (MPR) gas price forecast, which is equivalent to $6.40/MMBtu escalated at 2.5 percent annually. All dollars are $2005. 2 With the permanent 10 percent ITC. With the 30 percent ITC, the cost drops to $103/MWh. 3 The MPR gas forecast for 2015 is $8/MMBtu. Futures prices on NYMEX were well above $10/MMBtu for the last four months of 2005, and are down to roughly $7.50/MMBtu as of April 1, 2006.
April 21, 2006 ES-2

NREL CA Solar Benefits Executive Summary
Table ES-2
Delivered Levelized Energy Cost and Economic Impacts for CSP and Gas Technologies in 2015 ($2005)
Delivered
Energy Cost Permanent Jobs,
per 100 MW GSP, $million per 100 MW
Simple Cycle* $187/MWh 13 $47
Combined Cycle* $119/MWh 56 $64
CSP with 6 Hours Storage** $115/MWh 94 $628 *The 2015 MPR natural gas price of $8.00 per MMBtu escalating at 2.5 percent annually was used. **CSP assumes permanent 10 percent ITC.
CSP is a fixed cost generation resource - that is the cost of generating each MWh of electricity is primarily dependent on the capital cost of the facility, rather than on fuel costs as is the case with natural gas fueled generation. Therefore, installation of more fixed-cost generation on the California electric system could reduce the effect on electricity prices resulting from natural gas price increases and volatility. This is relevant to current generation investment decisions because of recent natural gas price volatility and price increases as shown on Figure ES-1.
2.23 2.71 3.082.79 2.76
5.88
9.40
3.82
5.496.05
7.76
0.00
1.00
2.00
3.00
4.00
5.00
6.00
7.00
8.00
9.00
10.00
1995 1996 1997 1998 1999 2000 2001 2002 2003 2004 2005
$ pe
r Mcf
Figure ES-1
California Electric Power Sector, Annual Average Natural Gas Prices, $ per Mcf (Source: Energy Information Administration)4
4 Data for 2005 is for January through November only. Data found at www.eia.doe.gov.
April 21, 2006 ES-3
NREL CA Solar Benefits Executive Summary
Recent studies have suggested that the installation of CSP, wind or other non-gas plants in lieu of new natural gas fueled generators can relieve a portion of the demand pressure behind gas price volatility. Lawrence Livermore Laboratory and others suggest that the natural gas price could decline by one to four percent for each change of 1 percent in demand. The 4,000 MW high deployment scenario could result in a savings of $60 million per year for natural gas in California for a 1 percent price reduction for a 1 percent usage reduction. At the higher price impact range, the California savings could be four times greater. Power generation with CSP technology does not result in any significant air emissions compared with a business as usual approach. Therefore, if the installation of CSP avoids the installation of new natural gas fueled power stations or avoids the operation of existing power stations, there would be a net reduction in air emissions in California. Using the natural gas combined cycle plant – the cleanest, most efficient fossil technology – as a proxy, data for criteria air emissions reductions were developed. For the 4,000 MW deployment scenario, at least 300 tons per year of NOx and 7.6 million tons per year of CO2 would be avoided. If the fossil displacement is simple cycle gas turbines or coal fired plants, these values would be larger. Black & Veatch has made the following conclusions about the deployment of CSP from this analysis:
• California has high quality solar resources sufficient to support far more CSP than either the 2,100 MW or 4,000 MW scenarios analyzed.
• Depending on the CSP plant interconnection point and the load profile of the local electricity provider, CSP with 6 hours of storage could perform peaking and/or intermediate generation roles for a utility.
• Investment in CSP power plants delivers greater return to California in both economic activity and employment than corresponding investment in natural gas equipment: - Each dollar spent on CSP contributes approximately $1.40 to
California’s Gross State Product; each dollar spent on natural gas plants contributes about $0.90 - $1.00 to Gross State Product.
- The 4,000 MW deployment scenario was estimated to create about 3,000 permanent jobs from the ongoing operation of the plants.
• Operations period expenditures on operations and maintenance for CSP create more permanent jobs than alternative natural gas fueled generation. For each 100 MW of generating capacity, CSP was estimated to generate 94 permanent jobs compared to 56 jobs and 13 jobs for combined cycle and simple cycle plants, respectively.
April 21, 2006 ES-4
NREL CA Solar Benefits Executive Summary
• Energy delivered from early CSP plants (startup in 2007) costs more than that delivered from natural gas combined cycle plants5 ($157 per MWh vs. $104 per MWh, based on a 30 percent ITC for CSP). With technology advancements, improvements to CSP construction efficiency, and with higher gas prices consistent with 2015 MPR projections, CSP becomes competitive with combined cycle power generation ($115 per MWh vs. $119 per MWh, even with the permanent 10 percent ITC). Most of the economic and employment advantages are still retained.
• CSP plants are a fixed-cost generation resource and offer a physical hedge against the fluctuating cost of electricity produced with natural gas.
• Each CSP plant provides emissions reductions compared to its natural gas counterpart; the 4,000 MW scenario in this study offsets at least 300 tons per year of NOx emissions, 180 tons of CO emissions per year, and 7,600,000 tons per year of CO2.
The economic and employment benefits, together with delivered energy price stability and environmental advantages, suggest that the CSP solar alternative would be a beneficial addition to California’s energy supply. While early CSP plants are more costly than their traditional gas counterparts, subsequent plants are estimated to become nearly cost competitive on a levelized cost of energy basis.
5 Based on MPR gas prices for 2007, $6.40/MMBtu, and assuming a 100 MW CSP plant with 6 hours storage and a 500 MW combined cycle plant. Both CSP and combined cycle plants operate at 40 percent capacity factor. All dollars are $2005.
April 21, 2006 ES-5
NREL CA Solar Benefits Introduction
1.0 Introduction
This report documents work performed by Black & Veatch Corporation (Black & Veatch) on the “Economic, Energy, and Environmental Benefits of Concentrating Solar Power in California,” a study funded by the National Renewable Energy Laboratory (NREL) under subcontract AEK-5-55036-01. The objective of the study was to characterize commercial and developing CSP technologies and estimate the direct and indirect economic impacts of CSP deployment. The economic impact of CSP deployment was calculated by considering the impact to Gross State Output, earnings, employment, and to state tax receipts. The study was divided into five tasks:
• Task 1: Technology Assessment • Task 2: Solar Resource Assessment • Task 3: Cost of Energy and Economic Impact Evaluation • Task 4: Environmental and Energy Attributes and Specific Benefits to
California • Task 5: Review and Reporting
This report relies on information gathered by the Black & Veatch team which performed the “New Mexico Concentrating Solar Plant Feasibility Study,” performed for the New Mexico CSP Task Force under contract to New Mexico Energy, Minerals and Natural Resources Department. The study also made extensive use of Excelergy, the NREL solar parabolic trough performance and cost modeling program. Economic impacts were calculated using the Regional Input-Output Modeling System (RIMS II model), developed and maintained by the US Bureau of Economic Analysis.
April 21, 2006 1-1
NREL CA Solar Benefits CSP Technology Assessment
2.0 CSP Technology Assessment
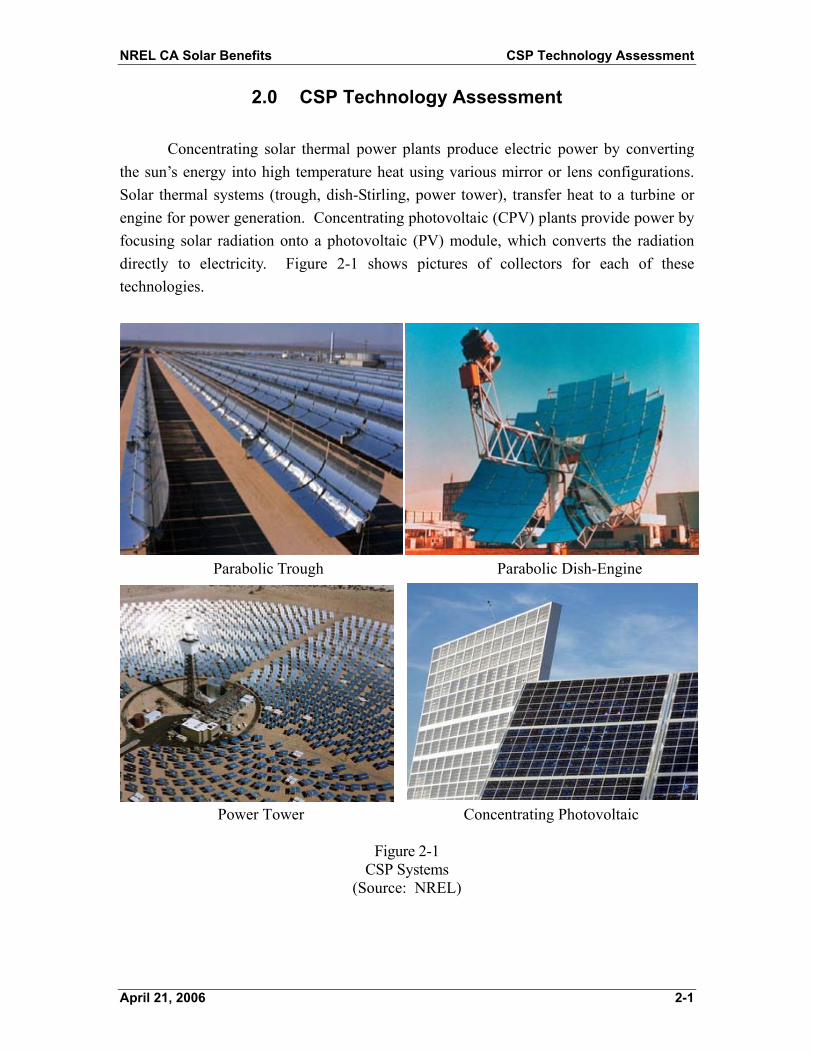
Concentrating solar thermal power plants produce electric power by converting the sun’s energy into high temperature heat using various mirror or lens configurations. Solar thermal systems (trough, dish-Stirling, power tower), transfer heat to a turbine or engine for power generation. Concentrating photovoltaic (CPV) plants provide power by focusing solar radiation onto a photovoltaic (PV) module, which converts the radiation directly to electricity. Figure 2-1 shows pictures of collectors for each of these technologies.
Parabolic Trough Parabolic Dish-Engine
Power Tower Concentrating Photovoltaic
Figure 2-1 CSP Systems
(Source: NREL)
April 21, 2006 2-1

NREL CA Solar Benefits CSP Technology Assessment
2.1 Description of Technologies This section provides a brief description of the four CSP technologies. A more complete description is provided in Appendix A. Parabolic trough systems comprise rows of trough-shaped mirrors which direct solar insolation to a receiver tube along the focal axis of each trough. The focused radiation raises the temperature of heat-transfer oil, which is used to generate steam. The steam is then used to power a turbine-generator to produce electricity. Power tower systems consist of a field of thousands of sun-tracking mirrors which direct insolation to a receiver atop a tall tower. A molten salt heat-transfer fluid is heated in the receiver and is piped to a ground based steam generator. The steam drives a steam turbine-generator to produce electricity. Because trough and power tower systems collect heat to drive central turbine-generators, they are best suited for large-scale plants: 50 MW or larger. Trough and tower plants, with their large central turbine generators and balance of plant equipment, can take advantage of economies of scale for cost reduction, as cost per kW goes down with increased size. Additionally, these plants can make use of thermal storage or hybrid fossil systems to achieve greater operating flexibility and dispatchability. This provides the ability to produce electricity when needed by the utility system, rather than only when sufficient solar insolation is available to produce electricity, for example, during short cloudy periods or after sunset. This capability has significantly more value to the utility and potentially allows the owner of the CSP plant to receive additional credit, or payment, for the electric generating capacity of the plant. Parabolic dish systems use a dish shaped arrangement of mirror facets to focus energy onto a receiver at the focal point of the collector. A working fluid such as hydrogen is heated in the receiver, and drives a turbine or Stirling engine. Most current dish applications use Stirling engine technology because of its high efficiency. CPV systems use either parabolic dish mirror systems or a large array of flat Fresnel lenses to focus energy on PV cells. The PV cells generate direct current electricity, which is converted to alternating current using a solid state inverter. Dish and CPV systems are modular in nature, with single units producing power in the range of 10 kW to 35 kW. Thus, dish and CPV systems could be used for distributed or remote generation applications, or in large arrays of several hundred or thousand units to produce power on a utility scale. Dish and CPV systems have the potential advantage of mass production of individual units, similar to the mass production of automobiles or wind turbines. At this time, neither the dish Stirling or CPV system use storage or hybrid fossil capabilities to provide a firm resource. CPV systems could, of course, make use of battery energy storage; however, present battery storage technology is comparatively inefficient and expensive.
April 21, 2006 2-2

NREL CA Solar Benefits CSP Technology Assessment
2.2 Commercial Status of Technologies The largest group of solar systems in the world is the Solar Energy Generating Systems (SEGS) I through IX parabolic trough plants in the Mohave Desert in southern California. The SEGS plants were built between 1985 and 1991 and have a total capacity of 354 MW. These plants have generally performed well over their 15 to 20 years of operation. There are several other commercial trough projects in the planning or active project development stage, including a 64 MW plant in Nevada and several 50 MW plants in Spain. Integrated Solar Combined Cycle Systems (ISCCS) are in various stages of planning in southern California, India, Egypt, Morocco, Mexico, and Algeria. A 1 MW trough plant was recently constructed for Arizona Public Service (APS), and is currently in startup. There are no operating commercial dish-Stirling power plants. Recently, installation was completed on a six dish test deployment at Sandia National Laboratories (SNL) in Albuquerque. This development is under a joint agreement between Stirling Engine Systems (SES) (Phoenix) and SNL. On August 2, 2005, Southern California Edison publicly announced the completion of negotiations on a 20-year power purchase agreement with SES for between 500 to 850 MW of capacity (producing 1,182 to 2,010 GWh per year) using parabolic dish units. On September 7, 2005, SES announced a contract with San Diego Gas & Electric to provide between 300 and 900 MW of solar power using the dish technology. Pricing for these power purchase agreements remains confidential. These large deployments of dish Stirling systems are expected to drastically reduce capital and O&M costs and to result in increased system reliability. There are no commercial power tower plants in operation. The 10 MW Solar One plant near Barstow, California, operated from 1982 to 1988 and produced over 38 GWh of electricity. Solar One generated steam directly in the receiver. To implement improved heat transfer and thermal storage, the plant was retrofitted with a receiver, storage system, and steam generator using a molten salt heat transfer fluid. The retrofitted plant, named Solar Two, operated from 1998 to 1999. In addition to Solar One and Solar Two, experimental and prototype systems have operated in Spain, France, and Israel. Abengoa in Spain has announced an 11 MW project called PS 10. ESKOM, the state-owned utility in South Africa, is considering a 100 MW molten-salt plant. A 17 MW molten salt plant in Spain, Solar Tres, was planned by Ghersa, Boeing, and Nexant. However, execution of this project appears to be unlikely at this time. CPV systems are being offered by Amonix, Inc., a US manufacturer, and Solar Systems Pty, Ltd, an Australian firm. These systems are offered in 25-35 kW sizes. There are 547 kW of Amonix systems deployed at APS. Planned deployments in the near future include 10 to 20 MW in Spain. Ten Solar Systems dish PV systems have been deployed since 2003, for a total capacity of 220 kW, with the construction of an
April 21, 2006 2-3
NREL CA Solar Benefits CSP Technology Assessment
additional 720 kW under way. Several contracts are anticipated in the relatively near future in the US Southwest to comply with Renewable Portfolio Standard (RPS) requirements. 2.3 Technology Selection for Benefits Analysis Black & Veatch has chosen the parabolic trough technology as the CSP proxy for economics benefits analysis because much more detailed information on construction and operation costs and performance is available for this technology than other CSP technologies. Detailed information on the amount of material and labor for plant construction and operation is needed to develop a reasonable economic impacts analysis. There are currently 354 MW of trough generation in the SEGS plants in southern California, a 64 MW plant under construction in Nevada, and several 50 MW or larger trough plants are in various stages of development around the world. Other technologies do not have significant commercial operating experience. The use of trough as a proxy is not intended to suggest that future CSP installations will not include significant amounts of generation using other CSP technologies.
April 21, 2006 2-4
NREL CA Solar Benefits California CSP Resource Assessment
3.0 California CSP Resource Assessment
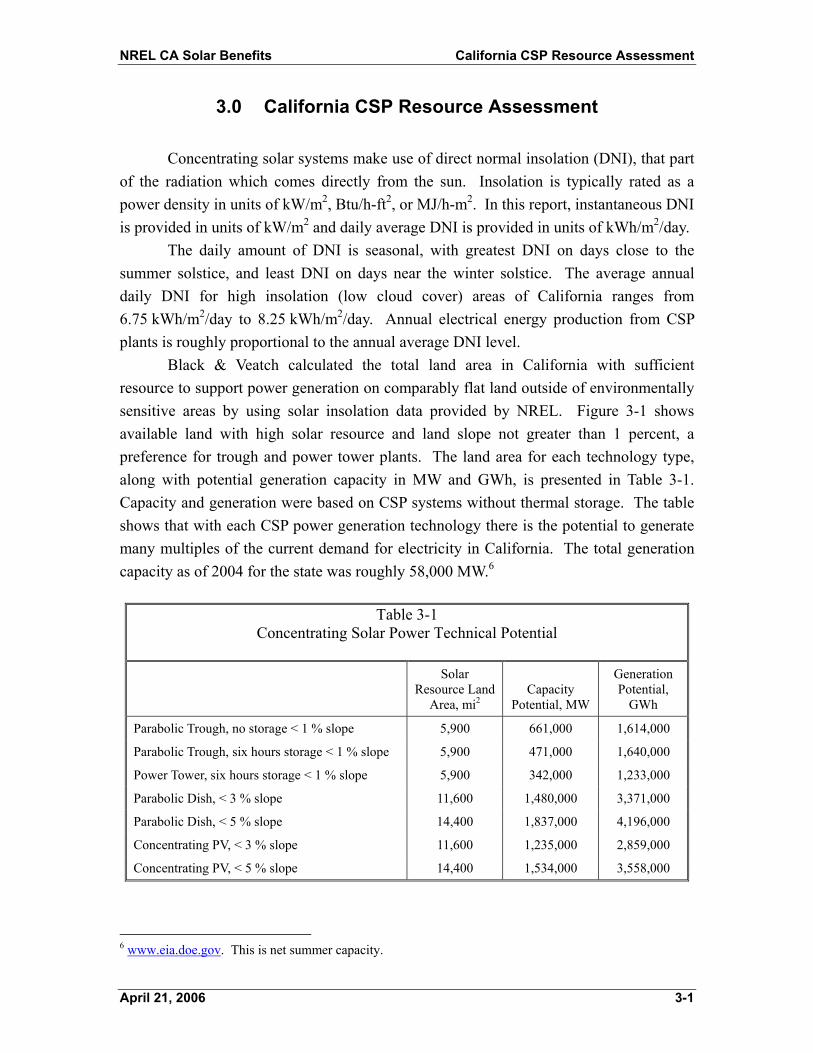
Concentrating solar systems make use of direct normal insolation (DNI), that part of the radiation which comes directly from the sun. Insolation is typically rated as a power density in units of kW/m2, Btu/h-ft2, or MJ/h-m2. In this report, instantaneous DNI is provided in units of kW/m2 and daily average DNI is provided in units of kWh/m2/day. The daily amount of DNI is seasonal, with greatest DNI on days close to the summer solstice, and least DNI on days near the winter solstice. The average annual daily DNI for high insolation (low cloud cover) areas of California ranges from 6.75 kWh/m2/day to 8.25 kWh/m2/day. Annual electrical energy production from CSP plants is roughly proportional to the annual average DNI level. Black & Veatch calculated the total land area in California with sufficient resource to support power generation on comparably flat land outside of environmentally sensitive areas by using solar insolation data provided by NREL. Figure 3-1 shows available land with high solar resource and land slope not greater than 1 percent, a preference for trough and power tower plants. The land area for each technology type, along with potential generation capacity in MW and GWh, is presented in Table 3-1. Capacity and generation were based on CSP systems without thermal storage. The table shows that with each CSP power generation technology there is the potential to generate many multiples of the current demand for electricity in California. The total generation capacity as of 2004 for the state was roughly 58,000 MW.6
Table 3-1 Concentrating Solar Power Technical Potential
Solar
Resource Land Area, mi2
Capacity Potential, MW
Generation Potential,
GWh
Parabolic Trough, no storage < 1 % slope 5,900 661,000 1,614,000
Parabolic Trough, six hours storage < 1 % slope 5,900 471,000 1,640,000
Power Tower, six hours storage < 1 % slope 5,900 342,000 1,233,000
Parabolic Dish, < 3 % slope 11,600 1,480,000 3,371,000
Parabolic Dish, < 5 % slope 14,400 1,837,000 4,196,000
Concentrating PV, < 3 % slope 11,600 1,235,000 2,859,000
Concentrating PV, < 5 % slope 14,400 1,534,000 3,558,000
6 www.eia.doe.gov. This is net summer capacity.
April 21, 2006 3-1

NREL CA Solar Benefits California CSP Resource Assessment
Figure 3-1
Direct Normal Radiation Solar Resource Land Greater Than 1 Percent Slope Excluded (Source: NREL)
April 21, 2006 3-2

Deployment of NREL CA Solar Benefits CSP Plants in California
4.0 Deployment of CSP Plants in California
Black & Veatch developed aggressive, but reasonable, CSP deployment scenarios collaboratively with NREL to calculate the economic impact of CSP deployment (Section 5.0). By stating that the deployment scenarios are aggressive, Black & Veatch recognizes that CSP commercialization requires a long-term view that may not be supported by current economics or utility preferences. The cost of energy from the first 100 MW CSP plant may be high compared to alternative conventional (fossil fueled) or renewable energy generation options. However, CSP has the potential to be an important generation resource for California (and other southwest US states) in developing a balanced power generation portfolio. One consideration in developing scenarios is the need for new power plants. According to the State of California “Energy Action Plan,”7 dated May 8, 2003, California’s peak electric demand was 52,863 MW on July 2, 2002. According to the Action Plan, peak demand is projected to grow at 2.4 percent annually. Platts Research Service forecasts electric demand to grow from 54,320 MW in 2005 to 77,759 MW in 2020 in the “Power Outlook Quarter 1 2005.”8 Platts also estimates that nearly 10,000 MW of generation capacity will be retired over this time frame. Therefore, Platts estimated that nearly 33,000 MW of generation capacity additions will be required to meet growing demand. The estimate for growth in energy demand is from 295,000 GWh in 2005 to 422,000 GWh in 2020, or a growth of 127,000 GWh. Another consideration in developing scenarios is the California Renewable Portfolio Standard (RPS), which currently mandates that 20 percent of energy be generated by renewables by 2017. The California Energy Commission (CEC) has set an accelerated goal of 20 percent by 2010. Figure 4-1 shows the level of renewable energy generation in California through 2003 with projected requirements for 2010, 2017, and a more aggressive proposed goal of 33 percent by 2020. The RPS applies only to investor owned utilities (IOUs), such that only San Diego Gas & Electric, Southern California Edison, and Pacific Gas & Electric are subject to the RPS. However, municipally owned utilities such as Los Angeles Department of Water and Power and Sacramento Municipal Utility District are mandated by legislation to develop appropriate renewable plans that follow the spirit of the RPS. Therefore, renewable energy generation would need to increase to 34,200 GWh/y above the 2004 level of 28,300 GWh to achieve the 20 percent RPS by 2017.
7 Available from the California Energy Commission at http://www.energy.ca.gov/energy_action_plan/2003-05-08_ACTION_PLAN.PDF. 8 Platts Power Outlook service (www.platts.com).
April 21, 2006 4-1

Deployment of NREL CA Solar Benefits CSP Plants in California
0
20,000
40,000
60,000
80,000
100,000
120,000
1983 1988 1993 1998 2003 2008 2013 2018
Adopted Goal20% by 2010
Proposal33% by 2020
StatutoryRequirement20% by 2017
2003 Total for all US Non-Hydro RE2003 Total for all US Non-Hydro RE
Historical CA Non-Hydro Generation
Figure 4-1 California Renewable Portfolio Standard
As discussed in Section 2.2, Black & Veatch has used trough plants with six hours of storage as the proxy for CSP generation expansion. The use of trough as a proxy is not intended to suggest that future CSP installations will not include significant amounts of generation using other technologies. The announcement of 20 year power purchase agreements between SES and Southern California Edison and San Diego Gas & Electric for a total of between 800 MW and 1,750 MW of dish engine power generation indicates strong commercial viability for dish systems. Each 1,000 MW of parabolic trough systems, with six-hours of storage, will generate about 3,600 GWh/yr. Thus, thousands of MW of parabolic trough could, theoretically, be installed to meet state electric demand and RPS requirements. However, utilities install or purchase renewable energy on a least cost best fit (LCBF) basis. Should selected projects have energy costs which exceed the Market Price Referent (MPR), the project owner can file for payments of the energy cost exceeding the MPR from the state’s New Renewable Facilities Program. Should funds not be available, the utility is relieved of its obligation to meet the RPS requirement. Additional information on the California MPR and its impact on CSP is provided in Section 6.1. Because there is no viable approach for calculating CSP deployment on the basis of LCBF, Black & Veatch has opted to use a scenario basis for subsequent economic impact calculations. It has been assumed that the cumulative installation of CSP plants by 2020 will be between 2,100 MW and 4,000 MW (or about 8 to 18 percent of the peak demand growth). The Low and High Scenarios are summarized in Table 4-1. The Low Scenario provides a cumulative 2,100 MW of CSP addition by 2020, somewhat below
April 21, 2006 4-2
Deployment of NREL CA Solar Benefits CSP Plants in California
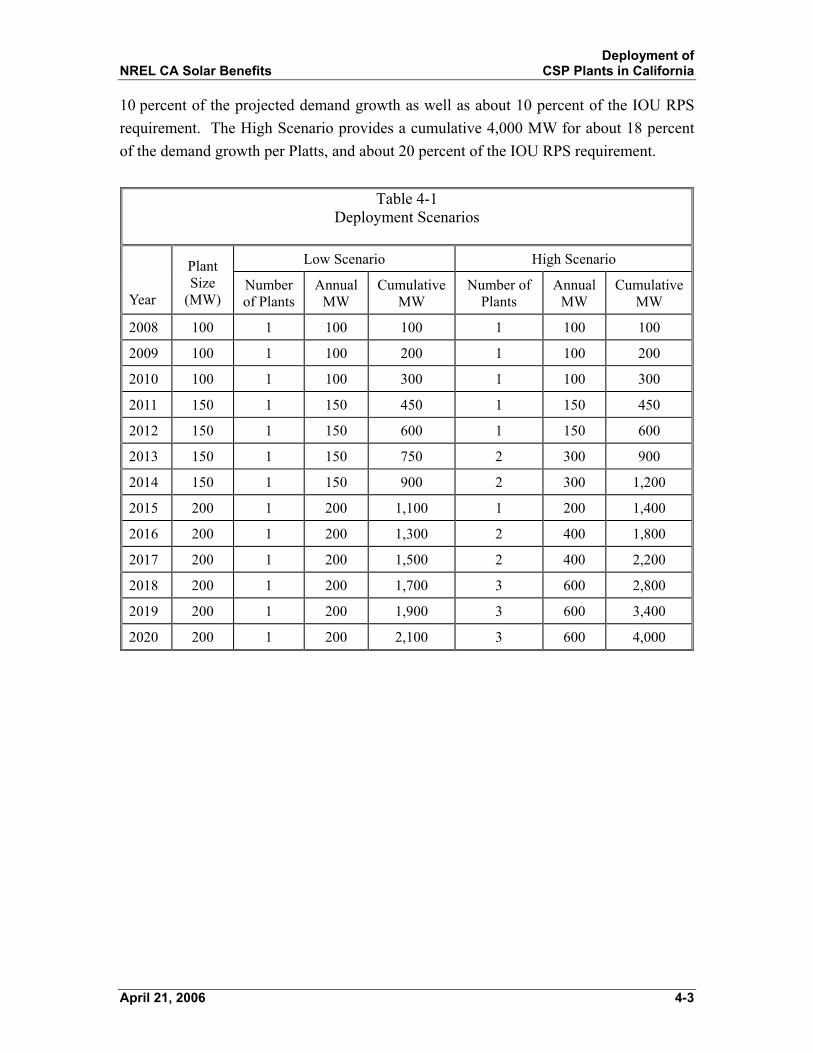
10 percent of the projected demand growth as well as about 10 percent of the IOU RPS requirement. The High Scenario provides a cumulative 4,000 MW for about 18 percent of the demand growth per Platts, and about 20 percent of the IOU RPS requirement.
Table 4-1 Deployment Scenarios
Low Scenario High Scenario
Year
Plant Size
(MW) Number of Plants
Annual MW
Cumulative MW
Number of Plants
Annual MW
Cumulative MW
2008 100 1 100 100 1 100 100
2009 100 1 100 200 1 100 200
2010 100 1 100 300 1 100 300
2011 150 1 150 450 1 150 450
2012 150 1 150 600 1 150 600
2013 150 1 150 750 2 300 900
2014 150 1 150 900 2 300 1,200
2015 200 1 200 1,100 1 200 1,400
2016 200 1 200 1,300 2 400 1,800
2017 200 1 200 1,500 2 400 2,200
2018 200 1 200 1,700 3 600 2,800
2019 200 1 200 1,900 3 600 3,400
2020 200 1 200 2,100 3 600 4,000
April 21, 2006 4-3
Economic Impacts of NREL CA Solar Benefits CSP in California
5.0 Economic Impacts of CSP in California
Utilities are charged with planning generation portfolios which provide a safe, adequate, and reliable supply of electricity at the lowest reasonable cost and in an environmentally acceptable manner. Practically, this objective has translated into utilities selecting the lowest cost generation sources. Despite the propensity of utilities to purchase the lowest-cost resources, it has long been recognized that there can be significant socioeconomic impacts associated with new power plant investments. It follows that power plants of different types with different characteristics will have different socioeconomic impacts. The goal of this study is to estimate the impact to the regional economy of developing CSP plants in California and to compare these impacts to regional economic impacts generated by building conventional fossil fueled power stations. The direct and indirect impacts of constructing one CSP plant and a series of CSP plants over the next 15 years have been estimated. 5.1 Economic Impacts Model The purpose of the economic impacts model is to determine the direct and indirect economic impact of developing CSP plants in California. Direct economic impacts are the dollars directly spent by the project in the region on materials, equipment, and wages. Indirect economic impacts are also referred to as the “multiplier” impacts of each dollar spent in the region. These impacts are created when a dollar is spent on goods or services produced by suppliers in the region. For example, if a dollar is spent on equipment manufactured in the region, the manufacturer spends a portion of this dollar to hire additional employees, expand production and purchase goods and services. The degree to which a dollar spent on a particular industry is re-spent in the region is the “multiplier” for that industry. The following economic metrics can be used to measure the direct and indirect economic impact of dollars spent in a given region:
• Gross State Output--The total value of goods and services produced within the state.
• Earnings--The value of wages and benefits earned by workers in the region.
• Employment--Full and part-time jobs. • Fiscal--Impact to tax receipts by the state and local governments. The economic impacts of a power generation project can be divided into the
construction and operation periods. During the construction phase of the project, there is a direct economic impact from the portion of goods and services for the project purchased from local vendors. For example, local labor is used for construction and concrete is
April 21, 2006 5-1

Economic Impacts of NREL CA Solar Benefits CSP in California
purchased from a local concrete plant. There are also indirect economic impacts, which include employment created by purchases from vendors and multiplier impacts in the regional economy. During the operation phase of the project, there is a direct impact from permanent jobs created by the plant and annual purchases of goods and services to support operations and maintenance of the plant. There are also multiplier impacts created by the annual plant operations and maintenance expenditures. The model chosen for this study is the Regional Input-Output Modeling System (RIMS II model), developed and maintained by the US Bureau of Economic Analysis. This is a regional input-output (I-O) model that measures the interdependency of the various sectors of the economy through the establishment of an accounting matrix. The matrix shows the change in output, earnings, and employment in each industry due to a change in final demand (purchases from that industry). The RIMS II model is well suited for the needs of this study because it can estimate economic impacts for any county or combination of counties in the US, and includes multipliers for nearly 500 industry classifications. For this analysis, the region of study was established to be southern California, including the following counties.
• Fresno • Imperial • Inyo • Kern • Kings • Los Angeles • Mono • Orange
• Riverside • San Bernardino • San Diego • San Luis Obispo • Santa Barbara • Tulare • Ventura
The economic analysis was limited to counties in southern California because the solar resource suitable for CSP is primarily available in southern California; thus, it has been assumed that the economic impact of CSP development would be concentrated in southern California. The multiplier analysis included the evaluation of impacts arising from the construction and operation periods. The results for each period were then summed to arrive at the total impact for developing one and multiple CSP plants. For the construction and operation periods, the cost estimates were broken into major equipment and labor categories (e.g., solar field mirrors, construction labor, etc.). The percent of labor and capital expenditures in each category that would occur in southern California were then estimated. The following section contains a complete discussion of the technical inputs to the economic model.
April 21, 2006 5-2

Economic Impacts of NREL CA Solar Benefits CSP in California
The expenditures in southern California were then multiplied by the final demand multipliers for the respective industries for each major capital and labor expense. This impact estimate was then added to the initial change due to the investment. Gross State Output, earnings and output estimates were then deflated to 1997, the basis for the I-O tables in the RIMS II model. Final results were then escalated to 2005 dollars. All estimates during construction were performed on a per MW basis. A similar process was followed for the operation period, based on the annual expenditures made per CSP plant per year. This estimate included expenditures for plant staff, consumables and supplies, land rent, and other cost items. Economic impact estimates for the operation period are provided on per MW and per MWh basis. The economic impacts of CSP deployment were then compared with the economic activity generated by 500 MW combined cycle and 85 MW simple cycle combustion turbine plants. These plants provide similar electric services to what a CSP plant provides and offer a basis for estimating the relative impacts of this renewable technology. Sizing of the combined cycle and simple cycle plants are typical sizes for plants built for intermediate and peaking service. 5.2 Input Data for the Model An important element of the economic impact analysis is the estimation of capital and annual operations and maintenance (O&M) costs. The magnitude of the capital and annual expenditures directly impacts the magnitude of the direct and indirect economic impacts. Black & Veatch used data from the Excelergy Model, developed and maintained by NREL.9 Capital and O&M costs were generated for parabolic trough systems with six hours of storage for a 100 MW plant built in 2007, a 100 MW plant built in 2009, a 150 MW plant built in 2011, and a 200 MW plant built in 2015. There are indications that recently bid trough plants may have somewhat lower capital costs than those generated by Excelergy; howerver, these data are not publicly available. Overall, while lower capital costs can somewhat lower the economic impact in California, the decrease is not expected to significantly change the conclusions of this report.
9 Excelergy is an Excel spreadsheet-based model for solar parabolic trough systems. Developed by NREL, it models annual plant performance and estimates capital and O&M costs. It uses a time step approach with hourly or finer time increment solar and weather data. Excelergy has been benchmarked against the SEGS plants.
April 21, 2006 5-3

Economic Impacts of NREL CA Solar Benefits CSP in California
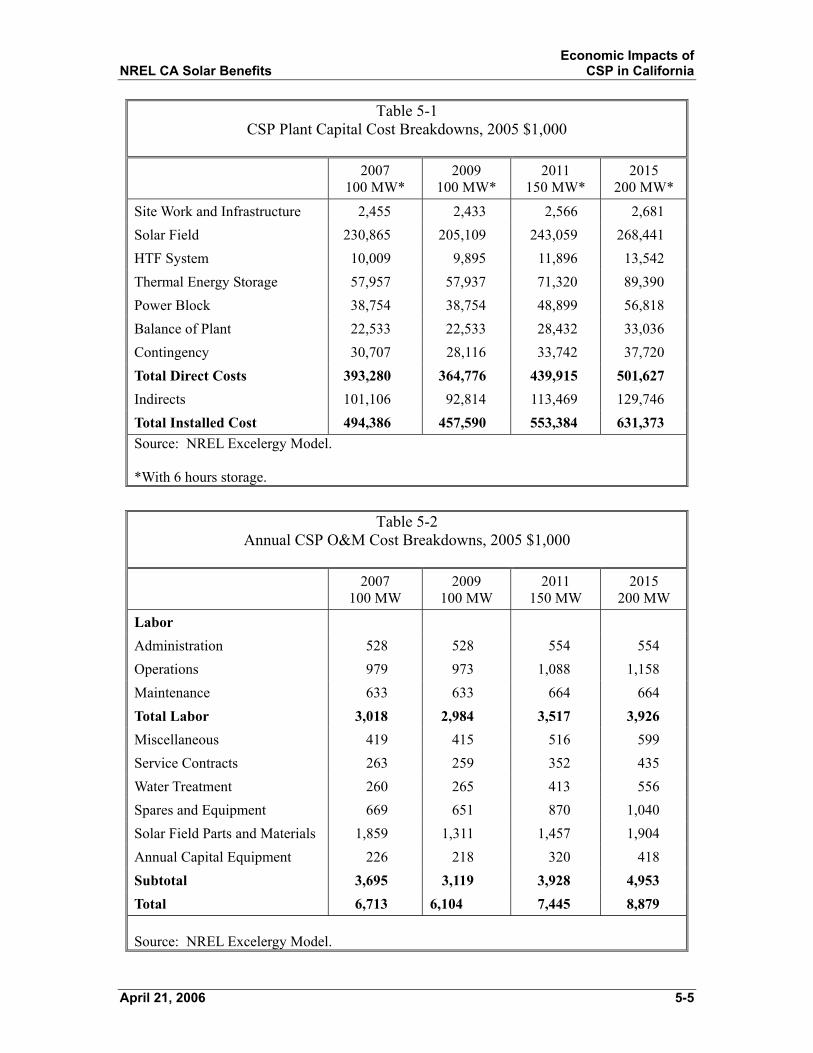
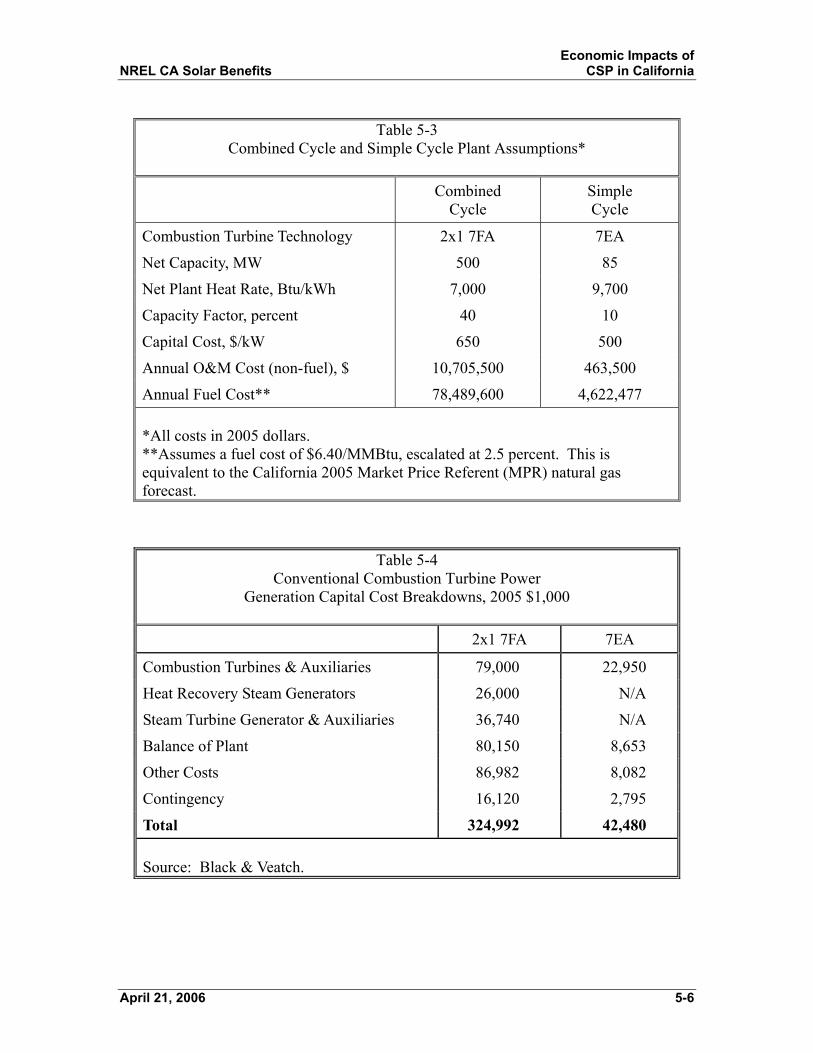
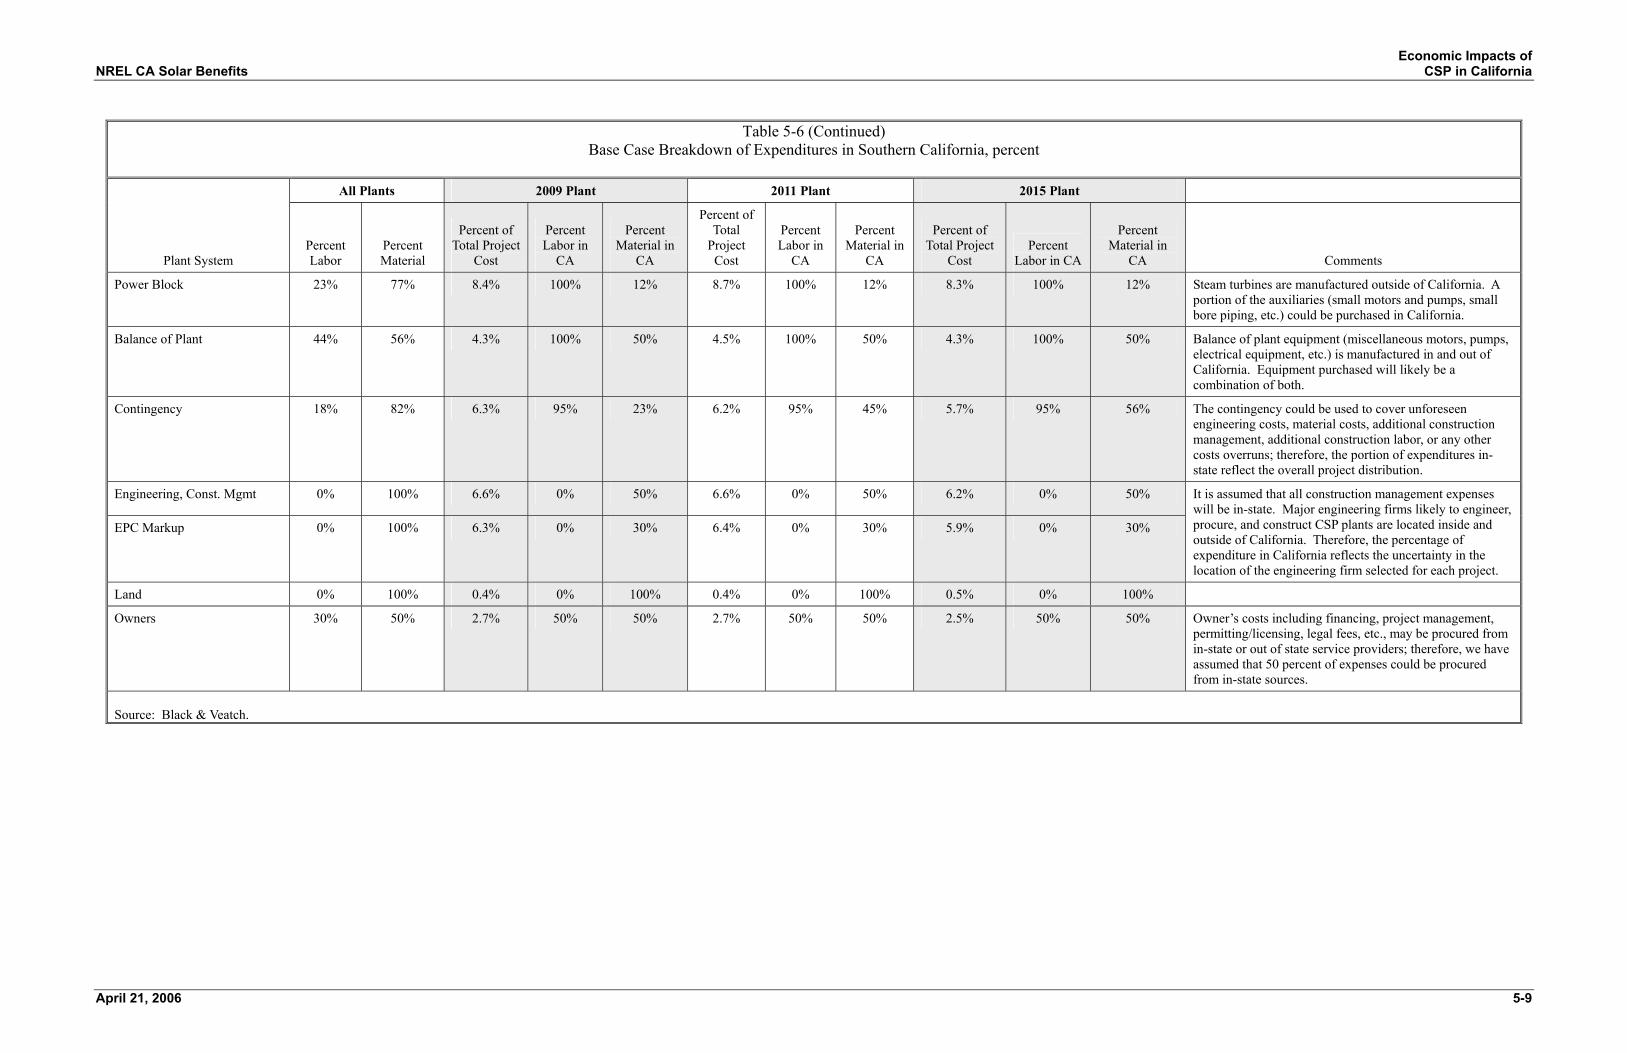
The Excelergy-generated capital cost estimates are based on data from the SEGS plants, vendor inquiries, and various studies. NREL has developed “Learning Curves” to describe the reduction in capital and operating costs observed as more CSP plants are deployed. The learning curve cost reductions relate to technology advances, scale up, effects of mass production resulting from large scale deployment, and improvements in construction efficiency. Table 5-1 is a summary of capital costs for the four CSP plants. Black & Veatch worked from a more detailed cost breakdown to place equipment costs into “Manufactured in southern California” and “Not Manufactured in southern California” categories. Table 5-2 is a summary of annual O&M costs for the four CSP plants. Black & Veatch also estimated the direct and indirect economic impact of constructing and operating combined cycle and simple cycle combustion turbine plants. Because these plants provide intermediate and peaking electric services similar to those of a CSP plant, they offer a good benchmark to the economic impacts created by CSP. Table 5-3 provides the input assumptions for the combined cycle and simple cycle combustion turbine plants. Capital and operating cost breakdowns were also developed for both plant types based on Black & Veatch experience with each of these plant types to estimate the direct and indirect economic impact of constructing each plant in southern California. Table 5-4 provides a summary capital cost breakdown and Table 5-5 provides an O&M cost breakdown for the combined cycle and simple cycle combustion turbine power plants, respectively. Black & Veatch worked from a more detailed cost breakdown to place equipment costs into “Manufactured in southern California” and “Not Manufactured in southern California” categories. 5.2.1 Estimation of California-Supplied Goods and Services The RIMS II model calculates the economic impact of expenditures inside of a given region; therefore, the part of capital and operating costs spent in and out of southern California must be determined. Black & Veatch first divided the total capital and operating cost estimates into material and labor components. It has been assumed that all construction and operations labor jobs created are in southern California. The plant cost estimates were examined on a line by line basis and percentages were applied, based on engineering judgment and knowledge of suppliers, as to what portion of the equipment purchased for the plant would be manufactured in southern California. Some of the material and equipment is available from southern California manufacturers, while other specialized items are not. Table 5-6 shows the base case assumptions used regarding equipment purchases in California. Section 5.4 provides a sensitivity analysis with lower and higher in-state spending assumptions.
April 21, 2006 5-4
Economic Impacts of NREL CA Solar Benefits CSP in California
Table 5-1 CSP Plant Capital Cost Breakdowns, 2005 $1,000
2007
100 MW* 2009
100 MW* 2011
150 MW* 2015
200 MW*
Site Work and Infrastructure 2,455 2,433 2,566 2,681 Solar Field 230,865 205,109 243,059 268,441 HTF System 10,009 9,895 11,896 13,542 Thermal Energy Storage 57,957 57,937 71,320 89,390 Power Block 38,754 38,754 48,899 56,818 Balance of Plant 22,533 22,533 28,432 33,036 Contingency 30,707 28,116 33,742 37,720 Total Direct Costs 393,280 364,776 439,915 501,627 Indirects 101,106 92,814 113,469 129,746 Total Installed Cost 494,386 457,590 553,384 631,373 Source: NREL Excelergy Model. *With 6 hours storage.
Table 5-2
Annual CSP O&M Cost Breakdowns, 2005 $1,000
2007
100 MW 2009
100 MW 2011
150 MW 2015
200 MW
Labor Administration 528 528 554 554 Operations 979 973 1,088 1,158 Maintenance 633 633 664 664 Total Labor 3,018 2,984 3,517 3,926 Miscellaneous 419 415 516 599 Service Contracts 263 259 352 435 Water Treatment 260 265 413 556 Spares and Equipment 669 651 870 1,040 Solar Field Parts and Materials 1,859 1,311 1,457 1,904 Annual Capital Equipment 226 218 320 418 Subtotal 3,695 3,119 3,928 4,953 Total 6,713 6,104 7,445 8,879 Source: NREL Excelergy Model.
April 21, 2006 5-5
Economic Impacts of NREL CA Solar Benefits CSP in California
Table 5-3
Combined Cycle and Simple Cycle Plant Assumptions*
Combined Cycle
Simple Cycle
Combustion Turbine Technology 2x1 7FA 7EA
Net Capacity, MW 500 85
Net Plant Heat Rate, Btu/kWh 7,000 9,700
Capacity Factor, percent 40 10
Capital Cost, $/kW 650 500
Annual O&M Cost (non-fuel), $ 10,705,500 463,500
Annual Fuel Cost** 78,489,600 4,622,477 *All costs in 2005 dollars. **Assumes a fuel cost of $6.40/MMBtu, escalated at 2.5 percent. This is equivalent to the California 2005 Market Price Referent (MPR) natural gas forecast.
Table 5-4 Conventional Combustion Turbine Power
Generation Capital Cost Breakdowns, 2005 $1,000
2x1 7FA 7EA
Combustion Turbines & Auxiliaries 79,000 22,950
Heat Recovery Steam Generators 26,000 N/A
Steam Turbine Generator & Auxiliaries 36,740 N/A
Balance of Plant 80,150 8,653
Other Costs 86,982 8,082
Contingency 16,120 2,795
Total 324,992 42,480 Source: Black & Veatch.
April 21, 2006 5-6

NREL
April 21, 200
Economic Impacts ofCA Solar Benefits CSP in California
6 5-7
Table 5-5
Conventional Combustion Turbine Power Generation O&M Cost Breakdowns, 2005 $1,000
2x1 7FA 7EA
Staff 2,205 179
Training & Communications 945 77
Water 1,511 42
Major Maintenance 5,289 146
Other VOM/parts 756 21
Natural Gas 103,478 3,250
Total 114,183 3,714 Source: Black & Veatch.

Economic Impacts of NREL CA Solar Benefits CSP in California
Table 5-6 Base Case Breakdown of Expenditures in Southern California, percent
All Plants 2009 Plant 2011 Plant 2015 Plant
Plant System Percent Labor
Percent Material
Percent of Total Project
Cost
Percent Labor in
CA
Percent Material in
CA
Percent of Total
Project Cost
Percent Labor in
CA
Percent Material in
CA
Percent of Total Project
Cost Percent
Labor in CA
Percent Material in
CA Comments
Sitework and Infrastructure 100% 0% 0.4% 100% 0% 0.3% 100% 0% 0.3% 100% 0% All construction labor has been assumed to be in California.
Contractor Overhead 0% 100% 8.3% 0% 100% 8.1% 0% 100% 7.4% 0% 100% The construction contractor is assumed to be located in California.
Heat Collection Elements 0% 100% 11.0% 0% 0% 10.9% 0% 50% 9.9% 0% 75%
Mirrors 0% 100% 11.8% 0% 0% 11.7% 0% 50% 10.7% 0% 75%
For early plants (2009), mirrors and heat conversion elements (HCE’s) were assumed to be manufactured outside southern California. At present, the major supplier for mirrors would be in Germany, while HCE’s are currently produced in Israel and Germany. For plants coming on-line in 2011, 50 percent of mirrors and HCE’s are assumed to be manufactured in California. For plants starting in 2015, 75 percent of mirrors and HCE’s are assumed to be manufactured in southern California. The German and Israeli manufacturers currently do not have large scale production facilities for CSP equipment due to limited demand. If a large number of CSP plants were planned (and orders had been placed), one or more manufacturers would likely be induced to open manufacturing facilities in the region.
Metal Support Structure 0% 100% 11.5% 0% 50% 11.3% 0% 50% 10.1% 0% 50% Steel for metal support structures is produced both inside and outside of California. We have assumed that an average of 50 percent of the material would be procured from California sources.
Misc. Solar Field Equipment 51% 49% 12.5% 91% 59% 12.2% 91% 59% 10.9% 90% 59% Miscellaneous solar field balance of plant equipment (small pumps and motors, bolts, small bore piping, etc.) is manufactured both inside and outside of California. The assumption is based on procurement of a mix of equipment from in-state and out of state suppliers.
HTF System 7% 93% 2.3% 100% 34% 2.3% 100% 34% 2.2% 100% 34% The balance of plant equipment for the HTF system is assumed to be procured from manufacturers located inside and outside of California. Specialized heat exchangers are assumed to be manufactured outside of California. Field erection labor is assumed to be from California suppliers.
Thermal Energy Storage 0% 100% 7.8% 0% 42% 9.2% 0% 75% 9.4% 0% 75% We have assumed that a significant portion of steel tank fabrication will occur in California, but that specialized heat exchangers will be manufactured outside California. .
Thermal Energy Storage Fluid 0% 100% 6.7% 0% 50% 5.6% 0% 50% 5.8% 0% 50% The heat transfer and thermal storage fluids, whether a silicone oil or a molten salt, are assumed to be specialized products produced primarily outside of southern California
April 21, 2006 5-8
NREL
April 21, 200
Economic Impacts of CA Solar Benefits CSP in California
6 5-9
Table 5-6 (Continued) Base Case Breakdown of Expenditures in Southern California, percent
All Plants 2009 Plant 2011 Plant 2015 Plant
Plant System Percent Labor
Percent Material
Percent of Total Project
Cost
Percent Labor in
CA
Percent Material in
CA
Percent of Total
Project Cost
Percent Labor in
CA
Percent Material in
CA
Percent of Total Project
Cost Percent
Labor in CA
Percent Material in
CA Comments
Power Block 23% 77% 8.4% 100% 12% 8.7% 100% 12% 8.3% 100% 12% Steam turbines are manufactured outside of California. A portion of the auxiliaries (small motors and pumps, small bore piping, etc.) could be purchased in California.
Balance of Plant 44% 56% 4.3% 100% 50% 4.5% 100% 50% 4.3% 100% 50% Balance of plant equipment (miscellaneous motors, pumps, electrical equipment, etc.) is manufactured in and out of California. Equipment purchased will likely be a combination of both.
Contingency 18% 82% 6.3% 95% 23% 6.2% 95% 45% 5.7% 95% 56% The contingency could be used to cover unforeseen engineering costs, material costs, additional construction management, additional construction labor, or any other costs overruns; therefore, the portion of expenditures in-state reflect the overall project distribution.
Engineering, Const. Mgmt 0% 100% 6.6% 0% 50% 6.6% 0% 50% 6.2% 0% 50%
EPC Markup 0% 100% 6.3% 0% 30% 6.4% 0% 30% 5.9% 0% 30%
It is assumed that all construction management expenses will be in-state. Major engineering firms likely to engineer, procure, and construct CSP plants are located inside and outside of California. Therefore, the percentage of expenditure in California reflects the uncertainty in the location of the engineering firm selected for each project.
Land 0% 100% 0.4% 0% 100% 0.4% 0% 100% 0.5% 0% 100%
Owners 30% 50% 2.7% 50% 50% 2.7% 50% 50% 2.5% 50% 50% Owner’s costs including financing, project management, permitting/licensing, legal fees, etc., may be procured from in-state or out of state service providers; therefore, we have assumed that 50 percent of expenses could be procured from in-state sources.
Source: Black & Veatch.
Economic Impacts of NREL CA Solar Benefits CSP in California
In general, goods and services purchases for O&M are assumed to be from in-state sources. It was assumed that all miscellaneous costs and service contracts were southern California based. Water costs are split nearly evenly between raw water costs and chemicals. Black & Veatch has assumed 100 percent of the raw water costs are spent in southern California, while 50 percent of the chemicals are produced in California. Spares and equipment, solar field parts, and capital equipment costs were assumed to be 50 percent southern California based. 5.2.2 Costs Versus Deployment Year To simplify the economic impacts analysis, Black & Veatch grouped the deployment scenarios into four “buckets,” which contain the following years:
• 2008, 2009, 2010. • 2011, 2012, 2013. • 2014, 2015, and 2016. • 2017, 2018, and 2019.
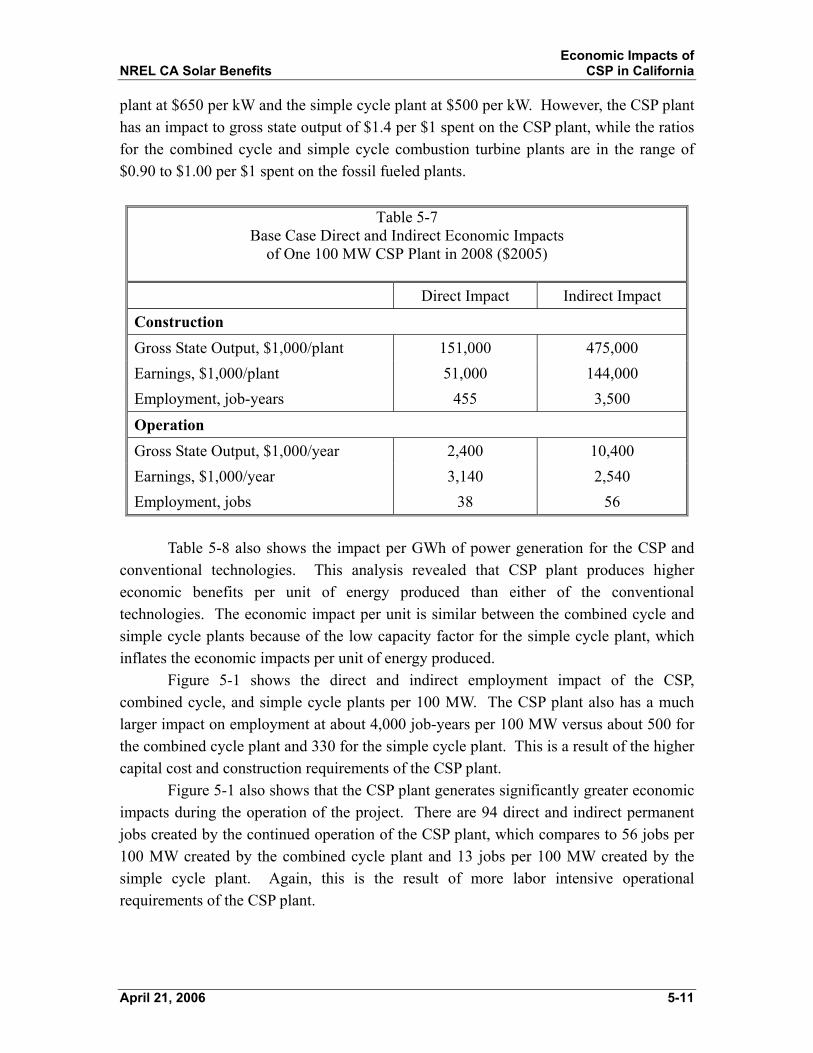
Black & Veatch used this approach because any difference in plant costs between years due to inflation is not within the accuracy of the cost estimates. Therefore, any gains in granularity in study results are not significant because of the confidence in the cost estimates. 5.3 Base Case Economic Impacts Analysis Results Black & Veatch estimated the direct and indirect impact of the development of the reference parabolic trough CSP plant, described in Section 2.1, in southern California with an on-line date in 2008. This section provides the base case analysis. A sensitivity analysis is discussed in Section 5.4. Table 5-7 shows that constructing one 100 MW CSP plant has a direct impact to Gross State Output of over $150 million and an indirect impact of over $470 million. The table also shows that about 455 job-years of direct employment are created during the construction of the facility, which equates to over $51 million in direct earnings. The table also shows that the plant results in about 38 permanent jobs directly created by the operation of the plant; another 56 jobs are indirectly created by the operation of the plant. Table 5-8 shows the total (direct plus indirect) economic impact per 100 MW of CSP, combined cycle and simple cycle combustion turbine plants. Table 5-8 shows that the total construction impact of CSP on gross state output at about $626 million per 100 MW is significantly larger than that for combined cycle or simple cycle combustion turbine plants at about $64 million per 100 MW and $47 million per 100 MW, respectively. The primary reason for this is the much larger total installed cost of the CSP plant, which is estimated to be $4,600 per kW in 2008 compared to the combined cycle
April 21, 2006 5-10
Economic Impacts of NREL CA Solar Benefits CSP in California
plant at $650 per kW and the simple cycle plant at $500 per kW. However, the CSP plant has an impact to gross state output of $1.4 per $1 spent on the CSP plant, while the ratios for the combined cycle and simple cycle combustion turbine plants are in the range of $0.90 to $1.00 per $1 spent on the fossil fueled plants.
Table 5-7 Base Case Direct and Indirect Economic Impacts
of One 100 MW CSP Plant in 2008 ($2005)
Direct Impact Indirect Impact Construction Gross State Output, $1,000/plant 151,000 475,000 Earnings, $1,000/plant 51,000 144,000 Employment, job-years 455 3,500
Operation Gross State Output, $1,000/year 2,400 10,400 Earnings, $1,000/year 3,140 2,540 Employment, jobs 38 56
Table 5-8 also shows the impact per GWh of power generation for the CSP and
conventional technologies. This analysis revealed that CSP plant produces higher economic benefits per unit of energy produced than either of the conventional technologies. The economic impact per unit is similar between the combined cycle and simple cycle plants because of the low capacity factor for the simple cycle plant, which inflates the economic impacts per unit of energy produced. Figure 5-1 shows the direct and indirect employment impact of the CSP, combined cycle, and simple cycle plants per 100 MW. The CSP plant also has a much larger impact on employment at about 4,000 job-years per 100 MW versus about 500 for the combined cycle plant and 330 for the simple cycle plant. This is a result of the higher capital cost and construction requirements of the CSP plant. Figure 5-1 also shows that the CSP plant generates significantly greater economic impacts during the operation of the project. There are 94 direct and indirect permanent jobs created by the continued operation of the CSP plant, which compares to 56 jobs per 100 MW created by the combined cycle plant and 13 jobs per 100 MW created by the simple cycle plant. Again, this is the result of more labor intensive operational requirements of the CSP plant.
April 21, 2006 5-11

Economic Impacts of NREL CA Solar Benefits CSP in California
Table 5-8
Total Economic Impacts of One CSP or Conventional Plant in 2008 per 100 MW ($2005)
Base Case Parabolic Trough
Combined Cycle
Combustion Turbine
Simple Cycle Combustion
Turbine
Construction
Gross State Output, $1,000 628,000 64,000 47,000
Earnings, $1,000 196,000 23,500 17,700
Employment, job-years 3,990 448 327
Operation
Gross State Output, $1,000/year 12,800 10,000 2,000
Earnings, $1,000/year 5,680 2,700 700
Employment, jobs 94 56 13
Operation
Gross State Output, $1,000/GWh 36 24 23
Earnings, $1,000/GWh 16 6 8
Employment, jobs/GWh 0.26 0.16 0.15
April 21, 2006 5-12

Economic Impacts of NREL CA Solar Benefits CSP in California
-
500
1,000
1,500
2,000
2,500
3,000
3,500
4,000
4,500
100 MWSolar
Trough
500 MWCombined
Cycle
85 MWSimpleCycle
100 MWSolar
Trough
500 MWCombined
Cycle
85 MWSimpleCycle
Con
stru
ctio
n Em
ploy
men
t Im
pact
s,
Job-
Year
s/10
0 M
W
-
20
40
60
80
100
120
140
160
180
Ope
ratio
n Em
ploy
men
t Im
pact
s,
Jobs
/100
MW
Indirect
Direct
Indirect
Direct
CONSTRUCTION OPERATION
Figure 5-1
Base Case Employment Impact Comparison Black & Veatch also estimated the economic impact of each deployment scenario developed for this study. Figure 5-2 shows that the low and high deployment scenarios result in total deployment of 2,100 MW and 4,000 MW, respectively. For a complete discussion of the deployment schedules refer to Section 4.0.
-
500
1,000
1,500
2,000
2,500
3,000
3,500
4,000
4,500
2008 2009 2010 2011 2012 2013 2014 2015 2016 2017 2018 2019 2020
Cum
ulat
ive
Inst
alle
d C
SP C
apac
ity, M
W
High Deployment
Low Deployment
Figure 5-2
CSP Low and High Deployment Scenarios
April 21, 2006 5-13
Economic Impacts of NREL CA Solar Benefits CSP in California
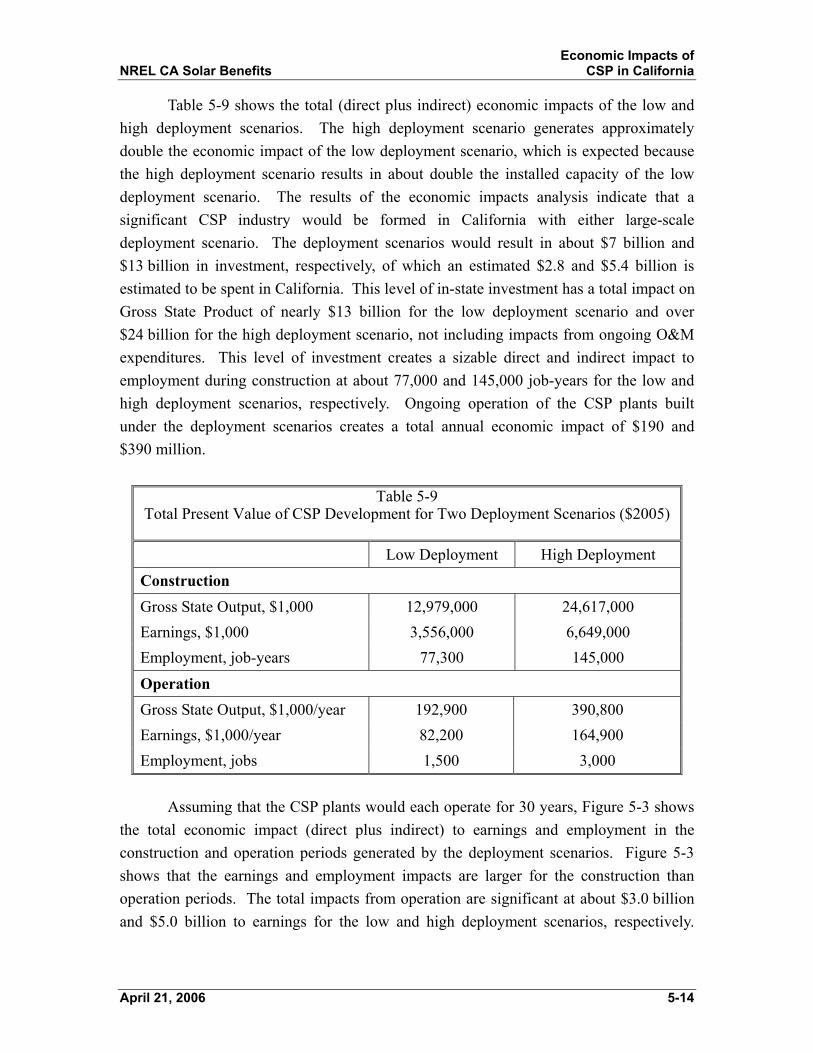
Table 5-9 shows the total (direct plus indirect) economic impacts of the low and high deployment scenarios. The high deployment scenario generates approximately double the economic impact of the low deployment scenario, which is expected because the high deployment scenario results in about double the installed capacity of the low deployment scenario. The results of the economic impacts analysis indicate that a significant CSP industry would be formed in California with either large-scale deployment scenario. The deployment scenarios would result in about $7 billion and $13 billion in investment, respectively, of which an estimated $2.8 and $5.4 billion is estimated to be spent in California. This level of in-state investment has a total impact on Gross State Product of nearly $13 billion for the low deployment scenario and over $24 billion for the high deployment scenario, not including impacts from ongoing O&M expenditures. This level of investment creates a sizable direct and indirect impact to employment during construction at about 77,000 and 145,000 job-years for the low and high deployment scenarios, respectively. Ongoing operation of the CSP plants built under the deployment scenarios creates a total annual economic impact of $190 and $390 million.
Table 5-9 Total Present Value of CSP Development for Two Deployment Scenarios ($2005)
Low Deployment High Deployment
Construction Gross State Output, $1,000 12,979,000 24,617,000 Earnings, $1,000 3,556,000 6,649,000 Employment, job-years 77,300 145,000
Operation Gross State Output, $1,000/year 192,900 390,800 Earnings, $1,000/year 82,200 164,900 Employment, jobs 1,500 3,000
Assuming that the CSP plants would each operate for 30 years, Figure 5-3 shows the total economic impact (direct plus indirect) to earnings and employment in the construction and operation periods generated by the deployment scenarios. Figure 5-3 shows that the earnings and employment impacts are larger for the construction than operation periods. The total impacts from operation are significant at about $3.0 billion and $5.0 billion to earnings for the low and high deployment scenarios, respectively.
April 21, 2006 5-14

NREL
April 21, 200
Economic Impacts ofCA Solar Benefits CSP in California
6 5-15
The High California Expenditure scenario assumes that more manufacturing capability is built in California than the base case assumptions. It is also assumed that most of the balance of plant equipment is purchased from in-state suppliers. All construction, installation, and most engineering are assumed to be provided by in-state suppliers.
The Low California Expenditure scenario assumes that less manufacturing capability is built in California to support CSP development. This scenario also assumes that most of the balance of plant equipment (small pumps, motors, small bore piping, etc.) is purchased from out of state suppliers. It is assumed, as with the base case, that construction and installation will be provided by in-state suppliers.
The assumptions for the amount of material and labor purchased inside and outside of California have a significant effect on the direct and indirect economic impacts results. Therefore, Black & Veatch developed “Low California Expenditure” and “High California Expenditure” scenarios to capture the range of possible economic impacts from the construction of CSP plants. Table 5-10 shows the assumptions for material purchased from in-state suppliers for the low, base, and high in-state expenditure scenarios.
5.4 Economic Impacts Sensitivity Analysis
Additionally, the continued operation of the CSP plants results in about 45,000 job-years for the low deployment scenario and 80,000 job-years for the high deployment scenario.
-
1,000
Low High
2,000
3,000
4,000
5,000
6,000
7,000
8,000
Low High
Tota
l Ear
ning
s, M
illio
n $2
005
-
30,000
60,000
90,000
120,000
150,000
180,000
210,000
240,000
Tota
l Em
ploy
men
t, Jo
b-Ye
ars
EARNINGS EMPLOYMENT
Construction
Operation
Figure 5-3
Low and High Deployment Scenarios Total Impact to Earnings and Employment

NREL
April 21, 200
Economic Impacts of CA Solar Benefits CSP in California
6 5-16
Table 5-10 Material Expenditures in California Sensitivity Criteria, percent
2009 CSP Plant 2011 CSP Plant 2015 CSP Plant
Plant System Low Base High Low Base High Low Base High
Siteworks and Infrastructure 0 0 0 0 0 0 0 0 0
Contractor Overhead 100 100 100 100 100 100 100 100 100
Heat Collection Elements 0 0 0 25 50 75 50 75 100
Mirrors 0 0 0 25 50 75 50 75 100
Metal Support Structure 25 50 75 25 50 75 25 50 75
Misc. Solar Field Equipment 30 59 85 30 59 85 30 59 85
HTF System 17 34 61 17 34 61 17 34 61
Thermal Energy Storage 23 42 59 40 75 88 40 75 88
Thermal Energy Storage Fluid 25 50 75 25 50 75 25 50 75
Power Block 2 12 14 2 12 14 2 12 14
Balance of Plant 26 50 74 26 50 74 26 50 74
Contingency 11 23 35 22 45 67 33 56 78
Engineering, Const. Mgmt 25 50 75 25 50 75 25 50 75
EPC Markup 30 30 50 30 30 50 30 30 50
Land 100 100 100 100 100 100 100 100 100
Owners 50 50 50 50 50 50 50 50 50

Economic Impacts of NREL CA Solar Benefits CSP in California
The sensitivity analysis revealed that even with significantly lower purchase of equipment and materials from California, the construction of CSP still produces larger economic impacts. Figure 5-4 shows the impact to employment and earnings for each sensitivity case along with the base case impacts for the combined cycle plant.
-
1,000
2,000
3,000
4,000
5,000
6,000
LowCalifornia
Expenditures
Base Case HighCalifornia
Expenditures
LowCalifornia
Expenditures
Base Case HighCalifornia
Expenditures
Con
stru
ctio
n Em
ploy
men
t Im
pact
s, J
ob-Y
ears
-
50
100
150
200
250
Con
stru
ctio
n Ea
rnin
gs Im
pact
, M
illio
n $2
005
Indi
rect
Dire
ct
Combined Cycle
(per 100 MW)
Employment Earnings
Figure 5-4
Construction Economic Impacts Sensitivity Analysis for 100 MW CSP Plant The sensitivity analysis also revealed that the impact to Gross State Output is significantly larger than the comparative combined cycle plant. The CSP plant produced a range of $450 million to $800 million compared to $420 million per 100 MW for the combined cycle plant. Black & Veatch also developed a sensitivity analysis of the low and high CSP deployment scenarios with the low and high California expenditure cases, as shown on Figure 5-5. The sensitivity analysis revealed that there is an impact of approximately ±20 percent to employment and earnings of the low California expenditures and high California expenditures scenarios, respectively. The analysis revealed that the impact to Gross State Output is slightly higher at about ±30 percent. The sensitivity analysis shows that the economic impacts results are robust and consistently higher than the calculated impacts for combined cycle power plants even with lower purchases of goods and services from California.
April 21, 2006 5-17

Economic Impacts of NREL CA Solar Benefits CSP in California
-20,00040,00060,00080,000
100,000120,000140,000160,000180,000200,000
LowCalifornia
Expenditures
Base Case HighCalifornia
Expenditures
LowCalifornia
Expenditures
Base Case HighCalifornia
Expenditures
Con
stru
ctio
n Em
ploy
men
t Im
pact
s, J
ob-Y
ears
-1,0002,0003,0004,0005,0006,0007,0008,0009,00010,000
Con
stru
ctio
n Ea
rnin
gs Im
pact
s,
Mill
ion
$200
5
Low
Hig
h
Figure 5-5
Construction Economic Impacts Sensitivity Analysis of Low and High CSP Deployment Scenarios
5.5 Fiscal Impacts Black & Veatch developed preliminary estimates of the fiscal impact (tax revenues) associated with the construction and continued operation of the CSP plants under the low and high deployment scenarios. To provide a point of comparison, the fiscal impacts for 2,100 and 4,000 MW of combined cycle power generation were also estimated. Fiscal impacts include the sales taxes during construction, individual income taxes paid by construction workers, individual income taxes paid by indirect jobs created by construction, individual income taxes paid by operators, individual income taxes paid by indirect jobs created during operation, and corporate income taxes assuming IPP ownership of the project. Based on data from the Tax Foundation, an individual state and local tax rate of 8.7 percent and a corporate state income tax rate of 8.84 percent have been assumed. The analysis yielded potential tax revenues of $1.3 billion for the low deployment scenario and $2.4 billion for the high deployment scenario, both in 2005 dollars. The potential fiscal impacts of constructing and operating 2,100 MW and 4,000 MW of combined cycle power plants are about $300 million and $600 million, respectively. The larger fiscal impacts for the CSP plants are a result of the larger capital cost and more labor intensive operations and maintenance of the CSP plants.
These fiscal impacts estimates are approximate and could vary significantly based on a number of factors including economic life of the CSP plants (assumed to be 30 years for this analysis), local tax abatements, changes to tax laws, corporate structure of the plant owner, and other factors.
April 21, 2006 5-18

Cost of Energy and NREL CA Solar Benefits Value of Dispatchability
6.0 Cost and Value of CSP Energy
This section provides the results of cost of energy calculations for CSP along with an evaluation of the time of delivery value of CSP energy. This section begins with a discussion of the Market Price Referent, the “reference price” of energy in California. 6.1 The Market Price Referent A good starting point for discussion of the cost of renewable energy in California is the Market Price Referent, or MPR.10 The MPR is part of the rulemaking surrounding the California Renewable Portfolio Standard (RPS). Utilities in California are not obligated to purchase renewable energy at prices above the MPR, which is a value set by the California Public Utilities Commission (CPUC) to reflect the market “all-in” (energy and capacity) price for base-load energy. If a renewable energy project has a cost to generate above the MPR, the generator can apply to the CEC for Supplemental Energy Payments (SEPs) to cover above market costs. The MPR is released after the results of the renewable energy solicitations are announced so the MPR does not affect the bids.
The MPR for 2005 was calculated with a proxy plant methodology using a natural gas fired combined cycle plant as the proxy for base-load energy. There was no simple-cycle proxy as in previous years. Instead, time of delivery (TOD) multipliers are to be applied to the baseload MPR value to come up with pricing at peak times. The all-in dollar per MWh levelized energy price for each proxy plant was calculated for 10, 15, and 20 year contract terms. The 2005 MPR value for a 20-year PPA starting in 2007 is $77.24 per MWh. The MPR also includes a 25-year natural gas price forecast, which is based on NYMEX forward futures costs for the first six years, and a combination of EIA and private forecasts for the later years. This report uses a natural gas forecast of $6.40 per MMBtu, escalated at 2.5 percent, which is equivalent to the levelized MPR natural gas forecast for 2007-2026.11 The CPUC MPR gas forecast is the consensus forecast of California natural gas prices among the CPUC, Utilities, and public interest groups.
10 The 2005 MPR declaration was published in March 2006 by the CPUC. It is available at http://www.cpuc.ca.gov/PUBLISHED/COMMENT_RESOLUTION/54445.htm. 11 Levelized using the MPR weighted average cost of capital of 9.3 percent as the discount rate. The levelized forecast for MPR natural gas from 2007 to 2026 is $7.61/MMBtu, while $6.40/MMBtu escalated at 2.5 percent annually is $7.62/MMBtu levelized.
April 21, 2006 6-1

Cost of Energy and NREL CA Solar Benefits Value of Dispatchability
The MPR also included other assumptions about plant heat rates, debt/equity splits, and finance costs. Where possible, this report has used the same assumptions as the MPR.12
6.2 Cost of Energy Calculations
Black & Veatch developed a cost of energy comparison between each of the proxy parabolic trough CSP plant and comparable fossil fuel technologies. The levelized cost of energy is a present value measure of the lifecycle cost of generating power from a given plant considering the capital cost, operating costs (including fuel), capacity factor, financing cost, and incentives. The levelized cost is a useful calculation because it allows comparison of different generation technologies on an equal basis. For this analysis, the parabolic trough CSP plant was compared with simple cycle and combined cycle combustion turbines because these types of plants provide peaking and intermediate electric services similar to CSP plants. Capital cost and performance assumptions for the CSP technologies were developed in Section 2.0 and performance assumptions for the combined and simple cycle combustion turbines were provided in Table 5-3. Financial assumptions, such as cost of debt and equity, were taken directly from the 2005 MPR ruling and are listed in Table 6-1. Actual plant financing parameters may differ from MPR; however, MPR has been used in this document for consistency. For all generation technologies it was assumed that the plant would be owned by a credit worthy independent power producer (IPP) with a power purchase agreement with a California IOU.
The Energy Policy Act of 2005 contains a number of incentives for renewable energy generation13. Specifically, the Act increases the Investment Tax Credit (ITC) to 30 percent through December 31, 2007, for solar facilities14. Solar facilities had a “permanent” ITC of 10 percent before the Act was passed. Because the 30 percent ITC may not be extended, cost of energy calculations have been made assuming both a 30 percent ITC and the older 10 percent ITC.15
12 We diverge only in capacity factor. The MPR uses a 92 percent capacity factor, while we use 40 percent to stay consistent with the intermediate duty cycle of CSP. At a 92 percent capacity factor, our LCOE calculations result in a price of $77 per MWh, equivalent to the MPR. 13 26 USC § 48 (2005). 14 The Act also extended the Production Tax Credit (PTC) to solar facilities, but the PTC for solar expired at the end of 2005. 15 A bill was recently introduced in the Senate (S.2401) that would extend the ITC to 2010.
April 21, 2006 6-2
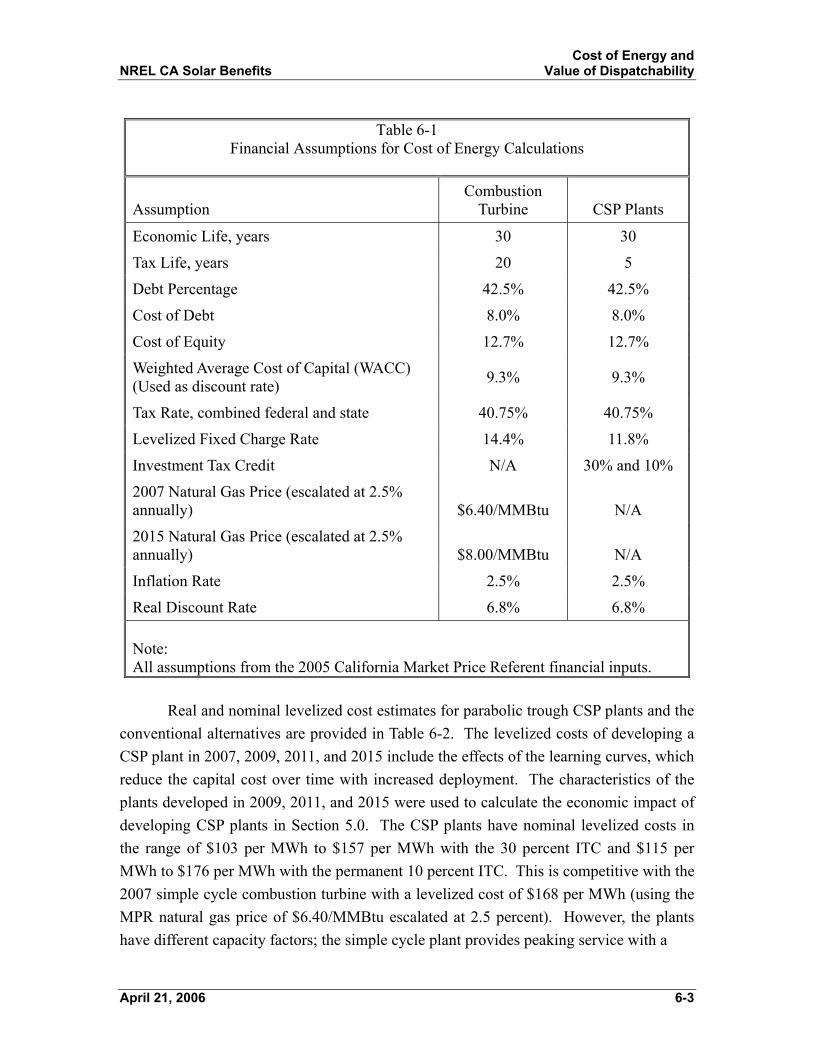
Cost of Energy and NREL CA Solar Benefits Value of Dispatchability
April 21, 2006 6-3
Table 6-1
Financial Assumptions for Cost of Energy Calculations
Assumption Combustion
Turbine CSP Plants
Economic Life, years 30 30
Tax Life, years 20 5
Debt Percentage 42.5% 42.5%
Cost of Debt 8.0% 8.0%
Cost of Equity 12.7% 12.7%
Weighted Average Cost of Capital (WACC) (Used as discount rate) 9.3% 9.3%
Tax Rate, combined federal and state 40.75% 40.75%
Levelized Fixed Charge Rate 14.4% 11.8%
Investment Tax Credit N/A 30% and 10%
2007 Natural Gas Price (escalated at 2.5% annually) $6.40/MMBtu N/A
2015 Natural Gas Price (escalated at 2.5% annually) $8.00/MMBtu N/A
Inflation Rate 2.5% 2.5%
Real Discount Rate 6.8% 6.8% Note: All assumptions from the 2005 California Market Price Referent financial inputs.
Real and nominal levelized cost estimates for parabolic trough CSP plants and the
conventional alternatives are provided in Table 6-2. The levelized costs of developing a CSP plant in 2007, 2009, 2011, and 2015 include the effects of the learning curves, which reduce the capital cost over time with increased deployment. The characteristics of the plants developed in 2009, 2011, and 2015 were used to calculate the economic impact of developing CSP plants in Section 5.0. The CSP plants have nominal levelized costs in the range of $103 per MWh to $157 per MWh with the 30 percent ITC and $115 per MWh to $176 per MWh with the permanent 10 percent ITC. This is competitive with the 2007 simple cycle combustion turbine with a levelized cost of $168 per MWh (using the MPR natural gas price of $6.40/MMBtu escalated at 2.5 percent). However, the plants have different capacity factors; the simple cycle plant provides peaking service with a

NREL
April 21, 200
CA Solar Benefits Cost of Energy and Value of Dispatchability
6 6-4
Table 6-2 Levelized Cost Comparison*
Capacity,
MW Storage,
hours Capacity Factor, %
Nominal Levelized Cost, $ per
MWh (30% ITC)
Nominal Levelized Cost, $ per
MWh (10% ITC)
Real Levelized Cost, $ per
MWh (30% ITC)
Real Levelized Cost, $ per
MWh (10% ITC)
Simple Cycle 85 N/A 10.0 168 168 134 134
Simple Cycle ($8/MMBtu Gas)** 85 N/A 10.0 187
187
149
149
Combined Cycle 500 N/A 40.0 104 104 83 83
Combined Cycle ($8/MMBtu Gas)** 100 N/A 40
119
119
95
95
Parabolic Trough (2007) 100 0 28.4 154 173 125 140
Parabolic Trough (2007) 100 6 40.4 157 176 127 143
Parabolic Trough (2009) 100 6 40.4 148 166 120 135
Parabolic Trough (2011) 150 6 40.4 120 134 97 109
Parabolic Trough (2015) 200 6 40.4 103 115 83 93 *Financial assumptions are essentially per MPR calculation methodology. Assumptions are provided in Table 6-1. **$8/MMBtu is MPR gas price for 2015.
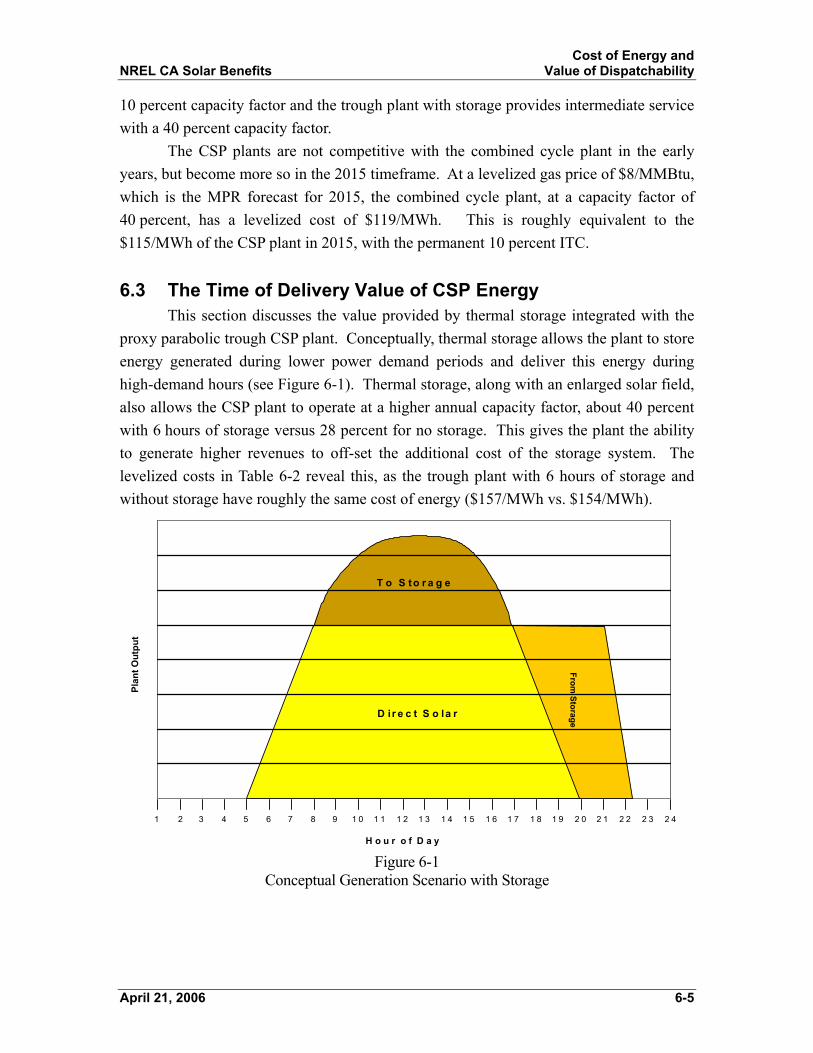
Cost of Energy and NREL CA Solar Benefits Value of Dispatchability
10 percent capacity factor and the trough plant with storage provides intermediate service with a 40 percent capacity factor.
The CSP plants are not competitive with the combined cycle plant in the early years, but become more so in the 2015 timeframe. At a levelized gas price of $8/MMBtu, which is the MPR forecast for 2015, the combined cycle plant, at a capacity factor of 40 percent, has a levelized cost of $119/MWh. This is roughly equivalent to the $115/MWh of the CSP plant in 2015, with the permanent 10 percent ITC.
6.3 The Time of Delivery Value of CSP Energy This section discusses the value provided by thermal storage integrated with the proxy parabolic trough CSP plant. Conceptually, thermal storage allows the plant to store energy generated during lower power demand periods and deliver this energy during high-demand hours (see Figure 6-1). Thermal storage, along with an enlarged solar field, also allows the CSP plant to operate at a higher annual capacity factor, about 40 percent with 6 hours of storage versus 28 percent for no storage. This gives the plant the ability to generate higher revenues to off-set the additional cost of the storage system. The levelized costs in Table 6-2 reveal this, as the trough plant with 6 hours of storage and without storage have roughly the same cost of energy ($157/MWh vs. $154/MWh).
1 2 3 4 5 6 7 8 9 1 0 1 1 1 2 1 3 1 4 1 5 1 6 1 7 1 8 1 9 2 0 2 1 2 2 2 3 2 4
H o u r o f D a y
Plan
t Out
put
From Storage
T o S to r a g e
D ir e c t S o la r
Figure 6-1
Conceptual Generation Scenario with Storage
April 21, 2006 6-5

Cost of Energy and NREL CA Solar Benefits Value of Dispatchability
Renewable energy generators generally fall into two categories: firm and as-available. As-available resources are resources such as wind or CSP without storage that are not controlled by the generator, while firm resources can control when they generate. PG&E lists four energy “products” allowed to bid into their 2005 renewable RFO: as-available, baseload, peaking, and dispatchable. Peaking resources must have at least a 95 percent capacity factor during the peak summer hours16, while baseload resources have 24x7 profiles. Dispatchable resources must be available on a day-ahead schedule.
The trend in the renewable energy industry is toward a single all-in energy payment, with no separate capacity payments.17. In the past, firm resources would receive capacity payments as well as energy payments. The lack of capacity payments makes it more difficult to assign a dollar value to a firm resource versus an as available resource, especially if both of those resources have similar time of delivery (TOD) profiles. The MPR methodology for assigning value to energy is based on the generator’s TOD profile, with multipliers for various time periods. For example, a plant that ran only during peak hours would have an MPR price of $110/MWh, based on SCE’s TOD factor of 1.425 applied to the 2007 MPR ($77.24/MWh)
The MPR prices for a CSP plant with 6 hours of storage and a CSP plant without storage were determined by applying the TOD multipliers to Excelergy’s production profile. Surprisingly, both CSP plants have approximately the same MPR energy value of about $87/MWh.18 Examination of the generation profile data show that, while the plant with storage generates more higher-value energy during peak hours, it also generates more lesser-value energy during non-peak hours. Although there is no separate capacity credit that can be assigned to the CSP plant with storage, it clearly has more value to the utility than an “as available” CSP plant without storage, despite their similar MPR prices. The plant with storage qualifies as a firm “peaking” resource under PG&E’s rules,19 generating firm power during peak summer hours. PG&E explicitly states a preference for peaking resources in its 2005 RFO, as it rates peaking resources as a “high” need and as-available as a “low.” Future MPR methodologies may return to including assigning explicit capacity value, which allow solar thermal with storage to receive a more explicit capacity credit. 16 Noon to 8PM, PDT, June through September. 17 PG&E, SCE, SDG&E, SMUD and LADWP all have a single all-in payment structure for renewable energy, and the MPR no longer contains a peaking unit. Other IOUs are also moving to all-in payments. 18 This value is using the 2005 MPR and SCE's TOD multipliers. PG&E’s and SDG&E’s multipliers are similar. 19 Excelergy modeling shows that 6 hours of storage is needed to ensure 95 percent availability during peak times.
April 21, 2006 6-6

NREL CA Solar Benefits Environmental and Hedging Benefits
7.0 Environmental and Hedging Benefits
CSP plants provide environmental benefits by generating power without producing criteria and CO2 air emissions. In addition, the use of fixed cost renewable energy generation, such as CSP or wind, can decrease fossil fuel use and provide a hedge against fossil fuel price increases. While CSP plants may have environmental benefits due to emissions reductions, they do require significant land area. A 100 MW CSP plant is estimated to cover approximately 800 acres (comprised mostly of the solar field) while a 500 MW combined cycle plant would occupy about 20 acres.20 7.1 Reduction in Criteria and CO2 Air Emissions A key benefit of the use of CSP plants in California is the potential to reduce the amount of criteria and greenhouse gas emissions. The installation of CSP may reduce air emissions if generating power from CSP plants offsets generation from fossil fueled plants.21 For this calculation of emissions reductions, it has been assumed that the CSP plants will displace generation by combined cycle plants with an average heat rate of 7,000 Btu/kWh. Typical permitted emissions requirements for a new plant in southern California were obtained from the California Air Resources Board, and are shown in Table 7-1.22 Based on these emission rates, the table also shows the amount of emissions displaced by annual generation from a single 100 MW trough plant with six hours of storage, as well as for the low deployment and high deployment scenarios of 2,100 MW and 4,000 MW of CSP generation capacities, respectively.
The estimates in Table 7-1 are conservative because of the assumption that CSP would displace emissions from new plants. CSP plants could offset generation from older thermal natural gas or oil fueled generation with average heat rates equal to or exceeding 10,000 Btu per kWh, which would increase the emissions offset by about 30 percent. Furthermore, the older plants are unlikely to have modern air emissions control technology that would be required on new plants. Thus, the increase in emissions offset by assuming displacement of older generation would likely exceed 30 percent.
20 Of course, the land requirements for the combined cycle plant do not include the land required for acquisition of natural gas. 21 While emissions reduction can be more complicated when cap-and-trade systems (such as the RECLAIM system for NOx trading in the South Coast Air Quality Management District) are involved, it is generally correct to assert that a CSP plant that offsets a natural gas-fired plant will result in less emissions. 22 Permitted air emissions requirements are available at the California Air Resources Board at: www.arb.ca.gov/bact/bactnew/rptpara.htm
April 21, 2006 7-1
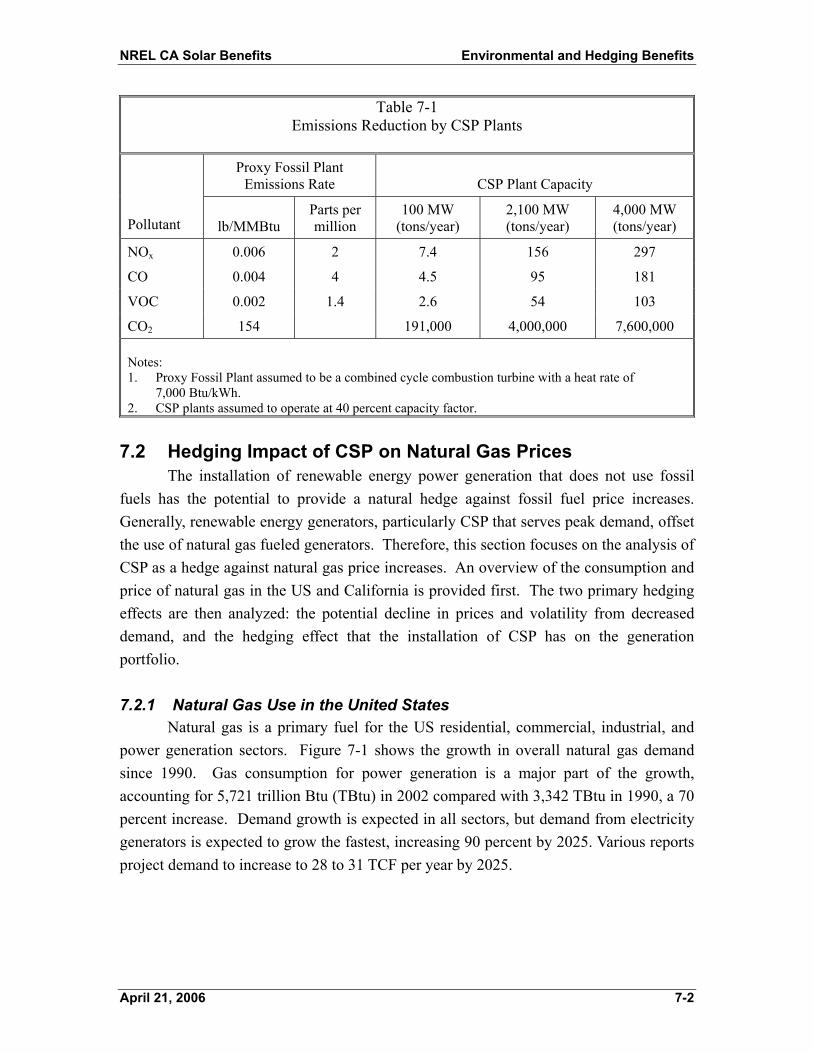
NREL CA Solar Benefits Environmental and Hedging Benefits
Table 7-1 Emissions Reduction by CSP Plants
Proxy Fossil Plant
Emissions Rate CSP Plant Capacity
Pollutant lb/MMBtu Parts per million
100 MW (tons/year)
2,100 MW (tons/year)
4,000 MW (tons/year)
NOx 0.006 2 7.4 156 297
CO 0.004 4 4.5 95 181
VOC 0.002 1.4 2.6 54 103
CO2 154 191,000 4,000,000 7,600,000 Notes: 1. Proxy Fossil Plant assumed to be a combined cycle combustion turbine with a heat rate of
7,000 Btu/kWh. 2. CSP plants assumed to operate at 40 percent capacity factor.
7.2 Hedging Impact of CSP on Natural Gas Prices The installation of renewable energy power generation that does not use fossil fuels has the potential to provide a natural hedge against fossil fuel price increases. Generally, renewable energy generators, particularly CSP that serves peak demand, offset the use of natural gas fueled generators. Therefore, this section focuses on the analysis of CSP as a hedge against natural gas price increases. An overview of the consumption and price of natural gas in the US and California is provided first. The two primary hedging effects are then analyzed: the potential decline in prices and volatility from decreased demand, and the hedging effect that the installation of CSP has on the generation portfolio. 7.2.1 Natural Gas Use in the United States Natural gas is a primary fuel for the US residential, commercial, industrial, and power generation sectors. Figure 7-1 shows the growth in overall natural gas demand since 1990. Gas consumption for power generation is a major part of the growth, accounting for 5,721 trillion Btu (TBtu) in 2002 compared with 3,342 TBtu in 1990, a 70 percent increase. Demand growth is expected in all sectors, but demand from electricity generators is expected to grow the fastest, increasing 90 percent by 2025. Various reports project demand to increase to 28 to 31 TCF per year by 2025.
April 21, 2006 7-2

NREL CA Solar Benefits Environmental and Hedging Benefits
Figure 7-1
Historic and Forecast Natural Gas Demand by Sector (NPC 2002) Source: American Gas Association
Natural gas consumption for power generation has increased because the
development of relatively low cost, high-efficiency combined cycle combustion turbine technology has made natural gas an economic alternative to oil and coal. Furthermore, gas is the cleanest burning of the fossil fuels and is favored globally for its relatively low greenhouse gas emissions when compared with other fossil fuels. Figure 7-2 shows that new electric generating capacity installed in the US for 1990-2006 was primarily natural gas fueled. Despite the large increase in natural gas fueled power generation, coal still provides about 50 percent of the electric supply for the US, followed by nuclear at about 20 percent, and natural gas fueled power stations at about 18 percent.23
7.2.2 Natural Gas Use in California
California currently consumes about 10 percent of the total natural gas used in the US – about 2.36 TCF in 2004. It is estimated that in the next decade, California will add five million people to its current population of about 35 million. The added population will need power and fuel; three-quarters of California’s electricity growth and most of the state’s natural gas growth will be driven by the need to serve these new citizens. California is particularly vulnerable to natural gas price fluctuations and supply constraints because of its reliance on out-of-state sources. Currently, about 85 percent of the consumption is provided by imports. Figure 7-3 shows a breakdown of the source of natural gas for the California market.
23 For 2004, EIA
35 2%/YEAR GROWTH 1%/YEAR GROWTH
Canada 30
25 US Power
20 US Cogeneration TCF
US Industrial 15
10 US Residential/Commercial
5
Other 01990 1995 2000 2005 2010 2015 2020 2025
April 21, 2006 7-3

NREL CA Solar Benefits Environmental and Hedging Benefits
010,00020,00030,00040,00050,00060,00070,00080,000
1990
1992
1993
1995
1996
1998
1999
2000
2001
2002
2003
2004
2005
2006
WaterRenewPetroOtherNucGasCoal
Figure 7-2
Breakdown of US Capacity Additions by On-Line Date (MW) Source: US Department of Energy, Energy Information Administration
Southwest 36.2 %
In State 15.5 %
Canada 24 %
Rockies24.3 %
Figure 7-3
California’s Natural Gas Sources for 2004 Source: California Energy Commission
April 21, 2006 7-4

NREL CA Solar Benefits Environmental and Hedging Benefits
The California Energy Commission (CEC) has passed a moratorium on the construction of coal fueled power generation in the state and the import of power produced by coal fueled plants. By removing coal as a possible fuel for new power generation, natural gas fueled or renewable energy will be required to meet the growing demand for power in the state. 7.2.3 Natural Gas Prices and Price Volatility Natural gas is actively traded on commodities markets throughout the world, such as the New York Mercantile Exchange (NYMEX) or the Chicago Board of Trade (CBOT). The fuel is bought and sold for immediate delivery, the “spot market,” and options on future delivery (“futures contracts”) are traded. Long-term price trends are typically caused by factors that affect supply and demand, such as economic activity and changes to natural gas production and storage. Figure 7-4 shows an upward long-term trend of natural gas prices in California. The figure also shows the impact of short-term phenomena on natural gas prices. The chart also shows the short-term effect of supply/demand shock during the California energy crisis in 2000 and 2001. The surge in the use of natural gas to meet power demand created short-term supply constraints and, thus the price spikes shown in the chart.
2.23 2.71 3.082.79 2.76
5.88
9.40
3.82
5.496.05
7.76
0.00
1.00
2.00
3.00
4.00
5.00
6.00
7.00
8.00
9.00
10.00
1995 1996 1997 1998 1999 2000 2001 2002 2003 2004 2005
$ pe
r Mcf
Figure 7-4
California Electric Power Sector, Annual Average Natural Gas Prices, $ per MCF (Source: EIA24)
24 2005 data point is for Jan-Nov, as Dec had not been reported as of 4/6/2006.
April 21, 2006 7-5
NREL CA Solar Benefits Environmental and Hedging Benefits
Short-term market price fluctuations, or volatility, are caused by random factors such as weather, expectations of future supply, geopolitical events, etc. The ability of the market to absorb short-term supply shocks caused by these factors is directly impacted by the relationship of supply and demand in the market. For example, a relatively small change in price would be expected if a short-term supply shock occurred and supply significantly exceeded demand. However, a relatively large price impact could be expected if supply and demand were in balance. The US is currently in the latter situation. While demand has increased, production has been relatively constant.
A combination of long-term and short-term factors has led to a consistent and significant increase in natural gas prices in recent years. The average wellhead natural gas price rose from around $2 per MMBtu in the 1990s to $7.51 per MMBtu in 2004.25 The 6 year NYMEX forward curve indicates that the price at the Henry Hub will remain in the $5 to $8 per MMBtu range, while the EIA’s latest forecast26 projects that wellhead prices will average $5 MMBtu in the coming 20 years.
7.2.4 The Hedging Impact of CSP Deployment in California There are two basic benefits that the large scale deployment of CSP could provide to the California natural gas and electric markets: reduction of natural gas prices from decreased demand; and lower exposure to natural gas price fluctuations from a more diversified electric generating portfolio. This section includes a brief analysis of each of these potential impacts and a high-level estimate of the potential value of these impacts. 7.2.4.1 Impact on Natural Gas Prices. The deployment of non-fossil fueled power generation can decrease or slow the growth in demand for fossil fuels if power generated by fossil fueled plants is off-set by renewable energy generators. Several recent studies suggest that there could be a price decrease of between one and four percent for each 1 percent decline in demand.27,28 Therefore, based on a 1 percent reduction in gas price for a 1 percent reduction in nationwide gas usage, the deployment of 4,000 MW of CSP in California could result in a total reduction of approximately $60 million per year for
25 US Energy Information Administration (EIA) www.eia.doe.gov. 26 2006 Annual Energy Outlook. Released December 2005. www.eia.doe.gov. 27 Easing the Natural Gas Crisis: Reducing Natural Gas Prices through Inceased Deployment of Renewable Energy and Energy Efficiency Ryan Wiser, Mark Bolinger, Matt St. Clair., Berkley National Laboratory, LBNL-56756, January 2005. 28 Dr. Ryan Wiser, Scientist, Lawrence Berkeley National Laboratory, testimony to Senate Committee on Energy and Natural Resources, Easing the Natural Gas Crisis: Reducing Natural Gas Prices Through Electricity Supply Diversification, March 8, 2005.
April 21, 2006 7-6

NREL CA Solar Benefits Environmental and Hedging Benefits
natural gas expenditures in California, assuming a natural gas price of $6.40 per MMBtu.29 If the natural gas price reduction were to be in the range of 4 percent for each 1 percent reduction in nationwide gas usage, the savings in gas cost to California could be four times higher. These savings in California are based on average savings for US consumers. However, savings per MMBtu could be higher in California than the national average. Dr. Ryan Wiser, in private communication, wrote, “Though reductions in California natural gas demand will have national price impacts that spill over to the state, the impact on California natural gas prices may be somewhat higher than the national impact if the natural gas transportation infrastructure serving California is constrained.30” 7.2.4.2 Portfolio Hedging Impact. Electricity is provided to California consumers primarily by natural gas, imported coal fueled power, and hydroelectric energy. Figure 7-5 shows the source of electricity generation in California.
Large Hydro14.8 %
DSW Imports 12.75 %
Renewables10.6 %
PNW Imports 6.33 %
Nuclear 12.9 %
Coal * 19.8 %
Natural Gas 41.9 %
Figure 7-5
Generation Sources for California Electricity in 2004 Source: California Energy Commission
*Intermountain and Mohave coal plants are considered in-state, since they are in California control areas.
29 Taking the US gas consumption in 2004 to be 23,000 trillion Btu, and assuming a proxy of a combined cycle plant heat rate of 7,000 Btu/kWh, the amount of natural gas displaced by a 100 MW CSP plant operating at a 40 percent capacity factor is 2,400 billion Btu/yr, or 0.01 percent of the US gas consumption. Likewise, the amounts of natural gas displaced by 2,100 MW and 4,000 MW are 52,000 billion Btu/yr and 99,000 billion Btu/yr, (0.2 percent and 0.4 percent of national consumption), respectively. At 1 percent price reduction for each one percent of demand reduction, this would equate to a 0.01 percent price reduction resulting from a 100 MW plant, a 0.2 percent price reduction for a 2,100 MW CSP deployment, and a 0.4 percent price reduction for a 4,000 MW CSP deployment. 30 Dr. Ryan Wiser in an email to Dr. Larry Stoddard, Black & Veatch, December 13, 2005.
April 21, 2006 7-7
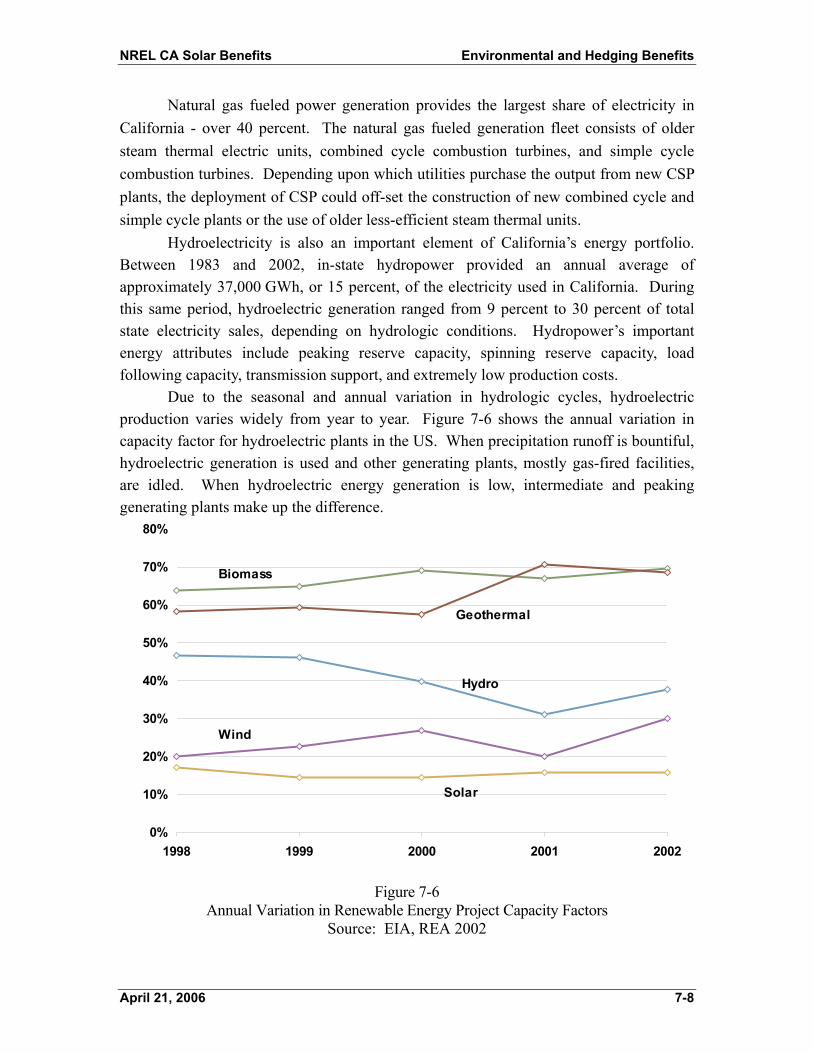
NREL CA Solar Benefits Environmental and Hedging Benefits
Natural gas fueled power generation provides the largest share of electricity in California - over 40 percent. The natural gas fueled generation fleet consists of older steam thermal electric units, combined cycle combustion turbines, and simple cycle combustion turbines. Depending upon which utilities purchase the output from new CSP plants, the deployment of CSP could off-set the construction of new combined cycle and simple cycle plants or the use of older less-efficient steam thermal units.
Hydroelectricity is also an important element of California’s energy portfolio. Between 1983 and 2002, in-state hydropower provided an annual average of approximately 37,000 GWh, or 15 percent, of the electricity used in California. During this same period, hydroelectric generation ranged from 9 percent to 30 percent of total state electricity sales, depending on hydrologic conditions. Hydropower’s important energy attributes include peaking reserve capacity, spinning reserve capacity, load following capacity, transmission support, and extremely low production costs.
Due to the seasonal and annual variation in hydrologic cycles, hydroelectric production varies widely from year to year. Figure 7-6 shows the annual variation in capacity factor for hydroelectric plants in the US. When precipitation runoff is bountiful, hydroelectric generation is used and other generating plants, mostly gas-fired facilities, are idled. When hydroelectric energy generation is low, intermediate and peaking generating plants make up the difference.
0%
10%
20%
30%
40%
50%
60%
70%
80%
1998 1999 2000 2001 2002
Biomass
Geothermal
Hydro
Wind
Solar
Source: EIA, REA 200
Figure 7-6
Annual Variation in Renewable Energy Project Capacity Factors Source: EIA, REA 2002
April 21, 2006 7-8

NREL CA Solar Benefits Environmental and Hedging Benefits
A diversified portfolio of generation technologies and energy sources decreases the total risk of the portfolio to fluctuations in the value of any one component of the portfolio. Black & Veatch estimated the relative portfolio hedging effect of CSP to the California electric system based upon plant production cost data obtained from Platt’s and the CSP deployment scenarios developed in Section 4.0.31 The total annual production cost, that is, fuel plus non-fuel variable O&M cost, but not including capital costs, was calculated for the current California generation portfolio, the low CSP deployment and high CSP deployment scenarios. This calculation was then repeated for three natural gas price scenarios. Figure 7-7 provides the total annual production cost compared to the base case generation portfolio. As shown in Figure 7-7, the total cost increases by 32 percent for the base case portfolio and by 27 percent under the high CSP deployment scenario – a difference of 5 percentage points. Given a total annual production cost of about $12 billion under the high fuel scenario, this difference equates to about $500 million annually. The benefit is somewhat smaller for the low CSP deployment scenario, but still positive. Thus, the benefit of portfolio diversification can be significant depending on the volatility of the other components of the portfolio.
70
80
90
100
110
120
130
140
5 7 10
Natural Gas Price, $/MMBTU
Tota
l Ann
ual P
rodu
ctio
n C
ost -
Per
cent
of C
urre
nt G
ener
atio
n P
ortfo
lio
Current Generation Portfolio
Low CSP Deployment
High CSP Deployment
Figure 7-7
Effect of CSP Deployment on Statewide Generation Cost (Current Portfolio with $7.00/MMBtu gas = 100)
31 Plant production cost data by fuel type provided by Platt’s and available through the Platt’s Power Outlook Research Service at: www.platts.com.
April 21, 2006 7-9

NREL CA Solar Benefits Conclusions
8.0 Conclusions
The purpose of this study was to determine the economic and environmental impacts on California resulting from the installation of concentrating solar power plants. The primary focus was on economic and employment impacts and the comparison of these findings with the corresponding impacts from conventional gas fired generators that would otherwise be employed. To ensure that projected installation scenarios were realistic, the electricity supply characteristics of potential CSP technology variants were examined and the availability of California solar resources to support estimated solar plant output was addressed. The environmental impacts of power production were quantified as well as the possible “hedge” value against increases in natural gas price. Having completed the foregoing, Black and Veatch reaches the following conclusions:
• California has high quality solar resources sufficient to support far more concentrating solar installations than either of the 2,100 MW or 4,000 MW capacity scenarios postulated for this study.
• Depending on the CSP plant interconnection point and the load profile of the local electricity provider, concentrating solar power installations with 6 hours storage could perform peaking and/or intermediate generation roles for the utility.
• Investment in CSP power plants delivers greater return to California in both economic activity and employment than corresponding investment in natural gas equipment: - Each dollar spent on CSP contributes approximately $1.40 - $1.50
to California’s Gross State Product; each dollar spent on natural gas plants contributes $0.90 - $1.00 to Gross State Product.
- The 4,000 MW deployment scenario was estimated to create about 3,000 permanent jobs from the ongoing operation of the plants.
• Operational period expenditures on operations and maintenance create more permanent jobs than alternative natural gas fueled generation.
• For each 100 MW of generating capacity, CSP was estimated to generate 94 permanent jobs compared to 56 jobs and 13 jobs for combined cycle and simple cycle plants, respectively.
• Energy delivered from early CSP plants (startup in 2007) costs more than that delivered from natural gas combined cycle plants32 ($157 per MWh
32 Based on MPR gas prices for 2007, $6.40/MMBtu, and assuming a 100 MW CSP plant with 6 hours storage and a 500 MW combined cycle plant. Both CSP and combined cycle plants operate at 40 percent capacity factor. All dollars are $2005.
April 21, 2006 8-1

NREL CA Solar Benefits Conclusions
vs. $104 per MWh, based on a 30 percent ITC for CSP). With technology advancements, improvements to CSP construction efficiency, and with higher gas prices consistent with 2015 MPR projections, CSP becomes competitive with combined cycle power generation ($115 per MWh vs. $119 per MWh, even with the permanent 10 percent ITC). Most of the economic and employment advantages are still retained.
• CSP plants are a fixed-cost generation resource and offer a physical hedge against the fluctuating cost of electricity produced with natural gas.
• Each CSP plant provides emissions reductions compared to its natural gas counterpart; the 4,000 MW scenario in this study offsets at least 300 tons per year of NOx emissions, 180 tons of CO emissions per year, and 7,600,000 tons per year of CO2.
The economic and employment benefits, together with delivered energy price stability and environmental advantages, suggest that the CSP solar alternative would be a beneficial addition to California’s energy supply. While early CSP plants are more costly than their traditional gas counterparts, subsequent plants are estimated to become nearly cost competitive on a levelized cost of energy basis.
April 21, 2006 8-2

NREL CA Solar Benefits Appendix A
Appendix A Technology Assessment
April 21, 2006 A-1

NREL CA Solar Benefits Appendix A
Appendix A Technology Assessment
This CSP technology assessment was aimed at characterizing the CSP technologies for the economic impact assessment tasks. Performance, commercial readiness, cost, reliability, and technical risk have been characterized. Six technologies are discussed in this section.
• Parabolic trough without storage or hybrid fossil. • Parabolic trough with storage. • Parabolic trough with hybrid fossil. • Parabolic dish. • Power tower. • Concentrating photovoltaic (CPV).
Concentrating solar thermal power plants produce electric power by converting the sun’s energy into high temperature heat using various mirror or lens configurations. For solar thermal systems (trough, dish-Stirling, power tower), the heat is transferred to a turbine or engine for power generation. Thermal plants consist of two major subsystems: one that collects solar energy and converts it to heat, and another that converts heat energy to electricity. CPV plants provide power by focusing solar radiation onto a photovoltaic (PV) module, which converts the radiation directly to electricity. Either mirrors or lenses can be used to concentrate the solar energy for a CPV system. All CSP systems make use of the direct normal component of solar radiation, that is, the radiation that comes directly from the sun. Concentrating systems are unable to use global radiation, which is reflected radiation. Global radiation is present on sunny days and on cloudy days. Direct normal insolation (DNI) is available only on sunny days. Concentration of DNI allows a solar system to achieve a high working fluid temperature, or, in the case of CPV, allows expenditure for higher efficiency CPV cells since the cell area is small compared with the collector (mirror or lens) area. The need to focus DNI requires that collector systems track the sun. Parabolic trough systems use single-axis trackers to focus radiation onto a linear receiver. Dish-Stirling and power tower systems use two-axis trackers. The CPV systems discussed in this report use two axis tracking to achieve point focus images on PV cells. Single axis, line focus CPV systems have been built, but do not appear to have the long term commercial potential that the two axis tracking CPV systems have.
April 21, 2006 A-2
NREL CA Solar Benefits Appendix A
Because trough and power tower systems collect heat to drive central turbine-generators, they are best suited for relatively large plants—50 MW or larger. Dish and CPV are modular in nature, with single units producing power in the range of 10 kW to 35 kW. Thus, dish and CPV systems could be used for distributed or remote generation applications, and can be sited as large plants by aggregating many units. Trough and tower plants, with their large central turbine generators and balance of plant equipment, have a cost advantage of economy of scale—that is, cost per kW goes down with increased size. Dish and CPV systems have the potential advantage of mass production of individual units, similar to the mass production of automobiles Trough and tower systems have the potential advantage over dish and CPV systems in that an amount of dispatchability can be designed into the system with thermal storage or the use of hybrid fossil. Dispatchability allows the solar plant to generate electricity during short duration cloudy periods or to generate electricity into the evening after sunset. This gives the plant potential to receive capacity credit, and provides the ability to more closely match the utility peak load profile. At this time, dish-Stirling systems have not been configured to provide hybrid fossil capability. CPV systems could, of course, make use of battery energy storage; however, battery storage is comparatively inefficient and expensive, and has not been considered in this study. Should battery storage system costs decrease substantially, and efficiency increase, the use of storage with CPV would certainly be an option in the future. A.1 Parabolic Trough Systems Parabolic trough systems concentrate DNI using single axis tracking, parabolic curved, trough-shaped reflectors onto a receiver pipe or heat collection element (HCE) located at the focal line of the parabolic surface. A high temperature heat transfer fluid (HTF) picks up the thermal energy in the HCE. Heat in the HCE is used to make steam in the steam generator. The steam drives a conventional steam-Rankine power cycle to generate electricity. Figure A-1 shows a row of trough collectors. A collector field contains many parallel rows of troughs connected in series. Rows are typically placed on a north-south axis, allowing the single-axis troughs to track the sun from east to west during the day.
April 21, 2006 A-3
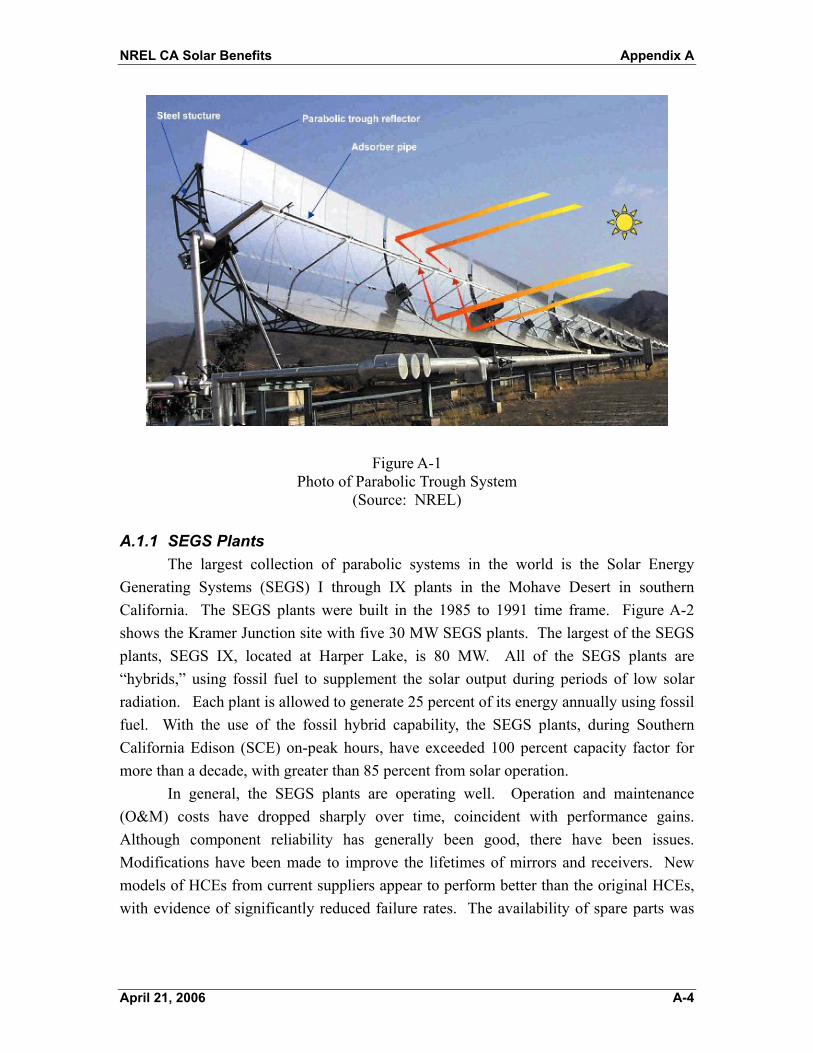
NREL CA Solar Benefits Appendix A
Figure A-1 Photo of Parabolic Trough System
(Source: NREL) A.1.1 SEGS Plants The largest collection of parabolic systems in the world is the Solar Energy Generating Systems (SEGS) I through IX plants in the Mohave Desert in southern California. The SEGS plants were built in the 1985 to 1991 time frame. Figure A-2 shows the Kramer Junction site with five 30 MW SEGS plants. The largest of the SEGS plants, SEGS IX, located at Harper Lake, is 80 MW. All of the SEGS plants are “hybrids,” using fossil fuel to supplement the solar output during periods of low solar radiation. Each plant is allowed to generate 25 percent of its energy annually using fossil fuel. With the use of the fossil hybrid capability, the SEGS plants, during Southern California Edison (SCE) on-peak hours, have exceeded 100 percent capacity factor for more than a decade, with greater than 85 percent from solar operation. In general, the SEGS plants are operating well. Operation and maintenance (O&M) costs have dropped sharply over time, coincident with performance gains. Although component reliability has generally been good, there have been issues. Modifications have been made to improve the lifetimes of mirrors and receivers. New models of HCEs from current suppliers appear to perform better than the original HCEs, with evidence of significantly reduced failure rates. The availability of spare parts was
April 21, 2006 A-4
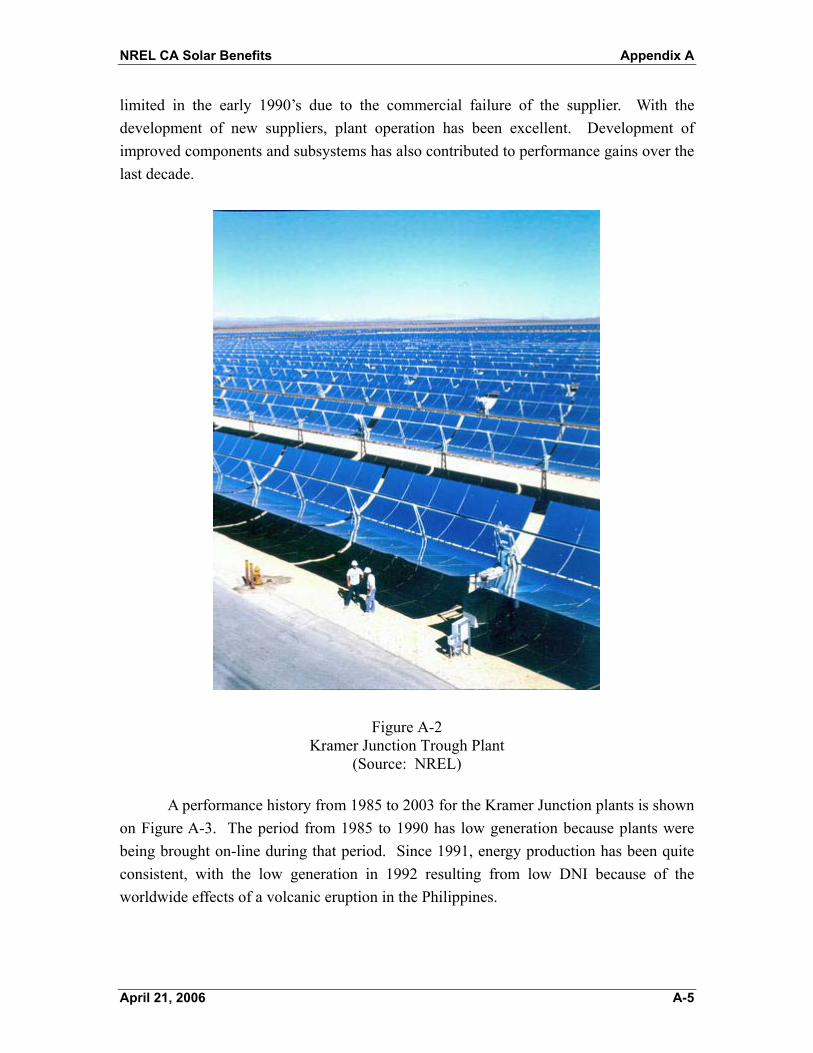
NREL CA Solar Benefits Appendix A
limited in the early 1990’s due to the commercial failure of the supplier. With the development of new suppliers, plant operation has been excellent. Development of improved components and subsystems has also contributed to performance gains over the last decade.
Figure A-2 Kramer Junction Trough Plant
(Source: NREL) A performance history from 1985 to 2003 for the Kramer Junction plants is shown on Figure A-3. The period from 1985 to 1990 has low generation because plants were being brought on-line during that period. Since 1991, energy production has been quite consistent, with the low generation in 1992 resulting from low DNI because of the worldwide effects of a volcanic eruption in the Philippines.
April 21, 2006 A-5

NREL CA Solar Benefits Appendix A
A.1.2 Planned Trough Plants There are several commercial projects in the planning or active project development stage. A 1 MW plant has been constructed in Arizona, with the plant currently in startup. Plants in the development stage include a 64 MW plant under construction in Nevada and a several 50 MW plant to be constructed in Spain. Indications are that the early Spanish plants will include 7 hours of thermal storage. Other projects in various stages of planning include integrated solar combined cycle system (ISCCS) in southern California, India, Egypt, Morocco, Mexico, and Algeria. In addition, there are plans for a series of SEGS type plants in Israel.
0
200
400
600
800
1,000
1985 1987 1989 1991 1993 1995 1997 1999 2001 2003
Year of Operation
Ann
ual G
ross
Sol
ar G
ener
atio
n (G
Wh)
0
2
4
6
8
10
Cum
ulat
ive
Gro
ss S
olar
G
ener
atio
n (T
Wh)
Cumulative Generation
Annual Generation
Figure A-3 Kramer Junction Annual Performance33
A.1.3 Trough Infrastructure Status Parabolic trough systems are considered commercially available for industrial applications. The primary developers of this technology include Solargenix Energy (USA), Solel Solar Systems (Israel), and Solar Millennium (Germany). Suppliers of components for trough systems include reflector supplier Flabeg (Germany) and receiver suppliers Schott Glass (Germany) and Solel Solar Systems. The currently planned technology, for thermal storage, is the molten salt two-tank system. This provides a feasible storage capacity of up to 12 hours and is considered to have a low-to-moderate associated risk.
33 Kearney, D., Price, H., “Advances in Parabolic Trough Solar Power Technology,” Advances in Solar Energy. Vol 16, Kreith, F., Goswami, D.Y. (Eds.), ASES, Boulder, Colorado, 2005.
April 21, 2006 A-6
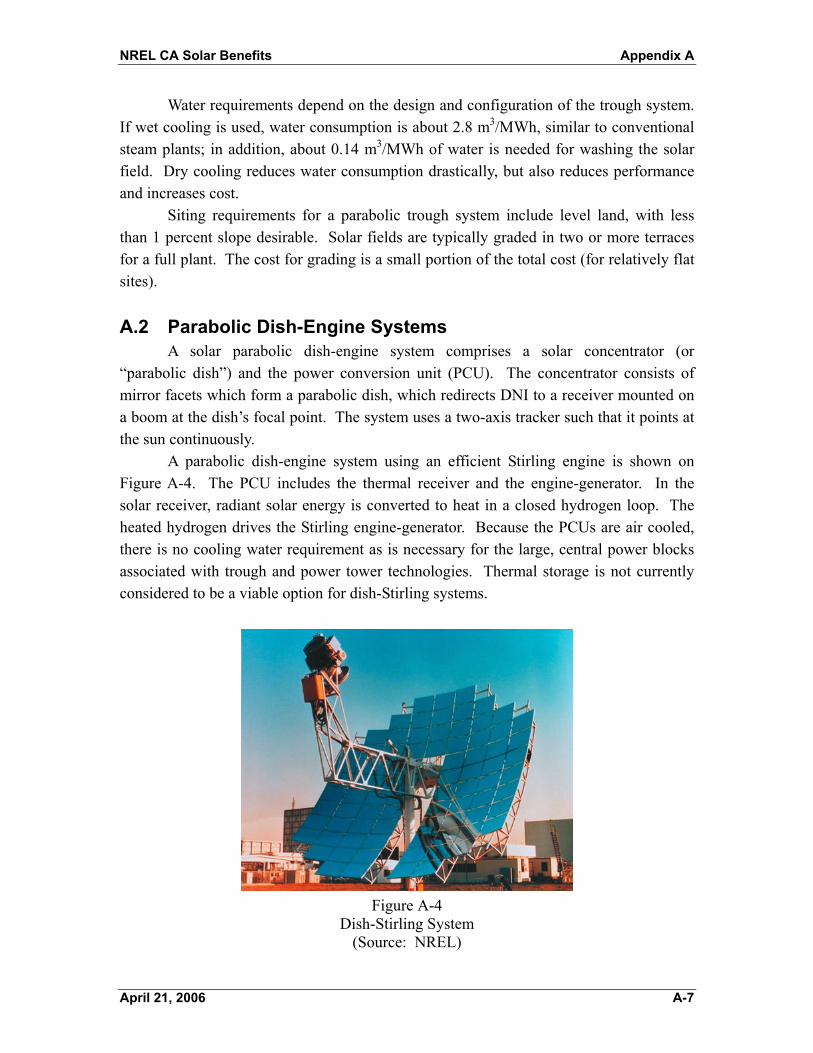
NREL CA Solar Benefits Appendix A
Water requirements depend on the design and configuration of the trough system. If wet cooling is used, water consumption is about 2.8 m3/MWh, similar to conventional steam plants; in addition, about 0.14 m3/MWh of water is needed for washing the solar field. Dry cooling reduces water consumption drastically, but also reduces performance and increases cost. Siting requirements for a parabolic trough system include level land, with less than 1 percent slope desirable. Solar fields are typically graded in two or more terraces for a full plant. The cost for grading is a small portion of the total cost (for relatively flat sites). A.2 Parabolic Dish-Engine Systems A solar parabolic dish-engine system comprises a solar concentrator (or “parabolic dish”) and the power conversion unit (PCU). The concentrator consists of mirror facets which form a parabolic dish, which redirects DNI to a receiver mounted on a boom at the dish’s focal point. The system uses a two-axis tracker such that it points at the sun continuously. A parabolic dish-engine system using an efficient Stirling engine is shown on Figure A-4. The PCU includes the thermal receiver and the engine-generator. In the solar receiver, radiant solar energy is converted to heat in a closed hydrogen loop. The heated hydrogen drives the Stirling engine-generator. Because the PCUs are air cooled, there is no cooling water requirement as is necessary for the large, central power blocks associated with trough and power tower technologies. Thermal storage is not currently considered to be a viable option for dish-Stirling systems.
Figure A-4
Dish-Stirling System (Source: NREL)
April 21, 2006 A-7
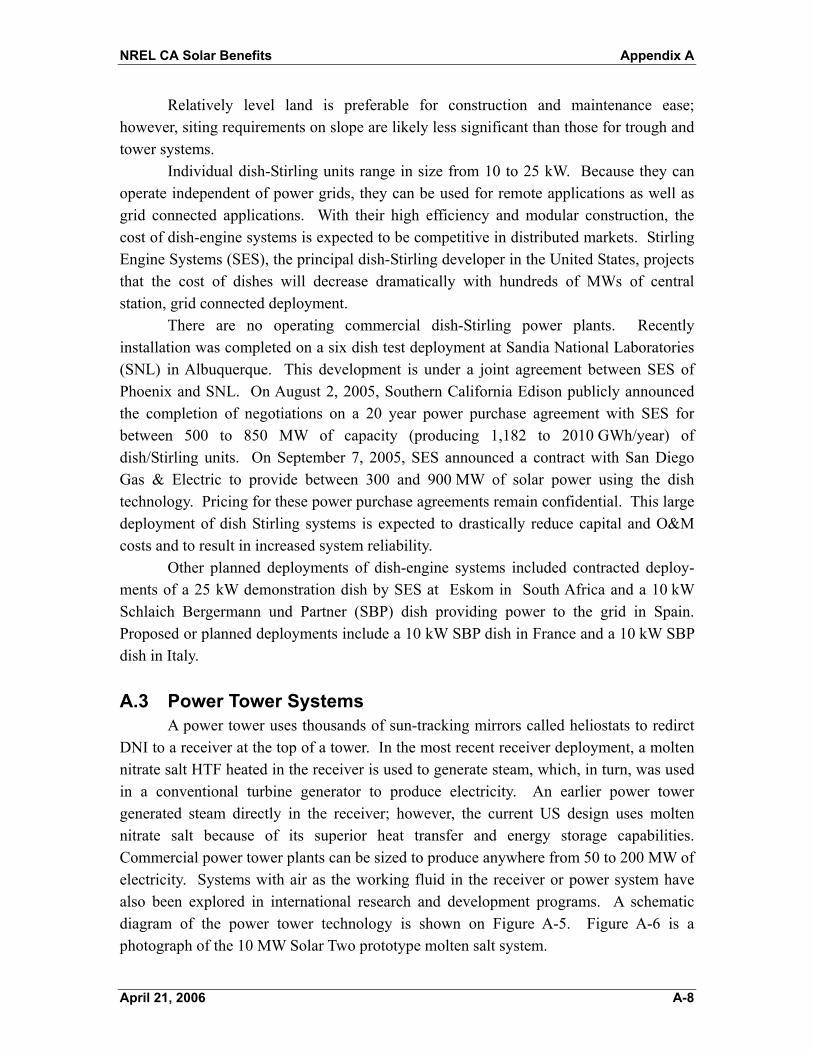
NREL CA Solar Benefits Appendix A
Relatively level land is preferable for construction and maintenance ease; however, siting requirements on slope are likely less significant than those for trough and tower systems. Individual dish-Stirling units range in size from 10 to 25 kW. Because they can operate independent of power grids, they can be used for remote applications as well as grid connected applications. With their high efficiency and modular construction, the cost of dish-engine systems is expected to be competitive in distributed markets. Stirling Engine Systems (SES), the principal dish-Stirling developer in the United States, projects that the cost of dishes will decrease dramatically with hundreds of MWs of central station, grid connected deployment. There are no operating commercial dish-Stirling power plants. Recently installation was completed on a six dish test deployment at Sandia National Laboratories (SNL) in Albuquerque. This development is under a joint agreement between SES of Phoenix and SNL. On August 2, 2005, Southern California Edison publicly announced the completion of negotiations on a 20 year power purchase agreement with SES for between 500 to 850 MW of capacity (producing 1,182 to 2010 GWh/year) of dish/Stirling units. On September 7, 2005, SES announced a contract with San Diego Gas & Electric to provide between 300 and 900 MW of solar power using the dish technology. Pricing for these power purchase agreements remain confidential. This large deployment of dish Stirling systems is expected to drastically reduce capital and O&M costs and to result in increased system reliability. Other planned deployments of dish-engine systems included contracted deploy-ments of a 25 kW demonstration dish by SES at Eskom in South Africa and a 10 kW Schlaich Bergermann und Partner (SBP) dish providing power to the grid in Spain. Proposed or planned deployments include a 10 kW SBP dish in France and a 10 kW SBP dish in Italy. A.3 Power Tower Systems A power tower uses thousands of sun-tracking mirrors called heliostats to redirct DNI to a receiver at the top of a tower. In the most recent receiver deployment, a molten nitrate salt HTF heated in the receiver is used to generate steam, which, in turn, was used in a conventional turbine generator to produce electricity. An earlier power tower generated steam directly in the receiver; however, the current US design uses molten nitrate salt because of its superior heat transfer and energy storage capabilities. Commercial power tower plants can be sized to produce anywhere from 50 to 200 MW of electricity. Systems with air as the working fluid in the receiver or power system have also been explored in international research and development programs. A schematic diagram of the power tower technology is shown on Figure A-5. Figure A-6 is a photograph of the 10 MW Solar Two prototype molten salt system.
April 21, 2006 A-8

NREL CA Solar Benefits Appendix A
Figure A-5 Power Tower System Schematic
Source: Adapted from SunLab (SNL and NREL)
Figure A-6 10 MW Solar Two Power Tower System
(Source: NREL)
April 21, 2006 A-9

NREL CA Solar Benefits Appendix A
An advantage of power tower plants is that molten salt can be heated to 1,050 oF, with steam generation at 1,000 oF, which is utility standard main steam temperature. This results in a somewhat higher cycle efficiency than is achievable with the lower temperature (about 735 oF) steam achievable with a trough system. Furthermore, power towers have the advantage that the molten salt is used both as the HTF and as the storage medium, unlike the trough system which uses a high temperature oil as the HTF, and requires oil-to-salt and salt-back-to-oil heat exchange for thermal storage. The result is that storage is less costly and more efficient for power tower than for troughs. There are no commercial power tower plants in operation. The 10 MW Solar One plant near Barstow, California, operated from 1982 to 1988, producing over 38 million kilowatt-hours (kWh) of electricity. Solar One generated steam directly in the receiver. To implement improved heat transfer and thermal storage, the plat was retrofitted (and renamed Solar Two). Solar Two operated from 1998 to 1999. Although Solar Two successfully demonstrated efficient collection of solar energy and dispatch of electricity, including the ability to routinely produce electricity during cloudy weather and at night, the plant encountered various technical issues. Solutions to these issues have been identified; however, successful demonstration of certain improvements is required prior to commercial financing of a large-scale plant. In addition to Solar One and Solar Two, experimental and prototype systems have operated in Spain, France, and Israel. Solucar Energia, S.A., an Abengoa company, recently announced a 11-megawatt solar power tower near Seville. Called PS 10, the power plant will be the largest solar power system in Europe and the first tower-based solar power system to generate electricity commercially. In addition, ESKOM, the large utility in South Africa, is considering a 100 MW molten-salt plant. A 17 MW molten salt plant in Spain, Solar Tres, was in planning by Ghersa, Boeing, and Nexant. However, this plant appears to be unlikely at this time. Potential component suppliers include heliostat supplier Sener and Inabensa in Spain. The Rocketdyne Unit of Boeing provided the molten salt receiver for Solar Two, and has been positioned to provide all molten salt equipment (receiver, thermal storage, steam generator) for a new power tower plant. Boeing recently announced the sale of the Rocketdyne Unit to Pratt & Whitney. The long term impact of this sale on solar equipment supply is not known. Cooling water requirements are about 2.8 m3/h per MWh, which include a small amount for heliostat washing. Dry cooling reduces this water consumption drastically, although, as with the trough system, performance is reduced and cost increased. As with the trough system, level land is preferable, with less than 1 percent slope desirable. The land area must be one continuous parcel with essentially a circular footprint.
April 21, 2006 A-10

NREL CA Solar Benefits Appendix A
A.4 CPV Systems Concentrating photovoltaic (CPV) systems have potential for cost reduction compared with conventional, non-concentrating (also referred to as flat plate) PV systems in two key ways. First, a major portion of conventional PV system cost is for the semiconductor material which makes up the PV modules. By concentrating sunlight onto a small cell, the amount of semiconductor can be reduced, albeit at additional cost for mirrors or lenses and for tracking equipment. Second, use of smaller cells allows for more advanced and efficient cell technology, making the overall system efficiency higher than for a conventional flat plate system. CPV systems have been under development since the 1970’s. This development has included single axis tracking, line focus CPV and two axis tracking, point focus CPV. Recent development has primarily been on the two-axis tracking systems. There are two primary developers of CVP systems today: Amonix, a company based in Torrance, California, and Solar Systems Pty, Ltd, located in Australia. The Amonix CPV unit, shown on Figure A-7, produces 25 to 35 kW per tracker, depending on how many modules are installed on the tracker. The Amonix system uses hundreds of acrylic Fresnel lenses to focus DNI on high concentration PV cells. Heat rejection is passive, meaning there is no water requirement and no closed loop radiator system The Amonix unit currently has an average annual efficiency of 15.5 percent.
Figure A-7 Amonix: Flat Acrylic Lens Concentrator with Silicon Cells
(Source: NREL)
April 21, 2006 A-11

NREL CA Solar Benefits Appendix A
Amonix systems have been deployed at Arizona Public Service (APS) facilities for a total capacity of 547 kW. Planned deployments in the near future include 10 to 20 MW in Spain. Currently, the systems use high-efficiency silicon cells. Efficiency and capacity gains are expected with advance triple-junction cells and higher concentration. Solar Systems Pty, Ltd, has a different approach to CPV, using a parabolic dish concentrator to focus DNI on a high concentration PV receiver. This 24 kW system, shown on Figure A-8, averages about 15 to 16 percent efficiency. Ten dishes have been deployed since 2003, for a total capacity of 220 kW, with the construction of an additional 720 kW under way. Several MW of contracts are anticipated in the relatively near future. The next generation of higher efficiency CPV modules is expected to increase the capacity to 35 kW in 2005. The core CPV technology, which accounts for about 25 percent of the cost, would be manufactured in Australia, with the remainder to be manufactured in the United States for a California deployment. A 50 MW CPV plant would consist of 2,000 25 kW units or 1,430 35 kW units. Similar to the dish-Stirling systems, no cooling water is required for operation. CPV systems have an annual capacity factor of about 26 percent. Near-term R&D is focused on reliability validation, module cost reduction (packaging), and advanced cell technology, e.g., III-V multijunction technology. Similar to the dish systems, level land is preferable for construction and maintenance ease, although it is likely a less significant requirement for CPV sites than that required by trough and tower systems.
Figure A-8 Solar Systems Pty, Ltd: Parabolic Dish PV Concentrator
(Source: NREL)
April 21, 2006 A-12

F1146-E(12/2004)
REPORT DOCUMENTATION PAGE Form Approved OMB No. 0704-0188
The public reporting burden for this collection of information is estimated to average 1 hour per response, including the time for reviewing instructions, searching existing data sources, gathering and maintaining the data needed, and completing and reviewing the collection of information. Send comments regarding this burden estimate or any other aspect of this collection of information, including suggestions for reducing the burden, to Department of Defense, Executive Services and Communications Directorate (0704-0188). Respondents should be aware that notwithstanding any other provision of law, no person shall be subject to any penalty for failing to comply with a collection of information if it does not display a currently valid OMB control number. PLEASE DO NOT RETURN YOUR FORM TO THE ABOVE ORGANIZATION. 1. REPORT DATE (DD-MM-YYYY)
April 2006 2. REPORT TYPE
Subcontract Report 3. DATES COVERED (From - To)
May 2005 - April 2006 5a. CONTRACT NUMBER
DE-AC36-99-GO10337
5b. GRANT NUMBER
4. TITLE AND SUBTITLE Economic, Energy, and Environmental Benefits of Concentrating Solar Power in California
5c. PROGRAM ELEMENT NUMBER
5d. PROJECT NUMBER NREL/SR-550-39291
5e. TASK NUMBER CP06.5002
6. AUTHOR(S) L. Stoddard, J. Abiecunas, R. O'Connell
5f. WORK UNIT NUMBER
7. PERFORMING ORGANIZATION NAME(S) AND ADDRESS(ES) Black & Veatch 11401 Lamar Ave. Overland Park, KS 66211
8. PERFORMING ORGANIZATION REPORT NUMBER AEK-5-55036-01
10. SPONSOR/MONITOR'S ACRONYM(S) NREL
9. SPONSORING/MONITORING AGENCY NAME(S) AND ADDRESS(ES) National Renewable Energy Laboratory 1617 Cole Blvd. Golden, CO 80401-3393 11. SPONSORING/MONITORING
AGENCY REPORT NUMBER NREL/SR-550-39291
12. DISTRIBUTION AVAILABILITY STATEMENT National Technical Information Service U.S. Department of Commerce 5285 Port Royal Road Springfield, VA 22161
13. SUPPLEMENTARY NOTES NREL Technical Monitor: Mark Mehos
14. ABSTRACT (Maximum 200 Words) This study provides a summary assessment of concentrating solar power and its potential economic return, energy supply impact, and environmental benefits for the State of California.
15. SUBJECT TERMS Solar power tower; concentrating photovoltaics; concentrating PV; Dish engine systems; Dish Stirling; concentrating solar power; solar parabolic trough; solar trough; parabolic trough
16. SECURITY CLASSIFICATION OF: 19a. NAME OF RESPONSIBLE PERSON a. REPORT
Unclassified b. ABSTRACT Unclassified
c. THIS PAGE Unclassified
17. LIMITATION OF ABSTRACT
UL
18. NUMBER OF PAGES
19b. TELEPHONE NUMBER (Include area code)
Standard Form 298 (Rev. 8/98) Prescribed by ANSI Std. Z39.18