economic evaluation of fertilizer supply strategies …
TRANSCRIPT

ECONOMIC EVALUATION
OF
FERTILIZER SUPPLY STRATEGIES
FOR THE ASEAN REGION
LINEAR PROGRAMMING APPROACH
IFDC INTERNATIONAL FERTILIZER DEVELOPMENT CENTER
Technical Bulletin-T-21 October 1981
ABSTRACT
This study was undertaken to illustrate the use of a dynamic linear programming model for planning the development of a fertilizer industry The model was applied to the countries of the ASEAN region
As formulated the model permits evaluation of different supply strategies specifically inreference to least cost supply patterns optimum production levels cost penalties when deviation from optimum occur and estimates of variable and total costs and of capital investments
To evaluate the impact of different fertilizer supply strategies in the region four scenarios were created They are (1) each country in the region can secure its fertilizer needs from least cost sources (2) a 100 regional self sufficiency in nitrogen (N) production is required (3) a 100 regional self-sufficiency in nit~ogen production and 50 self-sufficiency in phosphate (P20 5) production are required and (4) each country acts independently of each other and uses its own facilities as far as possible to meet its needs
Results of the study show the effect of different supply strategies on fertilizer cost It measures savings that could be realized through cooperative agreements It also shows the added costs that the region will have to pay to achieve different degrees of self-sufficiency
ECONOMIC EVALUATION OF FERTILIZER SUPPLY STRATEGIES FOR THE ASEAN REGION
LINEAR PROGRAMMING APPROACH
A Joint Publication of International Fertilizer Development Center (IFDC)
and Institut fiir Landwirtschaftliche Marktforschung (IfLM)
by
Lueder von Bremen with
Yao H Chuang Ray B Diamond Adolfo Martinez
Mohinder S Mudahar
October 1981
PREFACE
One of the first IFDC publications (IF DC T-2 1976) was amethodology study examining the potential for regional cooperation in fertilizer production between the member countries of the Association of Southeast Asia Nations (ASEAN) The essential elements of this publication which was financed by The World Bank were drawn from a working document drafted by The World Bank in collaboration with IFDC
With some of the highest population growth rates in the world and with economies based primarily on agriculture the ASEAN nations have developed and continue to develop fertilizer production capabilities aimed primarily at supporting the planned growth of the agricultural sector Fertilizer is increasingly becoming a strategic material hence national control of at least a part of the fertilizer supply is considered desirable Any move away from the free market system carries with it costs which can be evalumced In view of the very rapid economic development of the ASEAN nations it was felt that an improvement in the methodology used earliir and its application to evaluate possible alternative fertilizer supply strategies would give a valuable insight with respect to their relative economic advantages to the ASEAN countries
Consequently in late 1977 IFDC invited staff of the various agencies involved in the fertilizer sector of the ASEAN countries to prepare an information base in order to evaluate various supply strategies by using the new fertilizer sector planning model
Unavoidanle delays occurred in preparing the final report of the study The results reported in this study are however ba~ed on an update of the information to reflect the fertilizer supply situation during 1979
IFDC wishes to acknowledge the support and enthusiasm of the following who assisted in developing the information base and its update Mr Miguel Zosa Ms Bernadette Comotan-Abad Mr Filemon Cabungcal and Mr Jesus Gallegos Fertilizer and Pesticide Authority Manila Philippines Mr Kusmuno Ministry of Industry Jakarta Indonesia Dr A Wahab and Mr Soedharyono Mustafa PT Pupuk Sriwidjaja Jakarta Indonesia Mr Daniel Selvaretnam Singapore Economic Development Board Mr Gumthorn Utrawuthipong Thai Central Chemical Co Ltd and Mr Phachuap Phawandon and Mr Trakarn Chairat Ministry of Industry Bangkok Thailand
The authors gratefully acknowledge the technical assistance and helpful comments provided by the following IFDC staff members Mr A F Little Dr Dennis H Parish Dr Paul J Stangel Mr M Terry Frederick and Mr Richard Booth Appreciation is due the staff of the Word Processing Center for their patience in typing the many drafts of this report
IFDC is also indebted to der Forschungsanstalt fur Landwirtschaft (FAL) at Braunschweig-Volkenrt3de West Germany for their having seconded Dr Lueder von Bremen to IFDC to formushylate the mathematical programming model used in the study and for the use of their computer facilities at latter stages of the analyses
TABLE OF CONTENTS
Page Summary and Conclusions 1
Introduction 2
O bjectives of the Study 2 Overview of Economic and Agricultural Situation 3
Income Area and Population 3 Projected Food Deficits 3 Role of Trade 4 Role of Agriculture 4 Fertilizer Use and Crop Production 4
Overview of Fertilizer Sector 5 Actual and Planned Supply Capacities 5 Production acilities 5 Fertilizer Production 6 Fertilizer Imports 8 Fertilizer Consumption 8
Availability of Raw Materials 8 Methodology for Study 9
The Linear Programming Model 9 Model Constraints 10
Fertilizer Prices 10
Fertilizer Supply Strategies 11
Input Data for Model Estimation 12 Fertilizer Demand Projections 12 Production Coefficients 12
Capital Cost 12 Production Conversion Costs 12
Import and Export Prices 12
Transportation Costs 13 Empirical Results for Alternative Supply Strategie 14
Fertilizer Production Patterns 14 Fertilizer Supply Patterns 14
Production Site Prices 16
Market Region Prices 16 Economic Evaluation of Alternative Supply Strategies 18
Capital Requirements 18 Variable Production Costs 19
Cntribution to Profits 19
Return on Investment 20
Costs for Supplying Regional Requirements 20 Suggested Improvements and Applications 20
References 22
Appendix
LIST OF TABLES
Page1 Selected Socioeconomic Indicators for the ASEAN Region 3 2 Projected Food Deficits for 1990 in ASEAN Countries 4 3 Fertilizer and Rice Indicators for the ASEAN Region 5 4 Existing and Potential Fertilizer Production Capacity in ASEAN Region 6 5 Known Oil and Gas Reserves and Gas Production in Asian Countries 9 6 Prices for Finished Fertilizers Intermediates and Natural Gas During 1979 14 7 Annual Production of Nutrients Under Alternative Supply Scenarios Model Results 15 8 Sources of N Supply as Finished Fertilizers to ASEAN Market Regions Model Results 16 9 Sources of Phosphate (P2 05 ) Supply as Finished Fertilizers to ASEAN Market Regions
Model Results 17 10 Distribution of Principal Raw Materials and Intermediates Model Results 17 11 Annual Exports to World Markets of Urea and Ammonia Model Results 18 12 Weighted Aveage Prices for Nutrients by Country Model Results 19 13 Estimated Return on Investment at Expansion Sites Model Results 21 14 Estimated Total Expenses and Avoidable Costs to Supply Fertilizers to the ASEAN
Region During 1981-92 Model Results 21
LIST OF FIGURES
1 Marketing Regions and Locations of Existing and Planned Production Facilities in ASEAN Countries 7
2 Illustration of Fertilizer Price Determination 11 3 Apparent Historical and Projected Nutrient Consumption for ASEAN Countries 13
Summary and Conclusions
A dynamic linear programming model was dev-eloped and used to determine least cost fertilizer sup-ply strategies for the Association of Southeast Asian Nations (ASEAN) The overall objective of this study was to illustrate the use of the model as a planning tool for the fertilizer industry The study provides an example of its applications in planning investment programs and e-tablishing guidelines for international cooperation agreements in the fertilizer sector The model results for alternative fertilizer supply stra-tegies appear extremely useful to provide guidelines for national planners to ensure adequate amounts of fertilizer in consuming regions at the lowest possible cost
The dynamic nature of the model permits solu-tions which are elevant to changing fertilizer tech-nology fetilizer demand production ca)acities and price relationshipt The time period covered by the model is 1981-92 using 1978-80 as the base period All calculations are for midyears of four 3-year subshyperiods
TFie study considered the economic implications of alternative supply strategies fcr the ASEAN region and for individual ASEAN countries Foul different scenarios were simulated to measure the impact of alternate supply strategies for meeting projected fer-tilizer demand on individual countries and the region as a whole These four scenarios can be descibed briefly as follow
Scenario l--It is an unestictive scenaio which permits each country to secure its fertilizer needs from least cost sources Essentially this means that countries can poduce it domestically or purchase it from other ASEAN count lies or from the wold market
Sceno lo II-- It requires a 100 regional self-nnfficiery in nitrogen fertilizers except for sub-
period 1 when only 95 self-sufficien cy is possihlewith the existing facilities No imports of nitrogen fertilizers from outside the ASEAN region are per-mitted Phosphate fetilizes can bt obtained from any least c)st sources
Scenario lll--It is similar to scenario II with respect- to__regional self-sufficiency for nitrogen A restriction is added however that limits imports of phosphate (PO) fetilizers to 50 of total regionalneeds
Scenario IV--In this scenalio each county uses its own facilities as fal as possible to meet its needs Imports are allowed if a countrys capacities are not sufficient to meet the demand
When policies dictate a deviation fromn optimum allocation of resourcos direct comparisons of total costs to supply fertilizer needs under different stra-tegies permit determination of added cost
Results presented in this report show tthat a supply strategy tased on findings of scenario I is the most profitable for the ASEAN region and for each of its countries The total amount of fertilizers needed can be supplied at an avoidable cost of US $5809 million (1979) This amount includes the cost
1 Avoidable costs are defined as the minimum net total costs of production imports exports trans-portation and plant construction
of imports and of domestic production The tota fertilizer supplied to the region would have a markel value of US $11378 million Approximately 85-90of total nitrogen fertilizer will be produced in thE region the remainder will be imported from worlc markets For phosphate fertilizers 53-71 of thE 1205 will be imported and the rest will be produced in the region
Furthermore the results indicate that all exshyisting urea plants should operate at 98-1000 capacity and that expansion urea plants at Aceh and Bontang in Indonesia Bintulu in Malaysia and Sattahip in Thailand be completed (luring 1983-85 The expansion plant at Limay in the Philippines should not be given further consideration
With respect to ammonium sulfate (AS) it should not be produced in the region To supply nitroen (N) in the form of urea is a lower cost alternative t)iammonium phosphate (DAP) should be produced at Giesik in Indoinesia and at Leyte in the Philippines The production of NPK 2 (15-15-15) fertilizer should take place only at Petaling Jaya in Malaysia
Approximately 30 of the nitrogen and 5 of c phosphate (1)20s) fertilizer require transportation from one ASEAN country to another Cooperative agreements based on production guidelines provided by this scenario would guarantee an adequate supply of fertilizer for all consuming areas of the region at the least possible cost
Comparisons of scenario I with scenarios II and Ill show that the predetermined regfional levels of self-sufficiency for nitrogen and phosphate will be achieved at an additional cost For scenario II it is estimated that a total of US $6019 million is needed to meet demand requirements This represents an added cost of US $210 million to meet the regional self-sufficiency quirement of 100 for nitrogen proshyduction
For scenario III it is estimated that a total of tS $0 10( million is needed to meet demand requireshyments This represents an added cost of US $355 million over and above that for scenario I to meet regional self-sufficiency requirements of 100 in nishytrogen and 50 in phosphate (P 2 05) fertilizer proshyduction It is estimated that to achieve the 50
self-sufficiency in phosphate fertilizer production reshyquires an extra US $115 million
Scenario IV which represents the most probable path that ASEAN countries will follow provides total fertilizer needs at a cost of US $7328 million or US $1519 million more than the least cost supply altershynative of scenario I The main reason for this highcost is that existing inefficient plants with relatively high production costs will he operated
This study clearly demonstrates the potential effect of different supply strategies on fertilizer costs In general the lowest fertilizer prices are for scenario I and the highest for scenario IV This provides an indication of the possible consequences of alternative supply strategies on fertilizer prices fershytilizer use and therefore on agricultural production
It is not claimed that results presented in this report comprise an exhaustiv( study of the subject This is a preliminary investigation designed to proshyvide guidelines to policymakers involved in fertilizer
2--l- -- fertil-izers are nitrogen-phosphate-potash fertilizers expressed as a ratio of the N-P 2 0 5-K 2 0
sector planning It shows potential benefits that could be obtained from economic cooperation in de-veloping regional fertilizer industry Results and conclusions are tentative and subject to change with further refinements in model and input data
Introduction
Rapidly escalating energy prices have threatened traditional fertilizer sources especially of nitrogenthroughout the world Furthermore the cost of man-ufacturing fertilizers has been rising and will probably continue to do so in the future Government plannersand decisionmakers in developing countries are fullycognizant of the adverse effects on fertilizer use and food production of the fertilizer shortages and in-creased prices which occurred during the 1973-75 fer-tilizer crisis Reoccurring of such events and the lack of fertilizer supply at the farm level are causing many governments to create or expand domestic fer-tilizer production as an integral part of their national fertilizer supply strategy
Government officials may not be fully aware that development of domestic fertilizer production facilities does not always represent an optimum allocation of scarce resources It may be more costly to increase domestic production to meet total supply requirementsthan to rely fully or partially upon imports Fertil-izer production decisions in one country may affect not only the cost of fertilizers in other importingcountries but also the pattern and cost of supply for an entire economic region
Most fertilizer production feasibility studies deal only with the construction or expansion of single fa-cilities and not with long-term strategies to provideleast cost supply of all fertilizer requirements for a region or even a country However since capital inshyvestments are high and require long-term commitment it is important to evaluate the economic implications of several supply alternatives before selecting a given project
Indonesia the Philippines Malaysia and Thailand--the agricultural countries of the ASEAN region--have many of the raw materials and much of the production capacity to meet the growing fertilizer demand of the region From both a regional and national point of view there has been a growing in-terest in the ASEAN region for obtaining a greater degree of self-sufficiency in fertilizer production in order to develop a relatively more stable and secure fertilizer supply strategy
The national planners from the ASEAN regionexpressed an interest in determining possible least cost national and regional fertilizer supply alterna-tives An initial study was jointly conducted by The Worid Bank and IFDC The results are reported byFoster Livingston and Stangel (1976) An updateof this study was then undertaken by a working group within IFDC The initial preparations for this study were completed during the second half of 1977 This included conceptualization of the problem the formulation of a mathematical model the programming
3 Singapore the fifth ASEAN member country is not included in the analysis since it is neither a major fertilizer producer nor a consumer of fertilizer
for input generation and in collaboration with counshytry rep-esentatives the collection of appropriate data During mid-1978 a draft report of the preshyliminary results was discussed with government and industry representatives from the ASEAN countries Based on these discussions and on the knowledgereceived during further visits to the region during 1978 and 1979 the ASEAN Fertilizer Sector PlanningModel was modified to reflect mid-1979 conditions The main inputs to and the results obtained from the updated model runs are presented in this report
The study quantifies a more or less realisticfirst approximation of the fertilizer situation in the ASEAN region in 1979 The expansion of productionfacilities contemplated at the time availability of fershytilizer raw materials and demand projectioiis for 17 consumption regions through 1992 have been incorposhyrated A dynamic linear programming model was developed to determine the least cost solutions for supplying the estimated fetilizer demand to consumshying regions from 1981 to 1992 The results of the analysis give a first ap)proximation of the costs which countries will incur under four different supply strashytegies Thus even though most of the productionfacilities considered arc in operation or being develshyoped information with respect to technological and economic implications of different strategies which maybe useful for the future development of the fertilizer economy in the ASEAN region is generated
The model used for this study offers a systemshyat ic means to handle -i largi amount of data needed for obtaining optimum solutions for dynamic situashytions such as those now occurring in the fertilizer sectors of many developing countries Such an apshyproach can be meaningfully applied to other regions individual countries or marketing regions within a country in order to determine best fertilizer supplystrategies and thus serve as a guide for fertilizer sector planners
Objectives of the Study
The overall objective of the study is to illustrate the use of a dynamic linear programming model for planning the development of the fertilizer industry The model has been developed aind applied to the ASEAN region More specifically the study providesinsights with respect to planning investment programsand implications for regional cooperative agreements dealing with fertilizer projects Furtharmore it permits the economic evaluation of alternative supplystrategies to meet projected fertilizer requirements
The ASEAN region was selected not only to ilshylustrate the usefulness of this approach for planning purposes but also because the region is important and is experiencing rapid developments with respect to fertilizer supply The planning period considered was 1981 through 1992 The model as used in this study permits evaluation of different supply strateshygies specifically in reference toshy
1 Least cost supply patterns with respect to loshycatio size and timing of capacity expasion of plants o construction of new plants in the region
2 Optimum levels of domestic production and imshyports from different sources by each country in
2
order to satisfy projected fertilizer needs for selected time peiods
3 Estimates of cost penalties for the region when member countries deviatte from optimu m supply alternatives or from cooperatie agreements
I Variable costs total tlpply costs and capital investments
Overviewv of Eonom ic antd AgricuItural Situationi
A brief description of the eConoin ic and agiiCu1-tural situations in the four ASEAN countries is po-vided below
Inconle Area and Populat ion
Se etctd sotiotttnonlit indicators foi tie ASEAN countries aiie pitstnted in lahte 1 Malaysia has the highest pei eaptiti gioss national piodtItIt ( GNP) in the region In relation to othei countries it is about double that of the Philippires and Thailand and triple that of Indonesia The (Nl per capita is at annual rates ranging fom 26 in the lhilipplines to
469 illThailnitd Atuiatt infoiint ion on intolnt distiibution is nut geneially availa l lCowevei ac-coiding to 197071 dala fioin the Philippines and
Malaysia Ill Iotntom 20 of the houiseholds tontiol less than of incoie and lhe lop 20 control19 the approximately 5T-571
Indonesia is the largest of the fotir cotn1its with an area of 2)2700(1 kini
TABLE 1 SEtECTEI) SOCICECONOfIC
Socioeconomic Indicators
GNP per capita Growth in GNP per capita
Area Population Rate of inflation
Distribution of GDP Agriculture Industry tanufacturing Services
Exports Imports
Population growth Labor force in agriculture Rural population
Daily calorie supply
Calories as of rrluirements
Share of househotl income Lowest 20 IHighest 20
a Average for -stated period
Source The World fank 1980
eqtlivaltlt to apprcex-
imately six times that of Malaysia seven times that of the Philippines and four times that of Thailand Both Indonesia and the Philippines consist of a large number of islands creating several administrative and infrastructural problems At the same time they have a ilarge potential for developing polt facilities for water transport
Indonesia with 136 million inhabitants in 1978 is one of the most populous coun tries in the world and the most populous in the ASEAN region Malaysia Thailand and the Philippines have 133 million 445 million and 4t56 million inhatbitants respectively
Annual population growth rate in Indonesia is
the lovest of the region and is equal to 18 Malaysia the Philippines and Thailand have the same population growth rate of 2790 A large proportion of Indonesias population lives in ava and a large proshyportion of Malaysias popltation lives in peninsular Malaysia In tava the density of population is very high compared with that of the outer islands The Indonesian (Iove Ilnlen t is heavily involved in transshylocating part of the population from Java to the outer islands through transmigration schemes In each of the ASEAN countries over two-thirds of the popushylation live in rural areas and thus depend on agrishyc3owing is the major of their livelihoodeulture source
Projeced tF0dleficits
he pirojected food deficits for 1990 as estimated by the International Food Policy Research Institute (illfl) (1977) are reptorted in Table 2 Currently Indonesia and Malaysia are food-deficit countries Thailand is considered to have food surplus and the Ihilippines is just marginally self-sufficient in food
INDICATORS FOR TItE ASEAN REGION
Unit of Measurement
$ per capita per year
thousand kni mi IIion i per year
million US $ million US $
per year of total of total
calories per capita
Year Indonesia Malaysia Philippines Thailand
1978 360 1090 510 490
1960-78a 41 39 26 46
- 2027 330 300 514
id-1978 1360 131 456 445
1970-78a 200 72 134 91
1978 31 25 27 27
1978 33 32 35 27
1978 9 17 25 18
1978 36 43 38 46
1978 11643 7413 3425 4085
1978 6690 5929 5143 5256
1970-78 a 18 27 27 27
1978 1980
60 80
50 71
48 64
77 86
1977 2272 2610 2189 1929
1977 105 117 97 105
197071 197071
NA NA
33 566
37 539
NA NA
World Development Report
3
1
TABLE 2 PROJECTED FOOD DEFICITS FOR 1990 IN ASEAN COUNTRIESa
At 110 of FoodIncome GrowthLow Income Growth 11ij]_h Energy Requirement
Deficit of Deficit of Deficit ofCountry 000 mt Consumption 000 mt Consumption 000 mt Consumption
Indonesia 5985 14 7656 17 4240 10Malaysia 387 11 454 13 434 13PhilippiBes 1443 11 1738 13 3632 24Thailand (6972) (45) (6771) (43) (7302) (48)
Region 843 1 3077 4 1004
a Food consists of staples including cereals root crops pulses and groundnutsb Figures in parentheses imply food surplus
Source Calculated from IFPRI (1977)
requirements It is projected that through 1990 loleofAgricultureThailand will remain a food surplus countryIndonesia Malaysia and the Philippines are not Agricultue plays an important role in economicexpected to be able to meet their requirements from growth in each of these countries With the exshydomestic production in the future in spite of attempts ception of Indonesia where oil is a major export itemby these governments to achieve food self-sufficiency the agricultural sector is a major ource of foreignThe food deficit as a prot)ortion of domestic conuinp- exchange Cafniogl Table l shows that approximatelytion is estimate(] to be about 1(0-17 in Indonesia 311Wof ti gross domestic )roduct (GDP) comes from11-13 in Malaysia and ll-2 in tilePhilippines the agricultu1 at sector A large prcportion of thedepending upon tileassumptions with respect to in- total labor force is involved in agriculture-relatedcome growth and nutritional standards Thailand will activities The labor force in agriculture ranges fromhave a food surplus from 130to t8 of domestic con- 8 in Malaysia to 77 in Thailand Even though allsumption four countries eml)has ize (livers ification of crop proshy
duction rice is still tlmain food crop and theAt both low and high income growth 771-791 of staple food commoditythe regions food deficit will be in Indonesia flowshyever in order to provide 110 of the food energyrequirements the food deficit in Indonesia and the Philippines becomes about and 14Vof the regionsdeficit respectively This is mainly because the existing nutritional standards in the Philippines are estimated to be lower than the minimum requirementsHowever for the region as a whole the net food def- tlseanddelizerCrop Production icitis about 1V-of the consumption requirementimplying that food surplus from Thailand is large Wlee is the single major crop in each of theseenough to substantially compensate for food deficits in countries with the exception of Malaysia where rub-Indonesia Malaysia and tilt Philippines ber and oil palm are most important ones Thesethree thecrops reeeive most of the fertilizer used in
these countries
In the last decade the major sources of ex-Role of Trade pansion in rice prodtuction were yield increases in
Indonesia Malaysia and the Philippines and areaexpansion in Thailand Table 3 showsThese countries trade bilaterally through the proportionthe of growth in rice production attributed to fertilizerASEAN arrangements and with other countries in tile use It ranges from 17 in Thailand to 31 in Malayshyregion and outside During 1977 Indonesia and sia The rice yields and the contribution of fertilizerMalaysia had positive international trade balances to rice yield increases are expected to play evenwhereas the Philippines and Thailand had negative greater roles in the future if the laige projected foodinternational trade balances The major exl)ort prod- deficits are to be reduced Table 3 also shows thatuct from Indonesia is oil followed by rubber and fertilizeC use during 197879 varied from 165 kghacoffee The major export )ro(ucts from Malaysia are in Thailand to 571 kgha in Malaysia
rubber palm oil cocoa and tin The Philippinesexports coconuts sugdr t)ananas and apples hiile The (overnments of Indonesia Malaysia and theThailand exports cassava maize rice sugar and lhilippines are making a concerted effort to improverubber The agricultural sector plays a major role in crop yields by providing modern farm inputs such asthe balance of trade of these countries As a result water fertilizer seed and insecticides they aregrowth in domestic production of agricultural coin- also providing economic incentives through favorablemodities can play an important role in influencing crop and input prices The Indonesian Governmentforeign exchange situations through expansion in through the I3IMAS program and the Philippinesforeign exhange earnings or foreign exchange Government th rough the MASAGANA 99 programsavings Fertilizer has a large potential to expand have been fairly successful in stimulating modernshycrop yields and thus domestic agricultural )ro- inization of the rice sector through an increaseduction Ihe adoption of modern farm technology
TABLE 3 FERTILIZER AND RICE INDICATORS FOR THE ASEAN REGION
Fertilizer and Rice Indicators
N consumption P205 consumption K20 consumption
Fertilizer usehectare on arable land and permanent crops
Rice (paddy production Rice (paddmy area harvested Rice (paddy) yield Cuntribution of fertilizer to
rice production growth
Unit of Measurement Year Indonesia Malaysia Philippines Thailand
000 mt 197879 5240 1069 2054 1535 000 mt 197879 1354 905 498 1044 000 mt 197879 754 1727 566 300
kgha 1978 449 571 385 165
000 mt 1979 26350 2161 7000 15640 000 ha 1979 8850 757 3500 8300 kgha 1979 2977 2855 2000 1884
1965-75 24 31 27 17
Source FAO 1980 Production Yearbook FAO 1980 Fertilizer Yearbook Mudahar 1979 Policy Implications of Increased Fertilizer Efficiency for Rice Production in Asia
Overview of the Fertilizer Sector
Actual and Planned Supply Capacities
The actual installed fertilizer production capac-ity (1979) and the expansion in capacity currently planned for the ASEAN countries are reported in Table 4 Production capacity for nitrogen phos-phate and potash (N P2 0 5 and K2 0) fertilizersamounts to 1205 million mtpy 307000 mtpy and 28000 0 mtpymilorespectivelyamp nacn-28000 mtpy respectively 4 At 978At 197879 regional con-sumption levels nitrogen (N) production capacity is approximately 22 greater than that of consumption phosphate (P 2 0 5 ) production capacity is equal to 81 of that of consumption and potash (K20) production capacity is only 8 of that of consumption
Including the potential expansion of productionfacilities considered in this study production c-pac-
ities could increase to 2339000 mtpy of nitrogen and to 600000 of in Thesemtpy lO 1991 capacities
be equivalent to- 236 and 182 of the nitrogenwould be enuin in 197 respectivelyhenitrogen and P2 05 consumption in 1979 respectively and 116and 71 of the projected nitrogen and con-P2 0 5
sumption for 1991
Production Facilities
The production facilities in operation and those planned or being considered in 1979 are described briefly below The main characteristics of existing and planned facilities are shown in Appendix
Table A-1 The approximate location of the facilities is shown in Figure
Indonesia has seven fertilizer complexes in operation They include four ammoniaurea complexes under PUSRI at Palembang (Sumatra) one ammonia urea complex under Kujang at Cikampek (Java) one ammoniasulfuric acidAS complex and one TSPDAP
4 Some of the 205 and all of the K20 production refer to P and K contained in NlPK fertilizers and are based on imported raw materials Presently some P2 05 is produced in the Philippines but there is no production of K2 0 in the region
NPK complex under Petrokimia at Gresik (Java) The PUSRI and Kujang complexes utilize natural gas for ammonia Petrokimia uses fuel oil for ammonia proshyduction and imports sulfur phosphate rock and phosphoric acid for other intermediate or finished fertilizer products
A new ammoniaurea complex for KALTIM near Bontang (Kalimantan) and another near Aceh (Sumashytra) aris approaching the initiation of constructionKujang is considering adding another ammoniaurea complex at the existing Cikampek site PetrokimiasGresik plant has also been contracted for expansion Grik an alobon tracted f expansin to produce an additional 500000 mtpy of TSP using imported rock and phosphoric acid
In Malaysia ammonia is produced near Port Dickson from refinery gas That ammonia is utilized
in facilities near Petaling Jaya to produce ammonium sulfate and ammonium nitrate Another plant uses locally produced nitrogen fertilizers and imported phosphate and potash fertilizers to produce granular NPK products These are plants which simply mixfertilizers An ammoniaurea complex based upon natural gas is planned for construction near Bintulu(Sarawak) Malaysia (
In the Philippines fertilizer plants are located at Limay and Pasig (around Manila Bay) at Toledo City and at Iligan City All plants are more than 15 years old and produce a wide range of products most of which are low analysis Actually some of these plants are temporarily shut down for renovation Present capacity does not meet domestic fertilizer demand
The Philippines having facilities at Limay and Toledo City is the only ASEAN country currently producing phosphoric acid
New production facilities for ammoniaurea may be located near Limay and a phosphoric acidDAP NPK complex is to be located on Leyte Recent deshyvelopments indicate that the latter complex which may also include ammonium sulfate production would depend upon sulfuric acid from the copper smelting industry
In Thailand the existing Mae Moh ammoniaurea AS complex is considered in the study on the basis that it could he renovated Since the model runs were made the Thai Government has decided to close
TABLE 4 EXISTING AND POTENTIAL FERTILIZER PRODUCTION CAPACITY IN ASEAN REGION
Country Location Site Product N Nutrient Thousand mtpy
P29O K20
Existing Installed (1979)
Indonesia Palembang I Urea 41 0 0 II Urea 166 0 0
III Urea 245 0 0 IV Urea 245 0 0
Gresik AS 27 0 0 DAP 13 33 0 NPK 7 7 7 TSP 0 137 0
Cikampek Urea 245 0 0
TOTAL 989 177 7
Malaysia Port Dickson AS 11 0 0 Petaling Jaya NPK 13 13 13
TOTAL 24 13 13
Philippines Limay Urea 26 0 0
NPK 31 31 0 Pasig AS 5 0 0 Toledo City AS 15 0 0
NPK 8 8 8 Iligan City AS 9 0 0
TOTAL 94 39 8
Thailand Mac Moh Urea 10 0 0
AS 10 0 0 Bangkok NPK 78 78 0
TOTAL 98 78 0
TOTAL OF EXISTING 1205 307 28
Potential Expansion
Indonesia Aceh Urea 245 0 0 Bontang Urea 245 0 0
TOTAL 490 0 0
Malaysia Bintulu Ammoniaurea 245 a
0 0
TOTAL 245 0 0
Philippines Limay Bay Urea 137 0 0 Leyte DAP 37 96 0
TOTAL 174 96 0
Thailand Sattahip Urea 109 0 0
NPK 105 141 16 MAPn H1 56 0
TOTAL 225 197 16
TOTAL OF POTENTIAL EXPANSION 1134 293 16
TOTAL OF EXISTING AND EXPANSION 2339 600 44
a Ammonia apacity urea capacity is equivalent to 216000 mtpy of N b MAP is an intermediate for NPK production in the Bangkok facility
the facilities Ilowever this change does not greally Fertilizer Production affect the study results since its production capacily was rather low Additional capacity in Thailand c n- Production of nitrogen in the ASEAN region has sists of an NPK mixing and granulation plant which is increased from 118001 mtpy in 1970 to 822600 mtpybased upon imported fertilizer materials in 1979 (Appendix Table A-2) This is equivalent to
an annual compound growth rate of 226 Indonesia A new fertilizer complex is being considered for is solely responsible for this dramatic increase This
Thailand PlIans exist for an ammoniauria complex country which accounted for approximately 30 of the and a phosphoric cidlIAPNlPK complex to he located total regional production during 197( produced apshynear Sattahip At the existing Bangkok facility MAP proximately 83Tof the total during 1979 Production is considered as an intermediate for NPK production in oilier ASEAN countries has remained relatively
6
Z
w
Z
LI
--
0
gt
gt C
d_
1cr
L
C
L
~0
ILU
4shy
044
00
L0
-Jm
I-LM
IL
stable and therefore does not show any definite patterns of change
Prior to 1979 small quantities of phosphate fertil-izers were produced in thp ASEAN region in 1979 approximately 65000 mt of was produced OnlyP2 0 5the Philippines produces phosphoric acid Malaysia converts some phosphate to soluble P2 0 5 during NPK production using sulfuric acid Thailand mixes diam-monium or monoammonium phosphate with other materishyals and granulates NPK fertilizers Indonesias facility at Gresik is based on imported rock and phosphoricacid and it began producing in late 1979 This fa-cility will substantially increase the regions capacity to produce phosphate fertilizers
Although there is no production of potash in the ASEAN region small quantities of imported potash are included in NPK formulations in each of the countries
Fertilizer Imports
The imports of nitrogen in the ASEAN region in-creased from 227000 mt in 1970 to 416500 mt in 1979 (Appendix Table A-2) Indonesia exported 106000 mt and imported only 17100 mt of nitrogen during1979 On the other hand the Philippines imported 117500 mt Malaysia imported 103000 mt and Thai-land imported 178900 mt
Imports of P2 0 5 by the ASEAN group increased from 149600 mt in 1970 to 329700 mt in 1979 Of this amount Indonesia and Thailand imported 121500mt and 125000 mt respectively accounting for ap-proximately 75 of the total P2 0 5 imports of the ASEAN countries During the same year Malaysia and the Philippines impoted 75000 mt and 8200 mtrespectively
Imports of K20 by the ASEAN countries have increased from 122600 mt in 1970 to 355100 mt in 1979 During that time Thailand and the Philippineseach increased imports only by 15000 mt while im-ports of K20 into Malaysia increased by 134000 mt and into Indonesia by 69000 mt Of the total ASEAN imports of K20 in 1979 190000 mt or about 54 was made by Malaysia
Fertilizer Consumption
Annual regional consumption of nutrients for the period 1970-79 is shown in Appendix Table A-3 During this period nitrogen consumption increased from 308000 to 990000 mt P2 0 5 from 189000 to 330000 mt and K2 0 from 105000 to 335000 mt From 1970 to 1979 the consumption of nitrogen andK 2 0 increased by 920 and that of P 2 )5 by 75
The greatest increase in consumption of nitrogenand P2 0 5 occurred in Indonesia while the greatest in-crease in K2 0 consumption was in Malaysia The average annual increases in nitrogen consumption between 1970 and 1979 were 195 for Indonesia 135 for Thailand and 82 for Malaysia and the Philippines The average annual increases in con-sumption of P2 0 5 and K2 0 were also fairly high for all the countries except for the Philippines In the Philippines the 2 0 5 consumption ranged between 10000 and 50000 mtpy whereas K2 0 consumptionhas been gradually increasing from 30000 mtpy in 1970 to 56600 mtpy in 1979
Fertilizer use in the ASEAN countries on a perhectare basis is still low It ranged from 165 kgha
in Thailand to 571 kgha in Malaysia during 1978 However fertilizer use is expanding rnpidly in response to HYV use irrigation expansion favorableprice policy and various government programs Rice is the major crop in the region in terms of fertilizer use Urea is the major source of nitrogen for the rice crop P2 0 5 K2 0 and complex fertilizers are used mainly on plantation crops including rubber oil palm and cocoa
With the exception of Thailand governments are actively involved in different aspects of fertilizer production and distribution Fertilizer is distributed at the retail level by public private and cooperativeagencies with varying degrees of participation The use of fertilizer subsidies to stimulate consumption is fairly common as an instrument for the reduction of retail prices except in Thailand
Availability of Raw Materials
It is rather difficult to appraise the availabilityof raw materials that are or thst could be available within the ASEAN region for the production of fertilizers This is partly due to the fact that a demand for such raw materials with the exception of oil and gas of which the rcgion has large reserves has not really existed in the past Appendix Table A-4 contains a summary of the natural reshysources of the region relevant to the fertilizer industry
The known oil and gas reserves and their production levels are reported in Table 5 Indonesia is the leading producer of natural gas and oil in the region Natural gas production in Indonesia inshycreased from 1260 billion ft 3
ft 3 in 1973 to 8163 billion in 1979 production is expected to reach
ft 316 trillion by 1981 Reserves at their present rate of usage are sufficient to last for at least 40 years however the real life of the-reserves is unknown because gas discoveries are proceeding at a faster rate than their usage
Malaysia-Brunci is the second largest producerof natural gas in the region Production hasincreased from 51 billion ft 3 in 1974 to 3027 billion ft 3 in 1979 At the 1979 usage rate reserves would last at least 82 years Malaysian gas is also being discovered at a faster rate than it is being usedOther ASEAN countries are not currently producingnatural gas but Thailand and the Philippines are actively exploring for gas and oil Thailand has discovered significant quantities of gas in the Gulf of Thailand and plans to have on-shore delivery in 1981
Lignite is used to some exten as feedstock for power plants in Thailand It ws also used asfeedstock for fertilizer picduction until 1978 when the Mae Mob plant was closed Phosphate rock depositsin ava Peninsular Malaysia Thailand and the Philippines are considered to be too small for economic exploitation and use in the produclion of phosphatefertilizers Pyrites are now used in the Philippinesfor sulfuric acid production (Limay) Coppersmelting in the Philippines will yield byproduct sulfuric acid with potential for use in phosphoric acid production
otash deposits in northeast Thailand are largeand exploration is being expande( to determine the feasibility for commercial development Howeverbecause of insufficient economic data these potashdeposits were not considered in this study
8
TABLE 5 KNOWN OIL AND GAS RESERVES AND GAS PRODUCTION IN SOUTHEAST ASIAN COUNTRIES
Gas Production Oil Reserves Jan 1 1980 Gas Reserves Jan 1 1980 1979
a 9 3 Country i0 bbl 10_ t m i f_t 10 ft
Indonesia 9600 1315 686 24000 8163 Malaysia 2800 384 486 17000 3027a Brunei 1800 247 220 7700 Thailand 0 0 229 8000 0 Singapore 0 0 0 0 0
Philippines 25 3 0 0 0
TOTAL 14225 1949 1621 56700 11190
a Total for Malaysia and Brunei
Source International Petroleum Encyclopedia 1980
Methodology for Study The objective function of the model which is the
decision criterion for evaluating supply strategies is formulated to minimize the total cost for meeting
A dynamic linear programming model was used to projected nutrient demand for the ASEAN region over determine least cost solutions to supply the fertilizer the period 1981-92 This function includes all costs needs of the ASEAN region under different supply and revenues which will occur under different altershystrategies Four supply strategies were considered natives The components of costs and revenues are for illustrative purposes Data were collected from each ASEAN country to permit a realistic quantitative 1 Costs which include description of the existing fertilizer production a Transportation costs facilities fertilizer technology planned or considered b Import costs expansion fertilizer consumption relevant cost and c Purchase of byproducts prices d Production costs
e Plant construction costs The evaluation of supply strategies is based on 2 Revenues which include
production capacity prices and cost structure of a Exports of primary products 1979 which is the midpoint of the assumed base period b Sales of coproducts (1978-80) Four projection subperiods of 3 years each are used in the analysis This gives a planning Some of the general premises underlying the model period of 12 years (1981-92) The projected input are briefly summarized below figures and the respective resulting figures are representative for the midyear of each subperiod 1 Production and cost data for 1979 were used in (1982 1985 1988 and 19W the model These data included production
capacities by material and region possible plant Investment decisions are based on the assumption expansion investment cost raw material cost
of a real interest rate of 2 (nominal interest rate import and export prices and transportation 10 inflation rate 8) costs and routes
In general only those facilities in which the 2 The linear programming simulation uses the peshyproduction processes are more complex than simple riod 1978-80 (mid-1979) as a base and simulates mixing of ingredients were considered as fertilizer conditions for 1981-92 in four subperiods of production sites Thus if granulation accompanied 3 years each the simple mixing the facility was included as a production site Possible expansion sites were 3 All costs and prices are calculated for the middle considered only when it was known that they were year of each subperiod All costs and prices being contemplated by the respective governments are adjusted for inflation andor converted to
1979 values where necessary The breakdown of the ASEAN countries into
17 consuming regions is shown in Figure 1 This 4 Formulas used to compute discounting factors regionalization was done on the basis of information and capital recovery factors are outlined in provided by country representatives about existing Appendix C central ports transportation systems marketing areas around each central port and fertilizer consumption 5 The selection of fertilizer products is influenced patterns by the constraints which require a certain level
of domestic production Product selection is allowed among those which can be produced in
The Linear Programming Model the region except for muriate of potash which is imported
The mathematical formulation of the linear programming model used in the study is presented in 6 No specific constraints were applied to require Appendix C 5 A schematic representation of the nutrients to be supplied as specific fertilizer models major components and data required for its products In other words the demand for use are presented in Appendix Figure C-I nutrients may be supplied in the form of singleshy
nutrient NP or NPK produdts or a combination 5 Similar mathematical models are also discussed in a of these materials However several products
recently published book by Choksi Mceraus and which could be included in any least cost supply Stoutjesdijk (1980) alternative were identified
9
Model Constraints
The objective function of the linear programmingmodel described above can be minimized subject to 15constraints described below
Constraint 1 Nutrient Supplv and Demand Balance--Supply of aiiy plant nutrient in a givenregion has to be equal to or greater than demandThis constraint applies for all nutrients regions andtime periods Supply for a particular region is defined as domestic production plus imports minus exports
Constraint 2 Nutrient Imports--Nutrient importsto market regions have to be less than or equal to a predetermined share of consumption This constraint plays a major role in the creation and evaluation ofsupply strategies
Constraint 3 Materials--Raw materials needed for the manufacture of specific fertilizers must be available in adequate amounts In each region and for each time period a balance between inputs to be used and outputs to be produced under different technologies must exist
Constraint 4 Production Capacity--During thefirst time period production of any given material in any region cannot exceed actual installed capacityFor subsequent time periods production cannot exceed initial plus added capacity The time lagbetween initial investment and start of production at a new facility is fixed at 3 years
Constraint 5 Capital Availability--Capital in-vestments made in any region for plant construction cannot exceed total capital available from internal and external sources
Constraint 6 Production Cpacity Expansion-Raw Materials--The production capacity expansion that may occur in any region during any time period toproduce ary fertilizer product is restricted by the availability of raw materials froni indigenous reserves
Constraint 7 Production Capacit _ExpansionPlants--Production capacity expansion cannot exceed a technologically determined maximum size for new plants
Constraint 8 Plant Construction Activities--No more than one plant may be onstructed to poducu a given product in any given location This con-straint applies only to the construction of new plantswhich are not presently considered Itdoes not re-strict construction of planned facilities even thoughsimilar facilities may already exist in the region
Constraint 9 Fertilizer Supply and Demand Balance--This constraint is included to ensure that in any given region and for any time period the supplyof any type of fertilizer will be equal to or greaterthan demand
Constraint 10 Transportation Capacity--Inter-regional transportation of materials by different trans-portation technologies in any time period cannot exceed available transportation capacity
Constraint 11 Raw Materials Intermediates andFertilizer Im orts--This constraint restricts the quan-tity of raw materials intermediates and fertilizers which can be imported from the world market Since prices may be lower in the world market some solu-tions might include unacceptably high levels of importsif not restricted to politically acceptable levels
Constraint 12 Material Ex orts--This constraint restricts the quantity o fertilizers or other materialsthat can be exported to the world market
Constraint 13 Byproduct Purchases--The total amount of byproduct materials that can be purchasedin any region during a given time period cannot exceed what is actually available
Constraint 14 Coproduct Sales--The total amountof coproduct that can tie sold in any region during a given time period cannot exceed what is actuallyavailable
Constraint 15 Plant Construction--This integerconstraint is used to limit model solutions to construct or not to construct new plants
Of the above 15 constraints only 9 were used in the empirical estimation of the model used in thisstudy Constraints 6 10 11 12 13 and 14 were not incorporated in the model calculations either beshycause of lack of data andor they were considered itrshyrelevant for the illustration presented in this report
Fertilizer Prices
As mentioned earlier the linear programmingmodel is based upon cost minimization inder different supply strategies This means that cost and priceassumptions are very important in determining inshyvestment production and distribution patternsResulting fertilizer prices are used as a means of evaluating the effects of various restrictions uponsupply strategies
The fertilizer prices are considered as equilibshyrium prices valid under the cost assumptions and under the specific structural model assumptions Theprices are estimated by the dual solution of the linear programming model Technically they can also be called incremental costs selling price marginal costsbreak-even price or shadow prices For simplicitythey will be referred to as fertilize- prices in this report Their economic meaning is illustrated inFigure 2 Production capacities (C 1 C2 C3 andC4 ) of a region have been drawn on the x-axis beshyginning with the facility with the lowest productioncosts and then other capacities according to their inshycreasing penduction costs The y-axis representsproduction costs and fertilizer prices The curves with slope downward to the right represent averageproduction costs which in this figure are shown to decrease for each plant as its capacity use increases Regional fertilizer demand (D) is shown as a vertical line at different levels The point where the supplyand demand curves intersect determines the price level per unit of product It can be seen that ifquantity Q is needed to satisfy demand for a regionwith demand equal to D1 capacities C and areC2sufficient to supply the region with fertilizers The equilibrium price would be P11 If the demand inshycreases sufficiently capacity C3 would be necessarywhich has production costs equal to P 2 Then P 2 beshycomes the equilibrium price in the region CapacityC3 would be operating at break-even levels but capacities C1 and C 2 would realize profits which would be equal to the difference between their proshyduction costs and the equilibrium price
To simplify analysis a vertical demand curve D (drawn with different levels 1 2 and 3) was assumed This means that fertilizer demand at a certain point in time was fied and not price dependent However the necessity to bring into production facilities with highertransformation costs to satisfy demand increased the
10
C1 C2 Capacities of different production facilities in order of ferred to as scenarios I through IV and can be de-C3 C4 increasing conversion cost scribed as follows
D D2 1D3 Three different price inelastic demand curves
PI P2 3 Fertilizer (equilibrium) prices 1At three supplydemand
21 Equilibrium quantitier situations203 J
incaseof demand level Di1d Dfertilizer
a b cd conversion cost of facility with capacity 1
d c e f contribution to profits of facility with capacity 1 b g he conversion cost of facility with capacity 2
af=Pl = equilibrium price ag = 0I = production quantity
D 1 D2 DScenario
I II - +___-------
3 I I
I I c L_ ---- IP2- - - - - - -
I i I 0 P1-- a hI
U I I
I I I I
c I I
gt 9_ _ 2 Ql3
cC c 2 c 3 C4
QUANTITIES
Figure 2 Illustration of Fertilizer Price Determination
equilibrium prices The most expensive source of fer-tilizers a region must use establishes the price level for that r-i ion
To minhize total fertilizer supply costs the model considers world market supply sources and re-sorts to imports if the following two conditions are met (1) world market prices are lower than regional production costs and (2) restrictions imposed in the
formulation of the model allow imports to be made If these two conditions are not met imports will not occur Therefore it is easy to predict that with supply strategies which allow unlimited imports from the world market regional prices will be lower than or equal to world market prices Since imports are allowed domestic production may be lower than do-mestic capacity
Scenario I--Each country has the choice of meeting its fertilizer needs from any source They
can produce it locally at their existing facilities exshy
pand those facilities build planned facilities or buy from other ASEAN countries and world
markets Countries are free to select least cost alshyternatives
supply alshyternative for the ASEAN region It will serve as a basis for possible cooperation agreements among
ASEAN countries Agreements so based will guaranshytee an adequate supply of fertilizers on a regional basis at the lowest possible cost
This scenario will provide a least cost
Il--The ASEAN countries under coshy
operative agreements are supposed to produce 100 of their nitrogen needs This scenario prohibits inshyports of nitrogen fertilizers from outside the ASEAN region during the planning period except for subshyperiod 1 where only 95 self-sufficiency is possible with existing facilities However countries can
secure their phosphate and potash fertilizer needs from any least cost sources
Comparison of results for this scenario with those for scenario I will permit estimation of cost due to cooperation to attain 100 self-sufficiency in supply
of nitrogen fertilizers
Scenario IlI-This scenario is the same as sceshynario II with respect to nitrogen fertilizers An adshy
ditional restriction which specifies that ASEAN countries will cooperate to attain a 50 regional selfshysufficiency for production of phosphate fertilizers is
added As in scenarios I and II each country can secure its potash needs from any least cost sources
Comparison of results for this scenario with reshy
sults for scenarios I and II will permit estimation of cost due to cooperation to attain 100 regional selfshysufficiency in production of nitrogen fertilizers and 50 regional self-sufficiency in phosphate fertilshyizers
Scenario IV--It can be defined as the most probshyable production path for the ASEAN countries For this scenario each country produces what it can of N and P with existing and firmly planned facilities and secures the rest from least cost sources These least cost sources can be other ASEAN countries or the world market
It is unreasonable to expect that all the conshyditions for perfect competition could be achieved For this scenario each countrys needs are coy-Furthermore it may be too optimistic to expect that ered as far as possible by domestic sources If
the prevailing intraregional prices could be re- needed for in-country use domestic production may
presented exactly by the fertilizer prices determined not be lower than 95 of its capacity and if proshy
by the model These prices are an approximation of duction capacity allows not lower than 95 of the that the production andthe actual equilibrium prices which might occur if the fertilizer needs provided
handling system of raw materials and intermediateassumed conditions prevail However these prices do provide information to possibly cooperating countries products are adequate with respect to the expected long-term price strucshytures and trends This scenario will permit evaluation of a situation
where no cooperation among ASEAN countries exists Instead each one of them tries to satisfy its needs
Fertilizer Supply Strategies with its own production capacity and imports the rest from least cost sources Each country will use its
Four strategies representing different supply plants to its own advantage and secure some degree situations were analyzed These strategies are re- of self-sufficiency
11
Input Data for Model Estimation items and for support facilities located outside theplant site boundary were not included
The input data used in this study deal with several aspects of the fertilizer sector This includes fertilizer demand projections production coefficientscapital costs production conversion costs import and export prices and transportation costs and routes
Fertilizer Demand Projections
As food demand expands fertilizer demand mayincrease even at a greater rate This is because (1) the new land brought under cultivation will be of poor quality and thus will need large amounts of fer-tilizer to improve its fertility and (2) the existingland will need more fertilizer to maintain fertility as cropping intensity goes up and new crop varieties with large nutrient demand are grown
The fertilizer nutrient demand by country for the 1979-92 period was estimated using historical timeseries analyses For all countries the base period for these projections was time series data set for 14 yearsfrom 1964 through 1977 Different types of demand functions were estimated and for each country the results of the function which gave the best fit were chosen These functions were then used to make de-mand projections for the 1981-92 period However inthe case of Thailand demand projections were adjustedbased on an in-country study conducted by IFDC in early 1979 Since the demand projections are based on historical data when fertilizer consumption was rather low the projections may reflect under-estimates
The breakdown of nutrient consumption by marketing regions for each country (except Thaihandwhere the country was not divided into market regions) was based partly on information comingdirectly from representatives of the respectivecountries and partly on information coming from other knowledgeable sources With the exception of the Philippines this breakdown was held constant over the whole projection period For the Philippines slightdifferences in the regional growth rates in fertilizer consumption were used These growth rates weredetermined on the basis of information provided bycountry representatives
The estimates for aggregate and regional nutri-ent consumption forecasts for each of the four 3-yearsubperiods are reported in Appendix Table A-5 These estimates for fertilizer demand were used as an input in evaluating alternative supply strategies The past and projected fertilizer consumption by countries is shown in Figure 3
Production Coefficients
Production coefficients defining the quantities of raw materials and intermediates required to producefertilizer products selected for this study are devel-oped in the Appendix Tables A-6 and A-7
Capital Cost
The investment cost figures for fertilizer pro-duction facilities under construction or in the planningstage are based on IFDC estimates These estimates are presented in Appendix Table A-1 When available cost estimate data were considered for spe-cific projects Specific allowances for infrastructure
The investment estimates are on a 1979 cost basis including interest during construction (10year) A 4-year construction schedule with a disshybursement rate of 10 30 40 and 20 for fixed capital funds is used No cost escalation during conshystruction is included Since the capital costs normalshyly overrun the actual capital costs may be higher than the estimates used in this study
Production Conversion Costs
Conversion cost figures used for the calculations are IFDC estimates These cost estimates are alsopresented in Appendix Table A-1 They are based on the assumption of a 90 capacity utilization rate for all plants except the following Indonesian plants which are based on the assumption of 95 PUSRI IIIII and IV Aceh Bontang and Cikampek Annual capacity is defined as 330 days of operation at dailydesign capacity Thus a 90 capacity utilization is equivalent to 297 (330 x 09) days of operation at daily design capacity Raw material costs interest charges on capital and depreciation are not included in conversion cost estimates but are accounted for separately
For natural gas feedstock-based plants theprice of natural gas for steam and electricity genershyation is the same as for feedstock Cost of fuel oil for steam and electricity generation and other uses was assumed to be world market price Cost of purshychased electricity is assumed to be US $0030kWh Sulfuric acid plants are credited for steam export at US $10mt of steam Process plants using the exportsteam are charged at US $10mt of steam
Annual cost of maintenance materials is 3 and insurance and taxes are 1 of the estimated fixed inshyvestment (1979 cost basis) excluding interest duringconstruction Administration expenses and generaloverhead are 150 of the estimated cost of wagessalaries and benefits
Import and Export Prices
Depending on the respective scenario formushylation the economic environment as reflected by the world markets for fertilizers intermediates and rawmaterials can greatly influence the results of the opshytimizations The assumed cif prices for bulk mashyterial gas and liquids are reported in Table 6 for mid-1979 Prices for bulk materials and liquid were estimated for seaborne transported materials from themain supplying areas They are fob prices plus sea transport costs and port handling costs at the receiving ports
Prices for natural gas are accounting prices which were provided by government officials from each country They were assumed to remain constant throughout the planning period except for Malaysiawhere they were allowed to increase at a 5 annual rate
Prices for fertilizer exports from the ASEAN region to the world markets are assumed to be 20lower than the import prices for corresponding fershytilizer This reflects in general the transportcharges to other main consuming regions in the world Export potential has been evaluated for thefollowing products urea(1) which could be deshylivered from large plants (existing or expansion) in Indonesia Malaysia and the Philippines (2) ammonia
12
--
12 3- THAILAND
11 INDONESIA -- 2S
- HISTORICAL CONSUMPTION 2N110 PROJECTIONS_
9 0
MALAYSIA 8
z7 2shy
0 6
5- Z 0
0 C I-- PHILIPPINES
4 z4 P2 0 5
I-3 D 3 z
2 12-~~
1 K20 1
-
N - -
P2 0 5 -shy -
K2__
K20shy
-shy
p2 0 5
N -
-
P2 05
- 1(20 0 0 1 11 1 l it 1 I
1965 1970 1975 1980 1985 1990 1965 1970 1975 1980 1985 1990
YEAR YEAR
Figure 3 Apparent Historical Nutrientand Projected Consumption forASEAN Countries
where excess capacity is available (Bontang and Bintulu) and (3) DAP from Leyte
Transportation Costs
Transport activities refer to movement of fershytilizer from producing locations to receiving ports in consuming regions and transport of intermediates between production sites Three types of materials are transported These are (1) solid materials (2) ammonia and (3) phosphoric acid Transportation of solid fertilizers is much more voluminous than the transportation of ammonia or of phosphoric acid Due to the geographic situation of the ASEAN countries only seaborne transportation is considered
In most cases bulk terminal or bagging facilities exist at the receiving central ports of the selected market regions Most of the central ports can be reached by ships that are normally used for the in-terisland transportation within the region
The bulk transport freight rates refer to the middle of 1979 For ammonia and especially for phosphoric acid it is difficult to obtain reasonable
information about the actual freight terms because freight rates (long-term contracts) are normally not published In the case of large-volume contracts freight rates are often contracted in conjunction with fob or as part of cif prices Therefore they do not appear explicitly in market price scans
The freight rates for ammonia and phosphoric acid are based upon personal communications with shipping agents and rates fDr bulk materials are based upon published rates reported weekly in Green Markets and Fertilizer International
For the calculatiors of transportation costs the following equations have been used
Bulk material C = 8 + (0005 x M)
Ammonia C = 10 + (0005 x M) Phosphoric acid C = 7 + (0006 x M) Where C = transport costs in US dollars per
ton of product (mid-1979) M= distance in nautical miles
Transportation rates are for 1979 These rates are allowed to increase at an annual rate of 8 throughout the planning period
13
TABLE 6 PRICES FOR FINISHED FERTILIZERS INTER-MEDIATES AND NtITURAL GAS DURING 1979
Material aImported Materialmdnonia
Ammonium chloride
Ammonium sulfate DAP
MAP (powdered)Fuel oilNaphtha
NPK 15-15-15 Phosphoric acid (100 P205) 60 Potassium chloride Rock phosphate 60 BPL Sulfur TSP Urea
Natural Gash Indonesia Bontang amp Cikampek
Aceh amp Palembang Thailand Sattahip Mp ysia Bintulu
Prices (US $mt)19000 9000
11800 24300
22500 15000 26000
14700 34500 11400 6400 9800 18700 20000
(US $1000 ft) 085 060 075 070
a Prices are estimated mid-1979 cif basis including port haodling cost at receiving port b Refers to accounting prices
Empirical Results for Alternative Supply Strategies
Selected empirical results for the specified four fertilizer scenarios are discussed with respect to fer-tilizer production patterns fertilizer supply patterns production site fertilizer prices and fertilizer pricesat the market regions Various assumptions described above need to be kept in mind before interpreting these model results The results may vary under different assumptions Consequently these result serve only as broad guideposts for the fertilizer seL-tor planners
Fertilizer Production Patterns
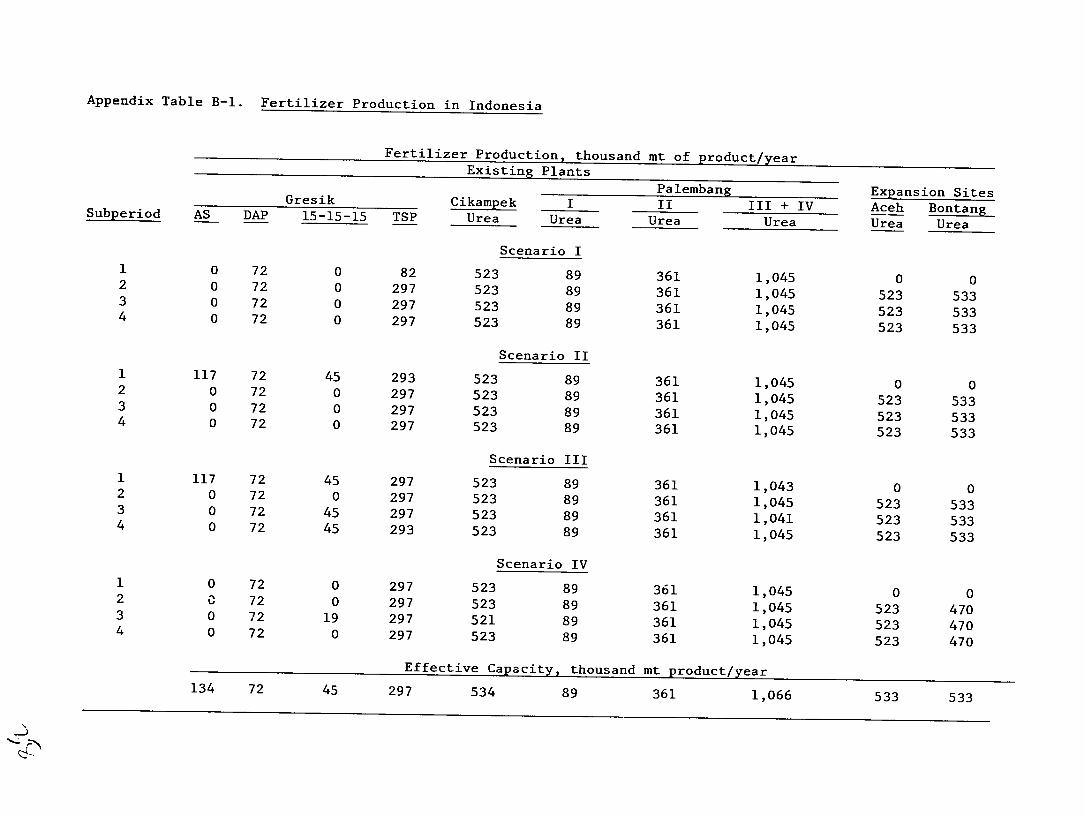
The optimum levels of domestic and regional production for nitrogen and P20 5 for each subperiod and for the four scenarios are reported in Table 7 The optimum production patterns for each productionfacility in each study country are provided in Appendix Tables B-1 through B-4
In general regional production of nitrogen and phosphate fertilizers increases for each subperiod In scenario I production increased from subperiod 1 to subperiod 2 but stayed at that level for the remaining two subperiods In scenarios II and IIl regional production increased throughout the planning period For scenario IV production increased duringthe first three subperiods and declined slightly during the last subperiod
Total regional production of nitrogen and phosphate fertilizers by subperiod is the lowest for scenario I and the highest for scenario IV This reflects the crucial role played by constraints on imports and on regional production in the respective scenarios
Fertilizer production at different plants in Indonesia is reported in Appendix Table B-1 It shows that all existing urea plants operate at max-imum capacity for all scenarios and for all subperiods
The only exception to this is the plant at Cikampekwhich operates at 98 capacity The Aceh urea plant operates at maximum capacity in all scenarios after it comes on stream The same applies to the Bontang urea plant with the exception of scenario IV where it operates at 88 capacity The DAP unit of theGresik plant operates at maximum capacity for all scenarios and for all time periods The TSP unit at
Gresik operates at maximum capacity for all scenarios and for alltime periods except for subperiod 1 of scenario I
The fertilizer production at different plants in Malaysia is reported in Appendix Table B-2 The expansion site for urea production at Bintulu operates at maximum capacity in all sctnarios after it is completed and starts production in subperiod 2 TheNPK unit at Petaling Jaya operates at maximum capacity for all scenarios and subperiods The AS unit at this complex does not operate at all in scenario I and operates only during the first subperiod in the other three scenarios
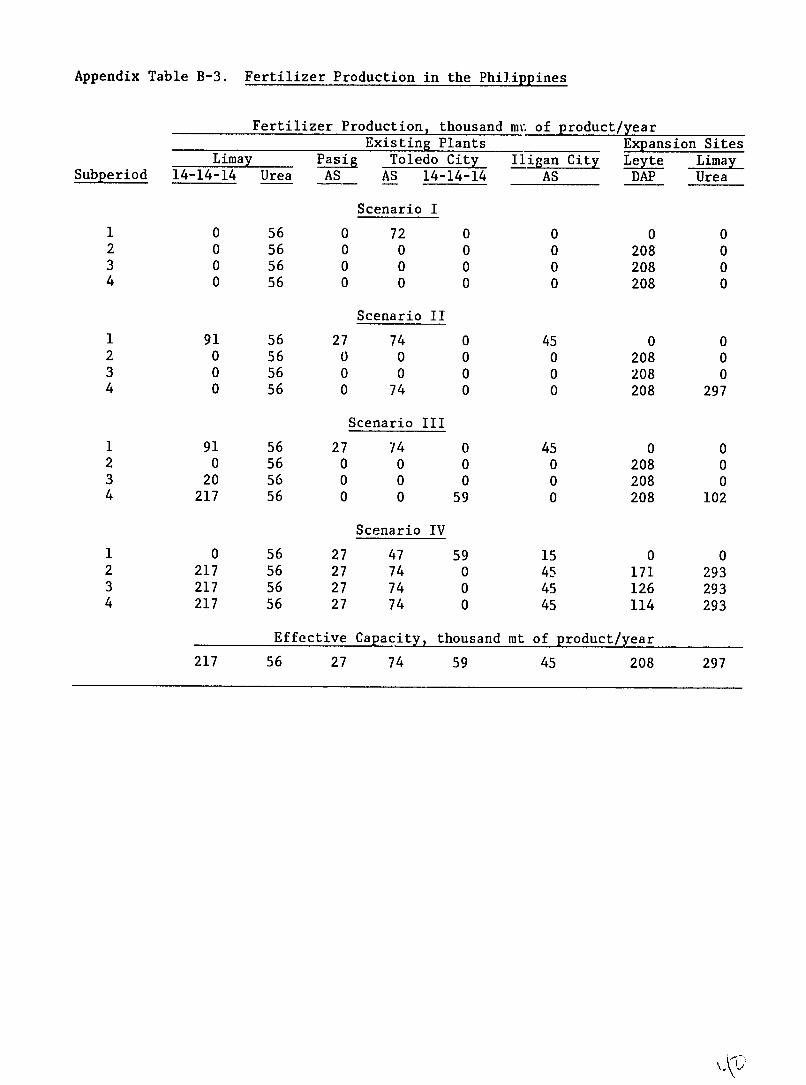
The fertilizer production at different plants in the Philippines is reoorted in Appendix Table B-3 It shows that the old urea plant at Limay is the onlyold plant that operates at maximum capacity for allscenarios and during all subperiods The DAP expansion site at Leyte operates at maximum capacity after completion in subperiod 2 for scenarios I It and I11 However the DAP production is less than maximum capacity in scenario IV The new urea plantand the NPK plant at limay and the AS plants at Pasig Toledo City and Iligan City operate at full capacity during the last three subperiods of scenario IV For the other scenarios these plants operate sporadically or not at all The AS plants usually operate only during the first subperiod before expansion projects could be completed
The fertilizer production at different plants in Thailand is reported in Appendix Table B-4 It shows that the urea unit at Sattahip operates at maximum capacity in scenarios I II and Ill after it is constructed in subperiod 1 In scenario IV however this unit operates at maximum capacity only during the last two subperiods The Mae Moh plantoperates at full capacity during all subperiods for scenarios I It and Ill and sporadically for scenario IV It is interesting to note that in scenario only the urea plants at Mae Moh and the expansion at Sattahip operate The NPK production units operate only in scenarios with restrictions
The Mae Moh urea facility in Thailand produces at full capacity during the entire planning period for all scenarios except IV The AS plant seldom operates However recently all the Mae Mob facilities have been closed for technical reasons It was assumed for modeling purposes that the facilities would be renovated but those plans have apparently now been abandoned Since the total Mae Moh capacity was very low the permanent closing of the Mae Moh plants has little effect upon the results of this analysis The mixing-granulation plant near Bangkok was simulated to operate only occasionally in scenario It and to operate with more or less full capacity utilization in scenarios III and IV At Sattahip the production of NP and NPK fertilizers is feasible only under the conditions of scenario IV MAP is not produced as an intermediate for NP fertilizer at Bangkok
Fertilizer Supply Patterns
The general sources of supply of plant nutrients as finished fertilizers to consuming regions by
14
TABLE 7 ANNUAL PRODUCI1ON OF NUTRIENTS UNDER ALTERNATIVE SUPPLY SCENARIOS MODEL RESULTS
Nutrient Production Thousand mtpy Country Scenario I Region N
Indonesia 94124 7084 Ma1ILsia 1275 1275 Philippines 4016 0 Thailand 1058 0
TOTAL 100473 8359
Indonesia 142700 16974 Malaysia 21791 1275 Philippines 6320 9568 Thailand 12006 0
TOTAL 182817 27817
Indonesia 142700 16974 Malaysia 21791 1275 Philippines 6320 9568 Thailand 12006 0
TOTAL 182817 27817
Indonesia 142700 16974 Malaysia 21791 1275 Philippines 6320 9568 Thailand 12006 -
TOTAL 182817 27817
Scenario II N P20
Subperiod 1 (1981-83)
97139 17465 2295 1275 6770 1275 9058 7200
115262 27214
Subperiod 2 (1984-86)
142700 16974 21791 1275 6320 9568 12006 0
182817 27817
Subperiod 3 (1987-89)
142700 21791 6320 12006
182817
Subperiod
142700 21791 21462 15646
201599
subperiods and scenarios in each study country are reported in Appendix Tables 11-5 through B-8 These results are summarized in Tables 8 and 9 A graphic illustration of the distribution of major raw materials and intermediates is shown in Appendix Figures B-1 through B-4 and are summarized in Table 10 Domestic production of nitrogen accounts for 51-61 62-65 60)-69 and 62-96 of ASEAN demand for scenarios 1 I III and IV respectively during the planning periods Domestic production of P 2 0 5 P2 0 5accounts for 29-11 of demand for sce-nario I 34-18 for scenario II 35-16 for sce-nario Ill and 51-81 for scenario IV Thus while increasingly restrictive conditions on nitrogen pro-
duction requirements increase the proportion of ASEAN demand which is produced in the country of use only the most restrictive scenario has a signishyficant influence on P2 0 5 production within the countries of use
For scenarios I II and III the region obtains about 30-35 of its nitrogen supply and less than 15 of its P 2 0 5 supply from the other ASEAN countries Since no cooperative agreements among ASEAN countries exist in scenario IV the prices for such trade are world market prices and fertilizers obtained from other ASEAN countries are reported as obtained from the world market Generally less than 10 of N is obtained from outside the ASEAN region for scenarios I I1 and Ill However fvr scenario IV Malaysia the Philippines and lhvi Id obtain 85 80 and 60 respectively of tiir nitrogen from the world market (other ASEAN countries and outside the ASEAN region) during subperiod 1 Thereafter only the Philippines imports
16974 1275 9568 0
27817
4 (1990-92)
16974 1275 9568 3640
31457
significant
Scenario III Scenario IV N N P2P25
97139 17649 94124 16974 2295 1275 2015 1275 6770 1274 5182 826 9058 7200 8898 7040
115262 27398 110219 26115
142700 16974 139802 16974 21791 1275 21791 1275 6320 9568 25090 10904 13946 1940 25631 18813
184757 29757 212314 47966
143375 17649 140087 17255 21791 1275 21791 1275 6620 9848 24280 8834 19206 7200 29113 21220
190972 35972 215271 48584
143375 17649 139802 16974 21791 1275 21791 1275 14876 13432 24064 8282 21560 10303 29385 20060
201602 42659 215042 46591
quantities of nitrogen On the other hand generally more than 50 of phosphate (P 2 0 5 ) fertilizer is obtained from for scenarios 1 II and scenario IV All potash ASEAN region but some within a country
As reported in Table fertilizers from the world
outside the ASEAN region III and from 27 to 46 for originates from outside the
is transformed into NPKs
10 the imports of finished market primarily consist of
KCI AS and MAP Inter-ASEAN trade in fertilizers is dominated by urea which is supplied by the Indonesian and Malaysian plants Small quantities of TSP and DAP are traded within the ASEAN region Low-analysis fertilizers are usually not transported between countries
Production capacity for nitrogen fertilizers in Indonesia is well in excess of domestic demand throughout the planning period Nitrogen production capacity in Malaysia is less than demand in subshyperiod 1 but it exceeds demand through the reshymainder of the planning period Nitrogen production capacity in the Philippines is less than demand throughout the planning period In Thailand nishytrogen production capacity is less than demand in subperiod 1 but it exceeds demand until the end of the planning period when capacity and demand are in balance
Exports (outside the ASEAN region) of urea and ammonia are shown in Table 11 Export potential to world markets decreases over time during the planning period The greatest export potential exists for scenario IV but as mentioned earlier sales to
15
TABLE 8 SOURCES OF N SUPPLY AS FINISHED FERTILIZERS TO ASEAN MARKET REGIONS MODEL RESULTS
Supply Sources as Percent of Projected DemandIn-Country_ Other ASEAN Countries Non-ASEAN CountriesCountry Scenario Scenario Scenario
of Use I II I1 IV
Indonesia 94 95 94 100 Malaysia 10 17 12 15 Philippines 15 26 26 20 Thailand 5 41 41 40
ASEAN 51 62 60 62
Indonesia 93 99 100 100 Malaysia 19 19 19 100 Philippines 16 16 12 80 Thailand 47 47 54 100
ASEAN 61 64 65 96
Indonesia 91 100 99 100 Malaysia 18 18 19 100 Philippines 14 14 11 65 Thailand 41 41 66 100 ASEAN 59 63 67 92
Indonesia 89 99 98 100 Malaysia 18 18 18 100 Philippines 12 16 25 55 Thailand 37 48 66 -90
ASEAN 57 65 69 89
other ASEAN countries are classified as world market exports in this scenario The next greatest exportpotential exists for scenario I The export potential is at its lowest for scenarios II and I11
Production Site Prices
The estimated fertilizer prices for different products at each plant within countries are reportedin Appendix Tables B-9 through B-12 In generalthese tables show that fertilizer prices increase as the scenarios become more restrictive and limits are set on the level of imports andor domestic productionWith few exceptions scenario I has the lowest pricesfor all products and for all scenarios In some casesprices for subperiods 2 3 and 4 are lower than prices in subperiod 1 mainly because of a decline in production costs as new facilities come on stream
In scenarios 1I and III which require nitrogenself-sufficiency prices for nitrogen fertilizer duringsubperiod 1 are influenced by high production from existing facilities During subperiod 2 and 3 pricesdecrease slightly because of lower production costs at new plants For subperiod 4 when ASEAN demandapproaches potential fertilizer prices increase
Scenarios I and II exhibit the lowest prices for phosphate fertilizers Since there are no constraints on phosphate fertilizer production in the region and imports can take place prices are leveled with world market prices Scenario III in which 50 of the total phosphate (P 2 0 5 ) fertilizer requirement is to be pro-
IIF 111 -1 V I II III IV
Subperiod 1 (1981-83)
0 0 1 0 6 5 5 0 82 78 87 0 8 5 1 85 57 69 69 0 28 5 5 80 66 55
33 33
Subperiod 2 (1984-86) 1 1
74 81 84 84 25 53
31 36
Subperiod 3 (1987-89)
1 0 74 82 86 86 30 59
31 37
Subperiod 4 (1990-92) 1
74 88 35
1 82 84 52
32 35
55 0 29 5 5 60
34 0 15 5 5 38
0 0 5 0 0 0 81 0 7 0 0 0 88 0 0 0 0 20 46 0 29 0 0 0
35 0 8 0 0 4
1 0 8 0 0 0 81 0 8 0 0 0 89 0 0 0 0 35 34 0 29 0 0 0
33 0 10 0 0 8
2 0 10 0 0 0 82 0 8 0 0 0 75 0 0 0 0 45 34 0 28 0 0 10
31 0 11 0 0 11
duced domestically has higher prices especially for subperiod I when less efficient production units must come on stream to meet the requirements
The fertilizer prices calculated for scenario IV vary widely for all products For Indonesia and Malaysia fertilizer prices for this scenario are sometimes lower than for other scenarios 7his is theresult of excess production above domestic requirements so that in-country equilibrium prices are lowered by export prices to world markets For the Philippines and Thailand the fertilizer prices are generally high because they are influenced by the respective in-corntry high production cost strucshylures In-country capacities must be used as far as possible even to th point of using inefficient plants In several cases prices reflect that domestic production determined inefficient plants could other words the cost dependent on the world reflected by the price high
Market Region Prices
by forcing the use of existing be extremely uneconomic In
of avoiding the risk by being market for fertilizer supply is level which could be very
The weighted average prices for nitrogen and P205 in each consuming country are shown in Table 12 These prices can be considered as approximations for the nutrient prices to be expectedunder the different scenario assumptions Theyinclude the cost of transportation to central points in market regions but do not include transportation costs from central points to farmers
16
IV
TABLE 9 SOURCES OF PHOSPHATE (P2Os) SUPPLY AS FINISHED FERTILIZERS TO ASEAN MARKET REGIONS MODEL RESULTS
Supply Sources as Percent of Projected Demand In-Country Other ASEAN Countries Non-ASEAN Countries
Country -Scenario Scenario -- Scenario of Use I II III IV I II III IV I II III
ubpeiod 1 (181-83)
Indonesia 57 62 61 77 0 0 3 0 43 38 36 23 Malaysia 30 30 14 30 0 26 35 0 70 44 51 70 Philippines 0 24 24 15 0 9 27 0 100 67 49 85 Thailand 0 44 44 42 0 13 6 0 100 43 50 58
ASEAN 29 48 46 5L 0 8 10 0 71 44 44 46
Subperiod 2 (1984-86)
Indonesia 57 57 50 57 9 9 0 0 34 34 50 43 Malaysia 26 26 26 26 16 22 24 0 58 52 50 74 Philippines 100 100 50 0 0 0 0 0 0 50 0179a Thailand 0 0 10 100 0 0 40 0 100 100 50 0
ASEAN 41 41 35 81 6 6 15 0 53 53 50 27
Subperiod 3 (1987-89)
Indonesia 45 45 46 45 5 5 4 0 50 50 50 55 Malaysia 24 24 24 24 12 12 26 0 64 64 50 76 Philippines 100 100 50 0 0 0 0 0 0 5013 3a U Thailand 0 0 34 100 0 0 16 0 100 100 50 0
ASEAN 35 35 41 68 4 4 9 0 61 61 50 35
Subperiod 4 (1990-92)
Indonesia 35 35 36 35 3 3 14 0 62 62 50 65 Malaysia 21 2i 21 21 11 11 29 0 67 67 50 79 Philippines 100 100 50 114 0 0 1 0 0 0 49 0 Thailand 0 15 44 85 0 0 6 0 100 85 50 15
ASEAN 30 34 38 55 2 3 12 0 67 63 50 46
a In these cases the Philippines is oversupplied with P205 because domestic production of DAP and NPK products was used to meet the N requirement
TABLE 10 DISTRIBUTION OF PRINCIPAL RAW MAIFRIALS AND INTERMEDIATES MODEL RESULTS
Raw Material and Intermediates for Scenario To From I II III IV
Gresik World market FO PR FO PR PA FO PR PA KCI FO PR PA Limay PA PA
Petaling World market PR KCI PR KCI PR KCI PR KCl Jaya Bintulu AA AA AA
Limay World market PR AS PR AS FO PR KCI FO FO PR AS KC1
Leyte World market PA PR PR AA PR PR AA Bintulu AA AA Limay AA PA AA
Bangkok World market AC MAP AC MAP AC MAP
Sattahip World market PR SU KCl
a FO = fuel oil SU = sulfur PR = phosphate rock PA = phosphoric acid AA = ammonia AS ammonium sulfate AC = ammonium chloride MAP = monoammonium phosphate KCI = potassium chloride
17
TABLE 11 ANNUAL EXPORTS TO WORLD MARKETS OF UREA AND AMMONIA MODEL RESULTS
Exports Thousand Metric Tons of ProductYearPalembang Aceh BontangSubperiod Urea Urea Bintulu Urea Ammonia Urea Ammonia
Scenario I 1 2 3 4
0 644 679 0
0 386 359 78
0 39 0 0
0 150 150 150
0 0 0 0
0 10 10 10
Scenario II 1 2 3 4
0 438 0 0
0 362 213 0
0 0 0 0
0 150 150 141
0 0 0 0
0 10 10 0
Scenario III 1 2 3 4
0 476 52 0
0 367 334 0
0 0 0 0
0 150 150 128
0 0 0 0
0 10 3 0
Scenario IV 1 2 3 4
750 1015 828 488
0 367 333 298
0 115 0 0
0 150 150 150
0 145 106 69
0 13 13 13
The prices of nitrogen and P2 0 5 indicate thedirection in which the scenario-specific supplystrategies influence the levelprice of plant nutrients In general the lowet prices can be found in the unrestricted scenario I throughout the planningperiod In this scenario prices are influenced bythe world market prices or by the in-countryproduction costs depending on the relationshipbetween them and on the potentially available capacities
Scenarios II and III have relatively high nitrogenprices during subperiod 1 when the old nitrogenshyproducing facilities must be used and before new plants come on stream Scenario III shows veryhigh P2 0 5 prices during subperiod 4 This is be-cause old NPK plants with high production costs are required to operate to meet 50 of the P205 con-sumption imposed as a constraint on the supply system
Scenario IV results are highly influenced by the country-specific relative needs someIn casesespecially in Thailand the prices of P2 05 are veryhigh This indicates a situation in which NP fershytilizers are produced at old and relatively ineffi-cient plants
For scenario IV in the Philippines the P2 0 5prices for subperiods 2 3 and 4 are close to zero This is an indication that the fertilizer type structuredoes not fit the nutrient demand structure Specif-ically the supply of nitrogen is partially satisfied byDAP which esults in a surplus of P2O5 coming into the Philippines consuming regions Since the urea plants are operating at maximum capacity the onlyother alternative to satisfy nitrogen demand from do-mestic production is to produce more DAP HoweverDAP is not an adequate source of nitrogen since itsP2 0 5 content is much higher than its nitrogen content
This apparent problem of high nitrogen prices andlow P2 0 5 prices can be corrected by calculatingweighted average nutrient price using nutrient conshytents as weights
Economic Evaluation of Alternative SueSupply Strategies
The economic implications of alternative fertilizer supply strategies are discussd in terms of capitalrequirements variable production costs contribution to profits return on investments and total costs ofsupply strategies As mentioned earlier however all figures are presented in 1979 constant US dollars The derived costs and returns taken collectivelyreflect the relative economic advantage of one supplystrategy over the other
Capital Requirements
Capital requirements are discussed in terms ofinvestment costs for facilities to be constructed during the planning period In Indonesia andMalaysia all urea plants which were considered as potential new ftcilities are constructed duringsubperiod I in all scenarios and start production insubperiod 2 The same applies for the planned DAP plant in the Philippines and for the tentative ureafacility at Sattahip in Thailand The planned urea plant at Limay operates only in subperiod 4 of scenarios II and III and subperiods 2-4 ofscenario IV The NPK plant at Sattahip does not operate at all in scenarios I and I very little insubperiod 4 of scenario ill and at less than fullcapacity in subperiods L-4 in scenario IV
18
TABLE 12 WEIGHTED AVERAGE PRICES FOR NUTRIENTS BY COUNTRY MODEL RESULTS
a mr
Average Prices 1979 US
Indonesia Malaysia Philippines Thailand
Subperiod N PI00 N P__ N P 0 N P205
Scenario I
1 425 362 426 364 434 355 4-7 361
2 368 381 367 381 373 370 372 382
3 369 385 368 385 374 374 373 382 4 374 381 373 383 380 371 376 381
Scenario II
1 768 401 767 404 776 402 768 407
2 356 403 367 403 373 393 372 405
3 371 406 369 406 375 396 374 407 4 503 405 502 406 510 396 507 406
Scenario III
1 762 404 762 409 772 707 763 411
2 368 535 367 536 373 526 372 540
3 369 703 368 703 374 691 373 706
4 471 t247 470 1242 476 1214 475 1246
Scenario IV
1 371 412 619 359 674 603 606 358 2 368 412 368 424 1411 0 125 1403
3 369 664 369 426 1319 2 356 1364
4 370 412 369 426 1318 2 546 1082
a Price for K20 is always US $190 (1979) in each market region
If all potentially planned facilities are realized Philippines these costs for urea are US $112-$116mt capital requirements are US $588 million for at both the existing and new plants at Limay Indonesia US $270 million for Malaysia US $503 million for the Philippines and US $505 million for The estimated variable production costs for AS Thailand This results in a total of US $1866 million in the Philippines range from US $78mt at Toledo as capital required for investment to establish the City to US $127mt at Iligan City Variable proshynew fertilizer facilities in the ASEAN region duction cost of NPK is estimated to be US $185mt
in the Philippines US $175mt in Indonesia and US $121mt in Malaysia The costs for DAP are
Variable Production Costs US $229mt in the Philippines and US $224mt in Indonesia The estimated variable production cost of
Variable production costs at existing facilities TSP is US $157mt in Indonesia At the mixing are equal to raw material costs plus conversion costs granulation plant in Thailand the estimated cost In the case of new facilities however the investment for 20-20-0 varies from US $173 to US $183mt costs per unit of output are also added Variable Variable production costs for the NP and NPK fershyproduction costs for a given fertilizer from a tilizers at Sattahip were equal to US $170mt for specified plant are constant in terms of 1979 US MAP US $121mt for 25-34-0 and US $120mt for dollars throughout the planning period and for all 22-29-7 respectively scenarios Natural gas prices were assumed to remain nominally constant at 1979 levels for all countries except Malaysia where an annual increase of 5was Contribution to Profits assumed These estimates were made on the basis of information provided by country representatives in The contribution to profits was calculated by 1978 This results in declining 1979 present values subtracting the variable production cost from the for natural gas and in declining variable production fertilizer price at the production site Since prices costs as indicated in the bottom line of Appendix are toed to estimate contributions to profits the Tables B-13 through B-16 The highest cost is for estimates are valid only under conditions of economic zubperiod 1 and the lowest cost is for subperiod I equilibrium The accuracy of the estimates depends Costs of other raw materials are assumed to be the to a large degree upon the deviation of prices from world market prices and were presented earlier in real prices Thus they only indicate a potential for Table 6 the contribution to profits The estimated contribushy
tions are reported in Appendix Tables B-13 through In Indonesia variable production cost for urea B-16
ranges from US $69 to US $72 at Palembang Unit I from US $47 to US $50 at Palembang Unit II and from Negative values on these tables indicate that US $44 to US $47 at Palembang Unit Ill and IV The production costs exceed the estimated fertilizer price estimated variable costs for urea in Malaysia and Since prices are determined based on production Thailand are also within this range but in the costs all products being produced have variable
19
costs equal to or less than the price but never higher Negative values are shown to indicate the magnitude of financial loss on a per-ton basis ifproduction occurs at those places Since the objec-tive is to minimize costs those production facilities which contribute the greatest amount to profits are selected first for fertilizer production
The results reported in these tables indicate that in general the urea facilities of the region are highly economical especially those located in Indonesia Among the possible new urea production sites Aceh Bontang Bintulu and Sattahip contribshyute around ITS $100mt of urea toward profits The new facility at timay contfrihutes enough profit to justify construction only in scenario IV and sub-period 4 of scenarios 11and Ill
On the other hand the uncomletitive position of ammonium sulfate and NPNI1K is shown for nearly all cases Some exceptions occur during suhl)riod I with its high prices The TSproduction facility at Gresik is in a rather good position lDiammoniui-phosphate production at a possible plant at 1Iimaygives a low contribution to profit Ani exceptionis found in the case of Thailand at Sattahip Ihe whole multinutrient and urea complex seems to le economical only in scenario IV and in subperiod It of scenario Ill In the remaining scenarios onlythe urea facility of this plant seems economical
Return on Investment
The return on investment (1101) is calculated bydividing the plant specific total contribe ion to profits(product specific contribution to profit per ton ilimes tons produced) by the initial investment The 11O1 is used mainly for comparisons of different investment It reflects the rate of return on an investment that can be achieved under equilibrium conditions
On the basis of the possible contribution to profits and considering the investment to he made for each new plant an assessment of the ROI was made fable 13 shows ROI figures for plants that are under construction and for potential new plants which are considered
The figures indicate that the potential urea facilities in Indonesia and Malaysia have a high RO1 With respect to relative profitability these facilities appear to have economic advantage over the urea and DAP facilitisthat re planned to be built near Limayand on Leyte in he Philippines lurthermore the tentative faci~ties at Sattahip also show itpositiveROI However the ROI is valid only for the ammonia--u ea piant except for scenario IV and subperiol of scenario Ill when the NP and NPK fa lities are also built and operated
The urea plant at Limay has the highest ROI in scenario IV This is due partially to high prevailingnitrogen prices in the Philippines for this scenario and partially to the fact that it uses fuel oil as raw material The Leyte urea plant- exhibits itvery lowROI in scenarios 1 HI and IV and a high RO in scenario III Even though the 1101 is low for these scenarios operating this plant is part of the scheme that minimizes total fertilizer supply cost to the region
Costs for Supplying Regional Rlequirements
In considering the costs of supplying the fertilizer demands of the entire ASEAN region two
cost categories are used These categories are total expenses and avoidable costs
Total expenses represent the total value that the countries and region would pay for fertilizers delivered to consuming regions over the entire planning period at market prices Total expenses are calculated by adding the value of products at central points of market regions These values are shown for individual nutrients by subperiods and scenarios in Appendix Tables 1-17 through B-20 However the total expenses are summarized in Table 11
Scenario I is the lowest total expense supplyalternative for each country Other scenarios have mixed effects among the different countries The most expensive scenario for Indonesia and Malaysia is scenario IlI while for the other two countriesscenario IV is the most expensive One factor which reILuces the cost of scenario IV for Indonesia and Malaysia compared with that of other countries is the value of eXl)Olt s It world market prices This increases total revenuc fomn the sale of nitrogenfertilizers Ihe greatest cont ri1)ut ion to the increased expenditure for scenario Ill for Malaysiaand Indonesia is the increased expense for Iroduction of t205 In the hilippines scenario IV exlenses are consideratily greate than those of other scenarios because of ihe greatly increased expense for production of nitrogen In lhaind expenses increase gradually fIoim scenario I through IV and the greatest increase is due to the expense of supplying l(O
On the other hand avoidable costs represent the minimum total costs of production imports exportstransportation and constuction activities They do not include capital costs of facilities operating at the Ieginning of the planning period Those capital costs
are no longer decision parameters for plant managersIn other words sunken costs are not included
[he differences between avoidable costs for various scenarios indicate the extent to which formulated supply strategies could lead to different total costs to meet fertilizer needs for the whole ASEAN region Avoidable cosis for the region are shown for eachI scenario in abtle IH Scenario I which contains fewer constraints to supplypossibilities allows the lowest cost supply of fertilizer to meet the needs of the whole ASEAN regionScenario IV represents the most expensive supply strategy
The total expenses which also represent the total value of production of the whle ASEAN regionexceed the avoidable costs by l00- 50 This represents the realized ROI of activities associated with supplying the fertilizer needs of the whole region
Suggested Improvement and Applications
Because complex fertilizer sector planning models are seldom free front some shortcomings there is always a scope for further improvements The present study can he improved in three different but related areas First the structural and behavioral aspects of the planning model itself can be improvedby adding new activities constraints and behavior rules to represent uncertainty and expectations Second some of the simplifying assumptions with respect to fertilizer sector planning horizon and the planning region can be modified Third the input
20
TABLE 13 ESTIMATED RETURN ON INVESTMENT AT EXPANSION SITES MODEL RESULTS
Return on Investment Aceh Bontang Bintulu L e Limay Sattahip
Subperiod Urea Urea Urea DAP Urea NP Urea
Scenario I
1 0 0 0 0 0 0 2 21 19 19 0 0 13 3 21 20 19 03 0 13
19 03 0 14a4 21 20
Scenario II
1 0 0 0 0 0 0 a 2 21 19 19 3 0 13
3 13a3 21 20 19 0
4 33 30 29 9 11 20a
Scenario Ill
1 0 0 0 0 0 0 2 21 19 19 18 0 13a
a 3 21 20 19 37 0 13
4 30 28 27 104 3 16
Scenario IV
1 0 0 0 0 0 0 2 21 19 19 4 55 26 3 21 20 19 0 50 39 4 21 20 19 0 50 37
a Only ammoniaurea plant built
TABLE 14 ESTIMATED TOTAL EXPENSES AND AVOIDABLE COSTS TO SUPPLY FERTILIZERS TO THE ASEAN REGION DURING 1981-92 MODEL RESULTS
Estimated Total Expenses Total Total Supply Avoidable
Scenario Indonesia Malaysia Phi I ippines Tha i Iand Expenses Costs ----------------- (millions of 1979 US dollars)-- - ---------------shy
1 5499 1539 2046 2294 11376 5809 II 6614 1764 2504 2846 13728 6019
III 8198 1967 2718 3565 16448 6164 IV 5824 1637 5317 4087 16865 7328
data can be further updated and refined The has not changed very much The general implications qluality of data used in empirical estimation of the model appear valid in providing guidelines to determines to a great exlent the reliability of the the planners in the region for fertilizer sector develshymodel results This probhlm can be partly removed opment individually or in cooperation with each other by conducting sensitivity analysis with respect to key The economic decisions with respect to the ASEAN parameters and policy variables fertilizer sector and on the basis of the results of
this model appear logical and better than those deci-Complex mathematical programming models being sions which might be based on pure descriptive analshy
normative in nature cannot le validated with respect ysis or political considerations to their predictability by using standard statistical tests However despite some obvious shortcomings The model results are very instructive in the model appears to have performed extremely well in providing some guidelines to the planners in the simulating the general features of the fertilizer sector region with respect to broad economic implications of in the ASEAN region alternative supply strategies lowever the planners
must keep in mind the idealistic character of the Despite attempts to realistically portray the fer- model results This is especially true with respect to
tilizer economy in the ASEAN region some simplifying the interpretation of fertilizer prices contribution to assumptions with respect to data can be removed or profits and return on investments Furthermore modified For example the input prices and costs this study evaluates only four fertilizer supply were developed at the beginning of the steep price strategies which were considered appropriate for the increase of 1979 The level and structure of input ASEAN region lowever depending on the data prices costs and output prices have since changed availability computation facilities time and planning However despite these changes tile technical and objectives the model can be adapted to evaluate any economic structure of the ASEAN fertilizer industry number of alternative fertilizer strategies
21
References
British Sulphur Corporation 1979 Fertilizer Higgins J K (ed) 1979 Gren MarketsInternational The British Sulphur Corporation Fertilizer Market Intelligence Weekly McGraw-till Ltd London England (several issues during Co ew- -ork-Nfe -- York -(diitiferent issues1979) during 1979)
Choksi A M A Meeraus and A J Sloutjeudijk International Food Policy Research Institute 19771980 The Planning of Investment Programis in Food Needs of )eveloping Countriesthe Fertilizer Industry The Johns lopkins Projections of Production and ConsumptionUniversity Press Baltimore Maryland
to 1990 Research Report No 3 Washington DC
Food and Agriculture Organization of the United International Petroleum Encyclopedia 1980 TheNations (FAO) 1980 Production Yearbook Petroleun iPublishing Company Tulsa Oklahoma1979 Rome Italy (includes other previous Mudahar M S 1979 Policy Implications ofissues) Increased Fertilizer Efficiency for Rice
FAO 1980 Fertilizer Yearbook 1979 Rome Italv Production in Asia Preliminary I)raft IFDC(includes other pieViOUS issues) Muscle Shoals Alabama 35660
Foster T 110 W livingston and P J Stangel The World Bank 1980 World Development Report1976 The Potential for tRegional Cooperation in 1980 The World Bank Wasington I)-CFertilizer the ASEAN Group A MethodologyStudy Technical Btulletin IFI)C- T-2 IFDC Muscle Shoals Alabama 35660
22
APPENDIX A
Selected Model Input Data
List of Appendix A Tables
Table A-1 Selected Characteristics of Existing and Potential Fertilizer
Plants in the ASEAN Region
Table A-2 Production Imports and Exports of Fertilizer in the ASEAN Region
1970-79
Table A-3 Nutrient Consumption in ASEAN Countries 1970-79
Table A-4 Selected Fertilizer Raw Material Reserves in the ASEAN Region
Table A-5 Nutrient Demand Projections by Market Region (1981-92)
Table A-6 Input Requirements for Intermediates and Fertilizer Products
Table A-7 Input Requirements for Selected Compound Fertilizer Grades
- -- -
--
- -
Appendix Table A-i Selected Characteristics of Existing and Potential Fertilizer Plants in the ASEAN Region
Site Product
Gresik Ammonia AS Sulfuric acid TSP DAP NPK
Cikampek Ammonia Urea
Palembang
I Ammonia Urea
II Ammonia Urea
III Ammonia Urea
IV Ammonia Urea
Aceh Ammonia Urea
Bontang Ammonia Urea
Pt Dickson Ammonia
Petaling Sulfuric acid Jaya Nitric acid
AS NPK
Bintulu Ammonia Urea
Plant Statusa
OPR (1972) OPR (1972) OPR (1972) OPR (1979) OPR (1979) OPR (1979)
OPR (1979) OPR (1979)
OPR (1963) OPR (1963)
OPR (1974) OPR (1974)
OPR (1976) OPR (1976)
OPR (1977) OPR (1977)
CTN (1981) CTN (1981)
PLN PLN
OPR (1966)
OPR (1970) OPR (1966) OPR (1970) OPR (1966) CON CON
Raw Material
Capacity or(mtday) Intermediates
Indonesia
240 Fuel Oil 450 Sulfur 340 Phosphate rock
rl200 (Potash dA11800 djPhosphoric acid
j1800 (Ammonia
1000 Natural gas 1700
180 Natural gas 300
700 Natural gas 1150
1000 Natural gas 1700
1000 Natural gas 1700
1000 Natural gas 1725
1500 Natural gas 1725
Malaysia
150 Naphtha or ref gas
150 Sulfur 80 Ammonia from Pt Dickson
180 800 Potash
1000 Natural gas 1500
(Continued)
b
Conversion Cost 1979 US $mt
115 23 -1
1197
47 25
60 30
45 17
41 16
41 16
47 19
45 23
115
9 28 30 30 46 28
Capital Investmentc
1979 US $ million Facilities Working
-
- -- -
- --
- -- -
- -- -
160 3 100 5
200 5 100 15
- -
-160 5 90 15
Appendix Table A-i Selected Characteristics of Existing and Potential Fertilizer Plants in the ASEAN Region (Continued)
b Capital InvestmentcRaw Material Capacity or Conversion Cost 1979 US $ million
aSite Product Plant Status (mtday) Intermediates 1979 US $mt Facilities Working
Philippines
Limay Ammonia OPR (1965) 270 Ref gas 100 -Urea OPR (1965) 190 48 - -Sulfuric acid OPR (1965) 620 Pyrites -1 - -
Phosphoric acid P2 05 NPK
OPR (1965) OPR (1965)
210 730
Phosphate rock Potash
66 30
--
--
Pasig Sulfuric acid OPR (1966) 180 Sulfur 5 - -AS OPR (1966) 90 Ammonia 37 - -
Toledo City Phosphoric acid OPR (1958) 30f Phosphate rock g - -
Sulfuric acid OPR (1958) 250 Pyrites 3 - -
AS OPR (1958) 250 Ammonia 27 - -
NPNPK OPR (1958) 200 Potash 45 - -
Iligan Citye Ammonia OPR (1966) 80 Naphtha 135 - -Sulfuric acid OPR (1954) 120 Pyrites 10 - -
AS OPR (1966) 150 31 - -
Limay Ammonia CON (1982) 600 Naphtha or 102 130 10 (expansion) fuel oil 92 175 10
Urea CON (1982 1000 46 75 20
Leyte Phosphoric acid P2 05 CON (1982) 350 f H 2SO4 from Cu smelter 59 42 5 DAP CON (1982) 7O Ammonia 29 26 10
Thailand
Mae Moh Ammonia OPR (1966) 82 Lignite 130 - -Urea OPR (1975) 76 60 - -Sulfuric acid OPR (1975) 300 Sulfur 2 - -AS OPR (1975) 175 30 - -
Bangkok NPNPK OPR (1975) 400 Ammonium chloride 40 - -
Diammonium phosphate
NPNPK OPR (1978) 800 Potash 30 - shy
(Continued)
Appendix Table A-I Selected Characteristics of Existing and Potential Fertilizer Plants in the ASEAN Region (Continued)
Raw Material b Capital Investmentc
Site Product aPlant Status Capacity(mtday) orIntermediates Conversion Cost1979 US $mt
1979 US $ Facilities
million Working
Thailand (Continued) Sattahip Ammonia
Urea crystals Urea granular Phosphoric acid Sulfuric acid Powdered MAP
CON CON CON CON CON CON
1200 1200
800 700
2000 350
Natural gas
Phosphate rock Sulfur
45 15 6
22 8 5
191 61 21 61 56 6
5 3 7 5 3 4
NP (22-29-7) + (25-34-0) CON 1500 Potash 9 59 23
a OPR--operational CTN--under construction kLN--being planned CON--to be constructed The number in parentheses indicates startup yearb Do not include raw materials depreciation and interest Based an 95 capacity utilization except for PUSRI I and Gresik plants which are based on 90 c IFDC cost estimates for projects under construction or in planning stages Estimates do not include escalation during constructiond Maximum capacity if one fertilizer type is produced e Iligan City production facilities to be phased out in 1985 f Capacity is in terms of quantity of P2 05 g Not estimated--Limay estimate taken
Appendix Table A-2 Production Imports and Exports of Fertilizer in the ASEAN Region 1970-79
Country 1970 1971 Production or Trade thousand mt 1972 1973 1974 1975 1976 1977 1978 1979
N Production
Indonesia 393 453 482 599 852 1659 2075 1842 3961 7360 Malaysia 310 260 425 400 462 370 340 387 377 374 Philippines 535 477 586 554 535 534 621 484 379 457 Thailand 80 115 103 77 74 67 43 69 89 35 TOTAL 318 1305 1596 1630 1923 2630 3079 2815 4859 8226
N Imports
Indonesia 1076 990 2147 2449 2930 6110 1590 1030 99 171 Malaysia 305 339 443 383 556 752 449 734 660 1030 Philippines 479 714 940 510 946 2394 441 632 1416 1175 Thailand 410 360 520 550 529 731 746 1297 1512 1789
TOTAL 2270 2403 4050 3892 4961 9987 3226 3693 3687 4165
N Exports
Indonesia 0 0 0 0 0 0 0 0 1841 1060 Malaysia 0 14 28 53 57 58 55 0 0 0 Philippines 0 30 12 0 0 0 0 0 45 12 Thailand 0 0 0 0 0 0 0 0 0 0
TOTAL 0 44 60 53 53 58 55 0 1886 1072
P20 Production
Indonesia 0 0 0 0 0 0 0 0 0 0 Malaysia 235 229 212 260 243 0 209 220 253 288 Philippines 390 410 417 418 410 421 312 310 293 361 Thailand 0 0 0 0 0 0 0 0 0 0
TOTAL 625 639 629 678 653 421 521 530 546 649
(Continued)
Appendix Table A-2 Production Imports and Exports of Fertilizer in the ASEAN Region 1970-79 (Continued)
Country 1970 1971 Production or Trade thousand mt 1972 1973 1974 1975 1975 1977 1978 1979
P20s Imports
Indonesia Malaysia Philippines Thailand
626 170 250 450
180 229 08
235
216 125 52
433
960 108 21
559
850 160 65 514
348 183 477 704
819 127 06
622
79 193 0
803
442 170 0
1326
1215 750 82
1250 TOTAL 1496 652 826 1648 1589 1712 1574 1075 1838 3297
POs Exports Indonesia Malaysia Philippines Thailand
0 0 0 0
0 0 29 0
0 0 13 0
0 53 0 0
0 48 16 0
0 0 0 0
0 0 0 0
0 0 0 0
0 0 56 0
0 0 15 0
TOTAL 0 29 13 53 64 0 0 0 56 15
K20 Imports
Indonesia Malaysia Philippines Thailand
82 561 377 206
68 757 364 150
47 749 366 228
299 808 450 420
403 893 466 384
332 1029 863 509
134 1187 440 391
300 1434 480 205
400 1732 428 298
772 1900 539 340
TOTAL 1226 1339 1390 1977 2146 2733 2152 2419 2858 3551
Source FAO Fertilizer Yearbook various issues
Appendix Table A-3 Nutrient Consumption in ASEAN Countries 1970-79
Country 1970 1971 1972 Consumption thousand mt 1973 1974 1975 1976 1977 1978 1979
Average Annual Compound
Growth Rate
N
Indonesia 1055 2017 1963 3474 3500 3450 3419 3512 4652 5240 195 Malaysia Philippines
524 1014
664 1192
666 1220
808 1145
1122 1519
689 1774
776 1441
835 1772
968 1742
1069 2054
82 82
Thailand 490 425 620 620 602 798 789 1363 1601 1535 135 TOTAL 3083 4298 4469 6047 6743 6711 6425 7482 8963 9898 138
Indonesia 626 289 231 668 P90a
850 1141 1165 1067 1082 1235 78 Malaysia 170 229 120 256 352 291 283 364 160 524 133 Philippines 640 440 500 399 510 478 340 400 404 498 -27 Thailand 453 235 433 559 514 704 622 803 900 1044 97 TOTAL 1889 1193 1284 1882 2226 2614 2410 2634 2546 3301 64
Indonesia 82 65 47 299 403 330 250 300 254 754 280 Malaysia 561 757 768 808 893 1029 1137 1411 1508 1727 133 Philippines 300 400 377 388 556 600 488 515 459 566 73 Thailand 108 150 228 420 384 509 391 205 250 300 120
TOTAL 1051 1372 1400 1915 2236 2468 2468 2431 2471 3347 137
Source FAO Fertilizer Yearbook various issues
Appendix Table A-4 Selected Fertilizer Raw Material Reserves in the Southeast Asian Region
Main Region Port Lignite Crude Oil Natural Gas
North Thailand
Bangkok Mae Moh 80 million mt
Fang oil quantity not exactly known
Total Thailand 8000 x 109 ft2
Li 15 Li oil shale million mt Thailand reserves
140000 bbl South Plukeit Krabi Thailand 100 million mt
North Sumatra Aceh Indonesian reserves Indonesian reserves 9600 x 106 bbl 24000 x 109 ft3 reserves obviously are reserves obviously not a limiting factor are not a limiting at any of the locations factor at one of mentioned the locations
mentioned South Sumatra Palembang West Java
East Bontang or Kalimantan Balikpapan
Brunei Kuala - 1800 x 106 bbl 7700 x 109 ft3
- Belait
Malaysia Peninsula
- Malaysian reserves 2800 x 106 bbl
Malaysian reserves 17000 x 109 ft3
Malaysia Sabah
Malaysia Sarawak
Philippines 25 x 106 bbl
Sources International Petroleum Encyclopedia 1980 and unpublished IFDC information
Pyrites
60 x 106 mt
Rock Phosphates
Total Thailand 50000 mt of P2 05
500000 mt rock exploitation not probable in larger scale
100000 mt rock exploitation not
probable
454000 mt rock
small-scale exploitation
Potash Salts
In excess of 10 x 106 mt of K2 0
Appendix Table A-5 Nutrient Demand Projections by Market Region (1981-92)a
Central Demand 1981-83 1984-86 1987-89 1990-92 Country Market Region Point (Port) N P2 N P KO N P - N
---------------shy (thousand mt of nutrientsyear)- - -----------
Indonesia Kalimantan East Balikpapan 18 7 06 22 9 07 27 11 1 32 14 1 Kalimantan West Pontianak 6 2 06 7 3 07 9 4 1 11 5 1 Sulawesi Ujung Pandang 30 11 06 37 15 07 45 i9 1 54 24 1 East Java Surabaja 167 62 7 207 83 9 250 107 11 298 133 13 Central Java Cilacap 143 53 3 177 71 35 215 92 4 256 116 5 West Java Jakarta 155 58 7 192 77 9 232 100 11 276 126 13 South Sumatra Palembang 18 7 06 22 9 07 27 11 1 32 14 1 Central Sumatra Padang 24 9 06 30 12 07 36 15 1 43 19 1 North Sumatra Belawan 35 13 35 44 17 45 54 23 56 63 29 67
TOTAL 596 222 55 738 296 70 895 382 87 1065 480 103
Malaysia West Malaysia (Penisula W) Port Dickson 92 28 128 102 33 159 114 37 193 126 42 228 West Malaysia (Penisula E) Kuantan 28 9 38 31 10 47 34 11 58 37 12 69 Sarawak Bintulu 9 3 7 10 4 9 12 4 10 13 4 12 Sabah Kota Kinabalu 5 3 9 8 3 10 9 3 11 10 3 13
TOTAL 134 43 182 151 50 225 169 55 272 186 61 322 Philippines North Philippines Manila 110 23 26 126 24 26 150 27 27 176 29 29
Central Philippines Iloilo 99 21 23 132 26 28 157 28 29 184 31 31 South Philippines Cagayan de Oro 51 11 12 56 11 12 67 12 12 78 13 13
TOTAL 260 55 61 314 61 66 374 67 68 438 73 73
Thailand TOTAL Bangkok 222 165 47 256 188 57 291 212 67 326 236 77
GRAND TOTAL 1212 485 345 1459 595 418 1729 716 494 2015 850 575
a For the midpoint of the years indicated
Appendix Table A-6 Input Requirements for Intermediates and Fertilizer Products
Product Input Requirement per mt
Ammonia 22700 ft3 of natural gas or 22900 ft3 of refinery gasmt or 075 mt of fuel oil or 056 mt of naphtha or 262 mt of lignitemt
Nitric acid 0283 mt of ammoniamt Sulfuric acid 072 mt of pyrite or 0344 mt of
sulfurmt Phosphoric acid 310 mt of phosphate rock plus 262 mt
of sulfuric acidmtAmmonium sulfate 027 mt of ammonia plus 075 mt of
sulfuric acidmt Urea 060 mt of ammoniamt Triple superphosphate 036 mt of P205 as phosphoric acid plus
041 mt of phosphate rockmtDiammonium phosphate 025 mt of ammonia plus 046 mt of
phosphoric acidmtMonoammonium phosphate 060 mt of ammonia plus 053 mt of
phosphoric acidmt
Appendix Table A-7 Input Requirements for Selected Compound Fertilizer Grades
Quantity of Inputs mtmt of Product Philippines Indonesia Malaysia Thailand
Inputs 14-14-14 15-15-15 15-15-15 20-20-0 25-34-0 22-29-7
Ammonia 0045 0048 0110 - 0170 0150 Ammonium chloride - - - 0610 - -Ammonium sulfate 0464 0362 0030 - -
Nitric acid - - 0280 - - -Urea 0017 0081 - - 0270 0235 Phosphoric acid 0140 0150 - - 0350 0300 Phosphate rock - - 0500 - - -Triple superphosphate 0059 0080 KCL (60) 0234 0250 0250 - - 0130 Diammonium phosphate - - - 0390 - -
APPENDIX B
Selected Empirical Results
List of Appendix B Tables
Table B-I Fertilizer Production in Indonesia
Table B-2 Fertilizer Production in Malaysia
Table B-3 Fertilizer Production in the Philippines
Table B-4 Fertilizer Production in Thailand
Table B-5 Sources of Supply of Plant Nutrients as Finished Fertilizers
to Market Regions in Indonesia
Table B-6 Sources of Supply of Plant Nutrients as Finished Fertilizers
to Market Regions in Malaysia
Table B-7 Sources of Supply of Plant Nutrients as Finished Fertilizers to
Market Regions in the Philippines
Table B-8 Sources of Supply of Plant Nutrients as Finished Fertilizers to
Market Regions in Thailand
Table B-9 Estimated Fertilizer Prices at Production Sites in Indonesia
Table B-10 Estimated Fertilizer Prices at Production Sites in Malaysia
Table B-lI Estimated Fertilizer Prices at Production Sites in the Philippines
Table B-12 Estimated Fertilizer Prices at Production Sites in Thailand
Table B-13 Estimated Variable Production Costs and Contribution to Profits
in Indonesia
Table B-14 Estimated Variable Production Costs and Contribution to Profits
in Malaysia
Table B-15 Estimated Variable Production Costs and Contribution to Profits
in the Philippines
Table B-16 Estimated Variable Production Costs and Contribution to Profits
in Thailand
Table B-17 Estimated Total Expenses to Supply Plant Nutrients in Indonesia
Table B-18 Estimated Total Expenses to Supply Plant Nutrients in Malaysia
Table B-19 Estimated Total Expenses To Supply Plant Nutrients in the
Philippines
Table B-20 Estimated Total Expenses to Supply Plant Nutrients in Thailand
List of Appendix B Figures
Figure B-I Distribution of Principal Raw Materials and Intermediates for
Scenario I
Figure B-2 Distribution of Principal Raw Materials and Intermediates for
Scenario II
Figure B-3 Distribution of Principal Raw Materials and Intermediates for
Scenario III
Figure B-4 Distribution of Principal Raw Materials and Intermediates for
Scenario IV
Appendix Table B-I Fertilizer Production in Indonesia
Subperiod AS DAP Gresik
15-15-15
Fertilizer Production thousand mt of productyear Existing Plants
PalembangCikampek I Ii III + IV
TSP Urea Urea Urea Urea
Expansion Sites Aceh Bontang Urea Urea
1 2 3 4
0 0 0 0
72 72 72 72
0 0 0 0
82 297 297 297
Scenario I 523 89 523 89 523 89 523 89
361 361 361 361
1045 1045 1045 1045
0 523 523 523
0 533 533 533
1 2
3
4
117 0
0
0
72 72
72
72
45 0
0
0
293 297
297
297
Scenario II 523 89 523 89 523 89 523 89
361 361
361
361
1045 1045
1045
1045
0 523
523
523
0 533
533
533
1 2 3 4
117 0 0 0
72 72 72 72
45 0
45 45
297 297 297 293
Scenario III 523 89 523 89 523 89 523 89
361 361 361 361
1043 1045 1041 1045
0 523 523 523
0 533 533 533
1 2 3 4
0 0 0 0
72 72 72 72
0 0
19 0
297 297 297 297
Scenario IV 523 89 523 89 521 89 523 89
361 361 361 361
1045 1045 1045 1045
0 523 523 523
0 470 470 470
134 72 45
Effective Capacity thousand mt productyear 297 534 89 361 1066 533 533
Appendix Table B-2 Fertilizer Production in Malaysia
Fertilizer Production thousand mt of productyear Existing Plant Expansion Site Petaling Jaya Bintulu
Subperiod AS 15-15-15 Urea
Scenario I
1 0 85 0 2 0 85 446 3 0 85 446 4 0 85 446
Scenario II
1 51 85 0 2 0 85 446 3 0 85 446 4 0 85 446
Scenario III
1 51 85 0 2 0 85 446 3 0 85 445 4 0 85 446
Scenario IV
1 37 85 0 2 0 85 446 3 0 85 446 4 0 85 446
Effective Capacity thousand mt of productyear a 446b 54 8 5
a Total capacity is equal to 238000 mtpy but nitric acid capacity limits NPK production to 85000 mtpy b Excess capacity of ammonia of 145000 mtpy
Appendix Table B-3 Fertilizer Production in the Philippines
Fertilizer Production thousand mv of productyear Existing Plants Expansion Sites
Limay Pasig Toledo City lligan City Leyte Limay Subperiod 14-14-14 Urea AS AS 14-14-14 AS DAP Urea
Scenario I
1 0 56 0 72 0 0 0 0 2 0 56 0 0 0 0 208 0 3 0 56 0 0 0 0 208 0 4 0 56 0 0 0 0 208 0
Scenario II
1 91 56 27 74 0 45 0 0 2 0 56 0 0 0 0 208 0 3 0 56 0 0 0 0 208 0 4 0 56 0 74 0 0 208 297
Scenario III
1 91 56 27 74 0 45 0 0 2 0 56 0 0 0 0 208 0 3 20 56 0 0 0 0 208 0 4 217 56 0 0 59 0 208 102
Scenario IV
1 0 56 27 47 59 15 0 0 2 217 56 27 74 0 45 171 293 3 217 56 27 74 0 45 126 293 4 217 56 27 74 0 45 114 293
Effective Capacity thousand mt of productyear
217 56 27 74 59 45 208 297
Appendix Table B-4 Fertilizer Production in Thailand
Fertilizer Production thousand mt of productyear Existing Plants Expansion Site
Mae Moh Bangkok Sattahip Subperiod AS Urea 20-20-0 ii-54-0a 25-34-0 22-29-7 Urea
Scenario I
1 0 23 0 0 0 0 0 2 0 23 0 0 0 0 238 3 0 23 0 0 0 0 238 4 0 23 0 0 0 0 238
Scenario II
1 40 23 360 0 0 0 0 2 0 23 0 0 0 0 238 3 0 23 0 0 0 0 238 4 0 23 182 0 0 0 238
Scenario III
1 40 23 360 0 0 0 0 2 0 23 97 0 0 0 238 3 0 23 360 0 0 0 238 4 0 23 360 0 0 107 238
Scenario IV
1 40 23 352 0 0 0 0 2 0 0 360 0 223 139 213 3 0 11 360 0 223 222 238 4 30 23 360 0 223 182 238
Effective Capacity thousand mt of productyear
52 23 360 104 223 223 238
a MAP is to be produced only to use as intermediate in Bangkok plant
Appendix Table B-5 Sources of Supply of Plant Nutrients as Finished Fertilizers to Market Regions in Indonesia
Quantity of Plant Nutrients thousand mtpy Other Non-ASEAN
In Country ASEAN Countries Countries Total Subperiod N P20a Kg N P2 KO N Z K20 N POn K90
Scenario I
1 559 127 0 0 0 0 37 95 55 596 222 55 2 689 170 0 10 26 0 39 100 70 738 296 70 3 812 170 0 8 22 0 75 190 87 895 382 87 4 945 170 0 6 16 0 114 294 103 1065 480 103
Scenario II
1 566 137 7 0 0 0 30 85 48 596 222 55 2 729 170 0 9 24 0 0 102 70 738 296 70 3 891 170 0 4 22 0 0 190 87 895 382 87 4 1059 170 0 6 16 0 0 294 103 1065 480 103
Scenario III
1 559 134 7 7 7 7 30 81 41 596 222 55 2 738 148 0 0 0 0 0 148 70 738 296 70 3 889 175 7 6 16 0 0 191 80 895 382 87 4 1040 175 7 25 65 0 0 240 96 1065 480 103
Scenario IV
1 596 170 0 0 0 0 0 52 55 596 222 55 2 738 170 0 0 0 0 0 126 79 738 296 79 3 895 172 3 0 0 0 0 210 84 895 382 87 4 1065 170 0 0 0 0 0 310 103 1065 480 103
Appendix Table B-6 Sources of Supply of Plant Nutrients as Finished Fertilizers to Market Regions in Malaysia
Subperiod In Country
N PZO K
Quantity of Plant Nutrients thousand mtpy Other Non-ASEAN
ASEAN Countries Countries N P90 K2 N P20- K N
Total PZO
Scenario I
1 2 3 4
13 28 31 33
13 13 13 13
13 13 13 13
110 112 124 137
0 8 7 7
0 0 0 0
11 11 14 16
30 29 35 41
169 212 259 309
134 151 169 186
43 50 55 61
182 225 272 322
Scenario II
1 2 3 4
23 28 31 33
13 13 13 13
13 13 13 13
104 123 138 153
11 11 7 7
0 0 0 0
7 0 0 0
19 26 35 41
169 212 259 309
134 151 169 186
43 50 55 61
182 225 272 322
Scenario III
1 2 3 4
16 29 32 34
6 13 13 13
6 13 13 13
116 122 137 152
15 12 15 17
0 0 0 2
2 0 0 0
22 25 27 31
176 212 259 307
134 151 169 186
43 50 55 61
182 225 272 322
Scenario IV
1 2 3 4
20 151 169 186
13 13 13 13
13 13 13 13
0 0 0 0
0 0 0 0
0 0 0 0
114 0 0 0
30 37 42 48
169 212 259 307
134 151 169 186
43 50 55 61
182 225 272 320
Appendix Table B-7 Sources of Supply of Plant Nutrients as Finished Fertilizers to Market Regions in the Philippines
Quantity of Plant Nutrients thousand mtpy Other Non-ASEAN
In Country ASEAN Countries Countries Total Subperiod N PZ0 K N K2 N P20 K N P20 K
Scenario I
1 40 0 0 147 0 0 73 55 61 260 55 61 2 50 61 0 264 0 0 0 0 66 314 61 66 3 52 67 0 322 0 0 0 0 68 374 67 68 4 54 73 0 384 0 0 0 0 73 438 73 73
Scenario II
1 68 13 13 179 5 0 13 37 48 260 55 61 2 51 61 0 263 0 0 0 0 66 314 61 66 3 52 67 0 322 0 0 0 0 68 374 67 68 4 69 73 0 369 0 0 0 0 73 438 73 73
Scenario III
1 68 13 13 179 15 0 13 27 48 260 55 61 2 38 31 0 276 0 0 0 30 66 314 61 66 3 41 34 3 333 0 0 0 33 65 374 67 6P 4 108 35 35 330 2 2 0 36 36 438 73 73
Scenario IV
1 52 8 8 0 0 0 208 47 53 260 55 61 2 251 109 30 0 0 0 63 0 36 314 109a 66 3 243 89 89a30 0 0 0 131 0 38 374 68 4 241 83 30 83a0 0 0 197 0 43 438 73
a In these cases an oversupply of P2 05 exists because DAP was produced to meet the N requirements
Appendix Table B-8 Sources of Supply of Plant Nutrients as Finished Fertilizers to Market Regions in Thailand
Quantity of Plant Nutrients thousand mtpy Other Non-ASEAN
In Country ASEAN Countries Countries Total Subperiod N P90- K90 N PqQO K N N PP K20
Scenario I
1 10 0 0 147 0 0 65 165 47 222 165 47 2 120 0 0 63 0 0 73 188 57 256 188 57 3 120 0 0 88 0 0 83 212 67 291 212 67 4 120 0 0 114 0 0 92 236 77 326 236 77
Scenario II
1 90 72 0 121 22 0 11 71 47 222 165 47 2 120 0 0 136 0 0 0 188 57 256 188 57 3 120 0 0 171 0 0 0 212 67 291 212 67 4 156 36 0 170 0 0 0 200 77 326 236 77
Scenario III
1 90 72 0 121 10 0 11 83 47 222 165 47 2 139 19 0 117 75 0 0 94 57 256 188 57 3 192 72 0 99 34 0 0 106 67 291 212 67 4 215 103 8 I1 15 0 0 118 69 326 236 77
Scenario IV
1 89 70 0 0 0 0 133 95 47 222 165 47 2 256 188 10 0 0 0 0 0 47 256 188 57 3 291 212 16 0 0 0 0 0 51 291 212 67 4 293 201 13 0 0 0 33 35 64 326 236 77
Appendix Table B-9 Estimated Fertilizer Prices at Production Sites in Indonesia
Fertilizer Prices 1979 US $mt of Product
Subperiod AS DAP Gresik
15-15-15 TSP Cikampek Urea
I Urea
Palembang II
Urea III + IV Urea
Aceh Urea
Bontang Urea
Scenario I 1 2 3
77 72 72
233 232 234
138 133 133
157 165 167
186 162 162
185 160 160
185 160 160
185 160 160
0 160 160
0 160 160
4 72 234 134 166 164 162 162 162 160 163
Scenario II 1 2 3 4
146 100 101 97
312 242 244 268
195 162 137 157
174 175 177 177
344 162 162 225
342 160 161 222
342 160 161 222
342 160 161 222
0 160 160 220
0 160 161 222
Scenario III 1 2 3 4
145 84
101 109
313 302 380 649
195 157 181 278
176 235 313 564
342 161 162 210
340 160 160 207
340 160 160 207
340 160 160 207
0 160 160 205
0 160 160 207
Scenario IV 1 2 3 4
66 66
109 109
246 245 362 246
141 161-175 137
179 178 295 179
162 161 162 163
160 160 160 160
160 160 160 160
160 160 160 160
0 160 160 160
0 160 160 160
Appendix Table B-10 Estimated Fertilizer Prices at Production Sites in Malaysia
Fertilizer Prices 1979 US $mt of Product Petaling Jaya Bintulu
Subperiod AS 15-15-15 Urea
Scenario I
1 93 138 shy
2 101 133 160 3 102 133 160 4 101 133 163
Scenario II
1 145 196 shy2 101 136 160 3 102 137 161 4 106 156 222
Scenario III
1 144 196 shy2 65 156 160 3 66 183 160 4 106 278 207
Scenario IV
1 113 165 shy2 106 137 160 3 106 137 160 4 106 137 160
Appendix Table B-Il Estimated Fertilizer Prices at Production Sites in the Philippines
Fertilizer Prices 1979 US $mt of Product
Subperiod Limay
14-14-14 Urea Pasig AS
Toledo City AS 14-14-14
Iligan City AS
Leyte DAP
Limay Urea
Scenario I
1 129 192 79 78 128 79 - -2 123 164 86 86 122 86 228 171 3 124 165 87 86 123 86 230 171 4 124 167 87 86 123 86 230 167
Scenario II
1 182 349 147 146 183 147 - -2 126 164 116 66 125 66 239 164 3 132 165 87 86 113 93 241 165 4 146 226 94 93 188 94 265 226
Scenario III
1 182 347 146 146 183 146 - -2 166 164 86 66 151 86 300 172 3 168 165 88 66 169 67 377 173 4 254 212 110 108 255 108 643 212
Scenario IV
1 198 301 126 126 196 127 - -2 215 640 274 274 270 275 246 640 3 202 598 255 255 203 256 229 598 4 202 597 255 255 211 256 229 597
Appendix Table B-12 Estimated Fertilizer Prices at Production Sites in Thailand
Fertilizer Prices 1979 US $mt of Product Mae Moh Bangkok Sattahip
Subperiod AS Urea 20-20-0 11-54-0 25-34-0 22-29-7 Urea
Scenario I
1 75 186 147 - - shy
2 64 161 140 134 215 198 163 3 64 161 141 135 215 198 163 4 65 163 141 136 216 199 165
Scenario II
1 143 343 225 - - shy
2 64 161 145 147 227 205 163 3 65 162 146 217 224 205 167 4 91 223 173 216 257 237 225
Scenario III
1 143 341 225 - - shy
2 64 161 173 216 268 244 163 3 64 161 205 217 325 292 163 4 85 208 334 764 534 471 210
Scenario IV
1 i1 268 183 - - - shy
2 15 47 296 221 500 440 49 3 61 154 334 217 544 479 156 4 99 241 315 216 496 439 243
Appendix Table B-13 Estimated Variable Production Costs and Contribution to Profits in Indonesia
Subperiod AS DAP Gresik
15-15-15
Contribution to Profits 1979 US $mt of Product PalembangCikampek I II III + IVTSP Urea Urea Urea Urea
Aceh Urea
Bontang Urea
1 2 3 4
-32 -37 -37 -37
9 8
10 10
-37 -42 -42 -41
0 8 10 9
123 101 103 106
Scenario I 113 135 89 11 90 112 93 115
138 114 115 118
-108 109 110
103 104 108
1 2 3 4
37 -9 -8
-12
88 18 20 44
20 -13 -38 -18
17 18 10 10
281 101 103 167
Scenario II 270 292 89 11 91 113
153 175
295 114 116 178
-108 109 170
-103 105 167
1 2 3 4
36 -25 -8 0
89 78
156 425
20 -18 6
103
19 78
156 407
279 100 103 152
Scenario III 268 390 89 11 90 112
138 160
293 114 115 163
-108 109 155
-103 104 152
1 2 3 4
-43 -43 0 0
22 21
138 22
-34 -14 0
-46
22 21
138 22
99 100 103 105
Scenario IV 88 110 89 il 90 112 91 113
113 114 115 116
-108 109 110
-103 104 105
109 224 175
Variable Production Cost 1979 US $mt of Product 157 63-58 72-69 50-47 47-44 52-50 57-55
Appendix Table B-14 Estimated Variable Production Costs and Contribution to Profits in Malaysia
Contribution to Profits 1979 US $mt of Product Petaling Jaya Bintulu
Subperiod AS 15-15-15 Urea
Scenario I
1 -20 17 -
2 -12 12 96 3 -11 12 97 4 -12 12 100
Scenario II
1 32 75 -
2 -12 15 96 3 -11 16 98 4 -7 35 159
Scenario III
1 31 75 -
2 -48 35 96 3 -47 62 97 4 -7 157 144
Scenario IV
1 0 44 -
2 -7 16 96 3 -7 16 97 4 -7 16 97
Variable Production Cost 1979 US $mt of Product
113 121 64-63
Appendix Table B-15 EstimateO Variable Production Costs and Contribution to Profits in the Philippines
Contribution to Profits 1979 US $mt of Product Limay Pasig Toledo City Iligan City Levte LmY
Subperiod 14-14-14 Urea ASAS 14-14-14 AS DAP Urea
Scenario I 1 -40 76 -37 -570 -48 - shy2 -45 50 -30 8 -63 -41 0 46 3 -44 52 -29 8 -62 -41 1 46 4 -44 55 -29 8 -62 -41 1 42
Scenario II 1 13 233 31 68 -2 20 - shy2 -42 50 0 -12 -60 -61 10 393 -36 52 -29 8 -72 -34 12 404 -22 114 -22 15 3 -33 36 101
Scenario III 1 13 231 30 68 -2 19 - shy2 -2 50 -30 -12 -34 -41 71 473 0 52 -28 -12 -16 -60 148 484 86 100 -6 30 70 -19 414 87
Scenario IV 1 29 185 10 48 11 0 shy -2 46 525 158 196 85 146 17 524 3 33 484 161 177 18 129 0 482 4 33 485 161 177 26 129 0 481
Variable Production Costs 1979 US $mt of Product
169 116-112 116 78 185 127 229 116
Appendix Table B-16 Estimated Variable Production Costs and Contribution to Profits in Thailand
Contribution to Profits 1979 US $mt of Product Bangkok
Subperiod Mae Moh
AS Urea 20-20-0
Old New 11-54-0 Sattahip
25-34-0 22-29-7 Urei-
Scenario I
1 -24 32 -36 -26 - - - -2 -35 7 -43 -33 -34 97 81 124 3 -35 7 -42 -32 -33 98 81 125 4 -34 9 -42 -32 -30 100 83 128
Scenario II
1 44 189 42 52 - - - -2 -35 7 -38 -28 -21 109 88 124 3 -34 8 -37 -27 50 106 88 126 4 -8 69 -10 0 50 141 121 188
Scenario III
1 44 187 42 52 - - - -2 -35 7 -10 0 48 150 127 124 3 -35 7 22 32 50 208 175 125 4 -14 54 151 161 598 418 355 173
Scenario IV
1 12 114 0 10 - - - -2 -84 -107 113 123 51 379 320 0 3 -38 0 151 161 47 423 359 106 4 0 87 132 142 46 375 319 193
Variable Production Costs 1979 US $mt of Product
99 154 183 173 170 121 120 50
Appendix Table B-17 Estimated Total Expenses to Supply Plant Nutrients in Indonesia
Equilibrium Expenses 1979 US $ x 106 Subperiod N P K Total
Scenario I
1 759 240 30 1029 2 816 339 39 1194 3 990 435 51 1476 4 1194 549 57 1800
TOTAL 3759 1563 177 5499
Scenario II
1 1373 267 31 1671 2 788 356 40 1184 3 996 465 50 1511 4 1607 583 58 2248
TOTAL 4764 1671 179 6614
Scenario III
1 1362 269 31 1662 2 815 475 40 1330 3 991 806 50 1847 4 1505 1796 58 3359
TOTAL 4673 3346 179 8198
Scenario IV
1 663 274 31 968 2 815 366 40 1221 3 991 761 50 1802 4 1182 593 58 1833
TOTAL 3651 1994 179 5824
Appendix Table B-18 Estimated Total Expenses to Supply Plant Nutrients in Malaysia
Equilibrium Expenses 1979 US $ x 106
Subperiod N P K20 Total
Scenario I
1 171 48 105 324 2 165 57 129 351 3 186 63 156 405 4 207 69 183 459
TOTAL 729 237 573 1539
Scenario II
1 308 52 104 464 2 166 60 128 354 3 187 67 155 409 4 280 74 183 537
TOTAL 941 253 570 1764
Scenario III
1 306 53 104 463 2 166 80 128 374 3 187 116 155 458 4 262 227 183 672
TOTAL 921 476 570 1967
Scenario IV
1 249 46 104 399 2 167 64 128 359 3 187 70 155 412 4 206 78 183 467
TOTAL 809 258 570 1637
Appendix Table B-19 Estimated Total Expenses to Supply Plant Nutrients in the Philippines
Equilibrium Expenses 1979 US $ x 106
Subperiod N 2 K Total
Scenario I
1 339 60 36 435 2 351 69 36 456 3 420 75 39 534 4 498 81 42 621
TOTAL 1608 285 153 2046
Scenario II
1 605 66 35 706 2 351 72 37 460 3 421 80 39 540 4 670 87 41 798
TOTAL 2047 305 152 2504
Scenario III
1 602 67 35 704 2 351 96 37 484 3 420 139 39 598 4 625 266 41 932
TOTAL 1998 568 152 2718
Scenario IV
1 526 99 35 660 2 1329 0 37 1366 3 1480 0 38 1518 4 732 0 41 _773
TOTAL 5067 99 151 5317
Appendix Table B-20 Estimated Total Expenses to Supply Plant Nutrients in Thailand
Equilibrium Expenses 1979 US $ x 106
Subperiod N -P9O1 K20 Total
Scenario I
1 284 179 25 488 2 286 215 29 530 3 326 243 32 601 4 368 270 35 673
TOTAL 1264 907 121 2292
Scenario II
1 511 201 27 739 2 286 228 32 546 3 327 259 38 624 4 496 397 44 937
TOTAL 1620 1085 141 2846
Scenario III
1 508 203 27 738 2 286 305 32 623 3 326 449 38 813 4 465 882 44 1391
TOTAL 1585 1839 141 3565
Scenario IV
1 404 177 26 607 2 96 791 32 919 3 311 868 38 1217 4 534 766 44 1344
TOTAL 1345 2602 140 4087
U
-J
6IG
cc
uCu
CC
00
0 00
ILL
0 L
)
02
F-0
shyo
w
00
b -J
w
aw
w
jo
0 c
U2
U 0 (A
0shy
0 0
4~0
0
CC
d C-
CO
Du
Ll0
coC
cc-
CL
cc
IL
w0
C-
X
Z
ca0
UU
-0
olto
z
10
0
44- j
0 cc
0 E
0 C
C
00
lt 00
CL
a -j
4-
CL
i
00
cc
Ishyal
olt
-o
LLI0
Ib
l-0
LL
C
oshy
w
0-
D
=
CL
u
CL
d
CL
)
U
z
U
c2 C
Lshy
050
00 iiiiiiiiiiii
bullccdeg L
U
CD
)
a
I
O
0
0c
CL
)
0
APPENDIX C
Mathematical and Schematic Formulations of the Linear Programming Model
Mathematical Formulation of the Dynamic Linear Programming Model
Objective Function
D I T tMinimize I P TI rt I I ct bulll~l~T~~~~ d= 1 i= 1 t= 1 = I p = 1
+ (cmidt M i t) dt- (ce E i~d)
+ (cPidt Pijd ) 1 ccdt i d
X+ [m = 1 ( xi dd m~t X~y~
+ cbid t cr bull I t)]i~~mt t i~d~mt
Constraints
I 1 2 an bullF gtDN
i1 in idt ndt
for each ndt combination (n = 12N d = 12D t = 12T)
I 2 2 an bullM 5pct n bull DN
i = 1 I n idt ndt ndt
for each ndt combination (n = 12N d = 12D t = 12T)
U D P 3 -Fidt + 1 2 (T - T t )
u = I d =I p =1 idpt uipdt
+ Mid~t EEi~dyt + Pi~dt
C M 2 ac c = 1 (Si + D ) + 2 X~~~ c~~ m ~ d=1C ml
I M - ah bullX=0i = Im = 1 jm idmt 0
for each idt combination (i = 12I d = t =12D 12T)
k 0
T-1 44 xXidmt 1 C mt ltC= - id ltCAdmtt s = I l m m
for each idmt combination (i = 12I d = 12D m = 12M t = 12T)
(s = first possible time period for plant construction)
I5XbM CIEd5 1 2 cbi d t r t cr bull~I ltl~- I~ =
i = I m = 1i m t idmt t
for each dt combination (d = 12D t = 12T)
M
6 2 Cid t RA m1 mt
for each idt combination (i = 121 d = 12D t = 12T)
7 -Cidmlt + sm I gt 0il~~ mt idmt shy
for each idmt combination (i = 12 I d = 12D m = 12M t = 12T)
M T 8 2 2 i dint =1I
m=I t=l
for each id combination (i = 12I d = 12D)
9 Fidt DFidt
For each idt combination (i = 12I d = 12D t = 12T)
10 Tui dp t - CTuidpt
for each uidpt combination (u = 12U i = 12I d =12D p = 12P t = 12T)
II idt i dt 11 M ~111Mi~~ 12 E d E for each idt combination
1 E dtgt(i = 12I d 12D
13 P 5ABt =12T)
14 Sicdt =5 icdt
for each icdt combination (i 12I c = 12C d = 12D t = 12T)
15 lidmt = 0 or I for all idh
Definition of Symbols
C = the number of coproducts per material
D = the number of model regions (destinations in case of transport
activities)
I = the number of model materials (raw materials intermediates and
fertilizers)
M = the number of production technologies
N = the number of model nutrients
P = the number of model regions in case of transport activities (origins)
T = the number of model time periods
U = the number of transportation technologies
ct = unit transportation cost ($ton)
cm = unit import cost ($ton)
ce = unit export prices ($ton)
cp = byproduct unit purchase cost ($ton)
cs = unit sales price of coproduct ($ton)
cx = unit production cost ($ton)
cb = plant construction cost ($)
an = tons of nutrient per ton of fertilizer
pct = of nutrient demand that may be imported
ac = tons of material required per ton of coproduct produced
ah = tons of material required per ton of material produced
sm = maximum plant expansion capacity
DN = nutrient demand (tons)
CA = initial production capacity (tonsmodel time period)
CIE = capital available from external and internal origin
RA = tons of raw material from indigenous reserve available per model
time period
DF = tons of fertilizer demand
CT = maximum allowable volume of transports (tons)
IM = maximum tons available for import
EX = maximum volume which may be exported (tons)
AB = material available for purchase as byproduct (tons)
MC = maximum sales possible for coproduct (tons)
Tupidpyt = material interregional transport activity by transportation techshy
nology u of material i from region d to region p in time period t
Mid t = import activity - material i region d time period t Eidt = export activity - material i region d time period t
Pid = byproduct purchase activity - material i coproduct c region d
time period t
Sicd t = coproduct sales activity - material i coproduct c region d
time period t
Xid = material pruduction activity - material i region d productiont
technology m time period t
Iidmt = plant construction activity for material i region d producshy
tion technology m time period t
Fi~d~t = fertilizer supply activity - material i region d time period t
Dicdt = coproduct disposal activity - material i coproduct c region d
time period t
Cidmt = production capacity expansion activity - material i region d
production technology m time period t
Discounting Factor
t
11= (1 + p) -q withtj=1
pj = rate of interest in time period j and
qj = number of years in time period j
Capital Recovery Factor
Pt cr = N + pt )- 1 + (1 + pt t
Pt = rate of interest in time period t and
Nt = number of years expected lifetime for a plant producing material i
Major Model Components
Raw materials from
in-country sources
to world marketsPrices
Raw materials from
world markets
Interregional raw material transport
Conversion Raw materials
Intermediates
Intermediatesto A world markets
Intermediates from
world markets
Interregional intermediates transport
Conversion Intermediates Fertilizers
Fertilizers to
world markets
Fertilizers from
ivorld markets
nterregional[
fertilizer transport
Fertilizer consumption Region IA Region IPRegion IIA Country I Country II-
Data Entries (to be Projected up to the End of Planning Period)
Reserves Industrial capacities Exploitation costs
Maximum demand
Availabilities Prices
Transport capacities Transport costs
Industrial capacities Conversion coefficients
Conversion costs
Mximum demand
Frices
Availabilities Prices
Transport capacities Transport costs
Industrial capacities Conversion coefficients Conversion costs
Maximum demand Prices
Availabilities Prices
Transport capacities Transport costs
Plant nutrient needs - per region percountr
ppendix Figure C-1 Data Requirements and Schematic Representation of Model Components and Interrelationships

ABSTRACT
This study was undertaken to illustrate the use of a dynamic linear programming model for planning the development of a fertilizer industry The model was applied to the countries of the ASEAN region
As formulated the model permits evaluation of different supply strategies specifically inreference to least cost supply patterns optimum production levels cost penalties when deviation from optimum occur and estimates of variable and total costs and of capital investments
To evaluate the impact of different fertilizer supply strategies in the region four scenarios were created They are (1) each country in the region can secure its fertilizer needs from least cost sources (2) a 100 regional self sufficiency in nitrogen (N) production is required (3) a 100 regional self-sufficiency in nit~ogen production and 50 self-sufficiency in phosphate (P20 5) production are required and (4) each country acts independently of each other and uses its own facilities as far as possible to meet its needs
Results of the study show the effect of different supply strategies on fertilizer cost It measures savings that could be realized through cooperative agreements It also shows the added costs that the region will have to pay to achieve different degrees of self-sufficiency
ECONOMIC EVALUATION OF FERTILIZER SUPPLY STRATEGIES FOR THE ASEAN REGION
LINEAR PROGRAMMING APPROACH
A Joint Publication of International Fertilizer Development Center (IFDC)
and Institut fiir Landwirtschaftliche Marktforschung (IfLM)
by
Lueder von Bremen with
Yao H Chuang Ray B Diamond Adolfo Martinez
Mohinder S Mudahar
October 1981
PREFACE
One of the first IFDC publications (IF DC T-2 1976) was amethodology study examining the potential for regional cooperation in fertilizer production between the member countries of the Association of Southeast Asia Nations (ASEAN) The essential elements of this publication which was financed by The World Bank were drawn from a working document drafted by The World Bank in collaboration with IFDC
With some of the highest population growth rates in the world and with economies based primarily on agriculture the ASEAN nations have developed and continue to develop fertilizer production capabilities aimed primarily at supporting the planned growth of the agricultural sector Fertilizer is increasingly becoming a strategic material hence national control of at least a part of the fertilizer supply is considered desirable Any move away from the free market system carries with it costs which can be evalumced In view of the very rapid economic development of the ASEAN nations it was felt that an improvement in the methodology used earliir and its application to evaluate possible alternative fertilizer supply strategies would give a valuable insight with respect to their relative economic advantages to the ASEAN countries
Consequently in late 1977 IFDC invited staff of the various agencies involved in the fertilizer sector of the ASEAN countries to prepare an information base in order to evaluate various supply strategies by using the new fertilizer sector planning model
Unavoidanle delays occurred in preparing the final report of the study The results reported in this study are however ba~ed on an update of the information to reflect the fertilizer supply situation during 1979
IFDC wishes to acknowledge the support and enthusiasm of the following who assisted in developing the information base and its update Mr Miguel Zosa Ms Bernadette Comotan-Abad Mr Filemon Cabungcal and Mr Jesus Gallegos Fertilizer and Pesticide Authority Manila Philippines Mr Kusmuno Ministry of Industry Jakarta Indonesia Dr A Wahab and Mr Soedharyono Mustafa PT Pupuk Sriwidjaja Jakarta Indonesia Mr Daniel Selvaretnam Singapore Economic Development Board Mr Gumthorn Utrawuthipong Thai Central Chemical Co Ltd and Mr Phachuap Phawandon and Mr Trakarn Chairat Ministry of Industry Bangkok Thailand
The authors gratefully acknowledge the technical assistance and helpful comments provided by the following IFDC staff members Mr A F Little Dr Dennis H Parish Dr Paul J Stangel Mr M Terry Frederick and Mr Richard Booth Appreciation is due the staff of the Word Processing Center for their patience in typing the many drafts of this report
IFDC is also indebted to der Forschungsanstalt fur Landwirtschaft (FAL) at Braunschweig-Volkenrt3de West Germany for their having seconded Dr Lueder von Bremen to IFDC to formushylate the mathematical programming model used in the study and for the use of their computer facilities at latter stages of the analyses
TABLE OF CONTENTS
Page Summary and Conclusions 1
Introduction 2
O bjectives of the Study 2 Overview of Economic and Agricultural Situation 3
Income Area and Population 3 Projected Food Deficits 3 Role of Trade 4 Role of Agriculture 4 Fertilizer Use and Crop Production 4
Overview of Fertilizer Sector 5 Actual and Planned Supply Capacities 5 Production acilities 5 Fertilizer Production 6 Fertilizer Imports 8 Fertilizer Consumption 8
Availability of Raw Materials 8 Methodology for Study 9
The Linear Programming Model 9 Model Constraints 10
Fertilizer Prices 10
Fertilizer Supply Strategies 11
Input Data for Model Estimation 12 Fertilizer Demand Projections 12 Production Coefficients 12
Capital Cost 12 Production Conversion Costs 12
Import and Export Prices 12
Transportation Costs 13 Empirical Results for Alternative Supply Strategie 14
Fertilizer Production Patterns 14 Fertilizer Supply Patterns 14
Production Site Prices 16
Market Region Prices 16 Economic Evaluation of Alternative Supply Strategies 18
Capital Requirements 18 Variable Production Costs 19
Cntribution to Profits 19
Return on Investment 20
Costs for Supplying Regional Requirements 20 Suggested Improvements and Applications 20
References 22
Appendix
LIST OF TABLES
Page1 Selected Socioeconomic Indicators for the ASEAN Region 3 2 Projected Food Deficits for 1990 in ASEAN Countries 4 3 Fertilizer and Rice Indicators for the ASEAN Region 5 4 Existing and Potential Fertilizer Production Capacity in ASEAN Region 6 5 Known Oil and Gas Reserves and Gas Production in Asian Countries 9 6 Prices for Finished Fertilizers Intermediates and Natural Gas During 1979 14 7 Annual Production of Nutrients Under Alternative Supply Scenarios Model Results 15 8 Sources of N Supply as Finished Fertilizers to ASEAN Market Regions Model Results 16 9 Sources of Phosphate (P2 05 ) Supply as Finished Fertilizers to ASEAN Market Regions
Model Results 17 10 Distribution of Principal Raw Materials and Intermediates Model Results 17 11 Annual Exports to World Markets of Urea and Ammonia Model Results 18 12 Weighted Aveage Prices for Nutrients by Country Model Results 19 13 Estimated Return on Investment at Expansion Sites Model Results 21 14 Estimated Total Expenses and Avoidable Costs to Supply Fertilizers to the ASEAN
Region During 1981-92 Model Results 21
LIST OF FIGURES
1 Marketing Regions and Locations of Existing and Planned Production Facilities in ASEAN Countries 7
2 Illustration of Fertilizer Price Determination 11 3 Apparent Historical and Projected Nutrient Consumption for ASEAN Countries 13
Summary and Conclusions
A dynamic linear programming model was dev-eloped and used to determine least cost fertilizer sup-ply strategies for the Association of Southeast Asian Nations (ASEAN) The overall objective of this study was to illustrate the use of the model as a planning tool for the fertilizer industry The study provides an example of its applications in planning investment programs and e-tablishing guidelines for international cooperation agreements in the fertilizer sector The model results for alternative fertilizer supply stra-tegies appear extremely useful to provide guidelines for national planners to ensure adequate amounts of fertilizer in consuming regions at the lowest possible cost
The dynamic nature of the model permits solu-tions which are elevant to changing fertilizer tech-nology fetilizer demand production ca)acities and price relationshipt The time period covered by the model is 1981-92 using 1978-80 as the base period All calculations are for midyears of four 3-year subshyperiods
TFie study considered the economic implications of alternative supply strategies fcr the ASEAN region and for individual ASEAN countries Foul different scenarios were simulated to measure the impact of alternate supply strategies for meeting projected fer-tilizer demand on individual countries and the region as a whole These four scenarios can be descibed briefly as follow
Scenario l--It is an unestictive scenaio which permits each country to secure its fertilizer needs from least cost sources Essentially this means that countries can poduce it domestically or purchase it from other ASEAN count lies or from the wold market
Sceno lo II-- It requires a 100 regional self-nnfficiery in nitrogen fertilizers except for sub-
period 1 when only 95 self-sufficien cy is possihlewith the existing facilities No imports of nitrogen fertilizers from outside the ASEAN region are per-mitted Phosphate fetilizes can bt obtained from any least c)st sources
Scenario lll--It is similar to scenario II with respect- to__regional self-sufficiency for nitrogen A restriction is added however that limits imports of phosphate (PO) fetilizers to 50 of total regionalneeds
Scenario IV--In this scenalio each county uses its own facilities as fal as possible to meet its needs Imports are allowed if a countrys capacities are not sufficient to meet the demand
When policies dictate a deviation fromn optimum allocation of resourcos direct comparisons of total costs to supply fertilizer needs under different stra-tegies permit determination of added cost
Results presented in this report show tthat a supply strategy tased on findings of scenario I is the most profitable for the ASEAN region and for each of its countries The total amount of fertilizers needed can be supplied at an avoidable cost of US $5809 million (1979) This amount includes the cost
1 Avoidable costs are defined as the minimum net total costs of production imports exports trans-portation and plant construction
of imports and of domestic production The tota fertilizer supplied to the region would have a markel value of US $11378 million Approximately 85-90of total nitrogen fertilizer will be produced in thE region the remainder will be imported from worlc markets For phosphate fertilizers 53-71 of thE 1205 will be imported and the rest will be produced in the region
Furthermore the results indicate that all exshyisting urea plants should operate at 98-1000 capacity and that expansion urea plants at Aceh and Bontang in Indonesia Bintulu in Malaysia and Sattahip in Thailand be completed (luring 1983-85 The expansion plant at Limay in the Philippines should not be given further consideration
With respect to ammonium sulfate (AS) it should not be produced in the region To supply nitroen (N) in the form of urea is a lower cost alternative t)iammonium phosphate (DAP) should be produced at Giesik in Indoinesia and at Leyte in the Philippines The production of NPK 2 (15-15-15) fertilizer should take place only at Petaling Jaya in Malaysia
Approximately 30 of the nitrogen and 5 of c phosphate (1)20s) fertilizer require transportation from one ASEAN country to another Cooperative agreements based on production guidelines provided by this scenario would guarantee an adequate supply of fertilizer for all consuming areas of the region at the least possible cost
Comparisons of scenario I with scenarios II and Ill show that the predetermined regfional levels of self-sufficiency for nitrogen and phosphate will be achieved at an additional cost For scenario II it is estimated that a total of US $6019 million is needed to meet demand requirements This represents an added cost of US $210 million to meet the regional self-sufficiency quirement of 100 for nitrogen proshyduction
For scenario III it is estimated that a total of tS $0 10( million is needed to meet demand requireshyments This represents an added cost of US $355 million over and above that for scenario I to meet regional self-sufficiency requirements of 100 in nishytrogen and 50 in phosphate (P 2 05) fertilizer proshyduction It is estimated that to achieve the 50
self-sufficiency in phosphate fertilizer production reshyquires an extra US $115 million
Scenario IV which represents the most probable path that ASEAN countries will follow provides total fertilizer needs at a cost of US $7328 million or US $1519 million more than the least cost supply altershynative of scenario I The main reason for this highcost is that existing inefficient plants with relatively high production costs will he operated
This study clearly demonstrates the potential effect of different supply strategies on fertilizer costs In general the lowest fertilizer prices are for scenario I and the highest for scenario IV This provides an indication of the possible consequences of alternative supply strategies on fertilizer prices fershytilizer use and therefore on agricultural production
It is not claimed that results presented in this report comprise an exhaustiv( study of the subject This is a preliminary investigation designed to proshyvide guidelines to policymakers involved in fertilizer
2--l- -- fertil-izers are nitrogen-phosphate-potash fertilizers expressed as a ratio of the N-P 2 0 5-K 2 0
sector planning It shows potential benefits that could be obtained from economic cooperation in de-veloping regional fertilizer industry Results and conclusions are tentative and subject to change with further refinements in model and input data
Introduction
Rapidly escalating energy prices have threatened traditional fertilizer sources especially of nitrogenthroughout the world Furthermore the cost of man-ufacturing fertilizers has been rising and will probably continue to do so in the future Government plannersand decisionmakers in developing countries are fullycognizant of the adverse effects on fertilizer use and food production of the fertilizer shortages and in-creased prices which occurred during the 1973-75 fer-tilizer crisis Reoccurring of such events and the lack of fertilizer supply at the farm level are causing many governments to create or expand domestic fer-tilizer production as an integral part of their national fertilizer supply strategy
Government officials may not be fully aware that development of domestic fertilizer production facilities does not always represent an optimum allocation of scarce resources It may be more costly to increase domestic production to meet total supply requirementsthan to rely fully or partially upon imports Fertil-izer production decisions in one country may affect not only the cost of fertilizers in other importingcountries but also the pattern and cost of supply for an entire economic region
Most fertilizer production feasibility studies deal only with the construction or expansion of single fa-cilities and not with long-term strategies to provideleast cost supply of all fertilizer requirements for a region or even a country However since capital inshyvestments are high and require long-term commitment it is important to evaluate the economic implications of several supply alternatives before selecting a given project
Indonesia the Philippines Malaysia and Thailand--the agricultural countries of the ASEAN region--have many of the raw materials and much of the production capacity to meet the growing fertilizer demand of the region From both a regional and national point of view there has been a growing in-terest in the ASEAN region for obtaining a greater degree of self-sufficiency in fertilizer production in order to develop a relatively more stable and secure fertilizer supply strategy
The national planners from the ASEAN regionexpressed an interest in determining possible least cost national and regional fertilizer supply alterna-tives An initial study was jointly conducted by The Worid Bank and IFDC The results are reported byFoster Livingston and Stangel (1976) An updateof this study was then undertaken by a working group within IFDC The initial preparations for this study were completed during the second half of 1977 This included conceptualization of the problem the formulation of a mathematical model the programming
3 Singapore the fifth ASEAN member country is not included in the analysis since it is neither a major fertilizer producer nor a consumer of fertilizer
for input generation and in collaboration with counshytry rep-esentatives the collection of appropriate data During mid-1978 a draft report of the preshyliminary results was discussed with government and industry representatives from the ASEAN countries Based on these discussions and on the knowledgereceived during further visits to the region during 1978 and 1979 the ASEAN Fertilizer Sector PlanningModel was modified to reflect mid-1979 conditions The main inputs to and the results obtained from the updated model runs are presented in this report
The study quantifies a more or less realisticfirst approximation of the fertilizer situation in the ASEAN region in 1979 The expansion of productionfacilities contemplated at the time availability of fershytilizer raw materials and demand projectioiis for 17 consumption regions through 1992 have been incorposhyrated A dynamic linear programming model was developed to determine the least cost solutions for supplying the estimated fetilizer demand to consumshying regions from 1981 to 1992 The results of the analysis give a first ap)proximation of the costs which countries will incur under four different supply strashytegies Thus even though most of the productionfacilities considered arc in operation or being develshyoped information with respect to technological and economic implications of different strategies which maybe useful for the future development of the fertilizer economy in the ASEAN region is generated
The model used for this study offers a systemshyat ic means to handle -i largi amount of data needed for obtaining optimum solutions for dynamic situashytions such as those now occurring in the fertilizer sectors of many developing countries Such an apshyproach can be meaningfully applied to other regions individual countries or marketing regions within a country in order to determine best fertilizer supplystrategies and thus serve as a guide for fertilizer sector planners
Objectives of the Study
The overall objective of the study is to illustrate the use of a dynamic linear programming model for planning the development of the fertilizer industry The model has been developed aind applied to the ASEAN region More specifically the study providesinsights with respect to planning investment programsand implications for regional cooperative agreements dealing with fertilizer projects Furtharmore it permits the economic evaluation of alternative supplystrategies to meet projected fertilizer requirements
The ASEAN region was selected not only to ilshylustrate the usefulness of this approach for planning purposes but also because the region is important and is experiencing rapid developments with respect to fertilizer supply The planning period considered was 1981 through 1992 The model as used in this study permits evaluation of different supply strateshygies specifically in reference toshy
1 Least cost supply patterns with respect to loshycatio size and timing of capacity expasion of plants o construction of new plants in the region
2 Optimum levels of domestic production and imshyports from different sources by each country in
2
order to satisfy projected fertilizer needs for selected time peiods
3 Estimates of cost penalties for the region when member countries deviatte from optimu m supply alternatives or from cooperatie agreements
I Variable costs total tlpply costs and capital investments
Overviewv of Eonom ic antd AgricuItural Situationi
A brief description of the eConoin ic and agiiCu1-tural situations in the four ASEAN countries is po-vided below
Inconle Area and Populat ion
Se etctd sotiotttnonlit indicators foi tie ASEAN countries aiie pitstnted in lahte 1 Malaysia has the highest pei eaptiti gioss national piodtItIt ( GNP) in the region In relation to othei countries it is about double that of the Philippires and Thailand and triple that of Indonesia The (Nl per capita is at annual rates ranging fom 26 in the lhilipplines to
469 illThailnitd Atuiatt infoiint ion on intolnt distiibution is nut geneially availa l lCowevei ac-coiding to 197071 dala fioin the Philippines and
Malaysia Ill Iotntom 20 of the houiseholds tontiol less than of incoie and lhe lop 20 control19 the approximately 5T-571
Indonesia is the largest of the fotir cotn1its with an area of 2)2700(1 kini
TABLE 1 SEtECTEI) SOCICECONOfIC
Socioeconomic Indicators
GNP per capita Growth in GNP per capita
Area Population Rate of inflation
Distribution of GDP Agriculture Industry tanufacturing Services
Exports Imports
Population growth Labor force in agriculture Rural population
Daily calorie supply
Calories as of rrluirements
Share of househotl income Lowest 20 IHighest 20
a Average for -stated period
Source The World fank 1980
eqtlivaltlt to apprcex-
imately six times that of Malaysia seven times that of the Philippines and four times that of Thailand Both Indonesia and the Philippines consist of a large number of islands creating several administrative and infrastructural problems At the same time they have a ilarge potential for developing polt facilities for water transport
Indonesia with 136 million inhabitants in 1978 is one of the most populous coun tries in the world and the most populous in the ASEAN region Malaysia Thailand and the Philippines have 133 million 445 million and 4t56 million inhatbitants respectively
Annual population growth rate in Indonesia is
the lovest of the region and is equal to 18 Malaysia the Philippines and Thailand have the same population growth rate of 2790 A large proportion of Indonesias population lives in ava and a large proshyportion of Malaysias popltation lives in peninsular Malaysia In tava the density of population is very high compared with that of the outer islands The Indonesian (Iove Ilnlen t is heavily involved in transshylocating part of the population from Java to the outer islands through transmigration schemes In each of the ASEAN countries over two-thirds of the popushylation live in rural areas and thus depend on agrishyc3owing is the major of their livelihoodeulture source
Projeced tF0dleficits
he pirojected food deficits for 1990 as estimated by the International Food Policy Research Institute (illfl) (1977) are reptorted in Table 2 Currently Indonesia and Malaysia are food-deficit countries Thailand is considered to have food surplus and the Ihilippines is just marginally self-sufficient in food
INDICATORS FOR TItE ASEAN REGION
Unit of Measurement
$ per capita per year
thousand kni mi IIion i per year
million US $ million US $
per year of total of total
calories per capita
Year Indonesia Malaysia Philippines Thailand
1978 360 1090 510 490
1960-78a 41 39 26 46
- 2027 330 300 514
id-1978 1360 131 456 445
1970-78a 200 72 134 91
1978 31 25 27 27
1978 33 32 35 27
1978 9 17 25 18
1978 36 43 38 46
1978 11643 7413 3425 4085
1978 6690 5929 5143 5256
1970-78 a 18 27 27 27
1978 1980
60 80
50 71
48 64
77 86
1977 2272 2610 2189 1929
1977 105 117 97 105
197071 197071
NA NA
33 566
37 539
NA NA
World Development Report
3
1
TABLE 2 PROJECTED FOOD DEFICITS FOR 1990 IN ASEAN COUNTRIESa
At 110 of FoodIncome GrowthLow Income Growth 11ij]_h Energy Requirement
Deficit of Deficit of Deficit ofCountry 000 mt Consumption 000 mt Consumption 000 mt Consumption
Indonesia 5985 14 7656 17 4240 10Malaysia 387 11 454 13 434 13PhilippiBes 1443 11 1738 13 3632 24Thailand (6972) (45) (6771) (43) (7302) (48)
Region 843 1 3077 4 1004
a Food consists of staples including cereals root crops pulses and groundnutsb Figures in parentheses imply food surplus
Source Calculated from IFPRI (1977)
requirements It is projected that through 1990 loleofAgricultureThailand will remain a food surplus countryIndonesia Malaysia and the Philippines are not Agricultue plays an important role in economicexpected to be able to meet their requirements from growth in each of these countries With the exshydomestic production in the future in spite of attempts ception of Indonesia where oil is a major export itemby these governments to achieve food self-sufficiency the agricultural sector is a major ource of foreignThe food deficit as a prot)ortion of domestic conuinp- exchange Cafniogl Table l shows that approximatelytion is estimate(] to be about 1(0-17 in Indonesia 311Wof ti gross domestic )roduct (GDP) comes from11-13 in Malaysia and ll-2 in tilePhilippines the agricultu1 at sector A large prcportion of thedepending upon tileassumptions with respect to in- total labor force is involved in agriculture-relatedcome growth and nutritional standards Thailand will activities The labor force in agriculture ranges fromhave a food surplus from 130to t8 of domestic con- 8 in Malaysia to 77 in Thailand Even though allsumption four countries eml)has ize (livers ification of crop proshy
duction rice is still tlmain food crop and theAt both low and high income growth 771-791 of staple food commoditythe regions food deficit will be in Indonesia flowshyever in order to provide 110 of the food energyrequirements the food deficit in Indonesia and the Philippines becomes about and 14Vof the regionsdeficit respectively This is mainly because the existing nutritional standards in the Philippines are estimated to be lower than the minimum requirementsHowever for the region as a whole the net food def- tlseanddelizerCrop Production icitis about 1V-of the consumption requirementimplying that food surplus from Thailand is large Wlee is the single major crop in each of theseenough to substantially compensate for food deficits in countries with the exception of Malaysia where rub-Indonesia Malaysia and tilt Philippines ber and oil palm are most important ones Thesethree thecrops reeeive most of the fertilizer used in
these countries
In the last decade the major sources of ex-Role of Trade pansion in rice prodtuction were yield increases in
Indonesia Malaysia and the Philippines and areaexpansion in Thailand Table 3 showsThese countries trade bilaterally through the proportionthe of growth in rice production attributed to fertilizerASEAN arrangements and with other countries in tile use It ranges from 17 in Thailand to 31 in Malayshyregion and outside During 1977 Indonesia and sia The rice yields and the contribution of fertilizerMalaysia had positive international trade balances to rice yield increases are expected to play evenwhereas the Philippines and Thailand had negative greater roles in the future if the laige projected foodinternational trade balances The major exl)ort prod- deficits are to be reduced Table 3 also shows thatuct from Indonesia is oil followed by rubber and fertilizeC use during 197879 varied from 165 kghacoffee The major export )ro(ucts from Malaysia are in Thailand to 571 kgha in Malaysia
rubber palm oil cocoa and tin The Philippinesexports coconuts sugdr t)ananas and apples hiile The (overnments of Indonesia Malaysia and theThailand exports cassava maize rice sugar and lhilippines are making a concerted effort to improverubber The agricultural sector plays a major role in crop yields by providing modern farm inputs such asthe balance of trade of these countries As a result water fertilizer seed and insecticides they aregrowth in domestic production of agricultural coin- also providing economic incentives through favorablemodities can play an important role in influencing crop and input prices The Indonesian Governmentforeign exchange situations through expansion in through the I3IMAS program and the Philippinesforeign exhange earnings or foreign exchange Government th rough the MASAGANA 99 programsavings Fertilizer has a large potential to expand have been fairly successful in stimulating modernshycrop yields and thus domestic agricultural )ro- inization of the rice sector through an increaseduction Ihe adoption of modern farm technology
TABLE 3 FERTILIZER AND RICE INDICATORS FOR THE ASEAN REGION
Fertilizer and Rice Indicators
N consumption P205 consumption K20 consumption
Fertilizer usehectare on arable land and permanent crops
Rice (paddy production Rice (paddmy area harvested Rice (paddy) yield Cuntribution of fertilizer to
rice production growth
Unit of Measurement Year Indonesia Malaysia Philippines Thailand
000 mt 197879 5240 1069 2054 1535 000 mt 197879 1354 905 498 1044 000 mt 197879 754 1727 566 300
kgha 1978 449 571 385 165
000 mt 1979 26350 2161 7000 15640 000 ha 1979 8850 757 3500 8300 kgha 1979 2977 2855 2000 1884
1965-75 24 31 27 17
Source FAO 1980 Production Yearbook FAO 1980 Fertilizer Yearbook Mudahar 1979 Policy Implications of Increased Fertilizer Efficiency for Rice Production in Asia
Overview of the Fertilizer Sector
Actual and Planned Supply Capacities
The actual installed fertilizer production capac-ity (1979) and the expansion in capacity currently planned for the ASEAN countries are reported in Table 4 Production capacity for nitrogen phos-phate and potash (N P2 0 5 and K2 0) fertilizersamounts to 1205 million mtpy 307000 mtpy and 28000 0 mtpymilorespectivelyamp nacn-28000 mtpy respectively 4 At 978At 197879 regional con-sumption levels nitrogen (N) production capacity is approximately 22 greater than that of consumption phosphate (P 2 0 5 ) production capacity is equal to 81 of that of consumption and potash (K20) production capacity is only 8 of that of consumption
Including the potential expansion of productionfacilities considered in this study production c-pac-
ities could increase to 2339000 mtpy of nitrogen and to 600000 of in Thesemtpy lO 1991 capacities
be equivalent to- 236 and 182 of the nitrogenwould be enuin in 197 respectivelyhenitrogen and P2 05 consumption in 1979 respectively and 116and 71 of the projected nitrogen and con-P2 0 5
sumption for 1991
Production Facilities
The production facilities in operation and those planned or being considered in 1979 are described briefly below The main characteristics of existing and planned facilities are shown in Appendix
Table A-1 The approximate location of the facilities is shown in Figure
Indonesia has seven fertilizer complexes in operation They include four ammoniaurea complexes under PUSRI at Palembang (Sumatra) one ammonia urea complex under Kujang at Cikampek (Java) one ammoniasulfuric acidAS complex and one TSPDAP
4 Some of the 205 and all of the K20 production refer to P and K contained in NlPK fertilizers and are based on imported raw materials Presently some P2 05 is produced in the Philippines but there is no production of K2 0 in the region
NPK complex under Petrokimia at Gresik (Java) The PUSRI and Kujang complexes utilize natural gas for ammonia Petrokimia uses fuel oil for ammonia proshyduction and imports sulfur phosphate rock and phosphoric acid for other intermediate or finished fertilizer products
A new ammoniaurea complex for KALTIM near Bontang (Kalimantan) and another near Aceh (Sumashytra) aris approaching the initiation of constructionKujang is considering adding another ammoniaurea complex at the existing Cikampek site PetrokimiasGresik plant has also been contracted for expansion Grik an alobon tracted f expansin to produce an additional 500000 mtpy of TSP using imported rock and phosphoric acid
In Malaysia ammonia is produced near Port Dickson from refinery gas That ammonia is utilized
in facilities near Petaling Jaya to produce ammonium sulfate and ammonium nitrate Another plant uses locally produced nitrogen fertilizers and imported phosphate and potash fertilizers to produce granular NPK products These are plants which simply mixfertilizers An ammoniaurea complex based upon natural gas is planned for construction near Bintulu(Sarawak) Malaysia (
In the Philippines fertilizer plants are located at Limay and Pasig (around Manila Bay) at Toledo City and at Iligan City All plants are more than 15 years old and produce a wide range of products most of which are low analysis Actually some of these plants are temporarily shut down for renovation Present capacity does not meet domestic fertilizer demand
The Philippines having facilities at Limay and Toledo City is the only ASEAN country currently producing phosphoric acid
New production facilities for ammoniaurea may be located near Limay and a phosphoric acidDAP NPK complex is to be located on Leyte Recent deshyvelopments indicate that the latter complex which may also include ammonium sulfate production would depend upon sulfuric acid from the copper smelting industry
In Thailand the existing Mae Moh ammoniaurea AS complex is considered in the study on the basis that it could he renovated Since the model runs were made the Thai Government has decided to close
TABLE 4 EXISTING AND POTENTIAL FERTILIZER PRODUCTION CAPACITY IN ASEAN REGION
Country Location Site Product N Nutrient Thousand mtpy
P29O K20
Existing Installed (1979)
Indonesia Palembang I Urea 41 0 0 II Urea 166 0 0
III Urea 245 0 0 IV Urea 245 0 0
Gresik AS 27 0 0 DAP 13 33 0 NPK 7 7 7 TSP 0 137 0
Cikampek Urea 245 0 0
TOTAL 989 177 7
Malaysia Port Dickson AS 11 0 0 Petaling Jaya NPK 13 13 13
TOTAL 24 13 13
Philippines Limay Urea 26 0 0
NPK 31 31 0 Pasig AS 5 0 0 Toledo City AS 15 0 0
NPK 8 8 8 Iligan City AS 9 0 0
TOTAL 94 39 8
Thailand Mac Moh Urea 10 0 0
AS 10 0 0 Bangkok NPK 78 78 0
TOTAL 98 78 0
TOTAL OF EXISTING 1205 307 28
Potential Expansion
Indonesia Aceh Urea 245 0 0 Bontang Urea 245 0 0
TOTAL 490 0 0
Malaysia Bintulu Ammoniaurea 245 a
0 0
TOTAL 245 0 0
Philippines Limay Bay Urea 137 0 0 Leyte DAP 37 96 0
TOTAL 174 96 0
Thailand Sattahip Urea 109 0 0
NPK 105 141 16 MAPn H1 56 0
TOTAL 225 197 16
TOTAL OF POTENTIAL EXPANSION 1134 293 16
TOTAL OF EXISTING AND EXPANSION 2339 600 44
a Ammonia apacity urea capacity is equivalent to 216000 mtpy of N b MAP is an intermediate for NPK production in the Bangkok facility
the facilities Ilowever this change does not greally Fertilizer Production affect the study results since its production capacily was rather low Additional capacity in Thailand c n- Production of nitrogen in the ASEAN region has sists of an NPK mixing and granulation plant which is increased from 118001 mtpy in 1970 to 822600 mtpybased upon imported fertilizer materials in 1979 (Appendix Table A-2) This is equivalent to
an annual compound growth rate of 226 Indonesia A new fertilizer complex is being considered for is solely responsible for this dramatic increase This
Thailand PlIans exist for an ammoniauria complex country which accounted for approximately 30 of the and a phosphoric cidlIAPNlPK complex to he located total regional production during 197( produced apshynear Sattahip At the existing Bangkok facility MAP proximately 83Tof the total during 1979 Production is considered as an intermediate for NPK production in oilier ASEAN countries has remained relatively
6
Z
w
Z
LI
--
0
gt
gt C
d_
1cr
L
C
L
~0
ILU
4shy
044
00
L0
-Jm
I-LM
IL
stable and therefore does not show any definite patterns of change
Prior to 1979 small quantities of phosphate fertil-izers were produced in thp ASEAN region in 1979 approximately 65000 mt of was produced OnlyP2 0 5the Philippines produces phosphoric acid Malaysia converts some phosphate to soluble P2 0 5 during NPK production using sulfuric acid Thailand mixes diam-monium or monoammonium phosphate with other materishyals and granulates NPK fertilizers Indonesias facility at Gresik is based on imported rock and phosphoricacid and it began producing in late 1979 This fa-cility will substantially increase the regions capacity to produce phosphate fertilizers
Although there is no production of potash in the ASEAN region small quantities of imported potash are included in NPK formulations in each of the countries
Fertilizer Imports
The imports of nitrogen in the ASEAN region in-creased from 227000 mt in 1970 to 416500 mt in 1979 (Appendix Table A-2) Indonesia exported 106000 mt and imported only 17100 mt of nitrogen during1979 On the other hand the Philippines imported 117500 mt Malaysia imported 103000 mt and Thai-land imported 178900 mt
Imports of P2 0 5 by the ASEAN group increased from 149600 mt in 1970 to 329700 mt in 1979 Of this amount Indonesia and Thailand imported 121500mt and 125000 mt respectively accounting for ap-proximately 75 of the total P2 0 5 imports of the ASEAN countries During the same year Malaysia and the Philippines impoted 75000 mt and 8200 mtrespectively
Imports of K20 by the ASEAN countries have increased from 122600 mt in 1970 to 355100 mt in 1979 During that time Thailand and the Philippineseach increased imports only by 15000 mt while im-ports of K20 into Malaysia increased by 134000 mt and into Indonesia by 69000 mt Of the total ASEAN imports of K20 in 1979 190000 mt or about 54 was made by Malaysia
Fertilizer Consumption
Annual regional consumption of nutrients for the period 1970-79 is shown in Appendix Table A-3 During this period nitrogen consumption increased from 308000 to 990000 mt P2 0 5 from 189000 to 330000 mt and K2 0 from 105000 to 335000 mt From 1970 to 1979 the consumption of nitrogen andK 2 0 increased by 920 and that of P 2 )5 by 75
The greatest increase in consumption of nitrogenand P2 0 5 occurred in Indonesia while the greatest in-crease in K2 0 consumption was in Malaysia The average annual increases in nitrogen consumption between 1970 and 1979 were 195 for Indonesia 135 for Thailand and 82 for Malaysia and the Philippines The average annual increases in con-sumption of P2 0 5 and K2 0 were also fairly high for all the countries except for the Philippines In the Philippines the 2 0 5 consumption ranged between 10000 and 50000 mtpy whereas K2 0 consumptionhas been gradually increasing from 30000 mtpy in 1970 to 56600 mtpy in 1979
Fertilizer use in the ASEAN countries on a perhectare basis is still low It ranged from 165 kgha
in Thailand to 571 kgha in Malaysia during 1978 However fertilizer use is expanding rnpidly in response to HYV use irrigation expansion favorableprice policy and various government programs Rice is the major crop in the region in terms of fertilizer use Urea is the major source of nitrogen for the rice crop P2 0 5 K2 0 and complex fertilizers are used mainly on plantation crops including rubber oil palm and cocoa
With the exception of Thailand governments are actively involved in different aspects of fertilizer production and distribution Fertilizer is distributed at the retail level by public private and cooperativeagencies with varying degrees of participation The use of fertilizer subsidies to stimulate consumption is fairly common as an instrument for the reduction of retail prices except in Thailand
Availability of Raw Materials
It is rather difficult to appraise the availabilityof raw materials that are or thst could be available within the ASEAN region for the production of fertilizers This is partly due to the fact that a demand for such raw materials with the exception of oil and gas of which the rcgion has large reserves has not really existed in the past Appendix Table A-4 contains a summary of the natural reshysources of the region relevant to the fertilizer industry
The known oil and gas reserves and their production levels are reported in Table 5 Indonesia is the leading producer of natural gas and oil in the region Natural gas production in Indonesia inshycreased from 1260 billion ft 3
ft 3 in 1973 to 8163 billion in 1979 production is expected to reach
ft 316 trillion by 1981 Reserves at their present rate of usage are sufficient to last for at least 40 years however the real life of the-reserves is unknown because gas discoveries are proceeding at a faster rate than their usage
Malaysia-Brunci is the second largest producerof natural gas in the region Production hasincreased from 51 billion ft 3 in 1974 to 3027 billion ft 3 in 1979 At the 1979 usage rate reserves would last at least 82 years Malaysian gas is also being discovered at a faster rate than it is being usedOther ASEAN countries are not currently producingnatural gas but Thailand and the Philippines are actively exploring for gas and oil Thailand has discovered significant quantities of gas in the Gulf of Thailand and plans to have on-shore delivery in 1981
Lignite is used to some exten as feedstock for power plants in Thailand It ws also used asfeedstock for fertilizer picduction until 1978 when the Mae Mob plant was closed Phosphate rock depositsin ava Peninsular Malaysia Thailand and the Philippines are considered to be too small for economic exploitation and use in the produclion of phosphatefertilizers Pyrites are now used in the Philippinesfor sulfuric acid production (Limay) Coppersmelting in the Philippines will yield byproduct sulfuric acid with potential for use in phosphoric acid production
otash deposits in northeast Thailand are largeand exploration is being expande( to determine the feasibility for commercial development Howeverbecause of insufficient economic data these potashdeposits were not considered in this study
8
TABLE 5 KNOWN OIL AND GAS RESERVES AND GAS PRODUCTION IN SOUTHEAST ASIAN COUNTRIES
Gas Production Oil Reserves Jan 1 1980 Gas Reserves Jan 1 1980 1979
a 9 3 Country i0 bbl 10_ t m i f_t 10 ft
Indonesia 9600 1315 686 24000 8163 Malaysia 2800 384 486 17000 3027a Brunei 1800 247 220 7700 Thailand 0 0 229 8000 0 Singapore 0 0 0 0 0
Philippines 25 3 0 0 0
TOTAL 14225 1949 1621 56700 11190
a Total for Malaysia and Brunei
Source International Petroleum Encyclopedia 1980
Methodology for Study The objective function of the model which is the
decision criterion for evaluating supply strategies is formulated to minimize the total cost for meeting
A dynamic linear programming model was used to projected nutrient demand for the ASEAN region over determine least cost solutions to supply the fertilizer the period 1981-92 This function includes all costs needs of the ASEAN region under different supply and revenues which will occur under different altershystrategies Four supply strategies were considered natives The components of costs and revenues are for illustrative purposes Data were collected from each ASEAN country to permit a realistic quantitative 1 Costs which include description of the existing fertilizer production a Transportation costs facilities fertilizer technology planned or considered b Import costs expansion fertilizer consumption relevant cost and c Purchase of byproducts prices d Production costs
e Plant construction costs The evaluation of supply strategies is based on 2 Revenues which include
production capacity prices and cost structure of a Exports of primary products 1979 which is the midpoint of the assumed base period b Sales of coproducts (1978-80) Four projection subperiods of 3 years each are used in the analysis This gives a planning Some of the general premises underlying the model period of 12 years (1981-92) The projected input are briefly summarized below figures and the respective resulting figures are representative for the midyear of each subperiod 1 Production and cost data for 1979 were used in (1982 1985 1988 and 19W the model These data included production
capacities by material and region possible plant Investment decisions are based on the assumption expansion investment cost raw material cost
of a real interest rate of 2 (nominal interest rate import and export prices and transportation 10 inflation rate 8) costs and routes
In general only those facilities in which the 2 The linear programming simulation uses the peshyproduction processes are more complex than simple riod 1978-80 (mid-1979) as a base and simulates mixing of ingredients were considered as fertilizer conditions for 1981-92 in four subperiods of production sites Thus if granulation accompanied 3 years each the simple mixing the facility was included as a production site Possible expansion sites were 3 All costs and prices are calculated for the middle considered only when it was known that they were year of each subperiod All costs and prices being contemplated by the respective governments are adjusted for inflation andor converted to
1979 values where necessary The breakdown of the ASEAN countries into
17 consuming regions is shown in Figure 1 This 4 Formulas used to compute discounting factors regionalization was done on the basis of information and capital recovery factors are outlined in provided by country representatives about existing Appendix C central ports transportation systems marketing areas around each central port and fertilizer consumption 5 The selection of fertilizer products is influenced patterns by the constraints which require a certain level
of domestic production Product selection is allowed among those which can be produced in
The Linear Programming Model the region except for muriate of potash which is imported
The mathematical formulation of the linear programming model used in the study is presented in 6 No specific constraints were applied to require Appendix C 5 A schematic representation of the nutrients to be supplied as specific fertilizer models major components and data required for its products In other words the demand for use are presented in Appendix Figure C-I nutrients may be supplied in the form of singleshy
nutrient NP or NPK produdts or a combination 5 Similar mathematical models are also discussed in a of these materials However several products
recently published book by Choksi Mceraus and which could be included in any least cost supply Stoutjesdijk (1980) alternative were identified
9
Model Constraints
The objective function of the linear programmingmodel described above can be minimized subject to 15constraints described below
Constraint 1 Nutrient Supplv and Demand Balance--Supply of aiiy plant nutrient in a givenregion has to be equal to or greater than demandThis constraint applies for all nutrients regions andtime periods Supply for a particular region is defined as domestic production plus imports minus exports
Constraint 2 Nutrient Imports--Nutrient importsto market regions have to be less than or equal to a predetermined share of consumption This constraint plays a major role in the creation and evaluation ofsupply strategies
Constraint 3 Materials--Raw materials needed for the manufacture of specific fertilizers must be available in adequate amounts In each region and for each time period a balance between inputs to be used and outputs to be produced under different technologies must exist
Constraint 4 Production Capacity--During thefirst time period production of any given material in any region cannot exceed actual installed capacityFor subsequent time periods production cannot exceed initial plus added capacity The time lagbetween initial investment and start of production at a new facility is fixed at 3 years
Constraint 5 Capital Availability--Capital in-vestments made in any region for plant construction cannot exceed total capital available from internal and external sources
Constraint 6 Production Cpacity Expansion-Raw Materials--The production capacity expansion that may occur in any region during any time period toproduce ary fertilizer product is restricted by the availability of raw materials froni indigenous reserves
Constraint 7 Production Capacit _ExpansionPlants--Production capacity expansion cannot exceed a technologically determined maximum size for new plants
Constraint 8 Plant Construction Activities--No more than one plant may be onstructed to poducu a given product in any given location This con-straint applies only to the construction of new plantswhich are not presently considered Itdoes not re-strict construction of planned facilities even thoughsimilar facilities may already exist in the region
Constraint 9 Fertilizer Supply and Demand Balance--This constraint is included to ensure that in any given region and for any time period the supplyof any type of fertilizer will be equal to or greaterthan demand
Constraint 10 Transportation Capacity--Inter-regional transportation of materials by different trans-portation technologies in any time period cannot exceed available transportation capacity
Constraint 11 Raw Materials Intermediates andFertilizer Im orts--This constraint restricts the quan-tity of raw materials intermediates and fertilizers which can be imported from the world market Since prices may be lower in the world market some solu-tions might include unacceptably high levels of importsif not restricted to politically acceptable levels
Constraint 12 Material Ex orts--This constraint restricts the quantity o fertilizers or other materialsthat can be exported to the world market
Constraint 13 Byproduct Purchases--The total amount of byproduct materials that can be purchasedin any region during a given time period cannot exceed what is actually available
Constraint 14 Coproduct Sales--The total amountof coproduct that can tie sold in any region during a given time period cannot exceed what is actuallyavailable
Constraint 15 Plant Construction--This integerconstraint is used to limit model solutions to construct or not to construct new plants
Of the above 15 constraints only 9 were used in the empirical estimation of the model used in thisstudy Constraints 6 10 11 12 13 and 14 were not incorporated in the model calculations either beshycause of lack of data andor they were considered itrshyrelevant for the illustration presented in this report
Fertilizer Prices
As mentioned earlier the linear programmingmodel is based upon cost minimization inder different supply strategies This means that cost and priceassumptions are very important in determining inshyvestment production and distribution patternsResulting fertilizer prices are used as a means of evaluating the effects of various restrictions uponsupply strategies
The fertilizer prices are considered as equilibshyrium prices valid under the cost assumptions and under the specific structural model assumptions Theprices are estimated by the dual solution of the linear programming model Technically they can also be called incremental costs selling price marginal costsbreak-even price or shadow prices For simplicitythey will be referred to as fertilize- prices in this report Their economic meaning is illustrated inFigure 2 Production capacities (C 1 C2 C3 andC4 ) of a region have been drawn on the x-axis beshyginning with the facility with the lowest productioncosts and then other capacities according to their inshycreasing penduction costs The y-axis representsproduction costs and fertilizer prices The curves with slope downward to the right represent averageproduction costs which in this figure are shown to decrease for each plant as its capacity use increases Regional fertilizer demand (D) is shown as a vertical line at different levels The point where the supplyand demand curves intersect determines the price level per unit of product It can be seen that ifquantity Q is needed to satisfy demand for a regionwith demand equal to D1 capacities C and areC2sufficient to supply the region with fertilizers The equilibrium price would be P11 If the demand inshycreases sufficiently capacity C3 would be necessarywhich has production costs equal to P 2 Then P 2 beshycomes the equilibrium price in the region CapacityC3 would be operating at break-even levels but capacities C1 and C 2 would realize profits which would be equal to the difference between their proshyduction costs and the equilibrium price
To simplify analysis a vertical demand curve D (drawn with different levels 1 2 and 3) was assumed This means that fertilizer demand at a certain point in time was fied and not price dependent However the necessity to bring into production facilities with highertransformation costs to satisfy demand increased the
10
C1 C2 Capacities of different production facilities in order of ferred to as scenarios I through IV and can be de-C3 C4 increasing conversion cost scribed as follows
D D2 1D3 Three different price inelastic demand curves
PI P2 3 Fertilizer (equilibrium) prices 1At three supplydemand
21 Equilibrium quantitier situations203 J
incaseof demand level Di1d Dfertilizer
a b cd conversion cost of facility with capacity 1
d c e f contribution to profits of facility with capacity 1 b g he conversion cost of facility with capacity 2
af=Pl = equilibrium price ag = 0I = production quantity
D 1 D2 DScenario
I II - +___-------
3 I I
I I c L_ ---- IP2- - - - - - -
I i I 0 P1-- a hI
U I I
I I I I
c I I
gt 9_ _ 2 Ql3
cC c 2 c 3 C4
QUANTITIES
Figure 2 Illustration of Fertilizer Price Determination
equilibrium prices The most expensive source of fer-tilizers a region must use establishes the price level for that r-i ion
To minhize total fertilizer supply costs the model considers world market supply sources and re-sorts to imports if the following two conditions are met (1) world market prices are lower than regional production costs and (2) restrictions imposed in the
formulation of the model allow imports to be made If these two conditions are not met imports will not occur Therefore it is easy to predict that with supply strategies which allow unlimited imports from the world market regional prices will be lower than or equal to world market prices Since imports are allowed domestic production may be lower than do-mestic capacity
Scenario I--Each country has the choice of meeting its fertilizer needs from any source They
can produce it locally at their existing facilities exshy
pand those facilities build planned facilities or buy from other ASEAN countries and world
markets Countries are free to select least cost alshyternatives
supply alshyternative for the ASEAN region It will serve as a basis for possible cooperation agreements among
ASEAN countries Agreements so based will guaranshytee an adequate supply of fertilizers on a regional basis at the lowest possible cost
This scenario will provide a least cost
Il--The ASEAN countries under coshy
operative agreements are supposed to produce 100 of their nitrogen needs This scenario prohibits inshyports of nitrogen fertilizers from outside the ASEAN region during the planning period except for subshyperiod 1 where only 95 self-sufficiency is possible with existing facilities However countries can
secure their phosphate and potash fertilizer needs from any least cost sources
Comparison of results for this scenario with those for scenario I will permit estimation of cost due to cooperation to attain 100 self-sufficiency in supply
of nitrogen fertilizers
Scenario IlI-This scenario is the same as sceshynario II with respect to nitrogen fertilizers An adshy
ditional restriction which specifies that ASEAN countries will cooperate to attain a 50 regional selfshysufficiency for production of phosphate fertilizers is
added As in scenarios I and II each country can secure its potash needs from any least cost sources
Comparison of results for this scenario with reshy
sults for scenarios I and II will permit estimation of cost due to cooperation to attain 100 regional selfshysufficiency in production of nitrogen fertilizers and 50 regional self-sufficiency in phosphate fertilshyizers
Scenario IV--It can be defined as the most probshyable production path for the ASEAN countries For this scenario each country produces what it can of N and P with existing and firmly planned facilities and secures the rest from least cost sources These least cost sources can be other ASEAN countries or the world market
It is unreasonable to expect that all the conshyditions for perfect competition could be achieved For this scenario each countrys needs are coy-Furthermore it may be too optimistic to expect that ered as far as possible by domestic sources If
the prevailing intraregional prices could be re- needed for in-country use domestic production may
presented exactly by the fertilizer prices determined not be lower than 95 of its capacity and if proshy
by the model These prices are an approximation of duction capacity allows not lower than 95 of the that the production andthe actual equilibrium prices which might occur if the fertilizer needs provided
handling system of raw materials and intermediateassumed conditions prevail However these prices do provide information to possibly cooperating countries products are adequate with respect to the expected long-term price strucshytures and trends This scenario will permit evaluation of a situation
where no cooperation among ASEAN countries exists Instead each one of them tries to satisfy its needs
Fertilizer Supply Strategies with its own production capacity and imports the rest from least cost sources Each country will use its
Four strategies representing different supply plants to its own advantage and secure some degree situations were analyzed These strategies are re- of self-sufficiency
11
Input Data for Model Estimation items and for support facilities located outside theplant site boundary were not included
The input data used in this study deal with several aspects of the fertilizer sector This includes fertilizer demand projections production coefficientscapital costs production conversion costs import and export prices and transportation costs and routes
Fertilizer Demand Projections
As food demand expands fertilizer demand mayincrease even at a greater rate This is because (1) the new land brought under cultivation will be of poor quality and thus will need large amounts of fer-tilizer to improve its fertility and (2) the existingland will need more fertilizer to maintain fertility as cropping intensity goes up and new crop varieties with large nutrient demand are grown
The fertilizer nutrient demand by country for the 1979-92 period was estimated using historical timeseries analyses For all countries the base period for these projections was time series data set for 14 yearsfrom 1964 through 1977 Different types of demand functions were estimated and for each country the results of the function which gave the best fit were chosen These functions were then used to make de-mand projections for the 1981-92 period However inthe case of Thailand demand projections were adjustedbased on an in-country study conducted by IFDC in early 1979 Since the demand projections are based on historical data when fertilizer consumption was rather low the projections may reflect under-estimates
The breakdown of nutrient consumption by marketing regions for each country (except Thaihandwhere the country was not divided into market regions) was based partly on information comingdirectly from representatives of the respectivecountries and partly on information coming from other knowledgeable sources With the exception of the Philippines this breakdown was held constant over the whole projection period For the Philippines slightdifferences in the regional growth rates in fertilizer consumption were used These growth rates weredetermined on the basis of information provided bycountry representatives
The estimates for aggregate and regional nutri-ent consumption forecasts for each of the four 3-yearsubperiods are reported in Appendix Table A-5 These estimates for fertilizer demand were used as an input in evaluating alternative supply strategies The past and projected fertilizer consumption by countries is shown in Figure 3
Production Coefficients
Production coefficients defining the quantities of raw materials and intermediates required to producefertilizer products selected for this study are devel-oped in the Appendix Tables A-6 and A-7
Capital Cost
The investment cost figures for fertilizer pro-duction facilities under construction or in the planningstage are based on IFDC estimates These estimates are presented in Appendix Table A-1 When available cost estimate data were considered for spe-cific projects Specific allowances for infrastructure
The investment estimates are on a 1979 cost basis including interest during construction (10year) A 4-year construction schedule with a disshybursement rate of 10 30 40 and 20 for fixed capital funds is used No cost escalation during conshystruction is included Since the capital costs normalshyly overrun the actual capital costs may be higher than the estimates used in this study
Production Conversion Costs
Conversion cost figures used for the calculations are IFDC estimates These cost estimates are alsopresented in Appendix Table A-1 They are based on the assumption of a 90 capacity utilization rate for all plants except the following Indonesian plants which are based on the assumption of 95 PUSRI IIIII and IV Aceh Bontang and Cikampek Annual capacity is defined as 330 days of operation at dailydesign capacity Thus a 90 capacity utilization is equivalent to 297 (330 x 09) days of operation at daily design capacity Raw material costs interest charges on capital and depreciation are not included in conversion cost estimates but are accounted for separately
For natural gas feedstock-based plants theprice of natural gas for steam and electricity genershyation is the same as for feedstock Cost of fuel oil for steam and electricity generation and other uses was assumed to be world market price Cost of purshychased electricity is assumed to be US $0030kWh Sulfuric acid plants are credited for steam export at US $10mt of steam Process plants using the exportsteam are charged at US $10mt of steam
Annual cost of maintenance materials is 3 and insurance and taxes are 1 of the estimated fixed inshyvestment (1979 cost basis) excluding interest duringconstruction Administration expenses and generaloverhead are 150 of the estimated cost of wagessalaries and benefits
Import and Export Prices
Depending on the respective scenario formushylation the economic environment as reflected by the world markets for fertilizers intermediates and rawmaterials can greatly influence the results of the opshytimizations The assumed cif prices for bulk mashyterial gas and liquids are reported in Table 6 for mid-1979 Prices for bulk materials and liquid were estimated for seaborne transported materials from themain supplying areas They are fob prices plus sea transport costs and port handling costs at the receiving ports
Prices for natural gas are accounting prices which were provided by government officials from each country They were assumed to remain constant throughout the planning period except for Malaysiawhere they were allowed to increase at a 5 annual rate
Prices for fertilizer exports from the ASEAN region to the world markets are assumed to be 20lower than the import prices for corresponding fershytilizer This reflects in general the transportcharges to other main consuming regions in the world Export potential has been evaluated for thefollowing products urea(1) which could be deshylivered from large plants (existing or expansion) in Indonesia Malaysia and the Philippines (2) ammonia
12
--
12 3- THAILAND
11 INDONESIA -- 2S
- HISTORICAL CONSUMPTION 2N110 PROJECTIONS_
9 0
MALAYSIA 8
z7 2shy
0 6
5- Z 0
0 C I-- PHILIPPINES
4 z4 P2 0 5
I-3 D 3 z
2 12-~~
1 K20 1
-
N - -
P2 0 5 -shy -
K2__
K20shy
-shy
p2 0 5
N -
-
P2 05
- 1(20 0 0 1 11 1 l it 1 I
1965 1970 1975 1980 1985 1990 1965 1970 1975 1980 1985 1990
YEAR YEAR
Figure 3 Apparent Historical Nutrientand Projected Consumption forASEAN Countries
where excess capacity is available (Bontang and Bintulu) and (3) DAP from Leyte
Transportation Costs
Transport activities refer to movement of fershytilizer from producing locations to receiving ports in consuming regions and transport of intermediates between production sites Three types of materials are transported These are (1) solid materials (2) ammonia and (3) phosphoric acid Transportation of solid fertilizers is much more voluminous than the transportation of ammonia or of phosphoric acid Due to the geographic situation of the ASEAN countries only seaborne transportation is considered
In most cases bulk terminal or bagging facilities exist at the receiving central ports of the selected market regions Most of the central ports can be reached by ships that are normally used for the in-terisland transportation within the region
The bulk transport freight rates refer to the middle of 1979 For ammonia and especially for phosphoric acid it is difficult to obtain reasonable
information about the actual freight terms because freight rates (long-term contracts) are normally not published In the case of large-volume contracts freight rates are often contracted in conjunction with fob or as part of cif prices Therefore they do not appear explicitly in market price scans
The freight rates for ammonia and phosphoric acid are based upon personal communications with shipping agents and rates fDr bulk materials are based upon published rates reported weekly in Green Markets and Fertilizer International
For the calculatiors of transportation costs the following equations have been used
Bulk material C = 8 + (0005 x M)
Ammonia C = 10 + (0005 x M) Phosphoric acid C = 7 + (0006 x M) Where C = transport costs in US dollars per
ton of product (mid-1979) M= distance in nautical miles
Transportation rates are for 1979 These rates are allowed to increase at an annual rate of 8 throughout the planning period
13
TABLE 6 PRICES FOR FINISHED FERTILIZERS INTER-MEDIATES AND NtITURAL GAS DURING 1979
Material aImported Materialmdnonia
Ammonium chloride
Ammonium sulfate DAP
MAP (powdered)Fuel oilNaphtha
NPK 15-15-15 Phosphoric acid (100 P205) 60 Potassium chloride Rock phosphate 60 BPL Sulfur TSP Urea
Natural Gash Indonesia Bontang amp Cikampek
Aceh amp Palembang Thailand Sattahip Mp ysia Bintulu
Prices (US $mt)19000 9000
11800 24300
22500 15000 26000
14700 34500 11400 6400 9800 18700 20000
(US $1000 ft) 085 060 075 070
a Prices are estimated mid-1979 cif basis including port haodling cost at receiving port b Refers to accounting prices
Empirical Results for Alternative Supply Strategies
Selected empirical results for the specified four fertilizer scenarios are discussed with respect to fer-tilizer production patterns fertilizer supply patterns production site fertilizer prices and fertilizer pricesat the market regions Various assumptions described above need to be kept in mind before interpreting these model results The results may vary under different assumptions Consequently these result serve only as broad guideposts for the fertilizer seL-tor planners
Fertilizer Production Patterns
The optimum levels of domestic and regional production for nitrogen and P20 5 for each subperiod and for the four scenarios are reported in Table 7 The optimum production patterns for each productionfacility in each study country are provided in Appendix Tables B-1 through B-4
In general regional production of nitrogen and phosphate fertilizers increases for each subperiod In scenario I production increased from subperiod 1 to subperiod 2 but stayed at that level for the remaining two subperiods In scenarios II and IIl regional production increased throughout the planning period For scenario IV production increased duringthe first three subperiods and declined slightly during the last subperiod
Total regional production of nitrogen and phosphate fertilizers by subperiod is the lowest for scenario I and the highest for scenario IV This reflects the crucial role played by constraints on imports and on regional production in the respective scenarios
Fertilizer production at different plants in Indonesia is reported in Appendix Table B-1 It shows that all existing urea plants operate at max-imum capacity for all scenarios and for all subperiods
The only exception to this is the plant at Cikampekwhich operates at 98 capacity The Aceh urea plant operates at maximum capacity in all scenarios after it comes on stream The same applies to the Bontang urea plant with the exception of scenario IV where it operates at 88 capacity The DAP unit of theGresik plant operates at maximum capacity for all scenarios and for all time periods The TSP unit at
Gresik operates at maximum capacity for all scenarios and for alltime periods except for subperiod 1 of scenario I
The fertilizer production at different plants in Malaysia is reported in Appendix Table B-2 The expansion site for urea production at Bintulu operates at maximum capacity in all sctnarios after it is completed and starts production in subperiod 2 TheNPK unit at Petaling Jaya operates at maximum capacity for all scenarios and subperiods The AS unit at this complex does not operate at all in scenario I and operates only during the first subperiod in the other three scenarios
The fertilizer production at different plants in the Philippines is reoorted in Appendix Table B-3 It shows that the old urea plant at Limay is the onlyold plant that operates at maximum capacity for allscenarios and during all subperiods The DAP expansion site at Leyte operates at maximum capacity after completion in subperiod 2 for scenarios I It and I11 However the DAP production is less than maximum capacity in scenario IV The new urea plantand the NPK plant at limay and the AS plants at Pasig Toledo City and Iligan City operate at full capacity during the last three subperiods of scenario IV For the other scenarios these plants operate sporadically or not at all The AS plants usually operate only during the first subperiod before expansion projects could be completed
The fertilizer production at different plants in Thailand is reported in Appendix Table B-4 It shows that the urea unit at Sattahip operates at maximum capacity in scenarios I II and Ill after it is constructed in subperiod 1 In scenario IV however this unit operates at maximum capacity only during the last two subperiods The Mae Moh plantoperates at full capacity during all subperiods for scenarios I It and Ill and sporadically for scenario IV It is interesting to note that in scenario only the urea plants at Mae Moh and the expansion at Sattahip operate The NPK production units operate only in scenarios with restrictions
The Mae Moh urea facility in Thailand produces at full capacity during the entire planning period for all scenarios except IV The AS plant seldom operates However recently all the Mae Mob facilities have been closed for technical reasons It was assumed for modeling purposes that the facilities would be renovated but those plans have apparently now been abandoned Since the total Mae Moh capacity was very low the permanent closing of the Mae Moh plants has little effect upon the results of this analysis The mixing-granulation plant near Bangkok was simulated to operate only occasionally in scenario It and to operate with more or less full capacity utilization in scenarios III and IV At Sattahip the production of NP and NPK fertilizers is feasible only under the conditions of scenario IV MAP is not produced as an intermediate for NP fertilizer at Bangkok
Fertilizer Supply Patterns
The general sources of supply of plant nutrients as finished fertilizers to consuming regions by
14
TABLE 7 ANNUAL PRODUCI1ON OF NUTRIENTS UNDER ALTERNATIVE SUPPLY SCENARIOS MODEL RESULTS
Nutrient Production Thousand mtpy Country Scenario I Region N
Indonesia 94124 7084 Ma1ILsia 1275 1275 Philippines 4016 0 Thailand 1058 0
TOTAL 100473 8359
Indonesia 142700 16974 Malaysia 21791 1275 Philippines 6320 9568 Thailand 12006 0
TOTAL 182817 27817
Indonesia 142700 16974 Malaysia 21791 1275 Philippines 6320 9568 Thailand 12006 0
TOTAL 182817 27817
Indonesia 142700 16974 Malaysia 21791 1275 Philippines 6320 9568 Thailand 12006 -
TOTAL 182817 27817
Scenario II N P20
Subperiod 1 (1981-83)
97139 17465 2295 1275 6770 1275 9058 7200
115262 27214
Subperiod 2 (1984-86)
142700 16974 21791 1275 6320 9568 12006 0
182817 27817
Subperiod 3 (1987-89)
142700 21791 6320 12006
182817
Subperiod
142700 21791 21462 15646
201599
subperiods and scenarios in each study country are reported in Appendix Tables 11-5 through B-8 These results are summarized in Tables 8 and 9 A graphic illustration of the distribution of major raw materials and intermediates is shown in Appendix Figures B-1 through B-4 and are summarized in Table 10 Domestic production of nitrogen accounts for 51-61 62-65 60)-69 and 62-96 of ASEAN demand for scenarios 1 I III and IV respectively during the planning periods Domestic production of P 2 0 5 P2 0 5accounts for 29-11 of demand for sce-nario I 34-18 for scenario II 35-16 for sce-nario Ill and 51-81 for scenario IV Thus while increasingly restrictive conditions on nitrogen pro-
duction requirements increase the proportion of ASEAN demand which is produced in the country of use only the most restrictive scenario has a signishyficant influence on P2 0 5 production within the countries of use
For scenarios I II and III the region obtains about 30-35 of its nitrogen supply and less than 15 of its P 2 0 5 supply from the other ASEAN countries Since no cooperative agreements among ASEAN countries exist in scenario IV the prices for such trade are world market prices and fertilizers obtained from other ASEAN countries are reported as obtained from the world market Generally less than 10 of N is obtained from outside the ASEAN region for scenarios I I1 and Ill However fvr scenario IV Malaysia the Philippines and lhvi Id obtain 85 80 and 60 respectively of tiir nitrogen from the world market (other ASEAN countries and outside the ASEAN region) during subperiod 1 Thereafter only the Philippines imports
16974 1275 9568 0
27817
4 (1990-92)
16974 1275 9568 3640
31457
significant
Scenario III Scenario IV N N P2P25
97139 17649 94124 16974 2295 1275 2015 1275 6770 1274 5182 826 9058 7200 8898 7040
115262 27398 110219 26115
142700 16974 139802 16974 21791 1275 21791 1275 6320 9568 25090 10904 13946 1940 25631 18813
184757 29757 212314 47966
143375 17649 140087 17255 21791 1275 21791 1275 6620 9848 24280 8834 19206 7200 29113 21220
190972 35972 215271 48584
143375 17649 139802 16974 21791 1275 21791 1275 14876 13432 24064 8282 21560 10303 29385 20060
201602 42659 215042 46591
quantities of nitrogen On the other hand generally more than 50 of phosphate (P 2 0 5 ) fertilizer is obtained from for scenarios 1 II and scenario IV All potash ASEAN region but some within a country
As reported in Table fertilizers from the world
outside the ASEAN region III and from 27 to 46 for originates from outside the
is transformed into NPKs
10 the imports of finished market primarily consist of
KCI AS and MAP Inter-ASEAN trade in fertilizers is dominated by urea which is supplied by the Indonesian and Malaysian plants Small quantities of TSP and DAP are traded within the ASEAN region Low-analysis fertilizers are usually not transported between countries
Production capacity for nitrogen fertilizers in Indonesia is well in excess of domestic demand throughout the planning period Nitrogen production capacity in Malaysia is less than demand in subshyperiod 1 but it exceeds demand through the reshymainder of the planning period Nitrogen production capacity in the Philippines is less than demand throughout the planning period In Thailand nishytrogen production capacity is less than demand in subperiod 1 but it exceeds demand until the end of the planning period when capacity and demand are in balance
Exports (outside the ASEAN region) of urea and ammonia are shown in Table 11 Export potential to world markets decreases over time during the planning period The greatest export potential exists for scenario IV but as mentioned earlier sales to
15
TABLE 8 SOURCES OF N SUPPLY AS FINISHED FERTILIZERS TO ASEAN MARKET REGIONS MODEL RESULTS
Supply Sources as Percent of Projected DemandIn-Country_ Other ASEAN Countries Non-ASEAN CountriesCountry Scenario Scenario Scenario
of Use I II I1 IV
Indonesia 94 95 94 100 Malaysia 10 17 12 15 Philippines 15 26 26 20 Thailand 5 41 41 40
ASEAN 51 62 60 62
Indonesia 93 99 100 100 Malaysia 19 19 19 100 Philippines 16 16 12 80 Thailand 47 47 54 100
ASEAN 61 64 65 96
Indonesia 91 100 99 100 Malaysia 18 18 19 100 Philippines 14 14 11 65 Thailand 41 41 66 100 ASEAN 59 63 67 92
Indonesia 89 99 98 100 Malaysia 18 18 18 100 Philippines 12 16 25 55 Thailand 37 48 66 -90
ASEAN 57 65 69 89
other ASEAN countries are classified as world market exports in this scenario The next greatest exportpotential exists for scenario I The export potential is at its lowest for scenarios II and I11
Production Site Prices
The estimated fertilizer prices for different products at each plant within countries are reportedin Appendix Tables B-9 through B-12 In generalthese tables show that fertilizer prices increase as the scenarios become more restrictive and limits are set on the level of imports andor domestic productionWith few exceptions scenario I has the lowest pricesfor all products and for all scenarios In some casesprices for subperiods 2 3 and 4 are lower than prices in subperiod 1 mainly because of a decline in production costs as new facilities come on stream
In scenarios 1I and III which require nitrogenself-sufficiency prices for nitrogen fertilizer duringsubperiod 1 are influenced by high production from existing facilities During subperiod 2 and 3 pricesdecrease slightly because of lower production costs at new plants For subperiod 4 when ASEAN demandapproaches potential fertilizer prices increase
Scenarios I and II exhibit the lowest prices for phosphate fertilizers Since there are no constraints on phosphate fertilizer production in the region and imports can take place prices are leveled with world market prices Scenario III in which 50 of the total phosphate (P 2 0 5 ) fertilizer requirement is to be pro-
IIF 111 -1 V I II III IV
Subperiod 1 (1981-83)
0 0 1 0 6 5 5 0 82 78 87 0 8 5 1 85 57 69 69 0 28 5 5 80 66 55
33 33
Subperiod 2 (1984-86) 1 1
74 81 84 84 25 53
31 36
Subperiod 3 (1987-89)
1 0 74 82 86 86 30 59
31 37
Subperiod 4 (1990-92) 1
74 88 35
1 82 84 52
32 35
55 0 29 5 5 60
34 0 15 5 5 38
0 0 5 0 0 0 81 0 7 0 0 0 88 0 0 0 0 20 46 0 29 0 0 0
35 0 8 0 0 4
1 0 8 0 0 0 81 0 8 0 0 0 89 0 0 0 0 35 34 0 29 0 0 0
33 0 10 0 0 8
2 0 10 0 0 0 82 0 8 0 0 0 75 0 0 0 0 45 34 0 28 0 0 10
31 0 11 0 0 11
duced domestically has higher prices especially for subperiod I when less efficient production units must come on stream to meet the requirements
The fertilizer prices calculated for scenario IV vary widely for all products For Indonesia and Malaysia fertilizer prices for this scenario are sometimes lower than for other scenarios 7his is theresult of excess production above domestic requirements so that in-country equilibrium prices are lowered by export prices to world markets For the Philippines and Thailand the fertilizer prices are generally high because they are influenced by the respective in-corntry high production cost strucshylures In-country capacities must be used as far as possible even to th point of using inefficient plants In several cases prices reflect that domestic production determined inefficient plants could other words the cost dependent on the world reflected by the price high
Market Region Prices
by forcing the use of existing be extremely uneconomic In
of avoiding the risk by being market for fertilizer supply is level which could be very
The weighted average prices for nitrogen and P205 in each consuming country are shown in Table 12 These prices can be considered as approximations for the nutrient prices to be expectedunder the different scenario assumptions Theyinclude the cost of transportation to central points in market regions but do not include transportation costs from central points to farmers
16
IV
TABLE 9 SOURCES OF PHOSPHATE (P2Os) SUPPLY AS FINISHED FERTILIZERS TO ASEAN MARKET REGIONS MODEL RESULTS
Supply Sources as Percent of Projected Demand In-Country Other ASEAN Countries Non-ASEAN Countries
Country -Scenario Scenario -- Scenario of Use I II III IV I II III IV I II III
ubpeiod 1 (181-83)
Indonesia 57 62 61 77 0 0 3 0 43 38 36 23 Malaysia 30 30 14 30 0 26 35 0 70 44 51 70 Philippines 0 24 24 15 0 9 27 0 100 67 49 85 Thailand 0 44 44 42 0 13 6 0 100 43 50 58
ASEAN 29 48 46 5L 0 8 10 0 71 44 44 46
Subperiod 2 (1984-86)
Indonesia 57 57 50 57 9 9 0 0 34 34 50 43 Malaysia 26 26 26 26 16 22 24 0 58 52 50 74 Philippines 100 100 50 0 0 0 0 0 0 50 0179a Thailand 0 0 10 100 0 0 40 0 100 100 50 0
ASEAN 41 41 35 81 6 6 15 0 53 53 50 27
Subperiod 3 (1987-89)
Indonesia 45 45 46 45 5 5 4 0 50 50 50 55 Malaysia 24 24 24 24 12 12 26 0 64 64 50 76 Philippines 100 100 50 0 0 0 0 0 0 5013 3a U Thailand 0 0 34 100 0 0 16 0 100 100 50 0
ASEAN 35 35 41 68 4 4 9 0 61 61 50 35
Subperiod 4 (1990-92)
Indonesia 35 35 36 35 3 3 14 0 62 62 50 65 Malaysia 21 2i 21 21 11 11 29 0 67 67 50 79 Philippines 100 100 50 114 0 0 1 0 0 0 49 0 Thailand 0 15 44 85 0 0 6 0 100 85 50 15
ASEAN 30 34 38 55 2 3 12 0 67 63 50 46
a In these cases the Philippines is oversupplied with P205 because domestic production of DAP and NPK products was used to meet the N requirement
TABLE 10 DISTRIBUTION OF PRINCIPAL RAW MAIFRIALS AND INTERMEDIATES MODEL RESULTS
Raw Material and Intermediates for Scenario To From I II III IV
Gresik World market FO PR FO PR PA FO PR PA KCI FO PR PA Limay PA PA
Petaling World market PR KCI PR KCI PR KCI PR KCl Jaya Bintulu AA AA AA
Limay World market PR AS PR AS FO PR KCI FO FO PR AS KC1
Leyte World market PA PR PR AA PR PR AA Bintulu AA AA Limay AA PA AA
Bangkok World market AC MAP AC MAP AC MAP
Sattahip World market PR SU KCl
a FO = fuel oil SU = sulfur PR = phosphate rock PA = phosphoric acid AA = ammonia AS ammonium sulfate AC = ammonium chloride MAP = monoammonium phosphate KCI = potassium chloride
17
TABLE 11 ANNUAL EXPORTS TO WORLD MARKETS OF UREA AND AMMONIA MODEL RESULTS
Exports Thousand Metric Tons of ProductYearPalembang Aceh BontangSubperiod Urea Urea Bintulu Urea Ammonia Urea Ammonia
Scenario I 1 2 3 4
0 644 679 0
0 386 359 78
0 39 0 0
0 150 150 150
0 0 0 0
0 10 10 10
Scenario II 1 2 3 4
0 438 0 0
0 362 213 0
0 0 0 0
0 150 150 141
0 0 0 0
0 10 10 0
Scenario III 1 2 3 4
0 476 52 0
0 367 334 0
0 0 0 0
0 150 150 128
0 0 0 0
0 10 3 0
Scenario IV 1 2 3 4
750 1015 828 488
0 367 333 298
0 115 0 0
0 150 150 150
0 145 106 69
0 13 13 13
The prices of nitrogen and P2 0 5 indicate thedirection in which the scenario-specific supplystrategies influence the levelprice of plant nutrients In general the lowet prices can be found in the unrestricted scenario I throughout the planningperiod In this scenario prices are influenced bythe world market prices or by the in-countryproduction costs depending on the relationshipbetween them and on the potentially available capacities
Scenarios II and III have relatively high nitrogenprices during subperiod 1 when the old nitrogenshyproducing facilities must be used and before new plants come on stream Scenario III shows veryhigh P2 0 5 prices during subperiod 4 This is be-cause old NPK plants with high production costs are required to operate to meet 50 of the P205 con-sumption imposed as a constraint on the supply system
Scenario IV results are highly influenced by the country-specific relative needs someIn casesespecially in Thailand the prices of P2 05 are veryhigh This indicates a situation in which NP fershytilizers are produced at old and relatively ineffi-cient plants
For scenario IV in the Philippines the P2 0 5prices for subperiods 2 3 and 4 are close to zero This is an indication that the fertilizer type structuredoes not fit the nutrient demand structure Specif-ically the supply of nitrogen is partially satisfied byDAP which esults in a surplus of P2O5 coming into the Philippines consuming regions Since the urea plants are operating at maximum capacity the onlyother alternative to satisfy nitrogen demand from do-mestic production is to produce more DAP HoweverDAP is not an adequate source of nitrogen since itsP2 0 5 content is much higher than its nitrogen content
This apparent problem of high nitrogen prices andlow P2 0 5 prices can be corrected by calculatingweighted average nutrient price using nutrient conshytents as weights
Economic Evaluation of Alternative SueSupply Strategies
The economic implications of alternative fertilizer supply strategies are discussd in terms of capitalrequirements variable production costs contribution to profits return on investments and total costs ofsupply strategies As mentioned earlier however all figures are presented in 1979 constant US dollars The derived costs and returns taken collectivelyreflect the relative economic advantage of one supplystrategy over the other
Capital Requirements
Capital requirements are discussed in terms ofinvestment costs for facilities to be constructed during the planning period In Indonesia andMalaysia all urea plants which were considered as potential new ftcilities are constructed duringsubperiod I in all scenarios and start production insubperiod 2 The same applies for the planned DAP plant in the Philippines and for the tentative ureafacility at Sattahip in Thailand The planned urea plant at Limay operates only in subperiod 4 of scenarios II and III and subperiods 2-4 ofscenario IV The NPK plant at Sattahip does not operate at all in scenarios I and I very little insubperiod 4 of scenario ill and at less than fullcapacity in subperiods L-4 in scenario IV
18
TABLE 12 WEIGHTED AVERAGE PRICES FOR NUTRIENTS BY COUNTRY MODEL RESULTS
a mr
Average Prices 1979 US
Indonesia Malaysia Philippines Thailand
Subperiod N PI00 N P__ N P 0 N P205
Scenario I
1 425 362 426 364 434 355 4-7 361
2 368 381 367 381 373 370 372 382
3 369 385 368 385 374 374 373 382 4 374 381 373 383 380 371 376 381
Scenario II
1 768 401 767 404 776 402 768 407
2 356 403 367 403 373 393 372 405
3 371 406 369 406 375 396 374 407 4 503 405 502 406 510 396 507 406
Scenario III
1 762 404 762 409 772 707 763 411
2 368 535 367 536 373 526 372 540
3 369 703 368 703 374 691 373 706
4 471 t247 470 1242 476 1214 475 1246
Scenario IV
1 371 412 619 359 674 603 606 358 2 368 412 368 424 1411 0 125 1403
3 369 664 369 426 1319 2 356 1364
4 370 412 369 426 1318 2 546 1082
a Price for K20 is always US $190 (1979) in each market region
If all potentially planned facilities are realized Philippines these costs for urea are US $112-$116mt capital requirements are US $588 million for at both the existing and new plants at Limay Indonesia US $270 million for Malaysia US $503 million for the Philippines and US $505 million for The estimated variable production costs for AS Thailand This results in a total of US $1866 million in the Philippines range from US $78mt at Toledo as capital required for investment to establish the City to US $127mt at Iligan City Variable proshynew fertilizer facilities in the ASEAN region duction cost of NPK is estimated to be US $185mt
in the Philippines US $175mt in Indonesia and US $121mt in Malaysia The costs for DAP are
Variable Production Costs US $229mt in the Philippines and US $224mt in Indonesia The estimated variable production cost of
Variable production costs at existing facilities TSP is US $157mt in Indonesia At the mixing are equal to raw material costs plus conversion costs granulation plant in Thailand the estimated cost In the case of new facilities however the investment for 20-20-0 varies from US $173 to US $183mt costs per unit of output are also added Variable Variable production costs for the NP and NPK fershyproduction costs for a given fertilizer from a tilizers at Sattahip were equal to US $170mt for specified plant are constant in terms of 1979 US MAP US $121mt for 25-34-0 and US $120mt for dollars throughout the planning period and for all 22-29-7 respectively scenarios Natural gas prices were assumed to remain nominally constant at 1979 levels for all countries except Malaysia where an annual increase of 5was Contribution to Profits assumed These estimates were made on the basis of information provided by country representatives in The contribution to profits was calculated by 1978 This results in declining 1979 present values subtracting the variable production cost from the for natural gas and in declining variable production fertilizer price at the production site Since prices costs as indicated in the bottom line of Appendix are toed to estimate contributions to profits the Tables B-13 through B-16 The highest cost is for estimates are valid only under conditions of economic zubperiod 1 and the lowest cost is for subperiod I equilibrium The accuracy of the estimates depends Costs of other raw materials are assumed to be the to a large degree upon the deviation of prices from world market prices and were presented earlier in real prices Thus they only indicate a potential for Table 6 the contribution to profits The estimated contribushy
tions are reported in Appendix Tables B-13 through In Indonesia variable production cost for urea B-16
ranges from US $69 to US $72 at Palembang Unit I from US $47 to US $50 at Palembang Unit II and from Negative values on these tables indicate that US $44 to US $47 at Palembang Unit Ill and IV The production costs exceed the estimated fertilizer price estimated variable costs for urea in Malaysia and Since prices are determined based on production Thailand are also within this range but in the costs all products being produced have variable
19
costs equal to or less than the price but never higher Negative values are shown to indicate the magnitude of financial loss on a per-ton basis ifproduction occurs at those places Since the objec-tive is to minimize costs those production facilities which contribute the greatest amount to profits are selected first for fertilizer production
The results reported in these tables indicate that in general the urea facilities of the region are highly economical especially those located in Indonesia Among the possible new urea production sites Aceh Bontang Bintulu and Sattahip contribshyute around ITS $100mt of urea toward profits The new facility at timay contfrihutes enough profit to justify construction only in scenario IV and sub-period 4 of scenarios 11and Ill
On the other hand the uncomletitive position of ammonium sulfate and NPNI1K is shown for nearly all cases Some exceptions occur during suhl)riod I with its high prices The TSproduction facility at Gresik is in a rather good position lDiammoniui-phosphate production at a possible plant at 1Iimaygives a low contribution to profit Ani exceptionis found in the case of Thailand at Sattahip Ihe whole multinutrient and urea complex seems to le economical only in scenario IV and in subperiod It of scenario Ill In the remaining scenarios onlythe urea facility of this plant seems economical
Return on Investment
The return on investment (1101) is calculated bydividing the plant specific total contribe ion to profits(product specific contribution to profit per ton ilimes tons produced) by the initial investment The 11O1 is used mainly for comparisons of different investment It reflects the rate of return on an investment that can be achieved under equilibrium conditions
On the basis of the possible contribution to profits and considering the investment to he made for each new plant an assessment of the ROI was made fable 13 shows ROI figures for plants that are under construction and for potential new plants which are considered
The figures indicate that the potential urea facilities in Indonesia and Malaysia have a high RO1 With respect to relative profitability these facilities appear to have economic advantage over the urea and DAP facilitisthat re planned to be built near Limayand on Leyte in he Philippines lurthermore the tentative faci~ties at Sattahip also show itpositiveROI However the ROI is valid only for the ammonia--u ea piant except for scenario IV and subperiol of scenario Ill when the NP and NPK fa lities are also built and operated
The urea plant at Limay has the highest ROI in scenario IV This is due partially to high prevailingnitrogen prices in the Philippines for this scenario and partially to the fact that it uses fuel oil as raw material The Leyte urea plant- exhibits itvery lowROI in scenarios 1 HI and IV and a high RO in scenario III Even though the 1101 is low for these scenarios operating this plant is part of the scheme that minimizes total fertilizer supply cost to the region
Costs for Supplying Regional Rlequirements
In considering the costs of supplying the fertilizer demands of the entire ASEAN region two
cost categories are used These categories are total expenses and avoidable costs
Total expenses represent the total value that the countries and region would pay for fertilizers delivered to consuming regions over the entire planning period at market prices Total expenses are calculated by adding the value of products at central points of market regions These values are shown for individual nutrients by subperiods and scenarios in Appendix Tables 1-17 through B-20 However the total expenses are summarized in Table 11
Scenario I is the lowest total expense supplyalternative for each country Other scenarios have mixed effects among the different countries The most expensive scenario for Indonesia and Malaysia is scenario IlI while for the other two countriesscenario IV is the most expensive One factor which reILuces the cost of scenario IV for Indonesia and Malaysia compared with that of other countries is the value of eXl)Olt s It world market prices This increases total revenuc fomn the sale of nitrogenfertilizers Ihe greatest cont ri1)ut ion to the increased expenditure for scenario Ill for Malaysiaand Indonesia is the increased expense for Iroduction of t205 In the hilippines scenario IV exlenses are consideratily greate than those of other scenarios because of ihe greatly increased expense for production of nitrogen In lhaind expenses increase gradually fIoim scenario I through IV and the greatest increase is due to the expense of supplying l(O
On the other hand avoidable costs represent the minimum total costs of production imports exportstransportation and constuction activities They do not include capital costs of facilities operating at the Ieginning of the planning period Those capital costs
are no longer decision parameters for plant managersIn other words sunken costs are not included
[he differences between avoidable costs for various scenarios indicate the extent to which formulated supply strategies could lead to different total costs to meet fertilizer needs for the whole ASEAN region Avoidable cosis for the region are shown for eachI scenario in abtle IH Scenario I which contains fewer constraints to supplypossibilities allows the lowest cost supply of fertilizer to meet the needs of the whole ASEAN regionScenario IV represents the most expensive supply strategy
The total expenses which also represent the total value of production of the whle ASEAN regionexceed the avoidable costs by l00- 50 This represents the realized ROI of activities associated with supplying the fertilizer needs of the whole region
Suggested Improvement and Applications
Because complex fertilizer sector planning models are seldom free front some shortcomings there is always a scope for further improvements The present study can he improved in three different but related areas First the structural and behavioral aspects of the planning model itself can be improvedby adding new activities constraints and behavior rules to represent uncertainty and expectations Second some of the simplifying assumptions with respect to fertilizer sector planning horizon and the planning region can be modified Third the input
20
TABLE 13 ESTIMATED RETURN ON INVESTMENT AT EXPANSION SITES MODEL RESULTS
Return on Investment Aceh Bontang Bintulu L e Limay Sattahip
Subperiod Urea Urea Urea DAP Urea NP Urea
Scenario I
1 0 0 0 0 0 0 2 21 19 19 0 0 13 3 21 20 19 03 0 13
19 03 0 14a4 21 20
Scenario II
1 0 0 0 0 0 0 a 2 21 19 19 3 0 13
3 13a3 21 20 19 0
4 33 30 29 9 11 20a
Scenario Ill
1 0 0 0 0 0 0 2 21 19 19 18 0 13a
a 3 21 20 19 37 0 13
4 30 28 27 104 3 16
Scenario IV
1 0 0 0 0 0 0 2 21 19 19 4 55 26 3 21 20 19 0 50 39 4 21 20 19 0 50 37
a Only ammoniaurea plant built
TABLE 14 ESTIMATED TOTAL EXPENSES AND AVOIDABLE COSTS TO SUPPLY FERTILIZERS TO THE ASEAN REGION DURING 1981-92 MODEL RESULTS
Estimated Total Expenses Total Total Supply Avoidable
Scenario Indonesia Malaysia Phi I ippines Tha i Iand Expenses Costs ----------------- (millions of 1979 US dollars)-- - ---------------shy
1 5499 1539 2046 2294 11376 5809 II 6614 1764 2504 2846 13728 6019
III 8198 1967 2718 3565 16448 6164 IV 5824 1637 5317 4087 16865 7328
data can be further updated and refined The has not changed very much The general implications qluality of data used in empirical estimation of the model appear valid in providing guidelines to determines to a great exlent the reliability of the the planners in the region for fertilizer sector develshymodel results This probhlm can be partly removed opment individually or in cooperation with each other by conducting sensitivity analysis with respect to key The economic decisions with respect to the ASEAN parameters and policy variables fertilizer sector and on the basis of the results of
this model appear logical and better than those deci-Complex mathematical programming models being sions which might be based on pure descriptive analshy
normative in nature cannot le validated with respect ysis or political considerations to their predictability by using standard statistical tests However despite some obvious shortcomings The model results are very instructive in the model appears to have performed extremely well in providing some guidelines to the planners in the simulating the general features of the fertilizer sector region with respect to broad economic implications of in the ASEAN region alternative supply strategies lowever the planners
must keep in mind the idealistic character of the Despite attempts to realistically portray the fer- model results This is especially true with respect to
tilizer economy in the ASEAN region some simplifying the interpretation of fertilizer prices contribution to assumptions with respect to data can be removed or profits and return on investments Furthermore modified For example the input prices and costs this study evaluates only four fertilizer supply were developed at the beginning of the steep price strategies which were considered appropriate for the increase of 1979 The level and structure of input ASEAN region lowever depending on the data prices costs and output prices have since changed availability computation facilities time and planning However despite these changes tile technical and objectives the model can be adapted to evaluate any economic structure of the ASEAN fertilizer industry number of alternative fertilizer strategies
21
References
British Sulphur Corporation 1979 Fertilizer Higgins J K (ed) 1979 Gren MarketsInternational The British Sulphur Corporation Fertilizer Market Intelligence Weekly McGraw-till Ltd London England (several issues during Co ew- -ork-Nfe -- York -(diitiferent issues1979) during 1979)
Choksi A M A Meeraus and A J Sloutjeudijk International Food Policy Research Institute 19771980 The Planning of Investment Programis in Food Needs of )eveloping Countriesthe Fertilizer Industry The Johns lopkins Projections of Production and ConsumptionUniversity Press Baltimore Maryland
to 1990 Research Report No 3 Washington DC
Food and Agriculture Organization of the United International Petroleum Encyclopedia 1980 TheNations (FAO) 1980 Production Yearbook Petroleun iPublishing Company Tulsa Oklahoma1979 Rome Italy (includes other previous Mudahar M S 1979 Policy Implications ofissues) Increased Fertilizer Efficiency for Rice
FAO 1980 Fertilizer Yearbook 1979 Rome Italv Production in Asia Preliminary I)raft IFDC(includes other pieViOUS issues) Muscle Shoals Alabama 35660
Foster T 110 W livingston and P J Stangel The World Bank 1980 World Development Report1976 The Potential for tRegional Cooperation in 1980 The World Bank Wasington I)-CFertilizer the ASEAN Group A MethodologyStudy Technical Btulletin IFI)C- T-2 IFDC Muscle Shoals Alabama 35660
22
APPENDIX A
Selected Model Input Data
List of Appendix A Tables
Table A-1 Selected Characteristics of Existing and Potential Fertilizer
Plants in the ASEAN Region
Table A-2 Production Imports and Exports of Fertilizer in the ASEAN Region
1970-79
Table A-3 Nutrient Consumption in ASEAN Countries 1970-79
Table A-4 Selected Fertilizer Raw Material Reserves in the ASEAN Region
Table A-5 Nutrient Demand Projections by Market Region (1981-92)
Table A-6 Input Requirements for Intermediates and Fertilizer Products
Table A-7 Input Requirements for Selected Compound Fertilizer Grades
- -- -
--
- -
Appendix Table A-i Selected Characteristics of Existing and Potential Fertilizer Plants in the ASEAN Region
Site Product
Gresik Ammonia AS Sulfuric acid TSP DAP NPK
Cikampek Ammonia Urea
Palembang
I Ammonia Urea
II Ammonia Urea
III Ammonia Urea
IV Ammonia Urea
Aceh Ammonia Urea
Bontang Ammonia Urea
Pt Dickson Ammonia
Petaling Sulfuric acid Jaya Nitric acid
AS NPK
Bintulu Ammonia Urea
Plant Statusa
OPR (1972) OPR (1972) OPR (1972) OPR (1979) OPR (1979) OPR (1979)
OPR (1979) OPR (1979)
OPR (1963) OPR (1963)
OPR (1974) OPR (1974)
OPR (1976) OPR (1976)
OPR (1977) OPR (1977)
CTN (1981) CTN (1981)
PLN PLN
OPR (1966)
OPR (1970) OPR (1966) OPR (1970) OPR (1966) CON CON
Raw Material
Capacity or(mtday) Intermediates
Indonesia
240 Fuel Oil 450 Sulfur 340 Phosphate rock
rl200 (Potash dA11800 djPhosphoric acid
j1800 (Ammonia
1000 Natural gas 1700
180 Natural gas 300
700 Natural gas 1150
1000 Natural gas 1700
1000 Natural gas 1700
1000 Natural gas 1725
1500 Natural gas 1725
Malaysia
150 Naphtha or ref gas
150 Sulfur 80 Ammonia from Pt Dickson
180 800 Potash
1000 Natural gas 1500
(Continued)
b
Conversion Cost 1979 US $mt
115 23 -1
1197
47 25
60 30
45 17
41 16
41 16
47 19
45 23
115
9 28 30 30 46 28
Capital Investmentc
1979 US $ million Facilities Working
-
- -- -
- --
- -- -
- -- -
160 3 100 5
200 5 100 15
- -
-160 5 90 15
Appendix Table A-i Selected Characteristics of Existing and Potential Fertilizer Plants in the ASEAN Region (Continued)
b Capital InvestmentcRaw Material Capacity or Conversion Cost 1979 US $ million
aSite Product Plant Status (mtday) Intermediates 1979 US $mt Facilities Working
Philippines
Limay Ammonia OPR (1965) 270 Ref gas 100 -Urea OPR (1965) 190 48 - -Sulfuric acid OPR (1965) 620 Pyrites -1 - -
Phosphoric acid P2 05 NPK
OPR (1965) OPR (1965)
210 730
Phosphate rock Potash
66 30
--
--
Pasig Sulfuric acid OPR (1966) 180 Sulfur 5 - -AS OPR (1966) 90 Ammonia 37 - -
Toledo City Phosphoric acid OPR (1958) 30f Phosphate rock g - -
Sulfuric acid OPR (1958) 250 Pyrites 3 - -
AS OPR (1958) 250 Ammonia 27 - -
NPNPK OPR (1958) 200 Potash 45 - -
Iligan Citye Ammonia OPR (1966) 80 Naphtha 135 - -Sulfuric acid OPR (1954) 120 Pyrites 10 - -
AS OPR (1966) 150 31 - -
Limay Ammonia CON (1982) 600 Naphtha or 102 130 10 (expansion) fuel oil 92 175 10
Urea CON (1982 1000 46 75 20
Leyte Phosphoric acid P2 05 CON (1982) 350 f H 2SO4 from Cu smelter 59 42 5 DAP CON (1982) 7O Ammonia 29 26 10
Thailand
Mae Moh Ammonia OPR (1966) 82 Lignite 130 - -Urea OPR (1975) 76 60 - -Sulfuric acid OPR (1975) 300 Sulfur 2 - -AS OPR (1975) 175 30 - -
Bangkok NPNPK OPR (1975) 400 Ammonium chloride 40 - -
Diammonium phosphate
NPNPK OPR (1978) 800 Potash 30 - shy
(Continued)
Appendix Table A-I Selected Characteristics of Existing and Potential Fertilizer Plants in the ASEAN Region (Continued)
Raw Material b Capital Investmentc
Site Product aPlant Status Capacity(mtday) orIntermediates Conversion Cost1979 US $mt
1979 US $ Facilities
million Working
Thailand (Continued) Sattahip Ammonia
Urea crystals Urea granular Phosphoric acid Sulfuric acid Powdered MAP
CON CON CON CON CON CON
1200 1200
800 700
2000 350
Natural gas
Phosphate rock Sulfur
45 15 6
22 8 5
191 61 21 61 56 6
5 3 7 5 3 4
NP (22-29-7) + (25-34-0) CON 1500 Potash 9 59 23
a OPR--operational CTN--under construction kLN--being planned CON--to be constructed The number in parentheses indicates startup yearb Do not include raw materials depreciation and interest Based an 95 capacity utilization except for PUSRI I and Gresik plants which are based on 90 c IFDC cost estimates for projects under construction or in planning stages Estimates do not include escalation during constructiond Maximum capacity if one fertilizer type is produced e Iligan City production facilities to be phased out in 1985 f Capacity is in terms of quantity of P2 05 g Not estimated--Limay estimate taken
Appendix Table A-2 Production Imports and Exports of Fertilizer in the ASEAN Region 1970-79
Country 1970 1971 Production or Trade thousand mt 1972 1973 1974 1975 1976 1977 1978 1979
N Production
Indonesia 393 453 482 599 852 1659 2075 1842 3961 7360 Malaysia 310 260 425 400 462 370 340 387 377 374 Philippines 535 477 586 554 535 534 621 484 379 457 Thailand 80 115 103 77 74 67 43 69 89 35 TOTAL 318 1305 1596 1630 1923 2630 3079 2815 4859 8226
N Imports
Indonesia 1076 990 2147 2449 2930 6110 1590 1030 99 171 Malaysia 305 339 443 383 556 752 449 734 660 1030 Philippines 479 714 940 510 946 2394 441 632 1416 1175 Thailand 410 360 520 550 529 731 746 1297 1512 1789
TOTAL 2270 2403 4050 3892 4961 9987 3226 3693 3687 4165
N Exports
Indonesia 0 0 0 0 0 0 0 0 1841 1060 Malaysia 0 14 28 53 57 58 55 0 0 0 Philippines 0 30 12 0 0 0 0 0 45 12 Thailand 0 0 0 0 0 0 0 0 0 0
TOTAL 0 44 60 53 53 58 55 0 1886 1072
P20 Production
Indonesia 0 0 0 0 0 0 0 0 0 0 Malaysia 235 229 212 260 243 0 209 220 253 288 Philippines 390 410 417 418 410 421 312 310 293 361 Thailand 0 0 0 0 0 0 0 0 0 0
TOTAL 625 639 629 678 653 421 521 530 546 649
(Continued)
Appendix Table A-2 Production Imports and Exports of Fertilizer in the ASEAN Region 1970-79 (Continued)
Country 1970 1971 Production or Trade thousand mt 1972 1973 1974 1975 1975 1977 1978 1979
P20s Imports
Indonesia Malaysia Philippines Thailand
626 170 250 450
180 229 08
235
216 125 52
433
960 108 21
559
850 160 65 514
348 183 477 704
819 127 06
622
79 193 0
803
442 170 0
1326
1215 750 82
1250 TOTAL 1496 652 826 1648 1589 1712 1574 1075 1838 3297
POs Exports Indonesia Malaysia Philippines Thailand
0 0 0 0
0 0 29 0
0 0 13 0
0 53 0 0
0 48 16 0
0 0 0 0
0 0 0 0
0 0 0 0
0 0 56 0
0 0 15 0
TOTAL 0 29 13 53 64 0 0 0 56 15
K20 Imports
Indonesia Malaysia Philippines Thailand
82 561 377 206
68 757 364 150
47 749 366 228
299 808 450 420
403 893 466 384
332 1029 863 509
134 1187 440 391
300 1434 480 205
400 1732 428 298
772 1900 539 340
TOTAL 1226 1339 1390 1977 2146 2733 2152 2419 2858 3551
Source FAO Fertilizer Yearbook various issues
Appendix Table A-3 Nutrient Consumption in ASEAN Countries 1970-79
Country 1970 1971 1972 Consumption thousand mt 1973 1974 1975 1976 1977 1978 1979
Average Annual Compound
Growth Rate
N
Indonesia 1055 2017 1963 3474 3500 3450 3419 3512 4652 5240 195 Malaysia Philippines
524 1014
664 1192
666 1220
808 1145
1122 1519
689 1774
776 1441
835 1772
968 1742
1069 2054
82 82
Thailand 490 425 620 620 602 798 789 1363 1601 1535 135 TOTAL 3083 4298 4469 6047 6743 6711 6425 7482 8963 9898 138
Indonesia 626 289 231 668 P90a
850 1141 1165 1067 1082 1235 78 Malaysia 170 229 120 256 352 291 283 364 160 524 133 Philippines 640 440 500 399 510 478 340 400 404 498 -27 Thailand 453 235 433 559 514 704 622 803 900 1044 97 TOTAL 1889 1193 1284 1882 2226 2614 2410 2634 2546 3301 64
Indonesia 82 65 47 299 403 330 250 300 254 754 280 Malaysia 561 757 768 808 893 1029 1137 1411 1508 1727 133 Philippines 300 400 377 388 556 600 488 515 459 566 73 Thailand 108 150 228 420 384 509 391 205 250 300 120
TOTAL 1051 1372 1400 1915 2236 2468 2468 2431 2471 3347 137
Source FAO Fertilizer Yearbook various issues
Appendix Table A-4 Selected Fertilizer Raw Material Reserves in the Southeast Asian Region
Main Region Port Lignite Crude Oil Natural Gas
North Thailand
Bangkok Mae Moh 80 million mt
Fang oil quantity not exactly known
Total Thailand 8000 x 109 ft2
Li 15 Li oil shale million mt Thailand reserves
140000 bbl South Plukeit Krabi Thailand 100 million mt
North Sumatra Aceh Indonesian reserves Indonesian reserves 9600 x 106 bbl 24000 x 109 ft3 reserves obviously are reserves obviously not a limiting factor are not a limiting at any of the locations factor at one of mentioned the locations
mentioned South Sumatra Palembang West Java
East Bontang or Kalimantan Balikpapan
Brunei Kuala - 1800 x 106 bbl 7700 x 109 ft3
- Belait
Malaysia Peninsula
- Malaysian reserves 2800 x 106 bbl
Malaysian reserves 17000 x 109 ft3
Malaysia Sabah
Malaysia Sarawak
Philippines 25 x 106 bbl
Sources International Petroleum Encyclopedia 1980 and unpublished IFDC information
Pyrites
60 x 106 mt
Rock Phosphates
Total Thailand 50000 mt of P2 05
500000 mt rock exploitation not probable in larger scale
100000 mt rock exploitation not
probable
454000 mt rock
small-scale exploitation
Potash Salts
In excess of 10 x 106 mt of K2 0
Appendix Table A-5 Nutrient Demand Projections by Market Region (1981-92)a
Central Demand 1981-83 1984-86 1987-89 1990-92 Country Market Region Point (Port) N P2 N P KO N P - N
---------------shy (thousand mt of nutrientsyear)- - -----------
Indonesia Kalimantan East Balikpapan 18 7 06 22 9 07 27 11 1 32 14 1 Kalimantan West Pontianak 6 2 06 7 3 07 9 4 1 11 5 1 Sulawesi Ujung Pandang 30 11 06 37 15 07 45 i9 1 54 24 1 East Java Surabaja 167 62 7 207 83 9 250 107 11 298 133 13 Central Java Cilacap 143 53 3 177 71 35 215 92 4 256 116 5 West Java Jakarta 155 58 7 192 77 9 232 100 11 276 126 13 South Sumatra Palembang 18 7 06 22 9 07 27 11 1 32 14 1 Central Sumatra Padang 24 9 06 30 12 07 36 15 1 43 19 1 North Sumatra Belawan 35 13 35 44 17 45 54 23 56 63 29 67
TOTAL 596 222 55 738 296 70 895 382 87 1065 480 103
Malaysia West Malaysia (Penisula W) Port Dickson 92 28 128 102 33 159 114 37 193 126 42 228 West Malaysia (Penisula E) Kuantan 28 9 38 31 10 47 34 11 58 37 12 69 Sarawak Bintulu 9 3 7 10 4 9 12 4 10 13 4 12 Sabah Kota Kinabalu 5 3 9 8 3 10 9 3 11 10 3 13
TOTAL 134 43 182 151 50 225 169 55 272 186 61 322 Philippines North Philippines Manila 110 23 26 126 24 26 150 27 27 176 29 29
Central Philippines Iloilo 99 21 23 132 26 28 157 28 29 184 31 31 South Philippines Cagayan de Oro 51 11 12 56 11 12 67 12 12 78 13 13
TOTAL 260 55 61 314 61 66 374 67 68 438 73 73
Thailand TOTAL Bangkok 222 165 47 256 188 57 291 212 67 326 236 77
GRAND TOTAL 1212 485 345 1459 595 418 1729 716 494 2015 850 575
a For the midpoint of the years indicated
Appendix Table A-6 Input Requirements for Intermediates and Fertilizer Products
Product Input Requirement per mt
Ammonia 22700 ft3 of natural gas or 22900 ft3 of refinery gasmt or 075 mt of fuel oil or 056 mt of naphtha or 262 mt of lignitemt
Nitric acid 0283 mt of ammoniamt Sulfuric acid 072 mt of pyrite or 0344 mt of
sulfurmt Phosphoric acid 310 mt of phosphate rock plus 262 mt
of sulfuric acidmtAmmonium sulfate 027 mt of ammonia plus 075 mt of
sulfuric acidmt Urea 060 mt of ammoniamt Triple superphosphate 036 mt of P205 as phosphoric acid plus
041 mt of phosphate rockmtDiammonium phosphate 025 mt of ammonia plus 046 mt of
phosphoric acidmtMonoammonium phosphate 060 mt of ammonia plus 053 mt of
phosphoric acidmt
Appendix Table A-7 Input Requirements for Selected Compound Fertilizer Grades
Quantity of Inputs mtmt of Product Philippines Indonesia Malaysia Thailand
Inputs 14-14-14 15-15-15 15-15-15 20-20-0 25-34-0 22-29-7
Ammonia 0045 0048 0110 - 0170 0150 Ammonium chloride - - - 0610 - -Ammonium sulfate 0464 0362 0030 - -
Nitric acid - - 0280 - - -Urea 0017 0081 - - 0270 0235 Phosphoric acid 0140 0150 - - 0350 0300 Phosphate rock - - 0500 - - -Triple superphosphate 0059 0080 KCL (60) 0234 0250 0250 - - 0130 Diammonium phosphate - - - 0390 - -
APPENDIX B
Selected Empirical Results
List of Appendix B Tables
Table B-I Fertilizer Production in Indonesia
Table B-2 Fertilizer Production in Malaysia
Table B-3 Fertilizer Production in the Philippines
Table B-4 Fertilizer Production in Thailand
Table B-5 Sources of Supply of Plant Nutrients as Finished Fertilizers
to Market Regions in Indonesia
Table B-6 Sources of Supply of Plant Nutrients as Finished Fertilizers
to Market Regions in Malaysia
Table B-7 Sources of Supply of Plant Nutrients as Finished Fertilizers to
Market Regions in the Philippines
Table B-8 Sources of Supply of Plant Nutrients as Finished Fertilizers to
Market Regions in Thailand
Table B-9 Estimated Fertilizer Prices at Production Sites in Indonesia
Table B-10 Estimated Fertilizer Prices at Production Sites in Malaysia
Table B-lI Estimated Fertilizer Prices at Production Sites in the Philippines
Table B-12 Estimated Fertilizer Prices at Production Sites in Thailand
Table B-13 Estimated Variable Production Costs and Contribution to Profits
in Indonesia
Table B-14 Estimated Variable Production Costs and Contribution to Profits
in Malaysia
Table B-15 Estimated Variable Production Costs and Contribution to Profits
in the Philippines
Table B-16 Estimated Variable Production Costs and Contribution to Profits
in Thailand
Table B-17 Estimated Total Expenses to Supply Plant Nutrients in Indonesia
Table B-18 Estimated Total Expenses to Supply Plant Nutrients in Malaysia
Table B-19 Estimated Total Expenses To Supply Plant Nutrients in the
Philippines
Table B-20 Estimated Total Expenses to Supply Plant Nutrients in Thailand
List of Appendix B Figures
Figure B-I Distribution of Principal Raw Materials and Intermediates for
Scenario I
Figure B-2 Distribution of Principal Raw Materials and Intermediates for
Scenario II
Figure B-3 Distribution of Principal Raw Materials and Intermediates for
Scenario III
Figure B-4 Distribution of Principal Raw Materials and Intermediates for
Scenario IV
Appendix Table B-I Fertilizer Production in Indonesia
Subperiod AS DAP Gresik
15-15-15
Fertilizer Production thousand mt of productyear Existing Plants
PalembangCikampek I Ii III + IV
TSP Urea Urea Urea Urea
Expansion Sites Aceh Bontang Urea Urea
1 2 3 4
0 0 0 0
72 72 72 72
0 0 0 0
82 297 297 297
Scenario I 523 89 523 89 523 89 523 89
361 361 361 361
1045 1045 1045 1045
0 523 523 523
0 533 533 533
1 2
3
4
117 0
0
0
72 72
72
72
45 0
0
0
293 297
297
297
Scenario II 523 89 523 89 523 89 523 89
361 361
361
361
1045 1045
1045
1045
0 523
523
523
0 533
533
533
1 2 3 4
117 0 0 0
72 72 72 72
45 0
45 45
297 297 297 293
Scenario III 523 89 523 89 523 89 523 89
361 361 361 361
1043 1045 1041 1045
0 523 523 523
0 533 533 533
1 2 3 4
0 0 0 0
72 72 72 72
0 0
19 0
297 297 297 297
Scenario IV 523 89 523 89 521 89 523 89
361 361 361 361
1045 1045 1045 1045
0 523 523 523
0 470 470 470
134 72 45
Effective Capacity thousand mt productyear 297 534 89 361 1066 533 533
Appendix Table B-2 Fertilizer Production in Malaysia
Fertilizer Production thousand mt of productyear Existing Plant Expansion Site Petaling Jaya Bintulu
Subperiod AS 15-15-15 Urea
Scenario I
1 0 85 0 2 0 85 446 3 0 85 446 4 0 85 446
Scenario II
1 51 85 0 2 0 85 446 3 0 85 446 4 0 85 446
Scenario III
1 51 85 0 2 0 85 446 3 0 85 445 4 0 85 446
Scenario IV
1 37 85 0 2 0 85 446 3 0 85 446 4 0 85 446
Effective Capacity thousand mt of productyear a 446b 54 8 5
a Total capacity is equal to 238000 mtpy but nitric acid capacity limits NPK production to 85000 mtpy b Excess capacity of ammonia of 145000 mtpy
Appendix Table B-3 Fertilizer Production in the Philippines
Fertilizer Production thousand mv of productyear Existing Plants Expansion Sites
Limay Pasig Toledo City lligan City Leyte Limay Subperiod 14-14-14 Urea AS AS 14-14-14 AS DAP Urea
Scenario I
1 0 56 0 72 0 0 0 0 2 0 56 0 0 0 0 208 0 3 0 56 0 0 0 0 208 0 4 0 56 0 0 0 0 208 0
Scenario II
1 91 56 27 74 0 45 0 0 2 0 56 0 0 0 0 208 0 3 0 56 0 0 0 0 208 0 4 0 56 0 74 0 0 208 297
Scenario III
1 91 56 27 74 0 45 0 0 2 0 56 0 0 0 0 208 0 3 20 56 0 0 0 0 208 0 4 217 56 0 0 59 0 208 102
Scenario IV
1 0 56 27 47 59 15 0 0 2 217 56 27 74 0 45 171 293 3 217 56 27 74 0 45 126 293 4 217 56 27 74 0 45 114 293
Effective Capacity thousand mt of productyear
217 56 27 74 59 45 208 297
Appendix Table B-4 Fertilizer Production in Thailand
Fertilizer Production thousand mt of productyear Existing Plants Expansion Site
Mae Moh Bangkok Sattahip Subperiod AS Urea 20-20-0 ii-54-0a 25-34-0 22-29-7 Urea
Scenario I
1 0 23 0 0 0 0 0 2 0 23 0 0 0 0 238 3 0 23 0 0 0 0 238 4 0 23 0 0 0 0 238
Scenario II
1 40 23 360 0 0 0 0 2 0 23 0 0 0 0 238 3 0 23 0 0 0 0 238 4 0 23 182 0 0 0 238
Scenario III
1 40 23 360 0 0 0 0 2 0 23 97 0 0 0 238 3 0 23 360 0 0 0 238 4 0 23 360 0 0 107 238
Scenario IV
1 40 23 352 0 0 0 0 2 0 0 360 0 223 139 213 3 0 11 360 0 223 222 238 4 30 23 360 0 223 182 238
Effective Capacity thousand mt of productyear
52 23 360 104 223 223 238
a MAP is to be produced only to use as intermediate in Bangkok plant
Appendix Table B-5 Sources of Supply of Plant Nutrients as Finished Fertilizers to Market Regions in Indonesia
Quantity of Plant Nutrients thousand mtpy Other Non-ASEAN
In Country ASEAN Countries Countries Total Subperiod N P20a Kg N P2 KO N Z K20 N POn K90
Scenario I
1 559 127 0 0 0 0 37 95 55 596 222 55 2 689 170 0 10 26 0 39 100 70 738 296 70 3 812 170 0 8 22 0 75 190 87 895 382 87 4 945 170 0 6 16 0 114 294 103 1065 480 103
Scenario II
1 566 137 7 0 0 0 30 85 48 596 222 55 2 729 170 0 9 24 0 0 102 70 738 296 70 3 891 170 0 4 22 0 0 190 87 895 382 87 4 1059 170 0 6 16 0 0 294 103 1065 480 103
Scenario III
1 559 134 7 7 7 7 30 81 41 596 222 55 2 738 148 0 0 0 0 0 148 70 738 296 70 3 889 175 7 6 16 0 0 191 80 895 382 87 4 1040 175 7 25 65 0 0 240 96 1065 480 103
Scenario IV
1 596 170 0 0 0 0 0 52 55 596 222 55 2 738 170 0 0 0 0 0 126 79 738 296 79 3 895 172 3 0 0 0 0 210 84 895 382 87 4 1065 170 0 0 0 0 0 310 103 1065 480 103
Appendix Table B-6 Sources of Supply of Plant Nutrients as Finished Fertilizers to Market Regions in Malaysia
Subperiod In Country
N PZO K
Quantity of Plant Nutrients thousand mtpy Other Non-ASEAN
ASEAN Countries Countries N P90 K2 N P20- K N
Total PZO
Scenario I
1 2 3 4
13 28 31 33
13 13 13 13
13 13 13 13
110 112 124 137
0 8 7 7
0 0 0 0
11 11 14 16
30 29 35 41
169 212 259 309
134 151 169 186
43 50 55 61
182 225 272 322
Scenario II
1 2 3 4
23 28 31 33
13 13 13 13
13 13 13 13
104 123 138 153
11 11 7 7
0 0 0 0
7 0 0 0
19 26 35 41
169 212 259 309
134 151 169 186
43 50 55 61
182 225 272 322
Scenario III
1 2 3 4
16 29 32 34
6 13 13 13
6 13 13 13
116 122 137 152
15 12 15 17
0 0 0 2
2 0 0 0
22 25 27 31
176 212 259 307
134 151 169 186
43 50 55 61
182 225 272 322
Scenario IV
1 2 3 4
20 151 169 186
13 13 13 13
13 13 13 13
0 0 0 0
0 0 0 0
0 0 0 0
114 0 0 0
30 37 42 48
169 212 259 307
134 151 169 186
43 50 55 61
182 225 272 320
Appendix Table B-7 Sources of Supply of Plant Nutrients as Finished Fertilizers to Market Regions in the Philippines
Quantity of Plant Nutrients thousand mtpy Other Non-ASEAN
In Country ASEAN Countries Countries Total Subperiod N PZ0 K N K2 N P20 K N P20 K
Scenario I
1 40 0 0 147 0 0 73 55 61 260 55 61 2 50 61 0 264 0 0 0 0 66 314 61 66 3 52 67 0 322 0 0 0 0 68 374 67 68 4 54 73 0 384 0 0 0 0 73 438 73 73
Scenario II
1 68 13 13 179 5 0 13 37 48 260 55 61 2 51 61 0 263 0 0 0 0 66 314 61 66 3 52 67 0 322 0 0 0 0 68 374 67 68 4 69 73 0 369 0 0 0 0 73 438 73 73
Scenario III
1 68 13 13 179 15 0 13 27 48 260 55 61 2 38 31 0 276 0 0 0 30 66 314 61 66 3 41 34 3 333 0 0 0 33 65 374 67 6P 4 108 35 35 330 2 2 0 36 36 438 73 73
Scenario IV
1 52 8 8 0 0 0 208 47 53 260 55 61 2 251 109 30 0 0 0 63 0 36 314 109a 66 3 243 89 89a30 0 0 0 131 0 38 374 68 4 241 83 30 83a0 0 0 197 0 43 438 73
a In these cases an oversupply of P2 05 exists because DAP was produced to meet the N requirements
Appendix Table B-8 Sources of Supply of Plant Nutrients as Finished Fertilizers to Market Regions in Thailand
Quantity of Plant Nutrients thousand mtpy Other Non-ASEAN
In Country ASEAN Countries Countries Total Subperiod N P90- K90 N PqQO K N N PP K20
Scenario I
1 10 0 0 147 0 0 65 165 47 222 165 47 2 120 0 0 63 0 0 73 188 57 256 188 57 3 120 0 0 88 0 0 83 212 67 291 212 67 4 120 0 0 114 0 0 92 236 77 326 236 77
Scenario II
1 90 72 0 121 22 0 11 71 47 222 165 47 2 120 0 0 136 0 0 0 188 57 256 188 57 3 120 0 0 171 0 0 0 212 67 291 212 67 4 156 36 0 170 0 0 0 200 77 326 236 77
Scenario III
1 90 72 0 121 10 0 11 83 47 222 165 47 2 139 19 0 117 75 0 0 94 57 256 188 57 3 192 72 0 99 34 0 0 106 67 291 212 67 4 215 103 8 I1 15 0 0 118 69 326 236 77
Scenario IV
1 89 70 0 0 0 0 133 95 47 222 165 47 2 256 188 10 0 0 0 0 0 47 256 188 57 3 291 212 16 0 0 0 0 0 51 291 212 67 4 293 201 13 0 0 0 33 35 64 326 236 77
Appendix Table B-9 Estimated Fertilizer Prices at Production Sites in Indonesia
Fertilizer Prices 1979 US $mt of Product
Subperiod AS DAP Gresik
15-15-15 TSP Cikampek Urea
I Urea
Palembang II
Urea III + IV Urea
Aceh Urea
Bontang Urea
Scenario I 1 2 3
77 72 72
233 232 234
138 133 133
157 165 167
186 162 162
185 160 160
185 160 160
185 160 160
0 160 160
0 160 160
4 72 234 134 166 164 162 162 162 160 163
Scenario II 1 2 3 4
146 100 101 97
312 242 244 268
195 162 137 157
174 175 177 177
344 162 162 225
342 160 161 222
342 160 161 222
342 160 161 222
0 160 160 220
0 160 161 222
Scenario III 1 2 3 4
145 84
101 109
313 302 380 649
195 157 181 278
176 235 313 564
342 161 162 210
340 160 160 207
340 160 160 207
340 160 160 207
0 160 160 205
0 160 160 207
Scenario IV 1 2 3 4
66 66
109 109
246 245 362 246
141 161-175 137
179 178 295 179
162 161 162 163
160 160 160 160
160 160 160 160
160 160 160 160
0 160 160 160
0 160 160 160
Appendix Table B-10 Estimated Fertilizer Prices at Production Sites in Malaysia
Fertilizer Prices 1979 US $mt of Product Petaling Jaya Bintulu
Subperiod AS 15-15-15 Urea
Scenario I
1 93 138 shy
2 101 133 160 3 102 133 160 4 101 133 163
Scenario II
1 145 196 shy2 101 136 160 3 102 137 161 4 106 156 222
Scenario III
1 144 196 shy2 65 156 160 3 66 183 160 4 106 278 207
Scenario IV
1 113 165 shy2 106 137 160 3 106 137 160 4 106 137 160
Appendix Table B-Il Estimated Fertilizer Prices at Production Sites in the Philippines
Fertilizer Prices 1979 US $mt of Product
Subperiod Limay
14-14-14 Urea Pasig AS
Toledo City AS 14-14-14
Iligan City AS
Leyte DAP
Limay Urea
Scenario I
1 129 192 79 78 128 79 - -2 123 164 86 86 122 86 228 171 3 124 165 87 86 123 86 230 171 4 124 167 87 86 123 86 230 167
Scenario II
1 182 349 147 146 183 147 - -2 126 164 116 66 125 66 239 164 3 132 165 87 86 113 93 241 165 4 146 226 94 93 188 94 265 226
Scenario III
1 182 347 146 146 183 146 - -2 166 164 86 66 151 86 300 172 3 168 165 88 66 169 67 377 173 4 254 212 110 108 255 108 643 212
Scenario IV
1 198 301 126 126 196 127 - -2 215 640 274 274 270 275 246 640 3 202 598 255 255 203 256 229 598 4 202 597 255 255 211 256 229 597
Appendix Table B-12 Estimated Fertilizer Prices at Production Sites in Thailand
Fertilizer Prices 1979 US $mt of Product Mae Moh Bangkok Sattahip
Subperiod AS Urea 20-20-0 11-54-0 25-34-0 22-29-7 Urea
Scenario I
1 75 186 147 - - shy
2 64 161 140 134 215 198 163 3 64 161 141 135 215 198 163 4 65 163 141 136 216 199 165
Scenario II
1 143 343 225 - - shy
2 64 161 145 147 227 205 163 3 65 162 146 217 224 205 167 4 91 223 173 216 257 237 225
Scenario III
1 143 341 225 - - shy
2 64 161 173 216 268 244 163 3 64 161 205 217 325 292 163 4 85 208 334 764 534 471 210
Scenario IV
1 i1 268 183 - - - shy
2 15 47 296 221 500 440 49 3 61 154 334 217 544 479 156 4 99 241 315 216 496 439 243
Appendix Table B-13 Estimated Variable Production Costs and Contribution to Profits in Indonesia
Subperiod AS DAP Gresik
15-15-15
Contribution to Profits 1979 US $mt of Product PalembangCikampek I II III + IVTSP Urea Urea Urea Urea
Aceh Urea
Bontang Urea
1 2 3 4
-32 -37 -37 -37
9 8
10 10
-37 -42 -42 -41
0 8 10 9
123 101 103 106
Scenario I 113 135 89 11 90 112 93 115
138 114 115 118
-108 109 110
103 104 108
1 2 3 4
37 -9 -8
-12
88 18 20 44
20 -13 -38 -18
17 18 10 10
281 101 103 167
Scenario II 270 292 89 11 91 113
153 175
295 114 116 178
-108 109 170
-103 105 167
1 2 3 4
36 -25 -8 0
89 78
156 425
20 -18 6
103
19 78
156 407
279 100 103 152
Scenario III 268 390 89 11 90 112
138 160
293 114 115 163
-108 109 155
-103 104 152
1 2 3 4
-43 -43 0 0
22 21
138 22
-34 -14 0
-46
22 21
138 22
99 100 103 105
Scenario IV 88 110 89 il 90 112 91 113
113 114 115 116
-108 109 110
-103 104 105
109 224 175
Variable Production Cost 1979 US $mt of Product 157 63-58 72-69 50-47 47-44 52-50 57-55
Appendix Table B-14 Estimated Variable Production Costs and Contribution to Profits in Malaysia
Contribution to Profits 1979 US $mt of Product Petaling Jaya Bintulu
Subperiod AS 15-15-15 Urea
Scenario I
1 -20 17 -
2 -12 12 96 3 -11 12 97 4 -12 12 100
Scenario II
1 32 75 -
2 -12 15 96 3 -11 16 98 4 -7 35 159
Scenario III
1 31 75 -
2 -48 35 96 3 -47 62 97 4 -7 157 144
Scenario IV
1 0 44 -
2 -7 16 96 3 -7 16 97 4 -7 16 97
Variable Production Cost 1979 US $mt of Product
113 121 64-63
Appendix Table B-15 EstimateO Variable Production Costs and Contribution to Profits in the Philippines
Contribution to Profits 1979 US $mt of Product Limay Pasig Toledo City Iligan City Levte LmY
Subperiod 14-14-14 Urea ASAS 14-14-14 AS DAP Urea
Scenario I 1 -40 76 -37 -570 -48 - shy2 -45 50 -30 8 -63 -41 0 46 3 -44 52 -29 8 -62 -41 1 46 4 -44 55 -29 8 -62 -41 1 42
Scenario II 1 13 233 31 68 -2 20 - shy2 -42 50 0 -12 -60 -61 10 393 -36 52 -29 8 -72 -34 12 404 -22 114 -22 15 3 -33 36 101
Scenario III 1 13 231 30 68 -2 19 - shy2 -2 50 -30 -12 -34 -41 71 473 0 52 -28 -12 -16 -60 148 484 86 100 -6 30 70 -19 414 87
Scenario IV 1 29 185 10 48 11 0 shy -2 46 525 158 196 85 146 17 524 3 33 484 161 177 18 129 0 482 4 33 485 161 177 26 129 0 481
Variable Production Costs 1979 US $mt of Product
169 116-112 116 78 185 127 229 116
Appendix Table B-16 Estimated Variable Production Costs and Contribution to Profits in Thailand
Contribution to Profits 1979 US $mt of Product Bangkok
Subperiod Mae Moh
AS Urea 20-20-0
Old New 11-54-0 Sattahip
25-34-0 22-29-7 Urei-
Scenario I
1 -24 32 -36 -26 - - - -2 -35 7 -43 -33 -34 97 81 124 3 -35 7 -42 -32 -33 98 81 125 4 -34 9 -42 -32 -30 100 83 128
Scenario II
1 44 189 42 52 - - - -2 -35 7 -38 -28 -21 109 88 124 3 -34 8 -37 -27 50 106 88 126 4 -8 69 -10 0 50 141 121 188
Scenario III
1 44 187 42 52 - - - -2 -35 7 -10 0 48 150 127 124 3 -35 7 22 32 50 208 175 125 4 -14 54 151 161 598 418 355 173
Scenario IV
1 12 114 0 10 - - - -2 -84 -107 113 123 51 379 320 0 3 -38 0 151 161 47 423 359 106 4 0 87 132 142 46 375 319 193
Variable Production Costs 1979 US $mt of Product
99 154 183 173 170 121 120 50
Appendix Table B-17 Estimated Total Expenses to Supply Plant Nutrients in Indonesia
Equilibrium Expenses 1979 US $ x 106 Subperiod N P K Total
Scenario I
1 759 240 30 1029 2 816 339 39 1194 3 990 435 51 1476 4 1194 549 57 1800
TOTAL 3759 1563 177 5499
Scenario II
1 1373 267 31 1671 2 788 356 40 1184 3 996 465 50 1511 4 1607 583 58 2248
TOTAL 4764 1671 179 6614
Scenario III
1 1362 269 31 1662 2 815 475 40 1330 3 991 806 50 1847 4 1505 1796 58 3359
TOTAL 4673 3346 179 8198
Scenario IV
1 663 274 31 968 2 815 366 40 1221 3 991 761 50 1802 4 1182 593 58 1833
TOTAL 3651 1994 179 5824
Appendix Table B-18 Estimated Total Expenses to Supply Plant Nutrients in Malaysia
Equilibrium Expenses 1979 US $ x 106
Subperiod N P K20 Total
Scenario I
1 171 48 105 324 2 165 57 129 351 3 186 63 156 405 4 207 69 183 459
TOTAL 729 237 573 1539
Scenario II
1 308 52 104 464 2 166 60 128 354 3 187 67 155 409 4 280 74 183 537
TOTAL 941 253 570 1764
Scenario III
1 306 53 104 463 2 166 80 128 374 3 187 116 155 458 4 262 227 183 672
TOTAL 921 476 570 1967
Scenario IV
1 249 46 104 399 2 167 64 128 359 3 187 70 155 412 4 206 78 183 467
TOTAL 809 258 570 1637
Appendix Table B-19 Estimated Total Expenses to Supply Plant Nutrients in the Philippines
Equilibrium Expenses 1979 US $ x 106
Subperiod N 2 K Total
Scenario I
1 339 60 36 435 2 351 69 36 456 3 420 75 39 534 4 498 81 42 621
TOTAL 1608 285 153 2046
Scenario II
1 605 66 35 706 2 351 72 37 460 3 421 80 39 540 4 670 87 41 798
TOTAL 2047 305 152 2504
Scenario III
1 602 67 35 704 2 351 96 37 484 3 420 139 39 598 4 625 266 41 932
TOTAL 1998 568 152 2718
Scenario IV
1 526 99 35 660 2 1329 0 37 1366 3 1480 0 38 1518 4 732 0 41 _773
TOTAL 5067 99 151 5317
Appendix Table B-20 Estimated Total Expenses to Supply Plant Nutrients in Thailand
Equilibrium Expenses 1979 US $ x 106
Subperiod N -P9O1 K20 Total
Scenario I
1 284 179 25 488 2 286 215 29 530 3 326 243 32 601 4 368 270 35 673
TOTAL 1264 907 121 2292
Scenario II
1 511 201 27 739 2 286 228 32 546 3 327 259 38 624 4 496 397 44 937
TOTAL 1620 1085 141 2846
Scenario III
1 508 203 27 738 2 286 305 32 623 3 326 449 38 813 4 465 882 44 1391
TOTAL 1585 1839 141 3565
Scenario IV
1 404 177 26 607 2 96 791 32 919 3 311 868 38 1217 4 534 766 44 1344
TOTAL 1345 2602 140 4087
U
-J
6IG
cc
uCu
CC
00
0 00
ILL
0 L
)
02
F-0
shyo
w
00
b -J
w
aw
w
jo
0 c
U2
U 0 (A
0shy
0 0
4~0
0
CC
d C-
CO
Du
Ll0
coC
cc-
CL
cc
IL
w0
C-
X
Z
ca0
UU
-0
olto
z
10
0
44- j
0 cc
0 E
0 C
C
00
lt 00
CL
a -j
4-
CL
i
00
cc
Ishyal
olt
-o
LLI0
Ib
l-0
LL
C
oshy
w
0-
D
=
CL
u
CL
d
CL
)
U
z
U
c2 C
Lshy
050
00 iiiiiiiiiiii
bullccdeg L
U
CD
)
a
I
O
0
0c
CL
)
0
APPENDIX C
Mathematical and Schematic Formulations of the Linear Programming Model
Mathematical Formulation of the Dynamic Linear Programming Model
Objective Function
D I T tMinimize I P TI rt I I ct bulll~l~T~~~~ d= 1 i= 1 t= 1 = I p = 1
+ (cmidt M i t) dt- (ce E i~d)
+ (cPidt Pijd ) 1 ccdt i d
X+ [m = 1 ( xi dd m~t X~y~
+ cbid t cr bull I t)]i~~mt t i~d~mt
Constraints
I 1 2 an bullF gtDN
i1 in idt ndt
for each ndt combination (n = 12N d = 12D t = 12T)
I 2 2 an bullM 5pct n bull DN
i = 1 I n idt ndt ndt
for each ndt combination (n = 12N d = 12D t = 12T)
U D P 3 -Fidt + 1 2 (T - T t )
u = I d =I p =1 idpt uipdt
+ Mid~t EEi~dyt + Pi~dt
C M 2 ac c = 1 (Si + D ) + 2 X~~~ c~~ m ~ d=1C ml
I M - ah bullX=0i = Im = 1 jm idmt 0
for each idt combination (i = 12I d = t =12D 12T)
k 0
T-1 44 xXidmt 1 C mt ltC= - id ltCAdmtt s = I l m m
for each idmt combination (i = 12I d = 12D m = 12M t = 12T)
(s = first possible time period for plant construction)
I5XbM CIEd5 1 2 cbi d t r t cr bull~I ltl~- I~ =
i = I m = 1i m t idmt t
for each dt combination (d = 12D t = 12T)
M
6 2 Cid t RA m1 mt
for each idt combination (i = 121 d = 12D t = 12T)
7 -Cidmlt + sm I gt 0il~~ mt idmt shy
for each idmt combination (i = 12 I d = 12D m = 12M t = 12T)
M T 8 2 2 i dint =1I
m=I t=l
for each id combination (i = 12I d = 12D)
9 Fidt DFidt
For each idt combination (i = 12I d = 12D t = 12T)
10 Tui dp t - CTuidpt
for each uidpt combination (u = 12U i = 12I d =12D p = 12P t = 12T)
II idt i dt 11 M ~111Mi~~ 12 E d E for each idt combination
1 E dtgt(i = 12I d 12D
13 P 5ABt =12T)
14 Sicdt =5 icdt
for each icdt combination (i 12I c = 12C d = 12D t = 12T)
15 lidmt = 0 or I for all idh
Definition of Symbols
C = the number of coproducts per material
D = the number of model regions (destinations in case of transport
activities)
I = the number of model materials (raw materials intermediates and
fertilizers)
M = the number of production technologies
N = the number of model nutrients
P = the number of model regions in case of transport activities (origins)
T = the number of model time periods
U = the number of transportation technologies
ct = unit transportation cost ($ton)
cm = unit import cost ($ton)
ce = unit export prices ($ton)
cp = byproduct unit purchase cost ($ton)
cs = unit sales price of coproduct ($ton)
cx = unit production cost ($ton)
cb = plant construction cost ($)
an = tons of nutrient per ton of fertilizer
pct = of nutrient demand that may be imported
ac = tons of material required per ton of coproduct produced
ah = tons of material required per ton of material produced
sm = maximum plant expansion capacity
DN = nutrient demand (tons)
CA = initial production capacity (tonsmodel time period)
CIE = capital available from external and internal origin
RA = tons of raw material from indigenous reserve available per model
time period
DF = tons of fertilizer demand
CT = maximum allowable volume of transports (tons)
IM = maximum tons available for import
EX = maximum volume which may be exported (tons)
AB = material available for purchase as byproduct (tons)
MC = maximum sales possible for coproduct (tons)
Tupidpyt = material interregional transport activity by transportation techshy
nology u of material i from region d to region p in time period t
Mid t = import activity - material i region d time period t Eidt = export activity - material i region d time period t
Pid = byproduct purchase activity - material i coproduct c region d
time period t
Sicd t = coproduct sales activity - material i coproduct c region d
time period t
Xid = material pruduction activity - material i region d productiont
technology m time period t
Iidmt = plant construction activity for material i region d producshy
tion technology m time period t
Fi~d~t = fertilizer supply activity - material i region d time period t
Dicdt = coproduct disposal activity - material i coproduct c region d
time period t
Cidmt = production capacity expansion activity - material i region d
production technology m time period t
Discounting Factor
t
11= (1 + p) -q withtj=1
pj = rate of interest in time period j and
qj = number of years in time period j
Capital Recovery Factor
Pt cr = N + pt )- 1 + (1 + pt t
Pt = rate of interest in time period t and
Nt = number of years expected lifetime for a plant producing material i
Major Model Components
Raw materials from
in-country sources
to world marketsPrices
Raw materials from
world markets
Interregional raw material transport
Conversion Raw materials
Intermediates
Intermediatesto A world markets
Intermediates from
world markets
Interregional intermediates transport
Conversion Intermediates Fertilizers
Fertilizers to
world markets
Fertilizers from
ivorld markets
nterregional[
fertilizer transport
Fertilizer consumption Region IA Region IPRegion IIA Country I Country II-
Data Entries (to be Projected up to the End of Planning Period)
Reserves Industrial capacities Exploitation costs
Maximum demand
Availabilities Prices
Transport capacities Transport costs
Industrial capacities Conversion coefficients
Conversion costs
Mximum demand
Frices
Availabilities Prices
Transport capacities Transport costs
Industrial capacities Conversion coefficients Conversion costs
Maximum demand Prices
Availabilities Prices
Transport capacities Transport costs
Plant nutrient needs - per region percountr
ppendix Figure C-1 Data Requirements and Schematic Representation of Model Components and Interrelationships
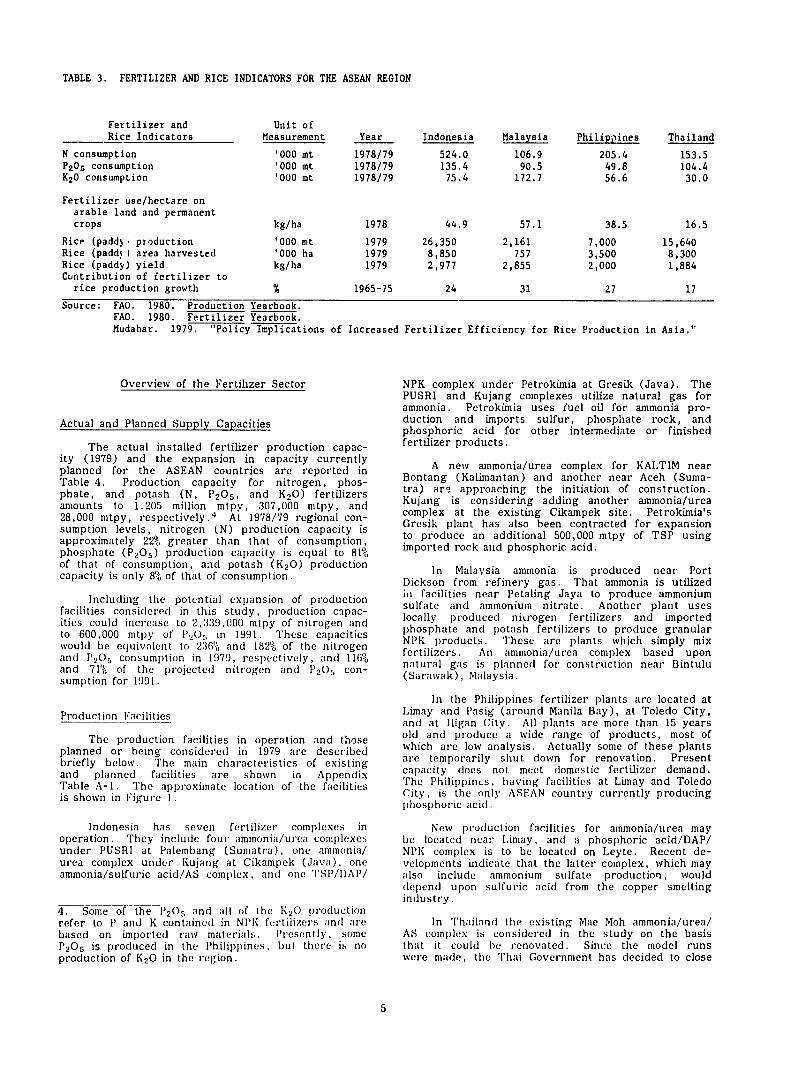

Z
w
Z
LI
--
0
gt
gt C
d_
1cr
L
C
L
~0
ILU
4shy
044
00
L0
-Jm
I-LM
IL
stable and therefore does not show any definite patterns of change
Prior to 1979 small quantities of phosphate fertil-izers were produced in thp ASEAN region in 1979 approximately 65000 mt of was produced OnlyP2 0 5the Philippines produces phosphoric acid Malaysia converts some phosphate to soluble P2 0 5 during NPK production using sulfuric acid Thailand mixes diam-monium or monoammonium phosphate with other materishyals and granulates NPK fertilizers Indonesias facility at Gresik is based on imported rock and phosphoricacid and it began producing in late 1979 This fa-cility will substantially increase the regions capacity to produce phosphate fertilizers
Although there is no production of potash in the ASEAN region small quantities of imported potash are included in NPK formulations in each of the countries
Fertilizer Imports
The imports of nitrogen in the ASEAN region in-creased from 227000 mt in 1970 to 416500 mt in 1979 (Appendix Table A-2) Indonesia exported 106000 mt and imported only 17100 mt of nitrogen during1979 On the other hand the Philippines imported 117500 mt Malaysia imported 103000 mt and Thai-land imported 178900 mt
Imports of P2 0 5 by the ASEAN group increased from 149600 mt in 1970 to 329700 mt in 1979 Of this amount Indonesia and Thailand imported 121500mt and 125000 mt respectively accounting for ap-proximately 75 of the total P2 0 5 imports of the ASEAN countries During the same year Malaysia and the Philippines impoted 75000 mt and 8200 mtrespectively
Imports of K20 by the ASEAN countries have increased from 122600 mt in 1970 to 355100 mt in 1979 During that time Thailand and the Philippineseach increased imports only by 15000 mt while im-ports of K20 into Malaysia increased by 134000 mt and into Indonesia by 69000 mt Of the total ASEAN imports of K20 in 1979 190000 mt or about 54 was made by Malaysia
Fertilizer Consumption
Annual regional consumption of nutrients for the period 1970-79 is shown in Appendix Table A-3 During this period nitrogen consumption increased from 308000 to 990000 mt P2 0 5 from 189000 to 330000 mt and K2 0 from 105000 to 335000 mt From 1970 to 1979 the consumption of nitrogen andK 2 0 increased by 920 and that of P 2 )5 by 75
The greatest increase in consumption of nitrogenand P2 0 5 occurred in Indonesia while the greatest in-crease in K2 0 consumption was in Malaysia The average annual increases in nitrogen consumption between 1970 and 1979 were 195 for Indonesia 135 for Thailand and 82 for Malaysia and the Philippines The average annual increases in con-sumption of P2 0 5 and K2 0 were also fairly high for all the countries except for the Philippines In the Philippines the 2 0 5 consumption ranged between 10000 and 50000 mtpy whereas K2 0 consumptionhas been gradually increasing from 30000 mtpy in 1970 to 56600 mtpy in 1979
Fertilizer use in the ASEAN countries on a perhectare basis is still low It ranged from 165 kgha
in Thailand to 571 kgha in Malaysia during 1978 However fertilizer use is expanding rnpidly in response to HYV use irrigation expansion favorableprice policy and various government programs Rice is the major crop in the region in terms of fertilizer use Urea is the major source of nitrogen for the rice crop P2 0 5 K2 0 and complex fertilizers are used mainly on plantation crops including rubber oil palm and cocoa
With the exception of Thailand governments are actively involved in different aspects of fertilizer production and distribution Fertilizer is distributed at the retail level by public private and cooperativeagencies with varying degrees of participation The use of fertilizer subsidies to stimulate consumption is fairly common as an instrument for the reduction of retail prices except in Thailand
Availability of Raw Materials
It is rather difficult to appraise the availabilityof raw materials that are or thst could be available within the ASEAN region for the production of fertilizers This is partly due to the fact that a demand for such raw materials with the exception of oil and gas of which the rcgion has large reserves has not really existed in the past Appendix Table A-4 contains a summary of the natural reshysources of the region relevant to the fertilizer industry
The known oil and gas reserves and their production levels are reported in Table 5 Indonesia is the leading producer of natural gas and oil in the region Natural gas production in Indonesia inshycreased from 1260 billion ft 3
ft 3 in 1973 to 8163 billion in 1979 production is expected to reach
ft 316 trillion by 1981 Reserves at their present rate of usage are sufficient to last for at least 40 years however the real life of the-reserves is unknown because gas discoveries are proceeding at a faster rate than their usage
Malaysia-Brunci is the second largest producerof natural gas in the region Production hasincreased from 51 billion ft 3 in 1974 to 3027 billion ft 3 in 1979 At the 1979 usage rate reserves would last at least 82 years Malaysian gas is also being discovered at a faster rate than it is being usedOther ASEAN countries are not currently producingnatural gas but Thailand and the Philippines are actively exploring for gas and oil Thailand has discovered significant quantities of gas in the Gulf of Thailand and plans to have on-shore delivery in 1981
Lignite is used to some exten as feedstock for power plants in Thailand It ws also used asfeedstock for fertilizer picduction until 1978 when the Mae Mob plant was closed Phosphate rock depositsin ava Peninsular Malaysia Thailand and the Philippines are considered to be too small for economic exploitation and use in the produclion of phosphatefertilizers Pyrites are now used in the Philippinesfor sulfuric acid production (Limay) Coppersmelting in the Philippines will yield byproduct sulfuric acid with potential for use in phosphoric acid production
otash deposits in northeast Thailand are largeand exploration is being expande( to determine the feasibility for commercial development Howeverbecause of insufficient economic data these potashdeposits were not considered in this study
8
TABLE 5 KNOWN OIL AND GAS RESERVES AND GAS PRODUCTION IN SOUTHEAST ASIAN COUNTRIES
Gas Production Oil Reserves Jan 1 1980 Gas Reserves Jan 1 1980 1979
a 9 3 Country i0 bbl 10_ t m i f_t 10 ft
Indonesia 9600 1315 686 24000 8163 Malaysia 2800 384 486 17000 3027a Brunei 1800 247 220 7700 Thailand 0 0 229 8000 0 Singapore 0 0 0 0 0
Philippines 25 3 0 0 0
TOTAL 14225 1949 1621 56700 11190
a Total for Malaysia and Brunei
Source International Petroleum Encyclopedia 1980
Methodology for Study The objective function of the model which is the
decision criterion for evaluating supply strategies is formulated to minimize the total cost for meeting
A dynamic linear programming model was used to projected nutrient demand for the ASEAN region over determine least cost solutions to supply the fertilizer the period 1981-92 This function includes all costs needs of the ASEAN region under different supply and revenues which will occur under different altershystrategies Four supply strategies were considered natives The components of costs and revenues are for illustrative purposes Data were collected from each ASEAN country to permit a realistic quantitative 1 Costs which include description of the existing fertilizer production a Transportation costs facilities fertilizer technology planned or considered b Import costs expansion fertilizer consumption relevant cost and c Purchase of byproducts prices d Production costs
e Plant construction costs The evaluation of supply strategies is based on 2 Revenues which include
production capacity prices and cost structure of a Exports of primary products 1979 which is the midpoint of the assumed base period b Sales of coproducts (1978-80) Four projection subperiods of 3 years each are used in the analysis This gives a planning Some of the general premises underlying the model period of 12 years (1981-92) The projected input are briefly summarized below figures and the respective resulting figures are representative for the midyear of each subperiod 1 Production and cost data for 1979 were used in (1982 1985 1988 and 19W the model These data included production
capacities by material and region possible plant Investment decisions are based on the assumption expansion investment cost raw material cost
of a real interest rate of 2 (nominal interest rate import and export prices and transportation 10 inflation rate 8) costs and routes
In general only those facilities in which the 2 The linear programming simulation uses the peshyproduction processes are more complex than simple riod 1978-80 (mid-1979) as a base and simulates mixing of ingredients were considered as fertilizer conditions for 1981-92 in four subperiods of production sites Thus if granulation accompanied 3 years each the simple mixing the facility was included as a production site Possible expansion sites were 3 All costs and prices are calculated for the middle considered only when it was known that they were year of each subperiod All costs and prices being contemplated by the respective governments are adjusted for inflation andor converted to
1979 values where necessary The breakdown of the ASEAN countries into
17 consuming regions is shown in Figure 1 This 4 Formulas used to compute discounting factors regionalization was done on the basis of information and capital recovery factors are outlined in provided by country representatives about existing Appendix C central ports transportation systems marketing areas around each central port and fertilizer consumption 5 The selection of fertilizer products is influenced patterns by the constraints which require a certain level
of domestic production Product selection is allowed among those which can be produced in
The Linear Programming Model the region except for muriate of potash which is imported
The mathematical formulation of the linear programming model used in the study is presented in 6 No specific constraints were applied to require Appendix C 5 A schematic representation of the nutrients to be supplied as specific fertilizer models major components and data required for its products In other words the demand for use are presented in Appendix Figure C-I nutrients may be supplied in the form of singleshy
nutrient NP or NPK produdts or a combination 5 Similar mathematical models are also discussed in a of these materials However several products
recently published book by Choksi Mceraus and which could be included in any least cost supply Stoutjesdijk (1980) alternative were identified
9
Model Constraints
The objective function of the linear programmingmodel described above can be minimized subject to 15constraints described below
Constraint 1 Nutrient Supplv and Demand Balance--Supply of aiiy plant nutrient in a givenregion has to be equal to or greater than demandThis constraint applies for all nutrients regions andtime periods Supply for a particular region is defined as domestic production plus imports minus exports
Constraint 2 Nutrient Imports--Nutrient importsto market regions have to be less than or equal to a predetermined share of consumption This constraint plays a major role in the creation and evaluation ofsupply strategies
Constraint 3 Materials--Raw materials needed for the manufacture of specific fertilizers must be available in adequate amounts In each region and for each time period a balance between inputs to be used and outputs to be produced under different technologies must exist
Constraint 4 Production Capacity--During thefirst time period production of any given material in any region cannot exceed actual installed capacityFor subsequent time periods production cannot exceed initial plus added capacity The time lagbetween initial investment and start of production at a new facility is fixed at 3 years
Constraint 5 Capital Availability--Capital in-vestments made in any region for plant construction cannot exceed total capital available from internal and external sources
Constraint 6 Production Cpacity Expansion-Raw Materials--The production capacity expansion that may occur in any region during any time period toproduce ary fertilizer product is restricted by the availability of raw materials froni indigenous reserves
Constraint 7 Production Capacit _ExpansionPlants--Production capacity expansion cannot exceed a technologically determined maximum size for new plants
Constraint 8 Plant Construction Activities--No more than one plant may be onstructed to poducu a given product in any given location This con-straint applies only to the construction of new plantswhich are not presently considered Itdoes not re-strict construction of planned facilities even thoughsimilar facilities may already exist in the region
Constraint 9 Fertilizer Supply and Demand Balance--This constraint is included to ensure that in any given region and for any time period the supplyof any type of fertilizer will be equal to or greaterthan demand
Constraint 10 Transportation Capacity--Inter-regional transportation of materials by different trans-portation technologies in any time period cannot exceed available transportation capacity
Constraint 11 Raw Materials Intermediates andFertilizer Im orts--This constraint restricts the quan-tity of raw materials intermediates and fertilizers which can be imported from the world market Since prices may be lower in the world market some solu-tions might include unacceptably high levels of importsif not restricted to politically acceptable levels
Constraint 12 Material Ex orts--This constraint restricts the quantity o fertilizers or other materialsthat can be exported to the world market
Constraint 13 Byproduct Purchases--The total amount of byproduct materials that can be purchasedin any region during a given time period cannot exceed what is actually available
Constraint 14 Coproduct Sales--The total amountof coproduct that can tie sold in any region during a given time period cannot exceed what is actuallyavailable
Constraint 15 Plant Construction--This integerconstraint is used to limit model solutions to construct or not to construct new plants
Of the above 15 constraints only 9 were used in the empirical estimation of the model used in thisstudy Constraints 6 10 11 12 13 and 14 were not incorporated in the model calculations either beshycause of lack of data andor they were considered itrshyrelevant for the illustration presented in this report
Fertilizer Prices
As mentioned earlier the linear programmingmodel is based upon cost minimization inder different supply strategies This means that cost and priceassumptions are very important in determining inshyvestment production and distribution patternsResulting fertilizer prices are used as a means of evaluating the effects of various restrictions uponsupply strategies
The fertilizer prices are considered as equilibshyrium prices valid under the cost assumptions and under the specific structural model assumptions Theprices are estimated by the dual solution of the linear programming model Technically they can also be called incremental costs selling price marginal costsbreak-even price or shadow prices For simplicitythey will be referred to as fertilize- prices in this report Their economic meaning is illustrated inFigure 2 Production capacities (C 1 C2 C3 andC4 ) of a region have been drawn on the x-axis beshyginning with the facility with the lowest productioncosts and then other capacities according to their inshycreasing penduction costs The y-axis representsproduction costs and fertilizer prices The curves with slope downward to the right represent averageproduction costs which in this figure are shown to decrease for each plant as its capacity use increases Regional fertilizer demand (D) is shown as a vertical line at different levels The point where the supplyand demand curves intersect determines the price level per unit of product It can be seen that ifquantity Q is needed to satisfy demand for a regionwith demand equal to D1 capacities C and areC2sufficient to supply the region with fertilizers The equilibrium price would be P11 If the demand inshycreases sufficiently capacity C3 would be necessarywhich has production costs equal to P 2 Then P 2 beshycomes the equilibrium price in the region CapacityC3 would be operating at break-even levels but capacities C1 and C 2 would realize profits which would be equal to the difference between their proshyduction costs and the equilibrium price
To simplify analysis a vertical demand curve D (drawn with different levels 1 2 and 3) was assumed This means that fertilizer demand at a certain point in time was fied and not price dependent However the necessity to bring into production facilities with highertransformation costs to satisfy demand increased the
10
C1 C2 Capacities of different production facilities in order of ferred to as scenarios I through IV and can be de-C3 C4 increasing conversion cost scribed as follows
D D2 1D3 Three different price inelastic demand curves
PI P2 3 Fertilizer (equilibrium) prices 1At three supplydemand
21 Equilibrium quantitier situations203 J
incaseof demand level Di1d Dfertilizer
a b cd conversion cost of facility with capacity 1
d c e f contribution to profits of facility with capacity 1 b g he conversion cost of facility with capacity 2
af=Pl = equilibrium price ag = 0I = production quantity
D 1 D2 DScenario
I II - +___-------
3 I I
I I c L_ ---- IP2- - - - - - -
I i I 0 P1-- a hI
U I I
I I I I
c I I
gt 9_ _ 2 Ql3
cC c 2 c 3 C4
QUANTITIES
Figure 2 Illustration of Fertilizer Price Determination
equilibrium prices The most expensive source of fer-tilizers a region must use establishes the price level for that r-i ion
To minhize total fertilizer supply costs the model considers world market supply sources and re-sorts to imports if the following two conditions are met (1) world market prices are lower than regional production costs and (2) restrictions imposed in the
formulation of the model allow imports to be made If these two conditions are not met imports will not occur Therefore it is easy to predict that with supply strategies which allow unlimited imports from the world market regional prices will be lower than or equal to world market prices Since imports are allowed domestic production may be lower than do-mestic capacity
Scenario I--Each country has the choice of meeting its fertilizer needs from any source They
can produce it locally at their existing facilities exshy
pand those facilities build planned facilities or buy from other ASEAN countries and world
markets Countries are free to select least cost alshyternatives
supply alshyternative for the ASEAN region It will serve as a basis for possible cooperation agreements among
ASEAN countries Agreements so based will guaranshytee an adequate supply of fertilizers on a regional basis at the lowest possible cost
This scenario will provide a least cost
Il--The ASEAN countries under coshy
operative agreements are supposed to produce 100 of their nitrogen needs This scenario prohibits inshyports of nitrogen fertilizers from outside the ASEAN region during the planning period except for subshyperiod 1 where only 95 self-sufficiency is possible with existing facilities However countries can
secure their phosphate and potash fertilizer needs from any least cost sources
Comparison of results for this scenario with those for scenario I will permit estimation of cost due to cooperation to attain 100 self-sufficiency in supply
of nitrogen fertilizers
Scenario IlI-This scenario is the same as sceshynario II with respect to nitrogen fertilizers An adshy
ditional restriction which specifies that ASEAN countries will cooperate to attain a 50 regional selfshysufficiency for production of phosphate fertilizers is
added As in scenarios I and II each country can secure its potash needs from any least cost sources
Comparison of results for this scenario with reshy
sults for scenarios I and II will permit estimation of cost due to cooperation to attain 100 regional selfshysufficiency in production of nitrogen fertilizers and 50 regional self-sufficiency in phosphate fertilshyizers
Scenario IV--It can be defined as the most probshyable production path for the ASEAN countries For this scenario each country produces what it can of N and P with existing and firmly planned facilities and secures the rest from least cost sources These least cost sources can be other ASEAN countries or the world market
It is unreasonable to expect that all the conshyditions for perfect competition could be achieved For this scenario each countrys needs are coy-Furthermore it may be too optimistic to expect that ered as far as possible by domestic sources If
the prevailing intraregional prices could be re- needed for in-country use domestic production may
presented exactly by the fertilizer prices determined not be lower than 95 of its capacity and if proshy
by the model These prices are an approximation of duction capacity allows not lower than 95 of the that the production andthe actual equilibrium prices which might occur if the fertilizer needs provided
handling system of raw materials and intermediateassumed conditions prevail However these prices do provide information to possibly cooperating countries products are adequate with respect to the expected long-term price strucshytures and trends This scenario will permit evaluation of a situation
where no cooperation among ASEAN countries exists Instead each one of them tries to satisfy its needs
Fertilizer Supply Strategies with its own production capacity and imports the rest from least cost sources Each country will use its
Four strategies representing different supply plants to its own advantage and secure some degree situations were analyzed These strategies are re- of self-sufficiency
11
Input Data for Model Estimation items and for support facilities located outside theplant site boundary were not included
The input data used in this study deal with several aspects of the fertilizer sector This includes fertilizer demand projections production coefficientscapital costs production conversion costs import and export prices and transportation costs and routes
Fertilizer Demand Projections
As food demand expands fertilizer demand mayincrease even at a greater rate This is because (1) the new land brought under cultivation will be of poor quality and thus will need large amounts of fer-tilizer to improve its fertility and (2) the existingland will need more fertilizer to maintain fertility as cropping intensity goes up and new crop varieties with large nutrient demand are grown
The fertilizer nutrient demand by country for the 1979-92 period was estimated using historical timeseries analyses For all countries the base period for these projections was time series data set for 14 yearsfrom 1964 through 1977 Different types of demand functions were estimated and for each country the results of the function which gave the best fit were chosen These functions were then used to make de-mand projections for the 1981-92 period However inthe case of Thailand demand projections were adjustedbased on an in-country study conducted by IFDC in early 1979 Since the demand projections are based on historical data when fertilizer consumption was rather low the projections may reflect under-estimates
The breakdown of nutrient consumption by marketing regions for each country (except Thaihandwhere the country was not divided into market regions) was based partly on information comingdirectly from representatives of the respectivecountries and partly on information coming from other knowledgeable sources With the exception of the Philippines this breakdown was held constant over the whole projection period For the Philippines slightdifferences in the regional growth rates in fertilizer consumption were used These growth rates weredetermined on the basis of information provided bycountry representatives
The estimates for aggregate and regional nutri-ent consumption forecasts for each of the four 3-yearsubperiods are reported in Appendix Table A-5 These estimates for fertilizer demand were used as an input in evaluating alternative supply strategies The past and projected fertilizer consumption by countries is shown in Figure 3
Production Coefficients
Production coefficients defining the quantities of raw materials and intermediates required to producefertilizer products selected for this study are devel-oped in the Appendix Tables A-6 and A-7
Capital Cost
The investment cost figures for fertilizer pro-duction facilities under construction or in the planningstage are based on IFDC estimates These estimates are presented in Appendix Table A-1 When available cost estimate data were considered for spe-cific projects Specific allowances for infrastructure
The investment estimates are on a 1979 cost basis including interest during construction (10year) A 4-year construction schedule with a disshybursement rate of 10 30 40 and 20 for fixed capital funds is used No cost escalation during conshystruction is included Since the capital costs normalshyly overrun the actual capital costs may be higher than the estimates used in this study
Production Conversion Costs
Conversion cost figures used for the calculations are IFDC estimates These cost estimates are alsopresented in Appendix Table A-1 They are based on the assumption of a 90 capacity utilization rate for all plants except the following Indonesian plants which are based on the assumption of 95 PUSRI IIIII and IV Aceh Bontang and Cikampek Annual capacity is defined as 330 days of operation at dailydesign capacity Thus a 90 capacity utilization is equivalent to 297 (330 x 09) days of operation at daily design capacity Raw material costs interest charges on capital and depreciation are not included in conversion cost estimates but are accounted for separately
For natural gas feedstock-based plants theprice of natural gas for steam and electricity genershyation is the same as for feedstock Cost of fuel oil for steam and electricity generation and other uses was assumed to be world market price Cost of purshychased electricity is assumed to be US $0030kWh Sulfuric acid plants are credited for steam export at US $10mt of steam Process plants using the exportsteam are charged at US $10mt of steam
Annual cost of maintenance materials is 3 and insurance and taxes are 1 of the estimated fixed inshyvestment (1979 cost basis) excluding interest duringconstruction Administration expenses and generaloverhead are 150 of the estimated cost of wagessalaries and benefits
Import and Export Prices
Depending on the respective scenario formushylation the economic environment as reflected by the world markets for fertilizers intermediates and rawmaterials can greatly influence the results of the opshytimizations The assumed cif prices for bulk mashyterial gas and liquids are reported in Table 6 for mid-1979 Prices for bulk materials and liquid were estimated for seaborne transported materials from themain supplying areas They are fob prices plus sea transport costs and port handling costs at the receiving ports
Prices for natural gas are accounting prices which were provided by government officials from each country They were assumed to remain constant throughout the planning period except for Malaysiawhere they were allowed to increase at a 5 annual rate
Prices for fertilizer exports from the ASEAN region to the world markets are assumed to be 20lower than the import prices for corresponding fershytilizer This reflects in general the transportcharges to other main consuming regions in the world Export potential has been evaluated for thefollowing products urea(1) which could be deshylivered from large plants (existing or expansion) in Indonesia Malaysia and the Philippines (2) ammonia
12
--
12 3- THAILAND
11 INDONESIA -- 2S
- HISTORICAL CONSUMPTION 2N110 PROJECTIONS_
9 0
MALAYSIA 8
z7 2shy
0 6
5- Z 0
0 C I-- PHILIPPINES
4 z4 P2 0 5
I-3 D 3 z
2 12-~~
1 K20 1
-
N - -
P2 0 5 -shy -
K2__
K20shy
-shy
p2 0 5
N -
-
P2 05
- 1(20 0 0 1 11 1 l it 1 I
1965 1970 1975 1980 1985 1990 1965 1970 1975 1980 1985 1990
YEAR YEAR
Figure 3 Apparent Historical Nutrientand Projected Consumption forASEAN Countries
where excess capacity is available (Bontang and Bintulu) and (3) DAP from Leyte
Transportation Costs
Transport activities refer to movement of fershytilizer from producing locations to receiving ports in consuming regions and transport of intermediates between production sites Three types of materials are transported These are (1) solid materials (2) ammonia and (3) phosphoric acid Transportation of solid fertilizers is much more voluminous than the transportation of ammonia or of phosphoric acid Due to the geographic situation of the ASEAN countries only seaborne transportation is considered
In most cases bulk terminal or bagging facilities exist at the receiving central ports of the selected market regions Most of the central ports can be reached by ships that are normally used for the in-terisland transportation within the region
The bulk transport freight rates refer to the middle of 1979 For ammonia and especially for phosphoric acid it is difficult to obtain reasonable
information about the actual freight terms because freight rates (long-term contracts) are normally not published In the case of large-volume contracts freight rates are often contracted in conjunction with fob or as part of cif prices Therefore they do not appear explicitly in market price scans
The freight rates for ammonia and phosphoric acid are based upon personal communications with shipping agents and rates fDr bulk materials are based upon published rates reported weekly in Green Markets and Fertilizer International
For the calculatiors of transportation costs the following equations have been used
Bulk material C = 8 + (0005 x M)
Ammonia C = 10 + (0005 x M) Phosphoric acid C = 7 + (0006 x M) Where C = transport costs in US dollars per
ton of product (mid-1979) M= distance in nautical miles
Transportation rates are for 1979 These rates are allowed to increase at an annual rate of 8 throughout the planning period
13
TABLE 6 PRICES FOR FINISHED FERTILIZERS INTER-MEDIATES AND NtITURAL GAS DURING 1979
Material aImported Materialmdnonia
Ammonium chloride
Ammonium sulfate DAP
MAP (powdered)Fuel oilNaphtha
NPK 15-15-15 Phosphoric acid (100 P205) 60 Potassium chloride Rock phosphate 60 BPL Sulfur TSP Urea
Natural Gash Indonesia Bontang amp Cikampek
Aceh amp Palembang Thailand Sattahip Mp ysia Bintulu
Prices (US $mt)19000 9000
11800 24300
22500 15000 26000
14700 34500 11400 6400 9800 18700 20000
(US $1000 ft) 085 060 075 070
a Prices are estimated mid-1979 cif basis including port haodling cost at receiving port b Refers to accounting prices
Empirical Results for Alternative Supply Strategies
Selected empirical results for the specified four fertilizer scenarios are discussed with respect to fer-tilizer production patterns fertilizer supply patterns production site fertilizer prices and fertilizer pricesat the market regions Various assumptions described above need to be kept in mind before interpreting these model results The results may vary under different assumptions Consequently these result serve only as broad guideposts for the fertilizer seL-tor planners
Fertilizer Production Patterns
The optimum levels of domestic and regional production for nitrogen and P20 5 for each subperiod and for the four scenarios are reported in Table 7 The optimum production patterns for each productionfacility in each study country are provided in Appendix Tables B-1 through B-4
In general regional production of nitrogen and phosphate fertilizers increases for each subperiod In scenario I production increased from subperiod 1 to subperiod 2 but stayed at that level for the remaining two subperiods In scenarios II and IIl regional production increased throughout the planning period For scenario IV production increased duringthe first three subperiods and declined slightly during the last subperiod
Total regional production of nitrogen and phosphate fertilizers by subperiod is the lowest for scenario I and the highest for scenario IV This reflects the crucial role played by constraints on imports and on regional production in the respective scenarios
Fertilizer production at different plants in Indonesia is reported in Appendix Table B-1 It shows that all existing urea plants operate at max-imum capacity for all scenarios and for all subperiods
The only exception to this is the plant at Cikampekwhich operates at 98 capacity The Aceh urea plant operates at maximum capacity in all scenarios after it comes on stream The same applies to the Bontang urea plant with the exception of scenario IV where it operates at 88 capacity The DAP unit of theGresik plant operates at maximum capacity for all scenarios and for all time periods The TSP unit at
Gresik operates at maximum capacity for all scenarios and for alltime periods except for subperiod 1 of scenario I
The fertilizer production at different plants in Malaysia is reported in Appendix Table B-2 The expansion site for urea production at Bintulu operates at maximum capacity in all sctnarios after it is completed and starts production in subperiod 2 TheNPK unit at Petaling Jaya operates at maximum capacity for all scenarios and subperiods The AS unit at this complex does not operate at all in scenario I and operates only during the first subperiod in the other three scenarios
The fertilizer production at different plants in the Philippines is reoorted in Appendix Table B-3 It shows that the old urea plant at Limay is the onlyold plant that operates at maximum capacity for allscenarios and during all subperiods The DAP expansion site at Leyte operates at maximum capacity after completion in subperiod 2 for scenarios I It and I11 However the DAP production is less than maximum capacity in scenario IV The new urea plantand the NPK plant at limay and the AS plants at Pasig Toledo City and Iligan City operate at full capacity during the last three subperiods of scenario IV For the other scenarios these plants operate sporadically or not at all The AS plants usually operate only during the first subperiod before expansion projects could be completed
The fertilizer production at different plants in Thailand is reported in Appendix Table B-4 It shows that the urea unit at Sattahip operates at maximum capacity in scenarios I II and Ill after it is constructed in subperiod 1 In scenario IV however this unit operates at maximum capacity only during the last two subperiods The Mae Moh plantoperates at full capacity during all subperiods for scenarios I It and Ill and sporadically for scenario IV It is interesting to note that in scenario only the urea plants at Mae Moh and the expansion at Sattahip operate The NPK production units operate only in scenarios with restrictions
The Mae Moh urea facility in Thailand produces at full capacity during the entire planning period for all scenarios except IV The AS plant seldom operates However recently all the Mae Mob facilities have been closed for technical reasons It was assumed for modeling purposes that the facilities would be renovated but those plans have apparently now been abandoned Since the total Mae Moh capacity was very low the permanent closing of the Mae Moh plants has little effect upon the results of this analysis The mixing-granulation plant near Bangkok was simulated to operate only occasionally in scenario It and to operate with more or less full capacity utilization in scenarios III and IV At Sattahip the production of NP and NPK fertilizers is feasible only under the conditions of scenario IV MAP is not produced as an intermediate for NP fertilizer at Bangkok
Fertilizer Supply Patterns
The general sources of supply of plant nutrients as finished fertilizers to consuming regions by
14
TABLE 7 ANNUAL PRODUCI1ON OF NUTRIENTS UNDER ALTERNATIVE SUPPLY SCENARIOS MODEL RESULTS
Nutrient Production Thousand mtpy Country Scenario I Region N
Indonesia 94124 7084 Ma1ILsia 1275 1275 Philippines 4016 0 Thailand 1058 0
TOTAL 100473 8359
Indonesia 142700 16974 Malaysia 21791 1275 Philippines 6320 9568 Thailand 12006 0
TOTAL 182817 27817
Indonesia 142700 16974 Malaysia 21791 1275 Philippines 6320 9568 Thailand 12006 0
TOTAL 182817 27817
Indonesia 142700 16974 Malaysia 21791 1275 Philippines 6320 9568 Thailand 12006 -
TOTAL 182817 27817
Scenario II N P20
Subperiod 1 (1981-83)
97139 17465 2295 1275 6770 1275 9058 7200
115262 27214
Subperiod 2 (1984-86)
142700 16974 21791 1275 6320 9568 12006 0
182817 27817
Subperiod 3 (1987-89)
142700 21791 6320 12006
182817
Subperiod
142700 21791 21462 15646
201599
subperiods and scenarios in each study country are reported in Appendix Tables 11-5 through B-8 These results are summarized in Tables 8 and 9 A graphic illustration of the distribution of major raw materials and intermediates is shown in Appendix Figures B-1 through B-4 and are summarized in Table 10 Domestic production of nitrogen accounts for 51-61 62-65 60)-69 and 62-96 of ASEAN demand for scenarios 1 I III and IV respectively during the planning periods Domestic production of P 2 0 5 P2 0 5accounts for 29-11 of demand for sce-nario I 34-18 for scenario II 35-16 for sce-nario Ill and 51-81 for scenario IV Thus while increasingly restrictive conditions on nitrogen pro-
duction requirements increase the proportion of ASEAN demand which is produced in the country of use only the most restrictive scenario has a signishyficant influence on P2 0 5 production within the countries of use
For scenarios I II and III the region obtains about 30-35 of its nitrogen supply and less than 15 of its P 2 0 5 supply from the other ASEAN countries Since no cooperative agreements among ASEAN countries exist in scenario IV the prices for such trade are world market prices and fertilizers obtained from other ASEAN countries are reported as obtained from the world market Generally less than 10 of N is obtained from outside the ASEAN region for scenarios I I1 and Ill However fvr scenario IV Malaysia the Philippines and lhvi Id obtain 85 80 and 60 respectively of tiir nitrogen from the world market (other ASEAN countries and outside the ASEAN region) during subperiod 1 Thereafter only the Philippines imports
16974 1275 9568 0
27817
4 (1990-92)
16974 1275 9568 3640
31457
significant
Scenario III Scenario IV N N P2P25
97139 17649 94124 16974 2295 1275 2015 1275 6770 1274 5182 826 9058 7200 8898 7040
115262 27398 110219 26115
142700 16974 139802 16974 21791 1275 21791 1275 6320 9568 25090 10904 13946 1940 25631 18813
184757 29757 212314 47966
143375 17649 140087 17255 21791 1275 21791 1275 6620 9848 24280 8834 19206 7200 29113 21220
190972 35972 215271 48584
143375 17649 139802 16974 21791 1275 21791 1275 14876 13432 24064 8282 21560 10303 29385 20060
201602 42659 215042 46591
quantities of nitrogen On the other hand generally more than 50 of phosphate (P 2 0 5 ) fertilizer is obtained from for scenarios 1 II and scenario IV All potash ASEAN region but some within a country
As reported in Table fertilizers from the world
outside the ASEAN region III and from 27 to 46 for originates from outside the
is transformed into NPKs
10 the imports of finished market primarily consist of
KCI AS and MAP Inter-ASEAN trade in fertilizers is dominated by urea which is supplied by the Indonesian and Malaysian plants Small quantities of TSP and DAP are traded within the ASEAN region Low-analysis fertilizers are usually not transported between countries
Production capacity for nitrogen fertilizers in Indonesia is well in excess of domestic demand throughout the planning period Nitrogen production capacity in Malaysia is less than demand in subshyperiod 1 but it exceeds demand through the reshymainder of the planning period Nitrogen production capacity in the Philippines is less than demand throughout the planning period In Thailand nishytrogen production capacity is less than demand in subperiod 1 but it exceeds demand until the end of the planning period when capacity and demand are in balance
Exports (outside the ASEAN region) of urea and ammonia are shown in Table 11 Export potential to world markets decreases over time during the planning period The greatest export potential exists for scenario IV but as mentioned earlier sales to
15
TABLE 8 SOURCES OF N SUPPLY AS FINISHED FERTILIZERS TO ASEAN MARKET REGIONS MODEL RESULTS
Supply Sources as Percent of Projected DemandIn-Country_ Other ASEAN Countries Non-ASEAN CountriesCountry Scenario Scenario Scenario
of Use I II I1 IV
Indonesia 94 95 94 100 Malaysia 10 17 12 15 Philippines 15 26 26 20 Thailand 5 41 41 40
ASEAN 51 62 60 62
Indonesia 93 99 100 100 Malaysia 19 19 19 100 Philippines 16 16 12 80 Thailand 47 47 54 100
ASEAN 61 64 65 96
Indonesia 91 100 99 100 Malaysia 18 18 19 100 Philippines 14 14 11 65 Thailand 41 41 66 100 ASEAN 59 63 67 92
Indonesia 89 99 98 100 Malaysia 18 18 18 100 Philippines 12 16 25 55 Thailand 37 48 66 -90
ASEAN 57 65 69 89
other ASEAN countries are classified as world market exports in this scenario The next greatest exportpotential exists for scenario I The export potential is at its lowest for scenarios II and I11
Production Site Prices
The estimated fertilizer prices for different products at each plant within countries are reportedin Appendix Tables B-9 through B-12 In generalthese tables show that fertilizer prices increase as the scenarios become more restrictive and limits are set on the level of imports andor domestic productionWith few exceptions scenario I has the lowest pricesfor all products and for all scenarios In some casesprices for subperiods 2 3 and 4 are lower than prices in subperiod 1 mainly because of a decline in production costs as new facilities come on stream
In scenarios 1I and III which require nitrogenself-sufficiency prices for nitrogen fertilizer duringsubperiod 1 are influenced by high production from existing facilities During subperiod 2 and 3 pricesdecrease slightly because of lower production costs at new plants For subperiod 4 when ASEAN demandapproaches potential fertilizer prices increase
Scenarios I and II exhibit the lowest prices for phosphate fertilizers Since there are no constraints on phosphate fertilizer production in the region and imports can take place prices are leveled with world market prices Scenario III in which 50 of the total phosphate (P 2 0 5 ) fertilizer requirement is to be pro-
IIF 111 -1 V I II III IV
Subperiod 1 (1981-83)
0 0 1 0 6 5 5 0 82 78 87 0 8 5 1 85 57 69 69 0 28 5 5 80 66 55
33 33
Subperiod 2 (1984-86) 1 1
74 81 84 84 25 53
31 36
Subperiod 3 (1987-89)
1 0 74 82 86 86 30 59
31 37
Subperiod 4 (1990-92) 1
74 88 35
1 82 84 52
32 35
55 0 29 5 5 60
34 0 15 5 5 38
0 0 5 0 0 0 81 0 7 0 0 0 88 0 0 0 0 20 46 0 29 0 0 0
35 0 8 0 0 4
1 0 8 0 0 0 81 0 8 0 0 0 89 0 0 0 0 35 34 0 29 0 0 0
33 0 10 0 0 8
2 0 10 0 0 0 82 0 8 0 0 0 75 0 0 0 0 45 34 0 28 0 0 10
31 0 11 0 0 11
duced domestically has higher prices especially for subperiod I when less efficient production units must come on stream to meet the requirements
The fertilizer prices calculated for scenario IV vary widely for all products For Indonesia and Malaysia fertilizer prices for this scenario are sometimes lower than for other scenarios 7his is theresult of excess production above domestic requirements so that in-country equilibrium prices are lowered by export prices to world markets For the Philippines and Thailand the fertilizer prices are generally high because they are influenced by the respective in-corntry high production cost strucshylures In-country capacities must be used as far as possible even to th point of using inefficient plants In several cases prices reflect that domestic production determined inefficient plants could other words the cost dependent on the world reflected by the price high
Market Region Prices
by forcing the use of existing be extremely uneconomic In
of avoiding the risk by being market for fertilizer supply is level which could be very
The weighted average prices for nitrogen and P205 in each consuming country are shown in Table 12 These prices can be considered as approximations for the nutrient prices to be expectedunder the different scenario assumptions Theyinclude the cost of transportation to central points in market regions but do not include transportation costs from central points to farmers
16
IV
TABLE 9 SOURCES OF PHOSPHATE (P2Os) SUPPLY AS FINISHED FERTILIZERS TO ASEAN MARKET REGIONS MODEL RESULTS
Supply Sources as Percent of Projected Demand In-Country Other ASEAN Countries Non-ASEAN Countries
Country -Scenario Scenario -- Scenario of Use I II III IV I II III IV I II III
ubpeiod 1 (181-83)
Indonesia 57 62 61 77 0 0 3 0 43 38 36 23 Malaysia 30 30 14 30 0 26 35 0 70 44 51 70 Philippines 0 24 24 15 0 9 27 0 100 67 49 85 Thailand 0 44 44 42 0 13 6 0 100 43 50 58
ASEAN 29 48 46 5L 0 8 10 0 71 44 44 46
Subperiod 2 (1984-86)
Indonesia 57 57 50 57 9 9 0 0 34 34 50 43 Malaysia 26 26 26 26 16 22 24 0 58 52 50 74 Philippines 100 100 50 0 0 0 0 0 0 50 0179a Thailand 0 0 10 100 0 0 40 0 100 100 50 0
ASEAN 41 41 35 81 6 6 15 0 53 53 50 27
Subperiod 3 (1987-89)
Indonesia 45 45 46 45 5 5 4 0 50 50 50 55 Malaysia 24 24 24 24 12 12 26 0 64 64 50 76 Philippines 100 100 50 0 0 0 0 0 0 5013 3a U Thailand 0 0 34 100 0 0 16 0 100 100 50 0
ASEAN 35 35 41 68 4 4 9 0 61 61 50 35
Subperiod 4 (1990-92)
Indonesia 35 35 36 35 3 3 14 0 62 62 50 65 Malaysia 21 2i 21 21 11 11 29 0 67 67 50 79 Philippines 100 100 50 114 0 0 1 0 0 0 49 0 Thailand 0 15 44 85 0 0 6 0 100 85 50 15
ASEAN 30 34 38 55 2 3 12 0 67 63 50 46
a In these cases the Philippines is oversupplied with P205 because domestic production of DAP and NPK products was used to meet the N requirement
TABLE 10 DISTRIBUTION OF PRINCIPAL RAW MAIFRIALS AND INTERMEDIATES MODEL RESULTS
Raw Material and Intermediates for Scenario To From I II III IV
Gresik World market FO PR FO PR PA FO PR PA KCI FO PR PA Limay PA PA
Petaling World market PR KCI PR KCI PR KCI PR KCl Jaya Bintulu AA AA AA
Limay World market PR AS PR AS FO PR KCI FO FO PR AS KC1
Leyte World market PA PR PR AA PR PR AA Bintulu AA AA Limay AA PA AA
Bangkok World market AC MAP AC MAP AC MAP
Sattahip World market PR SU KCl
a FO = fuel oil SU = sulfur PR = phosphate rock PA = phosphoric acid AA = ammonia AS ammonium sulfate AC = ammonium chloride MAP = monoammonium phosphate KCI = potassium chloride
17
TABLE 11 ANNUAL EXPORTS TO WORLD MARKETS OF UREA AND AMMONIA MODEL RESULTS
Exports Thousand Metric Tons of ProductYearPalembang Aceh BontangSubperiod Urea Urea Bintulu Urea Ammonia Urea Ammonia
Scenario I 1 2 3 4
0 644 679 0
0 386 359 78
0 39 0 0
0 150 150 150
0 0 0 0
0 10 10 10
Scenario II 1 2 3 4
0 438 0 0
0 362 213 0
0 0 0 0
0 150 150 141
0 0 0 0
0 10 10 0
Scenario III 1 2 3 4
0 476 52 0
0 367 334 0
0 0 0 0
0 150 150 128
0 0 0 0
0 10 3 0
Scenario IV 1 2 3 4
750 1015 828 488
0 367 333 298
0 115 0 0
0 150 150 150
0 145 106 69
0 13 13 13
The prices of nitrogen and P2 0 5 indicate thedirection in which the scenario-specific supplystrategies influence the levelprice of plant nutrients In general the lowet prices can be found in the unrestricted scenario I throughout the planningperiod In this scenario prices are influenced bythe world market prices or by the in-countryproduction costs depending on the relationshipbetween them and on the potentially available capacities
Scenarios II and III have relatively high nitrogenprices during subperiod 1 when the old nitrogenshyproducing facilities must be used and before new plants come on stream Scenario III shows veryhigh P2 0 5 prices during subperiod 4 This is be-cause old NPK plants with high production costs are required to operate to meet 50 of the P205 con-sumption imposed as a constraint on the supply system
Scenario IV results are highly influenced by the country-specific relative needs someIn casesespecially in Thailand the prices of P2 05 are veryhigh This indicates a situation in which NP fershytilizers are produced at old and relatively ineffi-cient plants
For scenario IV in the Philippines the P2 0 5prices for subperiods 2 3 and 4 are close to zero This is an indication that the fertilizer type structuredoes not fit the nutrient demand structure Specif-ically the supply of nitrogen is partially satisfied byDAP which esults in a surplus of P2O5 coming into the Philippines consuming regions Since the urea plants are operating at maximum capacity the onlyother alternative to satisfy nitrogen demand from do-mestic production is to produce more DAP HoweverDAP is not an adequate source of nitrogen since itsP2 0 5 content is much higher than its nitrogen content
This apparent problem of high nitrogen prices andlow P2 0 5 prices can be corrected by calculatingweighted average nutrient price using nutrient conshytents as weights
Economic Evaluation of Alternative SueSupply Strategies
The economic implications of alternative fertilizer supply strategies are discussd in terms of capitalrequirements variable production costs contribution to profits return on investments and total costs ofsupply strategies As mentioned earlier however all figures are presented in 1979 constant US dollars The derived costs and returns taken collectivelyreflect the relative economic advantage of one supplystrategy over the other
Capital Requirements
Capital requirements are discussed in terms ofinvestment costs for facilities to be constructed during the planning period In Indonesia andMalaysia all urea plants which were considered as potential new ftcilities are constructed duringsubperiod I in all scenarios and start production insubperiod 2 The same applies for the planned DAP plant in the Philippines and for the tentative ureafacility at Sattahip in Thailand The planned urea plant at Limay operates only in subperiod 4 of scenarios II and III and subperiods 2-4 ofscenario IV The NPK plant at Sattahip does not operate at all in scenarios I and I very little insubperiod 4 of scenario ill and at less than fullcapacity in subperiods L-4 in scenario IV
18
TABLE 12 WEIGHTED AVERAGE PRICES FOR NUTRIENTS BY COUNTRY MODEL RESULTS
a mr
Average Prices 1979 US
Indonesia Malaysia Philippines Thailand
Subperiod N PI00 N P__ N P 0 N P205
Scenario I
1 425 362 426 364 434 355 4-7 361
2 368 381 367 381 373 370 372 382
3 369 385 368 385 374 374 373 382 4 374 381 373 383 380 371 376 381
Scenario II
1 768 401 767 404 776 402 768 407
2 356 403 367 403 373 393 372 405
3 371 406 369 406 375 396 374 407 4 503 405 502 406 510 396 507 406
Scenario III
1 762 404 762 409 772 707 763 411
2 368 535 367 536 373 526 372 540
3 369 703 368 703 374 691 373 706
4 471 t247 470 1242 476 1214 475 1246
Scenario IV
1 371 412 619 359 674 603 606 358 2 368 412 368 424 1411 0 125 1403
3 369 664 369 426 1319 2 356 1364
4 370 412 369 426 1318 2 546 1082
a Price for K20 is always US $190 (1979) in each market region
If all potentially planned facilities are realized Philippines these costs for urea are US $112-$116mt capital requirements are US $588 million for at both the existing and new plants at Limay Indonesia US $270 million for Malaysia US $503 million for the Philippines and US $505 million for The estimated variable production costs for AS Thailand This results in a total of US $1866 million in the Philippines range from US $78mt at Toledo as capital required for investment to establish the City to US $127mt at Iligan City Variable proshynew fertilizer facilities in the ASEAN region duction cost of NPK is estimated to be US $185mt
in the Philippines US $175mt in Indonesia and US $121mt in Malaysia The costs for DAP are
Variable Production Costs US $229mt in the Philippines and US $224mt in Indonesia The estimated variable production cost of
Variable production costs at existing facilities TSP is US $157mt in Indonesia At the mixing are equal to raw material costs plus conversion costs granulation plant in Thailand the estimated cost In the case of new facilities however the investment for 20-20-0 varies from US $173 to US $183mt costs per unit of output are also added Variable Variable production costs for the NP and NPK fershyproduction costs for a given fertilizer from a tilizers at Sattahip were equal to US $170mt for specified plant are constant in terms of 1979 US MAP US $121mt for 25-34-0 and US $120mt for dollars throughout the planning period and for all 22-29-7 respectively scenarios Natural gas prices were assumed to remain nominally constant at 1979 levels for all countries except Malaysia where an annual increase of 5was Contribution to Profits assumed These estimates were made on the basis of information provided by country representatives in The contribution to profits was calculated by 1978 This results in declining 1979 present values subtracting the variable production cost from the for natural gas and in declining variable production fertilizer price at the production site Since prices costs as indicated in the bottom line of Appendix are toed to estimate contributions to profits the Tables B-13 through B-16 The highest cost is for estimates are valid only under conditions of economic zubperiod 1 and the lowest cost is for subperiod I equilibrium The accuracy of the estimates depends Costs of other raw materials are assumed to be the to a large degree upon the deviation of prices from world market prices and were presented earlier in real prices Thus they only indicate a potential for Table 6 the contribution to profits The estimated contribushy
tions are reported in Appendix Tables B-13 through In Indonesia variable production cost for urea B-16
ranges from US $69 to US $72 at Palembang Unit I from US $47 to US $50 at Palembang Unit II and from Negative values on these tables indicate that US $44 to US $47 at Palembang Unit Ill and IV The production costs exceed the estimated fertilizer price estimated variable costs for urea in Malaysia and Since prices are determined based on production Thailand are also within this range but in the costs all products being produced have variable
19
costs equal to or less than the price but never higher Negative values are shown to indicate the magnitude of financial loss on a per-ton basis ifproduction occurs at those places Since the objec-tive is to minimize costs those production facilities which contribute the greatest amount to profits are selected first for fertilizer production
The results reported in these tables indicate that in general the urea facilities of the region are highly economical especially those located in Indonesia Among the possible new urea production sites Aceh Bontang Bintulu and Sattahip contribshyute around ITS $100mt of urea toward profits The new facility at timay contfrihutes enough profit to justify construction only in scenario IV and sub-period 4 of scenarios 11and Ill
On the other hand the uncomletitive position of ammonium sulfate and NPNI1K is shown for nearly all cases Some exceptions occur during suhl)riod I with its high prices The TSproduction facility at Gresik is in a rather good position lDiammoniui-phosphate production at a possible plant at 1Iimaygives a low contribution to profit Ani exceptionis found in the case of Thailand at Sattahip Ihe whole multinutrient and urea complex seems to le economical only in scenario IV and in subperiod It of scenario Ill In the remaining scenarios onlythe urea facility of this plant seems economical
Return on Investment
The return on investment (1101) is calculated bydividing the plant specific total contribe ion to profits(product specific contribution to profit per ton ilimes tons produced) by the initial investment The 11O1 is used mainly for comparisons of different investment It reflects the rate of return on an investment that can be achieved under equilibrium conditions
On the basis of the possible contribution to profits and considering the investment to he made for each new plant an assessment of the ROI was made fable 13 shows ROI figures for plants that are under construction and for potential new plants which are considered
The figures indicate that the potential urea facilities in Indonesia and Malaysia have a high RO1 With respect to relative profitability these facilities appear to have economic advantage over the urea and DAP facilitisthat re planned to be built near Limayand on Leyte in he Philippines lurthermore the tentative faci~ties at Sattahip also show itpositiveROI However the ROI is valid only for the ammonia--u ea piant except for scenario IV and subperiol of scenario Ill when the NP and NPK fa lities are also built and operated
The urea plant at Limay has the highest ROI in scenario IV This is due partially to high prevailingnitrogen prices in the Philippines for this scenario and partially to the fact that it uses fuel oil as raw material The Leyte urea plant- exhibits itvery lowROI in scenarios 1 HI and IV and a high RO in scenario III Even though the 1101 is low for these scenarios operating this plant is part of the scheme that minimizes total fertilizer supply cost to the region
Costs for Supplying Regional Rlequirements
In considering the costs of supplying the fertilizer demands of the entire ASEAN region two
cost categories are used These categories are total expenses and avoidable costs
Total expenses represent the total value that the countries and region would pay for fertilizers delivered to consuming regions over the entire planning period at market prices Total expenses are calculated by adding the value of products at central points of market regions These values are shown for individual nutrients by subperiods and scenarios in Appendix Tables 1-17 through B-20 However the total expenses are summarized in Table 11
Scenario I is the lowest total expense supplyalternative for each country Other scenarios have mixed effects among the different countries The most expensive scenario for Indonesia and Malaysia is scenario IlI while for the other two countriesscenario IV is the most expensive One factor which reILuces the cost of scenario IV for Indonesia and Malaysia compared with that of other countries is the value of eXl)Olt s It world market prices This increases total revenuc fomn the sale of nitrogenfertilizers Ihe greatest cont ri1)ut ion to the increased expenditure for scenario Ill for Malaysiaand Indonesia is the increased expense for Iroduction of t205 In the hilippines scenario IV exlenses are consideratily greate than those of other scenarios because of ihe greatly increased expense for production of nitrogen In lhaind expenses increase gradually fIoim scenario I through IV and the greatest increase is due to the expense of supplying l(O
On the other hand avoidable costs represent the minimum total costs of production imports exportstransportation and constuction activities They do not include capital costs of facilities operating at the Ieginning of the planning period Those capital costs
are no longer decision parameters for plant managersIn other words sunken costs are not included
[he differences between avoidable costs for various scenarios indicate the extent to which formulated supply strategies could lead to different total costs to meet fertilizer needs for the whole ASEAN region Avoidable cosis for the region are shown for eachI scenario in abtle IH Scenario I which contains fewer constraints to supplypossibilities allows the lowest cost supply of fertilizer to meet the needs of the whole ASEAN regionScenario IV represents the most expensive supply strategy
The total expenses which also represent the total value of production of the whle ASEAN regionexceed the avoidable costs by l00- 50 This represents the realized ROI of activities associated with supplying the fertilizer needs of the whole region
Suggested Improvement and Applications
Because complex fertilizer sector planning models are seldom free front some shortcomings there is always a scope for further improvements The present study can he improved in three different but related areas First the structural and behavioral aspects of the planning model itself can be improvedby adding new activities constraints and behavior rules to represent uncertainty and expectations Second some of the simplifying assumptions with respect to fertilizer sector planning horizon and the planning region can be modified Third the input
20
TABLE 13 ESTIMATED RETURN ON INVESTMENT AT EXPANSION SITES MODEL RESULTS
Return on Investment Aceh Bontang Bintulu L e Limay Sattahip
Subperiod Urea Urea Urea DAP Urea NP Urea
Scenario I
1 0 0 0 0 0 0 2 21 19 19 0 0 13 3 21 20 19 03 0 13
19 03 0 14a4 21 20
Scenario II
1 0 0 0 0 0 0 a 2 21 19 19 3 0 13
3 13a3 21 20 19 0
4 33 30 29 9 11 20a
Scenario Ill
1 0 0 0 0 0 0 2 21 19 19 18 0 13a
a 3 21 20 19 37 0 13
4 30 28 27 104 3 16
Scenario IV
1 0 0 0 0 0 0 2 21 19 19 4 55 26 3 21 20 19 0 50 39 4 21 20 19 0 50 37
a Only ammoniaurea plant built
TABLE 14 ESTIMATED TOTAL EXPENSES AND AVOIDABLE COSTS TO SUPPLY FERTILIZERS TO THE ASEAN REGION DURING 1981-92 MODEL RESULTS
Estimated Total Expenses Total Total Supply Avoidable
Scenario Indonesia Malaysia Phi I ippines Tha i Iand Expenses Costs ----------------- (millions of 1979 US dollars)-- - ---------------shy
1 5499 1539 2046 2294 11376 5809 II 6614 1764 2504 2846 13728 6019
III 8198 1967 2718 3565 16448 6164 IV 5824 1637 5317 4087 16865 7328
data can be further updated and refined The has not changed very much The general implications qluality of data used in empirical estimation of the model appear valid in providing guidelines to determines to a great exlent the reliability of the the planners in the region for fertilizer sector develshymodel results This probhlm can be partly removed opment individually or in cooperation with each other by conducting sensitivity analysis with respect to key The economic decisions with respect to the ASEAN parameters and policy variables fertilizer sector and on the basis of the results of
this model appear logical and better than those deci-Complex mathematical programming models being sions which might be based on pure descriptive analshy
normative in nature cannot le validated with respect ysis or political considerations to their predictability by using standard statistical tests However despite some obvious shortcomings The model results are very instructive in the model appears to have performed extremely well in providing some guidelines to the planners in the simulating the general features of the fertilizer sector region with respect to broad economic implications of in the ASEAN region alternative supply strategies lowever the planners
must keep in mind the idealistic character of the Despite attempts to realistically portray the fer- model results This is especially true with respect to
tilizer economy in the ASEAN region some simplifying the interpretation of fertilizer prices contribution to assumptions with respect to data can be removed or profits and return on investments Furthermore modified For example the input prices and costs this study evaluates only four fertilizer supply were developed at the beginning of the steep price strategies which were considered appropriate for the increase of 1979 The level and structure of input ASEAN region lowever depending on the data prices costs and output prices have since changed availability computation facilities time and planning However despite these changes tile technical and objectives the model can be adapted to evaluate any economic structure of the ASEAN fertilizer industry number of alternative fertilizer strategies
21
References
British Sulphur Corporation 1979 Fertilizer Higgins J K (ed) 1979 Gren MarketsInternational The British Sulphur Corporation Fertilizer Market Intelligence Weekly McGraw-till Ltd London England (several issues during Co ew- -ork-Nfe -- York -(diitiferent issues1979) during 1979)
Choksi A M A Meeraus and A J Sloutjeudijk International Food Policy Research Institute 19771980 The Planning of Investment Programis in Food Needs of )eveloping Countriesthe Fertilizer Industry The Johns lopkins Projections of Production and ConsumptionUniversity Press Baltimore Maryland
to 1990 Research Report No 3 Washington DC
Food and Agriculture Organization of the United International Petroleum Encyclopedia 1980 TheNations (FAO) 1980 Production Yearbook Petroleun iPublishing Company Tulsa Oklahoma1979 Rome Italy (includes other previous Mudahar M S 1979 Policy Implications ofissues) Increased Fertilizer Efficiency for Rice
FAO 1980 Fertilizer Yearbook 1979 Rome Italv Production in Asia Preliminary I)raft IFDC(includes other pieViOUS issues) Muscle Shoals Alabama 35660
Foster T 110 W livingston and P J Stangel The World Bank 1980 World Development Report1976 The Potential for tRegional Cooperation in 1980 The World Bank Wasington I)-CFertilizer the ASEAN Group A MethodologyStudy Technical Btulletin IFI)C- T-2 IFDC Muscle Shoals Alabama 35660
22
APPENDIX A
Selected Model Input Data
List of Appendix A Tables
Table A-1 Selected Characteristics of Existing and Potential Fertilizer
Plants in the ASEAN Region
Table A-2 Production Imports and Exports of Fertilizer in the ASEAN Region
1970-79
Table A-3 Nutrient Consumption in ASEAN Countries 1970-79
Table A-4 Selected Fertilizer Raw Material Reserves in the ASEAN Region
Table A-5 Nutrient Demand Projections by Market Region (1981-92)
Table A-6 Input Requirements for Intermediates and Fertilizer Products
Table A-7 Input Requirements for Selected Compound Fertilizer Grades
- -- -
--
- -
Appendix Table A-i Selected Characteristics of Existing and Potential Fertilizer Plants in the ASEAN Region
Site Product
Gresik Ammonia AS Sulfuric acid TSP DAP NPK
Cikampek Ammonia Urea
Palembang
I Ammonia Urea
II Ammonia Urea
III Ammonia Urea
IV Ammonia Urea
Aceh Ammonia Urea
Bontang Ammonia Urea
Pt Dickson Ammonia
Petaling Sulfuric acid Jaya Nitric acid
AS NPK
Bintulu Ammonia Urea
Plant Statusa
OPR (1972) OPR (1972) OPR (1972) OPR (1979) OPR (1979) OPR (1979)
OPR (1979) OPR (1979)
OPR (1963) OPR (1963)
OPR (1974) OPR (1974)
OPR (1976) OPR (1976)
OPR (1977) OPR (1977)
CTN (1981) CTN (1981)
PLN PLN
OPR (1966)
OPR (1970) OPR (1966) OPR (1970) OPR (1966) CON CON
Raw Material
Capacity or(mtday) Intermediates
Indonesia
240 Fuel Oil 450 Sulfur 340 Phosphate rock
rl200 (Potash dA11800 djPhosphoric acid
j1800 (Ammonia
1000 Natural gas 1700
180 Natural gas 300
700 Natural gas 1150
1000 Natural gas 1700
1000 Natural gas 1700
1000 Natural gas 1725
1500 Natural gas 1725
Malaysia
150 Naphtha or ref gas
150 Sulfur 80 Ammonia from Pt Dickson
180 800 Potash
1000 Natural gas 1500
(Continued)
b
Conversion Cost 1979 US $mt
115 23 -1
1197
47 25
60 30
45 17
41 16
41 16
47 19
45 23
115
9 28 30 30 46 28
Capital Investmentc
1979 US $ million Facilities Working
-
- -- -
- --
- -- -
- -- -
160 3 100 5
200 5 100 15
- -
-160 5 90 15
Appendix Table A-i Selected Characteristics of Existing and Potential Fertilizer Plants in the ASEAN Region (Continued)
b Capital InvestmentcRaw Material Capacity or Conversion Cost 1979 US $ million
aSite Product Plant Status (mtday) Intermediates 1979 US $mt Facilities Working
Philippines
Limay Ammonia OPR (1965) 270 Ref gas 100 -Urea OPR (1965) 190 48 - -Sulfuric acid OPR (1965) 620 Pyrites -1 - -
Phosphoric acid P2 05 NPK
OPR (1965) OPR (1965)
210 730
Phosphate rock Potash
66 30
--
--
Pasig Sulfuric acid OPR (1966) 180 Sulfur 5 - -AS OPR (1966) 90 Ammonia 37 - -
Toledo City Phosphoric acid OPR (1958) 30f Phosphate rock g - -
Sulfuric acid OPR (1958) 250 Pyrites 3 - -
AS OPR (1958) 250 Ammonia 27 - -
NPNPK OPR (1958) 200 Potash 45 - -
Iligan Citye Ammonia OPR (1966) 80 Naphtha 135 - -Sulfuric acid OPR (1954) 120 Pyrites 10 - -
AS OPR (1966) 150 31 - -
Limay Ammonia CON (1982) 600 Naphtha or 102 130 10 (expansion) fuel oil 92 175 10
Urea CON (1982 1000 46 75 20
Leyte Phosphoric acid P2 05 CON (1982) 350 f H 2SO4 from Cu smelter 59 42 5 DAP CON (1982) 7O Ammonia 29 26 10
Thailand
Mae Moh Ammonia OPR (1966) 82 Lignite 130 - -Urea OPR (1975) 76 60 - -Sulfuric acid OPR (1975) 300 Sulfur 2 - -AS OPR (1975) 175 30 - -
Bangkok NPNPK OPR (1975) 400 Ammonium chloride 40 - -
Diammonium phosphate
NPNPK OPR (1978) 800 Potash 30 - shy
(Continued)
Appendix Table A-I Selected Characteristics of Existing and Potential Fertilizer Plants in the ASEAN Region (Continued)
Raw Material b Capital Investmentc
Site Product aPlant Status Capacity(mtday) orIntermediates Conversion Cost1979 US $mt
1979 US $ Facilities
million Working
Thailand (Continued) Sattahip Ammonia
Urea crystals Urea granular Phosphoric acid Sulfuric acid Powdered MAP
CON CON CON CON CON CON
1200 1200
800 700
2000 350
Natural gas
Phosphate rock Sulfur
45 15 6
22 8 5
191 61 21 61 56 6
5 3 7 5 3 4
NP (22-29-7) + (25-34-0) CON 1500 Potash 9 59 23
a OPR--operational CTN--under construction kLN--being planned CON--to be constructed The number in parentheses indicates startup yearb Do not include raw materials depreciation and interest Based an 95 capacity utilization except for PUSRI I and Gresik plants which are based on 90 c IFDC cost estimates for projects under construction or in planning stages Estimates do not include escalation during constructiond Maximum capacity if one fertilizer type is produced e Iligan City production facilities to be phased out in 1985 f Capacity is in terms of quantity of P2 05 g Not estimated--Limay estimate taken
Appendix Table A-2 Production Imports and Exports of Fertilizer in the ASEAN Region 1970-79
Country 1970 1971 Production or Trade thousand mt 1972 1973 1974 1975 1976 1977 1978 1979
N Production
Indonesia 393 453 482 599 852 1659 2075 1842 3961 7360 Malaysia 310 260 425 400 462 370 340 387 377 374 Philippines 535 477 586 554 535 534 621 484 379 457 Thailand 80 115 103 77 74 67 43 69 89 35 TOTAL 318 1305 1596 1630 1923 2630 3079 2815 4859 8226
N Imports
Indonesia 1076 990 2147 2449 2930 6110 1590 1030 99 171 Malaysia 305 339 443 383 556 752 449 734 660 1030 Philippines 479 714 940 510 946 2394 441 632 1416 1175 Thailand 410 360 520 550 529 731 746 1297 1512 1789
TOTAL 2270 2403 4050 3892 4961 9987 3226 3693 3687 4165
N Exports
Indonesia 0 0 0 0 0 0 0 0 1841 1060 Malaysia 0 14 28 53 57 58 55 0 0 0 Philippines 0 30 12 0 0 0 0 0 45 12 Thailand 0 0 0 0 0 0 0 0 0 0
TOTAL 0 44 60 53 53 58 55 0 1886 1072
P20 Production
Indonesia 0 0 0 0 0 0 0 0 0 0 Malaysia 235 229 212 260 243 0 209 220 253 288 Philippines 390 410 417 418 410 421 312 310 293 361 Thailand 0 0 0 0 0 0 0 0 0 0
TOTAL 625 639 629 678 653 421 521 530 546 649
(Continued)
Appendix Table A-2 Production Imports and Exports of Fertilizer in the ASEAN Region 1970-79 (Continued)
Country 1970 1971 Production or Trade thousand mt 1972 1973 1974 1975 1975 1977 1978 1979
P20s Imports
Indonesia Malaysia Philippines Thailand
626 170 250 450
180 229 08
235
216 125 52
433
960 108 21
559
850 160 65 514
348 183 477 704
819 127 06
622
79 193 0
803
442 170 0
1326
1215 750 82
1250 TOTAL 1496 652 826 1648 1589 1712 1574 1075 1838 3297
POs Exports Indonesia Malaysia Philippines Thailand
0 0 0 0
0 0 29 0
0 0 13 0
0 53 0 0
0 48 16 0
0 0 0 0
0 0 0 0
0 0 0 0
0 0 56 0
0 0 15 0
TOTAL 0 29 13 53 64 0 0 0 56 15
K20 Imports
Indonesia Malaysia Philippines Thailand
82 561 377 206
68 757 364 150
47 749 366 228
299 808 450 420
403 893 466 384
332 1029 863 509
134 1187 440 391
300 1434 480 205
400 1732 428 298
772 1900 539 340
TOTAL 1226 1339 1390 1977 2146 2733 2152 2419 2858 3551
Source FAO Fertilizer Yearbook various issues
Appendix Table A-3 Nutrient Consumption in ASEAN Countries 1970-79
Country 1970 1971 1972 Consumption thousand mt 1973 1974 1975 1976 1977 1978 1979
Average Annual Compound
Growth Rate
N
Indonesia 1055 2017 1963 3474 3500 3450 3419 3512 4652 5240 195 Malaysia Philippines
524 1014
664 1192
666 1220
808 1145
1122 1519
689 1774
776 1441
835 1772
968 1742
1069 2054
82 82
Thailand 490 425 620 620 602 798 789 1363 1601 1535 135 TOTAL 3083 4298 4469 6047 6743 6711 6425 7482 8963 9898 138
Indonesia 626 289 231 668 P90a
850 1141 1165 1067 1082 1235 78 Malaysia 170 229 120 256 352 291 283 364 160 524 133 Philippines 640 440 500 399 510 478 340 400 404 498 -27 Thailand 453 235 433 559 514 704 622 803 900 1044 97 TOTAL 1889 1193 1284 1882 2226 2614 2410 2634 2546 3301 64
Indonesia 82 65 47 299 403 330 250 300 254 754 280 Malaysia 561 757 768 808 893 1029 1137 1411 1508 1727 133 Philippines 300 400 377 388 556 600 488 515 459 566 73 Thailand 108 150 228 420 384 509 391 205 250 300 120
TOTAL 1051 1372 1400 1915 2236 2468 2468 2431 2471 3347 137
Source FAO Fertilizer Yearbook various issues
Appendix Table A-4 Selected Fertilizer Raw Material Reserves in the Southeast Asian Region
Main Region Port Lignite Crude Oil Natural Gas
North Thailand
Bangkok Mae Moh 80 million mt
Fang oil quantity not exactly known
Total Thailand 8000 x 109 ft2
Li 15 Li oil shale million mt Thailand reserves
140000 bbl South Plukeit Krabi Thailand 100 million mt
North Sumatra Aceh Indonesian reserves Indonesian reserves 9600 x 106 bbl 24000 x 109 ft3 reserves obviously are reserves obviously not a limiting factor are not a limiting at any of the locations factor at one of mentioned the locations
mentioned South Sumatra Palembang West Java
East Bontang or Kalimantan Balikpapan
Brunei Kuala - 1800 x 106 bbl 7700 x 109 ft3
- Belait
Malaysia Peninsula
- Malaysian reserves 2800 x 106 bbl
Malaysian reserves 17000 x 109 ft3
Malaysia Sabah
Malaysia Sarawak
Philippines 25 x 106 bbl
Sources International Petroleum Encyclopedia 1980 and unpublished IFDC information
Pyrites
60 x 106 mt
Rock Phosphates
Total Thailand 50000 mt of P2 05
500000 mt rock exploitation not probable in larger scale
100000 mt rock exploitation not
probable
454000 mt rock
small-scale exploitation
Potash Salts
In excess of 10 x 106 mt of K2 0
Appendix Table A-5 Nutrient Demand Projections by Market Region (1981-92)a
Central Demand 1981-83 1984-86 1987-89 1990-92 Country Market Region Point (Port) N P2 N P KO N P - N
---------------shy (thousand mt of nutrientsyear)- - -----------
Indonesia Kalimantan East Balikpapan 18 7 06 22 9 07 27 11 1 32 14 1 Kalimantan West Pontianak 6 2 06 7 3 07 9 4 1 11 5 1 Sulawesi Ujung Pandang 30 11 06 37 15 07 45 i9 1 54 24 1 East Java Surabaja 167 62 7 207 83 9 250 107 11 298 133 13 Central Java Cilacap 143 53 3 177 71 35 215 92 4 256 116 5 West Java Jakarta 155 58 7 192 77 9 232 100 11 276 126 13 South Sumatra Palembang 18 7 06 22 9 07 27 11 1 32 14 1 Central Sumatra Padang 24 9 06 30 12 07 36 15 1 43 19 1 North Sumatra Belawan 35 13 35 44 17 45 54 23 56 63 29 67
TOTAL 596 222 55 738 296 70 895 382 87 1065 480 103
Malaysia West Malaysia (Penisula W) Port Dickson 92 28 128 102 33 159 114 37 193 126 42 228 West Malaysia (Penisula E) Kuantan 28 9 38 31 10 47 34 11 58 37 12 69 Sarawak Bintulu 9 3 7 10 4 9 12 4 10 13 4 12 Sabah Kota Kinabalu 5 3 9 8 3 10 9 3 11 10 3 13
TOTAL 134 43 182 151 50 225 169 55 272 186 61 322 Philippines North Philippines Manila 110 23 26 126 24 26 150 27 27 176 29 29
Central Philippines Iloilo 99 21 23 132 26 28 157 28 29 184 31 31 South Philippines Cagayan de Oro 51 11 12 56 11 12 67 12 12 78 13 13
TOTAL 260 55 61 314 61 66 374 67 68 438 73 73
Thailand TOTAL Bangkok 222 165 47 256 188 57 291 212 67 326 236 77
GRAND TOTAL 1212 485 345 1459 595 418 1729 716 494 2015 850 575
a For the midpoint of the years indicated
Appendix Table A-6 Input Requirements for Intermediates and Fertilizer Products
Product Input Requirement per mt
Ammonia 22700 ft3 of natural gas or 22900 ft3 of refinery gasmt or 075 mt of fuel oil or 056 mt of naphtha or 262 mt of lignitemt
Nitric acid 0283 mt of ammoniamt Sulfuric acid 072 mt of pyrite or 0344 mt of
sulfurmt Phosphoric acid 310 mt of phosphate rock plus 262 mt
of sulfuric acidmtAmmonium sulfate 027 mt of ammonia plus 075 mt of
sulfuric acidmt Urea 060 mt of ammoniamt Triple superphosphate 036 mt of P205 as phosphoric acid plus
041 mt of phosphate rockmtDiammonium phosphate 025 mt of ammonia plus 046 mt of
phosphoric acidmtMonoammonium phosphate 060 mt of ammonia plus 053 mt of
phosphoric acidmt
Appendix Table A-7 Input Requirements for Selected Compound Fertilizer Grades
Quantity of Inputs mtmt of Product Philippines Indonesia Malaysia Thailand
Inputs 14-14-14 15-15-15 15-15-15 20-20-0 25-34-0 22-29-7
Ammonia 0045 0048 0110 - 0170 0150 Ammonium chloride - - - 0610 - -Ammonium sulfate 0464 0362 0030 - -
Nitric acid - - 0280 - - -Urea 0017 0081 - - 0270 0235 Phosphoric acid 0140 0150 - - 0350 0300 Phosphate rock - - 0500 - - -Triple superphosphate 0059 0080 KCL (60) 0234 0250 0250 - - 0130 Diammonium phosphate - - - 0390 - -
APPENDIX B
Selected Empirical Results
List of Appendix B Tables
Table B-I Fertilizer Production in Indonesia
Table B-2 Fertilizer Production in Malaysia
Table B-3 Fertilizer Production in the Philippines
Table B-4 Fertilizer Production in Thailand
Table B-5 Sources of Supply of Plant Nutrients as Finished Fertilizers
to Market Regions in Indonesia
Table B-6 Sources of Supply of Plant Nutrients as Finished Fertilizers
to Market Regions in Malaysia
Table B-7 Sources of Supply of Plant Nutrients as Finished Fertilizers to
Market Regions in the Philippines
Table B-8 Sources of Supply of Plant Nutrients as Finished Fertilizers to
Market Regions in Thailand
Table B-9 Estimated Fertilizer Prices at Production Sites in Indonesia
Table B-10 Estimated Fertilizer Prices at Production Sites in Malaysia
Table B-lI Estimated Fertilizer Prices at Production Sites in the Philippines
Table B-12 Estimated Fertilizer Prices at Production Sites in Thailand
Table B-13 Estimated Variable Production Costs and Contribution to Profits
in Indonesia
Table B-14 Estimated Variable Production Costs and Contribution to Profits
in Malaysia
Table B-15 Estimated Variable Production Costs and Contribution to Profits
in the Philippines
Table B-16 Estimated Variable Production Costs and Contribution to Profits
in Thailand
Table B-17 Estimated Total Expenses to Supply Plant Nutrients in Indonesia
Table B-18 Estimated Total Expenses to Supply Plant Nutrients in Malaysia
Table B-19 Estimated Total Expenses To Supply Plant Nutrients in the
Philippines
Table B-20 Estimated Total Expenses to Supply Plant Nutrients in Thailand
List of Appendix B Figures
Figure B-I Distribution of Principal Raw Materials and Intermediates for
Scenario I
Figure B-2 Distribution of Principal Raw Materials and Intermediates for
Scenario II
Figure B-3 Distribution of Principal Raw Materials and Intermediates for
Scenario III
Figure B-4 Distribution of Principal Raw Materials and Intermediates for
Scenario IV
Appendix Table B-I Fertilizer Production in Indonesia
Subperiod AS DAP Gresik
15-15-15
Fertilizer Production thousand mt of productyear Existing Plants
PalembangCikampek I Ii III + IV
TSP Urea Urea Urea Urea
Expansion Sites Aceh Bontang Urea Urea
1 2 3 4
0 0 0 0
72 72 72 72
0 0 0 0
82 297 297 297
Scenario I 523 89 523 89 523 89 523 89
361 361 361 361
1045 1045 1045 1045
0 523 523 523
0 533 533 533
1 2
3
4
117 0
0
0
72 72
72
72
45 0
0
0
293 297
297
297
Scenario II 523 89 523 89 523 89 523 89
361 361
361
361
1045 1045
1045
1045
0 523
523
523
0 533
533
533
1 2 3 4
117 0 0 0
72 72 72 72
45 0
45 45
297 297 297 293
Scenario III 523 89 523 89 523 89 523 89
361 361 361 361
1043 1045 1041 1045
0 523 523 523
0 533 533 533
1 2 3 4
0 0 0 0
72 72 72 72
0 0
19 0
297 297 297 297
Scenario IV 523 89 523 89 521 89 523 89
361 361 361 361
1045 1045 1045 1045
0 523 523 523
0 470 470 470
134 72 45
Effective Capacity thousand mt productyear 297 534 89 361 1066 533 533
Appendix Table B-2 Fertilizer Production in Malaysia
Fertilizer Production thousand mt of productyear Existing Plant Expansion Site Petaling Jaya Bintulu
Subperiod AS 15-15-15 Urea
Scenario I
1 0 85 0 2 0 85 446 3 0 85 446 4 0 85 446
Scenario II
1 51 85 0 2 0 85 446 3 0 85 446 4 0 85 446
Scenario III
1 51 85 0 2 0 85 446 3 0 85 445 4 0 85 446
Scenario IV
1 37 85 0 2 0 85 446 3 0 85 446 4 0 85 446
Effective Capacity thousand mt of productyear a 446b 54 8 5
a Total capacity is equal to 238000 mtpy but nitric acid capacity limits NPK production to 85000 mtpy b Excess capacity of ammonia of 145000 mtpy
Appendix Table B-3 Fertilizer Production in the Philippines
Fertilizer Production thousand mv of productyear Existing Plants Expansion Sites
Limay Pasig Toledo City lligan City Leyte Limay Subperiod 14-14-14 Urea AS AS 14-14-14 AS DAP Urea
Scenario I
1 0 56 0 72 0 0 0 0 2 0 56 0 0 0 0 208 0 3 0 56 0 0 0 0 208 0 4 0 56 0 0 0 0 208 0
Scenario II
1 91 56 27 74 0 45 0 0 2 0 56 0 0 0 0 208 0 3 0 56 0 0 0 0 208 0 4 0 56 0 74 0 0 208 297
Scenario III
1 91 56 27 74 0 45 0 0 2 0 56 0 0 0 0 208 0 3 20 56 0 0 0 0 208 0 4 217 56 0 0 59 0 208 102
Scenario IV
1 0 56 27 47 59 15 0 0 2 217 56 27 74 0 45 171 293 3 217 56 27 74 0 45 126 293 4 217 56 27 74 0 45 114 293
Effective Capacity thousand mt of productyear
217 56 27 74 59 45 208 297
Appendix Table B-4 Fertilizer Production in Thailand
Fertilizer Production thousand mt of productyear Existing Plants Expansion Site
Mae Moh Bangkok Sattahip Subperiod AS Urea 20-20-0 ii-54-0a 25-34-0 22-29-7 Urea
Scenario I
1 0 23 0 0 0 0 0 2 0 23 0 0 0 0 238 3 0 23 0 0 0 0 238 4 0 23 0 0 0 0 238
Scenario II
1 40 23 360 0 0 0 0 2 0 23 0 0 0 0 238 3 0 23 0 0 0 0 238 4 0 23 182 0 0 0 238
Scenario III
1 40 23 360 0 0 0 0 2 0 23 97 0 0 0 238 3 0 23 360 0 0 0 238 4 0 23 360 0 0 107 238
Scenario IV
1 40 23 352 0 0 0 0 2 0 0 360 0 223 139 213 3 0 11 360 0 223 222 238 4 30 23 360 0 223 182 238
Effective Capacity thousand mt of productyear
52 23 360 104 223 223 238
a MAP is to be produced only to use as intermediate in Bangkok plant
Appendix Table B-5 Sources of Supply of Plant Nutrients as Finished Fertilizers to Market Regions in Indonesia
Quantity of Plant Nutrients thousand mtpy Other Non-ASEAN
In Country ASEAN Countries Countries Total Subperiod N P20a Kg N P2 KO N Z K20 N POn K90
Scenario I
1 559 127 0 0 0 0 37 95 55 596 222 55 2 689 170 0 10 26 0 39 100 70 738 296 70 3 812 170 0 8 22 0 75 190 87 895 382 87 4 945 170 0 6 16 0 114 294 103 1065 480 103
Scenario II
1 566 137 7 0 0 0 30 85 48 596 222 55 2 729 170 0 9 24 0 0 102 70 738 296 70 3 891 170 0 4 22 0 0 190 87 895 382 87 4 1059 170 0 6 16 0 0 294 103 1065 480 103
Scenario III
1 559 134 7 7 7 7 30 81 41 596 222 55 2 738 148 0 0 0 0 0 148 70 738 296 70 3 889 175 7 6 16 0 0 191 80 895 382 87 4 1040 175 7 25 65 0 0 240 96 1065 480 103
Scenario IV
1 596 170 0 0 0 0 0 52 55 596 222 55 2 738 170 0 0 0 0 0 126 79 738 296 79 3 895 172 3 0 0 0 0 210 84 895 382 87 4 1065 170 0 0 0 0 0 310 103 1065 480 103
Appendix Table B-6 Sources of Supply of Plant Nutrients as Finished Fertilizers to Market Regions in Malaysia
Subperiod In Country
N PZO K
Quantity of Plant Nutrients thousand mtpy Other Non-ASEAN
ASEAN Countries Countries N P90 K2 N P20- K N
Total PZO
Scenario I
1 2 3 4
13 28 31 33
13 13 13 13
13 13 13 13
110 112 124 137
0 8 7 7
0 0 0 0
11 11 14 16
30 29 35 41
169 212 259 309
134 151 169 186
43 50 55 61
182 225 272 322
Scenario II
1 2 3 4
23 28 31 33
13 13 13 13
13 13 13 13
104 123 138 153
11 11 7 7
0 0 0 0
7 0 0 0
19 26 35 41
169 212 259 309
134 151 169 186
43 50 55 61
182 225 272 322
Scenario III
1 2 3 4
16 29 32 34
6 13 13 13
6 13 13 13
116 122 137 152
15 12 15 17
0 0 0 2
2 0 0 0
22 25 27 31
176 212 259 307
134 151 169 186
43 50 55 61
182 225 272 322
Scenario IV
1 2 3 4
20 151 169 186
13 13 13 13
13 13 13 13
0 0 0 0
0 0 0 0
0 0 0 0
114 0 0 0
30 37 42 48
169 212 259 307
134 151 169 186
43 50 55 61
182 225 272 320
Appendix Table B-7 Sources of Supply of Plant Nutrients as Finished Fertilizers to Market Regions in the Philippines
Quantity of Plant Nutrients thousand mtpy Other Non-ASEAN
In Country ASEAN Countries Countries Total Subperiod N PZ0 K N K2 N P20 K N P20 K
Scenario I
1 40 0 0 147 0 0 73 55 61 260 55 61 2 50 61 0 264 0 0 0 0 66 314 61 66 3 52 67 0 322 0 0 0 0 68 374 67 68 4 54 73 0 384 0 0 0 0 73 438 73 73
Scenario II
1 68 13 13 179 5 0 13 37 48 260 55 61 2 51 61 0 263 0 0 0 0 66 314 61 66 3 52 67 0 322 0 0 0 0 68 374 67 68 4 69 73 0 369 0 0 0 0 73 438 73 73
Scenario III
1 68 13 13 179 15 0 13 27 48 260 55 61 2 38 31 0 276 0 0 0 30 66 314 61 66 3 41 34 3 333 0 0 0 33 65 374 67 6P 4 108 35 35 330 2 2 0 36 36 438 73 73
Scenario IV
1 52 8 8 0 0 0 208 47 53 260 55 61 2 251 109 30 0 0 0 63 0 36 314 109a 66 3 243 89 89a30 0 0 0 131 0 38 374 68 4 241 83 30 83a0 0 0 197 0 43 438 73
a In these cases an oversupply of P2 05 exists because DAP was produced to meet the N requirements
Appendix Table B-8 Sources of Supply of Plant Nutrients as Finished Fertilizers to Market Regions in Thailand
Quantity of Plant Nutrients thousand mtpy Other Non-ASEAN
In Country ASEAN Countries Countries Total Subperiod N P90- K90 N PqQO K N N PP K20
Scenario I
1 10 0 0 147 0 0 65 165 47 222 165 47 2 120 0 0 63 0 0 73 188 57 256 188 57 3 120 0 0 88 0 0 83 212 67 291 212 67 4 120 0 0 114 0 0 92 236 77 326 236 77
Scenario II
1 90 72 0 121 22 0 11 71 47 222 165 47 2 120 0 0 136 0 0 0 188 57 256 188 57 3 120 0 0 171 0 0 0 212 67 291 212 67 4 156 36 0 170 0 0 0 200 77 326 236 77
Scenario III
1 90 72 0 121 10 0 11 83 47 222 165 47 2 139 19 0 117 75 0 0 94 57 256 188 57 3 192 72 0 99 34 0 0 106 67 291 212 67 4 215 103 8 I1 15 0 0 118 69 326 236 77
Scenario IV
1 89 70 0 0 0 0 133 95 47 222 165 47 2 256 188 10 0 0 0 0 0 47 256 188 57 3 291 212 16 0 0 0 0 0 51 291 212 67 4 293 201 13 0 0 0 33 35 64 326 236 77
Appendix Table B-9 Estimated Fertilizer Prices at Production Sites in Indonesia
Fertilizer Prices 1979 US $mt of Product
Subperiod AS DAP Gresik
15-15-15 TSP Cikampek Urea
I Urea
Palembang II
Urea III + IV Urea
Aceh Urea
Bontang Urea
Scenario I 1 2 3
77 72 72
233 232 234
138 133 133
157 165 167
186 162 162
185 160 160
185 160 160
185 160 160
0 160 160
0 160 160
4 72 234 134 166 164 162 162 162 160 163
Scenario II 1 2 3 4
146 100 101 97
312 242 244 268
195 162 137 157
174 175 177 177
344 162 162 225
342 160 161 222
342 160 161 222
342 160 161 222
0 160 160 220
0 160 161 222
Scenario III 1 2 3 4
145 84
101 109
313 302 380 649
195 157 181 278
176 235 313 564
342 161 162 210
340 160 160 207
340 160 160 207
340 160 160 207
0 160 160 205
0 160 160 207
Scenario IV 1 2 3 4
66 66
109 109
246 245 362 246
141 161-175 137
179 178 295 179
162 161 162 163
160 160 160 160
160 160 160 160
160 160 160 160
0 160 160 160
0 160 160 160
Appendix Table B-10 Estimated Fertilizer Prices at Production Sites in Malaysia
Fertilizer Prices 1979 US $mt of Product Petaling Jaya Bintulu
Subperiod AS 15-15-15 Urea
Scenario I
1 93 138 shy
2 101 133 160 3 102 133 160 4 101 133 163
Scenario II
1 145 196 shy2 101 136 160 3 102 137 161 4 106 156 222
Scenario III
1 144 196 shy2 65 156 160 3 66 183 160 4 106 278 207
Scenario IV
1 113 165 shy2 106 137 160 3 106 137 160 4 106 137 160
Appendix Table B-Il Estimated Fertilizer Prices at Production Sites in the Philippines
Fertilizer Prices 1979 US $mt of Product
Subperiod Limay
14-14-14 Urea Pasig AS
Toledo City AS 14-14-14
Iligan City AS
Leyte DAP
Limay Urea
Scenario I
1 129 192 79 78 128 79 - -2 123 164 86 86 122 86 228 171 3 124 165 87 86 123 86 230 171 4 124 167 87 86 123 86 230 167
Scenario II
1 182 349 147 146 183 147 - -2 126 164 116 66 125 66 239 164 3 132 165 87 86 113 93 241 165 4 146 226 94 93 188 94 265 226
Scenario III
1 182 347 146 146 183 146 - -2 166 164 86 66 151 86 300 172 3 168 165 88 66 169 67 377 173 4 254 212 110 108 255 108 643 212
Scenario IV
1 198 301 126 126 196 127 - -2 215 640 274 274 270 275 246 640 3 202 598 255 255 203 256 229 598 4 202 597 255 255 211 256 229 597
Appendix Table B-12 Estimated Fertilizer Prices at Production Sites in Thailand
Fertilizer Prices 1979 US $mt of Product Mae Moh Bangkok Sattahip
Subperiod AS Urea 20-20-0 11-54-0 25-34-0 22-29-7 Urea
Scenario I
1 75 186 147 - - shy
2 64 161 140 134 215 198 163 3 64 161 141 135 215 198 163 4 65 163 141 136 216 199 165
Scenario II
1 143 343 225 - - shy
2 64 161 145 147 227 205 163 3 65 162 146 217 224 205 167 4 91 223 173 216 257 237 225
Scenario III
1 143 341 225 - - shy
2 64 161 173 216 268 244 163 3 64 161 205 217 325 292 163 4 85 208 334 764 534 471 210
Scenario IV
1 i1 268 183 - - - shy
2 15 47 296 221 500 440 49 3 61 154 334 217 544 479 156 4 99 241 315 216 496 439 243
Appendix Table B-13 Estimated Variable Production Costs and Contribution to Profits in Indonesia
Subperiod AS DAP Gresik
15-15-15
Contribution to Profits 1979 US $mt of Product PalembangCikampek I II III + IVTSP Urea Urea Urea Urea
Aceh Urea
Bontang Urea
1 2 3 4
-32 -37 -37 -37
9 8
10 10
-37 -42 -42 -41
0 8 10 9
123 101 103 106
Scenario I 113 135 89 11 90 112 93 115
138 114 115 118
-108 109 110
103 104 108
1 2 3 4
37 -9 -8
-12
88 18 20 44
20 -13 -38 -18
17 18 10 10
281 101 103 167
Scenario II 270 292 89 11 91 113
153 175
295 114 116 178
-108 109 170
-103 105 167
1 2 3 4
36 -25 -8 0
89 78
156 425
20 -18 6
103
19 78
156 407
279 100 103 152
Scenario III 268 390 89 11 90 112
138 160
293 114 115 163
-108 109 155
-103 104 152
1 2 3 4
-43 -43 0 0
22 21
138 22
-34 -14 0
-46
22 21
138 22
99 100 103 105
Scenario IV 88 110 89 il 90 112 91 113
113 114 115 116
-108 109 110
-103 104 105
109 224 175
Variable Production Cost 1979 US $mt of Product 157 63-58 72-69 50-47 47-44 52-50 57-55
Appendix Table B-14 Estimated Variable Production Costs and Contribution to Profits in Malaysia
Contribution to Profits 1979 US $mt of Product Petaling Jaya Bintulu
Subperiod AS 15-15-15 Urea
Scenario I
1 -20 17 -
2 -12 12 96 3 -11 12 97 4 -12 12 100
Scenario II
1 32 75 -
2 -12 15 96 3 -11 16 98 4 -7 35 159
Scenario III
1 31 75 -
2 -48 35 96 3 -47 62 97 4 -7 157 144
Scenario IV
1 0 44 -
2 -7 16 96 3 -7 16 97 4 -7 16 97
Variable Production Cost 1979 US $mt of Product
113 121 64-63
Appendix Table B-15 EstimateO Variable Production Costs and Contribution to Profits in the Philippines
Contribution to Profits 1979 US $mt of Product Limay Pasig Toledo City Iligan City Levte LmY
Subperiod 14-14-14 Urea ASAS 14-14-14 AS DAP Urea
Scenario I 1 -40 76 -37 -570 -48 - shy2 -45 50 -30 8 -63 -41 0 46 3 -44 52 -29 8 -62 -41 1 46 4 -44 55 -29 8 -62 -41 1 42
Scenario II 1 13 233 31 68 -2 20 - shy2 -42 50 0 -12 -60 -61 10 393 -36 52 -29 8 -72 -34 12 404 -22 114 -22 15 3 -33 36 101
Scenario III 1 13 231 30 68 -2 19 - shy2 -2 50 -30 -12 -34 -41 71 473 0 52 -28 -12 -16 -60 148 484 86 100 -6 30 70 -19 414 87
Scenario IV 1 29 185 10 48 11 0 shy -2 46 525 158 196 85 146 17 524 3 33 484 161 177 18 129 0 482 4 33 485 161 177 26 129 0 481
Variable Production Costs 1979 US $mt of Product
169 116-112 116 78 185 127 229 116
Appendix Table B-16 Estimated Variable Production Costs and Contribution to Profits in Thailand
Contribution to Profits 1979 US $mt of Product Bangkok
Subperiod Mae Moh
AS Urea 20-20-0
Old New 11-54-0 Sattahip
25-34-0 22-29-7 Urei-
Scenario I
1 -24 32 -36 -26 - - - -2 -35 7 -43 -33 -34 97 81 124 3 -35 7 -42 -32 -33 98 81 125 4 -34 9 -42 -32 -30 100 83 128
Scenario II
1 44 189 42 52 - - - -2 -35 7 -38 -28 -21 109 88 124 3 -34 8 -37 -27 50 106 88 126 4 -8 69 -10 0 50 141 121 188
Scenario III
1 44 187 42 52 - - - -2 -35 7 -10 0 48 150 127 124 3 -35 7 22 32 50 208 175 125 4 -14 54 151 161 598 418 355 173
Scenario IV
1 12 114 0 10 - - - -2 -84 -107 113 123 51 379 320 0 3 -38 0 151 161 47 423 359 106 4 0 87 132 142 46 375 319 193
Variable Production Costs 1979 US $mt of Product
99 154 183 173 170 121 120 50
Appendix Table B-17 Estimated Total Expenses to Supply Plant Nutrients in Indonesia
Equilibrium Expenses 1979 US $ x 106 Subperiod N P K Total
Scenario I
1 759 240 30 1029 2 816 339 39 1194 3 990 435 51 1476 4 1194 549 57 1800
TOTAL 3759 1563 177 5499
Scenario II
1 1373 267 31 1671 2 788 356 40 1184 3 996 465 50 1511 4 1607 583 58 2248
TOTAL 4764 1671 179 6614
Scenario III
1 1362 269 31 1662 2 815 475 40 1330 3 991 806 50 1847 4 1505 1796 58 3359
TOTAL 4673 3346 179 8198
Scenario IV
1 663 274 31 968 2 815 366 40 1221 3 991 761 50 1802 4 1182 593 58 1833
TOTAL 3651 1994 179 5824
Appendix Table B-18 Estimated Total Expenses to Supply Plant Nutrients in Malaysia
Equilibrium Expenses 1979 US $ x 106
Subperiod N P K20 Total
Scenario I
1 171 48 105 324 2 165 57 129 351 3 186 63 156 405 4 207 69 183 459
TOTAL 729 237 573 1539
Scenario II
1 308 52 104 464 2 166 60 128 354 3 187 67 155 409 4 280 74 183 537
TOTAL 941 253 570 1764
Scenario III
1 306 53 104 463 2 166 80 128 374 3 187 116 155 458 4 262 227 183 672
TOTAL 921 476 570 1967
Scenario IV
1 249 46 104 399 2 167 64 128 359 3 187 70 155 412 4 206 78 183 467
TOTAL 809 258 570 1637
Appendix Table B-19 Estimated Total Expenses to Supply Plant Nutrients in the Philippines
Equilibrium Expenses 1979 US $ x 106
Subperiod N 2 K Total
Scenario I
1 339 60 36 435 2 351 69 36 456 3 420 75 39 534 4 498 81 42 621
TOTAL 1608 285 153 2046
Scenario II
1 605 66 35 706 2 351 72 37 460 3 421 80 39 540 4 670 87 41 798
TOTAL 2047 305 152 2504
Scenario III
1 602 67 35 704 2 351 96 37 484 3 420 139 39 598 4 625 266 41 932
TOTAL 1998 568 152 2718
Scenario IV
1 526 99 35 660 2 1329 0 37 1366 3 1480 0 38 1518 4 732 0 41 _773
TOTAL 5067 99 151 5317
Appendix Table B-20 Estimated Total Expenses to Supply Plant Nutrients in Thailand
Equilibrium Expenses 1979 US $ x 106
Subperiod N -P9O1 K20 Total
Scenario I
1 284 179 25 488 2 286 215 29 530 3 326 243 32 601 4 368 270 35 673
TOTAL 1264 907 121 2292
Scenario II
1 511 201 27 739 2 286 228 32 546 3 327 259 38 624 4 496 397 44 937
TOTAL 1620 1085 141 2846
Scenario III
1 508 203 27 738 2 286 305 32 623 3 326 449 38 813 4 465 882 44 1391
TOTAL 1585 1839 141 3565
Scenario IV
1 404 177 26 607 2 96 791 32 919 3 311 868 38 1217 4 534 766 44 1344
TOTAL 1345 2602 140 4087
U
-J
6IG
cc
uCu
CC
00
0 00
ILL
0 L
)
02
F-0
shyo
w
00
b -J
w
aw
w
jo
0 c
U2
U 0 (A
0shy
0 0
4~0
0
CC
d C-
CO
Du
Ll0
coC
cc-
CL
cc
IL
w0
C-
X
Z
ca0
UU
-0
olto
z
10
0
44- j
0 cc
0 E
0 C
C
00
lt 00
CL
a -j
4-
CL
i
00
cc
Ishyal
olt
-o
LLI0
Ib
l-0
LL
C
oshy
w
0-
D
=
CL
u
CL
d
CL
)
U
z
U
c2 C
Lshy
050
00 iiiiiiiiiiii
bullccdeg L
U
CD
)
a
I
O
0
0c
CL
)
0
APPENDIX C
Mathematical and Schematic Formulations of the Linear Programming Model
Mathematical Formulation of the Dynamic Linear Programming Model
Objective Function
D I T tMinimize I P TI rt I I ct bulll~l~T~~~~ d= 1 i= 1 t= 1 = I p = 1
+ (cmidt M i t) dt- (ce E i~d)
+ (cPidt Pijd ) 1 ccdt i d
X+ [m = 1 ( xi dd m~t X~y~
+ cbid t cr bull I t)]i~~mt t i~d~mt
Constraints
I 1 2 an bullF gtDN
i1 in idt ndt
for each ndt combination (n = 12N d = 12D t = 12T)
I 2 2 an bullM 5pct n bull DN
i = 1 I n idt ndt ndt
for each ndt combination (n = 12N d = 12D t = 12T)
U D P 3 -Fidt + 1 2 (T - T t )
u = I d =I p =1 idpt uipdt
+ Mid~t EEi~dyt + Pi~dt
C M 2 ac c = 1 (Si + D ) + 2 X~~~ c~~ m ~ d=1C ml
I M - ah bullX=0i = Im = 1 jm idmt 0
for each idt combination (i = 12I d = t =12D 12T)
k 0
T-1 44 xXidmt 1 C mt ltC= - id ltCAdmtt s = I l m m
for each idmt combination (i = 12I d = 12D m = 12M t = 12T)
(s = first possible time period for plant construction)
I5XbM CIEd5 1 2 cbi d t r t cr bull~I ltl~- I~ =
i = I m = 1i m t idmt t
for each dt combination (d = 12D t = 12T)
M
6 2 Cid t RA m1 mt
for each idt combination (i = 121 d = 12D t = 12T)
7 -Cidmlt + sm I gt 0il~~ mt idmt shy
for each idmt combination (i = 12 I d = 12D m = 12M t = 12T)
M T 8 2 2 i dint =1I
m=I t=l
for each id combination (i = 12I d = 12D)
9 Fidt DFidt
For each idt combination (i = 12I d = 12D t = 12T)
10 Tui dp t - CTuidpt
for each uidpt combination (u = 12U i = 12I d =12D p = 12P t = 12T)
II idt i dt 11 M ~111Mi~~ 12 E d E for each idt combination
1 E dtgt(i = 12I d 12D
13 P 5ABt =12T)
14 Sicdt =5 icdt
for each icdt combination (i 12I c = 12C d = 12D t = 12T)
15 lidmt = 0 or I for all idh
Definition of Symbols
C = the number of coproducts per material
D = the number of model regions (destinations in case of transport
activities)
I = the number of model materials (raw materials intermediates and
fertilizers)
M = the number of production technologies
N = the number of model nutrients
P = the number of model regions in case of transport activities (origins)
T = the number of model time periods
U = the number of transportation technologies
ct = unit transportation cost ($ton)
cm = unit import cost ($ton)
ce = unit export prices ($ton)
cp = byproduct unit purchase cost ($ton)
cs = unit sales price of coproduct ($ton)
cx = unit production cost ($ton)
cb = plant construction cost ($)
an = tons of nutrient per ton of fertilizer
pct = of nutrient demand that may be imported
ac = tons of material required per ton of coproduct produced
ah = tons of material required per ton of material produced
sm = maximum plant expansion capacity
DN = nutrient demand (tons)
CA = initial production capacity (tonsmodel time period)
CIE = capital available from external and internal origin
RA = tons of raw material from indigenous reserve available per model
time period
DF = tons of fertilizer demand
CT = maximum allowable volume of transports (tons)
IM = maximum tons available for import
EX = maximum volume which may be exported (tons)
AB = material available for purchase as byproduct (tons)
MC = maximum sales possible for coproduct (tons)
Tupidpyt = material interregional transport activity by transportation techshy
nology u of material i from region d to region p in time period t
Mid t = import activity - material i region d time period t Eidt = export activity - material i region d time period t
Pid = byproduct purchase activity - material i coproduct c region d
time period t
Sicd t = coproduct sales activity - material i coproduct c region d
time period t
Xid = material pruduction activity - material i region d productiont
technology m time period t
Iidmt = plant construction activity for material i region d producshy
tion technology m time period t
Fi~d~t = fertilizer supply activity - material i region d time period t
Dicdt = coproduct disposal activity - material i coproduct c region d
time period t
Cidmt = production capacity expansion activity - material i region d
production technology m time period t
Discounting Factor
t
11= (1 + p) -q withtj=1
pj = rate of interest in time period j and
qj = number of years in time period j
Capital Recovery Factor
Pt cr = N + pt )- 1 + (1 + pt t
Pt = rate of interest in time period t and
Nt = number of years expected lifetime for a plant producing material i
Major Model Components
Raw materials from
in-country sources
to world marketsPrices
Raw materials from
world markets
Interregional raw material transport
Conversion Raw materials
Intermediates
Intermediatesto A world markets
Intermediates from
world markets
Interregional intermediates transport
Conversion Intermediates Fertilizers
Fertilizers to
world markets
Fertilizers from
ivorld markets
nterregional[
fertilizer transport
Fertilizer consumption Region IA Region IPRegion IIA Country I Country II-
Data Entries (to be Projected up to the End of Planning Period)
Reserves Industrial capacities Exploitation costs
Maximum demand
Availabilities Prices
Transport capacities Transport costs
Industrial capacities Conversion coefficients
Conversion costs
Mximum demand
Frices
Availabilities Prices
Transport capacities Transport costs
Industrial capacities Conversion coefficients Conversion costs
Maximum demand Prices
Availabilities Prices
Transport capacities Transport costs
Plant nutrient needs - per region percountr
ppendix Figure C-1 Data Requirements and Schematic Representation of Model Components and Interrelationships