economic feasibility of irrigation (technolo gy ... · irrigation structures and cost of irrigation...
TRANSCRIPT
Improving water use for dry season agriculture by marginal and tenant farmers in the Eastern Gangetic Plains
Economic Feasibility of Irrigation (technology) Interventions: Review of Concepts and Case Studies with typical irrigation
interventions
Working Paper
Authors: K.Palanisami Date: June 2016

2
Table of Contents 1. Introduction ..................................................................................................... 4 2. Irrigation investments- Types, sizes and economics ........................................ 7
2.1 Drip irrigation investment – Tamil Nadu, India ......................................... 7 2.1.2 Energy consumption ............................................................................ 8 2.1.3 Cost of irrigation .................................................................................. 9 2.1.4 Returns per unit of water and energy ................................................ 10 2.1.5 Cost of irrigation water under canal system ..................................... 12
2.1.6 Economics of Drip and Surface Irrigation Systems .............................. 12 2.1.7 Cost of establishment of drip irrigation structure............................. 13 2.1.8 Calculation of EAC for Drip irrigation system ................................. 14
2.2 Investment cost of alternative irrigation systems - USA .......................... 16 2.2.1 Irrigation investment costs ................................................................ 16 2.2.2 Economies of scale of different systems ........................................... 17
2.3 Investment in solar and diesel pumps for irrigation – Andhra Pradesh, India ................................................................................................................ 19
2.3.1 Investment in solar pumps ................................................................. 19 2.3.2 Trade off of pumping with diesel and solar energy sources .............. 20
2.4 Solar pumps for micro irrigation- Tamil Nadu, India .............................. 22 2.5 Supplemental irrigation and income- Karnataka state, India ................... 27 2.6 Irrigation scheduling and water use efficiency ......................................... 29 2.7 Watershed investment- Kothapally Watershed-- Andhra Pradesh, India . 30
2.7.1 Watershed investment ....................................................................... 30 2.7.2. Impact of investment in watersheds ................................................. 30
2.8 SRI and happa in Nayagram Block - West Bengal, India ....................... 31 2.8.1.SRI ..................................................................................................... 31 2.8.2 Happa (rain water harvesting ) in Nayagram Block .......................... 31
2.9 Tank irrigation investments -Nepal .......................................................... 33 2.9.1 Economics of interventions ............................................................... 34
2.10 Tank irrigation interventions -Odisha, India .......................................... 34 2.10.1 Irrigation investment-Renovation and Improvement of existing tanks .................................................................................................................... 35
2.11 Tank irrigation investments – Bihar, India ................................................. 35 2.12 Key elements in irrigation investment analysis: ..................................... 37
2.12.1 Using appropriate discount rate ....................................................... 37 2.12.2 Incorporation of risk in the investment analysis .............................. 37 2.12.3 Sensitivity analysis of investments .................................................. 38 2.12.4 Inclusion of subsidy in investment analysis .................................... 38 2.13.5 Financial versus economic costs and prices .................................... 39
3. Analysis of typical irrigation investments ...................................................... 39
3
3.1. Farm level water conservation and use ................................................... 39 3.1.1 In situ moisture conservation ............................................................. 40 3.1.2. Ex situ water harvesting and management ....................................... 44
4. Returns to irrigation investments in water conservation, storage and management ........................................................................................................ 62
4.1 Comparison of different irrigation investments ....................................... 62 References .......................................................................................................... 68
Annexures Annexure 1. Definitions of the cost and benefit concepts Annexure 2. Analysis of irrigation investments Annexure 3. Incorporation of risk in farm investment analysis Annexure 4. Social benefit cost analysis and role of subsidy in farm profitability Annexure 5. Financial versus economic costs and prices
4
1. Introduction
Farming under irrigated agriculture has become more and more a complex business due to frequent changes in the socio-economic and political environment including markets. A well developed plan will help in fitting enterprises and farming methods, (eg. methods of irrigation), together into a more profitable business unit. In recent years, technologies are constantly changing, agricultural prices are widely fluctuating and the availability of inputs is becoming not only scarce but also costlier particularly during agriculturally peak seasons. Such uncertainties in agriculture require major adjustments in farming operations and hence we have to think of proper planning so that the use efficiency of various economic resources could be improved and help achieve the defined objectives of the farm business. Irrigation plays a vital role in increasing farm production and hence profit. Irrigation significantly influences the cropping scheme as well as the productivity of the land. The extent of availability of water, methods of irrigation, costs of installation of irrigation structures and cost of irrigation have significant bearing on farm income as well as profit. Small-scale irrigation is an important aspect of irrigation development in countries like India where the climate is predominantly tropical. It involves individual or small groups of farms organized and managed by farmers. Small-scale irrigation development requires careful design, construction and management successful. Unlike in large- scale irrigation schemes, in a small irrigation system there are no tiers of management. Individual farmer alone decides how to irrigate, when to irrigate, how much to irrigate and generally run their irrigation structures with the help of the family members. Evidences show that small-scale farming is highly productive in terms of achieving higher productivity. The energy input into large-scale irrigation schemes can be up to 15 times greater than that required for small-scale farming for the same output of crops produced. In spite of their apparent attractiveness in terms of potential productivity, small-scale irrigation schemes are not always as efficiently run as they could be. Most schemes rely on pumping to supply their water needs and are often designed on the basis of minimum investment cost, with little or no thought given to the effect that this might have on operating costs over many years. For example, a farmer may purchase a cheap pump, which runs at a very low level of efficiency. The energy cost may be considerable and it

5
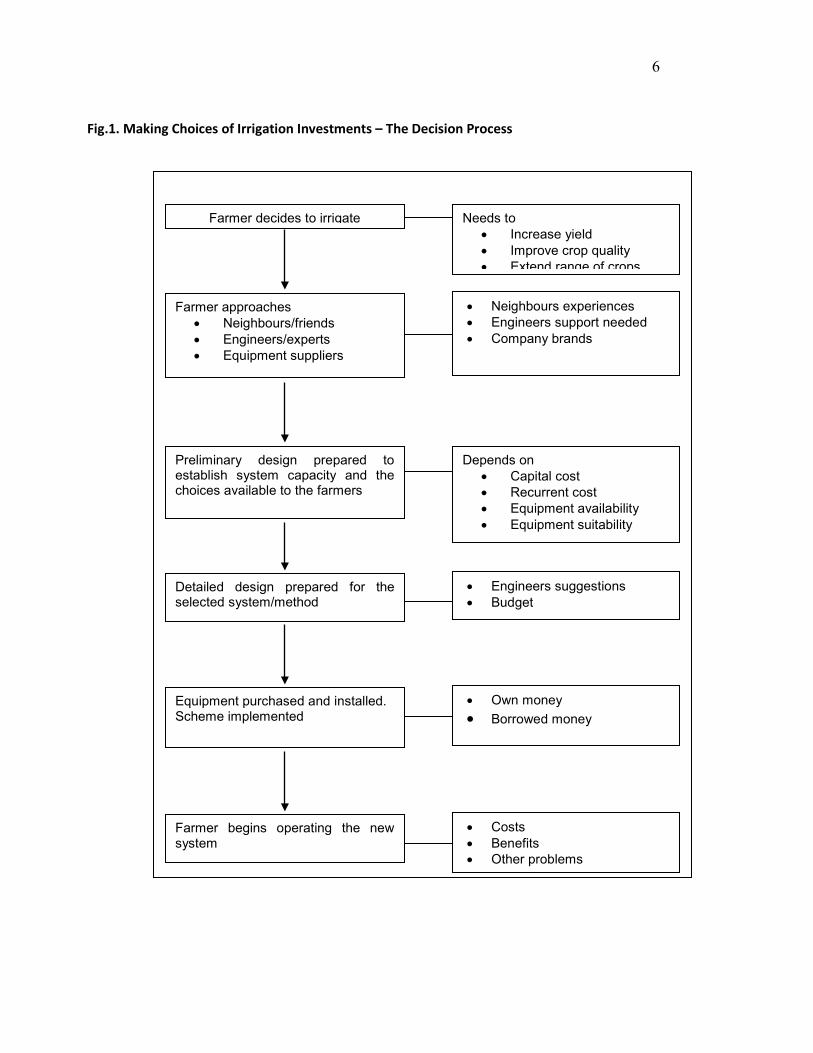
may require much servicing and other spares. If the farmer was to purchase a better and more appropriate pump then more money might be spent initially but there should be more costs on maintenance. Similar issues arise when selecting other components of an irrigation system. There may be different ways of irrigation on a farm and a basis for comparison and selection is needed. Cost is often the dominant factor. Thus it is necessary to understand the various costs involved in running irrigation structures when selecting equipment and proper running the irrigation schemes. As many small-scale irrigation schemes are already in operation, it is important to get best results. Understanding the various costs involved in operating irrigation structures help to determine energy use and operating costs and to find ways of reducing them though improved efficiency of irrigation structures and water use. Thus while making all decisions about installing new irrigation structures/schemes or going for alternate structures/methods, cost will be an important factor. Keeping these issues in view, the different costs concepts are used to demonstrate the methods of cost and return analysis of small-scale irrigation investment in agriculture. This will in addressing emerging issues and potentials in locations such as Indo-gangestic plains (IGP) where more scope exists for small scale irrigation investment to benefit the rural households. The schematic diagram (Fig.1) explains such investment options. The definitions of the concepts on various costs and benefits are given in Annexures 1 and 2.
6
Fig.1. Making Choices of Irrigation Investments – The Decision Process
Farmer decides to irrigate
Farmer approaches • Neighbours/friends • Engineers/experts • Equipment suppliers
Preliminary design prepared to establish system capacity and the choices available to the farmers
Detailed design prepared for the selected system/method
Equipment purchased and installed. Scheme implemented
Farmer begins operating the new system
Needs to • Increase yield • Improve crop quality • Extend range of crops
Depends on • Capital cost • Recurrent cost • Equipment availability • Equipment suitability
• Neighbours experiences • Engineers support needed • Company brands
• Engineers suggestions • Budget
• Own money • Borrowed money
• Costs • Benefits • Other problems

7
2. Irrigation investments- Types, sizes and economics This section deals with several case studies where irrigation investments options with varying sizes and scales have been successfully implemented. 2.1 Drip irrigation investment – Tamil Nadu, India Consider a farmer in Vellore district of Tamil Nadu owning land of 2.00 ha, cultivating crops such as rice, sugarcane and groundnut. The crop groundnut is cultivated under rainfed conditions for which the farmer is not giving irrigation. The area and yield of each crop is given as follows (Table 1).
Table.1. Details of crop production for the case study farmer
Crops Area (ha) Yield (kgs/ha) Water requirement (ha.cm)
No.of irrigation
Hours / irrigation /ha
Rice 0.59 4666 130 30 15.0 Sugarcane 0.97 98810 220 45 17.5
Groundnut 0.44 838 45 .. ..
The farmer has one open well and an electric motor of 5.0 HP using for irrigation purpose. The cost of dug well is Rs.45000 (digging in 1985). The cost of electric motor was Rs.8000. With the given information, workout the cost of irrigation per M3 of water and productivity per unit of water. The discharge rate of well water is worked out to 7.5 l/s. To calculate the quantity of water used by each crop the following formula can be used.
crop the of hectare one
sirrigation of number Total X irrigate to taken Time X rate Discharge
The total quantity of water pumped out in a year and the annual running hours can be worked out and from this the cost per ha cm of water and per hour running cost can be calculated.

8
2.1.1. Quantity of water used for each crop:
Rice
3121501000
6060301557 Mxxxx.dofwateruse.Qty ==
for 0.59 ha, the total water used is
12150 X 0.59 = 7168.5 M3 of water was used.
Sugarcane
35.212621000
6060455.175.7. MxxxxdofwateruseQty ==
for 0.97 ha, the total quantity of water used is
21262.5 X 0.97= 20624.6 M3 2.1.2 Energy consumption For irrigation purposes, farmers use electricity as the major energy. It is important that the quantum of electricity consumption for different crops. This will help the policy makers to take suitable policy options by comparing the cost of energy and returns per unit of energy consumed. The cropwise electricity consumption was computed as under: One HP motor pump runs for one hour consumes 0.746 kwh of power. Accordingly, kwh for each crop = [(HP of pump) X (0.746 kwh) X
( Number of hours per irrigation) X (No.of irrigation)] Note: The inefficiency was accounted in the hours of pumping while working out the electricity consumption of crops.
9
Quantum of electricity used for different crops Rice = 5.0 X 0.746 X 15 X 30 = 1678.5 kwh / ha Thus for 0.59 ha the electricity consumption = 990.32 kwh Sugarcane = 5.0 X 0.746 X 17.5 X 45 = 2937.37 kwh Thus for 0.97 ha, the electricity consumption = 2849.25 kwh 2.1.3 Cost of irrigation The cost of irrigation is the amortized cost of irrigation well, conveyance, storage structure, and annual repairs and maintenance costs. The cost of irrigation depends on the type of well (dug well, dug-cum-bore well, borewell, filter point well), current status of well, year of construction, average age / life of well, and the chosen discount rate. Amortized cost of irrigation is computed as the sum of amortized cost of well, amortized cost of pumpset and accessories, amortized cost of conveyance, and amortized cost of over ground storage structure. Amortized cost of well = [(Compounded cost of well) *(1+i) AL * i] ÷[(1 +i) AL-1] Where, AL = Average life of wells Compounded cost of well = (Initial investment on well)* (1+i) (2003-year of construction)
The discount rate of five per cent is used in amortization reflecting long term sustainable rate. Similarly investment on conveyance, pumpset, electrical installation, and groundwater storage structures were amortized. Labor cost of irrigation was merged with the cost of other cultural operations. The annual cost of irrigation is from all wells on the farm. The total cost of irrigation is then distributed over the total groundwater extracted on the farm, to obtain the cost per M3 of water extracted.
10
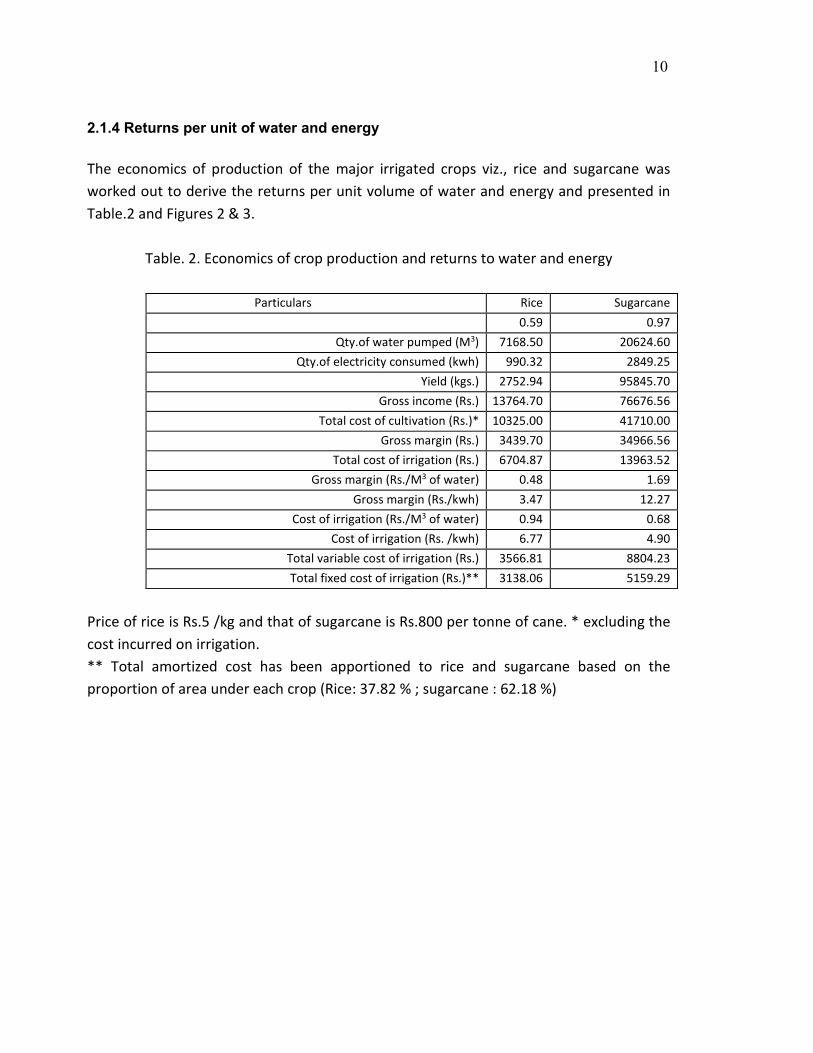
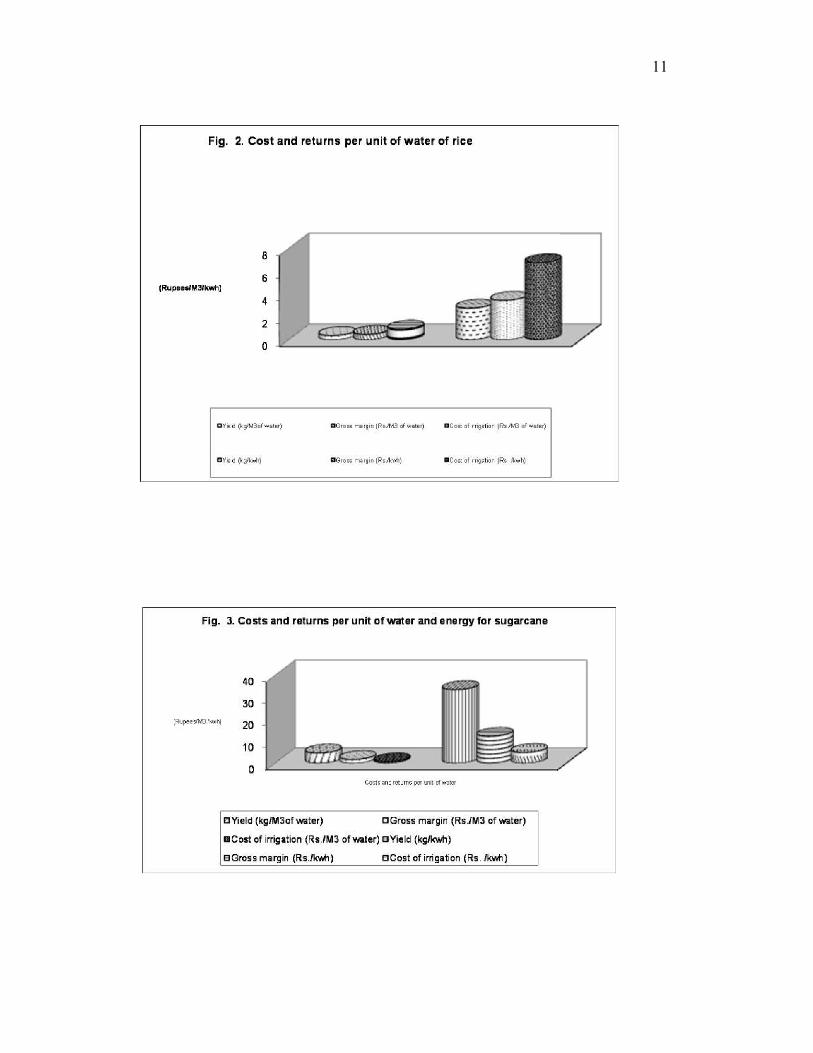
2.1.4 Returns per unit of water and energy The economics of production of the major irrigated crops viz., rice and sugarcane was worked out to derive the returns per unit volume of water and energy and presented in Table.2 and Figures 2 & 3.
Table. 2. Economics of crop production and returns to water and energy
Particulars Rice Sugarcane 0.59 0.97
Qty.of water pumped (M3) 7168.50 20624.60 Qty.of electricity consumed (kwh) 990.32 2849.25
Yield (kgs.) 2752.94 95845.70 Gross income (Rs.) 13764.70 76676.56
Total cost of cultivation (Rs.)* 10325.00 41710.00 Gross margin (Rs.) 3439.70 34966.56
Total cost of irrigation (Rs.) 6704.87 13963.52 Gross margin (Rs./M3 of water) 0.48 1.69
Gross margin (Rs./kwh) 3.47 12.27 Cost of irrigation (Rs./M3 of water) 0.94 0.68
Cost of irrigation (Rs. /kwh) 6.77 4.90 Total variable cost of irrigation (Rs.) 3566.81 8804.23 Total fixed cost of irrigation (Rs.)** 3138.06 5159.29
Price of rice is Rs.5 /kg and that of sugarcane is Rs.800 per tonne of cane. * excluding the cost incurred on irrigation. ** Total amortized cost has been apportioned to rice and sugarcane based on the proportion of area under each crop (Rice: 37.82 % ; sugarcane : 62.18 %)
11

12
It is evidenced that the total quantity of water pumped for rice crop is 7168.5 M3 and that of sugarcane is 20624.60 M3 of water. The returns per unit volume of water are worked out to Rs.0.48 / M3 of water for rice and it is Rs.1.69 for sugarcane. The return per unit volume of water can easily be compared with cost of irrigation. The cost of irrigation is worked out to Rs.0.94 / M3 of water for rice while it is Rs.0.68 for sugarcane. This clearly indicates that rice crop is not remunerative which consumes more water. This lucidly implies that rice crop is not an attractive crop under well irrigation. This helps the policy makers in comparing the cost and returns per unit of water energy and thereby set priorities for the future irrigation. 2.1.5 Cost of irrigation water under canal system In the case of canal system, first the historical cost of Dam construction is taken into account. Then this cost for different years should be compounded (at socially opportunity cost say 4 to 5 per cent) till the current year to arrive the present value of the investment already made. Then the compounded costs should be amortised to obtain the annual fixed cost component. The life of the Dam can be taken as 100 years. Then the operation and maintenance cost can be added upon with the annual fixed cost to arrive at the annual cost which should be further divided by the net irrigated area to arrive at the cost per hectare. Dividing this by quantity of water used per hectare will give the cost per unit quantity of water. 2.1.6 Economics of Drip and Surface Irrigation Systems Drip method of irrigation is recently introduced in India to enhance the water use efficiency in irrigation. Notably, the on-farm irrigation efficiency of properly designed and managed drip irrigation system is about 90 per cent whereas it is about 70 per cent for sprinklers and just about 45 per cent for surface irrigation methods. Experimental results from various research stations located in India do indicate that drip method of irrigation increases crop yield and reduced cultivation cost and water consumption. The basic approach used for assessing the relative economic impact of drip method of irrigation is a comparison between the adopters (with drip) and the non-adopters (without drip) in the context of the same crop. Depending upon the nature of investment (annuals or perennials) different methodologies are adopted to work out the economics of drip irrigation.

13
Let us consider a case of farmer in Salem District of Tamil Nadu owning 2 hectares of land and cultivating the crops like tapioca (1.0 ha.), groundnut (0.5 ha.) and sorghum (0.5 ha ). He has a open dug well constructed during 1980 with a 5 HP electric motor. The total cost of construction of well was rs.75000 and electric motor was Rs.8000 during 1980. Now he realize that the water available in the wells is insufficient to cultivate crops and he is planning for installation of drip irrigation system on his field so that the water saving could be achieved. Now he has two options (i) irrigating tapioca with surface irrigation and (ii) installation of drip irrigation system for 1.0 ha and thereby he could save water up to 50 per cent and realize 20-25 per cent increase in yield of tapioca. How an agricultural specialist advise the farmers in respect to (i) establishment of drip unit in one hectare, (ii) Cost of cultivation of tapioca with and without drip iriigation and (iii) returns per unit of water. 2.1.7 Cost of establishment of drip irrigation structure In working out the cost-return analysis, the cost incurred in establishment and maintenance of the drip irrigation system can be apportioned to the entire useful life period. The useful life period for drip irrigation systems can be taken as 10 years (Table 3).
Table.3.Per hectare installation cost of drip irrigation system
Particulars ost ( Rs.) 6650 nos) 26600.00 (8900 nos.) 26700.00
(200 Mtrs) 5000.00 ain line and accessories 5500.00
Total 63800.00 To work out the economics of drip irrigation, the establishment cost on drip irrigation need to be amortised. Following Equivalent Annualised Cost (EAC) method, the cost of drip irrigation system can be amortised. Thus, the amortised cost of drip irrigation system is worked out as follows:

14
2.1.8 Calculation of EAC for Drip irrigation system Steps involved in calculating EAC
• Calculate CRF for 10 years at 12.5 per cent interest rate
18060112501
125011250CRF 10
10.
).().)(.(
=−+
+=
• Calculate annualised capital cost
Annualised capital cost = Capital cost X CRF
= 63800.00 x 0.1806
= Rs.11522.28
• Calculate the EAC for the drip irrigation system EAC = Annualised capital cost + Annual operation and maintenance cost
EAC = Rs.11522.28 + Rs.750.00 = Rs. 12272.28 Comparing the EAC of different irrigation schemes, one can decide the type of irrigation system to be followed so as to minimise the cost of operation. However, the EAC is affected as changes in both the interest rate and the life of the irrigation system. The farmer incurred following costs towards cultivation of tapioca in 1 ha. They include both fixed and variable costs. Particulars Amount (Rs.) Particulars Amount (Rs.) Seeds/sets : 353.00 Plant protection : 40.00
15
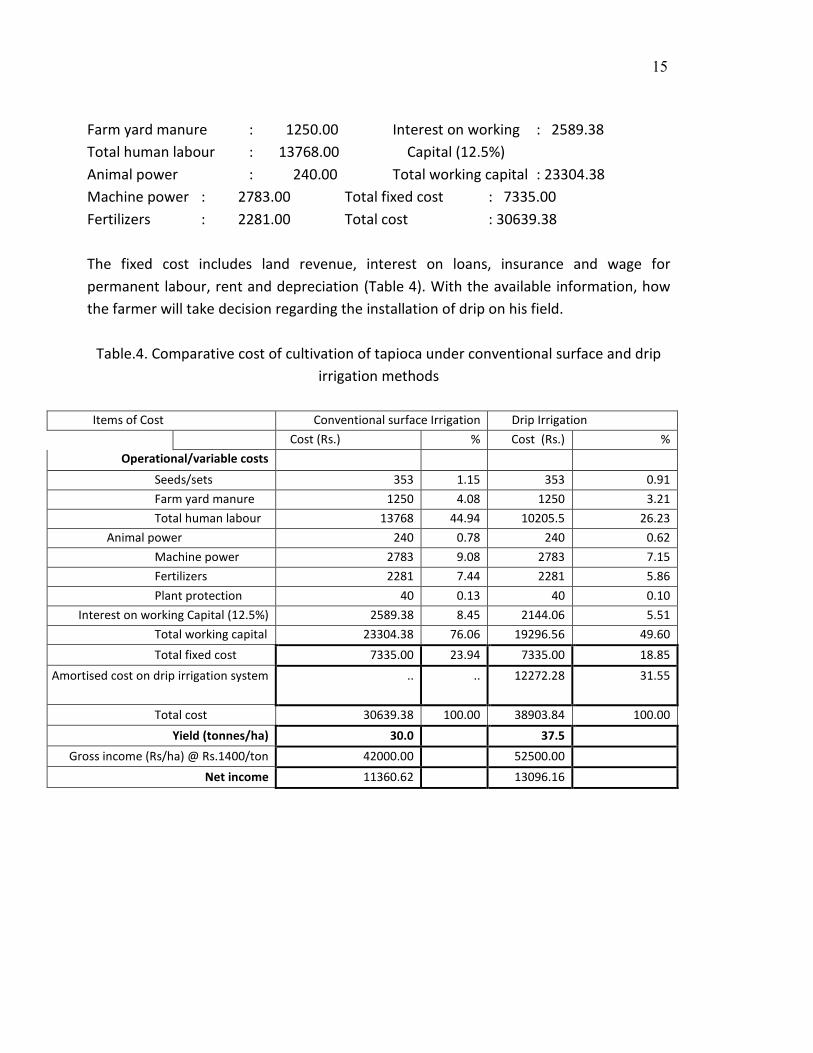
Farm yard manure : 1250.00 Interest on working : 2589.38 Total human labour : 13768.00 Capital (12.5%) Animal power : 240.00 Total working capital : 23304.38 Machine power : 2783.00 Total fixed cost : 7335.00 Fertilizers : 2281.00 Total cost : 30639.38 The fixed cost includes land revenue, interest on loans, insurance and wage for permanent labour, rent and depreciation (Table 4). With the available information, how the farmer will take decision regarding the installation of drip on his field.
Table.4. Comparative cost of cultivation of tapioca under conventional surface and drip irrigation methods
Items of Cost Conventional surface Irrigation Drip Irrigation
Cost (Rs.) % Cost (Rs.) % Operational/variable costs
Seeds/sets 353 1.15 353 0.91 Farm yard manure 1250 4.08 1250 3.21 Total human labour 13768 44.94 10205.5 26.23
Animal power 240 0.78 240 0.62 Machine power 2783 9.08 2783 7.15 Fertilizers 2281 7.44 2281 5.86 Plant protection 40 0.13 40 0.10
Interest on working Capital (12.5%) 2589.38 8.45 2144.06 5.51 Total working capital 23304.38 76.06 19296.56 49.60 Total fixed cost 7335.00 23.94 7335.00 18.85
Amortised cost on drip irrigation system .. .. 12272.28
31.55
Total cost 30639.38 100.00 38903.84 100.00 Yield (tonnes/ha) 30.0 37.5
Gross income (Rs/ha) @ Rs.1400/ton 42000.00 52500.00 Net income 11360.62 13096.16
16
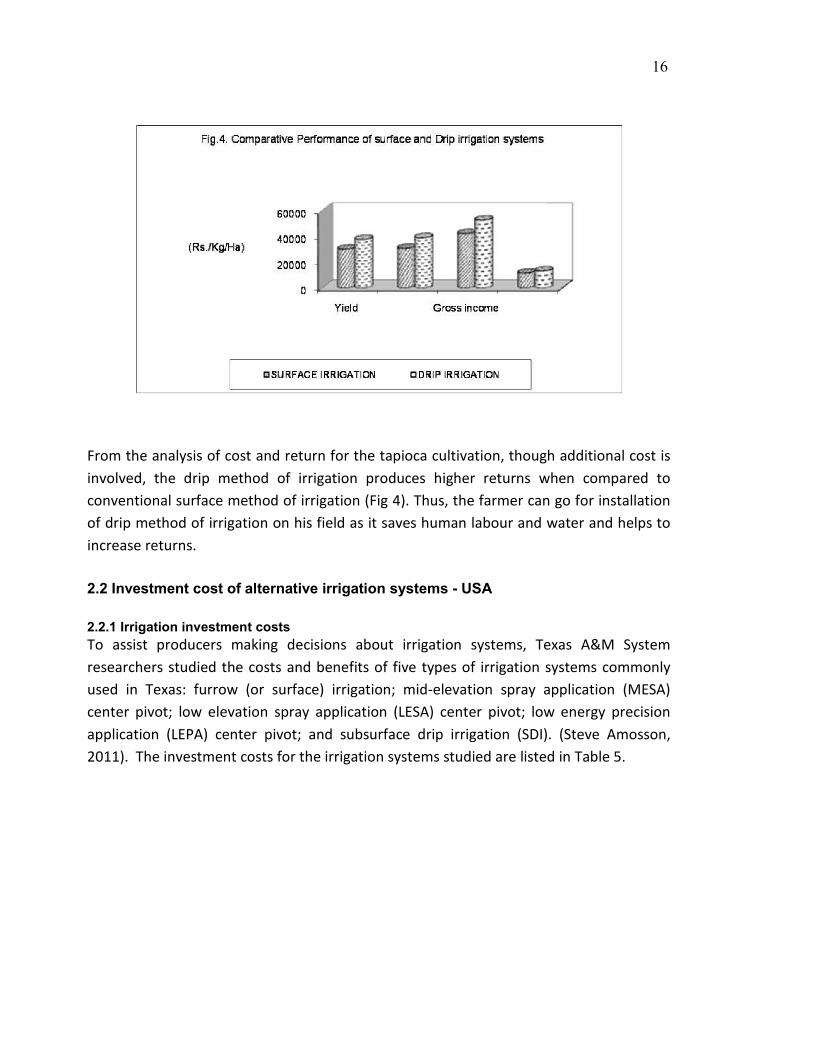
From the analysis of cost and return for the tapioca cultivation, though additional cost is involved, the drip method of irrigation produces higher returns when compared to conventional surface method of irrigation (Fig 4). Thus, the farmer can go for installation of drip method of irrigation on his field as it saves human labour and water and helps to increase returns. 2.2 Investment cost of alternative irrigation systems - USA 2.2.1 Irrigation investment costs To assist producers making decisions about irrigation systems, Texas A&M System researchers studied the costs and benefits of five types of irrigation systems commonly used in Texas: furrow (or surface) irrigation; mid-elevation spray application (MESA) center pivot; low elevation spray application (LESA) center pivot; low energy precision application (LEPA) center pivot; and subsurface drip irrigation (SDI). (Steve Amosson, 2011). The investment costs for the irrigation systems studied are listed in Table 5.

17
Table 5. Investment costs of alternative irrigation systems Distribution system Gross investment
($/acre) Net investment1
($/acre) Net investment2 ($/acre)
208.56 183.62 161.99 Center pivot, quarter mile 556.00 467.57 413.28
Center pivot, half mile 338.00 284.24 251.24 Subsurface drip irrigation 1,200.00 1,009.13 891.97
1 Assumes a marginal tax rate of 15 % and discount rate of 6 % 2 Assumes a marginal tax rate of 28 % and discount rate of 6 % Salvage values are respectively 0, 20, 20% for the three systems and useful system life is 25 years for three systems. Source: Steve Amosson, 2011. The costs for the well, pump, and engines were assumed to be the same for each irrigation system and were not included in the investment cost. The gross investment for each quarter-section system (160 acres) ranged from $208.56 per acre for furrow to $1,200.00 for subsurface drip irrigation with emitter lines spaced 5 feet apart. The gross investment for quarter-mile center pivot system is $556.00 per acre. 2.2.2 Economies of scale of different systems There are definite economies of scale associated with center pivot systems. You can substantially reduce the investment cost of a center pivot irrigation system by increasing the length of the pivot. Using a half-mile center pivot rather than four quarter-mile systems reduces the gross investment by 40 percent, or $218.00 per acre (from $556.00 to $338.00), as shown in Table 5. In addition, the corners become more functional for farming increasing from 8 to 40 acres. To calculate the net investment, subtract the dis-counted salvage value and the tax savings associated with a new system from the purchase price of the distribution system. By accounting for discounted tax savings and salvage value, producers can get a true comparison of what they would pay for each system. The net investments for the different systems vary significantly less than the gross investments. For example, the difference in net investment between a quarter-mile center pivot and furrow is $283.95 per acre ($467.57 − $183.62), given a 15 percent tax

18
and 6 percent discount rate. The net investment for a subsurface drip irrigation system, $1,009.13 per acre, is substantially less than the gross investment of $1,200.00 per acre. The economic feasibility of a new irrigation system can be affected by the marginal tax rate. For example, if a producer’s marginal tax rate is 28 percent instead of 15 percent, the net investment in subsurface drip is reduced by $117.16 (from $1,009.13 to $891.97) per acre; the net investment in furrow is reduced by $21.63 (from $183.62 to $161.99) per acre. Therefore, all systems become more feasible at the higher tax rate. The most expensive system is affected the most by the marginal tax rate; the least expensive system is affected the least ($117.16 versus $21.63 per acre).
6. Fixed and variable pumping costs per acre-inch for the intermediate water-use scenario (sorghum/soybeans) at a 350-foot pumping lift for five irrigation systems
------------ $/ac-in. of water ------------ Cost component/system rrow MESA ESA EPA SDI
A. Fixed cost Depreciation 0.41 1.13 1.27 1.37 3.02
Taxes 0.02 0.07 0.08 0.09 0.19 Insurance 0.06 0.21 0.24 0.26 0.57
Interest charges 0.61 0.85 0.95 1.03 2.27 Total fixed costs 1.10 2.26 2.54 2.75 6.05
B. Variable costs Fuel costs 6.04 6.55 6.22 6.22 6.22
LMR1 charges 3.93 4.26 4.04 4.04 4.04 Labor costs 1.19 0.91 0.80 0.75 0.73
Total variable costs 11.16 11.72 11.06 11.01 10.99 Total cost (A+B) 12.26 13.98 13.60 13.76 17.04
Source: Steve Amosson, 2011. The estimated total cost per acre-inch varied considerably among the systems evaluated. Furrow had the lowest total cost at $12.26 per acre-inch; subsurface drip had the highest cost at $17.04 per acre-inch. LESA, LEPA, and MESA center pivot systems ranged from $13.60 to $13.98 per acre-inch (Table 6).
Evaluating the conversion or replacement of an existing system from the data presented in Table 7 is more difficult. The expected benefits for each system as given in Table 7 will remain the same. However, a producer will need to estimate the cost of conversion, or the

19
net investment of the “new” system adjusted for the salvage value of the present system, in order to evaluate its feasibility. It appears that the water and/or field operation savings justify converting furrow to center pivots whenever physically possible.
Table 7. Comparison of net investment cost and benefits of irrigation technology adoption at three water-use
scenarios ------ Net benefits ($/ac)-------------
System Net investment cost
Change in net investment1
High water use ntermediate water use Low water use
Furrow 183.62 — — — — MESA 467.57 283.95 999.17 817.60 631.70 LESA 467.57 283.95 1,531.75 1,206.25 869.44 LEPA 467.57 283.95 1,747.71 1,359.04 966.22
SDI 1,009.13 825.51 1,274.21 873.88 465.17 net investment cost from furrow
Souce: Steve Amosson, 2011 2.3 Investment in solar and diesel pumps for irrigation – Andhra Pradesh, India
2.3.1 Investment in solar pumps In the groundwater abundant areas and in the open well areas where recharge is good, solar irrigation pump investment option can be validated to overcome the electricity scarcity. This also reduces the marginal cost of pumping and generate massive livelihoods (Shah and Kishore, 2012).
The solar irrigation pumps with higher subsidy and zero marginal cost is attracting the farmers’ attention in the recent years (Tewari, 2012, Kishore et al 2014). However, leaving it to the open market it has unique cost structure with high capital investment. This makes it similar to the electric pump investments with flat tariff at zero marginal cost.
Hence, solar pump integrated with micro irrigation and supplementary irrigation to various crops was field tested for the Kharif 2015 (July-December). The present section studies the economics of such energy efficient solar energy intervention. The total cost of the solar irrigation pump with micro irrigation for 0.4 ha is Rs.370,000. The solar pump is used for both drip irrigation and surface irrigation. The total area under cultivation is 2.8 ha with open well and canal as irrigation sources. Brinjal, Cotton and sugarcane are cultivated under the system. A 2 hp motor is used for pumping instead of 5 hp diesel
20
pump with consistent power supply.Six panels with 240 watts/panel is installed for 2 hp motor. The discharge rate of the solar irrigation pump installed is 1.2 lps with 6-8 hrs discharge.
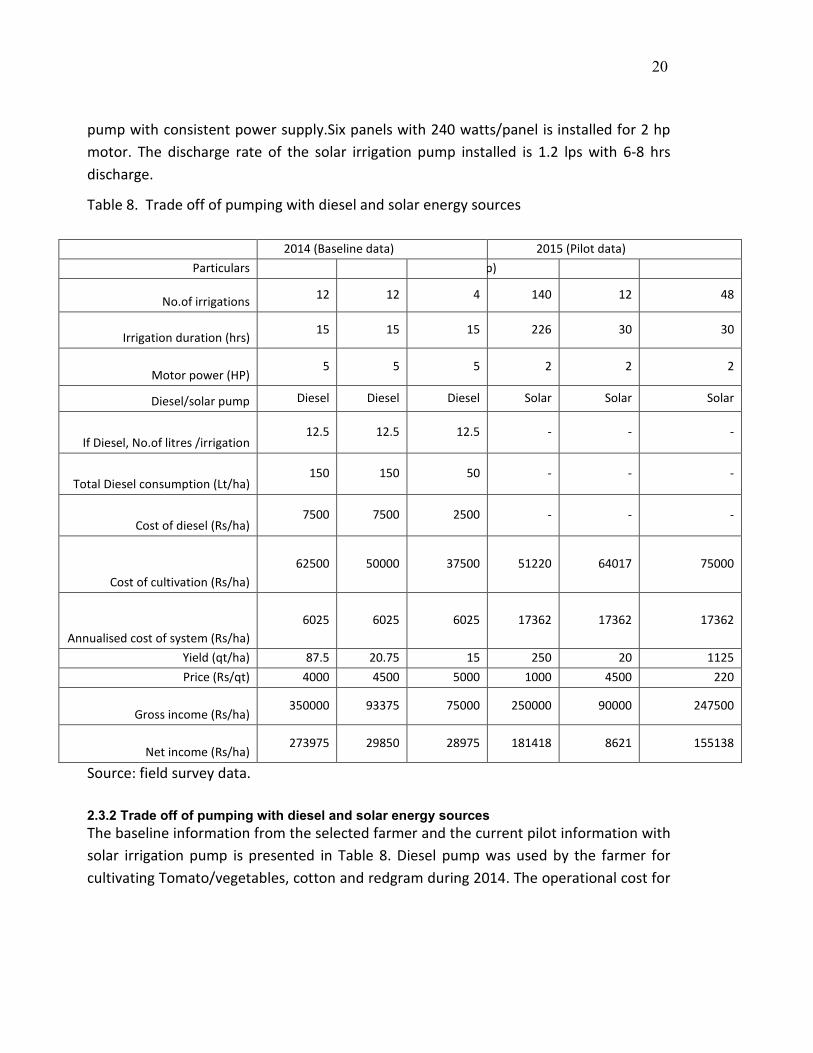
Table 8. Trade off of pumping with diesel and solar energy sources
2014 (Baseline data) 2015 (Pilot data) Particulars p)
No.of irrigations 12 12 4 140 12 48
Irrigation duration (hrs) 15 15 15 226 30 30
Motor power (HP) 5 5 5 2 2 2
Diesel/solar pump Diesel Diesel Diesel Solar Solar Solar
If Diesel, No.of litres /irrigation 12.5 12.5 12.5 - - -
Total Diesel consumption (Lt/ha) 150 150 50 - - -
Cost of diesel (Rs/ha) 7500 7500 2500 - - -
Cost of cultivation (Rs/ha) 62500 50000 37500 51220 64017 75000
Annualised cost of system (Rs/ha) 6025 6025 6025 17362 17362 17362
Yield (qt/ha) 87.5 20.75 15 250 20 1125 Price (Rs/qt) 4000 4500 5000 1000 4500 220
Gross income (Rs/ha) 350000 93375 75000 250000 90000 247500
Net income (Rs/ha) 273975 29850 28975 181418 8621 155138
Source: field survey data. 2.3.2 Trade off of pumping with diesel and solar energy sources The baseline information from the selected farmer and the current pilot information with solar irrigation pump is presented in Table 8. Diesel pump was used by the farmer for cultivating Tomato/vegetables, cotton and redgram during 2014. The operational cost for
21
the diesel pump varies with the crop and maintenance cost.The initial findings and famers perception show that the solar irrigation pumps were able to supplement the irrigation water without any power interruptions. The higher cost of diesel for irrigation and limited supply of electricity in the study areas/ rural areas need to think of adopting to solar irrigation pump system to favour the farmer crop and environment.
The carbon emissions contributed due to the electric pump (11.09 million tonnes) and diesel pumps (3.29 million tonnes) are high as India is the top abstractors of the groundwater (GoI 2005, Shah 2009). Many researchers estimated carbon dioxide emissions in different parts of world, where water pumping and conveyance accounts to the emissions from energy activities in the agricultural sector (Zou et al 2015, Sattenspiel et al 2009, Quershi 2014, and Reddy et al 2015). Preferring more electricity or diesel pump would increase the emissions and abatement cost to the state government.
The solar irrigation pumps can replace the emission challenges in India. But the initial capital cost is reducing the solar irrigation pump adoption in the country. Nevertheless, if the governments really think of emission cleaning costs in the developing countries like India, governments can substitute the cost of cleaning to subsidize the solar irrigation pump. For example, Uttar Pradesh alone can provide 95 thousand solar irrigation pumps with the emissions cleaning cost from diesel and electricity (Kakumanu, 2015). On the other hand, the groundwater scare states like Gujarat and Karnataka are preferring to integrate drip irrigation with solar systems to save water and energy (GGRC, 2015). Rajasthan has promoted solar energy with 86% subsidy to horticultural farmers who use drip irrigation and farm ponds (Kishore et al 2014). This has replaced majority of the diesel pumps and tractors in Rajasthan and saved the operation cost of diesel worth up to Rs 65,000. Besides saving diesel and electricity, solar also saved labour as the requirement of operators would be reduced. The timeliness of irrigation without any shortages in the irrigation schedule also enhance water use efficiency by 5-10% (Kishore et al 2014). The tubewells that pumped 400-500 hrs/year with diesel will pump 1500-2000 hrs/year with solar (Shah et al 2014).

22
2.4 Solar pumps for micro irrigation- Tamil Nadu, India SSuuppppllyy,, IInnssttaallllaattiioonn,, CCoommmmiissssiioonniinngg aanndd 55 YYeeaarrss CCoommpprreehheennssiivvee MMaaiinntteennaannccee ooff 55 HHPP AACC SSoollaarr PPVV PPuummppiinngg SSyysstteemmss eeaacchh 44880000 WWPP ccaappaacciittyy wwiitthh AAuuttoommaattiicc TTrraacckkiinngg FFaacciilliittyy..
Advantages of solar pv pumping system
• The solar PV pumping system is an excellent alternative to conventional pumping systems and provides renewable source of energy which is more useful to Agriculture.
• Solar PV pumping systems provides uninterrupted irrigation in the day time to agricultural fields.
• The Solar PV pumping systems are last long for considerable period of time and recurring expenses are low.
• It can be easily fixed, dependable and simple maintenance is sufficient. • The Solar PV pumping systems are environmental friendly and reduce
crude oil imports for our country. • The Solar PV pumping systems are a boon to remote places and in
places where immediate conventional power supply cannot be provided. It helps in saving in electrical costs and improves energy savings.
DDeessccrriippttiioonn ooff tthhee ssyysstteemm iinnssttaalllleedd::
DIVISION : COIMBATORE SUBDIVISION : AEE (AE) / AED / COIMBATORE
DISTRICT : COIMBATORE TALUK : COIMBATORE (SOUTH) BLOCK : THONDAMUTHUR
REVENUE VILLAGE : DEVARAYAPURAM SF NO : 562
NAME AND ADDRESS OF THE BENEFICIARY :
hiru. T.Kathiresan, S/O Thiyagarajan, 112, Vadakkuveethi, Devarayapuram, hondamuthur, Coimbatore – 641 109
(Mobile - 94434 26692) ME OF THE FIRM INSTALLED THE SOLAR PV PUMPING SYSTEM : M/S. RICH PHYTO CARE (P) LTD,
23
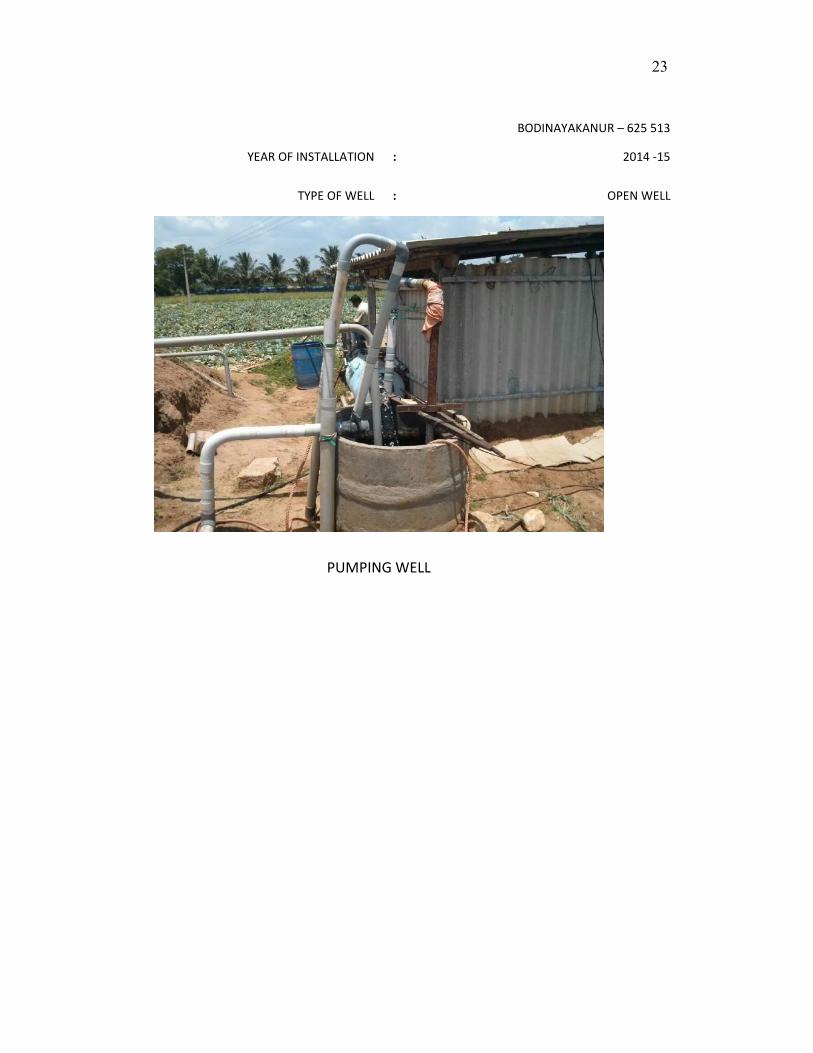
BODINAYAKANUR – 625 513
YEAR OF INSTALLATION : 2014 -15
TYPE OF WELL : OPEN WELL
PUMPING WELL
24
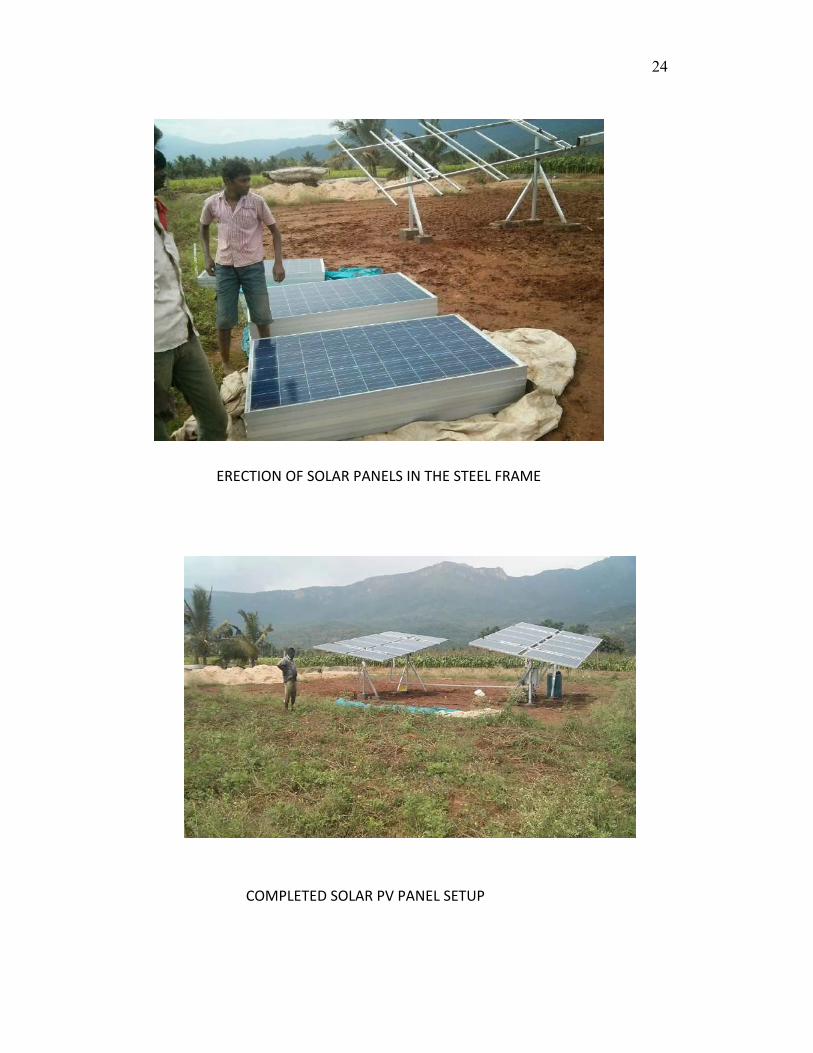
ERECTION OF SOLAR PANELS IN THE STEEL FRAME
COMPLETED SOLAR PV PANEL SETUP
25
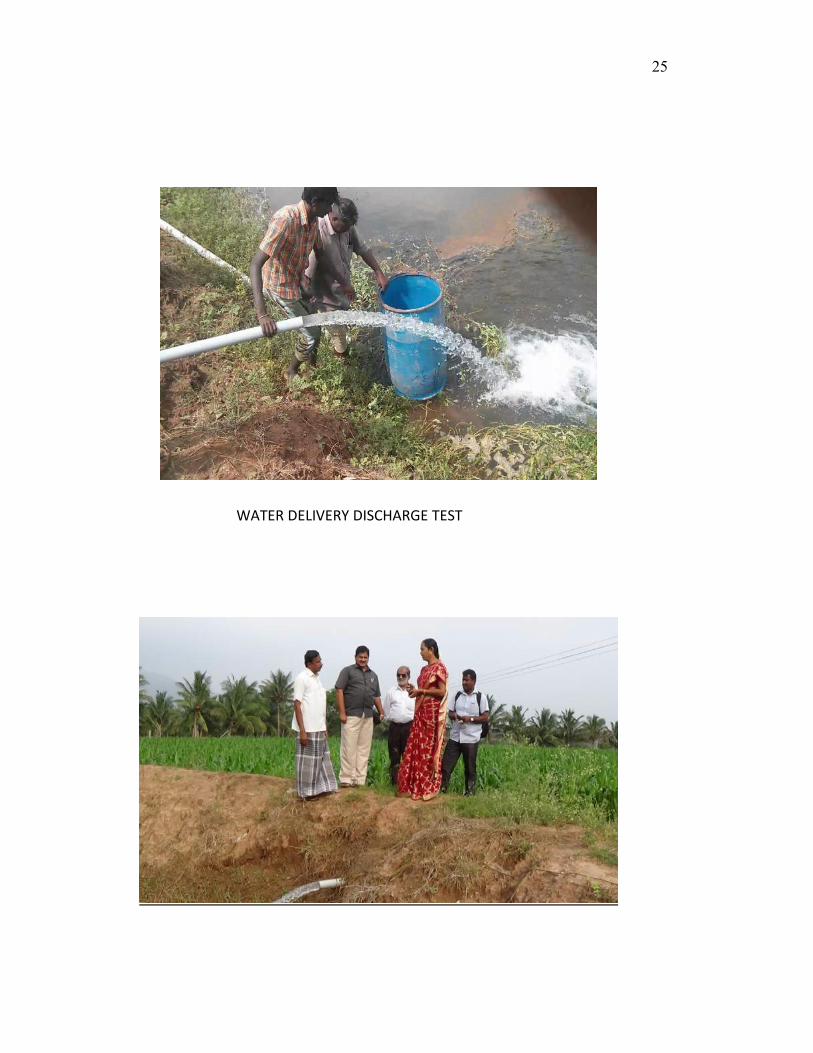
WATER DELIVERY DISCHARGE TEST

26
INTERACTION WITH THE FARMER ABOUT THE PERFORMANCE
OF SOLAR PV PUMPING SYSTEM
Mr.T.Kathiresan, farmer Devarayapuram
27
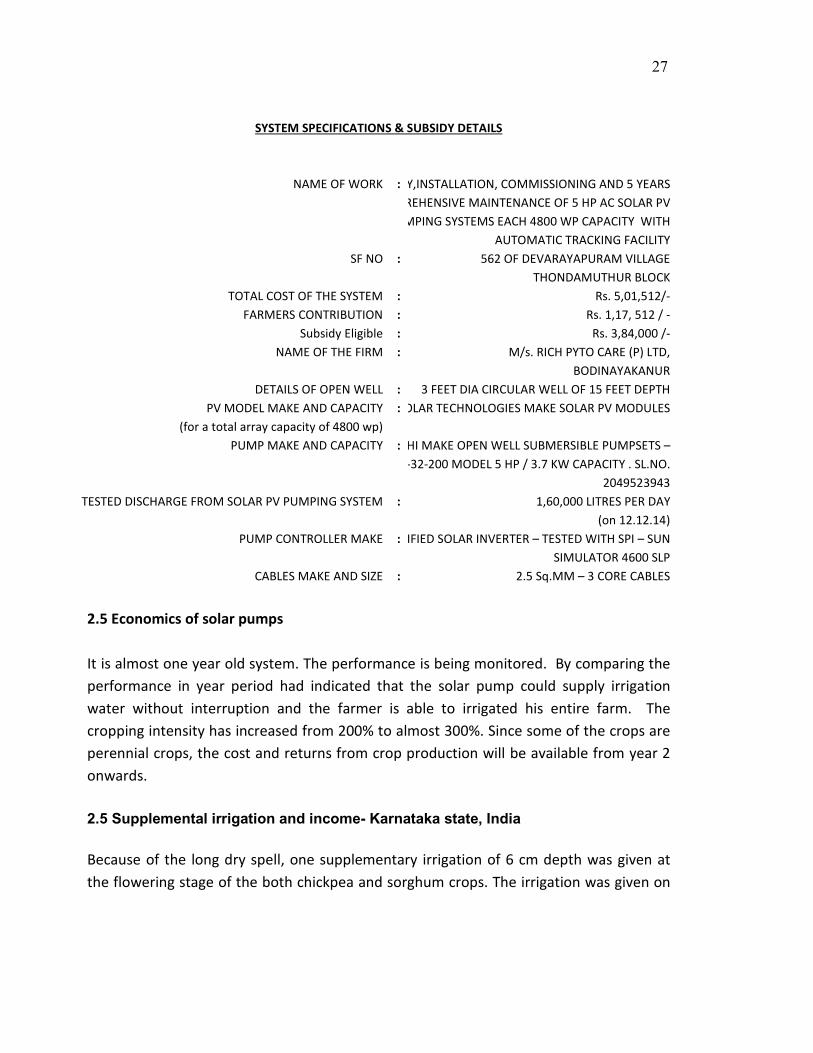
SYSTEM SPECIFICATIONS & SUBSIDY DETAILS
NAME OF WORK : Y,INSTALLATION, COMMISSIONING AND 5 YEARS REHENSIVE MAINTENANCE OF 5 HP AC SOLAR PV MPING SYSTEMS EACH 4800 WP CAPACITY WITH
AUTOMATIC TRACKING FACILITY SF NO : 562 OF DEVARAYAPURAM VILLAGE
THONDAMUTHUR BLOCK TOTAL COST OF THE SYSTEM : Rs. 5,01,512/-
FARMERS CONTRIBUTION : Rs. 1,17, 512 / - Subsidy Eligible : Rs. 3,84,000 /-
NAME OF THE FIRM : M/s. RICH PYTO CARE (P) LTD, BODINAYAKANUR
DETAILS OF OPEN WELL : 3 FEET DIA CIRCULAR WELL OF 15 FEET DEPTH PV MODEL MAKE AND CAPACITY
(for a total array capacity of 4800 wp) : OLAR TECHNOLOGIES MAKE SOLAR PV MODULES
PUMP MAKE AND CAPACITY : HI MAKE OPEN WELL SUBMERSIBLE PUMPSETS – -32-200 MODEL 5 HP / 3.7 KW CAPACITY . SL.NO.
2049523943 TESTED DISCHARGE FROM SOLAR PV PUMPING SYSTEM : 1,60,000 LITRES PER DAY
(on 12.12.14) PUMP CONTROLLER MAKE : IFIED SOLAR INVERTER – TESTED WITH SPI – SUN
SIMULATOR 4600 SLP CABLES MAKE AND SIZE : 2.5 Sq.MM – 3 CORE CABLES
2.5 Economics of solar pumps It is almost one year old system. The performance is being monitored. By comparing the performance in year period had indicated that the solar pump could supply irrigation water without interruption and the farmer is able to irrigated his entire farm. The cropping intensity has increased from 200% to almost 300%. Since some of the crops are perennial crops, the cost and returns from crop production will be available from year 2 onwards. 2.5 Supplemental irrigation and income- Karnataka state, India Because of the long dry spell, one supplementary irrigation of 6 cm depth was given at the flowering stage of the both chickpea and sorghum crops. The irrigation was given on

28
3rd and 4th December 2013 through the sprinkler system from the farm pond. In the irrigated plot an additional yield of 32.3 and 33.3 per cent was recorded in sorghum and chickpea crops, respectively (Table 9). Table 9. Impact of supplementary irrigation on the grain yield of sorghum and chickpea (q/ha)
Crop Irrigation with
cm depth of water ol
rease over ontrol
* nt yield)
13.5 10.2 32.3
(in sapota)
5.95 4.46 33.3
*Sorghum+ chickpea (2:4)
Yet in another experiment on the influence of supplemental irrigations in medium deep black soil at Bijapur with different horticultural crops, it was observed that guava, ber and fig responded in a range of 41.7 to 122.6 per cent more with irrigations over control. The highest response to supplemental irrigations was recorded in guava (122.6%) and the lowest response was found in fig (41.7%). However, the income from ber was the highest (Rs.26,180/ha) followed by fig (Rs.8,046/ha) and guava (Rs.5,544/ha) after third year of their planting (Table 10 ). Table 10. Influence of supplemental irrigations on different cropping systems at Bijapur
Cropping system Yield (q/ha) Gross income (Rs/ha) Ber Irrigated 52.36 26180
Control 32.65 16325 Fig Irrigated 13.41 8046
Control 9.46 5676 Guava Irrigated 27.72 5544
Control 12.45 2490 Subabul Irrigated 96.48 1447
Control 62.78 942 Rabi sorghum Irrigated 19.45 (46.30) 5556
Control 10.00 (18.42) 2777
29
Note: Figures in parentheses indicate straw yield of sorghum Source: Regional Agricultural Research Station, 2014. 2.6 Irrigation scheduling and water use efficiency The amount of water lost through these processes is affected by irrigation system design and irrigation management. Irrigation scheduling minimizes runoff and percolation losses, which in turn usually maximizes irrigation efficiency by reducing energy and water use. In the case of surface irrigation sources, water can be saved in the canals and in groundwater sources, both water and energy can be saved. When water supplies and irrigation equipment are adequate, irrigators tend to overirrigate, believing that applying more water will increase crop yields. Instead, overirrigation can reduce yields because the excess soil moisture often results in plant disease, nutrient leaching, and reduced pesticide effectiveness.
The quantity of water pumped can often be reduced without reducing yield. Studies have shown that irrigation scheduling using water balance methods can save 15 to 35 percent of the water normally pumped without reducing yield. Maximum yield usually does not equate to maximum profit. The optimum economic yield is less than the maximum potential yield. An optimum irrigation schedule maximizes profit and optimizes water and energy use. Irrigation scheduling requires knowledge of the sources of irrigation water, soil types, soil-water status, type of crops, the status of crop stress and the potential yield reduction if the crop remains in a stressed condition.
The additional costs of irrigation scheduling will be negligible as it involves only planning the irrigation schedule whereas the benefits will be 3-4 times higher than regular irrigation practices due to saving in water, energy and increase in crop yield. It is important to derive the optimal irrigation schedules for different crops. The ICAR water management centres and water management projects have demonstrated the increase yield and higher returns in different crops due to optimal irrigation scheduling. What is needed is the better water control which is possible under groundwater irrigation (ICAR, 2011).

30
2.7 Watershed investment- Kothapally Watershed-- Andhra Pradesh, India 2.7.1 Watershed investment There are 62 open wells in the Adarsha watershed, most of which occur along the main watercourse. All the wells were georeferenced, and water levels were monitored continuously on a fortnightly basis. There were 15 bore wells before project initiation, and 55 new bore wells were dug during the project. There was a significant improvement in the yields of most wells, particularly those located near check dams. Due to additional groundwater recharge, a total of 200 ha were irrigated in post-kharif season and 100 ha in post-rabi season, mostly vegetables, during the 2002-2003 cropping season. Based on three years (1999–2001) of observations of groundwater levels in open wells, the estimated mean average rise of ground water was 415 cm. Thus the average contribution of the seasonal rainfall to groundwater in the watershed could be estimated at approximately 27% of the seasonal rainfall (assuming the specific yield of the aquifer material as 4.5%) (Pathak et al. 2002). 2.7.2. Impact of investment in watersheds The watershed project resulted in impacts on the livelihoods of the community and on the natural resource base. Average maize equivalent grain yield (kg ha-1), cost of cultivation (Rs ha-1), total income (Rs ha-1), net profit (Rs ha-1) and cost benefit ratio for different cropping systems at Adarsha Watershed, Kothapally, 1999-2006 (Table 11). A new farmer participatory consortium model for efficient management of natural resources emerged from the lessons learned from long-term watershed-based research led by ICRISAT and national partners (Sreedevi et al 2002).
Table. 11. Watershed development in Kothapally
Increased crop productivity and incomes with different cropping systems in Kothapally. Cropping systems Average maize
equivalent grain yield (kg ha-1)
Cost of ultivation (Rs ha-1)
Total income (Rs ha-1)
Net profit (Rs ha-1)
Cost benefit ratio
1. Improved sole maize 3580 5230 16410 11170 2.16 2. Improved maize/pigeonpea
intercrop system 5850 7550 27870 22010 2.88
3. Improved sorghum/pigeonpea intercrop system
5500 7240 25620 18380 2.57
4. Improved sole sorghum 3330 5000 15070 10070 2.11 5. Farmers practice sole maize 1830 3870 8350 4480 1.11
31
6. Farmers practice sorghum/ pigeonpea intercrop system
2900 6320 13680 7360 1.13
7. Hybrid cotton 5880 15190 23950 8760 8. BT cotton 5900 16360 35240 18880
2.8 SRI and happa in Nayagram Block - West Bengal, India
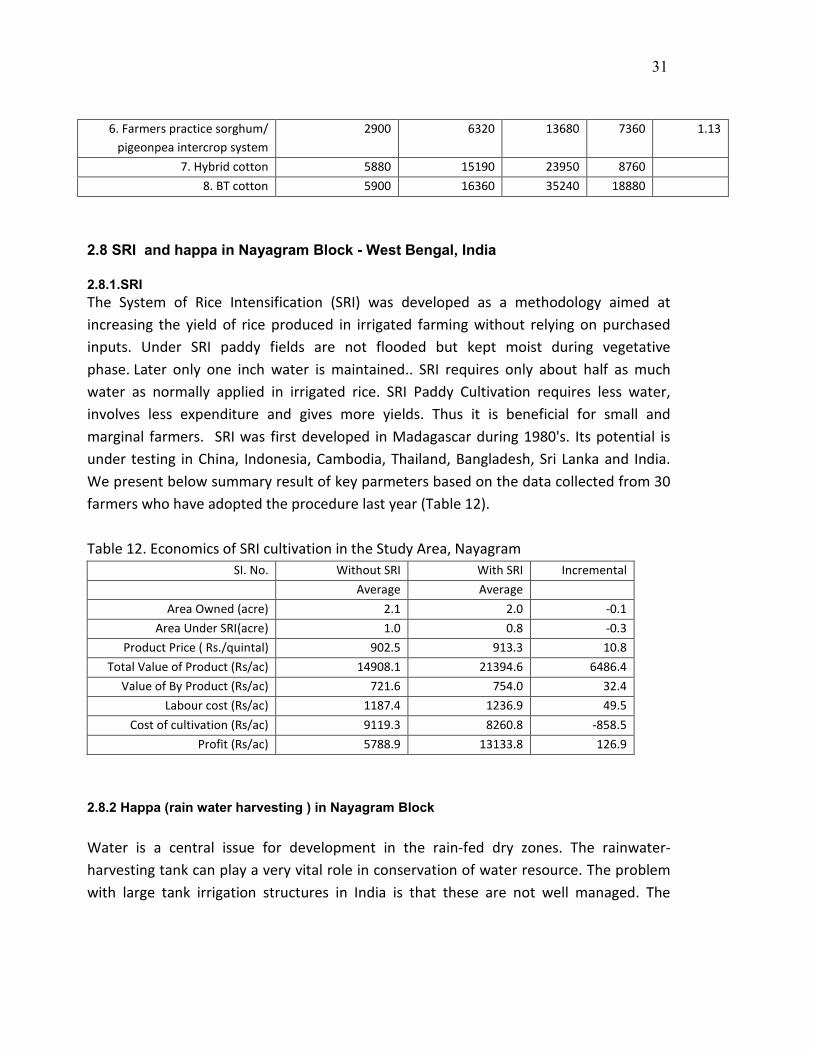
2.8.1.SRI The System of Rice Intensification (SRI) was developed as a methodology aimed at increasing the yield of rice produced in irrigated farming without relying on purchased inputs. Under SRI paddy fields are not flooded but kept moist during vegetative phase. Later only one inch water is maintained.. SRI requires only about half as much water as normally applied in irrigated rice. SRI Paddy Cultivation requires less water, involves less expenditure and gives more yields. Thus it is beneficial for small and marginal farmers. SRI was first developed in Madagascar during 1980's. Its potential is under testing in China, Indonesia, Cambodia, Thailand, Bangladesh, Sri Lanka and India. We present below summary result of key parmeters based on the data collected from 30 farmers who have adopted the procedure last year (Table 12). Table 12. Economics of SRI cultivation in the Study Area, Nayagram
SI. No. Without SRI With SRI Incremental Average Average
Area Owned (acre) 2.1 2.0 -0.1 Area Under SRI(acre) 1.0 0.8 -0.3
Product Price ( Rs./quintal) 902.5 913.3 10.8 Total Value of Product (Rs/ac) 14908.1 21394.6 6486.4
Value of By Product (Rs/ac) 721.6 754.0 32.4 Labour cost (Rs/ac) 1187.4 1236.9 49.5
Cost of cultivation (Rs/ac) 9119.3 8260.8 -858.5 Profit (Rs/ac) 5788.9 13133.8 126.9
2.8.2 Happa (rain water harvesting ) in Nayagram Block Water is a central issue for development in the rain-fed dry zones. The rainwater-harvesting tank can play a very vital role in conservation of water resource. The problem with large tank irrigation structures in India is that these are not well managed. The
32
experiment with the formation of water users’ association is not satisfactory at all in the state (Jana 2008). Some innovative experiments are going on in different parts of India in the irrigation sector. One such experiment in West Bengal happa where a small tank called is being excavated in the private land of the farmer wherefrom the farmer can irrigate his own agricultural land and the tank is managed by the farmer himself. A happa is a mud-excavated rain water harvesting structure and does not have any cement work or stone revetment. The sides of a happa are stepped with slope of 1:1 such that both livestock and human can access the water of happa easily. A happa is constructed by the side of agricultural field of a farmer with average length of 45 ft, breadth of 50 ft and depth of 12 ft. The total earth extraction of this happa is 17,360 cubic feet which requires 299 mandays. With existing NREGS wage rate of Rs. 100/day the average construction cost with the above specifications is about Rs. 29,900. The average command area of a happa is about 0.6 acre. The model is also called 5% model because it occupies 5% of the area of agricultural plot of the farmer. The construction cost of the happa is presently being financed from NREGS and all the operational expenditure is being incurred by the farmer for maintaining the happa. This model has become successful in some dry zones of West Bengal. It may be mentioned that there are two major cropping seasons in India, namely, Kharif and Rabi. The Kharif season is during the southwest monsoon (July-October). During this season, agricultural activities take place both in rainfed areas and irrigated areas. The Rabi season is during the winter months (October to June) when agricultural activities take place only in the irrigated areas. Khariff crop includes Aman paddy, maize, pulses etc. Rabi crop includes wheat, barley, oilseeds etc. Construction of water harvesting structures like happa have created a strong impact on their livelihood through generation of additional incomes in some dry areas because of the following reasons: (i) Farmers could provide life saving irrigation to paddy crop during this khariff season, (ii) They could grow vegetables around the bund of happas etc. It should be pointed out that in most of the dry zones the cropping intensity is poor. One extra crop will have perceptible impact on their standard of living (Table 13).
33
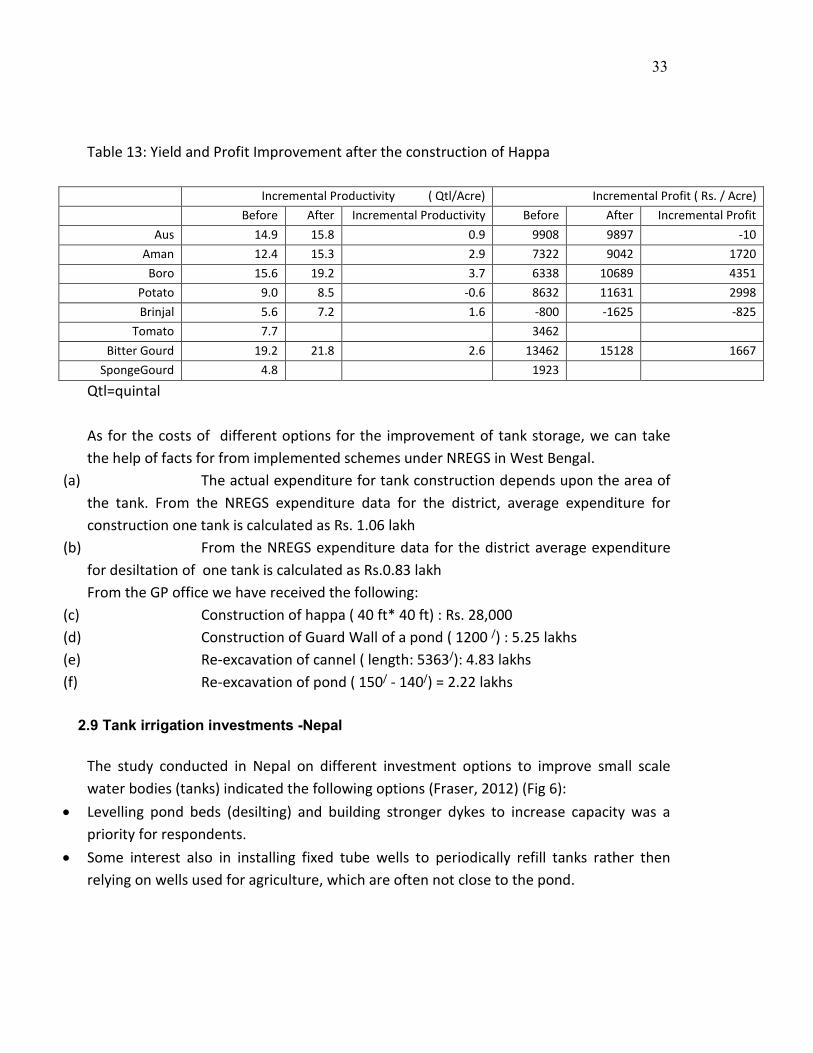
Table 13: Yield and Profit Improvement after the construction of Happa
Incremental Productivity ( Qtl/Acre) Incremental Profit ( Rs. / Acre) Before After Incremental Productivity Before After Incremental Profit
Aus 14.9 15.8 0.9 9908 9897 -10 Aman 12.4 15.3 2.9 7322 9042 1720 Boro 15.6 19.2 3.7 6338 10689 4351
Potato 9.0 8.5 -0.6 8632 11631 2998 Brinjal 5.6 7.2 1.6 -800 -1625 -825
Tomato 7.7 3462 Bitter Gourd 19.2 21.8 2.6 13462 15128 1667
SpongeGourd 4.8 1923
Qtl=quintal As for the costs of different options for the improvement of tank storage, we can take the help of facts for from implemented schemes under NREGS in West Bengal.
(a) The actual expenditure for tank construction depends upon the area of the tank. From the NREGS expenditure data for the district, average expenditure for construction one tank is calculated as Rs. 1.06 lakh
(b) From the NREGS expenditure data for the district average expenditure for desiltation of one tank is calculated as Rs.0.83 lakh From the GP office we have received the following:
(c) Construction of happa ( 40 ft* 40 ft) : Rs. 28,000 (d) Construction of Guard Wall of a pond ( 1200 /) : 5.25 lakhs (e) Re-excavation of cannel ( length: 5363/): 4.83 lakhs (f) Re-excavation of pond ( 150/ - 140/) = 2.22 lakhs
2.9 Tank irrigation investments -Nepal
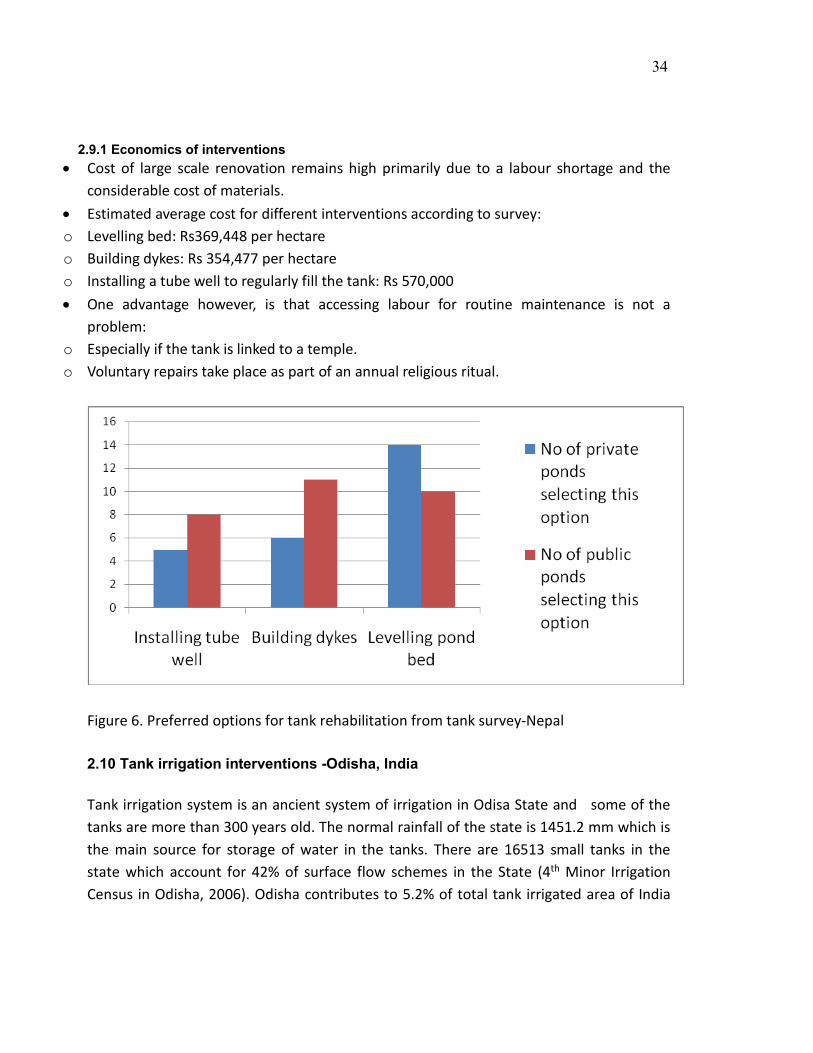
The study conducted in Nepal on different investment options to improve small scale water bodies (tanks) indicated the following options (Fraser, 2012) (Fig 6):
• Levelling pond beds (desilting) and building stronger dykes to increase capacity was a priority for respondents.
• Some interest also in installing fixed tube wells to periodically refill tanks rather then relying on wells used for agriculture, which are often not close to the pond.
34
2.9.1 Economics of interventions
• Cost of large scale renovation remains high primarily due to a labour shortage and the considerable cost of materials.
• Estimated average cost for different interventions according to survey: o Levelling bed: Rs369,448 per hectare o Building dykes: Rs 354,477 per hectare o Installing a tube well to regularly fill the tank: Rs 570,000 • One advantage however, is that accessing labour for routine maintenance is not a
problem: o Especially if the tank is linked to a temple. o Voluntary repairs take place as part of an annual religious ritual.
Figure 6. Preferred options for tank rehabilitation from tank survey-Nepal 2.10 Tank irrigation interventions -Odisha, India Tank irrigation system is an ancient system of irrigation in Odisa State and some of the tanks are more than 300 years old. The normal rainfall of the state is 1451.2 mm which is the main source for storage of water in the tanks. There are 16513 small tanks in the state which account for 42% of surface flow schemes in the State (4th Minor Irrigation Census in Odisha, 2006). Odisha contributes to 5.2% of total tank irrigated area of India
35
with 313000 ha (2001).However; nearly 60% of the potential created is used by tank irrigation. Tanks support not only crop production but a host of other related activities such as provision of water for drinking by humans and livestock, washing, bathing, etc. Tank water also facilitates provision of fodder to livestock, tree cultivation, fish culture and duck rearing. The value of land in tank command is more than the rainfed lands. The crop productivity of tanks is more than the normal crop production rate of the area. Tank has economic, ecological and socio-cultural uses in the rural areas.
The average yield of paddy was 36.25 q/ha. The average value of the produce is Rs 36250 and the average cost of production is Rs 24238/ha. Thus the return per rupee spent was 1.50. The return per rupee spent was 1.77 in case of pulses and 1.88 in case of vegetables. Thus growing non-paddy crop in tank command was more profitable than paddy (Bahera and Palanisami, 2012). 2.10.1 Irrigation investment-Renovation and Improvement of existing tanks Large number of existing irrigation tanks suffer from sub optimal irrigation utilisation due to deterioration of the tank structure and canal distribution system. The following investment options are suggested:
• Modernisation and improvement these tanks, will provide additional irrigation potential and it will facilitate a stable crop production in rural areas. Since the actual potential used is about 60% of the created potential renovation, modernization and improvement of existing tank irrigation are essential. Central Government has given high priority to sustainable development of rainfed areas.
• The works required on priority basis are desilting, repair of embankment, repair of distribution system and protection of catchment.
• Increasing pondage area by deepening the tanks may be necessary in many tanks. 2.11 Tank irrigation investments – Bihar, India According to the Planning Commission data of 1966, a majority of the tanks in Bihar (96.76%) were below 100 acres while a very small percent was greater than 100 acre Category. According to the Special Task Force report on Bihar (GoI, 2008), the lack of efficient on-farm water management is one of the major constraints for low productivity
36
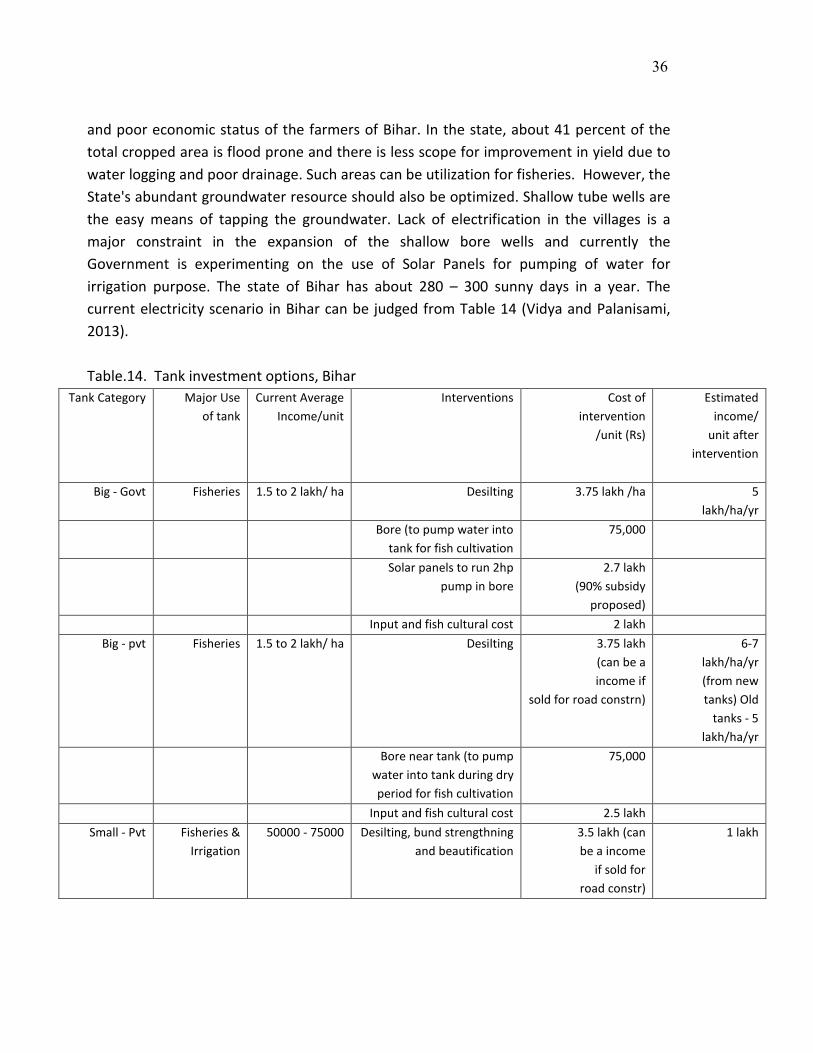
and poor economic status of the farmers of Bihar. In the state, about 41 percent of the total cropped area is flood prone and there is less scope for improvement in yield due to water logging and poor drainage. Such areas can be utilization for fisheries. However, the State's abundant groundwater resource should also be optimized. Shallow tube wells are the easy means of tapping the groundwater. Lack of electrification in the villages is a major constraint in the expansion of the shallow bore wells and currently the Government is experimenting on the use of Solar Panels for pumping of water for irrigation purpose. The state of Bihar has about 280 – 300 sunny days in a year. The current electricity scenario in Bihar can be judged from Table 14 (Vidya and Palanisami, 2013). Table.14. Tank investment options, Bihar
Tank Category Major Use of tank
Current Average Income/unit
Interventions Cost of intervention
/unit (Rs)
Estimated income/
unit after intervention
Big - Govt Fisheries 1.5 to 2 lakh/ ha Desilting 3.75 lakh /ha 5
lakh/ha/yr Bore (to pump water into
tank for fish cultivation 75,000
Solar panels to run 2hp pump in bore
2.7 lakh (90% subsidy
proposed)
Input and fish cultural cost 2 lakh Big - pvt Fisheries 1.5 to 2 lakh/ ha Desilting 3.75 lakh
(can be a income if
sold for road constrn)
6-7 lakh/ha/yr (from new tanks) Old
tanks - 5 lakh/ha/yr
Bore near tank (to pump water into tank during dry period for fish cultivation
75,000
Input and fish cultural cost 2.5 lakh Small - Pvt Fisheries &
Irrigation 50000 - 75000 Desilting, bund strengthning
and beautification 3.5 lakh (can be a income
if sold for road constr)
1 lakh

37
2.12 Key elements in irrigation investment analysis: 2.12.1 Using appropriate discount rate The discount rate is usually the marginal cost of money to the farm or firm for which the analysis is being done. To be able to use discounted measures of project worth, we must decide upon the discount rate to be used for calculating the net present worth, the benefit cost ratio. This often will be the rate at which the enterprise is able to borrow money. For economic analysis, the best discount or "cut-off" rate to use is the "opportunity cost of capital". This is the rate that will result in utilisation of all capital in the economy if all possible investments are undertaken that yield more return. Normally commercial bank interest rate is used as the discount rate in the investment calculations.
For example, the drip irrigation system is an investment yielding returns over time. Hence sensitivity analysis can be done to know the behaviour of BCR and NPW at different discount rates with the following assumptions.
1. There is no change in cost of production and gross income during the life period of the drip set.
2. There is some amount of change in interest rate (say 2 or 5 per cent) Also in order to assess the potential growth that subsidy plays in the adoption of drip irrigation method, computation can be done separately by including subsidy and excluding subsidy in the total fixed capital cost of drip set. This gives a clear picture on the behaviour of BCR and NPW at different discount rates with respect to change or no change in cost of production and gross income and also with or without subsidy. 2.12.2 Incorporation of risk in the investment analysis All these cases show the profitability of irrigation investment at farm level. The evaluation of capital investment projects can be regarded as one of the most important tasks of any financial manager. While the focus of capital investment evaluation methods is on return per se, it is often asked to what extent any of these methods take risk into account. It can be argued that the discount rate used in the application of these methods does take the necessary risk factors into account and that
38
no further risk assessments should be deemed necessary. The main problem with this point of view, however, is that the discount rate used, is often determined subjectively. People are using several discount rates as the bank interest rates are varying across financial institutions. There are different methods to evaluate capital investment decisions by incorporating the risk. The feasibility of a capital investment project should thus not only be determined by evaluating the expected rate of return which will be generated by such an investment option, but the risks which will have an impact on the outcome of such an investment decision should also be addressed. Several methods are available and they are outlined in Annexure 3. 2.12.3 Sensitivity analysis of investments
Sensitivity analysis is a technique used to determine how different values of an independent variable will impact a particular dependent variable under a given set of assumptions. This technique is used within specific boundaries that will depend on one or more input variables, such as the effect that changes in interest rates on profitability. Sensitivity analysis is a way to predict the outcome of a decision if a situation turns out to be different compared to the key prediction(s). This is a way to predict the outcome of a decision if a situation turns out to be different compared to the key prediction(s). In the case of irrigation investment analysis, the following can be examined under sensitivity analysis: increased yield and crop production, additional fertiliser costs, additional labour, increases wages, management and maintenance costs
2.12.4 Inclusion of subsidy in investment analysis Governments in both the developing and developed economies introduce various forms of policy interventions to promote economic growth and social equity, reduce poverty, promote environment protection and realize sustainable development of national and regional economy. To achieve these developmental objectives, various technologies are promoted by the state to enhance agricultural production, resource conservation etc. As part of the promotional activities, market based instruments such as taxes and subsidies are introduced and being implemented. It is observed in many states of India, that micro irrigation subsidy helps the farmers in minimizing their capital cost and helps in the spread of micro irrigation. The financial evaluation has shown that micro irrigation investment with subsidy resulted in comparatively higher rate of return than without subsidy ( Sureshkumar and Palanisami 2011).
39
As the State spends millions of rupees on subsidies in order to achieve increased agricultural production and water resource conservation, these technologies should be viable and should not only increase private profit but also to ensure social benefits. Thus the social cost and benefit analysis of drip adoption is considered increasingly important. A detailed section on social benefit cost ratio with and without subsidy is given in Annexure 4. 2.13.5 Financial versus economic costs and prices Financial and economic analyses differ on account of the basis used for valuing inputs and outputs from a given project. The resulting costs and benefits are not necessarily the same under the two types of analysis. Financial analysis includes as costs all payments that reduce the monetary resources of the project, and considers as benefits (or revenues) all receipts that increase the project’s financial resources. Economic analysis treats as costs only those payments which reduce the nation’s real resources, and as benefits only those receipts which increase the nation’s real resources. Taxes and various forms of subsidies are examples of such transfer payments and receipts.. However, these payments and receipts from an integral part of financial analysis since they change the availability of monetary resources to the project under consideration. The financial and economic costs may also differ considerably, for example, in the values attached to imports into a country with an overvalued exchange rate; to the value placed upon labour in conditions of underemployment; or to intangible such as pollution which may have no financial costs to the enterprise causing it but a high cost to society (Annexure 5). 3. Analysis of typical irrigation investments 3.1. Farm level water conservation and use There is a wide spread consensus that the sustainability of dryland system is endangered due to over exploitation of natural resources beyond their carrying capacity. Rainwater and soil, being the key natural resources of dryland system agriculture, focus on management practices that can maximize the usefulness of limited rainwater by practicing relevant conservation measures and land uses matching with the water availability period are important.

40
First step for improving the dryland crop yields is the conservation of rainwater, which cannot be separated from soil conservation. Evaporation decreases with time. Water present in lower layers cannot reach soil surface to meet the evaporation rate. Therefore, under conditions of frequent small showers, more soil water is lost as evaporation. About 60 to 75 per cent of the rainfall is lost through and these evaporation losses can be reduced by applying mulches. In situ refers mostly the soil and moisture conservation practices such as contour cultivation, contour bunding, border trenches, deep trenches in dryland orchards, and exsitu refers mainly the checkdams, percolation tanks, farm ponds are taken up on watershed basis. 3.1.1 In situ moisture conservation Soil reclamation, soil testing, soil test based fertilizer application, zinc sulphate application were taken up in the project area for increasing nutrient use efficiency. a..Zingg conservation bench terraces in deep black soils of Bijapur This technology has spread to an extent of 2.1 to 2.6 lakh ha (25 to 30 per cent of net crop area) of Bijapur and Bagalkot districts in Karnataka in heavy rabi black soil region. This technology may be up scaled through the watershed development department, Mahatma Gandhi Rural Employment Guarantee Scheme and Krishibhagya programmes. Double cropping was made possible due to this modified practice in the farmers’ fields. The extent of increase in the yield of different crops ranged between 30 to 60 per cent. Adoption of this technology enhanced the productivity of rabi sorghum, sunflower, greengram and pearlmillet by 39, 82, 113 and 139% respectively over a period of 5 years.. The yield advantage was more visible during sub-normal years. In this practice, 1/3 to ¼ areas on the upstream side of the bund were leveled. The rainwater was allowed to spread uniformly along the bund in leveled portion. The pressure on the bund was reduced. The cost involved was Rs.3500 per ha for zing conservation bench terrace. The bunds have to be raised at every 4-5 years interval. b. Inter plot rain water harvesting technique
41
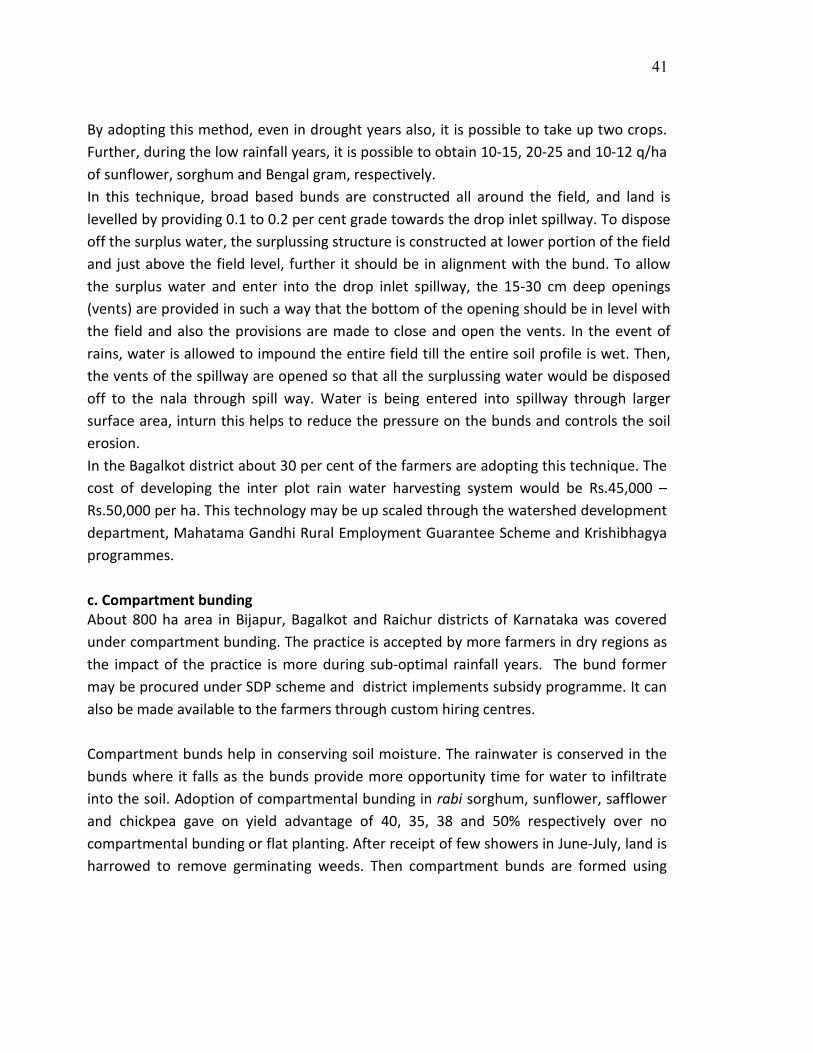
By adopting this method, even in drought years also, it is possible to take up two crops. Further, during the low rainfall years, it is possible to obtain 10-15, 20-25 and 10-12 q/ha of sunflower, sorghum and Bengal gram, respectively. In this technique, broad based bunds are constructed all around the field, and land is levelled by providing 0.1 to 0.2 per cent grade towards the drop inlet spillway. To dispose off the surplus water, the surplussing structure is constructed at lower portion of the field and just above the field level, further it should be in alignment with the bund. To allow the surplus water and enter into the drop inlet spillway, the 15-30 cm deep openings (vents) are provided in such a way that the bottom of the opening should be in level with the field and also the provisions are made to close and open the vents. In the event of rains, water is allowed to impound the entire field till the entire soil profile is wet. Then, the vents of the spillway are opened so that all the surplussing water would be disposed off to the nala through spill way. Water is being entered into spillway through larger surface area, inturn this helps to reduce the pressure on the bunds and controls the soil erosion. In the Bagalkot district about 30 per cent of the farmers are adopting this technique. The cost of developing the inter plot rain water harvesting system would be Rs.45,000 – Rs.50,000 per ha. This technology may be up scaled through the watershed development department, Mahatama Gandhi Rural Employment Guarantee Scheme and Krishibhagya programmes. c. Compartment bunding About 800 ha area in Bijapur, Bagalkot and Raichur districts of Karnataka was covered under compartment bunding. The practice is accepted by more farmers in dry regions as the impact of the practice is more during sub-optimal rainfall years. The bund former may be procured under SDP scheme and district implements subsidy programme. It can also be made available to the farmers through custom hiring centres. Compartment bunds help in conserving soil moisture. The rainwater is conserved in the bunds where it falls as the bunds provide more opportunity time for water to infiltrate into the soil. Adoption of compartmental bunding in rabi sorghum, sunflower, safflower and chickpea gave on yield advantage of 40, 35, 38 and 50% respectively over no compartmental bunding or flat planting. After receipt of few showers in June-July, land is harrowed to remove germinating weeds. Then compartment bunds are formed using
42
bund former. The size of the bunds vary from 3 m x 3 m to 4.5 m x 4.5 m depending on the slope (Fig 7). These bunds are retained till the sowing of rabi crops.
Fig-7: Compartment bund under construction d. Set-furrow cultivation Shallow soils: The pearl millet equivalent yield in Pearl millet-Sunflower sequence cropping system was given 3482 kg/ha with 4.5 B:C ratio as compared to 1810 kg/ha (2.28 B:C ratio) with farmers practice. On the other hand, Pigeonpea equivalent yield in Pigeonpea + Sesamum (2:4) inter cropping system with BC ratio of 3.8 was 2680 kg/ha as compared of farmers practice (997 kg/ha, with BC ratio 2.25) Medium to Deep black soils: Herbacium cotton variety Jayadhar has given 1096 kg/ha as compared to farmers practice (680 kg/ha) while, rabi sorghum grain equivalent yield in Sunflower-rabi sorghum + chickpea (2:4) sequence cropping system gave 4878 kg/ha as compared to farmers practice (3042 kg/ha). e. Tied ridges On-station study was conducted to quantify the effect of tied ridging on the seed yield of pigeonpea (two years), rabi sorghum and chickpea (three years). The seed yield of pigeonpea, grain yield of rabi sorghum were significantly higher with residue incorporation only (13.60 q/ha and 15.94 q/ha respectively) followed by tied ridging with residue incorporation (13.44 q/ha and 15.91 q/ha, respectively). On the other hand over years, the seed yield of chickpea was lower (1.54 q/ha) with tied ridging + residue incorporation (1.84 q/ha). Critical examination of the data clearly indicated unfavorable effects of tied ridging on the yield of pulse crops in a year of higher rainfall. On the contrary, rabi sorghum was not much affected.

43
f. Broad bed and furrows Broad bed and furrows produced less runoff (8.51%) than conventional practice (15.61% The increase in grain yield of rabi sorghum was 15.19 per cent over conventional practice at RARS, Bijapur. On the other hand in another study conducted at RARS, Bijapur involving pigeonpea variety S-1 (Japan super) for three years did not show the advantage of either BFR or BBF. g. Border planting method (Skipped row planting) Radder et al (1989) have indicated that skipping one row after using three or two rows produced grain yield on par with solid planting during all the three years in rabi sorghum. In safflower, skipping one row after every two rows increased the grain yield significantly by 22% compared to solid planting. While in chickpea skipping one row after every three rows has increased the yield by 28%. Reducing the seed rate and fertilizer levels to 75% of the recommended rate has not reduced the grain yield significantly in all the crops. Thus to stabilise the yield of rabi crops over the years, the border/skip row method of planting holds promise on deep black soils. h. Contour cultivation Response of rabi sorghum with recommended practices to contour key line cultivation in shallow black soil was conducted at Bijapur centre.Sowing of rabi sorghum along the contour key line with 60 cm row spacing and recommended dose of fertilizer gave higher yield of 8.0 q per ha compared to 5.0 q per ha when sowing was done along the slope as per farmer’s practice, where a seed drill with 35 cm row spacing and 60 kg DAP per ha was used.
i. Off season tillage practices An experiment conducted on the off season tillage on black cotton soil revealed that among the treatments, harrowing 3-4 times gave the highest yield of 36 q/ha followed by ploughing with wooden plough after receipt of summer rains(35.0 q/ha). Harrowing only once before sowing of rabi jowar gave the lowest yield of 28.0 q/ha.
j. Micro catchments Evaluation of different Micro-catchment water harvesting techniques for ber plantations revealed that the treatment, rectangular inward sloping basins followed by circular inward sloping basin, crescent bunding and trapezoidal bunding recorded 143.2%,
44
131.6%, 122.1% and 121.1 % increased fruit yield of ber, respectively over the check plot(control).
k. Sand ditch Trenches of 80 cm deep and 1 m wide are dug across the slope. The trenches were filled up to the original soil level using locally available fractured rock and river sand. These filled trenches, called sand ditches, collect rainfall, intercept runoff, and store water in the surrounding soil at greater depths to be used by plants for longer periods of time. It can be a very efficient method since it increases water infiltration and prevents evaporation during the growing season. Sand ditches increased both the percentage of rainfall stored in the soil matrix and the infiltration depth of water (Majed, et al 2000). Experimental results showed that sand-ditch technique significantly reduced runoff and sediment loss and increased infiltration and soil moisture compared to control or compacted plots. The overall average runoff and sediment reductions in the sand-ditch plots were 46% and 61% compared to control plots. Construction of sand ditch also increased the dry matter yield of native grass by an average of 62% and 40% in the two experimental fields compared to control (Abu-Zreig and Tamimi, 2011). 3.1.2. Ex situ water harvesting and management a. Farm pond Construction Some innovative farmers constructed the farm ponds on their own, further, in the ongoing watershed development programmes, the farm ponds are constructed in the farmers’ fields. This technology may be up scaled through the watershed development department, Mahatama Gandhi Rural Employment Guarantee Scheme and Krishibhagya programmes. Farm pond is also a proofed concept of water conservation which can be implemented across the action villages. In arid and semi-arid regions, rains are sometimes received in heavy down pours resulting in runoff (Singh, 1983). The percentage of runoff ranges from 10 to 30 % of total rainfall. Alfisols (major soils in the action villages) have high runoff generating potential than vertisols with deep cracks at the commencement of the monsoons. Runoff starts earlier and more frequently during rainy season in alfisols compared to vertisols. On alfisols even with contour bunds, there is atleast 20 to 30 per
45
cent runoff. Simple treatment of the land such as shaping, removing obstructions etc. enhance the harvesting efficiency of runoff water. Small farm ponds of size 100-300 m3 can be dug for storing runoff water. The size of the farm pond depends on the rainfall, slope of the soil and catchment area. The dimensions may be in the range of 10m x 10m x 2.5 m to 15m x 15m x 3.5 m (Yellamanda Reddy and SankaraReddi, 2010). The side slope 1.5:1 is considered sufficient. A silt trap is constructed with a width of slightly higher than the water course and depth of 0.5 to 1 m and with side slope of 1.5:1. The problem associated with farm ponds is high seepage loss. This can be reduced by lining walls. Some of the traditional methods for seepage control are: use of bentonite, soil dispersants and soil-cement mixture (Maheswari and Turner, 1986). Bentonite has excellent sealing properties if kept continuously wet, but cracks develop when dried. Soil-cement mixture can be used, but surface cracking develops when exposed to sun drying. A soil-cement lining of 100 mm thickness reduces seepage losses up to 100 per cent. The pit lined continuously develops cracks but no cracks develop when applied in blocks (AICRPDA.1986). The other alternative sealant for alfisols is a mixture of red soil and black soil in the ratio of 1: 2. The different types of lining materials are used depending on the availability, cost and soil type. They are: soil-cement, red and black soils, cement-concrete, bricks, Cuddapah slabs, stone pitching, polythene sheet etc. In alluvial sandy loam to loamy sand soils of Gujarat and red sandy loams soils of Bangalore, a soil + cement (8:1) mixture is the best lining material. At Anantapur (A.P.), soil without sieving and cement in 6:1 ratio is very effective and cheap lining materials for red sandy loam soils (Yellamanda Reddy et al, 2005). In laterite silt clay loam soils of Ooty, medium black soils of Kota, bitumen are effective. Cement and bricks are found useful for silty loam to silty clay loam soils at Dahradun. At Solapur, lining with sodic soils is better than lining with soil + cow dung + straw in medium deep soil. Evaporation losses can be reduced in farm ponds especially in arid regions like in action villages in Anantapurby rubber or plastic floats. White plastic sheet is economical and easily available. Farm pond technology is economically viable. Studies done in Ananatapur, and Kurnool regions showed that water harvesting in a farm pond of size 271 m3 and utilizing the

46
water for supplemental irrigation is economically viable (Goyal et al, 1995). The cost benefit ratio was 1.7. Rainfall intensity and water storage relationship: The Table 3depicts the relationship of rainfall, rainfall intensity and volume of water harvested. Event wise, rainfall, intensity and volume of water harvested is presented in the table. During the July month, on 8.7.2013 one high rainfall event of 110 mm occurred, it occurred in one spell only with rainfall intensity of 42.6 mm/hr and on that day the farm pond was full. Totally 18 runoff events were recorded and 3107 cum of water was harvested. Farm pond water balance: The simple water balance of the farm pond is presented in the Table 4. It revealed that during the reporting period, 711.1 mm of rainfall was received and 3107 cum of water was harvested. From June to January, 101.1 cm depth of water (695 cum) was lost in the form of evaporation. Further, about 10 per cent ie., 200 cum of water was lost in the form seepage and about 5 per cent amount of water was left in the pond as the dead storage. Remaining 2113 cum of water was used for giving the supplementary irrigation to the field crops, watering the floriculture and horticulture crops. Loss water in storage: The data on average storage loss of water in farm ponds located in deep, medium and shallow black soils at their full capacity (3 m deep) obtained at the Agricultural Research Station, Bijapur is presented in Tables 15 & 16. Table 15. Various components of farm pond water balance
Parameter Quantity Rainfall 711.1mm
Evaporation 101.1cm Water harvested 3107cum
Seepage losses 200cum Used for Irrigation 2113cum
Dead Storage 100cum

47
Table-16: Storage loss of water collected in ponds in different soil types at Bijapur
Location of farm pond: For locating the farm pond, selection of catchment assumes greater importance. It is so selected that a sizeable quantity of runoff is expected in the pond.Too big a catchment results in rapid silting due to more runoff water getting into the pond, while , too small a catchment may not bring in enough water into the pond. It is advisable to locate the pond at elevation differences between two fields or in a valley portion or depressions which favours storage excavation ratio and facilitates for gravity flow irrigation(Belgaumi, et al 1997). In case, such sites are not available then the second best is the location for the pond in the middle of the cultivated field so that a sizeable runoff could be used for irrigation on gravity flow. Further, the catchment of the pond should be well protected for arresting rapid siltataion. Storage capacity: Based on rainfall, topography of the land, soil type and land use pattern, a farm pond of 150 m3 size is sufficient for each hectare of catchment area in black soils with provision of emptying it after its fill up to accomodate the subsequent events of runoff (Belgaumi, et al., 1997). Farm ponds and supplementary irrigation: Water harvesting and supplemental irrigation is risk reducing investment. By doing the supplementation the overall efficiencies of water use can be improved and risk of crop loss can be reduced. In dry areas, water, not land is the most limiting resource for crop production. Maximizing the water productivity but not the yield per unit land is the better strategy for dry farming areas (Yellamanda Reddy and SankaraReddi, 2010). Supplemental irrigation is a highly efficient practice for increasing productivity of crops in arid regions (Fox and Rockstrom, 2003). The yields of rainfed crops are less than half of
Soil type Average loss of water collected in ponds in different soil types at
Bijapur (l/m2/day) Deep black soil 28
Medium deep black soil 65 Shallow black soil 120
48
their yields under irrigated conditions. Yield of groundnut under irrigated conditions in shallow alfisols in arid tropic conditions of Anantapur district in Andhra Pradesh is 4500 kg/ha.Yield of groundnut under rainfed condition ranges from a few kilograms to about 1500 kg/ha. Yields of crops can be increased by judicious application of small amounts of water through alternate furrows to wet the root zone during a stress period. Supplemental irrigation is beneficial in both sub-normal and normal rainfall conditions during the cropping period. With only 20 mm of irrigation in an intercropping system of pigeon pea + pearl millet, gross yields increases significantly. Vegetable yields increases significantly with irrigation (Vijayalakhsmi et al, 1989). Crops differ in responding to amount of irrigation water to supplemented irrigation during dry spell. Groundnut responds to 10 mm of irrigation through sprinkler on alfisols during pod development stage (Yellamanda Reddy and Sulochanamma, 2008). Cotton needs a minimum of 30 mm of water to respond to irrigation applied either sprinkler or drip irrigation system on vertisols. Chickpea similarly need 30 to 40 mm of supplemental irrigation applied as drip or sprinkler irrigation during flowering. Pigeonpea responds to 20 mm irrigation water applied at pod development state with drip irrigation to 20% of the cropped area. Irrigation can be provided near the row, covering about 20% of the cropped area, leaving 80% of interrow zone. Applying small quantity of water (around 250 ml) manually to each plant or hill is called pot watering. It is highly useful either for sowing of widely spaced crops like cotton, red gram castor, and maize if sowing rains are delayed. Transplanting of tomato, chilli and tobacco can be done by pot watering (Yellamanda Reddy and SankaraReddi, 2010). Yield of rainfed cotton is increased by 15 to 20% by timely planting of cotton compared to cotton planted late due to delay in rains. Similarly, pot watering is highly useful to protect the seedlings from moisture stress during early crop growth stage. The amount of water, if calculated over the entire area is less than 5 mm. For example, pot watering cotton seedlings at 250 ml/ hill works out 5000 l/ ha which is equivalent to 5 mm. Surface methods of irrigation like check basin, basin, and furrow method irrigation are not suitable for supplemental irrigation, mainly for three reasons: the rainfed lands are uneven, conveyance losses may go up to 30% and limited amount of water available for

49
irrigation. The harvested runoff in farm ponds is costly and scarce commodity in dryland agriculture. The stored water should be used most judiciously. Ample research data in the AICRP project is available on the benefits of supplemental irrigations to cultivated agricultural crops. The results of supplemental irrigation in medium deep black soils at Bijapur over a period of 5 years indicated that crop yields with one life saving irrigation could be enhanced by 40 to 90 per cent (Table 17). Table 17: Response of crops to supplemental irrigation in medium deep black soils
Crop Yield (qtl/ha) Per cent increase over control Irrigated Control
Rabi sorghum 25.74 18.45 39.5 Safflower 17.02 11.96 42.4
Bengalgram 8.87 6.69 32.5 Sunflower 14.29 8.73 63.7
Redgram 3.81 1.98 92.4 Hybrid cotton 15.24 10.94 39.3
Introduction of high value crops under protective irrigation further help to enhance the income of dryland farmer. Growing of hybrid cotton or following sequence cropping are some of the examples through which the farm income could be increased besides increasing the cropping intensity. Yet in another experiment on the influence of supplemental irrigations in medium deep black soil at Bijapur with different horticultural crops, it was observed that guava, ber and fig responded in a range of 41.7 to 122.6 per cent more with irrigations over control. The highest response to supplemental irrigations was recorded in guava (122.6%) and the lowest response was found in fig (41.7%). However, the income from ber was the highest (Rs.26,180/ha) followed by fig (Rs.8,046/ha) and guava (Rs.5,544/ha) after third year of their planting (Table 18).

50
Table 18: Influence of supplemental irrigations on different cropping systems at Bijapur Cropping system Yield (q/ha) Gross income (Rs/ha)
Ber Irrigated 52.36 26180 Control 32.65 16325
Fig Irrigated 13.41 8046 Control 9.46 5676
Guava Irrigated 27.72 5544 Control 12.45 2490
Subabul Irrigated 96.48 1447 Control 62.78 942
Rabi sorghum Irrigated 19.45 (46.30) 5556 Control 10.00 (18.42) 2777
Note: Figures in parentheses indicate straw yield of sorghum Supplemental irrigation through micro irrigation: Drip and sprinkler irrigations are more suitable because small amount of water can be delivered, even on uneven soils with no conveyances losses. Subsurface drip irrigation is very efficient for providing supplemental irrigation. The main drawback of micro-irrigation system is high initial cost of the system. It has been observed that drip method saved 50% of pond water compared to modified sprinkler and surface methods of application (Anon., 1991a). The response for a given depth of irrigation in different fruit crops with various methods of irrigation was maximum in drip method of water application (Table 19). Table 19: Effect of method of irrigation on the fruit yield of different plants for a given depth of irrigation (200 l/plant)
Method of irrigation Fruit yield (kg/plant)
Ber Fig Pomegranate Drip 6.17
(252) 2.73
(228) 3.36
(133) Jet 5.07
(189) 1.90
(128) 2.20 (52)
Surface 4.37 1.51 2.31

51
(149) (82) (60) Control 1.75 0.83 1.44
(Figures in parentheses indicate yield increase over control in per cent) Lifting systems and conveyance Regarding lifting system, not much research work has been carried out, however, under the National Initiative on Climate Resilient Agriculture (NICRA) system, the petrol start diesel pump of 1.5 hp with 3000 resolution per second(rpm), low head high discharge pump was successfully demonstrated at the Koulagi village. With this type of pump, five sprinkler heads could be operationlised. b. Groundwater recharge strategies Rain water harvesting and diverting to a well through a filter bed for reutilization. This technology has been implemented in the entire Kakol village of Ranebennur taluka of Haveri district and progressive farmers have adopted this technology in most of the villages of the northern Karnataka. On the policy matter of ground water argumentation programme, the government should consider this type of works in Mahatama Gandhi Rural Employment Guarantee Scheme, central government sponsored Augumentation of defunct well scheme and under the krishibhagya programmes.. Rain water harvesting and diverting to a well through a filter bed for reutilization technology was successfully demonstrated at RARS, Bijapur. During the normal rainfall years, 3 to 4 times the dug well was full. From the normal size wells (5x5x10m) it is possible to recharge about 5 to 6 lakh litres of water per year. This technology is more effective, if this work is taken up on community basis. c. Tank rehabilitation Tank irrigation systems are one of the oldest structures in India that has been serving as an important water harvesting device since time immemorial. Rehabilitation of tank ecosystems is considered as one of the best options to improve the performance the irrigated agriculture. Tank modernization is the process by which water in existing tanks is used more efficiently through improved water storage, distribution and on-farm water use. Increasing food production and rural income by achieving higher cropping intensity through improved water management and reduced water losses is the context behind the intervention’s popularization. If tanks are modernized, the potential returns is

52
expected to be more than 25% of water saving. Past experience shows that, physical modernization alone improved irrigation efficiency by 32.25% and subsequently increasing the yield by about 30% (Sindhu, 2010). Government of Tamil Nadu has proposed several programmes to help strengthen tank irrigation. These programmes intended primarily to provide major repairs and improve tank performance, increase irrigation potential by constructing new tanks and improving existing tank structure. Though these small improvements have attempted to rehabilitate tanks, no big attempts were made until European Economic Committee (EEC) came forward to modernize 649 tanks in Tamil Nadu during 1984-85 to 1994-95. A study conducted in the year 2006 revealed that the programme was financially aided by EEC and consisted of two phases. A total of 150 non-system tanks with command area of 100-200 ha were selected for modernization with a financial outlay of Rs 4,500 lakh. In the second phase from 1989-1995, an additional 230 tanks were included for modernization with a financial outlay of Rs 5,000 lakhs. The approximate cost per hectare was 21,000. The project aimed to save about 20% of water over the present use thus permitting the expansion of cultivation by about 9000 ha (Government of Tamil Nadu, 1986; Palanisami, K. 2008). Similarly, in Andhra Pradesh, the Andhra Pradesh Irrigation and Livelihood Improvement Project (APILIP) has been created in order to stabilize irrigation potential, increase agricultural production, increase efficiency of water use and alleviate poverty with diversified livelihood programme through modernizing minor irrigation tanks. It was agreed by the Government of Andhra Pradesh and Japan International Cooperation Agency in 2007 that, 55 new minor irrigation tanks will be formed in 48 surplus river basin with a tentative cost of Rs 1934.03 Millions to create new irrigation potential of 17,179 ha and 20 medium irrigation projects for rehabilitation and improvement with an approximate cost of Rs 4720.77 Million having an ayacuts 1,18,175 ha will be modernized in the next six years (www.apwaterreforms.in). Impact of the technology or intervention: The declining share of tanks is indicative of fast depleting water holding capacity, a large proportion of which suffers inadequate maintenance and requires periodical desilting, strengthening of bunds etc. At the same time well irrigation is increasing from 29.8 to 55.1 per cent dramatically. Modernization of tanks increased water availability 10 to 20

53
days in a crop season in 60% of tanks, the crucial factor which decide the tank performance. But now almost all the tank farmers started to cultivate short duration varieties like ADT 39, ADT 43, Co 43 and ASD 16. Comparison of benefits before and after modernization of irrigation tanks had indicated increase in water productivity ( Table 20). Table 20. Impact of tank modernization
Benefits Before Modernization After Modernization Conveyance efficiency (%) 79.2 95.7 Distribution efficiency (%) 50.0 90.0 Application efficiency (%) 69.8 91.0
Irrigation efficiency (%) 27.7 78.4 Water requirement (m3/ha) 12300.00 10250.00
Paddy yield (t/ha) 3.0 3.9 Water Productivity (Rs/m3) 0.2 0.3
Gross Income (Rs/ha) 2962.0 5261.0
Source: CWR 1996; Sindhu, 2010
Another case in Tamil Nadu is Deevanur Village, where TN-IAMWARM project on PVC pipelining system has intervened and impacted most of the farmers of the village. A division tank which was constructed for the purpose maintains a static head supplying water through underground PVC pipe to the field thereby ensuring efficient water supply from head to tail end regions of Deevanur village. Paddy and Sugarcane were the major crops here too. But water conveyance to these crops is through the division tank and PVC system (Fig 8). As a result, the intervention has greatly impacted the cropping pattern of the village with higher B/C ratio.
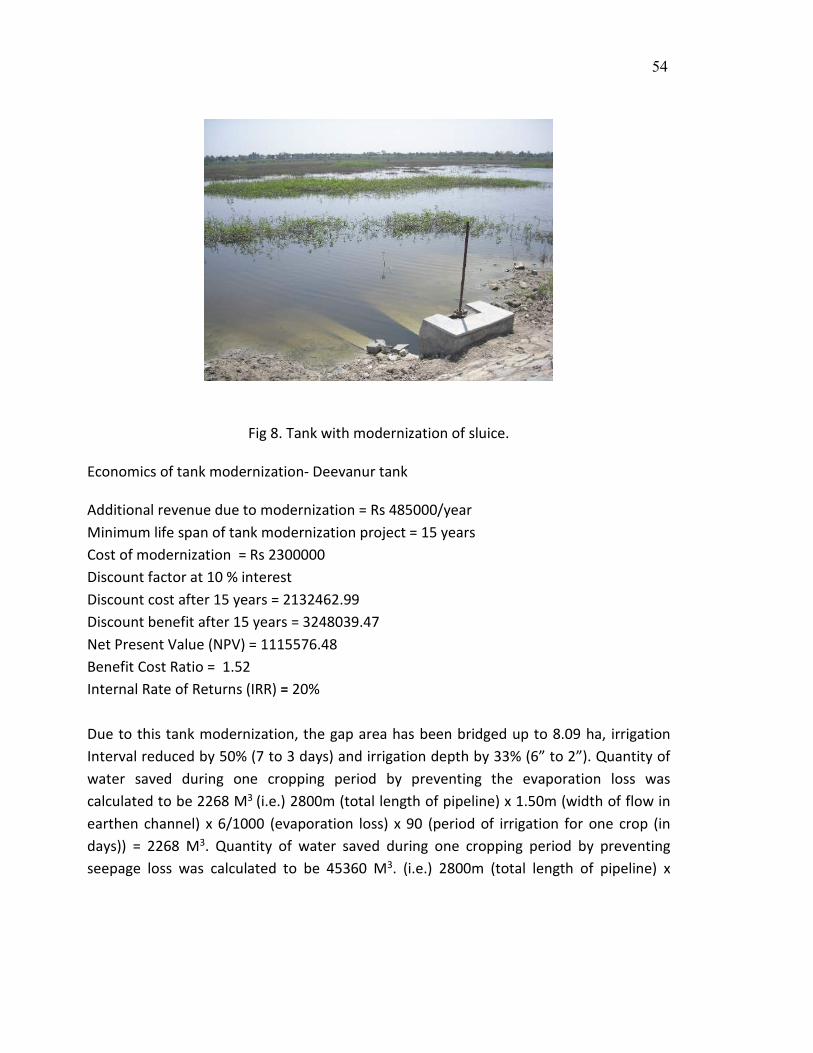
54
Fig 8. Tank with modernization of sluice.
Economics of tank modernization- Deevanur tank
Additional revenue due to modernization = Rs 485000/year Minimum life span of tank modernization project = 15 years Cost of modernization = Rs 2300000 Discount factor at 10 % interest Discount cost after 15 years = 2132462.99 Discount benefit after 15 years = 3248039.47 Net Present Value (NPV) = 1115576.48 Benefit Cost Ratio = 1.52 Internal Rate of Returns (IRR) = 20% Due to this tank modernization, the gap area has been bridged up to 8.09 ha, irrigation Interval reduced by 50% (7 to 3 days) and irrigation depth by 33% (6” to 2”). Quantity of water saved during one cropping period by preventing the evaporation loss was calculated to be 2268 M3 (i.e.) 2800m (total length of pipeline) x 1.50m (width of flow in earthen channel) x 6/1000 (evaporation loss) x 90 (period of irrigation for one crop (in days)) = 2268 M3. Quantity of water saved during one cropping period by preventing seepage loss was calculated to be 45360 M3. (i.e.) 2800m (total length of pipeline) x

55
1.50m (width of flow in earthen channel) x 5/1000 (seepage loss) x 24 hours x 90 (period of irrigation for one crop (in days)) = 45360 M3 . Total quality of water saved during one cropping period was (45360 + 2268 = 47628 M3). The production of paddy before the intervention of this project was 1626 Quintals in 27.10 ha. After this intervention, the production has been raised to 2112 Quintals. The result showed that tank modernization with underground PVC pipeline system has increased the area of cultivation which in-turn resulted in higher crop production. The total capacity of Deevanur Tank is 0.431 million cubic meter. On field enquiry with farmers, it was found that farmers irrigated applied more water than required and after this intervention, farmers had reduced their water application resulting in saving of tank water.The key factor that had contributed positively to the better tank performance was its adoption and perception of farmers towards better water management practices. However, the cost of modernization varies across states of India and it heavily depended upon the type of modernization and the donor agencies ( Fig 9). Also different modernization options tested in some tanks in south India had shown varying levels of costs and returns as evidenced from the higher IRR ( Palanisami and Easter, 2000). (Tables 21 & 22).

56
Fig 9. Comparison of tank rehabilitation costs Table 21. Evaluation of Different Tank Improvement Strategies, Tamilnadu.
Strategies Production ratio Equity ratio B/C ratio IRR (%) Sluice modification 1.0 - 0.5 0
Sluice management 1.1 2.6 10.0 142 Canal lining 1.3 1.6 1.8 24.4
Additional wells 1.3 1.5 1.7 23.5 Rotation management 1.4 1.5 10.8 159
Canal lining + additional wells 1.4 1.0 1.5 23.2 Sluice management + additional wells + canal lining 1.5 1.2 1.7
23.7
Rotation management additional wells + canal lining 1.5 1.2 1.4
32.5

57
Note: Productivity ratio: It is the ratio of increased production with the modernization strategies to the production at base level. Equity ratio: It is the ratio of net income per ha in the head region to the net income per ha, in the tail region. For more details, see, Palanisami, et al 2008a. Discount rate=10%, life period is varying from 6 to 15 years for different strategies. Table 22. Financial evaluation of tank investment strategies, Tamilnadu
Source B/C ratio* IRR (%) System tanks 1.22 19.8
Medium/large tanks 1.25 20.3 Small tanks 1.27 20.6
Non-system tanks 0.50 5.8 Medium/large tanks 0.52 6.2
Small tanks 0.52 6.4
discount rate = 10%.
d. Watershed development and impact in dryland syatems
Kothapally watershed
The kothapally watershed consists of 465 ha of which 430 ha are cultivated; 274 households (1492 people) with an average landholding per household of 1.4 ha (70% of the households own less than 2 ha each); Predominantly Vertisols and associated soils (90%); An undulating topography with an average slope of 2.5%.
More than 250 rainwater harvesting structures such as check-dams, mini percolation pits, sunken pits and gully plugs were erected in the watershed throughout the topo-sequence (Fig 14). ICRISAT promoted especially low-cost structures such as mini percolation tanks since these constructions are comparatively easy to construct and maintain, local materials are sufficient and they benefit at least 2-3 farmers and hence lead to greater equity. The estimated mean rise of the groundwater is between 2 -4 meters with an average contribution of rainfall to the groundwater level of 27%. Interested farmers were trained in monitoring the ground-water levels in the wells. The estimated additional groundwater recharge per year is currently 4,27,800 m³ and the groundwater level is continuously monitored by the farmers. Additional run-off water was saved by diverting steams to
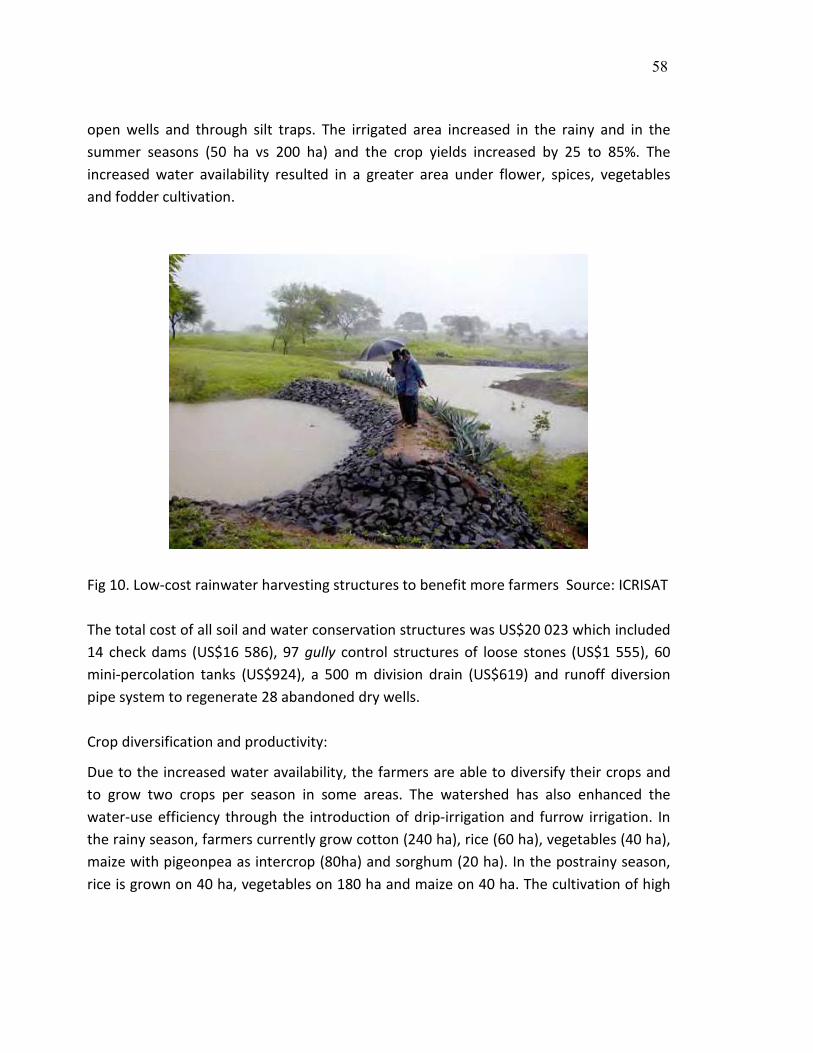
58
open wells and through silt traps. The irrigated area increased in the rainy and in the summer seasons (50 ha vs 200 ha) and the crop yields increased by 25 to 85%. The increased water availability resulted in a greater area under flower, spices, vegetables and fodder cultivation.
Fig 10. Low-cost rainwater harvesting structures to benefit more farmers Source: ICRISAT The total cost of all soil and water conservation structures was US$20 023 which included 14 check dams (US$16 586), 97 gully control structures of loose stones (US$1 555), 60 mini-percolation tanks (US$924), a 500 m division drain (US$619) and runoff diversion pipe system to regenerate 28 abandoned dry wells. Crop diversification and productivity:
Due to the increased water availability, the farmers are able to diversify their crops and to grow two crops per season in some areas. The watershed has also enhanced the water-use efficiency through the introduction of drip-irrigation and furrow irrigation. In the rainy season, farmers currently grow cotton (240 ha), rice (60 ha), vegetables (40 ha), maize with pigeonpea as intercrop (80ha) and sorghum (20 ha). In the postrainy season, rice is grown on 40 ha, vegetables on 180 ha and maize on 40 ha. The cultivation of high

59
value-crops such as carrot, cabbage, tomato and chili, as well as flowers, is possible only due to the water conservation structures and the enhanced water-use efficiency. Out of all cropping systems in the rainy season in the Adarsha watershed maize/pigeonpea and maize/chickpea proved to be most beneficial (Benefit-cost ratio 2.67). Farmers could gain about Rs 19,500 and Rs 16,500 with these systems respectively. Sole sorghum, sole chickpea and sorghum/pigeonpea intercrop also proved to be highly beneficial. The application of micronutrients after soil-testing yielded increases between 13 and 29% in sorghum grains and 20 to 39% in maize in the following season.
e. Investment in managed aquifer recharge (MAR) Managed Aquifer Recharge (MAR) describes planned storage and treatment of water in aquifers which can provide cheapest form of new safe water supply for towns and small communities (British Geological Survey, 2006). It is a part of a groundwater manager’s tool which is useful for replenishing and re-pressurising depleted aquifers, controlling saline intrusion or land subsidence as well as improving water quality through filtration and chemical and biological processes. MAR can enhance volumes of groundwater abstracted through different package of measures and restore groundwater balance. It also plays a vital role in smoothing out supply and demand fluctuations, stabilizing over-exploited groundwater levels, reducing evaporation losses and runoff, maintaining environmental flows in streams and rivers, improving water quality and augmenting the reuse of waste and storm water. In recent times, MAR uptake has been very limited. This may be due to the lack of understanding of hydrology and knowledge about the intervention. With training and demonstration projects, MAR has potential to be a major contributor to the UN Millennium Goal for Water Supply, especially for village supplies in semi-arid and arid areas (UNESCO’s IHP, 2005). Construction of check dams across rivers can also impound the surface runoff so as to increase the groundwater recharge (see Box 1). In India, most of the rivers are non-perennial (i.e.) they flow only during monsoon. Hence, large quantity of rainfall reaches the sea as runoff and also results in flooding during seasonal rains. Managed Aquifer Recharge by check dam will help in harvesting the surface runoff by increasing the contact time between the water and the river bed to facilitate infiltration (Renganayaki et al. 2013). The recharge wells and checkdams are shown in Figures 11 & 12.
60
Impact of the technology or intervention:
Most of the projects on Managed Aquifer Recharge (MAR) conducted in India focused on four aspects namely environmental, social, institutional and economic aspects. The impact of aquifers in quality and quantity is generally referred in environmental perspective. A study of three Watershed Development Programmes (Gale et al. 2006) in different parts of India showed that recharged amount of water to aquifers increased by 3 – 23% compared to the natural recharge situation. Depending on groundwater quality and quality of the recharged water, groundwater quality can improve or deteriorate. In order to improve groundwater quality, implementing MAR structures requires capital investment and operation cost. Government of India in 2007 revealed that construction cost per m3 recharged water vary between 2.5 INR and 455 INR depending on the type of structure applied (Table 23).
Institutional arrangements are important in order to operate and maintain MAR. Most of the systems are implemented in rural areas and are operated by designated committees which are also responsible for collecting user fees. The existing studies showed that building up proper alertness and constant influence and inspiration is necessary to ensure long-term sustainability of the structures. All the three aspect viz., environmental, economic and institutional aspects directly or indirectly create reasonable impact on users by providing alternative water source. Available studies on social perspective reveal that water from MAR system is generally well accepted and no problems have been reported. The recharge structures are assumed to provide community-wide benefits and are viewed as community assets to be financed and managed by the community. Nevertheless, land owners are the ones who are benefitting most of the interventions (www.saphpani.eu).
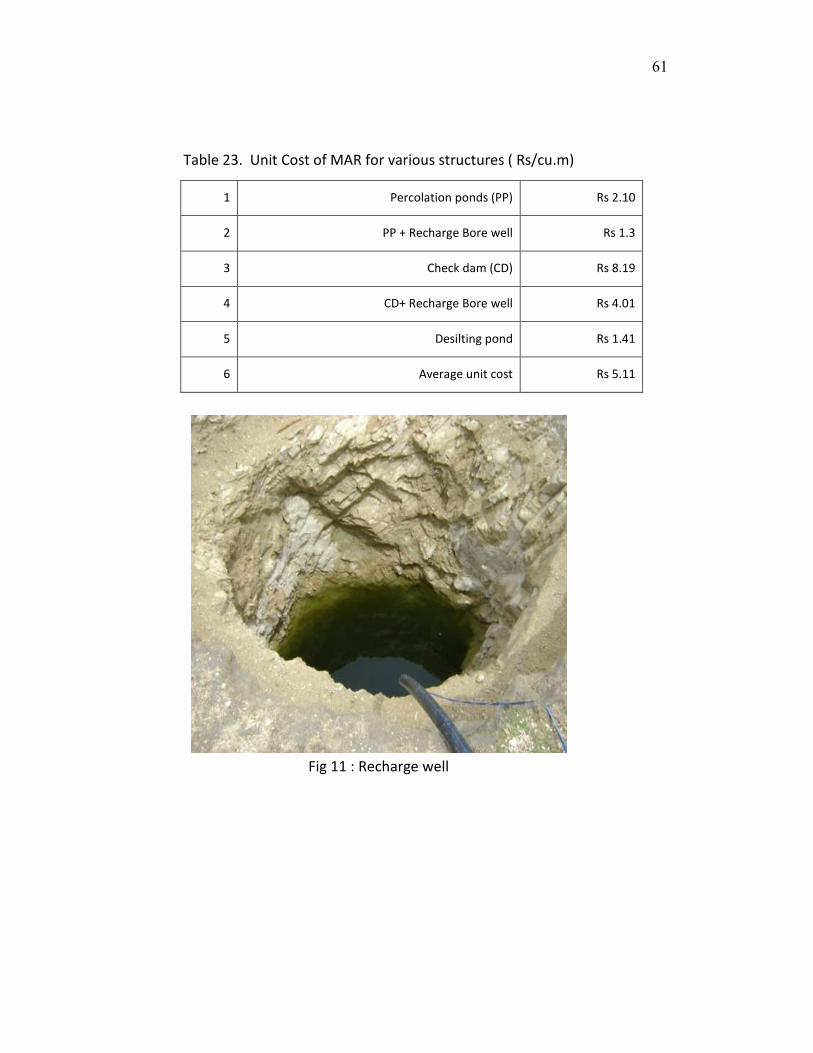
61
Table 23. Unit Cost of MAR for various structures ( Rs/cu.m)
1 Percolation ponds (PP) Rs 2.10
2 PP + Recharge Bore well Rs 1.3
3 Check dam (CD) Rs 8.19
4 CD+ Recharge Bore well Rs 4.01
5 Desilting pond Rs 1.41
6 Average unit cost Rs 5.11
Fig 11 : Recharge well
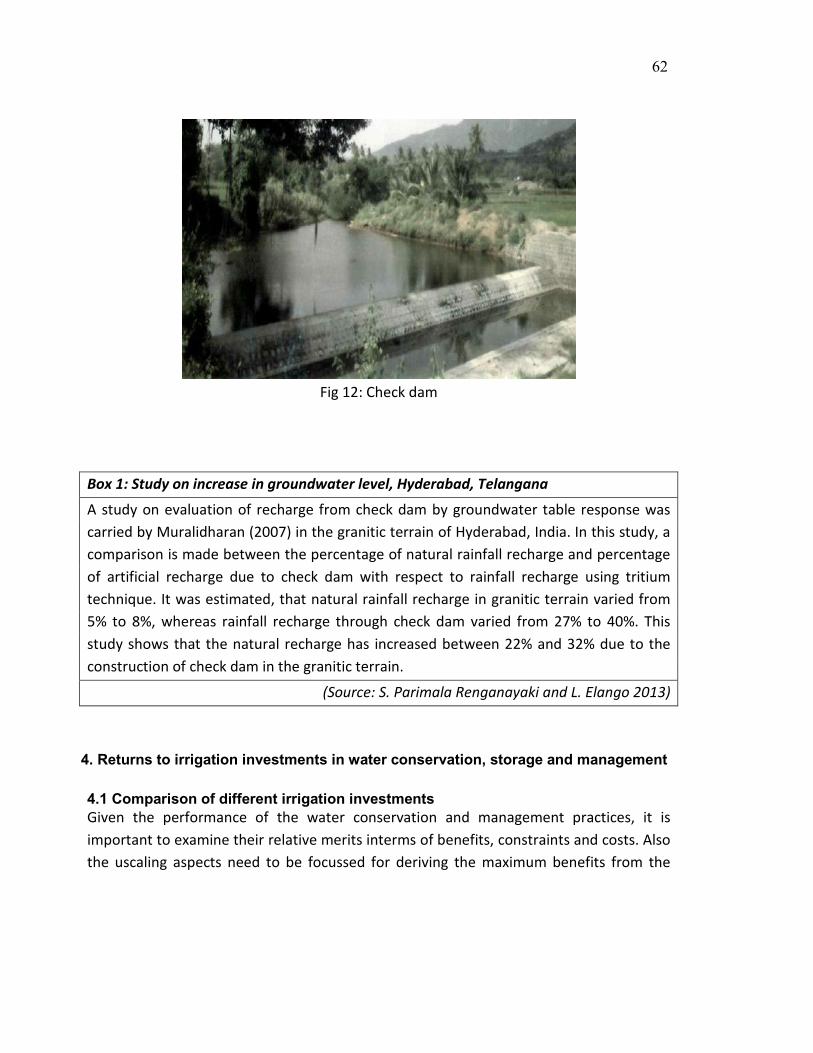
62
Fig 12: Check dam
Box 1: Study on increase in groundwater level, Hyderabad, Telangana
A study on evaluation of recharge from check dam by groundwater table response was carried by Muralidharan (2007) in the granitic terrain of Hyderabad, India. In this study, a comparison is made between the percentage of natural rainfall recharge and percentage of artificial recharge due to check dam with respect to rainfall recharge using tritium technique. It was estimated, that natural rainfall recharge in granitic terrain varied from 5% to 8%, whereas rainfall recharge through check dam varied from 27% to 40%. This study shows that the natural recharge has increased between 22% and 32% due to the construction of check dam in the granitic terrain.
(Source: S. Parimala Renganayaki and L. Elango 2013)
4. Returns to irrigation investments in water conservation, storage and management 4.1 Comparison of different irrigation investments Given the performance of the water conservation and management practices, it is important to examine their relative merits interms of benefits, constraints and costs. Also the uscaling aspects need to be focussed for deriving the maximum benefits from the
63
interventions. A brief account of various measures and their returns are compared below (Table 24). Table 24. Impacts of in-situ and ex-situ moisture conservation and management practices
Investment practices Current performance f return Constraints
1. In situ soil and moisture conservation practices Zingg conservation bench terraces
Adoption: 20-25% of medium to deep black soil area
Economic benefit: Rs. 12000-15000/ha. The increase in yield of different crops
varied from 10.5 to 53.0%.
8-9% Heavy initial investment. Majority of the farmers in
Northern Dry zone of Karnataka
(30-35%) have adopted a soil and water conservation structure
which is similar to zing consersvation bench terrace.
Inter plot rain water harvesting
technique
Adoption: Negligible Economic benefit: Rs. 4000-6000/ha.
Increase in yield 10-12%.
6-7% The operations are laborious an time consuming. Also costly.
Compartmental funding Adoption: moderate Economic benefit: Rs. 6000-7000/ha.
Increase in yield 12-15%.
10-12% Availability of machineries or bullocks to form the funding is limited.
Set furlow cultivation Adoption: Negligible Economic benefit: Rs. 3000-5000/ha.
Increase in yield 6-10%.
8-9% Bullock labour not available or costly to do this in small fields.
Tied ridges
Adoption: Negligible Economic benefit: Rs. 3000-4000/ha.
Increase in yield 5-6%.
5-6% This practice is difficult to adopt by all mers due to difficulties in making tied ridges
Broad bed and furrows Adoption: moderate Economic benefit: Rs. 7000-9000/ha.
Increase in yield 15-18%.
12-14%
Border planting method (Skipped row planting)
Adoption: Negligible – to moderate. Economic benefit: Rs. 5000-6000/ha.
Increase in yield 8-10%.
7-8% Not adopted by all; it depends upon the crop pattern and farmers choice of the
border crops Contour border strips Adoption: Negligible
Economic benefit: Rs. 4-50000-5000/ha. Increase in yield 8-9%-8
7-8% Not much familiar to all farmers and soil types.

64
Contour bunds Adoption: Very low Economic benefit:
Increase in yield was from 14% to 56% (Rs. 10000/ha)
12-13% The technology was not accepted by the clients. They say it is de-shaping
the width of the cultivable land (seed drill width) consequently
it results in increased inconveniences
in cultural operations and cost of cultivation
Off season tillage practices Adoption: moderate; economic benefit= Rs 4000-5000/ha.
6-7% Bullock labour costly for timely field operations
Micro catchments Adoption: moderate; benefit= Rs 5000-6000/ha. Yield increase 8-
10%
8-9% Operational cost is high.
Graded border strips Adoption: Negligible Economic benefit: Rs.12000-15000/ha. The increase in yield was to the extent
of 11-128%.
7-8% Farmers have accepted the technology, but they are of the opinion that
the minimum width of the border strip should be at least of 0.4 ha. Its spread is
very high in irrigated command areas Graded bunds with strip leveling Adoption: Modernate to heavy.
Economic benefit: Rs. 6000-8000/ha. The increase in yield was to the
extent of 15-20%.
6-7% Though this technology is strictly recommended for areas receiving more
than 750 mm of rainfall, still it is in very high adoption in low rainfall areas.
Vegetative live barriers and mechanical checks
Adoption: Negligible Economic benefit: Rs. 4000-5000/ha.
Per cent increase in yield was 15-20%%.
8-9% Spread vetivera or Leucaena is very much limited because seeds of Leucaena
are not accessable to clients on the other hand Vetivera acts as a alternative
host for striga which cause greater threat to sorghum cultivation.
2. Ex situ water storage and management practices Surface water harvesting
structures – Farm pond, Nala bund, check dam,
percolation tanks ,
Adoption: moderate. There has been improvement in the water
table depth to an extent of 3-4 meters and there was increase in the area of
irrigation to an extent of 1 ha. Supplemental irrigation covers 1-2 ha
additionally.
12-14% Initial investment is high.
Ground water recharging techniques
Adoption: low to moderate. The benefit of the technology is realized.
Water table increased 1-2 m post
14-15% Initial investment high; Needs awareness creation
65
monsoon season. Average area increase 1 to 1.5 ha with
irrigated dry crops Watershed development Adoption: moderate;
benefits vary according to type of watershed interventions;
average income increase =Rs 7000-8000/ha
15-16% Mostly done under government programs and NGOs. Selective interventions are done by few
large farmers. Upstream and downstream issues common
Tank rehabilitation Adoption: low to moderate; c benefits range from Rs 8000 to 10,000/ha.
18-20% Mostly done under government programs through national or international
funding; some donor programs are common. Community initiatives are
lacking; post project maintenance also poor.
Note: In the case of in situ measures, the simple rate of returns were worked out using the case study data from the research station data. In the case of ex situ measures, the rates of return (IRR) were worked using the available data from different implementing agencies as well as authors own estimates. 4.2 Constraints in technology adoption The overall constraints in the better adoption of the various soil and water conservation measures include the following:
• Inadequate, low and erratic rainfall, most vulnerable and aberrant • Undulating topography and rolling plains • Lowering in ground water table • High evaporation in farm ponds/ stored water. Low adoption of rainwater management
techniques with special reference to moisture conservation practices. • Low adaptability of farm ponds at farmers level • Soils are highly degraded with low water retention capacity and multiple nutrient
deficiencies • Soil erosion due to high intensity of rainfall • Socio economic issues- high wage rate and non availability of farm machineries for timely
field operations.
66
4.3 Conclusions and recommendations Among the various in situ and ex situ soil and water conservation practices, adoption of the in situ soil and moisture conservation measures ranged from low to moderate. The average adoption has ranged from 5-6% only. . Most of the in situ measures yielded moderate financial return which ranged from 7-8 %.; in the case of ex situ measures, which were done using community based Government/NGO programs, the overall financial rate of return ranged from 15-16% indicating the importance of ex-situ measures. However, most of the in situ measures are individual farmer based and are constrained by the increasing labour wage rates and non-availability of farm implements and bullocks. Also, most of the in situ practices are adopted using the rainfall pattern, where the variation in rainfall pattern affected their performance. In both in situ an ex situ cases, supplemental irrigation provided a better opportunity to increase crop income and farmer income. Further, micro irrigation based supplemental irrigation from farm ponds, percolation ponds and tanks proved investment worthy. Research station based in situ measure are more in the farmers fields thus creation of more awareness of these measures among the farm households. Cropping pattern and farming system approach can be piloted in selected villages to create awareness among the farmers to manage the soil and water resources more efficiently. The study concludes that in the case of in situ conservation measures, contour bunding, broad bed and furrows and compartmental bunding are worth for investment. In the case of ex situ measures, farm pond construction, storage tanks (from pumps), and tank rehabilitation are suggested. In all the investment strategies, change in cropping pattern and supplemental irrigation using drip and sprinkler are highly recommended.

67
Piloting of some of the promising in situ measures in a cluster of villages will help boost the adoption of these measures by the small and marginal households. As most of the dryland farmers are facing the risk of crop failure due to variation in rainfall, appropriate weather based crop insurance products can be examined and introduced. Introduction of more custom hiring units in a cluster of villages is suggested to boost the timely adoption of the in situ conservation measures. Further, awareness programs on the rainfall pattern, training /capacity building programs on several in situ soil and water conservation practices in the villages will be helpful to convince the small and marginal farmers in their adoption of these in situ measures. In the case of ex situ measures, most of them are community based and involves active participation of the community. As the investment varied from Rs 10000 to 20000 per ha, it is important that appropriate investment package should be designed to implement the ex situ measures. For better implementation of various ex situ measures, public private partnership can be developed. Also convergence of the several ongoing government programs will help implement these measures in a better manner as indicated below.
68
References Akshata k. Nayake. 2011. Economics of percolation tanks in eastern dry zone of Karnataka. Department of agricultural economics Unpublished M.Sc thesis, University of Agricultural Sciences, GKVK, Bengaluru. Adeoti, A.I., 2009, Factors Influencing Irrigation Technology Adoption and its Impact on Household Poverty in Ghana, Journal of Agriculture and Rural Development in the Tropics and Subtropics, 109(1): 51-63 Ahmad, M., Akram, M., Rauf, R. and Khan, I.A., 2007. Adoption of and constraints in use of high yielding varieties: A case study of four villages of district Peshawar and Charsada, Sarhad J. Agric. Vol., 23(3) 803-806. Bahera and K.Palanisami. 2013. Small Tank Study report – Odisha. Overseas Projects and Services Ltd, Bhubaneswar, Odisha in association with ICAR Water Management Directorate and IWMI, Hyderabad Chanda, D. K. 2003. Management of Aquifer Recharge and Subsurface Storage. Netherlands National Committee – International Association of Hydrogeologists (NNC-IAH). Seminar Publication No. 4, 18 – 19 December 2002. Characterization of benchmark agricultural watersheds in India, Thailand, and Vietnam. Global Theme 3: Water, Soil and Agrobiodiversity Management for Ecosystem Health. Report no. 2. Patancheru 502 324, Andhra Pradesh, India: International Crops Research Institute for the Semi-Arid Tropics. 52 pp.
Ferede, S. and Bokelmann, W. 2008. Adoption of agricultural technology and socio-economic characteristics of smallholder farmers in ethiopia. Acta Hort. (ISHS) 772:187-190. Fernandez-Cornejo, J., 2007, Off-Farm Income, Technology Adoption, and Farm Economic Performance, Economic Research Report No. (ERR-36), February 2007, pp.53.
69
FAO. 1991. Manual on costs and prices. Rome. FP7 Project “Saph Pani”. 2013. Managed aquifer recharge from an integrated perspective. http://dste.puducherry.gov.in/managed_aquifer_recharge.pdf Gale IN, Macdonald MJ., Calow R, Meumandd I, Moench, Kulkarni H, Mudrakartha Sand Palanisami K. 2006. Managed Aquifer Recharge: an assessment of its role and effectiveness in watershed management, British Geological Survey, Commissioned Report, CR/06/107N. 80pp. GoI (2005). Ministry of water resources: Report on third census of minor irrigation schemes 2000-2001. Minor irrigation division, Government of India. Goyal R K, Ojasvi P R, Bhati T K 1995. Economic evaluation of water harvesting pond under arid condition, Indian Journal of Soil Conservation, 23 (1): 74-76. ICAR. 2011. Annual Reports of Water Management Schemes. Various centres. Bhabaneswar. India Kakumanu, Krishna Reddy. 2015. Economics of new energy efficient methods with micro irrigation in dryland system. Research Program on Dryland Systems. IWMI, Hyderabad. Kishore A, Shah T and Tewari N D 2014. Solar irrigation pimps: Farmers’ experiences and state policy in Rajasthan. Economic & Political Weekly, 40(10): 55-62. Jana, S and K.Palanisami. 2012. Scoping Study to Assess Constraints and Opportunities for Sustaining Tank Irrigation Ecosystem and Small Holder Livelihoods in West Bengal, ACIAR-IWMI Small tank Scoping Study. Unpublished Report, IWMI, Hyderabad. Jodha N.S., 1977. Resource Base as a Determinant of Cropping Patterns, In: Symposium on Cropping Systems Research and Development for the Asian Rice Farmer, Los Banos: International Rice Research Institute, 1977.
70
Renganayaki, P. S and Elango, L. 2013. A review on managed aquifer recharge by check dams: a case study near Chennai, India. International Journal of Research in Engineering and Technology Vol. 2 Issue 4. 416 – 423pp
Raman S and Tikadar 2011. Estimated energy savings in Gujarat through micro irrigation. Paper presented in IGWC, Madurai Rawat S and Mukherji A 2012. Poor state of irrigation statistics in India: The case of wells and tube wells. Water policy research, IWMI-TATA Water policy program: 5. Regional Agricultural Research Station, 2014. Annual report of All India Co-ordinated Research Project for Dryland Agriculture, Bijapur (karnataka) for 2013-14. Samaj Pragati Sahayog, 2006. Food Security in 2020: Drylands are the Answer, Bagli, 2006.
Schutjer, W.A. and Van der Veen, M.G., 1977. Economic Constraints on Agricultural Technology Adoption in Developing Nations. United States Agency for International Development, Occasional Paper No. 5. Washington, DC: USAID.
Shah, M., Banerji D., Vijayshankar P.S. and Ambasta P., 1998. India’s Drylands: Tribal Societies and Development Through Environmental Regeneration, Oxford University Press, New Delhi, 1998.
Singh, A., Gaurav, S. and Ranganathan, T., 2012, Do caste and social interactions affect risk attitudes and adoption of microinsurance? Evidence from rainfall insurance adoption in Gujarat, India, Research Paper No.25, November 2012, International Labour Office, Geneva, pp.25. Shah T 2009. Climate change and groundwater: India’s opportunities for mitigation and adaptation, Environmental Research Letters 4, 035005. Shah T and Kishore A 2012. Solar-powered irrigation and India’s groundwater economy, water policy research, IWMI-TATA Water policy program: 26.

71
Shah T, Verma S and Durga N 2014. Karnataka’s smart, new solar pump policy for irrigation. Economic & Political Weekly, 49 (48): 10-14. Singh R P (1983). Farm ponds. Project Bulletin No. 6, AICRDA, Hyderabad, India Suresh Kumar,D and K.Palanisami. 2011. Can Drip Irrigation Technology be Socially Beneficial? : Evidence from Southern India, Water Policy, 13:571-587. Tewari N P 2012. Solar irrigation pumps. Water policy research, IWMI-TATA Water policy program: 35. Steve Amosson, Lal Almas,Jnaneshwar R. Girase, Nicholas Kenny, Bridget Guerrero, Kumar Vimlesh and Thomas Marek. 2011. Economics of Irrigation Systems, Report. The Texas A&M System Sreedevi TK, Shiferaw B and Wani SP. 2004. Adarsha watershed in Kothapally: understanding the drivers of higher impact. Global Theme on Agroecosystems Report no. 10. Patancheru 502 324, Andhra Pradesh, India: International Crops Research Institute for the Semi-Arid Tropics. 24 pp.
Sugden Fraser, 2012. Tank Irrigation in Saptari and Shaunsha, Eastern Nepal, Tarai. ACIAR-IWMI Small tank Scoping Study. Unpublished Report, IWMI, Hyderabad. Qureshi A S 2014. Reducing carbon emissions through improved irrigation management: A case study from Pakistan. Irrigation and Drainage, 63(1), 132–138. UNESCO’s International Hydrological Programme. 2005. Strategies for Managed Aquifer Recharge (MAR) in semi-arid areas. UNESCO/IHP/2005/GW/MAR. http://unesdoc.unesco.org/images/0014/001438/143819e.pdf Vidya Ramesh and K.Palanisami. 2013. Constraints and Opportunities for Sustaining Tank Irrigation Ecosystems and Small Holder Livelihoods- Bihar Case Study. ACIAR-IWMI Small tank Scoping Study. Unpublished Report, IWMI, Hyderabad.

72
Zou X, Li Y, Li K, Cremades R, Gao Q, Wan Y and Qin X 2015. Greenhouse gas emissions from agricultural irrigation in China. Mitigation and Adaptation Strategies for Global Change, 20: 295-315.

73
Annexure Annexure 1. Definitions of the cost and benefit concepts
An understanding of few basic terms and concepts relating to the economics of irrigation investment is important. Brief description of these concepts is given below. Revenue: Revenue or gross income refers to the money value of output and we often talk of total and average revenue. Total revenue is the synonymous of total value product. The average revenue is defined as the value per unit of output. If we define the quantities of outputs as Y1, Y2,Y3….Yn and their respective prices as Py1, Py2….Pyn , then the total revenue (TR) can be expressed as Total Revenue (TR) = Py1.Y1+Py2.Y2 +………..+Pyn.Yn The average revenue (AR) can be easily derived from total revenue. Average Revenue (AR) = Total Revenue (TR) / Output (Y) Costs: The term cost refers to the outlay of money for productive services. If the money value of irrigating field on a farm during a given period of planning is Rs.1500.00, it is termed as the cost incurred by the farm. Costs may be total or per unit. Total costs: Money value of all the inputs used on a certain farm during a given period, season or year, is termed as the total costs. If the inputs used are represented by X1, X2, …. Xn and their respective prices are Px1, Px2…..Pxn, then the total cost (TC) can be expressed as Total cost (TC) = Px1.X1 + Px2.X2 + ………+ Pxn.Xn Fixed and Variable costs: The total cost comprises of two components i.e. fixed and variable cost. Fixed costs are those costs, which are not a function of output, hence they do not vary with the level of output. For example, land revenue, taxes, insurance premium and contractual payments such as rent represent fixed costs. Variable costs

74
constitute the outlay of funds that are a function of output in a given production period, i.e. they vary with the level of output. The outlay of funds on labour, fuel and oil, electricity are a few examples of variable costs. If we represent total costs by TC, total fixed cost by TFC and total variable cost by TVC, then TC = TFC + TVC Signifying that the total fixed and variable costs add up to the total cost of which they are two constituents. Average cost: The total cost can be expressed per unit of the output (Y) and that refers to average cost (AC). AC = TC / Y We know that TC = TFC + TVC. If we divide through out by Y, the quantity or level of output, we obtain the following. TC/Y = TFC/Y + TVC/Y
Which reduces to AC = AFC + AVC Thus average cost consists of two components i.e. average fixed and variable costs. Marginal cost (MC): It is the change in total cost due to an addition of one unit of output to the total production. i.e. it is the change in total cost with respect to change in output.
YΔTCΔMC =
In addition to the above cost concepts, four cost concepts are being widely used particularly in the scheme on “Cost of Cultivation of Principal Crops”. These concepts are useful in deriving various income concepts relating to the contribution of various factors

75
of production like water, land, labour etc. Each cost concept along with its constituents is explained below: Cost A1 : All actual expenses in cash and kind incurred in farm production by the farmer. This includes value of hired human labour, value of bullock labour (hired and owned), value of machine power (hired and owned), value of seeds (farm produced and purchased), value of insecticides and pesticides, value of machineries (owned and purchased), value of fertilizers, depreciation of implements and farm buildings, irrigation charges, land revenue, cesses and other taxes, miscellaneous expenses like electricity charges and interest on working capital.
Cost A2: Cost A1 + rent paid for leased in land Cost B1: Cost A2 + interest on value of owned capital assets (excluding land) Cost B2: Cost B1 + rental value of owned land Cost C1: Cost B1 + imputed value of family labour Cost C2: Cost B2 + imputed value of family labour Cost C3 : Cost C2 X 1.1 (10 % added to the Cost C2).
Cost C3 is the recently added concept to provide allowance for managerial functions performed by the farmer. Gross margin: The gross margin (GM) may be defined as the total value product (TVP) less total variable costs (TVC). Gross margin (GM) = Total value product -- Total variable costs Profit (or Loss): As we know, one of the important objectives of the farmer is to maximize the farm profits on a continuous basis, it is important that the farm profit concept be understood very clearly. Profit (π ) = TVP – TC = TVP – (TFC + TVC)
76
Where,π refers to profit when positive and loss when negative. Depreciation: Depreciation involves spreading the original cost of an asset over its entire useful life. The original cost is a prepaid expense, therefore, it is logical that this cost be allocated to the accounting periods during which the asset is used. Budgeting: It may be defined as a detailed physical and financial statement of a farm plan or of a change in the farm plan over a certain period of time. The length of period varies from plan to plan which the budgeting refers. This technique relies heavily on the judgement and experience of drawing up one or more farm plans and thus choosing the one gives the best financial results. Break-even point: It refers to that volume of business, at which the farmer is indifferent between two alternatives i.e. he is neither better-off nor worse-off irrespective of the choice he makes.
hourpercosRunninghourperesargchhireCustom t cost fixed AnnualTotal point even-Break
−=
This is the method used to work out the minimum level of work the implement/machinery has to perform to justify its purchase.
77
Annexure 2 Analysis of irrigation investments Analysis of irrigation investments is important to examine the financial viability of the investments both in the short and long run. Irrigation machinery and equipments are the major components of fixed capital on the farm and there is a large variety of machines and equipments from which the farmer has to choose, within the framework of his farm organization, in order to reduce the per unit cost in the long-run and achieve the highest returns per unit of time. The management of irrigation machines on the farms is reduced drudgery on tedious operations, reduced costs, increased returns through increasing intensity, efficiency and timeliness of operations. Once it is decided to get the work done with the machine, the immediate management question is whether to own the machine or to get it on custom hiring. Again if it is to be owned, what should be its size and whether it should be new or secondhand. The key points to be considered while deciding upon the size of a machine are:
• The difference in the initial cost of the large and small unit of irrigation equipment
• The annual use to made of the machine • The amount of additional labour saved by the machine • The relative opportunity cost of capital and labour on the farm
Costs Cost plays a major role in the process of selection of an irrigation system. Preference has to be given by the designer/planner to select a system that has either the least cost or the one, meets the farmer’s requirements at a cost that can be recovered from the sale of the produce from the scheme. The overall cost of the scheme depends on the system capacity, technology selected and its management and maintenance. Overall cost comprises the capital cost (cost of constructing the system and buying pumps and irrigation equipment) and the operation cost (cost of running the system over many years). Based on the cost effectiveness, the selection of the irrigation system is to be done. Capital costs are easily identifiable as the

78
sum of money which is paid out when installing a scheme. Operating costs are not as clearer as capital costs. It is spread over the years and is not uniform. So usually the farmers tend to opt for an irrigation system that involves less capital cost, thus saving money to meet out the operating cost as the scheme starts functioning. Even choosing capital equipment can create difficulties. Should a farmer for example, buy a cheap pump which may only last a few years or buy an expensive model which may provide good service for many years. Should the farmer buy a new machine costs Rs.10000, which may last for 20 years or purchase a second-hand machine costs Rs.5000, which may last for 10 years? A farmer may opt for lined canal instead of using pipes, as they are cheaper to construct. But canals require more maintenance and also prone to seepage problems. Pipes on the other hand, may be more expensive but needs little maintenance. For sprinkler or drip irrigation, a farmer may prefer to buy smaller diameter pipes because they are cheaper than larger ones. What may not be considered is the increase in power required to pump water along smaller pipes because of increased friction which may result in a rise in energy use and hence energy cost. This increase in energy cost over a few years of operation may be far greater than the cost of installing larger diameter pipes. Capital cost This is the major investment cost of constructing the irrigation systems to the point where it is ready for use. It may include pumps, pipes and field equipment, construction of open channels and land preparation such as bush clearance and levelling.
Table .1 Useful life of irrigation system components
Items Years Diesel engine pump 15
Electricity driven pump 10 Pipelines
a. On the surface b. Buried
4-7
10-20 Sprinkler and drip equipment 5-10
Open channels a. Lined
10
79
b. Unlined 5
Just as how long equipment lasts before it needs to be replaced obviously depends on the quality of the equipment, how much it is used and how well it is maintained. Table.1 presents the guidelines for useful life of equipment for small-scale irrigation schemes when they are properly used and maintained. Operating cost These costs are incurred regularly throughout the useful life of the scheme and so a time period needs to be set over which the costs can be assessed. Usually the operation of the scheme is similar from one season or year to the next and so a common approach is to consider costs on the basis of one cropping season or over a full year as a suitable period. There are three main operating costs
a. Energy b. Maintenance and Repair c. Labour
Energy This is the cost of providing fuel (diesel) to operate the irrigation system. The cost of diesel per litre can be determined from the local market. The scarcity of such fuels must also be considered. If there are shortages, the farmer has to pay more price than the normal. Electricity, if available, will be charged at each unit of energy consumed. Maintenance and Repair Maintenance and repair costs vary greatly depending on the type of the scheme. For example, a surface irrigation scheme with open earth channels which may require substantial annual maintenance and repair. The farmer and his family in between irrigation seasons may do this, and so money is not actually paid to the outsiders for this work. However, this effort has got the money value. But maintenance of pumping equipment and equipment for sprinkler and drip irrigation may need outside specialist help and spare parts and hence cash will be needed for it.
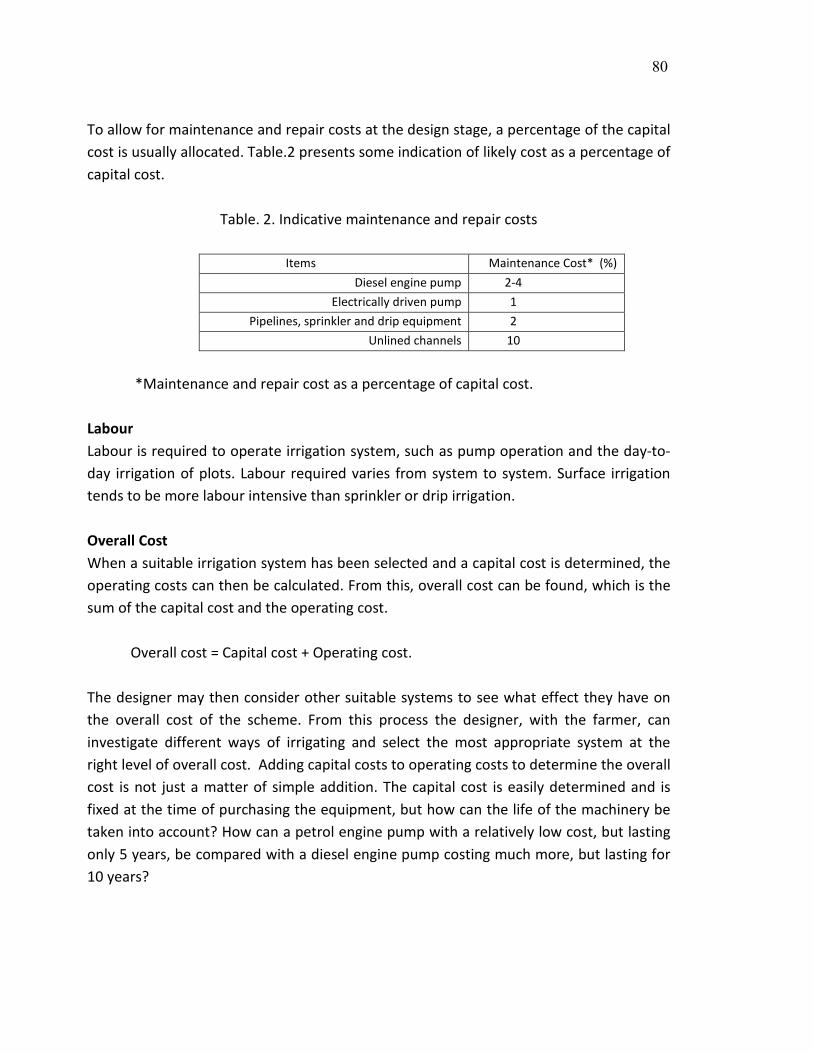
80
To allow for maintenance and repair costs at the design stage, a percentage of the capital cost is usually allocated. Table.2 presents some indication of likely cost as a percentage of capital cost.
Table. 2. Indicative maintenance and repair costs
Items Maintenance Cost* (%) Diesel engine pump 2-4
Electrically driven pump 1 Pipelines, sprinkler and drip equipment 2
Unlined channels 10
*Maintenance and repair cost as a percentage of capital cost.
Labour Labour is required to operate irrigation system, such as pump operation and the day-to-day irrigation of plots. Labour required varies from system to system. Surface irrigation tends to be more labour intensive than sprinkler or drip irrigation. Overall Cost When a suitable irrigation system has been selected and a capital cost is determined, the operating costs can then be calculated. From this, overall cost can be found, which is the sum of the capital cost and the operating cost. Overall cost = Capital cost + Operating cost. The designer may then consider other suitable systems to see what effect they have on the overall cost of the scheme. From this process the designer, with the farmer, can investigate different ways of irrigating and select the most appropriate system at the right level of overall cost. Adding capital costs to operating costs to determine the overall cost is not just a matter of simple addition. The capital cost is easily determined and is fixed at the time of purchasing the equipment, but how can the life of the machinery be taken into account? How can a petrol engine pump with a relatively low cost, but lasting only 5 years, be compared with a diesel engine pump costing much more, but lasting for 10 years?
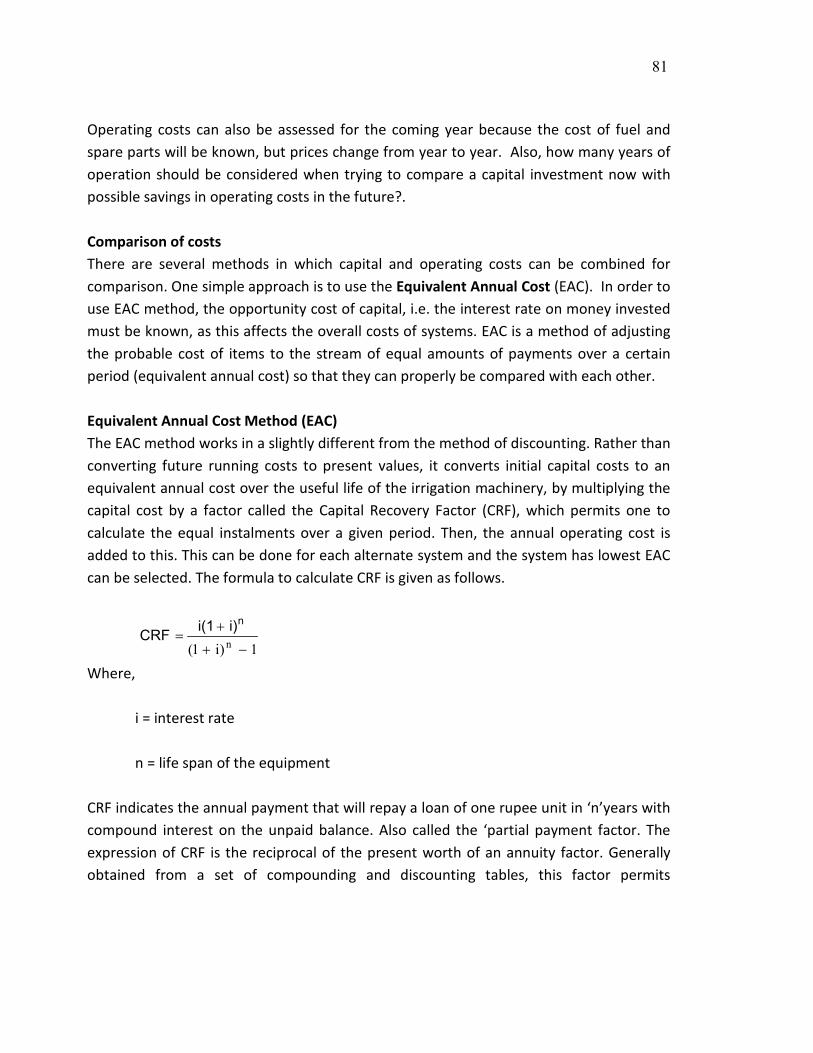
81
Operating costs can also be assessed for the coming year because the cost of fuel and spare parts will be known, but prices change from year to year. Also, how many years of operation should be considered when trying to compare a capital investment now with possible savings in operating costs in the future?. Comparison of costs There are several methods in which capital and operating costs can be combined for comparison. One simple approach is to use the Equivalent Annual Cost (EAC). In order to use EAC method, the opportunity cost of capital, i.e. the interest rate on money invested must be known, as this affects the overall costs of systems. EAC is a method of adjusting the probable cost of items to the stream of equal amounts of payments over a certain period (equivalent annual cost) so that they can properly be compared with each other. Equivalent Annual Cost Method (EAC) The EAC method works in a slightly different from the method of discounting. Rather than converting future running costs to present values, it converts initial capital costs to an equivalent annual cost over the useful life of the irrigation machinery, by multiplying the capital cost by a factor called the Capital Recovery Factor (CRF), which permits one to calculate the equal instalments over a given period. Then, the annual operating cost is added to this. This can be done for each alternate system and the system has lowest EAC can be selected. The formula to calculate CRF is given as follows.
1)i1( n −+
+=
ni)i(1 CRF
Where,
i = interest rate n = life span of the equipment
CRF indicates the annual payment that will repay a loan of one rupee unit in ‘n’years with compound interest on the unpaid balance. Also called the ‘partial payment factor. The expression of CRF is the reciprocal of the present worth of an annuity factor. Generally obtained from a set of compounding and discounting tables, this factor permits

82
calculating the equal instalments necessary to repay (amortize) a loan over a given period at a stated interest rate. By using the CRF value, EAC for different irrigation system can be calculated and then compared. This method converts initial capital cost to an equivalent annual cost over the useful life of the equipment. This can be done as follows.
• Find Capital Recovery Factor (CRF)
• Then work out annualised capital cost = Capital cost X CRF
• To the annualised cost add the annual operating cost to arrive the annual cost or EAC. The one, which shows the lowest EAC, is the cheapest solution The following example illustrates how the EAC method is used in a practical situation. Let us assume that a farmer in Coimbatore region is installing a drip unit for his grapes in one hectare. Capital Cost = Rs. 30170.42; Life span = 10 years; Interest rate = 12.5 % Annual operation and maintenance cost = Rs. 750 Comparing the EAC of different irrigation schemes, one can decide the type of irrigation system to be followed so as to minimise the cost of operation. However, the EAC is affected as changes in both the interest rate and the life of the irrigation system.
83
The interest rate clearly has a significant effect on the choice of irrigation system. If interest rate is lower then the more expensive capital equipment with relatively low operating cost is favoured. If it is higher then it may be more cost effective to choose a less durable pump with a lower capital cost and a relatively high operating cost. If the life expectancy of the irrigation system is extended due to good care and maintenance then it becomes more attractive option. For example, if the life expectancy of the diesel engine is reduced to below 10 years, then the cost of this option rises and it becomes less attractive. In summary, at a lower interest rate invest in low capital cost equipment with high operating cost. At a higher rate of interest invest in high capital cost equipment with low operating cost. Extending the useful life of equipment reduces overall costs and may influence equipment selection. Decision making with different irrigation investment options Apart from the Equivalent Annual Cost method, other economic measures can also be applied to test the viability of the scheme. Let us assume that we are to compare/study the economic impact of introduction of a drip system. The basic approach used for assessing the relative economic impact of drip method of irrigation is a comparison between the adopters (with drip) and the non-adopters (without drip) in the context of the same crop. Depending upon the nature of investment (annuals or perennials) different methodologies are adopted to work out the economics of drip irrigation. Budgeting Partial Budgeting It is used to workout the cost and returns of making relatively small changes in the existing farm business, i.e. it evaluates just a segment of a whole farm plan. A partial budget is aimed at answering the questions relating to financial losses and gains due to the proposed minor change in the farm organization. Specially, four questions need to be answered. They are (i) What are extra financial gains? (ii) What are the savings on account of costs? (iii) What are the losses in revenue? and (iv) What are the additional costs?. We can find out the additional cost and returns due to the introduction of new method of (e.g. drip method) irrigation in the place of conventional (e.g. surface irrigation) method of irrigation. Partial budgets are commonly used to estimate the outcomes of possible
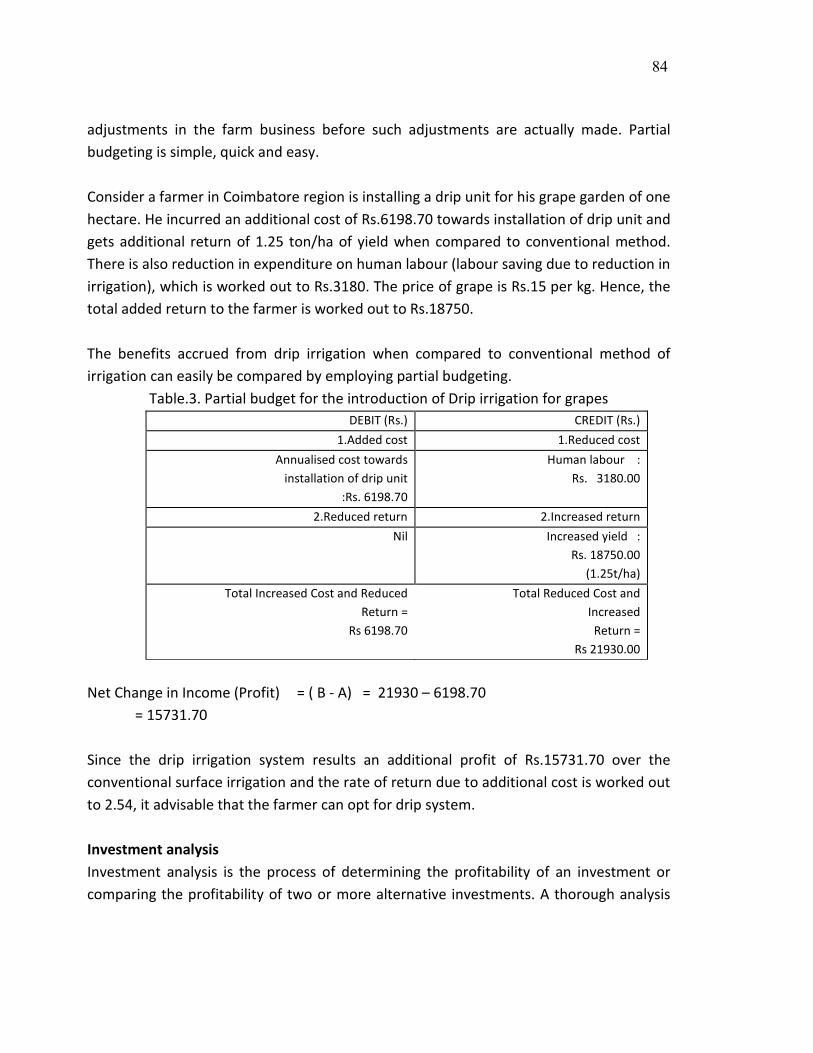
84
adjustments in the farm business before such adjustments are actually made. Partial budgeting is simple, quick and easy. Consider a farmer in Coimbatore region is installing a drip unit for his grape garden of one hectare. He incurred an additional cost of Rs.6198.70 towards installation of drip unit and gets additional return of 1.25 ton/ha of yield when compared to conventional method. There is also reduction in expenditure on human labour (labour saving due to reduction in irrigation), which is worked out to Rs.3180. The price of grape is Rs.15 per kg. Hence, the total added return to the farmer is worked out to Rs.18750. The benefits accrued from drip irrigation when compared to conventional method of irrigation can easily be compared by employing partial budgeting.
Table.3. Partial budget for the introduction of Drip irrigation for grapes DEBIT (Rs.) CREDIT (Rs.)
1.Added cost 1.Reduced cost Annualised cost towards
installation of drip unit :Rs. 6198.70
Human labour : Rs. 3180.00
2.Reduced return 2.Increased return Nil Increased yield :
Rs. 18750.00 (1.25t/ha)
Total Increased Cost and Reduced Return =
Rs 6198.70
Total Reduced Cost and Increased
Return = Rs 21930.00
Net Change in Income (Profit) = ( B - A) = 21930 – 6198.70
= 15731.70 Since the drip irrigation system results an additional profit of Rs.15731.70 over the conventional surface irrigation and the rate of return due to additional cost is worked out to 2.54, it advisable that the farmer can opt for drip system. Investment analysis Investment analysis is the process of determining the profitability of an investment or comparing the profitability of two or more alternative investments. A thorough analysis

85
of an investment requires the following information. They are the net cash revenues from the investment, its cost, the terminal or salvage value of the investment and the interest or discount rate to be used. Net cash revenues or cash flows must be estimated for each year in the life of the investment. The cash receipts less the cash expenses equals the incremental benefits resulting from the investment. The cost of the investment should be the actual total expenditure for its purchase and not the list price or just the down payment if it is being financed. The terminal value will often need to be estimated and may be set equal to the salvage value for a depreciable asset. The discount rate is often one of the more difficult pieces of information to estimate. It is the opportunity cost of capital representing the minimum rate of return required to justify the investment. Profitability of the capital investment can be assessed by various undiscounted and discounted measures. Undiscounted measures The undiscounted measures ignore the time element of the capital investment. There are different measures available viz., pay back period, ranking by inspection, proceeds per rupee of outlay, average annual proceeds per rupee of outlay to compare the project investment. Pay Back Period The pay back period is the length of the time from the beginning of the project until the net value of the incremental production stream reaches the total amount of the capital investment. The pay back period is common, rough means of choosing among investments in business enterprises, especially when the choice entails a high degree of risk. As a measure of investment worth, the payback period fails to consider earnings after the pay back period. Hence pay back period is an inadequate criterion to make a choice between two projects or alternatives. For example, the following table shows the pay back period for a drip irrigation system investment for grape garden in Coimbatore district.

86
Table.4. Net cash flow of a drip irrigation system
Year Annual Cumulative 1 -193936.00 -193936.00 2 89905.26 -104030.74 3 79493.62 - 24537.12 4 81873.80 57336.68
The pay back period for drip irrigation investment is four years. Some of the other undiscounted measures such as ranking by inspection, proceeds per rupee of outlay, average annual proceeds per rupee of outlay etc., can be used. Ranking by inspection simply looking at the investment cost and the net value of production. It does not adequately take into consideration the timing of proceeds. Proceeds per rupee of outlay is the total net value of incremental production divided by the total amount of the investment. It fails to consider the differences in timing of the proceeds and it ignores time value of money. Average annual proceeds per rupee of outlay is the average net value of production divided by the total amount of the investment. Where, the average net value of production is net value of production divided by number of annual cash flows. Example: Consider the following four irrigation projects. For the given capital investment and returns over a period of four years, the project investment can easily be compared by various undiscounted measures (Tables 5 to 6).
Table.5. Cost and benefit stream of four irrigation projects Years Capital (Rs.) Net value of production (Rs.)
Project 1 1 20000 0 2 0 10000 3 0 10000 4 0 0
Total 20000 20000 Project 2

87
1 20000 0 2 0 10000 3 0 10000 4 0 3000
Total 20000 23000 Project 3
1 20000 0 2 0 2000 3 0 8000 4 0 15000
Total 20000 25000 Project 4
1 20000 0 2 0 2000 3 0 15000 4 0 10000
Total 20000 27000
Ranking by inspection: Simply by observing capital and net value of production, one can rank the projects.
Table.6. Results of ranking by inspection method
Projects Rank 1 IV 2 III 3 II 4 I
Proceeds per rupee of outlay: The proceeds per rupee of outlay is worked out for each projects and be compared (Table 7).
Table.7. Results of proceeds per rupee of outlay
Projects Capital (Rs.) Net value of production (Rs.)
Proceeds per rupee of outlay
Rank
1 20000 20000 1.00 IV 2 20000 23000 1.15 III

88
3 20000 25000 1.25 II 4 20000 27000 1.35 I
Average annual proceeds per rupee of outlay: This can be used as a measure to make comparison of different projects (Table 8).
Table.8. Results of average annual proceeds per rupee of outlay
Projects Capital Net value of production
Average net value of
production
Average annual proceeds /rupee of outlay
Rank
1 20000 20000 10000.00 0.5 I 2 20000 23000 7666.66 0.38 IV 3 20000 25000 8333.33 0.42 III 4 20000 27000 9000.00 0.45 II
Using these undiscounted measures, the projects can be compared and ranked. Discounted measures The method of finding the present equivalent of a future amount is termed discounting. An irrigation project will return the same benefit in each of several years, and we need to know the present worth of the future income stream to know how much we are justified in investing today to receive that income stream. The technique of discounting permits us to determine whether to accept for implementation of particular irrigation project that has variously shaped time streams i.e., patterns of when costs and benefits fall during the life of the project that differ from one another and that are of different duration.
Net Present Worth (NPW) NPW is the difference between the sum of the present value of benefits and that of costs during the economic life period of the irrigation scheme. In terms of the NPW criterion, the investment on a irrigation scheme can be treated as economically viable if the present value of the benefits is greater than the present value of the costs. The selection criteria is that NPW should be positive. ( see, Fig 2 for showing the NPW of irrigation investment).
∑ ∑= = +
−+
=n
1K
n
1K nK
nK
)i1(C
)i1(B
NPW

89
Where,
Bk = Benefits in the period ‘k’ k = 1..n Ck = Cost in the period ‘k’ i = Discount rate n = number of years
Benefit cost ratio (BCR) It is the ratio that gives the returns per rupee of investment on an irrigation project.
∑= +
+=
n
1K nK
nK
)i1/(C)i1/(B
BCR
Generally if BCR is more than one, then investment of that project can be considered as economically viable. The selection criterion is that BCR should be greater than one (see, Fig 3 for showing the NPW of irrigation investment). Internal rate of return (IRR) Another way of using the incremental net benefit stream or incremental cash flow for measuring the worth of the irrigation project is to find the discount rate that makes the net present worth of the incremental net benefit stream or incremental cash flow equal to zero. This discount rate is called Internal rate of return. It is the maximum rate of return that a project could pay for the resources used. The selection criterion is that the IRR should be greater than the opportunity cost of capital (e.g. interest rate of the financial institution).
+=
ignored signs LDR, and HDR at NPW of SumLDR at NPW LDR)-(HDR LDR IRR
Where LDR and HDR is respectively the lower and higher discount rates. The criterion is to select the project with IRR greater than the opportunity cost of capital.

90
Example: The following example demonstrates the working out of NPW, BCR and IRR for the Grape cultivation in Coimbatore under drip irrigation system and without drip irrigation system (Tables 9 & 10).
Table.9. Investment analysis of drip irrigation system (Rupees)
Year Benefit
stream Cost stream Dis.factor @ 12.5 % Dis.ben Dis.cost
Incremental benefit
1 0 218177.7 0.888889 0 193935.7 -218177.7 2 182250 68463.66 0.790123 144000 54094.74 113786.34 3 183750 70564.75 0.702332 129053.5 49559.88 113185.25 4 202500 71354 0.624295 126419.8 44545.95 131146 5 217500 71986.5 0.554929 120697 39947.39 145513.5 6 217500 98699.75 0.49327 107286.3 48685.64 118800.25 7 195000 76560 0.438462 85500.17 33568.68 118440.00 8 187500 74362.8 0.389744 73077.06 28982.48 113137.20 9 183750 73565.95 0.346439 63658.24 25486.14 110184.05
10 185250 80687 0.307946 57047.02 24847.25 104563.00 Sum 906739.1 543653.9
363085.2 BCR 1.667861 IRR 54%
From the analysis of NPW, BCR and IRR, one could easily assess the financial feasibility of the drip installation. Since, NPW is positive, BCR is greater than one and IRR is greater than the opportunity cost of capital (i.e. interest rate of 12.5 per cent), the installation of drip irrigation system for the grape garden will be financially feasible.

91
Table.10. Investment analysis of conventional (with out drip) irrigation system
(Rupees)
Year Benefit Cost Dis.factor @ 12.5 % Dis.benefit Dis.cost
Incrmental benefit
1 0 188007.3 0.888889 0 167117.6 -188007.30 2 167250 68463.66 0.790123 132148.1 54094.74 98786.34 3 168750 70564.75 0.702332 118518.5 49559.88 98185.25 4 180000 71354 0.624295 112373.1 44545.95 108646.00 5 187500 71986.5 0.554929 104049.2 39947.39 115513.50 6 187500 98699.75 0.49327 92488.16 48685.64 88800.25 7 165000 76560 0.438462 72346.29 33568.68 88440.00 8 172500 74362.8 0.389744 67230.9 28982.48 98137.20 9 168750 73565.95 0.346439 58461.65 25486.14 95184.05
10 170250 80687 0.307946 52427.83 24847.25 89563.00 Sum 810043.8 516835.7
NPW = BCR = IRR =
Choosing the discount rate To be able to use discounted measures of project worth, we must decide upon the discount rate to be used for calculating the net present worth, the benefit cost ratio. For financial analysis, the discount rate is usually the marginal cost of money to the farm or firm for which the analysis is being done. This often will be the rate at which the enterprise is able to borrow money. For economic analysis, the best discount or "cut-off" rate to use is the "opportunity cost of capital". This is the rate that will result in utilisation of all capital in the economy if all possible investments are undertaken that yield more return.
For example, the drip irrigation system is an investment yielding returns over time. Hence sensitivity analysis can be done to know the behaviour of BCR and NPW at different discount rates with the following assumptions.
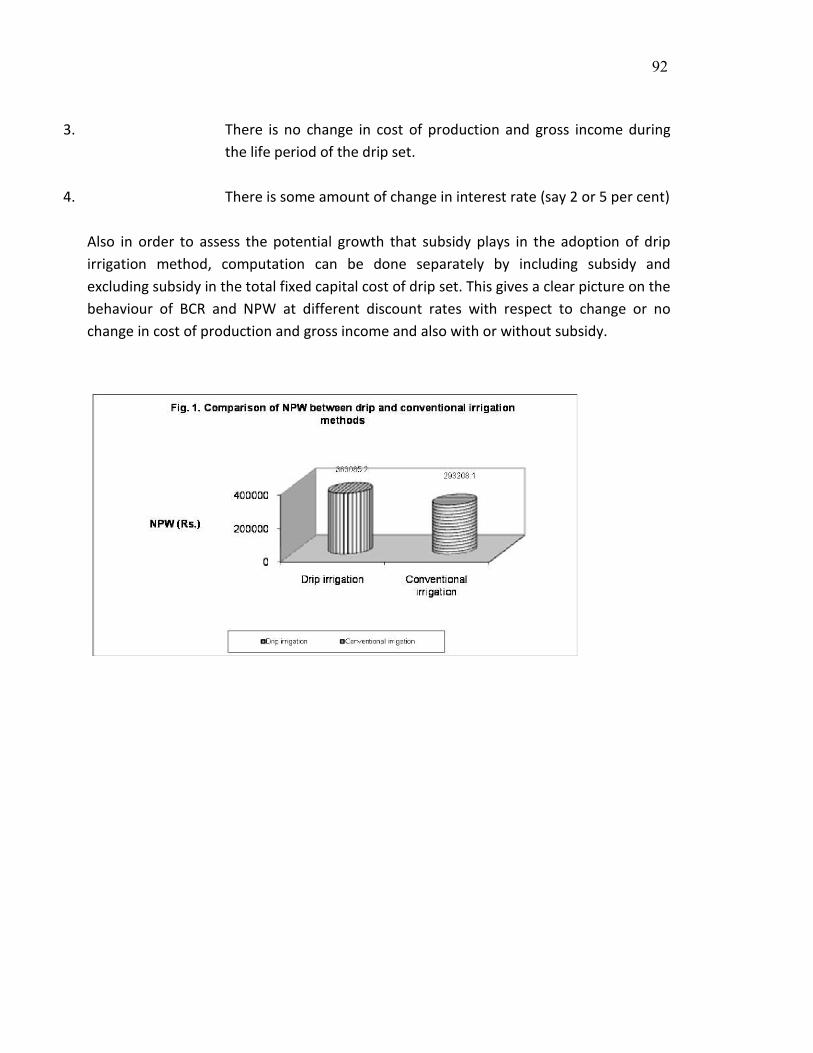
92
3. There is no change in cost of production and gross income during the life period of the drip set.
4. There is some amount of change in interest rate (say 2 or 5 per cent) Also in order to assess the potential growth that subsidy plays in the adoption of drip irrigation method, computation can be done separately by including subsidy and excluding subsidy in the total fixed capital cost of drip set. This gives a clear picture on the behaviour of BCR and NPW at different discount rates with respect to change or no change in cost of production and gross income and also with or without subsidy.

93
Discounted measures are generally followed when a drip system is installed in a newly planted perennial crop field. The perennial crops may start its economic yield only after three or four years. Hence it is necessary to determine the present worth of future income stream. However, when a drip system is introduced in an already existing perennial crop field, partial budgeting can be used annualising the drip establishment cost.
94
Annexure 3 Incorporation of risk in farm investment analysis In financial circles, the term risk has a definite and distinct meaning. Risk refers to the situation where decisions are based on the calculation of probabilities that certain outcomes will materialize, or where probabilities, based on historical information and statistical frequency distributions, are known. For an evaluation of any investment to be meaningful, we must represent how much risk there is so that the cash flows of an investment will differ from what is expected in terms of their amount and timing. Poor decisions have an enormous impact on the profitability of a farm as decisions usually cannot be revoked. To address risks, the farmer should adjust his/her evaluation of capital investment decisions in the following two ways: the required rate of return should be adjusted to provide for the additional risk involved or an adjustment should be made with regard to the relevant cash flows. Various techniques are used to evaluate investment opportunities. The most important techniques are: Internal Rate of Return (IRR), Present Value Payback (PVP), and Net Present Value (NPV). Theoretically, risk can be incorporated or accounted for in each of these methods when they are applied to evaluate the irrigation (capital) investment decision. The question of how management should go about evaluating the risk associated with capital investment decisions needs to be addressed. Mean, variance and coefficient of variation The calculation of the mean, variance and coefficient of variation is a very popular method and relatively easy to use in the evaluation of risk. With the computation of the coefficient of variation and the correlation coefficient, the relative risk of the projects concerned can be compared. The lower the coefficient of variation, the smaller the degree of relative risk. Certainty equivalent method The certainty equivalent method is a recognized technique for the adjustment of risk in capital investment decisions. It is a method based on the principle that risky cash flows can be converted into corresponding risk free cash flows. It is thus an adjustment of cash flow estimates. The method allows for risk preferences to be included in the investment decision as each risky cash flow is converted into its risk free equivalent by multiplying it

95
with a conversion factor. The decision-making rule which applies when this method is used for capital investment decisions is that if the certainty equivalent NPV is greater than or equal to 0, the project can be accepted. Risk-adjusted discount rate method The risk-adjusted discount rate method for investment projects is relatively simple and is consequently widely used. The method is based on the assumption that adjustments for risks associated with capital investment projects can be made by means of the discount rate or cost of capital. The adjustment for risk thus requires the expected risk for the cash flows to be discounted at a higher discount rate than when the probability distribution of expected cash flows (and therefore the risk) is relatively smaller. Sensitivity analysis Sensitivity analysis is used in order to improve the accuracy and reliability of cash flows. It requires the examination of the sensitivity of some variable to changes in another variable. The primary purpose of sensitivity analysis is not to quantify risk, but to establish how sensitive the NPV and the IRR are to changes in the values of key variables in the evaluation of investment projects. Hall, J.H. 1999. Incorporation of risk in the capital investment decision. lecture notes. department of accounting & finance, university of pretoria,pretoria,south africa (this paper can be downloaded from the social science research network electronic paper collection: http://papers.ssrn.com/ paper.taf?abstract_ id=243163
96
Annexure 4 Social benefit cost analysis and role of subsidy in farm profitability Social benefit-cost analysis (SBCA) is a process of identifying, measuring and comparing the social benefits and costs of an investment project or program. SBCA is used to appraise private projects from a social viewpoint as well as to appraise public projects. The need for social benefit-cost analysis in preference to market valuation arises mainly due to the externalities. Externalities arise when certain actions of producers or consumers have unintended external (indirect) effects on other producers or/consumers. Externalities exist when not all costs or benefits are taken into consideration by consumers and producers when conducting their consumption and production activities. Externalities may be positive or negative. Positive externalities would arise when an action by an individual or a group confers benefits to others. Negative externalities would arise when an action by an individual or group of producers had harmful effects on others. The adoption of drip irrigation has significant bearing on the society as a whole and generates various positive and negative externalities. The positive externalities include reduction in well failure rate, reduction in deepening cost of existing wells or cost of drilling new wells, and increased availability of irrigation water. In some cases, drip irrigation helps in increasing water level in the neighbouring wells or maintaining water level in wells. The adoption of drip irrigation also generates negative externalities such as reduction in human labour employment due to cropping pattern changes i.e. labour intensive annual cereals crop production to less labour intensive trees, and additional consumption expenditure incurred by the local villagers because of increased local price of cereals due to reduced local production. In order to quantify various positive and negative externalities caused by the drip irrigation technology, it is essential to enumerate and differentiate between the private and social cost and benefits. Since the social cost is the sum of private cost and external cost and the social benefit is the sum of private benefit and external benefit, it is crucial to workout these costs and benefits. The following conceptual framework is therefore developed for the study (Table.1).

97
Table.1. Cost and benefits associated with drip adoption
Cost Benefit Private External Private External
Capital cost (investment cost) Reduction in labour absorption per of traditionally irrigated crop replaced
by drip system
Value of labour saved Increased water availability for irrigation purposes
Maintenance cost Reduction in food security due to replacement of traditional cereals by
high valued vegetables, cash crops and fruits
Increase in value of outputs
Reduced power energy consumption in agriculture
Additional cost incurred towards purchase of cereals because of
drip adoption
Expansion in cropped area
Reduction in cost of well deepening
Reduction in well failure
Source : Suresh Kumar and Palanisami, 2011. The Social benefit –cost ratio with present worth was employed. Thus, the
t
T
0it
t
T
0it
)r1(
SC
)r1(
SB
SBCR
+
+=
∑
∑
=
=
Where SBCR : Social benefit cost ratio SBt : Social benefit which is defined as SBt = (α+β) in period ‘t’ SCt : Social cost which is defined as SCt = (µ+δ) in period ‘t’ t : Life time of the project period r : Social rate of discount The α is the annual returns from crop production due to adoption of drip irrigation in Rs/ha, and β is the annual economic value of all positive externalities generated by the drip irrigation in Rs./ha. The µ is the initial investment on drip equipments, annual operation and maintenance cost of the drip system and cost incurred towards crop production and δ is the annual economic value of all negative externalities induced by
98
drip irrigationi. It is assumed that the life period of drip set was considered as 10 years. The life of the drip system is critical in working out the amortized cost of capital. The life period obviously depends on the quality of the equipment, its usage and its maintenances. It is revealed from the discussion with the farmers and drip irrigation firms that the average life is 10 years if it is maintained properly. Two different discount rates were considered to understand the sensitivity of investment to the change in capital cost. They are assumed at 2 per cent and 5 per cent as alternatives representing different opportunity costs of capital. Social Cost and Benefits of Drip Irrigation Governments in both the developing and developed economies introduce various forms of policy interventions to promote economic growth and social equity, reduce poverty, promote environment protection and realize sustainable development of national and regional economy. To achieve these developmental objectives, various technologies are promoted by the state to enhance agricultural production, resource conservation etc. As part of the promotional activities, market based instruments such as taxes and subsidies are introduced and being implemented. As the State spends millions of rupees on subsidies in order to achieve increased agricultural production and water resource conservation, these technologies should be viable and should not only increase private profit but also to ensure social benefits. Thus the social cost and benefit analysis of drip adoption is considered increasingly important. The private cost includes the cost of investment on drip equipments, establishment of the garden, maintenance of drip system and expenses incurred towards the cultivation. The drip system is widely adopted in crops like grapes, banana and coconut. In over-exploited region, the private cost is worked out to Rs.76824.7/ha with subsidy and Rs.80766.3 under without subsidy as against Rs.50246.4 and Rs.54694.8 respectively in semi-critical region. Investment on drip irrigation system for grapes and banana is higher than the coconut and inclusion of grapes escalates the private cost (Table.2). The potential negative externalities will be: (i) reduced labour absorption in agriculture, mainly from replacement of labour-intensive crops by cash crops which depend on mechanized farming, and decline in wage rates due to the reduction in labour demand; and (ii) increase in food prices due to decline in cereals production in the area mainly due to replacement of traditional food crops by high valued cash crops.
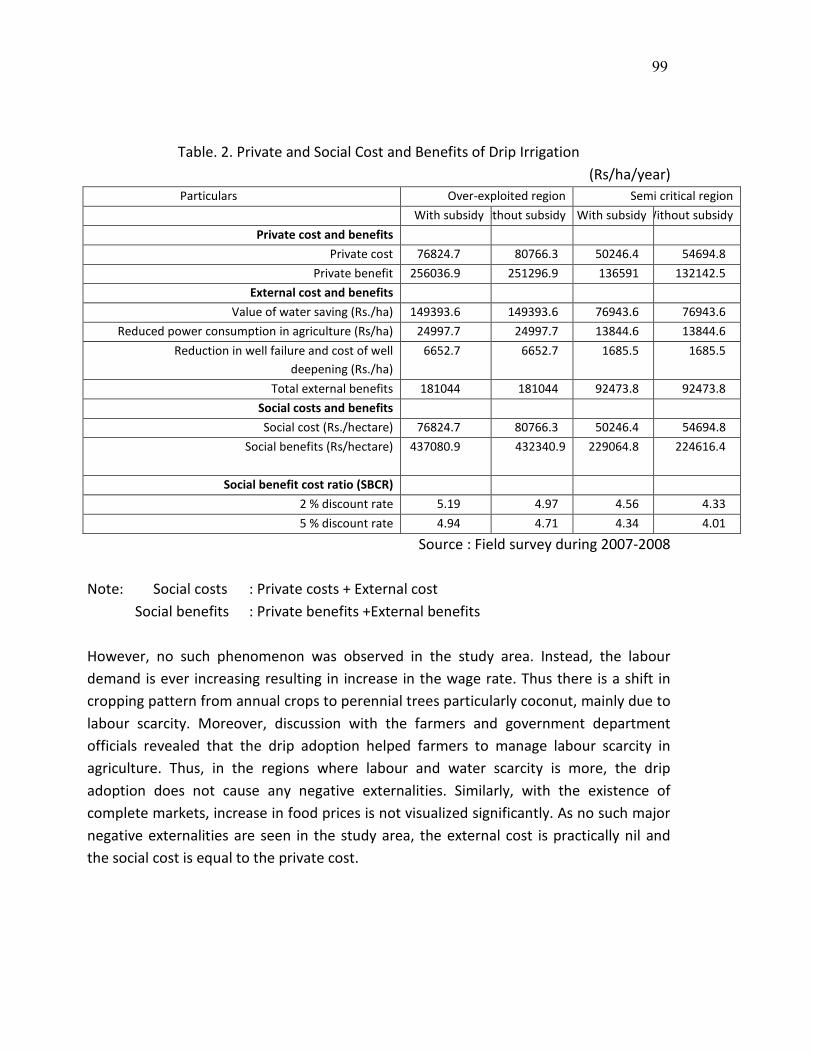
99
Table. 2. Private and Social Cost and Benefits of Drip Irrigation
(Rs/ha/year) Particulars Over-exploited region Semi critical region
With subsidy ithout subsidy With subsidy Without subsidy Private cost and benefits
Private cost 76824.7 80766.3 50246.4 54694.8 Private benefit 256036.9 251296.9 136591 132142.5
External cost and benefits Value of water saving (Rs./ha) 149393.6 149393.6 76943.6 76943.6
Reduced power consumption in agriculture (Rs/ha) 24997.7 24997.7 13844.6 13844.6 Reduction in well failure and cost of well
deepening (Rs./ha) 6652.7 6652.7 1685.5 1685.5
Total external benefits 181044 181044 92473.8 92473.8 Social costs and benefits Social cost (Rs./hectare) 76824.7 80766.3 50246.4 54694.8
Social benefits (Rs/hectare) 437080.9 432340.9
229064.8 224616.4
Social benefit cost ratio (SBCR) 2 % discount rate 5.19 4.97 4.56 4.33 5 % discount rate 4.94 4.71 4.34 4.01
Source : Field survey during 2007-2008 Note: Social costs : Private costs + External cost
Social benefits : Private benefits +External benefits However, no such phenomenon was observed in the study area. Instead, the labour demand is ever increasing resulting in increase in the wage rate. Thus there is a shift in cropping pattern from annual crops to perennial trees particularly coconut, mainly due to labour scarcity. Moreover, discussion with the farmers and government department officials revealed that the drip adoption helped farmers to manage labour scarcity in agriculture. Thus, in the regions where labour and water scarcity is more, the drip adoption does not cause any negative externalities. Similarly, with the existence of complete markets, increase in food prices is not visualized significantly. As no such major negative externalities are seen in the study area, the external cost is practically nil and the social cost is equal to the private cost.
100
In addition to the private benefit in the form of increased returns from crop cultivation, the drip adoption generates significant positive externalities. The positive externalities are in the form of water saving, reduced electricity power consumption, reduction in well failure and well deepening cost. Among the different positive externalities, the most significant external benefit in the region is real saving of irrigation water. This is in view of the scarcity value of the resource being acutely felt in the study area with growing competition from other non-agricultural sectors. The non-adoption of drip irrigation would have forced the farmers to over exploit the groundwater to sustain the income from crop production. Hence, it is imperative to know how much water could have been used up by the farmers to generate the return that occurs from the drip irrigated plots, had they used the conventional method of irrigation. In order to do so, the difference in water used by the farmers between the drip villages and control villages for different crops were found and then the value of saved water was determined. Had the farmers not used drip irrigation, they would have been forced to depend on bore wells for maintaining the current level of farm returns. Hence, the water saving can be treated as real. The value of water saving is worked out to Rs. 149393.6 /ha in over-exploited regions while it is Rs.76943.6/ha in semi-critical region. The drip adoption saves significant amount of electricity power energy in agriculture. Farmers need 30 hours of pumping to provide irrigation in one hectare of land under flood method. But, under drip method of irrigation, farmers usually irrigate 1-1.5 hours per time there by considerable energy saving is achieved. The saved energy was monetized taking into account of the economic cost of supply of electricity power. The external benefits due to drip adoption through energy saving is worked out to Rs. 24997.7/ha in over-exploited regions and Rs.13844.6 in semi-critical regions. Water scarcity coupled with low discharge rate led the farmers to run their electric motors for longer hours resulted in high energy consumption. Drip irrigation saves considerable amount of energy. Thus, drip irrigation produced significant external benefits in water scarce regions. To assess the impact of drip adoption on reduction in well failure and deepening cost, the difference in cost incurred towards well failure and well deepening cost between the drip and control villages was worked out and compared. It is evident that the reduction in well failure and well deepening cost is worked out to Rs. 6652.7/ha and Rs.1685.5 respectively
101
in over-exploited and semi-critical regions. The total external benefits due to adoption of drip irrigation is worked out to Rs. 181044/ha in over-exploited regions and Rs.92473.8/ha in semi-critical regions. The social cost in over-exploited region is worked out to Rs. 76824.7/ha with subsidy and it is Rs. 80766.3/ha without subsidy. Similarly, the social benefit is worked out to Rs. 437080.9/ha and Rs. 432340.9 respectively with and without subsidy scenarios. It is clear that the social benefit exceeds the social cost. Having no significant negative externalities noticed in regions characterized by water and labour scarcity, the wider adoption of drip irrigation generates considerable social benefits. Thus, one can conclude that the drip irrigation is financially and socially viable and more beneficial in regions where there is more water and labour scarcity. The social benefit cost ratio (SBCR) was worked out at two different discount rates viz., 2 and 5 per cent. The SBCR in over-exploited region is worked out to 5.19 and 4.94 with a discount rate of 2 and 5 per cent respectively when subsidy is included. The same is 4.97 and 4.71 under without subsidy situation. The SBCR is relatively high when the subsidy component also included. The analysis of social-cost benefit of drip irrigation revealed that the social benefits exceeded social cost. This clearly shows that wider adoption of drip irrigation produces sufficient social benefits and huge subsidization (65 per cent at present in Tamil Nadu) on drip irrigation is justified.

102
Annexure 5
Relationship between financial and economic analysis
There are two ways of assessing the desirability of undertaking a project financial economic analysis. The underlying tools used for carrying out financial and economic analysis are not different and both types of analyses are required for project screening and selection. However, there is a difference in approach since financial analysis deals with the cost and benefit flows from the point of view of a firm or individual as opposed to economic analysis which deals with the costs and benefits than financial analysis. The methods nevertheless differ in several important ways. An enterprise is interested in financial profit and the stability of the profit, while society or government is concerned with much wider objectives such as food self-sufficiency, rural employment, poverty alleviation, and resulting net benefits to society as whole. Therefore, the objectives of the two types of analysis are different. The two analysis also differ on account of the basis used for valuing inputs and outputs from a given project. The resulting costs and benefits are not necessarily the same under the two types of analysis. Financial analysis includes as costs all payments that reduce the monetary resources of the project, and considers as benefits (or revenues) all receipts that increase the project’s financial resources. Economic analysis treats as costs only those payments which reduce the nation’s real resources, and as benefits only those receipts which increase the nation’s real resources. Monetary resources are distinguished from real resources by the fact that there are certain payments (e.g. taxation) and receipts (e.g. unemployment benefits) which are in the nature of ‘transfers’ from one section to another section of the society. They do not in any way affect the total availability of real resources to the economy as a whole. Taxes and various forms of subsidies are examples of such transfer payments and receipts.. However, these payments and receipts from an integral part of financial analysis since they change the availability of monetary resources to the project under consideration. Thus, a company tax will decrease profits while an investment grant will augment the monetary resources of the enterprise. The financial and economic costs may also differ considerably, for example, in the values attached to imports into a country with an overvalued exchange rate; to the value placed

103
upon labour in conditions of underemployment; or to intangible such as pollution which may have no financial costs to the enterprise causing it but a high cost to society. The distinction between financial and economic pricing may be illustrated by the following examples (Table 1). Consider the price of petrol at Rs. 60 per litre which contains a large element of value added tax (20%). The price to be used for financial analysis will be Rs. 60 per litre, while for economic analysis it will be Rs. 48 i.e. net of tax Rs. 12. Similarly, subsidy elements in prices should be adjusted to reflect economic costs. For example, consider a market price for fertilizer of Rs. 15000 per ton used by a tea estate. Given a subsidy of 50%, the financial cost to the estate will be Rs.15000; the economic cost will be Rs.30,000. A third illustration is in respect of labour input. If the wages which have to be paid to the unskilled labour on an investment project are Rs. 100 per man-day, which is greater than their marginal opportunity cost, then financial analysis will use Rs. 100 per day, while economic analysis will discount it by a margin to bring it to its opportunity cost (FAO Manual, 1991). Table 1. The difference in pricing between financial and economic analysis
Items Financial analysis Economic analysis I. Subsidies Subsidized price or cost Exclude subsidies II. For taxes Tax-inclusive price or cost Exclude taxes
III. Opportunity cost -inputs/labour
-Capital
Local farm-gate price
Cost of borrowing or return which could be earned by investing capital elsewhere than
in the project
Opportunity costs
Opportunity cost of capital
Project generated output Local farm gate-price World market parity price/ border price

104
i The cropwise electricity consumption was computed as under: A one HP pump run for one hour consumes 0.746 kwh of power. Accordingly, kwh for each crop = [(HP of pump) X (0.746 kwh) X ( Number of hours of irrigation) X (No.of irrigation)] The economic value of energy is Rs.3. 5 /kwh which is the unit cost of supply of electricity in Rs/ kwh. The unit cost of supply of electricity represents the cost incurred by the utility to supply electricity to ultimate consumers. This include the cost of fuel, operation and maintenance expenditure, establishment and administration cost, interest payment liability, depreciation and the cost of power purchase (Government of India, 2002). Depleting groundwater table has serious concern on pumping hours. The groundwater resource degradation compelled the farmers to lift water from much deeper levels. Moreover, water scarcity further aggravates the problem of low discharge rate in the bore wells. These led to extended hours of pumping. On an average, under flood method of irrigation, the farmers in the water scarce region need 30 hours of pumping to provide irrigation in one hectare of land. The average discharge rate (The discharge rate of pumping was measured by volumetric basis. Time taken to fill up a fixed quantity of water was noted and then the discharge rate was calculated.) of pumping is varied from 1.6 to 2.0 litre / second. The drip method of irrigation requires considerably less hours to irrigate a hectare of land. Farmers usually irrigate 1.1 to 1.4 hours per irrigation under drip method of irrigation. On an average, farmers irrigate 1.3 hours for banana and coconut, 1.4 hours for grapes, 1.2 hours for maize and 1.1 hours for turmeric. As the time required for irrigating a piece of land is significantly low, the drip method of irrigation not only saves energy and water, but also saves considerable number of irrigation labour.