economic freedom of the arab world: 2017 annual report · economic freedom of the arab world 2017...
TRANSCRIPT

Economic Freedom of the Arab World
2017 Annual Report
Salem Ben Nasser Al Ismaily, Azzan Al-Busaidi, Miguel Cervantes & Fred McMahon
Friedrich Naumann Foundation for Freedom
International Research Foundation of Oman
Fraser Institute
2017
ii / Economic Freedom of the Arab World: 2017 Annual Report
Friedrich Naumann Foundation / International Research Foundation / Fraser Institute
Copyright ©2017 by the Fraser Institute. All rights reserved. No part of this book may be reproduced in any manner whatsoever without written permission except in the case of brief quotations embodied in critical articles and reviews.
The authors of this book have worked independently and opinions expressed by them are, therefore, their own, and do not necessarily reflect the position of the Fraser Institute, or the views of the supporters, the Board of Directors, or staff of the Fraser Institute. This publication in no way implies that the Fraser Institute, its supporters, directors, or staff are in favor of, or oppose the passage of, any bill; or that they support or oppose any particular political party or candidate.
The principal author of this publication, Salem Ben Nasser Al Ismaily, is professionally involved in the promotion of investment in Oman. Therefore, to avoid a conflict of interest, he excused himself from calculating the index though he undertook the bulk of the analysis.
Date of issue: 2017
Cover design by Marie-Pier Gagne
Cite this publication
Authors: Salem Ben Nasser Al Ismaily, Azzan Al-Busaidi, Miguel Cervantes, and Fred McMahon Title: Economic Freedom of the Arab World: 2017 Annual Report Publisher: Fraser Institute Date of publication: 2017 Digital copy: <https://www.fraserinstitute.org/studies/economic-freedom-of-the-arab-world-2017-annual-report>
Cataloguing Information
Ben Nasser Al Ismaily, Salem, 1958–Economic freedom of the Arab world: 2017 annual report / Salem Ben Nasser Al Ismaily, Azzan Al-Busaidi, Miguel Cervantes, and Fred McMahon
ISBN 978-0-88975-468-3 (2017 English edition) ISBN 978-0-88975-469-0 (2017 Arabic edition)
Economic Freedom of the Arab World: 2017 Annual Report / iii
Friedrich Naumann Foundation / International Research Foundation / Fraser Institute
Contents
About the Authors / iv
Acknowledgments / vi
About the Co-publishers / vii
Introduction / 1
Research on Economic Freedom / 10
Country Summaries / 13
The Index of Economic Freedom in the Arab World / 19
Country Data Tables / 23
Appendix: Explanatory Notes and Data Sources / 48
References / 58
iv / Economic Freedom of the Arab World: 2017 Annual Report
Friedrich Naumann Foundation / International Research Foundation / Fraser Institute
About the Authors
Salem Ben Nasser Al IsmailySalem Ben Nasser Al Ismaily, Ph.D., holds degrees in Telecommunications, Liberal Arts, Industrial Engineering, Business Administration, Management, Philosophy, and Economy from universities in the United Kingdom and the United States. Al Ismaily worked at the Public Establishment for Industrial Estates (PEIE) from 1984 to 1996 as the Managing Director. In 1996, he was appointed as a Deputy Chairman and Executive President of the Omani Centre for Investment Promotion and Export Development. In 2012, he was appointed as the Chairman of the Public Establishment for Investment Promotion and Export Development. He is the founder and chairman of International Research Foundation Oman, a member of the Fulbright Family for Global Peace USA, and a member of the Board of Directors of the Fraser Institute in Canada. Al Ismaily has published several papers on the subject of cross culture, manage-ment, and economy, and five books on corporate culture, religion, and history. Most recently, he published Economic Freedom and Social Economic Outcomes in the Arab World, for which he was awarded a Ph.D. from the University of Northumbria and Newcastle. He also serves as a board member of companies in the field of financial services and energy.
Salem Ben Nasser Al Ismaily is professionally involved in the promotion of investment in Oman. Therefore, to avoid a conflict of interest, he excused himself from calculating the index though he undertook the bulk of the analysis.
Azzan bin Qassim Al-BusaidiAzzan bin Qassim Al-Busaidi has worked as an economist at several depart-ments relevant to research, investments, and marketing in Oman. He is the CEO of the International Research Foundation in Oman, which is an independent, non-profit think tank, and Director General of Research & E-services for the Public Authority for Investment Promotion and Export Development. He holds a degree in Economics from Sultan Qaboos University in Oman and an M.B.A. from the University of Strathclyde in Scotland.
Economic Freedom of the Arab World: 2017 Annual Report / v
Friedrich Naumann Foundation / International Research Foundation / Fraser Institute
Miguel CervantesMiguel Angel Cervantes is an economist who undertakes international research for the Fraser Institute. He holds Bachelor’s and Master’s degrees in Economics from the University of Texas at El Paso and has lectured at Vanier College, HEC Montreal Business School, Neoma Business School, and EM Lyon Business School. He was the coordinator of the 2008/2009, 2009/2010, 2010/2011, 2011/2012, and 2013 editions of the Fraser Institute Annual Survey of Mining Companies; the 2009, 2010, 2011, 2102, and 2013 editions of the Fraser Institute Global Petroleum Survey; and of the 2010, 2011, 2012, 2013, 2014, 2015, and 2016 editions of Economic Freedom of the Arab World. He is currently a Ph.D. Candidate at Montpellier University and a lecturer at Audiencia Business School, Nantes; ESC Troyes; and EM Lyon Business School in France.
Fred McMahonFred McMahon holds the Dr. Michael A. Walker Research Chair in Economic Freedom at the Fraser Institute. He manages the Institute’s economic free-dom project, which publishes or co-publishes the annual reports, Economic Freedom of the World, Economic Freedom of North America, and this publication, Economic Freedom of the Arab World; and coordinates the Economic Freedom Network of independent think tanks in nearly 90 nations and territories. He has written several books, including Looking the Gift Horse in the Mouth: The Impact of Federal Transfers on Atlantic Canada, which won the Sir Antony Fisher International Memorial Award for public-policy books, Road to Growth: How Lagging Economies Become Prosperous (with a foreword by former Irish Prime Minister John Bruton), and Retreat from Growth: Atlantic Canada and the Negative Sum Economy (with a foreword by Nobel Laureate Robert Mundell).
vi / Economic Freedom of the Arab World: 2017 Annual Report
Friedrich Naumann Foundation / International Research Foundation / Fraser Institute
Acknowledgments
The authors would like to thank the Friedrich Naumann Foundation for Freedom for making this book possible. In particular, we thank René Klaff, Regional Director MENA, Amman, Jordan, for his support.
We also wish to acknowledge Michael Walker, Fraser Institute Senior Fellow, James Gwartney of Florida State University, and Robert Lawson of Southern Methodist University for their invaluable ideas and assistance when we initiated this project.
The opinions expressed in this report are those of the authors and do not necessarily reflect the position of the Fraser Institute, or the views of the support-ers, the Board of Directors, or staff of the Fraser Institute. This publication in no way implies that the Fraser Institute, its supporters, directors, or staff are in favor of, or oppose the passage of, any bill; or that they support or oppose any particular political party or candidate.

Economic Freedom of the Arab World: 2017 Annual Report / vii
Friedrich Naumann Foundation / International Research Foundation / Fraser Institute
About the Co-publishers
Friedrich Naumann Foundation for Freedom
The Friedrich Naumann Foundation for Freedom (FNF) is an independent, non-profit, non-governmental organization that is committed to promoting liberal values and policies. Founded in Germany in 1958, the Foundation has won a reputation for promoting freedom worldwide.
To create an open society, FNF is guided by the principles of Liberalism and its message of mutual tolerance and acceptance of diversity. Its core concepts such as the protection of human rights, the application of the rule of law, liberal democracy, and a free-market economy have proven throughout the centuries that Liberalism offers appropriate solutions for the present and the future in public and personal life. Our intensive work in civic education, political consul-tancy, training, and international dialogue is carried out in Germany and in over 70 countries worldwide.
website: <www.freiheit.org>
International Research Foundation
The International Research Foundation (IRF), Sultanate of Oman, was estab-lished in 2005 as a non-governmental, independent, non-profit “think tank” based in Oman to conduct research on domestic and international economic issues with emphasis on the Arab World. The IRF has set its research and public-affairs agenda on a collegial basis, relying on the input of its researcher staff, its editorial board, and its Senior Fellows. It maintains a working arrangement with governmental and non-governmental organizations in the region and other parts of the world. The IRF is the regional member of the Fraser Institute’s Economic Freedom Network.
The vision of IRF is to create wealth and jobs through promotion of eco-nomic freedom. Its mission is to measure, research, and communicate to a global audience the impact of competitive markets with free economic policies on the welfare of individuals.
The Board of Trustees of the IRF consists of high-profile private-sector members from different organizations. The IRF has initiated the establishment of a network of academic researchers to facilitate research projects, which will help in its endeavor to research economic issues affecting the daily life of individuals.
website: <www.omanirf.org>
viii / Economic Freedom of the Arab World: 2017 Annual Report
Friedrich Naumann Foundation / International Research Foundation / Fraser Institute
Fraser Institute
Our mission is to improve the quality of life for Canadians, their families and future generations by studying, measuring and broadly communicating the effects of gov-ernment policies, entrepreneurship, and choice on their well-being. Founded in 1974, we are an independent research and educational organization with locations throughout North America and international partners in over 90 countries. Our work is financed by tax-deductible contributions from thousands of individuals, organizations, and foundations. In order to protect its independence, the Institute does not accept grants from government or contracts for research.
website: <http://www.fraserinstitute.org> • e-mail: [email protected]

Economic Freedom of the Arab World: 2017 Annual Report / 1
Friedrich Naumann Foundation / International Research Foundation / Fraser Institute
Introduction
When old economic structures are preserved or only modestly adapted, it cannot be expected that different outcomes on growth and equality will result (Amin et al., 2012: 13).
The Arab world faces a huge challenge. Although the Arab Spring undoubtedly had a political impulse, in large measure it was driven by economic concerns: sky-high unemployment, particularly for youth; under-employment and lack of quality in the jobs that are available; elite control of the economy; economic exclusion; cronyism; and corruption (see, for example, Amin et al., 2012; Malik and Awadalla, 2011; and Sidahmed, 2014, Feb. 23). Sadly, although several nations have implemented limited political change, with Tunisia being the most successful, little if any economic reform has occurred and some nations have back-pedaled on economic policy, as the data in this report shows. The chronic economic problems that plagued the region remain in place. Even the Gulf States face immense challenges in providing quality employment in the face of popula-tion growth, the “youth bulge”, and declining oil and gas prices. As Amin and colleagues argue (2012), for the future to be better than the past, economic reform is essential. Successful political change hinges on economic success and economic freedom for all people. If people are excluded from opportunity and hope, stability and democracy are illusive.
Economic Freedom of the Arab World aims to provide a reliable and objec-tive metric of economic policy throughout the Arab World. It measures the extent to which citizens of the nations of the Arab League are able to make their own economic decisions without limitations imposed by the government or by crony elites. The report provides sound empirical measurement of economic policy that can distinguish between phony reform that leaves economic and political power in the hands of crony elites, and real reform that creates new prosperity, entrepreneurship, and jobs, by opening business and work opportu-nities for everyone no matter whom they know.
Arab and Islamic societies have a rich trading tradition, one that celebrates markets open even to the humblest members of society. Economic freedom is consistent with that proud history and provides a path to a more prosperous and freer tomorrow. Economic freedom is simply the ability of individuals and families to take charge of their fate and make their own economic decisions—to sell or buy in the marketplace without discrimination, to open or close a business, to work for whom they wish or hire whom they wish, to receive investment or invest in others.

2 / Economic Freedom of the Arab World: 2017 Annual Report
Friedrich Naumann Foundation / International Research Foundation / Fraser Institute
As discussed later in this report, economic freedom has a proven fact-based record of improving the lives of people, liberating them from dependence, and leading to other freedoms and democracy. Unfortunately, many in the Arab world believe their nations have already gone through a period of free-market reform and that it hasn’t worked. This misconception deprives many of an eco-nomic alternative and vision for the future.
In fact, reform was frequently phony. Economic “reform” before the Arab Spring was all too often crony capitalism dressed up in the language of free markets. In many nations, it simply replaced elite control of the economy through govern-ment with elite control through crony capitalism—handing off state assets, monop-olies, and other rent-seeking opportunities to friends, supporters, and relatives of the regime. Rather than releasing entrepreneurial drive, it protected privilege.
The data in this report show little progress in increasing economic free-dom during the supposed period of “neoliberal” reform. Instead, the old struc-tures largely remained in place and mostly still remain in place. It is our hope that the empirical measure of reform and economic policy in this report will help provide a path for reform and accountability, enabling people to determine whether progress in policy reform is real or illusionary.
Benefits of economic freedom
Since the publication of the first edition of the Economic Freedom of the World in 1996 and, more recently, national and regional indexes, there have been about 600 scholarly and policy articles that have used the economic freedom indexes to explore the relationship between economic freedom and other socioeconomic outcomes. Fact-based studies in top academic journals have shown that eco-nomic freedom promotes growth, job creation, prosperity, and other positive outcomes. The relationship of economic freedom to prosperity is unsurprising. Individuals and families are best able to look after themselves when free to do so, without external constraints. Their drive and ingenuity have simply proved to be more productive than government planning or restricted markets and monopolies under crony capitalism.
However, the importance of economic freedom goes beyond mere eco-nomics. Economic freedom has intrinsic value and is inextricably linked to all other freedoms. Individuals and families should have the inherent right to make their own economic decisions. When they do, economic freedom liberates them from government dependence and opens the door to other freedoms. Economic freedom is thus vital for those seeking these freedoms and democracy in a peace-ful, stable, and prosperous society, as evidence discussed later in this report shows. Economic freedom supports these goals directly and by boosting pros-perity. Prosperity, in turn, supports both democracy, stability, and the further growth of freedom.
Over time, economic freedom itself directly supports other freedoms, democracy, and stability by changing the way societies function. When govern-ments or crony capitalists control the ability of individuals to get a job, start a

Economic Freedom of the Arab World: 2017 Annual Report / 3
Friedrich Naumann Foundation / International Research Foundation / Fraser Institute
business, gain a promotion, feed, house, and clothe their families, and so on, then the government and its supporters have great tools to suppress freedom and democracy, until the anger grows too great, as it did in many parts of the Arab world. Economic freedom liberates people from dependence on govern-ment and the government’s cronies and allows them the freedom to decide on their own actions and views.
Economic freedom transforms the dynamics of any society that had lacked it. When people make their own economic choices, they gain only when they produce products or services desired in free exchange—in other words, by making people better off. Those in other groups become customers, suppliers, clients. Over time, this builds tolerance and a common sense of citizenship. When governments—or government friends under crony capitalism—control the economy, the economy grows slowly or not at all. Individuals and groups battle each other for wealth and privilege. People gain by cultivating connections, suppressing the opportunities of others, and making them worse off. All too often, the individual gains not as an individual but as a member of rent-seeking group, whether economic, ethnic, or religious. Groups stand against groups, as is all too evident in much of the world.
With economic freedom, the biggest gains are achieved by people who increase the size of the economic pie for everyone; without economic freedom, the biggest gains are by those who cut a bigger slice of the pie for themselves to the disadvantage of others. This is a key reason that economic freedom has been shown to promote democracy, stability, and other freedoms, as discussed later in the report.
True economic freedom also combats corruption. When people are eco-nomically free, they may do what they like economically. Although some regula-tions are necessary, many things become possible without asking government permission, so there is no one capable of demanding a bribe. Also, as size of government decreases, government has fewer favors to hand out, so no one can demand a payment for a favor that government can’t grant in the first place.
Economic freedom would also have a highly important benefit for the Arab world. A key driver of dissatisfaction in the region is the high unemploy-ment rate among young people. Youth unemployment in the region averages nearly 30% (World Bank, 2014). Economic freedom has been shown to create jobs and reduce unemployment, particularly among young people (Feldmann, 2010), and hence could play an important role in increasing stability and thus the region’s attractiveness to investors, leading to even more job creation.
Illustrative figures
Quartile charts, like the following, can help illustrate important findings. To provide a global view, the figures are based on the 159 jurisdictions included in the index published in Economic Freedom of the World: 2017 Annual Report. (Much of this section comes directly from Gwartney, Lawson and Hall, 2017, and other economic freedom documents.) The jurisdictions are broken down into four quartiles based on their level of economic freedom.
4 / Economic Freedom of the Arab World: 2017 Annual Report
Friedrich Naumann Foundation / International Research Foundation / Fraser Institute
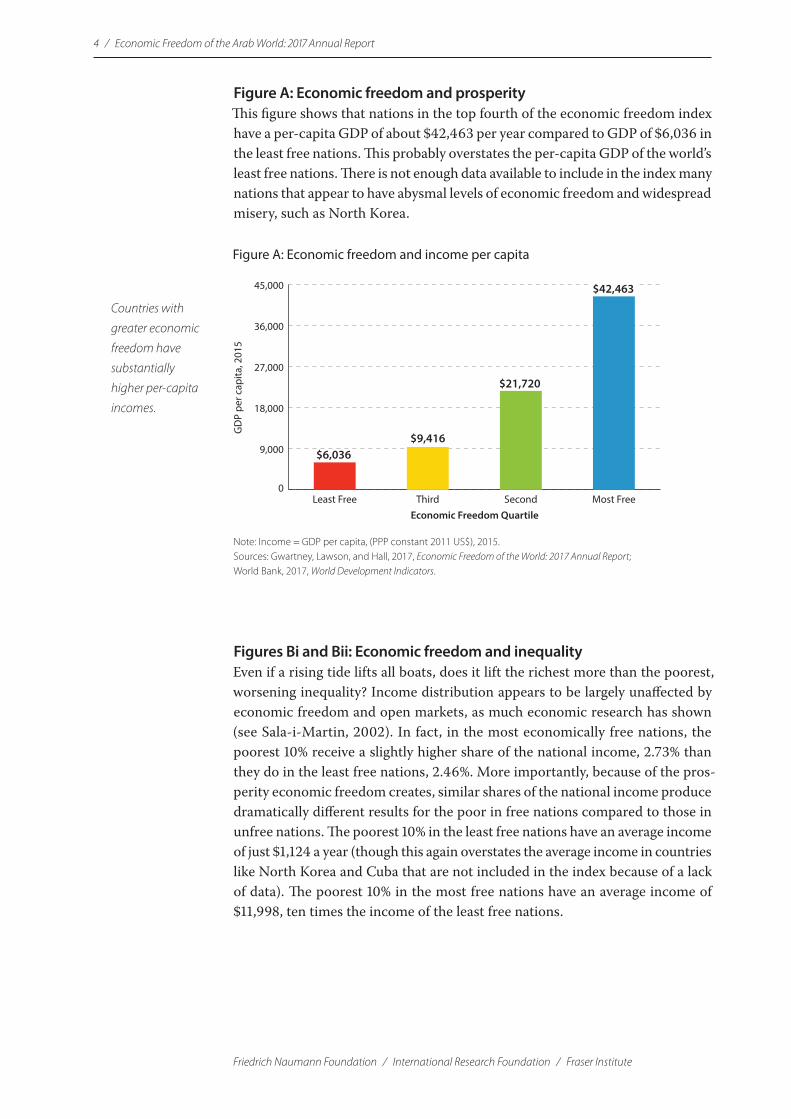
Figure A: Economic freedom and prosperityThis figure shows that nations in the top fourth of the economic freedom index have a per-capita GDP of about $42,463 per year compared to GDP of $6,036 in the least free nations. This probably overstates the per-capita GDP of the world’s least free nations. There is not enough data available to include in the index many nations that appear to have abysmal levels of economic freedom and widespread misery, such as North Korea.
Figures Bi and Bii: Economic freedom and inequalityEven if a rising tide lifts all boats, does it lift the richest more than the poorest, worsening inequality? Income distribution appears to be largely unaffected by economic freedom and open markets, as much economic research has shown (see Sala-i-Martin, 2002). In fact, in the most economically free nations, the poorest 10% receive a slightly higher share of the national income, 2.73% than they do in the least free nations, 2.46%. More importantly, because of the pros-perity economic freedom creates, similar shares of the national income produce dramatically different results for the poor in free nations compared to those in unfree nations. The poorest 10% in the least free nations have an average income of just $1,124 a year (though this again overstates the average income in countries like North Korea and Cuba that are not included in the index because of a lack of data). The poorest 10% in the most free nations have an average income of $11,998, ten times the income of the least free nations.
Figure A: Economic freedom and income per capita
0
9,000
18,000
27,000
36,000
45,000
Most FreeSecondThirdLeast Free
Countries with
greater economic
freedom have
substantially
higher per-capita
incomes.
Note: Income = GDP per capita, (PPP constant 2011 US$), 2015.Sources: Gwartney, Lawson, and Hall, 2017, Economic Freedom of the World: 2017 Annual Report; World Bank, 2017, World Development Indicators.
$6,036$9,416
$21,720
GD
P pe
r cap
ita, 2
015
Economic Freedom Quartile
$42,463

Economic Freedom of the Arab World: 2017 Annual Report / 5
Friedrich Naumann Foundation / International Research Foundation / Fraser Institute
Figure C: Economic freedom and povertyAs figure Bii suggests, economic freedom dramatically reduces poverty. In the least free nations, 30% of the population suffers extreme poverty (defined as US$1.90 a day) and nearly 50% suffers moderate poverty (US$3.10 a day). In the freest nations, under 1.0% of the population suffers $1.90-a-day poverty and only 2.26% suffer $3.10-a-day poverty.
Figure Bi: Economic Freedom and the Income Share of the Poorest 10%
0.0
0.5
1.0
1.5
2.0
2.5
3.0
Most FreeSecondThirdLeast Free
The share of
income earned by
the poorest 10%
of the population
is unrelated to
economic freedom.
Sources: Gwartney, Lawson, and Hall, 2017, Economic Freedom of the World: 2017 Annual Report; World Bank, 2017, World Development Indicators.
2.46%2.25% 2.15%
Inco
me
Shar
e (B
otto
m 1
0%),
2000
–201
5
Economic Freedom Quartile
2.73%
Figure Bii: Economic Freedom and the Income Earned by the Poorest 10%
0
2,000
4,000
6,000
8,000
10,000
12,000
Most FreeSecondThirdLeast Free
The amount of income, as opposed to the share, earned by the poorest 10% of the population is much higher in countries with higher economic freedom.
Note: Annual income per capita of poorest 10% (PPP constant 2011 US$), 2015.Sources: Gwartney, Lawson, and Hall, 2017, Economic Freedom of the World: 2017 Annual Report; World Bank, 2017, World Development Indicators.
$1,124$2,153
$4,593
Annu
al in
com
e pe
r cap
ita o
f poo
rest
10%
, 201
5
Economic Freedom Quartile
$11,998

6 / Economic Freedom of the Arab World: 2017 Annual Report
Friedrich Naumann Foundation / International Research Foundation / Fraser Institute
Figure D: Economic freedom and other freedomsWhen a government has the power to determine individuals’ ability to feed, clothe, house, and educate their families; to hold a job and get a promotion; and to restrict their ability to move ahead in other ways, government has all the tools it needs to suppress other freedoms, at least until life becomes unbearable and recourse is made to violence. When economic freedom is lacking, individuals and families must depend on the kindness of government to get ahead. Economic freedom gives people economic independence and lessens dependence on gov-ernment, opening the way for the growth of other freedoms. Empirical stud-ies support the connection between economic freedom, other freedoms and democracy (Griswold, 2004; Dawson, 1998). The data used for this figure are from Freedom House, which measures freedom on a 1-to-7 scale, with 1 being the greatest amount of freedom and 7, the least.
Figure E: Economic freedom and happinessOpponents of economic freedom have argued that the prosperity economic freedom creates is not a good measure of human well-being; that instead, we should be concerned about human happiness and that, they claim, is highest in socialist nations. This argument is typically made without any proof. Instead, a considerable body of research now shows that economic freedom “causes” hap-piness (or life satisfaction). Figure D shows happiness measured on the United Nations Happiness Index on a 0 to 10 scale. As it turns out, people like to be in control of their own lives (see Pitlik, Redín, and Rode, 2015).
Figure C: Economic Freedom and Extreme and Moderate Poverty Rates
0
10
20
30
40
50
Most FreeSecondThirdLeast Free
Extreme and
moderate poverty
are lower in countries
with more economic
freedom.
Note: The extreme poverty rate is the percentage of a country’s population that lives on $1.90 per day; the moderate poverty rate is the percentage that lives $3.10 per day, in 2011 constant PPP-adjusted dollars.Sources: Gwartney, Lawson, and Hall, 2017, Economic Freedom of the World: 2017 Annual Report; World Bank, 2017, World Development Indicators; for details, see Connors, 2011.
Pove
rty
rate
(%)
Economic Freedom Quartile
30.34%
48.90%
12.93%
26.26%
5.87%
14.04%
0.98% 2.26%
extreme moderate extreme moderate extreme moderate extreme moderate

Economic Freedom of the Arab World: 2017 Annual Report / 7
Friedrich Naumann Foundation / International Research Foundation / Fraser Institute
Figure D: Economic Freedom and Political Rights and Civil Liberties
1
2
3
4
5
6
7
Most FreeSecondThirdLeast Free
Greater economic
freedom is associated
with more political
rights and civil liberties.
Note: Political rights and civil liberties are measured on a scale from 1 to 7: 1 = the highest degree of political rights and civil liberties; 7 = the lowest.Sources: Gwartney, Lawson, and Hall, 2017, Economic Freedom of the World: 2017 Annual Report; Freedom House, 2017, Freedom in the World 2017.
Polit
ical
Rig
hts
and
Civi
l Lib
ertie
s, 20
15
Economic Freedom Quartile
4.5 4.4
3.1 3.3
2.4 2.5
1.7 1.61
2
3
4
5
6
7political civil political civil political civil political civil
Figure E: Economic Freedom and the UN World Happiness Index
0
2
4
6
8
10
Most FreeSecondThirdLeast Free
People in countries
with greater
economic freedom
tend to be happier
about their lives.
Note: “The rankings are based on answers to the main life evaluation question … This is called the Cantril ladder: it asks respondents to think of a ladder, with the best possible life for them being a 10, and the worst possible life being a 0. They are then asked to rate their own current lives on that 0 to 10 scale”. Data are for 2015.Sources: Gwartney, Lawson, and Hall, 2017, Economic Freedom of the World: 2017 Annual Report; United Nations, 2016, World Happiness Report 2016 Update.
4.61 4.935.72
UN
Wor
ld H
appi
ness
Inde
x
Economic Freedom Quartile
6.70
8 / Economic Freedom of the Arab World: 2017 Annual Report
Friedrich Naumann Foundation / International Research Foundation / Fraser Institute
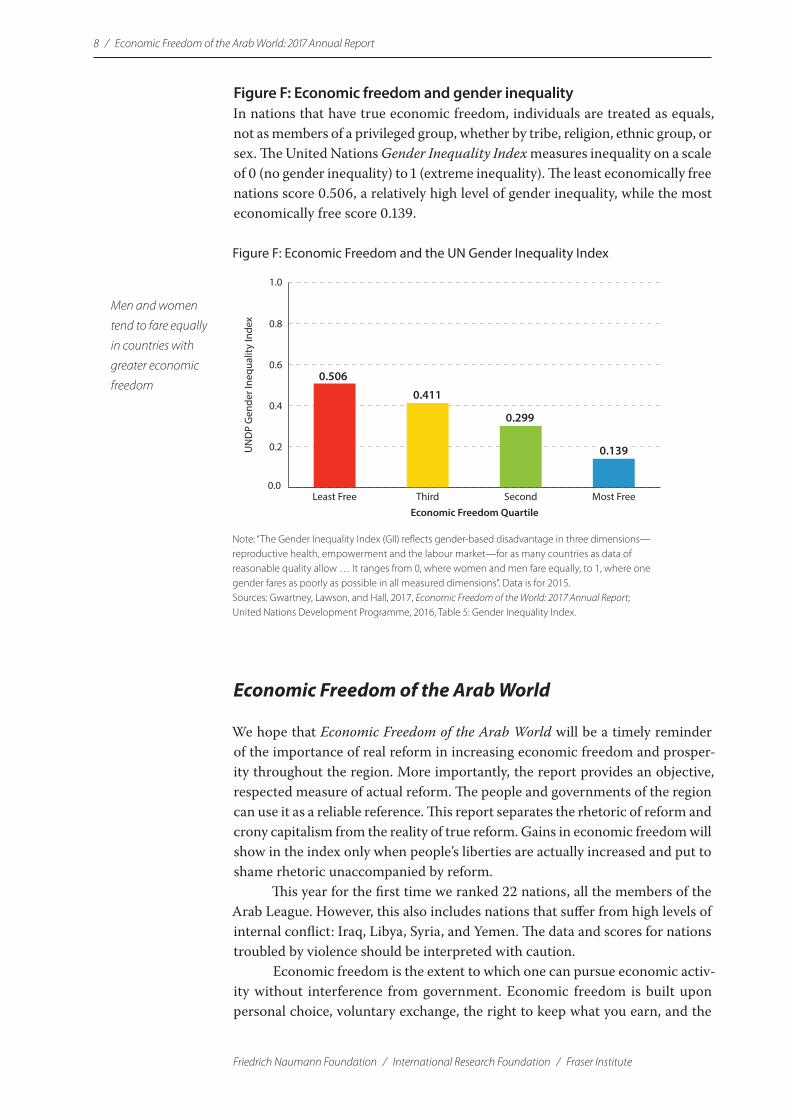
Figure F: Economic freedom and gender inequalityIn nations that have true economic freedom, individuals are treated as equals, not as members of a privileged group, whether by tribe, religion, ethnic group, or sex. The United Nations Gender Inequality Index measures inequality on a scale of 0 (no gender inequality) to 1 (extreme inequality). The least economically free nations score 0.506, a relatively high level of gender inequality, while the most economically free score 0.139.
Economic Freedom of the Arab World
We hope that Economic Freedom of the Arab World will be a timely reminder of the importance of real reform in increasing economic freedom and prosper-ity throughout the region. More importantly, the report provides an objective, respected measure of actual reform. The people and governments of the region can use it as a reliable reference. This report separates the rhetoric of reform and crony capitalism from the reality of true reform. Gains in economic freedom will show in the index only when people’s liberties are actually increased and put to shame rhetoric unaccompanied by reform.
This year for the first time we ranked 22 nations, all the members of the Arab League. However, this also includes nations that suffer from high levels of internal conflict: Iraq, Libya, Syria, and Yemen. The data and scores for nations troubled by violence should be interpreted with caution.
Economic freedom is the extent to which one can pursue economic activ-ity without interference from government. Economic freedom is built upon personal choice, voluntary exchange, the right to keep what you earn, and the
Figure F: Economic Freedom and the UN Gender Inequality Index
0.0
0.2
0.4
0.6
0.8
1.0
Most FreeSecondThirdLeast Free
Men and women
tend to fare equally
in countries with
greater economic
freedom
Note: “The Gender Inequality Index (GII) re�ects gender-based disadvantage in three dimensions—reproductive health, empowerment and the labour market—for as many countries as data of reasonable quality allow … It ranges from 0, where women and men fare equally, to 1, where one gender fares as poorly as possible in all measured dimensions”. Data is for 2015.Sources: Gwartney, Lawson, and Hall, 2017, Economic Freedom of the World: 2017 Annual Report; United Nations Development Programme, 2016, Table 5: Gender Inequality Index.
0.506
0.411
0.299
UN
DP
Gen
der I
nequ
ality
Inde
x
Economic Freedom Quartile
0.139
Economic Freedom of the Arab World: 2017 Annual Report / 9
Friedrich Naumann Foundation / International Research Foundation / Fraser Institute
security of one’s property rights. The mechanics of economic freedom are easy to understand. Any transaction freely entered into must benefit both parties. Any transaction that does not benefit both parties would be rejected by the party that would come up short. This has consequences throughout the economy. Consumers who are free to choose will only be attracted by superior quality and price. A producer must constantly improve the price and quality of existing products or invent new products. Without this, customers will not freely enter into transactions with the producer. Many billions of mutually beneficial transac-tions occur every day, powering the dynamic that spurs increased productivity and prosperity throughout the economy.
This is our thirteenth report on economic freedom in the Arab world. The first was published in the Arab World Competitiveness Report 2005 (Lopez-Claros and Schwab, 2005). The second and subsequent editions were published by the International Research Foundation (IRF) of Oman and the Fraser Institute. In 2008, the MENA Regional Office (formerly based in Cairo, now in Amman) of the Friedrich Naumann Foundation for Freedom also became a co-publisher. Economic Freedom of the Arab World has gathered more attention every year since it was first published. Its importance comes from being a tool to measure how economically free Arab countries are.
The index in this edition adds data for 2015, the most recent year for which full data are available. Looking forward, we also present some early data for 2016 in both the country tables and the country summaries. As well, the scores for previous years have been re-calculated using revised data from the World Bank for its Doing Business and World Development Indicators databases. Economic Freedom of the Arab World is modeled on the annual reports in the series, Economic Freedom of the World (see Gwartney, Lawson, and Hall, 2017).
These results are important to investors and enterprises working, or even considering working, in this region. Development of investor-friendly climates in the Arab world could be structured around the areas this report examines, as best practices in the world of doing business.
Overview of scores and ranking
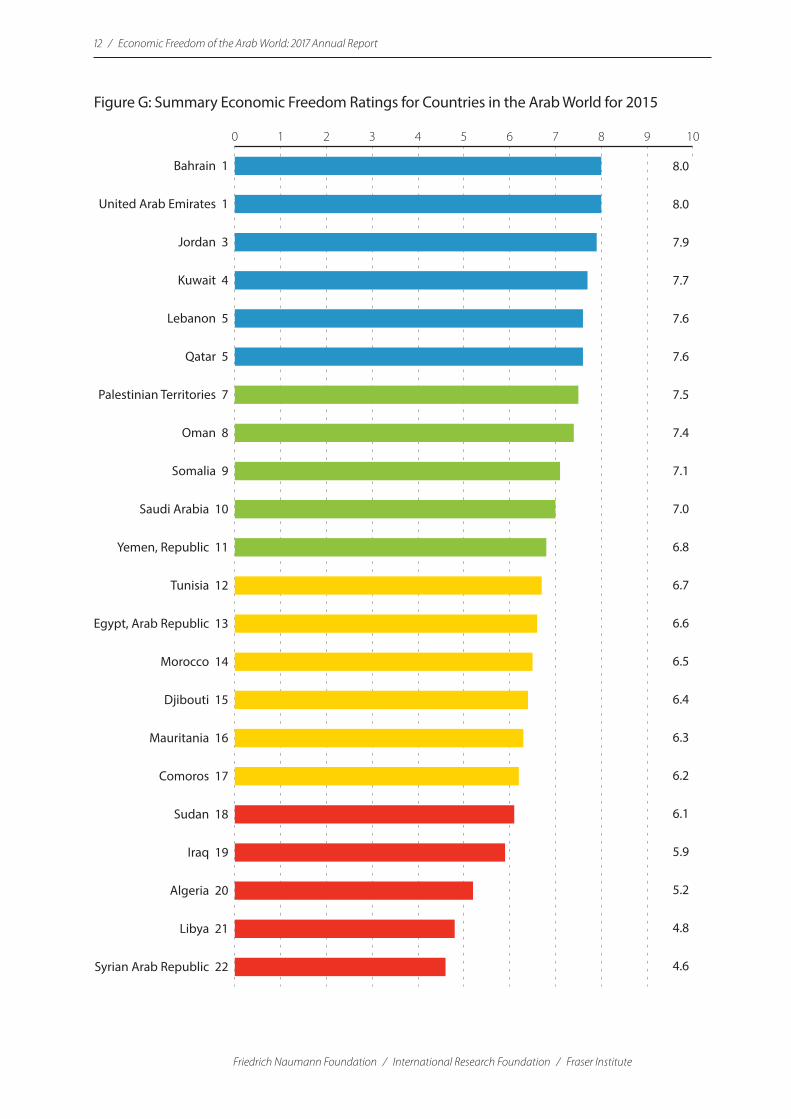
The United Arab Emirates and Bahrain tied for top spot, each with a score of 8.0 out of 10. The Hashemite Kingdom of Jordan came in third with a score of 7.9. The bottom three nations are the Syrian Arab Republic, the least economically free nation in the Arab world with a score of 4.6, just behind Libya with a score of 4.8, and Algeria, 5.2.
Over the past few years, the average score of Arab nations has exhibited a slight but noticeable decline, from 7.0 in 2012 to 6.7 in 2015, the most recently available data. Since Somalia’s score was not available in previous years, it was not used to calculate the average for 2015.

10 / Economic Freedom of the Arab World: 2017 Annual Report
Friedrich Naumann Foundation / International Research Foundation / Fraser Institute
Research on Economic Freedom
Increases in economic freedom that are, in effect, a return to the classical Arab model of free trade and open markets would help meet the region’s challenges and generate the economic dynamism needed to create the jobs and prosperity that the region requires for a successful future. The era of government-directed economies, import substitution, and other uses of government power to direct the economy did not produce prosperity. The rise of crony capitalism in many nations only looted the state, created divisions in society, and left most people as badly off as before or worse than ever.
Economic freedom is distinct from both crony socialism and crony capi-talism. Its markets are open to all, not just the rich and powerful. Jobs and con-tracts go to those with the best abilities, not just the connected. Entrepreneurs are free to start their own businesses without facing unnecessary hurdles and corruption. An impartial rule of law and simple regulations that allow business activity to flourish and create jobs and prosperity are vital to economic freedom.A large body of empirical research has found that economic freedom is key to increasing prosperity, particularly among the emerging nations. Fact-based studies in top academic journals have shown that economic freedom promotes growth, prosperity, and other positive outcomes.
Intuitively, one would expect that economic freedom would have a posi-tive impact on economic growth because economic freedom creates a climate that allows individuals and businesses to allocate their resources to the highest end use. However, the question is ultimately an empirical one. One of the first studies, Easton and Walker (1997) found that changes in economic freedom have a significant impact on the steady-state level of income even after the level of technology, the level of education of the work-force, and the level of investment are taken into account. De Haan and Sturm (2000) show empirically that posi-tive (negative) changes in economic freedom lead to positive (negative) changes in economic growth rates. Using the economic freedom index published in Gwartney, Lawson, and Block (1996) and per-capita GDP data for 80 countries, their results indicate that, after educational level, investment, and population growth have been taken into account, changes in economic freedom have a significant impact on economic growth.
Gwartney and Lawson (2004) examined the impact of economic freedom on economic growth but with a specific focus on investment and productivity. They found that economic freedom strongly promotes investment. Nations with a score below 5 for economic freedom (on a scale from zero to 10, where a higher
Economic Freedom of the Arab World: 2017 Annual Report / 11
Friedrich Naumann Foundation / International Research Foundation / Fraser Institute
value indicates a higher level of economic freedom) attracted US$845 in invest-ment per worker over the period from 1980 to 2000 and only US$68 per worker in foreign direct investment. Nations with an economic freedom score above 7 attracted US$10,871 in investment per worker, including US$3,117 of foreign direct investment. Moreover, investment is more productive in economically free nations. Holding constant factors thought to affect growth and productivity, such as initial per-capita GDP, tropical location, coastal location, change in human investment, and public investment, Gwartney and Lawson found that an increase of one percentage point in the ratio of private investment to GDP leads to increases in the growth rate of per-capita GDP by 0.33 percentage point in an economically free country. The same increase in private investment in a less economically free country increases the growth rate of per-capita GDP by 0.19 percentage point. In other words, investment in economically free nations (with a score above 7) had a positive impact on growth that was 70% greater than investment in nations with poor levels of economic freedom (score below 5). Using the same regression model, Gwartney and Lawson also calculated the impact of economic freedom on overall growth through both direct and indirect effects. They found that, if a nation increased its economic freedom by one unit (on a scale from zero to 10) in the 1980s, it would have seen increased growth of 1.9 percentage points a year over the period from 1980 to 2000. Because of the high rates of growth associated with economic freedom, they also found that over the long term economic freedom explains over two thirds of the cross-country variation in GDP.
Increases in economic freedom also reduce poverty (Norton and Gwartney, 2008). Specifically, the weighted $1-per-day poverty rate was 29.7% in 2004 for countries with EFW ratings of less than 5 but only 7.7% for countries with EFW ratings between 6 and 7; the $2-per-day poverty rate declines from 51.5% to 46.2% to 38.9% as one moves from the least-free to the most-free economies. Moreover, a one-unit increase in the EFW rating between 1980 and 1995 was associated with a 5.21 percentage-point reduction in the $1-per-day poverty rate and a 5.22 percentage-point reduction in the $2-per-day poverty rate. Norton and Gwartney also examined the relationship between economic freedom and other measures of well-being. In the most unfree economies, only 72.6% of the population has access to safe water compared to nearly 100% in the most free economies. Life expectancy of people in the mostly free group is over 20 years greater than it is for those in mostly unfree economies. Mostly free economies have more than twice as many physicians per 1,000 population than mostly unfree economies. For every 1,000 births, 64 more babies survive in mostly free economies per year than in the mostly unfree countries. For every thousand children under age of five, 109 more children survive in mostly free countries each year than in those countries that are mostly unfree.
A study from the Fraser Institute by Indra de Soysa and Krishna Chaitanya Vadlamannati (2014) shows that economic freedom reduces conflict by creating more profitable alternatives. In nations that are not economically free, the most profitable venture may be looting through violent strife. With economic freedom, individuals have the opportunity to look after themselves and their families in the regular economy.
12 / Economic Freedom of the Arab World: 2017 Annual Report
Friedrich Naumann Foundation / International Research Foundation / Fraser Institute
Figure G: Summary Economic Freedom Ratings for Countries in the Arab World for 2015
0 1 2 3 4 5 6 7 8 9 10
Syrian Arab Republic 22
Libya 21
Algeria 20
Iraq 19
Sudan 18
Comoros 17
Mauritania 16
Djibouti 15
Morocco 14
Egypt, Arab Republic 13
Tunisia 12
Yemen, Republic 11
Saudi Arabia 10
Somalia 9
Oman 8
Palestinian Territories 7
Qatar 5
Lebanon 5
Kuwait 4
Jordan 3
United Arab Emirates 1
Bahrain 1 8.0
8.0
7.9
7.7
7.6
7.6
7.5
7.4
7.1
7.0
6.8
6.7
6.6
6.5
6.4
6.3
6.2
6.1
5.9
5.2
4.8
4.6

Economic Freedom of the Arab World: 2017 Annual Report / 13
Friedrich Naumann Foundation / International Research Foundation / Fraser Institute
Country Summaries
In this section, we look at the country scores this year compared with previ-ous years and examine the available data to get an indication of future scores. Countries are listed according to the level of economic freedom from the most free down to the least free. This year we were able to rank all 22 nations of the Arab League, including Somalia, the only league nation not ranked in last year’s report.
This index measures obstacles to economic freedom imposed on countries by their governments and elites. It does not measure the impact of external and internal violence. It may well be, for example, that many, with a choice between two nations, would choose the more peaceful rather than the more free because of the violence and consequent threats to persons and property in the latter.
1 The United Arab EmiratesThe United Arab Emirates (UAE) ties with Bahrain for first in this year’s report with a score of 8.0. Its score for size of government is down 0.1 point to 6.9 with a rank of 7th. Its score in this area has declined dramatically over the last decade, falling from 8.6 in 2007. Its score rose for legal structure and security of property rights from 8.2 to 8.3; the UAE remained in 1st place for this area. Its score for sound money fell from 9.5 to 9.4, dropping the UAE from 8th to 9th in the ranking. The UAE came in 4th place in freedom to trade, down from 2nd, with an unchanged score of 8.2. For regulation of business, labor, and credit, the UAE scored 7.1, the same as the last year. but rose to 5th from 7th in the rankings.
looking forward — initial data suggest little change going forward.
1 BahrainBahrain tied for first in this year’s report, up from 2nd last year. Its score remained 8.0. Its score for the size of government rose to 6.8 from 6.7 but it remained in 8th place. Its rank for legal structure and security of property was 8th, up from 9th last year, and its score stayed at 7.0. Bahrain was in 2nd in access to sound money, and its score rose from 9.6 to 9.7. In the area of freedom to trade internation-ally, its score remained 8.3 and it ranked 2nd. Finally, in the regulation of labor, credit and business area, Bahrain’s score remained 8.3, and it still ranked 1st.
looking forward — initial data suggest little change going forward.
14 / Economic Freedom of the Arab World: 2017 Annual Report
Friedrich Naumann Foundation / International Research Foundation / Fraser Institute
3 JordanJordan ranks 3rd this year with a score of 7.9, down from 8.1. For the size of govern-ment area, Jordan drops to 4th place from 3rd, and its score fell from 8.4 to 8.0. Its rank for legal structure and security of property rights stayed at 8th but its score fell to 7.0 from 7.1. In terms of access to sound money, Jordan still ranks 2nd, with a score of 9.7. Its score for freedom to trade internationally fell to 7.7 from 8.0 and its rank fell from 6th to 7th. Finally, its score in the business, labor, and credit regulation area dropped by 0.2 points to 7.2 but its rank moved up to 4th from 5th.
looking forward — initial data suggest little change going forward.
4 KuwaitKuwait retained its position in 4th place, but its score fell from 7.9 to 7.7. Its rank in the size of government area remained 11th, and its score remained 6.4. It ranked 4th, the same as last year, in legal structure and security of property rights, although its score fell to 7.6 from 8.0. Kuwait’s score in the area of access to sound money remained at 9.6, but its rank improved from 6th to 3rd. Kuwait’s rank in freedom to trade internationally was 9th, down from 7th, and its score fell to 7.3 from 7.8. For the regulation of business, credit and labor area, its score fell to 7.5 from 7.6, but it ranked 3rd, up from 4th.
qlooking forward — initial data suggest some deterioration in economic freedom.
5 LebanonLebanon came in tied for 5th place in this year’s report, same as last year. Its score was 7.6, down from 7.7. Its score in size of government rose to 8.6 from 8.4, for a rank of 2nd. Its score for legal structure and security of property rights remained 6.0, for a rank of 10th, same as last year. In access to sound money, Lebanon’s score fell from 9.6 to 9.3 and its rank fell to 11th place from 3rd. Lebanon’s score in the freedom to trade internationally area remained 6.5, as did its rank at 14th. For regulation of business, credit and labor, Lebanon had a score of 7.9 down from 8.2, with a rank of 2nd, the same as last year.
looking forward — initial data suggest little change going forward.
5 QatarQatar tied for 5th place up from 7th, though its score remained 7.6 points. Its score for the size of government area remained unchanged at 6.4, with a rank of 11th. Its score for legal structure remained unchanged at 7.5, with a rank of 6th, the same as last year. In the access to sound money area, its score was 9.7, up from 9.3 and it leapt from 11th to 2nd place in the rankings. The score in the freedom to trade internationally area was unchanged at 7.7 and its rank increased to 7th from 8th. Qatar’s score in regulation of business, credit and labor fell to 6.9 from 7.1 and it came in 9th, down one from last year.
qlooking forward — initial data suggest some deterioration in economic freedom.
Economic Freedom of the Arab World: 2017 Annual Report / 15
Friedrich Naumann Foundation / International Research Foundation / Fraser Institute
7 Palestinian TerritoriesThe Palestinian Territories’ overall score remained 7.5 but it rose from 8th to 7th place. The Palestinian Territories’ rank rose to 4th from 5th but its score fell to 8.0 from 8.2 in the size of government area. The territories’ score in rule of law remained 5.8, coming in 12th, up from 13th last year. The Palestinian Territories had a score of 9.8 in sound money, up from 9.6, and ranked 1st, up from 3rd. In the area of freedom to trade internationally, the Palestinian Territories scored 8.0, up from 7.7, with a rank of 5th up from 8th. Its ranking in regulation fell to 14th, down from 13th, though its score moved to 6.2, up from 6.1.
qlooking forward — initial data suggest some deterioration in economic freedom.
8 OmanOman came in 8th place this year, down from 5th; its score fell to 7.4 from 7.7. The size of government is the area that most negatively affects the overall score of Oman: its score remained at 4.5, for a rank of 18th, down one from last year. On the other hand, Oman does well in legal structure and security of property rights. Its score remained 8.1 points, and its rank went down one spot to 3rd. In access to sound money, Oman’s score remained 9.5 and its rank remained 8th. Oman’s score fell 0.4 in the freedom to trade internationally area to 7.8 points, and its rank fell from 4th last year to 6th. For regulation of business, credit and labor, Oman fell substantially to 7.1, down from 8.1; its rank dropped to 5th from 3rd.
plooking forward — initial data suggest future improvement.
9 SomaliaSomalia enters the ranking at 9th place with a score of 7.1. Its score in size of gov-ernment is 8.5, with a rank of 3rd. It ranks 21st in rule of law with a score of 4.2. Somalia is 15th in sound money with a score of 7.4. In freedom to trade, its score is 9.7, putting it in 1st place. In regulation, its score was 5.8, leaving it in 19th place.
looking forward — initial data suggest little change going forward, although ongo-ing conflict remains a danger to economic freedom.
10 Saudi ArabiaSaudi Arabia’s rank, 10th, was unchanged from last year and its score also remained the same at 7.0. In the size of government area, Saudi Arabia main-tained its score of 4.0, and its rank remained 20th. Saudi Arabia’s score was 8.2, up 0.1 points, in legal system and property rights, and the country remained 2nd in the ranking. For access to sound money, Saudi Arabia scored 9.4, the same as last year; its rank was 9th, up from 10th. Its score in freedom to trade fell from 6.7 to 6.6 points, and its rank fell to 13th from 11th. Finally, its score for the area of regulation of business, credit and labor fell to 6.8 from 6.9, though its rank remained 10th.
qlooking forward — initial data suggest some deterioration in economic freedom.
16 / Economic Freedom of the Arab World: 2017 Annual Report
Friedrich Naumann Foundation / International Research Foundation / Fraser Institute
11 YemenFor this year’s report, Yemen dropped to 11th place from 8th with a score of 6.8, down from 7.5. In the size of government area, its score dropped from 7.8 to 7.3 but it remained in 6th place. In the legal structure area, its score dropped to 5.5 from 5.9 and its rank fell to 16th from 11th. In sound money, its score fell dramati-cally to 6.3 from 8.8 and it ranked 19th, down from 14th in last year’s report. For freedom to trade, Yemen remained at 2nd, with a score of 8.3, the same as last year. Regulation of business, credit and labor area saw a decrease of 0.1 point to 6.4, with the same rank of 11th.
qlooking forward — initial data suggest a decline, with ongoing conflict posing additional risks.
12 TunisiaTunisia fell to 12th from 11th. Its overall score dropped to 6.7 from 6.8. The size of government score and ranks remained the same at 6.5 and 10th, respectively. Tunisia’s score and rank for the legal structure also remained the same at 7.6 and its rank rose to 4th from 5th. In the access to sound money area, Tunisia’s score rose from 6.9 to 7.0 and its rank rose from 19th to 18th. Tunisia’s score in the area of freedom to trade internationally fell from 6.0 to 5.6 and it remained at 17th. Finally, Tunisia’s score in the area of regulation of business, credit and labor fell to 7.0 from 7.1 and its rank, from 7th to 8th.
looking forward — initial data suggest little change going forward.
13 EgyptEgypt’s rank in the overall index fell from 12th to 13th but its score remained 6.6. The size of government area remained 6.4; Egypt’s rank in this area remained 11th. For the legal structure area, Egypt’s score remained at 5.1 and it ranked 18th, as it did last year. In the area of access to sound money, Egypt’s performance fell from 8.9 to 8.8, but its rank rose from 13th to 12th. Its score in the freedom to trade area fell to 6.2 from 6.4 and it ranked 15th, the same as last year. Finally, Egypt’s score in regulation was 6.3 and its rank was 11th, both the same as last year.
looking forward — initial data suggest little change going forward.
14 MoroccoMorocco’s rank fell to 14th from 13th but its score remained 6.5. Its score in size of government remained 5.9 and it ranked 14th, as it did as last year. Its rank for legal structure and security of property was 7th, the same as last year, and its score rose to 7.4 from 7.3. Morocco’s rank in the access to sound money area rose to 16th from 18th, but its score fell to 7.3 from 7.4. Morocco fell in the freedom to trade area by 0.1 points to 5.8, but it ranked 16th, up from 19th. Finally, Morocco’s score in the area of credit, labor and business regulation remained 6.1; its rank fell from 13th to 15th.
looking forward — initial data suggest little change going forward.
Economic Freedom of the Arab World: 2017 Annual Report / 17
Friedrich Naumann Foundation / International Research Foundation / Fraser Institute
15 DjiboutiDjibouti fell to 15th in this year’s report, down two in the rankings, with a score of 6.4, down 0.1 from its score in last year’s report. It scored 3.6 points, down from 4.3, in the size of government area and its rank fell to 21st from 18th. Its score remained 4.9 in the legal structure area, with a rank of 19th, the same as last year. In the access to sound money area, Djibouti’s score remained 9.6 but it fell from 3rd to 6th place. In freedom to trade internationally, its score remained 6.7 and its rank remained 11th. Finally, its score in the regulation of business, credit and labor fell from 7.2 to 7.1 but its rank rose to 5th, up from 6th.
looking forward — initial data suggest little change going forward.
16 MauritaniaMauritania rose to 16th from 17th and its score rose to 6.3 from 6.0. In the size of government area, Mauritania rose from 3.3 with a rank of 21st to a score of 4.7 and a rank of 17th. Its score for legal structure fell to 5.5 from 5.7, and its rank fell to 16th from 15th. Its score in the access to sound money area rose to 8.3 from 8.1 and its rank rose from 15th to 13th. Mauritania’s score remained 7.0 in the freedom to trade area, coming in 10th, the same as last year. Finally, Mauritania’s score rose to 5.9 from 5.7 in the area of regulation of business, credit and labor and it ranked 17th, down from 16th.
looking forward — initial data suggest little change going forward.
17 ComorosComoros fell to 17th from 15th though its score remained 6.2. Its score for the size of government remained 5.9 and it again ranked 14th. In the legal structure area, Comoros’ score rose by 0.3 point to 5.9; its rank rose to 11th from 16th. Its score in the access to sound money area fell to 6.2 from 6.9 and its rank fell to 20th from 19th. In the freedom to trade area, Comoros’ score stayed 6.7, and its rank remained 11th. Its score for the regulation area rose to 6.3 from 5.9, raising its rank from 15th to 12th.
plooking forward — initial data suggest future improvement.
18 SudanSudan came in 18th this year, down two in the rankings; its score remained 6.1. Sudan rose from 9.8 to 10.0 in the size of government area, for which it again ranked first. Its score in the legal structure area remained unchanged at 4.6, plac-ing it in 20th place, the same as last year. Its score in the access to sound money area rose from 5.0 to 6.2 and its rank rose from 21st to 20th. Its score in the area of freedom to trade internationally fell from 5.4. to 3.6 for a rank of 19th, up from 20th last year. Its score for business, credit and labor regulation rose by 0.3 to 6.0 points; its rank remained 16th.
qlooking forward — ongoing conflict suggests there will be further deterioration in economic freedom.
18 / Economic Freedom of the Arab World: 2017 Annual Report
Friedrich Naumann Foundation / International Research Foundation / Fraser Institute
19 IraqIraq ranked 19th, down from 18th with a score of 5.9, the same as last year. Iraq’s score and rank in the size of government area remained the same at 4.8 and 16th, respectively. Its score for the legal structure area remained at 4.1, and its rank dropped by one spot to 22nd, the lowest in the Arab world. Its score in the access to sound money area rose to 9.7 from 9.2 and its rank rose to 2nd from 12th. Iraq’s score in the freedom to trade area dropped from 6.0 to 5.4 and its rank fell to 18th from 17th. Finally, its score remained 5.4 in the area of credit, labour, and business, though its rank fell from 20th to 21st.
qlooking forward — initial data suggest deterioration going forward, with con-tinuing violence and disorder as a further risk to economic freedom.
20 AlgeriaAlgeria ranked 20th this year, the same as last year, but its score fell from 5.5 to 5.2. Its score in the size of government area moved up by 0.1 point to 4.2, putting Algeria in the 19th lace, the same as last year. Algeria’s score dropped to 5.7 points from 5.9 for legal structure and security of property rights, with a rank of 14th, up from 11th. Its score for the access to sound money area rose to 7.9 from 7.8 points for a rank of 14th, up two. Algeria’s score in freedom to trade internationally dropped significantly from 3.9 to 2.3, but its rank rose from 22nd to 21st. Algeria is the second least-free country in the Arab world for this area. In the regulation area, its score rose from 5.6 to 5.9, for a rank of 17th, up one from last year.
looking forward — initial data suggest little change going forward.
21 Libya Libya had a score of 4.8, down from 5.7; its rank fell from 19th to 21st. In the size of government area, Libya maintained its score of 3.3 but its rank fell one spot to 22nd, putting it last for this area. Libya’s score in the legal structure area remained at 5.8, but its rank rose to 12th from 13th. In access to sound money its score dropped from 7.7 to 7.1 but its rank remained 17th. Its score in the freedom to trade area dropped dramatically from 6.3 to 3.0, and its rank fell from 16th to 20th. Finally, in the business regulation area Libya scored 4.9, a decrease of 0.2, for a rank of 22nd, down to the last place from second last in the previous year.
looking forward — initial data suggest little change going forward but violence and disorder continue to be a threat to economic freedom.
22 Syrian Arab RepublicSyria’s overall score was 4.6, down from 5.1, again placing it last in the Arab world. Its score for the size of government area remained 6.7, with a rank of 9th, down from 8th. Its score in the legal structure area remained at 5.6 for a rank of 15th, up by one. Its score remained 3.3 in the access to sound money area, leaving it last at 22nd, the same as last year. In the area of freedom to trade, Syria’s score fell significantly to 2.0 from 4.6 and it ranked 22nd, last place. Finally, in the regula-tion area, Syria’s score rose from 5.5 to 5.6 for a rank of 20th, down from 19th.
qlooking forward — ongoing conflict suggests deterioration in economic freedom.
Economic Freedom of the Arab World: 2017 Annual Report / 19
Friedrich Naumann Foundation / International Research Foundation / Fraser Institute
The Index of Economic Freedom in the Arab World
The structure of the index
The index published in Economic Freedom of the Arab World includes the same five areas as that found in Economic Freedom of the World: 2017 Annual Report (Gwartney, Lawson, and Hall, 2017) but has 39, rather than 42, components. Because underlying data for some of the components used in the world index were not broadly available for the Arab world, they were replaced by similar components with broader coverage of the Arab world. This year all members of the Arab League are ranked. The score for each of the five areas is derived by averaging the components within that area. The most recent comprehensive data available for this report are from 2015, though we also publish some data now available from 2016.
Areas of Economic Freedom of the Arab World 1. Size of Government: Expenditures, Taxes and Enterprises; 2. Commercial and Economic Law and Security of Property Rights; 3. Access to Sound Money; 4. Freedom to Trade Internationally; 5. Regulation of Credit, Labor, and Business.
The overall rating was computed by averaging the scores of the five areas. Each component was normalized on a scale of zero to 10. The Appendix: Explanatory Notes and Data Sources (p. 48) describes the procedures by which scores between zero and 10 were derived for each category as well as details about sources and methodology.
For consistency, the minimums and maximums used in previous reports are also used in this year’s report. Global rather than regional minimums and maximums were used because some of the components show little variability among the Arab countries and in order to place the Arab nations in a broader con-text. Thus, a high score indicates that a nation is doing well, not only in compari-son with its immediate regional neighbors but also in comparison with nations around the world whose economic practices encourage economic freedom.
The index published in Economic Freedom of the Arab World includes data and ranks for all 22 members of the League of Arab States. Fifteen of these

20 / Economic Freedom of the Arab World: 2017 Annual Report
Friedrich Naumann Foundation / International Research Foundation / Fraser Institute
nations also appear in Economic Freedom of the World and the relative rankings of these nations in both indexes are very similar, despite the slightly different menu of components used in the index published in Economic Freedom of the Arab World. The index is compiled only from third-party data: in order to ensure objectivity, none of the sponsoring institutions provides any original data. As well, the formulas used in the calculations have remained the same for each year of the report. Thus, the authors of the report are unable to influence the stand-ings of the nations in the report. Moreover, any outside observer would be able to replicate the index in full, producing identical results.
Individual areas
Following is a description of the variables used to measure economic freedom and explanations of why they are relevant.1
Area 1: Size of Government: Expenditures, Taxes and EnterprisesThe four components of Area 1 indicate the extent to which countries rely on indi-vidual choice and markets rather than the political process to allocate resources and goods and services. When government spending increases relative to spend-ing by individuals, households, and businesses, government decision-making is substituted for personal choice and thus economic freedom is reduced. The first two components address this issue: Government consumption as a share of total consumption (1A) and Transfers and subsidies as a share of GDP (1B).
Government consumption (1A) refers to the extent to which the govern-ment itself provides goods and services. If government employees build a road, it is included as government consumption; if the construction is contracted to a private company, it is no longer included in government consumption though it is categorized as government spending. Competitive contracting builds effi-ciency and lessens the politicization of the economy, if the contracting is done impartially. Transfers and subsidies (1B) weaken markets by rewarding political power and position rather than the ability to produce goods and services the world wants and will pay for.
The third component (1C) measures the extent to which countries use pri-vate enterprise and free markets rather than government enterprises to produce goods and services. The fourth component (1D) is based on the top marginal income-tax rate and the income threshold at which it applies. High marginal tax rates that apply at relatively low income levels increasingly deny individuals the fruits of their labor.
Area 2: Commercial and Economic Law and Security of Property RightsSecurity of persons, contracts, and rightfully acquired property are central ele-ments of both economic freedom and civil society. Indeed, the legal system is the most important internal function of government. Security of property rights, pro-tected by the rule of law, is essential to economic freedom. Freedom to exchange, for
1 This description closely follows Gwartney and Lawson, 2006: 10–12.
Economic Freedom of the Arab World: 2017 Annual Report / 21
Friedrich Naumann Foundation / International Research Foundation / Fraser Institute
example, is meaningless if individuals do not have secure rights to property, includ-ing the fruits of their labor. Failure of a country’s legal system to provide for the security of property rights, enforcement of contracts, and the mutually agreeable settlement of disputes will undermine the operation of a market-exchange system.
As is appropriate for an assessment of economic freedom, the index focuses on economic and commercial law. However, the first two components in this area—2A, Military interference in the rule of law and the political process and 2B, Integrity of the legal system—are measures of whether or not the rule of law is applied impartially and consistently, which is also essential for effective economic and commercial law. Component 2C, Regulatory restrictions on the sale of real property, provides information on how easy it is to establish property rights and 2D, Legal enforcement of contracts, indicates whether agreements freely entered into are effectively protected by the rule of law. Both 2C and 2D are composites of other sub-components that measure the number of procedures, delays in judg-ments, and costs. Procedures that are too numerous, time-consuming, or costly lead to deterioration of the legal system’s ability to protect freely made agreements.
Area 3: Access to Sound MoneyMoney is essential to exchange. An absence of sound money undermines gains from trade and erodes the value of property held in monetary instruments. Sound money is essential to protect property rights and, thus, economic freedom. When governments print money to finance their expenditures, they are in effect expropriating the property and violating the economic freedom of their citizens. This (measured in component 3A) leads to inflation. High and volatile rates of inflation (components 3B and 3C) distort relative prices, alter the fundamental terms of long-term contracts, and make it virtually impossible for individuals and businesses to plan sensibly for the future. Component 3D is designed to mea-sure the ease with which other currencies can be used via domestic and foreign bank accounts: that is, can one freely exchange and obtain differing currencies?
Area 4: Freedom to Trade InternationallyIn a world of high technology and low costs for communication and transpor-tation, freedom of exchange across national boundaries is a key ingredient of economic freedom. The components in this area are designed to measure a wide variety of restraints that affect international exchange: these include tariffs (4A and its sub-components), exchange rate distortions (4B), and exchange rate and capital controls (4C). Individuals in the Arab world should have the right to buy and sell freely: Arab consumers should be able to buy the products they want from each other and from everyone in the world and Arab producers should be able to sell within the Arab world and to the world market.
Area 5: Regulation of Credit, Labor, and BusinessWhen regulations restrict entry into markets and interfere with the freedom to engage in voluntary exchange, they reduce economic freedom. Regulatory restraints that limit the freedom of exchange in credit, labor, and product markets are included in the index. Red tape can strangle business expansion, entrepreneurship, and job creation.

22 / Economic Freedom of the Arab World: 2017 Annual Report
Friedrich Naumann Foundation / International Research Foundation / Fraser Institute
The first component (5A) reflects conditions in the domestic credit market. Individuals should be able to make their own decisions in credit markets and deal with institutions they choose freely. The components are designed to measure whether government allows free markets to determine credit or whether this is politically determined and whether credit is available in a timely, cost-efficient manner to credit-worthy individuals and businesses that freely seek it.
Many types of labor-market regulation (5B) infringe upon the economic freedom of employees and employers. Individuals should be able to work for whom they wish and employers should be able to hire whom they wish. Variables include difficulty in hiring, rigidity in hours, dismissal regulations and costs, and conscription.
Like the regulation of the credit markets and labor markets, the regulation of business activities (5C) inhibits economic freedom. Individuals should be able to open the business they wish when they wish and close it when they choose. The regulation-of-business sub-components are designed to identify the extent to which regulatory restraints and bureaucratic procedures limit establishing a business (5Ci) and closing it (5Cii).

Economic Freedom of the Arab World: 2017 Annual Report / 23
Friedrich Naumann Foundation / International Research Foundation / Fraser Institute
Country Data Tables
The index published in Economic Freedom of the Arab World: 2017 Annual Report for the first time ranks all 22 members of the League of Arab States. Fifteen of these nations also appear in Economic Freedom of the World: 2017 Annual Report and the relative rankings of these nations in both indexes are very similar, despite the slightly different menu of components used in the index published in Economic Freedom of the Arab World. Last year there were not enough data available to rank Somalia.
For a jurisdiction to be given an overall score and rank, it must have rank-ings and scores for each of the five areas in the index. To be ranked for Areas 1 to 5, a nation must have data for at least two components in each area. Likewise, for components 5A, 5B, and 5C, a nation must have data for at least two sub-components in each.
For all countries, we present scores for each of the five areas analyzed as well as scores for each component, where data were available. All the scores in the index are values out of 10: 10 is the highest possible score and zero (0) is the lowest. A higher score indicates a greater degree of economic freedom. An arrow in table of overall ratings and ranks (pp. 24–25) shows under “Trend” whether the data available from 2015 indicate a nation’s trend is uncertain or likely to improve, decline, or hold steady in future rankings.
A more complete description of each component, including the method-ology used to calculate the scores, can be found in the Appendix: Explanatory Notes and Data Sources (p. 48).
Data available to ResearchersThe following tables contain data for the years 2002, 2005, 2010, 2013, 2014, 2015, and partial data for 2016. The full data-set, including all of the scores published in this report as well as all the annual data going back to 2002, can be freely downloaded at <https://www.fraserinstitute.org/studies/economic-freedom-of-
the-arab-world-2017-annual-report>. If you have any difficulties retrieving the data, please feel free to contact us via e-mail: <[email protected]>.

24 / Economic Freedom of the Arab World: 2017 Annual Report
Friedrich Naumann Foundation / International Research Foundation / Fraser Institute
Economic Freedom of the Arab World for 2015—Area Ratings and Ranks; Overall Rating and Rank; Trend
Areas Components of Area 5 Overall Rating (Rank)
Trend*1
Size of Government:
Expenditures, Taxes and Enterprises
2 Commercial and Economic Law and Security of Property Rights
3 Access to
Sound Money
4 Freedom to
Trade Internationally
5 Regulation of Credit, Labor, and Business
5A Credit Market Regulations
5B Labour Market
Regulations
5C Business
Regulations
Rating Rank Rating Rank Rating Rank Rating Rank Rating Rank Rating Rank Rating Rank Rating Rank Rating Rank
Algeria 4.2 19 5.7 14 7.9 14 2.3 21 5.9 17 Algeria 4.75 18 4.9 21 8.1 2 5.2 20
Bahrain 6.8 8 7.0 8 9.7 2 8.3 2 8.3 1 Bahrain 8.0 5 8.8 1 8.1 2 8.0 1
Comoros 5.9 14 5.9 11 6.2 20 6.7 11 6.3 12 Comoros 7.1 8 7.5 9 4.3 17 6.2 17 p
Djibouti 3.6 21 4.9 19 9.6 6 6.7 11 7.1 5 Djibouti 6.5 11 7.0 11 7.8 6 6.4 15
Egypt, Arab Republic 6.4 11 5.1 18 8.8 12 6.2 15 6.3 12 Egypt, Arab Republic 6.0 14 5.2 19 7.6 9 6.6 13
Iraq 4.8 16 4.1 22 9.7 2 5.4 18 5.4 21 Iraq 4.1 20 7.9 5 4.2 18 5.9 19 q
Jordan 8.0 4 7.0 8 9.7 2 7.7 7 7.2 4 Jordan 6.0 14 8.1 4 7.5 11 7.9 3
Kuwait 6.4 11 7.6 4 9.6 6 7.3 9 7.5 3 Kuwait 7.7 6 7.8 7 7.1 15 7.7 4 q
Lebanon 8.6 2 6.0 10 9.3 11 6.5 14 7.9 2 Lebanon 8.4 1 7.6 8 7.7 7 7.6 5
Libya 3.3 22 5.8 12 7.1 17 3.0 20 4.9 22 Libya 3.3 22 7.4 10 4.2 18 4.8 21
Mauritania 4.7 17 5.5 16 8.3 13 7.0 10 5.9 17 Mauritania 6.4 12 6.6 13 4.6 16 6.3 16
Morocco 5.9 14 7.4 7 7.3 16 5.8 16 6.1 15 Morocco 6.9 9 3.5 22 7.7 7 6.5 14
Oman 4.5 18 8.1 3 9.5 8 7.8 6 7.1 5 Oman 8.1 3 5.2 18 8.0 4 7.4 8 p
Palestinian Territories 8.0 4 5.8 12 9.8 1 8.0 5 6.2 14 Palestinian Territories 8.3 2 6.1 15 4.1 21 7.5 7 q
Qatar 6.4 11 7.5 6 9.7 2 7.7 7 6.9 9 Qatar 6.2 13 6.6 12 8.0 4 7.6 5 q
Saudi Arabia 4.0 20 8.2 2 9.4 9 6.6 13 6.8 10 Saudi Arabia 8.0 4 8.3 3 4.2 18 7.0 10 q
Somalia 8.5 3 4.2 21 7.4 15 9.7 1 5.8 19 Somalia 5.0 17 8.6 2 3.8 22 7.1 9
Sudan 10.0 1 4.6 20 6.2 20 3.6 19 6.0 16 Sudan 5.6 16 4.9 20 7.4 12 6.1 18 q
Syrian Arab Republic 6.7 9 5.6 15 3.3 22 2.0 22 5.6 20 Syrian Arab Republic 4.2 19 5.3 17 7.2 14 4.6 22 q
Tunisia 6.5 10 7.6 4 7.0 18 5.6 17 7.0 8 Tunisia 6.8 10 5.8 16 8.3 1 6.7 12
United Arab Emirates 6.9 7 8.3 1 9.4 9 8.2 4 7.1 5 United Arab Emirates 7.1 7 6.5 14 7.6 9 8.0 1
Yemen, Republic 7.3 6 5.5 16 6.3 19 8.3 2 6.4 11 Yemen, Republic 4.0 21 7.9 6 7.4 12 6.8 11 q
* Trend is based primarily on preliminary data for 2016. p = up; = unchanged, uncertain; q = down.

Economic Freedom of the Arab World: 2017 Annual Report / 25
Friedrich Naumann Foundation / International Research Foundation / Fraser Institute
Economic Freedom of the Arab World for 2015—Area Ratings and Ranks; Overall Rating and Rank; Trend
Areas Components of Area 5 Overall Rating (Rank)
Trend*1
Size of Government:
Expenditures, Taxes and Enterprises
2 Commercial and Economic Law and Security of Property Rights
3 Access to
Sound Money
4 Freedom to
Trade Internationally
5 Regulation of Credit, Labor, and Business
5A Credit Market Regulations
5B Labour Market
Regulations
5C Business
Regulations
Rating Rank Rating Rank Rating Rank Rating Rank Rating Rank Rating Rank Rating Rank Rating Rank Rating Rank
Algeria 4.2 19 5.7 14 7.9 14 2.3 21 5.9 17 Algeria 4.75 18 4.9 21 8.1 2 5.2 20
Bahrain 6.8 8 7.0 8 9.7 2 8.3 2 8.3 1 Bahrain 8.0 5 8.8 1 8.1 2 8.0 1
Comoros 5.9 14 5.9 11 6.2 20 6.7 11 6.3 12 Comoros 7.1 8 7.5 9 4.3 17 6.2 17 p
Djibouti 3.6 21 4.9 19 9.6 6 6.7 11 7.1 5 Djibouti 6.5 11 7.0 11 7.8 6 6.4 15
Egypt, Arab Republic 6.4 11 5.1 18 8.8 12 6.2 15 6.3 12 Egypt, Arab Republic 6.0 14 5.2 19 7.6 9 6.6 13
Iraq 4.8 16 4.1 22 9.7 2 5.4 18 5.4 21 Iraq 4.1 20 7.9 5 4.2 18 5.9 19 q
Jordan 8.0 4 7.0 8 9.7 2 7.7 7 7.2 4 Jordan 6.0 14 8.1 4 7.5 11 7.9 3
Kuwait 6.4 11 7.6 4 9.6 6 7.3 9 7.5 3 Kuwait 7.7 6 7.8 7 7.1 15 7.7 4 q
Lebanon 8.6 2 6.0 10 9.3 11 6.5 14 7.9 2 Lebanon 8.4 1 7.6 8 7.7 7 7.6 5
Libya 3.3 22 5.8 12 7.1 17 3.0 20 4.9 22 Libya 3.3 22 7.4 10 4.2 18 4.8 21
Mauritania 4.7 17 5.5 16 8.3 13 7.0 10 5.9 17 Mauritania 6.4 12 6.6 13 4.6 16 6.3 16
Morocco 5.9 14 7.4 7 7.3 16 5.8 16 6.1 15 Morocco 6.9 9 3.5 22 7.7 7 6.5 14
Oman 4.5 18 8.1 3 9.5 8 7.8 6 7.1 5 Oman 8.1 3 5.2 18 8.0 4 7.4 8 p
Palestinian Territories 8.0 4 5.8 12 9.8 1 8.0 5 6.2 14 Palestinian Territories 8.3 2 6.1 15 4.1 21 7.5 7 q
Qatar 6.4 11 7.5 6 9.7 2 7.7 7 6.9 9 Qatar 6.2 13 6.6 12 8.0 4 7.6 5 q
Saudi Arabia 4.0 20 8.2 2 9.4 9 6.6 13 6.8 10 Saudi Arabia 8.0 4 8.3 3 4.2 18 7.0 10 q
Somalia 8.5 3 4.2 21 7.4 15 9.7 1 5.8 19 Somalia 5.0 17 8.6 2 3.8 22 7.1 9
Sudan 10.0 1 4.6 20 6.2 20 3.6 19 6.0 16 Sudan 5.6 16 4.9 20 7.4 12 6.1 18 q
Syrian Arab Republic 6.7 9 5.6 15 3.3 22 2.0 22 5.6 20 Syrian Arab Republic 4.2 19 5.3 17 7.2 14 4.6 22 q
Tunisia 6.5 10 7.6 4 7.0 18 5.6 17 7.0 8 Tunisia 6.8 10 5.8 16 8.3 1 6.7 12
United Arab Emirates 6.9 7 8.3 1 9.4 9 8.2 4 7.1 5 United Arab Emirates 7.1 7 6.5 14 7.6 9 8.0 1
Yemen, Republic 7.3 6 5.5 16 6.3 19 8.3 2 6.4 11 Yemen, Republic 4.0 21 7.9 6 7.4 12 6.8 11 q
* Trend is based primarily on preliminary data for 2016. p = up; = unchanged, uncertain; q = down.

26 / Economic Freedom of the Arab World: 2017 Annual Report
Friedrich Naumann Foundation / International Research Foundation / Fraser Institute
Algeria2002 2005 2010 2013 2014 2015 2016
Summary Ratings (Rank) � 5.0 [17] 5.6 [17] 5.8 [17] 5.7 [18] 5.5 [20] 5.2 [20] Trend Rating [Data] Rating [Data] Rating [Data] Rating [Data] Rating [Data] Rating [Data] Rating [Data]
1. Size of Government 4.7 5.0 4.3 4.0 4.1 4.2
A. General government consumption spending 4.1 [26] 4.3 [25.3] 1.9 [33.4] 1.3 [35.6] 1.5 [34.8] 1.9 [33.5]
B. Transfers and subsidies as a percentage of GDP 8.0 [7.8] 8.6 [5.5] 8.2 [7.1] 7.8 [8.5] 7.8 [8.5] 7.8 [8.5]
C. Government enterprises and investment 2.0 2.0 0.0 0.0 0.0 0.0
D. Top marginal tax rate 7.0 [35] 7.0 [35] 7.0 [35] 7.0 [35]
2. Commercial, Economic Law & Property Rights 4.0 5.7 5.9 5.9 5.9 5.7 5.7
A. Military interference in rule of law and politics 0.0 5.0 5.0 5.0 5.0 4.2 4.2
B. Integrity of the legal system 3.3 5.0 5.0 5.0 5.0 5.0 5.0
C. Regulatory restrictions on the sale of real property 6.8 6.8 7.6 7.5 7.5 7.5 7.5
i. Number of procedures 3.5 5.5 5.5 5.5 5.5 5.5
ii. Time (days) 9.5 9.5 9.4 9.4 9.4 9.4
iii. Cost (% of property value) 7.6 7.7 7.7 7.7 7.7 7.7
D. Legal enforcement of contracts 6.0 6.0 6.1 6.1 6.0 6.0 6.0
i. Quality of judicial processes 2.5 3.0 3.0 2.6 2.6 2.6
ii. Time (days) 6.1 6.1 6.1 6.1 6.1 6.1
iii. Cost (% of claim) 9.3 9.3 9.3 9.3 9.4 9.4
3. Access to Sound Money 6.2 6.4 7.8 7.9 7.8 7.9
A. Money growth 5.7 [21.3] 6.4 [17.8] 7.7 [11.6] 8.3 [8.3] 7.9 [10.3] 8.4 [7.9]
B. Standard deviation of inflation 9.2 [1.9] 9.4 [1.5] 9.5 [1.3] 9.1 [2.2] 9.0 [2.4] 9.0 [2.4]
C. Inflation: most recent year 9.7 [1.4] 9.7 [1.4] 9.2 [3.9] 9.3 [3.3] 9.4 [2.9] 9.0 [4.8]
D. Freedom to own foreign currency bank accounts 0.0 0.0 5.0 5.0 5.0 5.0
4. Freedom to Trade Internationally 4.7 5.3 5.0 4.7 3.9 2.3
A. Taxes on international trade 5.2 7.0 6.8 6.9 6.8 6.8
i. Revenue from trade taxes (% of trade sector) 5.0 [7.6] 8.2 [2.7] 8.2 [2.8] 8.5 [2.3] 8.5 [2.3] 8.5 [2.3]
ii. Mean tariff rate 6.2 [18.8] 6.8 [15.8] 6.3 [18.6] 6.3 [18.6] 6.2 [18.8] 6.2 [18.8]
iii. Standard deviation of tariff rates 4.3 [14.3] 5.8 [10.5] 5.8 [10.4] 5.8 [10.4] 5.8 [10.5] 5.8 [10.5]
B. Black market exchange rates 8.1 [9.7] 8.1 [9.6] 8.3 [8.3] 7.2 [14.0] 4.8 [26.1] 0.0 [52.3] 3.8 [31.0]
C. Capital controls 0.8 0.9 0.0 0.0 0.0 0.0
5. Regulation of Credit, Labor, and Business 5.6 5.7 5.9 5.7 5.6 5.9
A. Credit market regulations 5.1 5.1 5.3 4.8 4.8 4.8
i. Ownership of banks 0.0 0.0 0.0 0.0 0.0 0.0
ii. Foreign bank competition 8.0 8.0 8.0 8.0 8.0 8.0
iii. Interest rate controls/negative real interest rates 10.0 10.0 10.0 10.0 10.0 10.0
iv. Getting credit 2.3 2.3 3.2 1.0 1.0 1.0 1.0
a. Legal Rights Index 3.0 3.0 2.0 2.0 2.0 2.0
b. Credit Information Index 1.7 3.3 0.0 0.0 0.0 0.0
B. Labor market regulations 4.3 4.6 4.9 4.9 4.4 4.9
i. Difficulty of Hiring Index 4.4 5.6 5.6 5.6 5.6 5.6
ii. Rigidity of Hours Index 4.0 4.0 6.0 6.0 4.0 6.0
iii. Rigidity of dismissals 7.8 7.8 6.9 6.9 6.9 6.9
a. Difficulty of Firing Index 6.0 6.0 6.0 6.0 6.0
b. Firing costs (weeks of wages) 9.5 7.8 7.8 7.8 7.8
iv. Conscription 1.0 1.0 1.0 1.0 1.0 1.0
C. Business Regulations 7.5 7.5 7.5 7.5 7.6 8.1 8.1
i. Starting a business 7.9 7.9 7.9 7.9 8.1 8.3 8.3
a. Number of procedures 2.9 2.9 2.9 3.5 4.1 4.1
b. Duration (days) 8.9 8.9 8.9 9.0 9.1 9.1
c. Cost (% of income per capita) 9.9 9.8 9.9 9.9 9.9 9.9
d. Minimum capital (% of income per capita) 9.9 9.9 9.9 10.0 10.0 10.0
ii. Closing a business 7.2 7.2 7.2 7.2 7.2 7.9 7.9
a. Time (years) 7.8 7.8 7.8 7.8 9.1 9.1
b. Cost (% of estate) 9.2 9.2 9.2 9.2 9.2 9.2
c. Recovery rate (cents on the dollar) 4.5 4.5 4.5 4.5 5.5 5.5
Trend is based primarily on preliminary data for 2016. p = up; = unchanged, uncertain; q = down.

Economic Freedom of the Arab World: 2017 Annual Report / 27
Friedrich Naumann Foundation / International Research Foundation / Fraser Institute
Bahrain2002 2005 2010 2013 2014 2015 2016
Summary Ratings (Rank) � 8.1 [1] 8.0 [1] 8.1 [1] 8.0 [3] 8.0 [2] 8.0 [1] Trend Rating [Data] Rating [Data] Rating [Data] Rating [Data] Rating [Data] Rating [Data] Rating [Data]
1. Size of Government 6.7 6.8 7.0 6.7 6.7 6.8
A. General government consumption spending 3.4 [28.6] 4.1 [26.1] 4.7 [23.9] 3.6 [27.6] 3.6 [27.6] 3.6 [27.6]
B. Transfers and subsidies as a percentage of GDP 9.5 [2.4] 9.0 [4.2] 9.4 [2.6] 9.3 [3.1] 9.3 [3.1] 9.6 [2.0]
C. Government enterprises and investment 4.0 4.0 4.0 4.0 4.0 4.0
D. Top marginal tax rate 10.0 [0.0] 10.0 [0.0] 10.0 [0.0] 10.0 [0.0] 10.0 [0.0] 10.0 [0.0]
2. Commercial, Economic Law & Property Rights 7.2 7.2 7.2 7.0 7.0 7.0 6.9
A. Military interference in rule of law and politics 5.0 5.0 5.0 5.0 5.0 5.0 5.0
B. Integrity of the legal system 8.3 8.3 8.3 7.5 7.5 7.5 7.5
C. Regulatory restrictions on the sale of real property 9.6 9.6 9.4 9.4 9.6 9.6 9.6
i. Number of procedures 9.5 9.5 9.5 9.5 9.5 9.5
ii. Time(days) 9.7 9.7 9.7 9.7 9.7 9.7
iii. Cost (% of property value) 9.7 9.1 9.1 9.5 9.5 9.5
D. Legal enforcement of contracts 6.0 6.0 6.0 6.0 6.0 6.0 5.7
i. Quality of judicial processes 2.3 2.3 2.3 2.2 2.2 1.5
ii. Time (days) 6.1 6.1 6.1 6.1 6.1 6.1
iii. Cost (% of claim) 9.6 9.6 9.6 9.6 9.6 9.6
3. Access to Sound Money 9.6 9.4 9.2 9.6 9.6 9.7
A. Money growth 8.9 [5.7] 8.9 [5.7] 7.5 [12.7] 9.8 [1.1] 9.7 [1.5] 9.9 [0.4]
B. Standard deviation of inflation 9.8 [0.4] 9.3 [1.7] 9.7 [0.7] 9.4 [1.5] 9.4 [1.4] 9.4 [1.4]
C. Inflation: most recent year 9.9 [−0.5] 9.5 [2.6] 9.6 [2.0] 9.3 [3.3] 9.5 [2.7] 9.6 [1.8]
D. Freedom to own foreign currency bank accounts 10.0 10.0 10.0 10.0 10.0 10.0
4. Freedom to Trade Internationally 8.5 8.2 8.4 8.2 8.3 8.3
A. Taxes on international trade 8.5 8.4 8.2 8.5 8.7 8.6
i. Revenue from trade taxes (% of trade sector) 9.3 [1.0] 8.8 [1.8] 9.4 [0.9] 9.5 [0.8] 9.5 [0.8] 9.5 [0.8]
ii. Mean tariff rate 9.0 [5.1] 9.0 [5.1] 9.0 [5.1] 9.1 [4.7] 9.1 [4.7] 9.1 [4.7]
iii. Standard deviation of tariff rates 7.3 [6.7] 7.3 [6.7] 6.3 [9.4] 7.1 [7.2] 7.4 [6.4] 7.3 [6.8]
B. Black market exchange rates 10.0 [0.0] 10.0 [0.0] 10.0 [0.0] 10.0 [0.0] 10.0 [0.0] 10.0 [0.0] 10.0 [0.0]
C. Capital controls 6.9 6.2 6.9 6.2 6.2 6.2
5. Regulation of Credit, Labor, and Business 8.5 8.5 8.9 8.4 8.3 8.3
A. Credit market regulations 8.1 8.3 8.3 7.8 8.0 8.0
i. Ownership of banks 10.0 10.0 10.0 10.0 10.0 10.0
ii. Foreign bank competition 7.0 8.0 8.0 7.0 7.0 7.0
iii. Interest rate controls/negative real interest rates 10.0 10.0 10.0 10.0 10.0 10.0
iv. Getting credit 5.3 5.3 5.3 4.3 4.9 4.9 5.5
a. Legal Rights Index 4.0 4.0 1.0 1.0 1.0 1.0
b. Credit Information Index 6.7 6.7 7.5 8.8 8.8 10.0
B. Labor market regulations 8.9 8.9 10.0 8.8 8.8 8.8
i. Difficulty of Hiring Index 10.0 10.0 10.0 8.3 8.3 8.3
ii. Rigidity of Hours Index 8.0 8.0 10.0 8.0 8.0 8.0
iii. Rigidity of dismissals 7.4 7.4 10.0 9.0 9.0 8.8
a. Difficulty of Firing Index 5.0 10.0 8.0 8.0 8.0
b. Firing costs (weeks of wages) 9.9 10.0 10.0 10.0 9.6
iv. Conscription 10.0 10.0 10.0 10.0 10.0 10.0
C. Business Regulations 8.4 8.4 8.4 8.5 8.1 8.1 8.1
i. Starting a business 9.1 9.1 9.0 9.1 9.1 9.1 9.1
a. Number of procedures 7.1 7.1 7.1 7.1 7.1 6.8
b. Duration (days) 9.7 9.7 9.7 9.7 9.7 9.6
c. Cost (% of income per capita) 10.0 10.0 10.0 10.0 10.0 10.0
d. Minimum capital (% of income per capita) 9.5 9.5 9.6 9.6 9.6 10.0
ii. Closing a business 7.8 7.8 7.8 8.0 7.1 7.1 7.1
a. Time (years) 7.8 7.8 7.8 7.8 7.8 7.8
b. Cost (% of estate) 8.8 8.8 8.8 8.9 8.9 8.9
c. Recovery rate (cents on the dollar) 6.8 6.9 7.3 4.5 4.5 4.6
Trend is based primarily on preliminary data for 2016. p = up; = unchanged, uncertain; q = down.
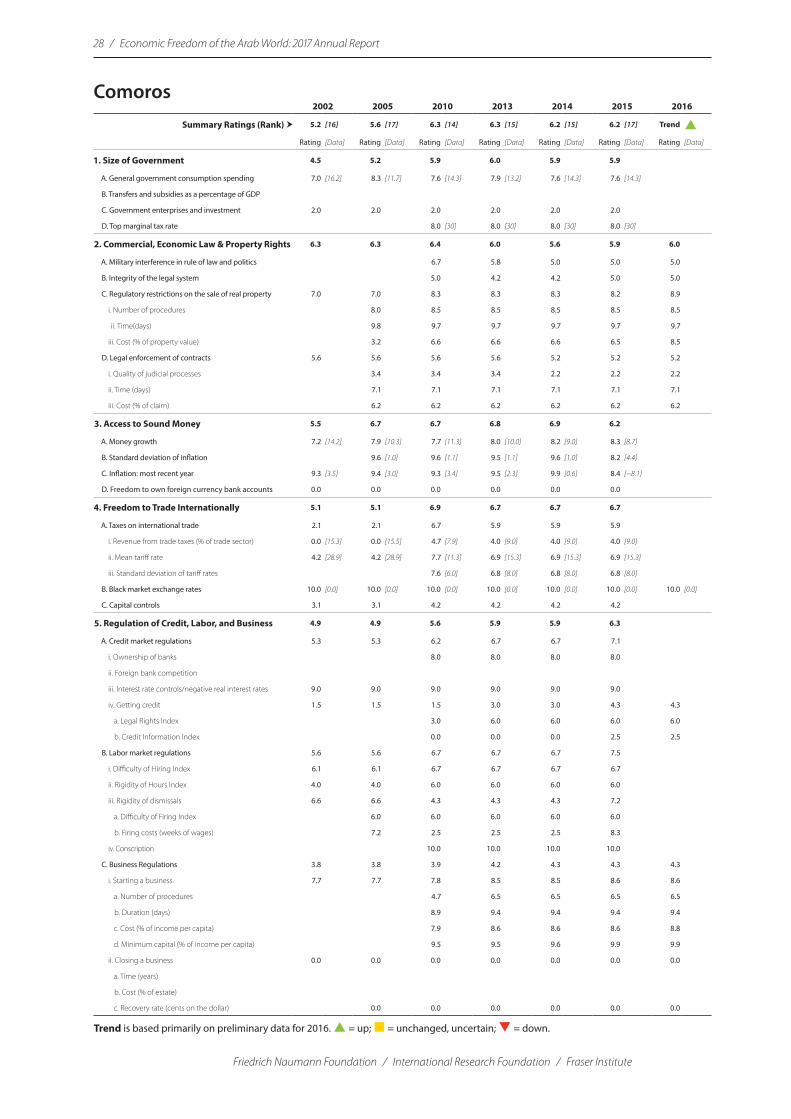
28 / Economic Freedom of the Arab World: 2017 Annual Report
Friedrich Naumann Foundation / International Research Foundation / Fraser Institute
Comoros2002 2005 2010 2013 2014 2015 2016
Summary Ratings (Rank) � 5.2 [16] 5.6 [17] 6.3 [14] 6.3 [15] 6.2 [15] 6.2 [17] Trend pRating [Data] Rating [Data] Rating [Data] Rating [Data] Rating [Data] Rating [Data] Rating [Data]
1. Size of Government 4.5 5.2 5.9 6.0 5.9 5.9
A. General government consumption spending 7.0 [16.2] 8.3 [11.7] 7.6 [14.3] 7.9 [13.2] 7.6 [14.3] 7.6 [14.3]
B. Transfers and subsidies as a percentage of GDP
C. Government enterprises and investment 2.0 2.0 2.0 2.0 2.0 2.0
D. Top marginal tax rate 8.0 [30] 8.0 [30] 8.0 [30] 8.0 [30]
2. Commercial, Economic Law & Property Rights 6.3 6.3 6.4 6.0 5.6 5.9 6.0
A. Military interference in rule of law and politics 6.7 5.8 5.0 5.0 5.0
B. Integrity of the legal system 5.0 4.2 4.2 5.0 5.0
C. Regulatory restrictions on the sale of real property 7.0 7.0 8.3 8.3 8.3 8.2 8.9
i. Number of procedures 8.0 8.5 8.5 8.5 8.5 8.5
ii. Time(days) 9.8 9.7 9.7 9.7 9.7 9.7
iii. Cost (% of property value) 3.2 6.6 6.6 6.6 6.5 8.5
D. Legal enforcement of contracts 5.6 5.6 5.6 5.6 5.2 5.2 5.2
i. Quality of judicial processes 3.4 3.4 3.4 2.2 2.2 2.2
ii. Time (days) 7.1 7.1 7.1 7.1 7.1 7.1
iii. Cost (% of claim) 6.2 6.2 6.2 6.2 6.2 6.2
3. Access to Sound Money 5.5 6.7 6.7 6.8 6.9 6.2
A. Money growth 7.2 [14.2] 7.9 [10.3] 7.7 [11.3] 8.0 [10.0] 8.2 [9.0] 8.3 [8.7]
B. Standard deviation of inflation 9.6 [1.0] 9.6 [1.1] 9.5 [1.1] 9.6 [1.0] 8.2 [4.4]
C. Inflation: most recent year 9.3 [3.5] 9.4 [3.0] 9.3 [3.4] 9.5 [2.3] 9.9 [0.6] 8.4 [−8.1]
D. Freedom to own foreign currency bank accounts 0.0 0.0 0.0 0.0 0.0 0.0
4. Freedom to Trade Internationally 5.1 5.1 6.9 6.7 6.7 6.7
A. Taxes on international trade 2.1 2.1 6.7 5.9 5.9 5.9
i. Revenue from trade taxes (% of trade sector) 0.0 [15.3] 0.0 [15.5] 4.7 [7.9] 4.0 [9.0] 4.0 [9.0] 4.0 [9.0]
ii. Mean tariff rate 4.2 [28.9] 4.2 [28.9] 7.7 [11.3] 6.9 [15.3] 6.9 [15.3] 6.9 [15.3]
iii. Standard deviation of tariff rates 7.6 [6.0] 6.8 [8.0] 6.8 [8.0] 6.8 [8.0]
B. Black market exchange rates 10.0 [0.0] 10.0 [0.0] 10.0 [0.0] 10.0 [0.0] 10.0 [0.0] 10.0 [0.0] 10.0 [0.0]
C. Capital controls 3.1 3.1 4.2 4.2 4.2 4.2
5. Regulation of Credit, Labor, and Business 4.9 4.9 5.6 5.9 5.9 6.3
A. Credit market regulations 5.3 5.3 6.2 6.7 6.7 7.1
i. Ownership of banks 8.0 8.0 8.0 8.0
ii. Foreign bank competition
iii. Interest rate controls/negative real interest rates 9.0 9.0 9.0 9.0 9.0 9.0
iv. Getting credit 1.5 1.5 1.5 3.0 3.0 4.3 4.3
a. Legal Rights Index 3.0 6.0 6.0 6.0 6.0
b. Credit Information Index 0.0 0.0 0.0 2.5 2.5
B. Labor market regulations 5.6 5.6 6.7 6.7 6.7 7.5
i. Difficulty of Hiring Index 6.1 6.1 6.7 6.7 6.7 6.7
ii. Rigidity of Hours Index 4.0 4.0 6.0 6.0 6.0 6.0
iii. Rigidity of dismissals 6.6 6.6 4.3 4.3 4.3 7.2
a. Difficulty of Firing Index 6.0 6.0 6.0 6.0 6.0
b. Firing costs (weeks of wages) 7.2 2.5 2.5 2.5 8.3
iv. Conscription 10.0 10.0 10.0 10.0
C. Business Regulations 3.8 3.8 3.9 4.2 4.3 4.3 4.3
i. Starting a business 7.7 7.7 7.8 8.5 8.5 8.6 8.6
a. Number of procedures 4.7 6.5 6.5 6.5 6.5
b. Duration (days) 8.9 9.4 9.4 9.4 9.4
c. Cost (% of income per capita) 7.9 8.6 8.6 8.6 8.8
d. Minimum capital (% of income per capita) 9.5 9.5 9.6 9.9 9.9
ii. Closing a business 0.0 0.0 0.0 0.0 0.0 0.0 0.0
a. Time (years)
b. Cost (% of estate)
c. Recovery rate (cents on the dollar) 0.0 0.0 0.0 0.0 0.0 0.0
Trend is based primarily on preliminary data for 2016. p = up; = unchanged, uncertain; q = down.
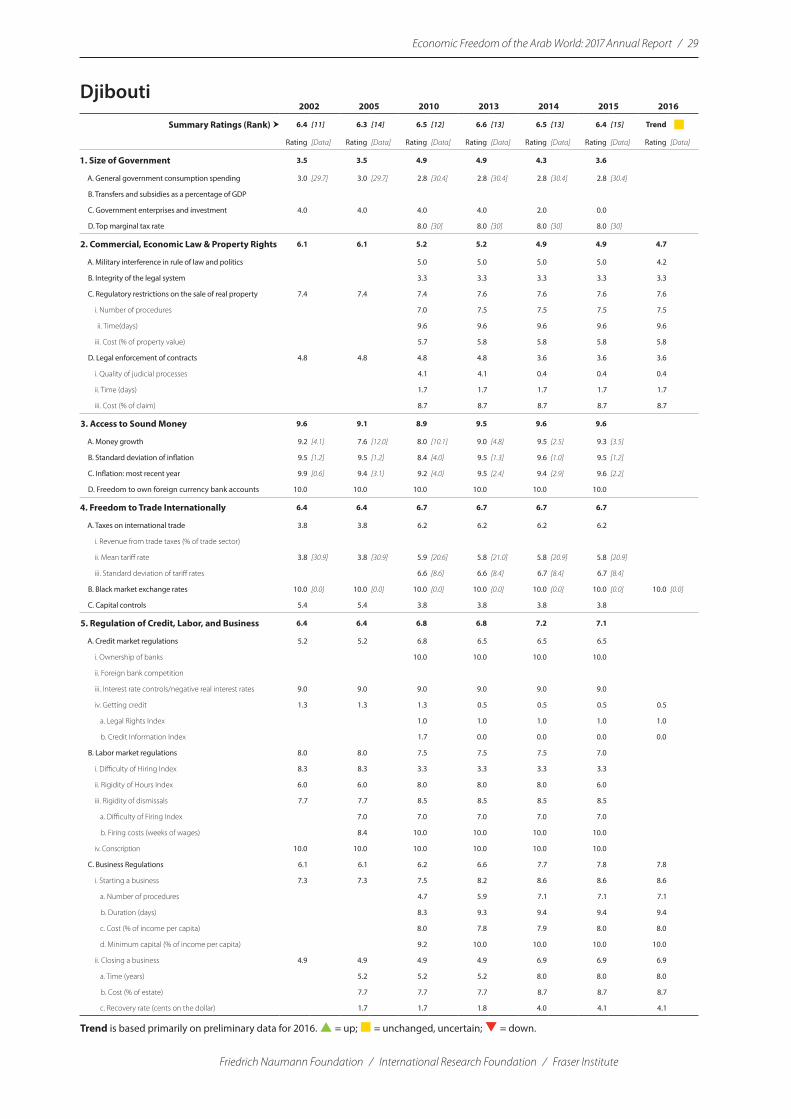
Economic Freedom of the Arab World: 2017 Annual Report / 29
Friedrich Naumann Foundation / International Research Foundation / Fraser Institute
Djibouti2002 2005 2010 2013 2014 2015 2016
Summary Ratings (Rank) � 6.4 [11] 6.3 [14] 6.5 [12] 6.6 [13] 6.5 [13] 6.4 [15] Trend Rating [Data] Rating [Data] Rating [Data] Rating [Data] Rating [Data] Rating [Data] Rating [Data]
1. Size of Government 3.5 3.5 4.9 4.9 4.3 3.6
A. General government consumption spending 3.0 [29.7] 3.0 [29.7] 2.8 [30.4] 2.8 [30.4] 2.8 [30.4] 2.8 [30.4]
B. Transfers and subsidies as a percentage of GDP
C. Government enterprises and investment 4.0 4.0 4.0 4.0 2.0 0.0
D. Top marginal tax rate 8.0 [30] 8.0 [30] 8.0 [30] 8.0 [30]
2. Commercial, Economic Law & Property Rights 6.1 6.1 5.2 5.2 4.9 4.9 4.7
A. Military interference in rule of law and politics 5.0 5.0 5.0 5.0 4.2
B. Integrity of the legal system 3.3 3.3 3.3 3.3 3.3
C. Regulatory restrictions on the sale of real property 7.4 7.4 7.4 7.6 7.6 7.6 7.6
i. Number of procedures 7.0 7.5 7.5 7.5 7.5
ii. Time(days) 9.6 9.6 9.6 9.6 9.6
iii. Cost (% of property value) 5.7 5.8 5.8 5.8 5.8
D. Legal enforcement of contracts 4.8 4.8 4.8 4.8 3.6 3.6 3.6
i. Quality of judicial processes 4.1 4.1 0.4 0.4 0.4
ii. Time (days) 1.7 1.7 1.7 1.7 1.7
iii. Cost (% of claim) 8.7 8.7 8.7 8.7 8.7
3. Access to Sound Money 9.6 9.1 8.9 9.5 9.6 9.6
A. Money growth 9.2 [4.1] 7.6 [12.0] 8.0 [10.1] 9.0 [4.8] 9.5 [2.5] 9.3 [3.5]
B. Standard deviation of inflation 9.5 [1.2] 9.5 [1.2] 8.4 [4.0] 9.5 [1.3] 9.6 [1.0] 9.5 [1.2]
C. Inflation: most recent year 9.9 [0.6] 9.4 [3.1] 9.2 [4.0] 9.5 [2.4] 9.4 [2.9] 9.6 [2.2]
D. Freedom to own foreign currency bank accounts 10.0 10.0 10.0 10.0 10.0 10.0
4. Freedom to Trade Internationally 6.4 6.4 6.7 6.7 6.7 6.7
A. Taxes on international trade 3.8 3.8 6.2 6.2 6.2 6.2
i. Revenue from trade taxes (% of trade sector)
ii. Mean tariff rate 3.8 [30.9] 3.8 [30.9] 5.9 [20.6] 5.8 [21.0] 5.8 [20.9] 5.8 [20.9]
iii. Standard deviation of tariff rates 6.6 [8.6] 6.6 [8.4] 6.7 [8.4] 6.7 [8.4]
B. Black market exchange rates 10.0 [0.0] 10.0 [0.0] 10.0 [0.0] 10.0 [0.0] 10.0 [0.0] 10.0 [0.0] 10.0 [0.0]
C. Capital controls 5.4 5.4 3.8 3.8 3.8 3.8
5. Regulation of Credit, Labor, and Business 6.4 6.4 6.8 6.8 7.2 7.1
A. Credit market regulations 5.2 5.2 6.8 6.5 6.5 6.5
i. Ownership of banks 10.0 10.0 10.0 10.0
ii. Foreign bank competition
iii. Interest rate controls/negative real interest rates 9.0 9.0 9.0 9.0 9.0 9.0
iv. Getting credit 1.3 1.3 1.3 0.5 0.5 0.5 0.5
a. Legal Rights Index 1.0 1.0 1.0 1.0 1.0
b. Credit Information Index 1.7 0.0 0.0 0.0 0.0
B. Labor market regulations 8.0 8.0 7.5 7.5 7.5 7.0
i. Difficulty of Hiring Index 8.3 8.3 3.3 3.3 3.3 3.3
ii. Rigidity of Hours Index 6.0 6.0 8.0 8.0 8.0 6.0
iii. Rigidity of dismissals 7.7 7.7 8.5 8.5 8.5 8.5
a. Difficulty of Firing Index 7.0 7.0 7.0 7.0 7.0
b. Firing costs (weeks of wages) 8.4 10.0 10.0 10.0 10.0
iv. Conscription 10.0 10.0 10.0 10.0 10.0 10.0
C. Business Regulations 6.1 6.1 6.2 6.6 7.7 7.8 7.8
i. Starting a business 7.3 7.3 7.5 8.2 8.6 8.6 8.6
a. Number of procedures 4.7 5.9 7.1 7.1 7.1
b. Duration (days) 8.3 9.3 9.4 9.4 9.4
c. Cost (% of income per capita) 8.0 7.8 7.9 8.0 8.0
d. Minimum capital (% of income per capita) 9.2 10.0 10.0 10.0 10.0
ii. Closing a business 4.9 4.9 4.9 4.9 6.9 6.9 6.9
a. Time (years) 5.2 5.2 5.2 8.0 8.0 8.0
b. Cost (% of estate) 7.7 7.7 7.7 8.7 8.7 8.7
c. Recovery rate (cents on the dollar) 1.7 1.7 1.8 4.0 4.1 4.1
Trend is based primarily on preliminary data for 2016. p = up; = unchanged, uncertain; q = down.
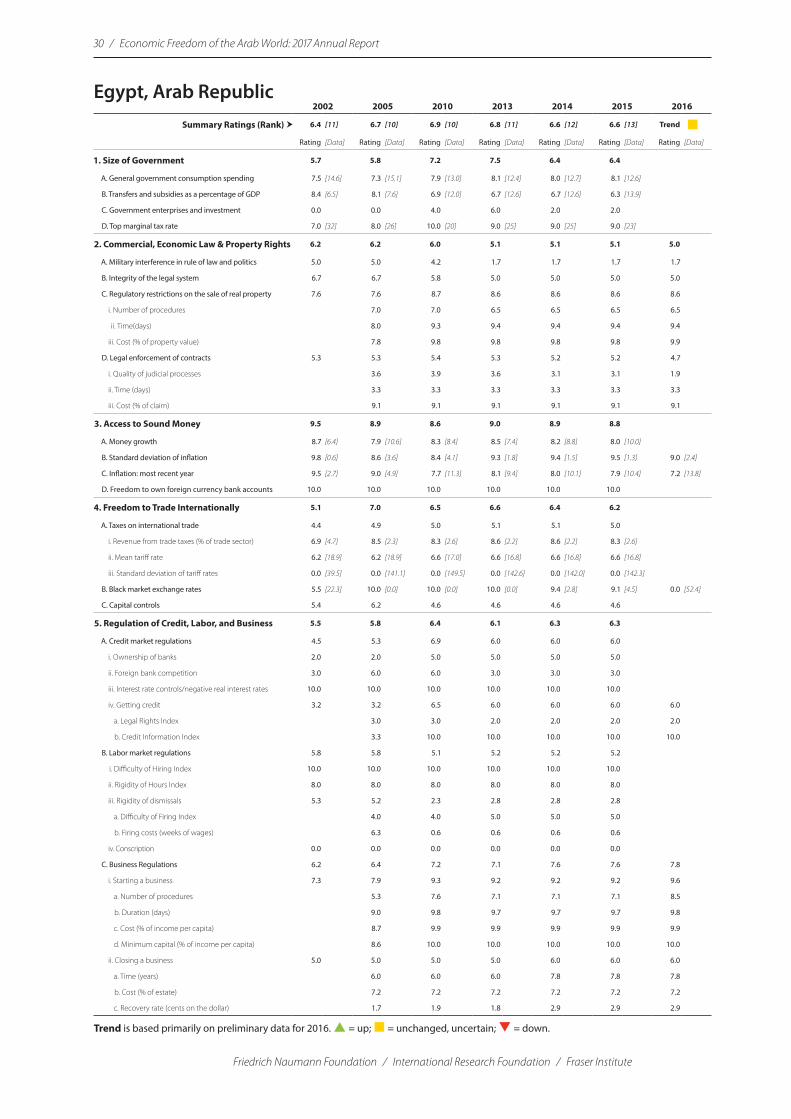
30 / Economic Freedom of the Arab World: 2017 Annual Report
Friedrich Naumann Foundation / International Research Foundation / Fraser Institute
Egypt, Arab Republic2002 2005 2010 2013 2014 2015 2016
Summary Ratings (Rank) � 6.4 [11] 6.7 [10] 6.9 [10] 6.8 [11] 6.6 [12] 6.6 [13] Trend Rating [Data] Rating [Data] Rating [Data] Rating [Data] Rating [Data] Rating [Data] Rating [Data]
1. Size of Government 5.7 5.8 7.2 7.5 6.4 6.4
A. General government consumption spending 7.5 [14.6] 7.3 [15.1] 7.9 [13.0] 8.1 [12.4] 8.0 [12.7] 8.1 [12.6]
B. Transfers and subsidies as a percentage of GDP 8.4 [6.5] 8.1 [7.6] 6.9 [12.0] 6.7 [12.6] 6.7 [12.6] 6.3 [13.9]
C. Government enterprises and investment 0.0 0.0 4.0 6.0 2.0 2.0
D. Top marginal tax rate 7.0 [32] 8.0 [26] 10.0 [20] 9.0 [25] 9.0 [25] 9.0 [23]
2. Commercial, Economic Law & Property Rights 6.2 6.2 6.0 5.1 5.1 5.1 5.0
A. Military interference in rule of law and politics 5.0 5.0 4.2 1.7 1.7 1.7 1.7
B. Integrity of the legal system 6.7 6.7 5.8 5.0 5.0 5.0 5.0
C. Regulatory restrictions on the sale of real property 7.6 7.6 8.7 8.6 8.6 8.6 8.6
i. Number of procedures 7.0 7.0 6.5 6.5 6.5 6.5
ii. Time(days) 8.0 9.3 9.4 9.4 9.4 9.4
iii. Cost (% of property value) 7.8 9.8 9.8 9.8 9.8 9.9
D. Legal enforcement of contracts 5.3 5.3 5.4 5.3 5.2 5.2 4.7
i. Quality of judicial processes 3.6 3.9 3.6 3.1 3.1 1.9
ii. Time (days) 3.3 3.3 3.3 3.3 3.3 3.3
iii. Cost (% of claim) 9.1 9.1 9.1 9.1 9.1 9.1
3. Access to Sound Money 9.5 8.9 8.6 9.0 8.9 8.8
A. Money growth 8.7 [6.4] 7.9 [10.6] 8.3 [8.4] 8.5 [7.4] 8.2 [8.8] 8.0 [10.0]
B. Standard deviation of inflation 9.8 [0.6] 8.6 [3.6] 8.4 [4.1] 9.3 [1.8] 9.4 [1.5] 9.5 [1.3] 9.0 [2.4]
C. Inflation: most recent year 9.5 [2.7] 9.0 [4.9] 7.7 [11.3] 8.1 [9.4] 8.0 [10.1] 7.9 [10.4] 7.2 [13.8]
D. Freedom to own foreign currency bank accounts 10.0 10.0 10.0 10.0 10.0 10.0
4. Freedom to Trade Internationally 5.1 7.0 6.5 6.6 6.4 6.2
A. Taxes on international trade 4.4 4.9 5.0 5.1 5.1 5.0
i. Revenue from trade taxes (% of trade sector) 6.9 [4.7] 8.5 [2.3] 8.3 [2.6] 8.6 [2.2] 8.6 [2.2] 8.3 [2.6]
ii. Mean tariff rate 6.2 [18.9] 6.2 [18.9] 6.6 [17.0] 6.6 [16.8] 6.6 [16.8] 6.6 [16.8]
iii. Standard deviation of tariff rates 0.0 [39.5] 0.0 [141.1] 0.0 [149.5] 0.0 [142.6] 0.0 [142.0] 0.0 [142.3]
B. Black market exchange rates 5.5 [22.3] 10.0 [0.0] 10.0 [0.0] 10.0 [0.0] 9.4 [2.8] 9.1 [4.5] 0.0 [52.4]
C. Capital controls 5.4 6.2 4.6 4.6 4.6 4.6
5. Regulation of Credit, Labor, and Business 5.5 5.8 6.4 6.1 6.3 6.3
A. Credit market regulations 4.5 5.3 6.9 6.0 6.0 6.0
i. Ownership of banks 2.0 2.0 5.0 5.0 5.0 5.0
ii. Foreign bank competition 3.0 6.0 6.0 3.0 3.0 3.0
iii. Interest rate controls/negative real interest rates 10.0 10.0 10.0 10.0 10.0 10.0
iv. Getting credit 3.2 3.2 6.5 6.0 6.0 6.0 6.0
a. Legal Rights Index 3.0 3.0 2.0 2.0 2.0 2.0
b. Credit Information Index 3.3 10.0 10.0 10.0 10.0 10.0
B. Labor market regulations 5.8 5.8 5.1 5.2 5.2 5.2
i. Difficulty of Hiring Index 10.0 10.0 10.0 10.0 10.0 10.0
ii. Rigidity of Hours Index 8.0 8.0 8.0 8.0 8.0 8.0
iii. Rigidity of dismissals 5.3 5.2 2.3 2.8 2.8 2.8
a. Difficulty of Firing Index 4.0 4.0 5.0 5.0 5.0
b. Firing costs (weeks of wages) 6.3 0.6 0.6 0.6 0.6
iv. Conscription 0.0 0.0 0.0 0.0 0.0 0.0
C. Business Regulations 6.2 6.4 7.2 7.1 7.6 7.6 7.8
i. Starting a business 7.3 7.9 9.3 9.2 9.2 9.2 9.6
a. Number of procedures 5.3 7.6 7.1 7.1 7.1 8.5
b. Duration (days) 9.0 9.8 9.7 9.7 9.7 9.8
c. Cost (% of income per capita) 8.7 9.9 9.9 9.9 9.9 9.9
d. Minimum capital (% of income per capita) 8.6 10.0 10.0 10.0 10.0 10.0
ii. Closing a business 5.0 5.0 5.0 5.0 6.0 6.0 6.0
a. Time (years) 6.0 6.0 6.0 7.8 7.8 7.8
b. Cost (% of estate) 7.2 7.2 7.2 7.2 7.2 7.2
c. Recovery rate (cents on the dollar) 1.7 1.9 1.8 2.9 2.9 2.9
Trend is based primarily on preliminary data for 2016. p = up; = unchanged, uncertain; q = down.

Economic Freedom of the Arab World: 2017 Annual Report / 31
Friedrich Naumann Foundation / International Research Foundation / Fraser Institute
Iraq2002 2005 2010 2013 2014 2015 2016
Summary Ratings (Rank) � 5.3 [19] 5.7 [18] 5.9 [18] 5.9 [19] Trend qRating [Data] Rating [Data] Rating [Data] Rating [Data] Rating [Data] Rating [Data] Rating [Data]
1. Size of Government 4.9 3.4 4.8 4.8
A. General government consumption spending 2.4 [32.0] 4.8 [23.5] 4.7 [24.0] 0.3 [38.8] 1.4 [35.1] 1.3 [35.4]
B. Transfers and subsidies as a percentage of GDP 7.8 [8.6] 7.8 [8.6]
C. Government enterprises and investment 0.0 0.0 0.0 0.0 0.0
D. Top marginal tax rate 10.0 [15] 10.0 [20] 10.0 [20] 10.0 [20]
2. Commercial, Economic Law & Property Rights 4.2 4.2 4.1 4.1 4.0
A. Military interference in rule of law and politics 0.0 0.0 0.0 0.0 0.0 0.0 0.0
B. Integrity of the legal system 3.3 2.5 2.5 2.5 2.5 2.5 2.5
C. Regulatory restrictions on the sale of real property 8.6 8.6 8.5 8.3 8.3 8.3 8.3
i. Number of procedures 8.0 8.0 8.0 8.0 8.0 8.0
ii. Time(days) 9.9 9.5 9.5 9.5 9.5 9.5
iii. Cost (% of property value) 7.8 7.9 7.3 7.3 7.3 7.4
D. Legal enforcement of contracts 5.8 5.8 5.8 5.8 5.8 5.8 5.3
i. Quality of judicial processes 1.6 1.6 1.6 1.5 1.5 0.0
ii. Time (days) 7.0 7.0 7.0 7.0 7.0 7.0
iii. Cost (% of claim) 8.8 9.0 9.0 9.0 9.0 9.0
3. Access to Sound Money 4.8 9.3 9.2 9.7
A. Money growth 4.4 [27.8] 8.4 [8.1] 8.2 [8.8] 9.9 [0.7]
B. Standard deviation of inflation 4.9 [12.7] 4.9 [12.7] 0.4 [23.9] 9.1 [2.2] 9.2 [2.0] 9.1 [2.3]
C. Inflation: most recent year 6.1 [19.3] 2.6 [37.0] 9.4 [2.9] 9.6 [1.9] 9.6 [2.2] 9.7 [1.4]
D. Freedom to own foreign currency bank accounts 0.0 5.0 5.0 10.0 10.0 10.0
4. Freedom to Trade Internationally 5.5 5.5 7.5 6.1 6.0 5.4
A. Taxes on international trade 6.4 6.4 6.4 6.4 6.4
i. Revenue from trade taxes (% of trade sector) 9.8 [0.3] 9.8 [0.3] 9.8 [0.3] 9.8 [0.3] 9.8 [0.3]
ii. Mean tariff rate 9.0 [5.0] 9.0 [5.0] 9.0 [5.0] 9.0 [5.0] 9.0 [5.0]
iii. Standard deviation of tariff rates 0.4 [23.9] 0.4 [23.9] 0.4 [23.9] 0.4 [23.9] 0.4 [23.9]
B. Black market exchange rates 10.0 [0.0] 10.0 [0.0] 10.0 [0.0] 9.7 [1.5] 9.4 [3.1] 7.4 [13.0] 8.8 [5.9]
C. Capital controls 0.9 0.0 6.2 2.3 2.3 2.3
5. Regulation of Credit, Labor, and Business 4.3 5.2 5.0 5.4 5.4 5.4
A. Credit market regulations 4.3 4.3 3.5 4.1 4.1 4.1
i. Ownership of banks 0.0 0.0 0.0 0.0
ii. Foreign bank competition 6.0 6.0 6.0
iii. Interest rate controls/negative real interest rates 7.0 7.0 9.0 10.0 10.0 10.0
iv. Getting credit 1.5 1.5 1.5 0.5 0.5 0.5 0.5
a. Legal Rights Index 3.0 3.0 1.0 1.0 1.0 1.0
b. Credit Information Index 0.0 0.0 0.0 0.0 0.0 0.0
B. Labor market regulations 4.9 7.4 7.9 7.9 7.9 7.9
i. Difficulty of Hiring Index 6.7 6.7 6.7 6.7 6.7 6.7
ii. Rigidity of Hours Index 4.0 4.0 6.0 6.0 6.0 6.0
iii. Rigidity of dismissals 9.0 9.0 9.0 9.0 9.0 9.0
a. Difficulty of Firing Index 8.0 8.0 8.0 8.0 8.0
b. Firing costs (weeks of wages) 10.0 10.0 10.0 10.0 10.0
iv. Conscription 0.0 10.0 10.0 10.0 10.0 10.0
C. Business Regulations 3.8 3.8 3.7 4.2 4.2 4.2 4.2
i. Starting a business 7.6 7.6 7.4 8.4 8.4 8.4 8.3
a. Number of procedures 4.7 4.7 5.3 5.3 5.3 5.6
b. Duration (days) 6.3 6.3 8.7 8.7 8.7 8.4
c. Cost (% of income per capita) 9.5 8.7 9.5 9.5 9.5 9.4
d. Minimum capital (% of income per capita) 9.9 9.9 10.0 10.0 10.0 10.0
ii. Closing a business 0.0 0.0 0.0 0.0 0.0 0.0 0.0
a. Time (years)
b. Cost (% of estate)
c. Recovery rate (cents on the dollar) 0.0 0.0 0.0 0.0 0.0 0.0 0.0
Trend is based primarily on preliminary data for 2016. p = up; = unchanged, uncertain; q = down.
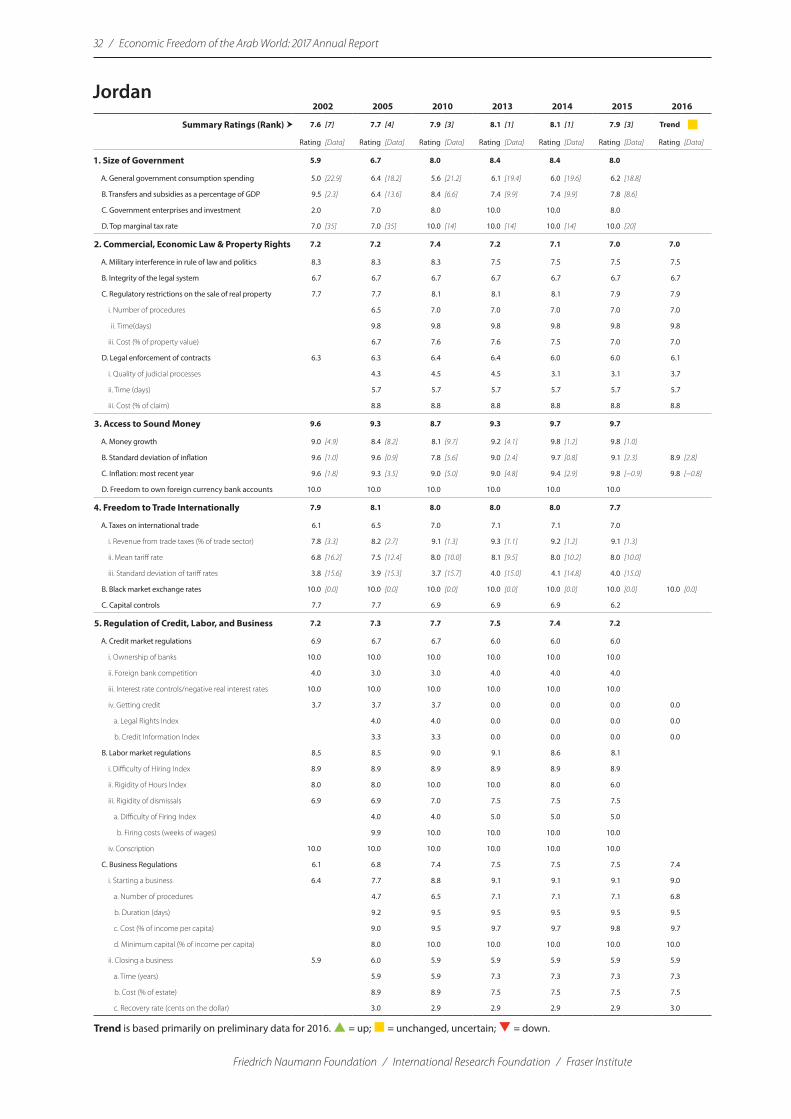
32 / Economic Freedom of the Arab World: 2017 Annual Report
Friedrich Naumann Foundation / International Research Foundation / Fraser Institute
Jordan2002 2005 2010 2013 2014 2015 2016
Summary Ratings (Rank) � 7.6 [7] 7.7 [4] 7.9 [3] 8.1 [1] 8.1 [1] 7.9 [3] Trend Rating [Data] Rating [Data] Rating [Data] Rating [Data] Rating [Data] Rating [Data] Rating [Data]
1. Size of Government 5.9 6.7 8.0 8.4 8.4 8.0
A. General government consumption spending 5.0 [22.9] 6.4 [18.2] 5.6 [21.2] 6.1 [19.4] 6.0 [19.6] 6.2 [18.8]
B. Transfers and subsidies as a percentage of GDP 9.5 [2.3] 6.4 [13.6] 8.4 [6.6] 7.4 [9.9] 7.4 [9.9] 7.8 [8.6]
C. Government enterprises and investment 2.0 7.0 8.0 10.0 10.0 8.0
D. Top marginal tax rate 7.0 [35] 7.0 [35] 10.0 [14] 10.0 [14] 10.0 [14] 10.0 [20]
2. Commercial, Economic Law & Property Rights 7.2 7.2 7.4 7.2 7.1 7.0 7.0
A. Military interference in rule of law and politics 8.3 8.3 8.3 7.5 7.5 7.5 7.5
B. Integrity of the legal system 6.7 6.7 6.7 6.7 6.7 6.7 6.7
C. Regulatory restrictions on the sale of real property 7.7 7.7 8.1 8.1 8.1 7.9 7.9
i. Number of procedures 6.5 7.0 7.0 7.0 7.0 7.0
ii. Time(days) 9.8 9.8 9.8 9.8 9.8 9.8
iii. Cost (% of property value) 6.7 7.6 7.6 7.5 7.0 7.0
D. Legal enforcement of contracts 6.3 6.3 6.4 6.4 6.0 6.0 6.1
i. Quality of judicial processes 4.3 4.5 4.5 3.1 3.1 3.7
ii. Time (days) 5.7 5.7 5.7 5.7 5.7 5.7
iii. Cost (% of claim) 8.8 8.8 8.8 8.8 8.8 8.8
3. Access to Sound Money 9.6 9.3 8.7 9.3 9.7 9.7
A. Money growth 9.0 [4.9] 8.4 [8.2] 8.1 [9.7] 9.2 [4.1] 9.8 [1.2] 9.8 [1.0]
B. Standard deviation of inflation 9.6 [1.0] 9.6 [0.9] 7.8 [5.6] 9.0 [2.4] 9.7 [0.8] 9.1 [2.3] 8.9 [2.8]
C. Inflation: most recent year 9.6 [1.8] 9.3 [3.5] 9.0 [5.0] 9.0 [4.8] 9.4 [2.9] 9.8 [−0.9] 9.8 [−0.8]
D. Freedom to own foreign currency bank accounts 10.0 10.0 10.0 10.0 10.0 10.0
4. Freedom to Trade Internationally 7.9 8.1 8.0 8.0 8.0 7.7
A. Taxes on international trade 6.1 6.5 7.0 7.1 7.1 7.0
i. Revenue from trade taxes (% of trade sector) 7.8 [3.3] 8.2 [2.7] 9.1 [1.3] 9.3 [1.1] 9.2 [1.2] 9.1 [1.3]
ii. Mean tariff rate 6.8 [16.2] 7.5 [12.4] 8.0 [10.0] 8.1 [9.5] 8.0 [10.2] 8.0 [10.0]
iii. Standard deviation of tariff rates 3.8 [15.6] 3.9 [15.3] 3.7 [15.7] 4.0 [15.0] 4.1 [14.8] 4.0 [15.0]
B. Black market exchange rates 10.0 [0.0] 10.0 [0.0] 10.0 [0.0] 10.0 [0.0] 10.0 [0.0] 10.0 [0.0] 10.0 [0.0]
C. Capital controls 7.7 7.7 6.9 6.9 6.9 6.2
5. Regulation of Credit, Labor, and Business 7.2 7.3 7.7 7.5 7.4 7.2
A. Credit market regulations 6.9 6.7 6.7 6.0 6.0 6.0
i. Ownership of banks 10.0 10.0 10.0 10.0 10.0 10.0
ii. Foreign bank competition 4.0 3.0 3.0 4.0 4.0 4.0
iii. Interest rate controls/negative real interest rates 10.0 10.0 10.0 10.0 10.0 10.0
iv. Getting credit 3.7 3.7 3.7 0.0 0.0 0.0 0.0
a. Legal Rights Index 4.0 4.0 0.0 0.0 0.0 0.0
b. Credit Information Index 3.3 3.3 0.0 0.0 0.0 0.0
B. Labor market regulations 8.5 8.5 9.0 9.1 8.6 8.1
i. Difficulty of Hiring Index 8.9 8.9 8.9 8.9 8.9 8.9
ii. Rigidity of Hours Index 8.0 8.0 10.0 10.0 8.0 6.0
iii. Rigidity of dismissals 6.9 6.9 7.0 7.5 7.5 7.5
a. Difficulty of Firing Index 4.0 4.0 5.0 5.0 5.0
b. Firing costs (weeks of wages) 9.9 10.0 10.0 10.0 10.0
iv. Conscription 10.0 10.0 10.0 10.0 10.0 10.0
C. Business Regulations 6.1 6.8 7.4 7.5 7.5 7.5 7.4
i. Starting a business 6.4 7.7 8.8 9.1 9.1 9.1 9.0
a. Number of procedures 4.7 6.5 7.1 7.1 7.1 6.8
b. Duration (days) 9.2 9.5 9.5 9.5 9.5 9.5
c. Cost (% of income per capita) 9.0 9.5 9.7 9.7 9.8 9.7
d. Minimum capital (% of income per capita) 8.0 10.0 10.0 10.0 10.0 10.0
ii. Closing a business 5.9 6.0 5.9 5.9 5.9 5.9 5.9
a. Time (years) 5.9 5.9 7.3 7.3 7.3 7.3
b. Cost (% of estate) 8.9 8.9 7.5 7.5 7.5 7.5
c. Recovery rate (cents on the dollar) 3.0 2.9 2.9 2.9 2.9 3.0
Trend is based primarily on preliminary data for 2016. p = up; = unchanged, uncertain; q = down.
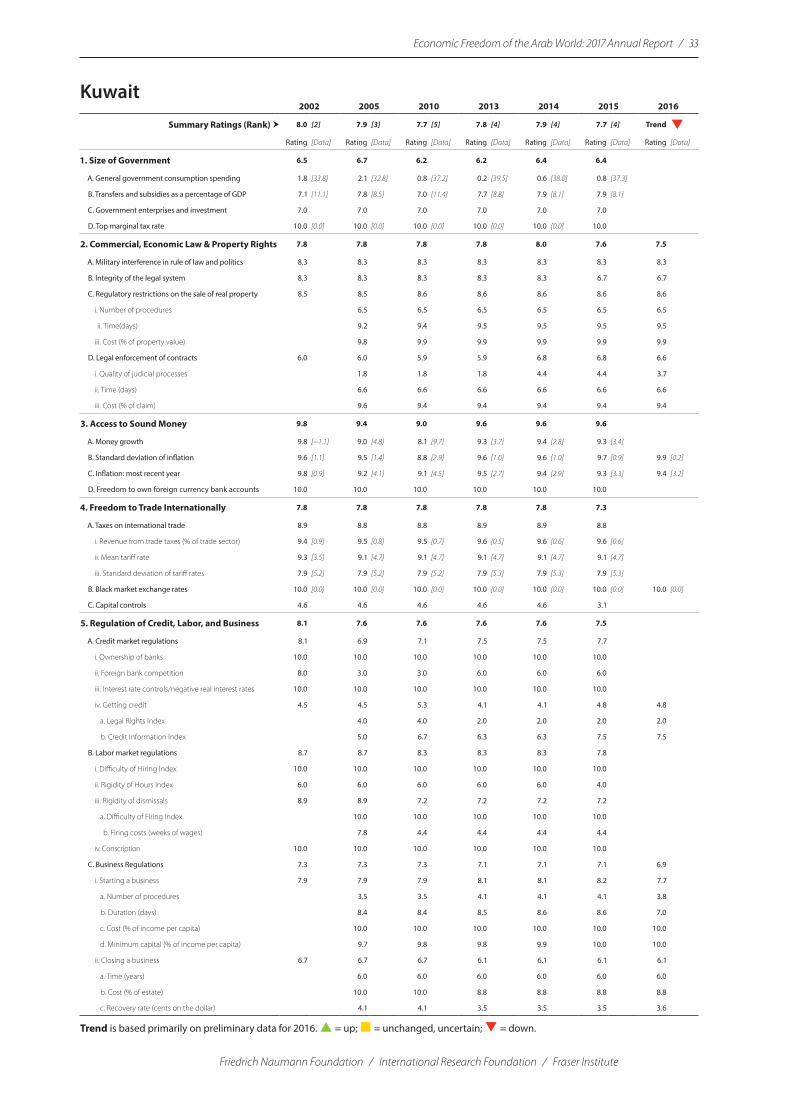
Economic Freedom of the Arab World: 2017 Annual Report / 33
Friedrich Naumann Foundation / International Research Foundation / Fraser Institute
Kuwait2002 2005 2010 2013 2014 2015 2016
Summary Ratings (Rank) � 8.0 [2] 7.9 [3] 7.7 [5] 7.8 [4] 7.9 [4] 7.7 [4] Trend qRating [Data] Rating [Data] Rating [Data] Rating [Data] Rating [Data] Rating [Data] Rating [Data]
1. Size of Government 6.5 6.7 6.2 6.2 6.4 6.4
A. General government consumption spending 1.8 [33.8] 2.1 [32.8] 0.8 [37.2] 0.2 [39.5] 0.6 [38.0] 0.8 [37.3]
B. Transfers and subsidies as a percentage of GDP 7.1 [11.1] 7.8 [8.5] 7.0 [11.4] 7.7 [8.8] 7.9 [8.1] 7.9 [8.1]
C. Government enterprises and investment 7.0 7.0 7.0 7.0 7.0 7.0
D. Top marginal tax rate 10.0 [0.0] 10.0 [0.0] 10.0 [0.0] 10.0 [0.0] 10.0 [0.0] 10.0
2. Commercial, Economic Law & Property Rights 7.8 7.8 7.8 7.8 8.0 7.6 7.5
A. Military interference in rule of law and politics 8.3 8.3 8.3 8.3 8.3 8.3 8.3
B. Integrity of the legal system 8.3 8.3 8.3 8.3 8.3 6.7 6.7
C. Regulatory restrictions on the sale of real property 8.5 8.5 8.6 8.6 8.6 8.6 8.6
i. Number of procedures 6.5 6.5 6.5 6.5 6.5 6.5
ii. Time(days) 9.2 9.4 9.5 9.5 9.5 9.5
iii. Cost (% of property value) 9.8 9.9 9.9 9.9 9.9 9.9
D. Legal enforcement of contracts 6.0 6.0 5.9 5.9 6.8 6.8 6.6
i. Quality of judicial processes 1.8 1.8 1.8 4.4 4.4 3.7
ii. Time (days) 6.6 6.6 6.6 6.6 6.6 6.6
iii. Cost (% of claim) 9.6 9.4 9.4 9.4 9.4 9.4
3. Access to Sound Money 9.8 9.4 9.0 9.6 9.6 9.6
A. Money growth 9.8 [−1.1] 9.0 [4.8] 8.1 [9.7] 9.3 [3.7] 9.4 [2.8] 9.3 [3.4]
B. Standard deviation of inflation 9.6 [1.1] 9.5 [1.4] 8.8 [2.9] 9.6 [1.0] 9.6 [1.0] 9.7 [0.9] 9.9 [0.2]
C. Inflation: most recent year 9.8 [0.9] 9.2 [4.1] 9.1 [4.5] 9.5 [2.7] 9.4 [2.9] 9.3 [3.3] 9.4 [3.2]
D. Freedom to own foreign currency bank accounts 10.0 10.0 10.0 10.0 10.0 10.0
4. Freedom to Trade Internationally 7.8 7.8 7.8 7.8 7.8 7.3
A. Taxes on international trade 8.9 8.8 8.8 8.9 8.9 8.8
i. Revenue from trade taxes (% of trade sector) 9.4 [0.9] 9.5 [0.8] 9.5 [0.7] 9.6 [0.5] 9.6 [0.6] 9.6 [0.6]
ii. Mean tariff rate 9.3 [3.5] 9.1 [4.7] 9.1 [4.7] 9.1 [4.7] 9.1 [4.7] 9.1 [4.7]
iii. Standard deviation of tariff rates 7.9 [5.2] 7.9 [5.2] 7.9 [5.2] 7.9 [5.3] 7.9 [5.3] 7.9 [5.3]
B. Black market exchange rates 10.0 [0.0] 10.0 [0.0] 10.0 [0.0] 10.0 [0.0] 10.0 [0.0] 10.0 [0.0] 10.0 [0.0]
C. Capital controls 4.6 4.6 4.6 4.6 4.6 3.1
5. Regulation of Credit, Labor, and Business 8.1 7.6 7.6 7.6 7.6 7.5
A. Credit market regulations 8.1 6.9 7.1 7.5 7.5 7.7
i. Ownership of banks 10.0 10.0 10.0 10.0 10.0 10.0
ii. Foreign bank competition 8.0 3.0 3.0 6.0 6.0 6.0
iii. Interest rate controls/negative real interest rates 10.0 10.0 10.0 10.0 10.0 10.0
iv. Getting credit 4.5 4.5 5.3 4.1 4.1 4.8 4.8
a. Legal Rights Index 4.0 4.0 2.0 2.0 2.0 2.0
b. Credit Information Index 5.0 6.7 6.3 6.3 7.5 7.5
B. Labor market regulations 8.7 8.7 8.3 8.3 8.3 7.8
i. Difficulty of Hiring Index 10.0 10.0 10.0 10.0 10.0 10.0
ii. Rigidity of Hours Index 6.0 6.0 6.0 6.0 6.0 4.0
iii. Rigidity of dismissals 8.9 8.9 7.2 7.2 7.2 7.2
a. Difficulty of Firing Index 10.0 10.0 10.0 10.0 10.0
b. Firing costs (weeks of wages) 7.8 4.4 4.4 4.4 4.4
iv. Conscription 10.0 10.0 10.0 10.0 10.0 10.0
C. Business Regulations 7.3 7.3 7.3 7.1 7.1 7.1 6.9
i. Starting a business 7.9 7.9 7.9 8.1 8.1 8.2 7.7
a. Number of procedures 3.5 3.5 4.1 4.1 4.1 3.8
b. Duration (days) 8.4 8.4 8.5 8.6 8.6 7.0
c. Cost (% of income per capita) 10.0 10.0 10.0 10.0 10.0 10.0
d. Minimum capital (% of income per capita) 9.7 9.8 9.8 9.9 10.0 10.0
ii. Closing a business 6.7 6.7 6.7 6.1 6.1 6.1 6.1
a. Time (years) 6.0 6.0 6.0 6.0 6.0 6.0
b. Cost (% of estate) 10.0 10.0 8.8 8.8 8.8 8.8
c. Recovery rate (cents on the dollar) 4.1 4.1 3.5 3.5 3.5 3.6
Trend is based primarily on preliminary data for 2016. p = up; = unchanged, uncertain; q = down.
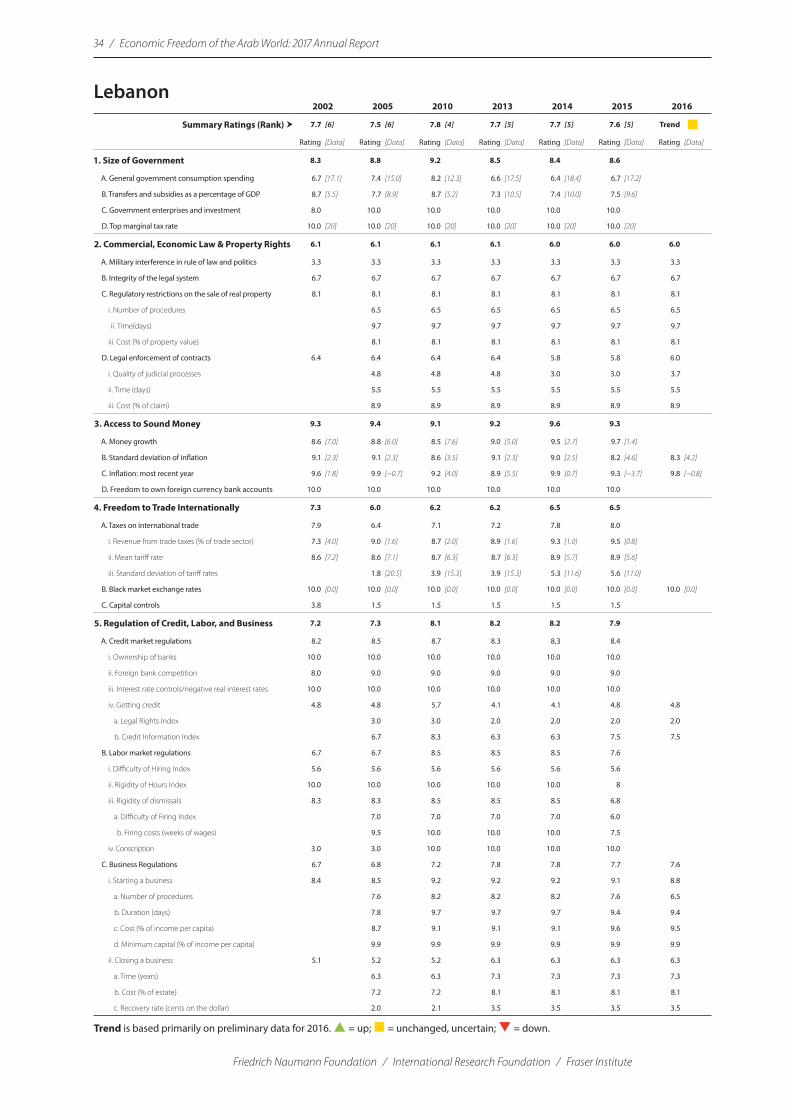
34 / Economic Freedom of the Arab World: 2017 Annual Report
Friedrich Naumann Foundation / International Research Foundation / Fraser Institute
Lebanon2002 2005 2010 2013 2014 2015 2016
Summary Ratings (Rank) � 7.7 [6] 7.5 [6] 7.8 [4] 7.7 [5] 7.7 [5] 7.6 [5] Trend Rating [Data] Rating [Data] Rating [Data] Rating [Data] Rating [Data] Rating [Data] Rating [Data]
1. Size of Government 8.3 8.8 9.2 8.5 8.4 8.6
A. General government consumption spending 6.7 [17.1] 7.4 [15.0] 8.2 [12.3] 6.6 [17.5] 6.4 [18.4] 6.7 [17.2]
B. Transfers and subsidies as a percentage of GDP 8.7 [5.5] 7.7 [8.9] 8.7 [5.2] 7.3 [10.5] 7.4 [10.0] 7.5 [9.6]
C. Government enterprises and investment 8.0 10.0 10.0 10.0 10.0 10.0
D. Top marginal tax rate 10.0 [20] 10.0 [20] 10.0 [20] 10.0 [20] 10.0 [20] 10.0 [20]
2. Commercial, Economic Law & Property Rights 6.1 6.1 6.1 6.1 6.0 6.0 6.0
A. Military interference in rule of law and politics 3.3 3.3 3.3 3.3 3.3 3.3 3.3
B. Integrity of the legal system 6.7 6.7 6.7 6.7 6.7 6.7 6.7
C. Regulatory restrictions on the sale of real property 8.1 8.1 8.1 8.1 8.1 8.1 8.1
i. Number of procedures 6.5 6.5 6.5 6.5 6.5 6.5
ii. Time(days) 9.7 9.7 9.7 9.7 9.7 9.7
iii. Cost (% of property value) 8.1 8.1 8.1 8.1 8.1 8.1
D. Legal enforcement of contracts 6.4 6.4 6.4 6.4 5.8 5.8 6.0
i. Quality of judicial processes 4.8 4.8 4.8 3.0 3.0 3.7
ii. Time (days) 5.5 5.5 5.5 5.5 5.5 5.5
iii. Cost (% of claim) 8.9 8.9 8.9 8.9 8.9 8.9
3. Access to Sound Money 9.3 9.4 9.1 9.2 9.6 9.3
A. Money growth 8.6 [7.0] 8.8 [6.0] 8.5 [7.6] 9.0 [5.0] 9.5 [2.7] 9.7 [1.4]
B. Standard deviation of inflation 9.1 [2.3] 9.1 [2.3] 8.6 [3.5] 9.1 [2.3] 9.0 [2.5] 8.2 [4.6] 8.3 [4.2]
C. Inflation: most recent year 9.6 [1.8] 9.9 [−0.7] 9.2 [4.0] 8.9 [5.5] 9.9 [0.7] 9.3 [−3.7] 9.8 [−0.8]
D. Freedom to own foreign currency bank accounts 10.0 10.0 10.0 10.0 10.0 10.0
4. Freedom to Trade Internationally 7.3 6.0 6.2 6.2 6.5 6.5
A. Taxes on international trade 7.9 6.4 7.1 7.2 7.8 8.0
i. Revenue from trade taxes (% of trade sector) 7.3 [4.0] 9.0 [1.6] 8.7 [2.0] 8.9 [1.6] 9.3 [1.0] 9.5 [0.8]
ii. Mean tariff rate 8.6 [7.2] 8.6 [7.1] 8.7 [6.3] 8.7 [6.3] 8.9 [5.7] 8.9 [5.6]
iii. Standard deviation of tariff rates 1.8 [20.5] 3.9 [15.3] 3.9 [15.3] 5.3 [11.6] 5.6 [11.0]
B. Black market exchange rates 10.0 [0.0] 10.0 [0.0] 10.0 [0.0] 10.0 [0.0] 10.0 [0.0] 10.0 [0.0] 10.0 [0.0]
C. Capital controls 3.8 1.5 1.5 1.5 1.5 1.5
5. Regulation of Credit, Labor, and Business 7.2 7.3 8.1 8.2 8.2 7.9
A. Credit market regulations 8.2 8.5 8.7 8.3 8.3 8.4
i. Ownership of banks 10.0 10.0 10.0 10.0 10.0 10.0
ii. Foreign bank competition 8.0 9.0 9.0 9.0 9.0 9.0
iii. Interest rate controls/negative real interest rates 10.0 10.0 10.0 10.0 10.0 10.0
iv. Getting credit 4.8 4.8 5.7 4.1 4.1 4.8 4.8
a. Legal Rights Index 3.0 3.0 2.0 2.0 2.0 2.0
b. Credit Information Index 6.7 8.3 6.3 6.3 7.5 7.5
B. Labor market regulations 6.7 6.7 8.5 8.5 8.5 7.6
i. Difficulty of Hiring Index 5.6 5.6 5.6 5.6 5.6 5.6
ii. Rigidity of Hours Index 10.0 10.0 10.0 10.0 10.0 8
iii. Rigidity of dismissals 8.3 8.3 8.5 8.5 8.5 6.8
a. Difficulty of Firing Index 7.0 7.0 7.0 7.0 6.0
b. Firing costs (weeks of wages) 9.5 10.0 10.0 10.0 7.5
iv. Conscription 3.0 3.0 10.0 10.0 10.0 10.0
C. Business Regulations 6.7 6.8 7.2 7.8 7.8 7.7 7.6
i. Starting a business 8.4 8.5 9.2 9.2 9.2 9.1 8.8
a. Number of procedures 7.6 8.2 8.2 8.2 7.6 6.5
b. Duration (days) 7.8 9.7 9.7 9.7 9.4 9.4
c. Cost (% of income per capita) 8.7 9.1 9.1 9.1 9.6 9.5
d. Minimum capital (% of income per capita) 9.9 9.9 9.9 9.9 9.9 9.9
ii. Closing a business 5.1 5.2 5.2 6.3 6.3 6.3 6.3
a. Time (years) 6.3 6.3 7.3 7.3 7.3 7.3
b. Cost (% of estate) 7.2 7.2 8.1 8.1 8.1 8.1
c. Recovery rate (cents on the dollar) 2.0 2.1 3.5 3.5 3.5 3.5
Trend is based primarily on preliminary data for 2016. p = up; = unchanged, uncertain; q = down.
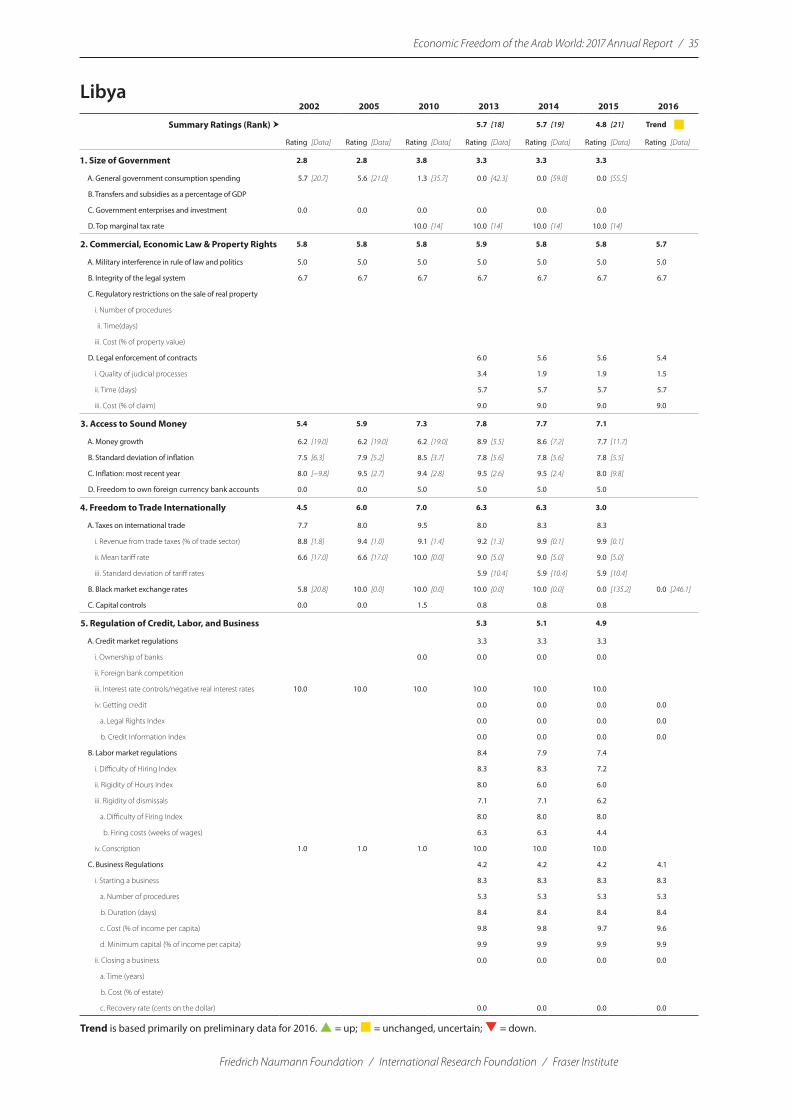
Economic Freedom of the Arab World: 2017 Annual Report / 35
Friedrich Naumann Foundation / International Research Foundation / Fraser Institute
Libya2002 2005 2010 2013 2014 2015 2016
Summary Ratings (Rank) � 5.7 [18] 5.7 [19] 4.8 [21] Trend Rating [Data] Rating [Data] Rating [Data] Rating [Data] Rating [Data] Rating [Data] Rating [Data]
1. Size of Government 2.8 2.8 3.8 3.3 3.3 3.3
A. General government consumption spending 5.7 [20.7] 5.6 [21.0] 1.3 [35.7] 0.0 [42.3] 0.0 [59.0] 0.0 [55.5]
B. Transfers and subsidies as a percentage of GDP
C. Government enterprises and investment 0.0 0.0 0.0 0.0 0.0 0.0
D. Top marginal tax rate 10.0 [14] 10.0 [14] 10.0 [14] 10.0 [14]
2. Commercial, Economic Law & Property Rights 5.8 5.8 5.8 5.9 5.8 5.8 5.7
A. Military interference in rule of law and politics 5.0 5.0 5.0 5.0 5.0 5.0 5.0
B. Integrity of the legal system 6.7 6.7 6.7 6.7 6.7 6.7 6.7
C. Regulatory restrictions on the sale of real property
i. Number of procedures
ii. Time(days)
iii. Cost (% of property value)
D. Legal enforcement of contracts 6.0 5.6 5.6 5.4
i. Quality of judicial processes 3.4 1.9 1.9 1.5
ii. Time (days) 5.7 5.7 5.7 5.7
iii. Cost (% of claim) 9.0 9.0 9.0 9.0
3. Access to Sound Money 5.4 5.9 7.3 7.8 7.7 7.1
A. Money growth 6.2 [19.0] 6.2 [19.0] 6.2 [19.0] 8.9 [5.5] 8.6 [7.2] 7.7 [11.7]
B. Standard deviation of inflation 7.5 [6.3] 7.9 [5.2] 8.5 [3.7] 7.8 [5.6] 7.8 [5.6] 7.8 [5.5]
C. Inflation: most recent year 8.0 [−9.8] 9.5 [2.7] 9.4 [2.8] 9.5 [2.6] 9.5 [2.4] 8.0 [9.8]
D. Freedom to own foreign currency bank accounts 0.0 0.0 5.0 5.0 5.0 5.0
4. Freedom to Trade Internationally 4.5 6.0 7.0 6.3 6.3 3.0
A. Taxes on international trade 7.7 8.0 9.5 8.0 8.3 8.3
i. Revenue from trade taxes (% of trade sector) 8.8 [1.8] 9.4 [1.0] 9.1 [1.4] 9.2 [1.3] 9.9 [0.1] 9.9 [0.1]
ii. Mean tariff rate 6.6 [17.0] 6.6 [17.0] 10.0 [0.0] 9.0 [5.0] 9.0 [5.0] 9.0 [5.0]
iii. Standard deviation of tariff rates 5.9 [10.4] 5.9 [10.4] 5.9 [10.4]
B. Black market exchange rates 5.8 [20.8] 10.0 [0.0] 10.0 [0.0] 10.0 [0.0] 10.0 [0.0] 0.0 [135.2] 0.0 [246.1]
C. Capital controls 0.0 0.0 1.5 0.8 0.8 0.8
5. Regulation of Credit, Labor, and Business 5.3 5.1 4.9
A. Credit market regulations 3.3 3.3 3.3
i. Ownership of banks 0.0 0.0 0.0 0.0
ii. Foreign bank competition
iii. Interest rate controls/negative real interest rates 10.0 10.0 10.0 10.0 10.0 10.0
iv. Getting credit 0.0 0.0 0.0 0.0
a. Legal Rights Index 0.0 0.0 0.0 0.0
b. Credit Information Index 0.0 0.0 0.0 0.0
B. Labor market regulations 8.4 7.9 7.4
i. Difficulty of Hiring Index 8.3 8.3 7.2
ii. Rigidity of Hours Index 8.0 6.0 6.0
iii. Rigidity of dismissals 7.1 7.1 6.2
a. Difficulty of Firing Index 8.0 8.0 8.0
b. Firing costs (weeks of wages) 6.3 6.3 4.4
iv. Conscription 1.0 1.0 1.0 10.0 10.0 10.0
C. Business Regulations 4.2 4.2 4.2 4.1
i. Starting a business 8.3 8.3 8.3 8.3
a. Number of procedures 5.3 5.3 5.3 5.3
b. Duration (days) 8.4 8.4 8.4 8.4
c. Cost (% of income per capita) 9.8 9.8 9.7 9.6
d. Minimum capital (% of income per capita) 9.9 9.9 9.9 9.9
ii. Closing a business 0.0 0.0 0.0 0.0
a. Time (years)
b. Cost (% of estate)
c. Recovery rate (cents on the dollar) 0.0 0.0 0.0 0.0
Trend is based primarily on preliminary data for 2016. p = up; = unchanged, uncertain; q = down.

36 / Economic Freedom of the Arab World: 2017 Annual Report
Friedrich Naumann Foundation / International Research Foundation / Fraser Institute
Mauritania2002 2005 2010 2013 2014 2015 2016
Summary Ratings (Rank) � 6.6 [10] 6.5 [11] 5.4 [18] 5.9 [16] 6.0 [17] 6.3 [16] Trend Rating [Data] Rating [Data] Rating [Data] Rating [Data] Rating [Data] Rating [Data] Rating [Data]
1. Size of Government 6.4 6.2 2.9 3.4 3.3 4.7
A. General government consumption spending 4.1 [26.1] 3.6 [27.9] 3.6 [27.9] 3.2 [29.1] 3.0 [29.8] 3.0 [29.8]
B. Transfers and subsidies as a percentage of GDP
C. Government enterprises and investment 10.0 10.0 0.0 2.0 2.0 6.0
D. Top marginal tax rate 5.0 [40] 5.0 [40] 5.0 [40] 5.0 [40] 5.0 [40] 5.0 [40]
2. Commercial, Economic Law & Property Rights 7.6 7.6 5.5 5.7 5.7 5.5 5.4
A. Military interference in rule of law and politics 3.3 3.3 3.3 3.3 3.3
B. Integrity of the legal system 3.3 4.2 4.2 3.3 3.3
C. Regulatory restrictions on the sale of real property 8.6 8.6 8.8 8.8 8.8 8.8 8.8
i. Number of procedures 8.5 8.5 8.5 8.5 8.5 8.5
ii. Time(days) 9.5 9.5 9.5 9.5 9.5 9.5
iii. Cost (% of property value) 7.8 8.3 8.5 8.5 8.5 8.5
D. Legal enforcement of contracts 6.5 6.5 6.7 6.7 6.5 6.5 6.3
i. Quality of judicial processes 2.5 2.7 2.7 2.2 2.2 1.5
ii. Time (days) 7.8 8.1 8.1 8.1 8.1 8.1
iii. Cost (% of claim) 9.2 9.2 9.2 9.2 9.2 9.2
3. Access to Sound Money 7.9 7.3 6.5 7.9 8.1 8.3
A. Money growth 8.0 [10.0] 8.0 [10.0] 8.0 [10.0] 8.2 [8.9] 8.6 [7.2] 8.9 [5.3]
B. Standard deviation of inflation 9.2 [1.9] 8.5 [3.7] 9.2 [2.1] 9.4 [1.6] 9.6 [1.1] 9.2 [2.0]
C. Inflation: most recent year 9.2 [3.9] 7.6 [12.1] 8.7 [6.3] 9.2 [4.1] 9.3 [3.5] 9.9 [0.5]
D. Freedom to own foreign currency bank accounts 5.0 5.0 0.0 5.0 5.0 5.0
4. Freedom to Trade Internationally 6.2 6.3 6.3 7.1 7.0 7.0
A. Taxes on international trade 7.8 8.0 8.0 8.0 7.8 7.8
i. Revenue from trade taxes (% of trade sector) 8.3 [2.5] 8.9 [1.6] 8.6 [2.1] 8.6 [2.1] 8.6 [2.1] 8.6 [2.1]
ii. Mean tariff rate 7.9 [10.7] 7.9 [10.7] 8.1 [9.6] 8.1 [9.6] 7.6 [12.0] 7.6 [12.0]
iii. Standard deviation of tariff rates 7.1 [7.2] 7.1 [7.2] 7.2 [7.0] 7.2 [7.0] 7.2 [7.1] 7.2 [7.1]
B. Black market exchange rates 10.0 [0.0] 10.0 [0.0] 10.0 [0.0] 10.0 [0.0] 10.0 [0.0] 10.0 [0.0] 10.0 [0.0]
C. Capital controls 0.8 0.8 1.0 3.3 3.3 3.3
5. Regulation of Credit, Labor, and Business 4.8 5.3 5.7 5.4 5.7 5.9
A. Credit market regulations 5.7 5.7 6.4 6.0 6.0 6.4
i. Ownership of banks 8.0 8.0 8.0 8.0
ii. Foreign bank competition
iii. Interest rate controls/negative real interest rates 9.0 9.0 9.0 9.0 9.0 9.0
iv. Getting credit 2.3 2.3 2.3 1.0 1.0 2.3 2.9
a. Legal Rights Index 3.0 3.0 2.0 2.0 2.0 2.0
b. Credit Information Index 1.7 1.7 0.0 0.0 2.5 3.8
B. Labor market regulations 5.4 6.7 6.4 6.1 6.6 6.6
i. Difficulty of Hiring Index 1.1 3.3 5.6 4.4 4.4 4.4
ii. Rigidity of Hours Index 4.0 6.0 8.0 8.0 10.0 10.0
iii. Rigidity of dismissals 6.6 7.6 7.0 7.0 7.0 7.0
a. Difficulty of Firing Index 6.0 6.0 6.0 6.0 6.0
b. Firing costs (weeks of wages) 9.1 7.9 7.9 7.9 7.9
iv. Conscription 10.0 10.0 5.0 5.0 5.0 5.0
C. Business Regulations 3.4 3.4 4.2 4.2 4.5 4.6 4.6
i. Starting a business 6.8 6.8 8.5 8.5 9.0 9.3 9.1
a. Number of procedures 4.7 5.9 5.9 7.1 7.6 7.1
b. Duration (days) 6.0 9.2 9.2 9.7 9.7 9.7
c. Cost (% of income per capita) 8.3 9.6 9.4 9.8 9.8 9.8
d. Minimum capital (% of income per capita) 8.3 9.2 9.4 9.4 10.0 10.0
ii. Closing a business 0.0 0.0 0.0 0.0 0.0 0.0 0.0
a. Time (years)
b. Cost (% of estate)
c. Recovery rate (cents on the dollar) 0.0 0.0 0.0 0.0 0.0 0.0
Trend is based primarily on preliminary data for 2016. p = up; = unchanged, uncertain; q = down.

Economic Freedom of the Arab World: 2017 Annual Report / 37
Friedrich Naumann Foundation / International Research Foundation / Fraser Institute
Morocco2002 2005 2010 2013 2014 2015 2016
Summary Ratings (Rank) � 6.3 [13] 6.4 [12] 6.4 [13] 6.5 [14] 6.5 [13] 6.5 [14] Trend Rating [Data] Rating [Data] Rating [Data] Rating [Data] Rating [Data] Rating [Data] Rating [Data]
1. Size of Government 6.4 6.7 6.3 5.9 5.9 5.9
A. General government consumption spending 4.9 [23.4] 4.6 [24.5] 4.9 [23.4] 4.5 [24.8] 4.4 [24.9] 4.4 [25.0]
B. Transfers and subsidies as a percentage of GDP 8.7 [5.3] 8.4 [6.5] 8.1 [7.4] 7.0 [11.4] 7.3 [10.4] 7.3 [10.4]
C. Government enterprises and investment 8.0 10.0 8.0 8.0 8.0 8.0
D. Top marginal tax rate 4.0 [44] 4.0 [44] 4.0 [44] 4.0 [44] 4.0 [44] 4.0 [44]
2. Commercial, Economic Law & Property Rights 7.9 7.5 7.4 7.2 7.3 7.4 7.2
A. Military interference in rule of law and politics 6.7 6.7 6.7 6.7 6.7 6.7 6.7
B. Integrity of the legal system 10.0 8.3 8.3 7.5 7.5 7.5 6.7
C. Regulatory restrictions on the sale of real property 8.5 8.4 8.0 8.0 8.1 8.6 8.4
i. Number of procedures 8.0 6.5 6.5 6.5 8.0 7.5
ii. Time(days) 9.5 9.2 9.2 9.6 9.7 9.8
iii. Cost (% of property value) 7.7 8.4 8.1 8.1 8.1 8.1
D. Legal enforcement of contracts 6.5 6.5 6.7 6.7 7.0 7.0 7.0
i. Quality of judicial processes 4.1 4.1 4.1 4.8 4.8 4.8
ii. Time (days) 6.3 7.0 7.0 7.0 7.0 7.0
iii. Cost (% of claim) 9.1 9.1 9.1 9.1 9.1 9.1
3. Access to Sound Money 6.9 7.0 7.0 7.3 7.4 7.3
A. Money growth 8.6 [7.0] 8.6 [7.2] 8.6 [7.1] 9.9 [0.5] 9.9 [0.5] 9.9 [0.7]
B. Standard deviation of inflation 9.6 [1.1] 9.7 [0.8] 9.5 [1.3] 9.8 [0.4] 9.8 [0.5] 9.8 [0.6] 9.8 [0.6]
C. Inflation: most recent year 9.4 [2.8] 9.8 [1.0] 9.8 [1.0] 9.6 [1.9] 9.9 [0.4] 9.7 [1.6] 9.7 [1.6]
D. Freedom to own foreign currency bank accounts 0.0 0.0 0.0 0.0 0.0 0.0
4. Freedom to Trade Internationally 4.6 5.0 5.4 5.6 5.9 5.8
A. Taxes on international trade 4.3 4.7 5.5 6.1 6.8 6.8
i. Revenue from trade taxes (% of trade sector) 6.6 [5.2] 7.5 [3.7] 8.4 [2.3] 9.1 [1.3] 9.1 [1.3] 9.3 [1.1]
ii. Mean tariff rate 4.5 [27.7] 6.1 [19.4] 6.4 [18.1] 7.4 [12.9] 7.8 [11.2] 7.7 [11.6]
iii. Standard deviation of tariff rates 1.8 [20.5] 0.6 [23.5] 1.8 [20.5] 1.8 [20.4] 3.6 [16.0] 3.4 [16.6]
B. Black market exchange rates 7.9 [10.3] 9.6 [1.8] 10.0 [0.0] 10.0 [0.0] 10.0 [0.0] 10.0 [0.0] 10.0 [0.0]
C. Capital controls 1.5 0.8 0.8 0.8 0.8 0.8
5. Regulation of Credit, Labor, and Business 5.6 5.7 5.9 6.2 6.1 6.1
A. Credit market regulations 6.1 5.8 5.9 6.9 6.9 6.9
i. Ownership of banks 5.0 8.0 5.0 5.0 5.0 5.0
ii. Foreign bank competition 8.0 3.0 3.0 8.0 8.0 8.0
iii. Interest rate controls/negative real interest rates 9.0 10.0 10.0 10.0 10.0 10.0
iv. Getting credit 2.3 2.3 5.7 4.8 4.8 4.8 5.4
a. Legal Rights Index 3.0 3.0 2.0 2.0 2.0 2.0
b. Credit Information Index 1.7 8.3 7.5 7.5 7.5 8.8
B. Labor market regulations 3.6 3.3 3.8 3.5 3.8 3.5
i. Difficulty of Hiring Index 0.0 0.0 1.1 0.0 1.1 0.0
ii. Rigidity of Hours Index 6.0 6.0 8.0 8.0 8.0 8.0
iii. Rigidity of dismissals 7.2 6.3 5.1 5.1 5.1 5.1
a. Difficulty of Firing Index 5.0 5.0 5.0 5.0 5.0
b. Firing costs (weeks of wages) 7.6 5.3 5.3 5.3 5.3
iv. Conscription 1.0 1.0 1.0 1.0 1.0 1.0
C. Business Regulations 7.2 7.8 8.0 8.1 7.6 7.7 7.7
i. Starting a business 7.8 8.9 9.2 9.4 9.4 9.6 9.6
a. Number of procedures 7.6 7.6 8.2 8.2 8.8 8.8
b. Duration (days) 9.5 9.5 9.6 9.6 9.6 9.6
c. Cost (% of income per capita) 9.8 9.8 9.9 9.9 9.9 9.9
d. Minimum capital (% of income per capita) 8.6 10.0 10.0 10.0 10.0 10.0
ii. Closing a business 6.7 6.7 6.8 6.8 5.8 5.8 5.8
a. Time (years) 8.5 8.5 8.5 6.8 6.8 6.8
b. Cost (% of estate) 7.7 7.7 7.7 7.7 7.7 7.7
c. Recovery rate (cents on the dollar) 3.8 4.1 4.1 3.0 3.0 3.0
Trend is based primarily on preliminary data for 2016. p = up; = unchanged, uncertain; q = down.

38 / Economic Freedom of the Arab World: 2017 Annual Report
Friedrich Naumann Foundation / International Research Foundation / Fraser Institute
Oman2002 2005 2010 2013 2014 2015 2016
Summary Ratings (Rank) � 7.8 [3] 7.5 [6] 7.6 [6] 7.7 [5] 7.7 [5] 7.4 [8] Trend pRating [Data] Rating [Data] Rating [Data] Rating [Data] Rating [Data] Rating [Data] Rating [Data]
1. Size of Government 5.0 4.9 5.2 4.6 4.5 4.5
A. General government consumption spending 0.1 [39.5] 0.0 [40.5] 1.1 [36.2] 0.0 [41.5] 0.0 [47.2] 0.0 [45.3]
B. Transfers and subsidies as a percentage of GDP 9.7 [1.7] 9.4 [2.7] 9.6 [1.8] 8.4 [6.2] 8.1 [7.3] 8.1 [7.3]
C. Government enterprises and investment 0.0 0.0 0.0 0.0 0.0 0.0
D. Top marginal tax rate 10.0 [0.0] 10.0 [0.0] 10.0 [0.0] 10.0 [0.0] 10.0 [0.0] 10.0 [0.0]
2. Commercial, Economic Law & Property Rights 8.0 8.0 8.0 8.0 8.1 8.1 8.2
A. Military interference in rule of law and politics 8.3 8.3 8.3 8.3 8.3 8.3 8.3
B. Integrity of the legal system 8.3 8.3 8.3 8.3 8.3 8.3 8.3
C. Regulatory restrictions on the sale of real property 9.5 9.5 9.5 9.5 9.5 9.5 9.5
i. Number of procedures 9.5 9.5 9.5 9.5 9.5 9.5
ii. Time(days) 9.8 9.8 9.8 9.8 9.8 9.8
iii. Cost (% of property value) 9.0 9.0 9.0 9.0 9.0 9.0
D. Legal enforcement of contracts 5.9 5.9 5.9 5.9 6.5 6.5 6.6
i. Quality of judicial processes 1.6 1.6 1.6 3.3 3.3 3.7
ii. Time (days) 6.4 6.4 6.4 6.4 6.4 6.4
iii. Cost (% of claim) 9.6 9.6 9.6 9.6 9.6 9.6
3. Access to Sound Money 9.7 9.5 8.7 9.6 9.5 9.5
A. Money growth 9.4 [3.2] 8.6 [6.8] 6.8 [16.0] 9.1 [4.6] 8.8 [6.0] 8.8 [6.2]
B. Standard deviation of inflation 9.6 [1.0] 9.6 [1.0] 8.5 [3.8] 9.5 [1.1] 9.5 [1.3] 9.4 [1.6]
C. Inflation: most recent year 9.9 [−0.3] 9.6 [1.9] 9.4 [3.2] 9.8 [1.2] 9.8 [1.0] 10.0 [0.1]
D. Freedom to own foreign currency bank accounts 10.0 10.0 10.0 10.0 10.0 10.0
4. Freedom to Trade Internationally 8.6 8.1 7.9 8.1 8.2 7.8
A. Taxes on international trade 9.1 7.7 7.9 8.6 8.8 8.1
i. Revenue from trade taxes (% of trade sector) 9.5 [0.8] 9.4 [0.8] 9.4 [0.9] 9.4 [0.9] 9.6 [0.6] 9.6 [0.6]
ii. Mean tariff rate 8.4 [8.0] 9.2 [3.8] 8.9 [5.5] 9.1 [4.7] 9.1 [4.7] 8.9 [5.5]
iii. Standard deviation of tariff rates 9.5 [1.2] 4.4 [14.0] 5.4 [11.4] 7.2 [7.1] 7.6 [6.0] 5.7 [10.7]
B. Black market exchange rates 10.0 [0.0] 10.0 [0.0] 10.0 [0.0] 10.0 [0.0] 10.0 [0.0] 10.0 [0.0] 10.0 [0.0]
C. Capital controls 6.7 6.7 5.8 5.8 5.8 5.4
5. Regulation of Credit, Labor, and Business 7.7 7.3 8.4 8.3 8.1 7.1
A. Credit market regulations 7.9 6.7 7.4 8.1 8.1 8.1
i. Ownership of banks 10.0 10.0 10.0 10.0 10.0 10.0
ii. Foreign bank competition 8.0 3.0 6.0 8.0 8.0 8.0
iii. Interest rate controls/negative real interest rates 10.0 10.0 10.0 10.0 10.0 10.0
iv. Getting credit 3.7 3.7 3.7 4.3 4.3 4.3 4.3
a. Legal Rights Index 4.0 4.0 1.0 1.0 1.0 1.0
b. Credit Information Index 3.3 3.3 7.5 7.5 7.5 7.5
B. Labor market regulations 7.9 7.9 10.0 8.7 8.2 5.2
i. Difficulty of Hiring Index 5.6 5.6 10.0 8.9 8.9 8.9
ii. Rigidity of Hours Index 6.0 6.0 10.0 6.0 4.0 2.0
iii. Rigidity of dismissals 9.9 9.9 10.0 10.0 10.0 0.0
a. Difficulty of Firing Index 10.0 10.0 10.0 10.0 0.0
b. Firing costs (weeks of wages) 9.9 10.0 10.0 10.0
iv. Conscription 10.0 10.0 10.0 10.0 10.0 10.0
C. Business Regulations 7.3 7.3 7.9 8.0 8.0 8.0 8.1
i. Starting a business 8.1 8.1 9.3 9.4 9.4 9.4 9.6
a. Number of procedures 5.3 8.2 8.2 8.2 8.2 8.5
b. Duration (days) 8.4 9.5 9.7 9.8 9.8 9.8
c. Cost (% of income per capita) 9.9 10.0 10.0 10.0 10.0 10.0
d. Minimum capital (% of income per capita) 8.7 9.4 9.6 9.6 9.5 10.0
ii. Closing a business 6.5 6.5 6.5 6.6 6.7 6.7 6.7
a. Time (years) 6.3 6.3 6.3 6.3 6.3 6.3
b. Cost (% of estate) 9.6 9.6 9.6 9.7 9.7 9.7
c. Recovery rate (cents on the dollar) 3.7 3.8 4.0 4.1 4.1 4.1
Trend is based primarily on preliminary data for 2016. p = up; = unchanged, uncertain; q = down.

Economic Freedom of the Arab World: 2017 Annual Report / 39
Friedrich Naumann Foundation / International Research Foundation / Fraser Institute
Palestinian Territories2002 2005 2010 2013 2014 2015 2016
Summary Ratings (Rank) � 7.6 [8] 7.5 [8] 7.5 [7] Trend qRating [Data] Rating [Data] Rating [Data] Rating [Data] Rating [Data] Rating [Data] Rating [Data]
1. Size of Government 8.2 8.2 8.2 8.0
A. General government consumption spending 5.1 [22.5] 5.5 [21.2] 5.0 [23.0] 4.9 [23.3] 5.1 [22.7] 5.2 [22.2]
B. Transfers and subsidies as a percentage of GDP 9.5 [2.5] 9.7 [1.5] 9.7 [1.5] 9.7 [1.7] 9.7 [1.7]
C. Government enterprises and investment 8.0 8.0 8.0 7.0
D. Top marginal tax rate 10.0 [20] 10.0 [20] 10.0 [15] 10.0 [20] 10.0 [20] 10.0 [20]
2. Commercial, Economic Law & Property Rights 6.7 6.2 5.8 5.8 5.4
A. Military interference in rule of law and politics 5.8 5.0 4.2 4.2 4.2
B. Integrity of the legal system 5.8 5.0 4.2 4.2 3.3
C. Regulatory restrictions on the sale of real property 8.6 8.6 8.8 8.3 8.3 8.5 8.5
i. Number of procedures 7.0 7.0 6.5 6.5 7.0 7.0
ii. Time(days) 9.3 9.5 9.4 9.4 9.5 9.5
iii. Cost (% of property value) 9.6 9.8 9.0 9.0 9.0 9.0
D. Legal enforcement of contracts 6.0 6.0 6.4 6.4 6.4 6.4 5.8
i. Quality of judicial processes 3.2 3.2 3.2 3.0 3.0 1.5
ii. Time (days) 5.6 6.8 6.8 6.8 6.8 6.8
iii. Cost (% of claim) 9.3 9.3 9.3 9.3 9.3 9.0
3. Access to Sound Money 8.9 9.8 9.6 9.8
A. Money growth 9.8 [0.9] 9.2 [−4.0] 7.6 [11.9] 9.8 [0.8] 9.2 [4.2] 9.6 [2.2]
B. Standard deviation of inflation 8.7 [3.2] 9.7 [0.7] 9.7 [0.9] 9.7 [0.7]
C. Inflation: most recent year 9.2 [4.1] 9.3 [3.7] 9.7 [1.7] 9.7 [1.7] 9.7 [1.4]
D. Freedom to own foreign currency bank accounts 10.0 10.0 10.0 10.0
4. Freedom to Trade Internationally 9.4 8.9 8.2 7.8 7.7 8.0
A. Taxes on international trade 9.6 7.5 7.1 7.9 7.8 7.8
i. Revenue from trade taxes (% of trade sector) 8.7 [2.0] 8.7 [2.0] 8.7 [2.0] 8.5 [2.3] 8.5 [2.3]
ii. Mean tariff rate 9.6 [2.0] 9.5 [2.7] 8.7 [6.4] 9.1 [4.6] 9.1 [4.6] 9.1 [4.5]
iii. Standard deviation of tariff rates 4.4 [14.1] 3.8 [15.5] 6.0 [10.0] 5.8 [10.5] 5.9 [10.2]
B. Black market exchange rates 10.0 [0.0] 10.0 [0.0] 10.0 [0.0] 10.0 [0.0] 10.0 [0.0] 10.0 [0.0] 10.0 [0.0]
C. Capital controls 8.5 9.2 7.7 5.4 5.4 6.2
5. Regulation of Credit, Labor, and Business 5.6 5.6 6.1 6.1 6.1 6.2
A. Credit market regulations 5.8 5.8 7.5 8.1 8.1 8.3
i. Ownership of banks 10.0 10.0 10.0 10.0
ii. Foreign bank competition
iii. Interest rate controls/negative real interest rates 10.0 10.0 10.0 10.0 10.0 10.0
iv. Getting credit 1.7 1.7 2.5 4.4 4.4 5.0 5.0
a. Legal Rights Index 0.0 0.0 0.0 0.0 0.0
b. Credit Information Index 5.0 8.8 8.8 10.0 10.0
B. Labor market regulations 7.6 7.6 7.0 6.1 6.1 6.1
i. Difficulty of Hiring Index 6.7 6.7 6.7 3.3 3.3 3.3
ii. Rigidity of Hours Index 6.0 6.0 6.0 6.0 6.0 6.0
iii. Rigidity of dismissals 7.7 7.7 5.3 5.3 5.3 5.3
a. Difficulty of Firing Index 8.0 8.0 8.0 8.0 8.0
b. Firing costs (weeks of wages) 7.5 2.5 2.5 2.5 2.5
iv. Conscription 10.0 10.0 10.0 10.0 10.0 10.0
C. Business Regulations 3.4 3.4 3.9 4.1 4.1 4.1 4.0
i. Starting a business 6.7 6.7 7.7 8.2 8.2 8.2 8.1
a. Number of procedures 4.1 4.7 5.9 5.9 5.9 5.0
b. Duration (days) 5.5 7.7 7.9 7.9 7.9 7.9
c. Cost (% of income per capita) 9.0 8.9 9.0 9.0 9.0 9.4
d. Minimum capital (% of income per capita) 8.3 9.6 10.0 10.0 10.0 10.0
ii. Closing a business 0.0 0.0 0.0 0.0 0.0 0.0 0.0
a. Time (years)
b. Cost (% of estate)
c. Recovery rate (cents on the dollar) 0.0 0.0 0.0 0.0 0.0 0.0
Trend is based primarily on preliminary data for 2016. p = up; = unchanged, uncertain; q = down.
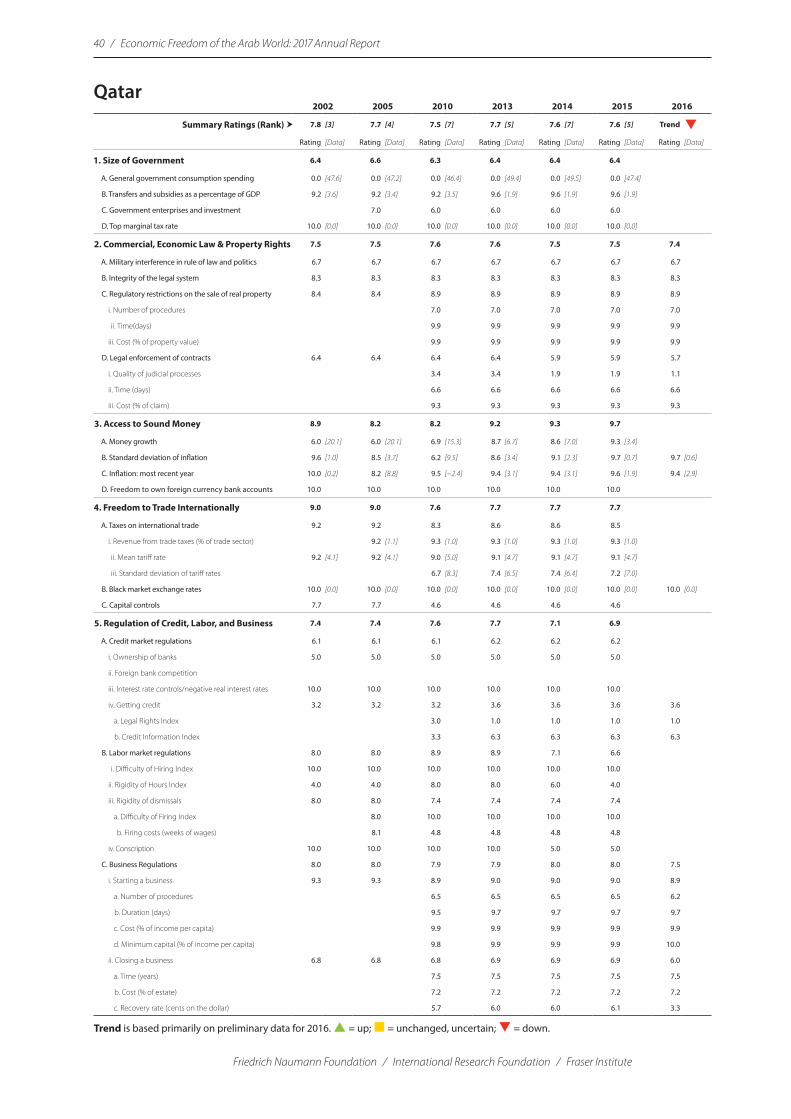
40 / Economic Freedom of the Arab World: 2017 Annual Report
Friedrich Naumann Foundation / International Research Foundation / Fraser Institute
Qatar2002 2005 2010 2013 2014 2015 2016
Summary Ratings (Rank) � 7.8 [3] 7.7 [4] 7.5 [7] 7.7 [5] 7.6 [7] 7.6 [5] Trend qRating [Data] Rating [Data] Rating [Data] Rating [Data] Rating [Data] Rating [Data] Rating [Data]
1. Size of Government 6.4 6.6 6.3 6.4 6.4 6.4
A. General government consumption spending 0.0 [47.6] 0.0 [47.2] 0.0 [46.4] 0.0 [49.4] 0.0 [49.5] 0.0 [47.4]
B. Transfers and subsidies as a percentage of GDP 9.2 [3.6] 9.2 [3.4] 9.2 [3.5] 9.6 [1.9] 9.6 [1.9] 9.6 [1.9]
C. Government enterprises and investment 7.0 6.0 6.0 6.0 6.0
D. Top marginal tax rate 10.0 [0.0] 10.0 [0.0] 10.0 [0.0] 10.0 [0.0] 10.0 [0.0] 10.0 [0.0]
2. Commercial, Economic Law & Property Rights 7.5 7.5 7.6 7.6 7.5 7.5 7.4
A. Military interference in rule of law and politics 6.7 6.7 6.7 6.7 6.7 6.7 6.7
B. Integrity of the legal system 8.3 8.3 8.3 8.3 8.3 8.3 8.3
C. Regulatory restrictions on the sale of real property 8.4 8.4 8.9 8.9 8.9 8.9 8.9
i. Number of procedures 7.0 7.0 7.0 7.0 7.0
ii. Time(days) 9.9 9.9 9.9 9.9 9.9
iii. Cost (% of property value) 9.9 9.9 9.9 9.9 9.9
D. Legal enforcement of contracts 6.4 6.4 6.4 6.4 5.9 5.9 5.7
i. Quality of judicial processes 3.4 3.4 1.9 1.9 1.1
ii. Time (days) 6.6 6.6 6.6 6.6 6.6
iii. Cost (% of claim) 9.3 9.3 9.3 9.3 9.3
3. Access to Sound Money 8.9 8.2 8.2 9.2 9.3 9.7
A. Money growth 6.0 [20.1] 6.0 [20.1] 6.9 [15.3] 8.7 [6.7] 8.6 [7.0] 9.3 [3.4]
B. Standard deviation of inflation 9.6 [1.0] 8.5 [3.7] 6.2 [9.5] 8.6 [3.4] 9.1 [2.3] 9.7 [0.7] 9.7 [0.6]
C. Inflation: most recent year 10.0 [0.2] 8.2 [8.8] 9.5 [−2.4] 9.4 [3.1] 9.4 [3.1] 9.6 [1.9] 9.4 [2.9]
D. Freedom to own foreign currency bank accounts 10.0 10.0 10.0 10.0 10.0 10.0
4. Freedom to Trade Internationally 9.0 9.0 7.6 7.7 7.7 7.7
A. Taxes on international trade 9.2 9.2 8.3 8.6 8.6 8.5
i. Revenue from trade taxes (% of trade sector) 9.2 [1.1] 9.3 [1.0] 9.3 [1.0] 9.3 [1.0] 9.3 [1.0]
ii. Mean tariff rate 9.2 [4.1] 9.2 [4.1] 9.0 [5.0] 9.1 [4.7] 9.1 [4.7] 9.1 [4.7]
iii. Standard deviation of tariff rates 6.7 [8.3] 7.4 [6.5] 7.4 [6.4] 7.2 [7.0]
B. Black market exchange rates 10.0 [0.0] 10.0 [0.0] 10.0 [0.0] 10.0 [0.0] 10.0 [0.0] 10.0 [0.0] 10.0 [0.0]
C. Capital controls 7.7 7.7 4.6 4.6 4.6 4.6
5. Regulation of Credit, Labor, and Business 7.4 7.4 7.6 7.7 7.1 6.9
A. Credit market regulations 6.1 6.1 6.1 6.2 6.2 6.2
i. Ownership of banks 5.0 5.0 5.0 5.0 5.0 5.0
ii. Foreign bank competition
iii. Interest rate controls/negative real interest rates 10.0 10.0 10.0 10.0 10.0 10.0
iv. Getting credit 3.2 3.2 3.2 3.6 3.6 3.6 3.6
a. Legal Rights Index 3.0 1.0 1.0 1.0 1.0
b. Credit Information Index 3.3 6.3 6.3 6.3 6.3
B. Labor market regulations 8.0 8.0 8.9 8.9 7.1 6.6
i. Difficulty of Hiring Index 10.0 10.0 10.0 10.0 10.0 10.0
ii. Rigidity of Hours Index 4.0 4.0 8.0 8.0 6.0 4.0
iii. Rigidity of dismissals 8.0 8.0 7.4 7.4 7.4 7.4
a. Difficulty of Firing Index 8.0 10.0 10.0 10.0 10.0
b. Firing costs (weeks of wages) 8.1 4.8 4.8 4.8 4.8
iv. Conscription 10.0 10.0 10.0 10.0 5.0 5.0
C. Business Regulations 8.0 8.0 7.9 7.9 8.0 8.0 7.5
i. Starting a business 9.3 9.3 8.9 9.0 9.0 9.0 8.9
a. Number of procedures 6.5 6.5 6.5 6.5 6.2
b. Duration (days) 9.5 9.7 9.7 9.7 9.7
c. Cost (% of income per capita) 9.9 9.9 9.9 9.9 9.9
d. Minimum capital (% of income per capita) 9.8 9.9 9.9 9.9 10.0
ii. Closing a business 6.8 6.8 6.8 6.9 6.9 6.9 6.0
a. Time (years) 7.5 7.5 7.5 7.5 7.5
b. Cost (% of estate) 7.2 7.2 7.2 7.2 7.2
c. Recovery rate (cents on the dollar) 5.7 6.0 6.0 6.1 3.3
Trend is based primarily on preliminary data for 2016. p = up; = unchanged, uncertain; q = down.
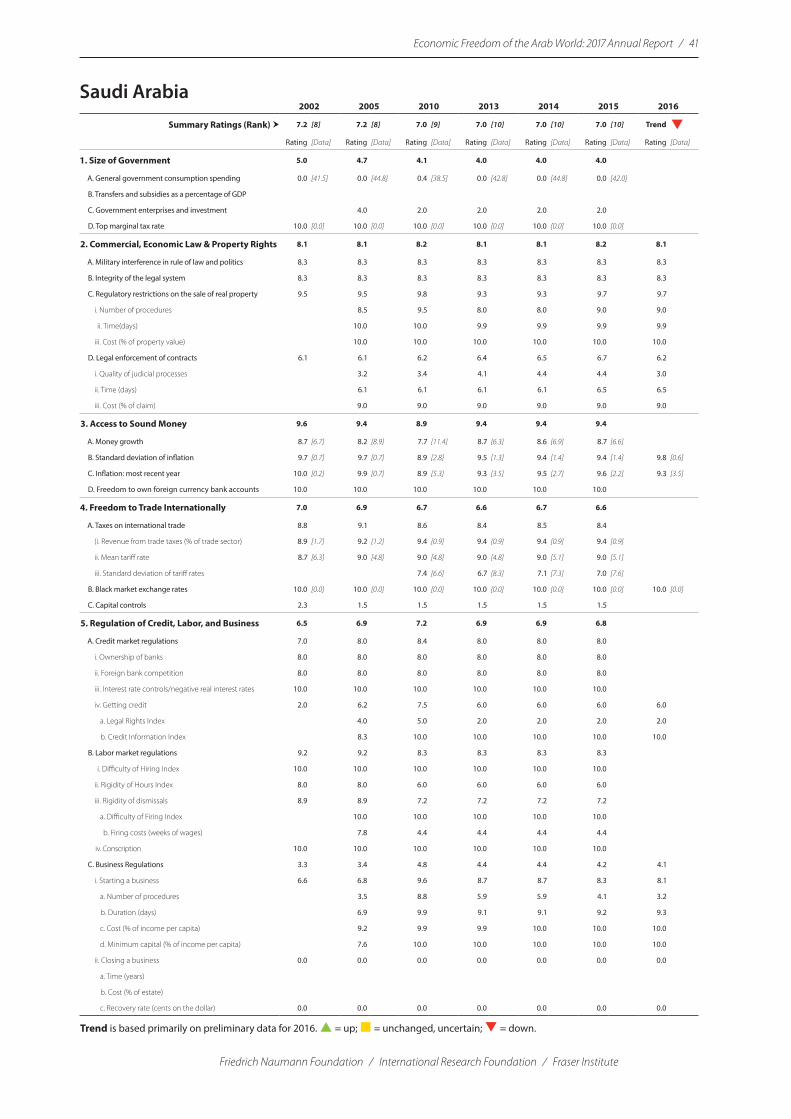
Economic Freedom of the Arab World: 2017 Annual Report / 41
Friedrich Naumann Foundation / International Research Foundation / Fraser Institute
Saudi Arabia2002 2005 2010 2013 2014 2015 2016
Summary Ratings (Rank) � 7.2 [8] 7.2 [8] 7.0 [9] 7.0 [10] 7.0 [10] 7.0 [10] Trend qRating [Data] Rating [Data] Rating [Data] Rating [Data] Rating [Data] Rating [Data] Rating [Data]
1. Size of Government 5.0 4.7 4.1 4.0 4.0 4.0
A. General government consumption spending 0.0 [41.5] 0.0 [44.8] 0.4 [38.5] 0.0 [42.8] 0.0 [44.8] 0.0 [42.0]
B. Transfers and subsidies as a percentage of GDP
C. Government enterprises and investment 4.0 2.0 2.0 2.0 2.0
D. Top marginal tax rate 10.0 [0.0] 10.0 [0.0] 10.0 [0.0] 10.0 [0.0] 10.0 [0.0] 10.0 [0.0]
2. Commercial, Economic Law & Property Rights 8.1 8.1 8.2 8.1 8.1 8.2 8.1
A. Military interference in rule of law and politics 8.3 8.3 8.3 8.3 8.3 8.3 8.3
B. Integrity of the legal system 8.3 8.3 8.3 8.3 8.3 8.3 8.3
C. Regulatory restrictions on the sale of real property 9.5 9.5 9.8 9.3 9.3 9.7 9.7
i. Number of procedures 8.5 9.5 8.0 8.0 9.0 9.0
ii. Time(days) 10.0 10.0 9.9 9.9 9.9 9.9
iii. Cost (% of property value) 10.0 10.0 10.0 10.0 10.0 10.0
D. Legal enforcement of contracts 6.1 6.1 6.2 6.4 6.5 6.7 6.2
i. Quality of judicial processes 3.2 3.4 4.1 4.4 4.4 3.0
ii. Time (days) 6.1 6.1 6.1 6.1 6.5 6.5
iii. Cost (% of claim) 9.0 9.0 9.0 9.0 9.0 9.0
3. Access to Sound Money 9.6 9.4 8.9 9.4 9.4 9.4
A. Money growth 8.7 [6.7] 8.2 [8.9] 7.7 [11.4] 8.7 [6.3] 8.6 [6.9] 8.7 [6.6]
B. Standard deviation of inflation 9.7 [0.7] 9.7 [0.7] 8.9 [2.8] 9.5 [1.3] 9.4 [1.4] 9.4 [1.4] 9.8 [0.6]
C. Inflation: most recent year 10.0 [0.2] 9.9 [0.7] 8.9 [5.3] 9.3 [3.5] 9.5 [2.7] 9.6 [2.2] 9.3 [3.5]
D. Freedom to own foreign currency bank accounts 10.0 10.0 10.0 10.0 10.0 10.0
4. Freedom to Trade Internationally 7.0 6.9 6.7 6.6 6.7 6.6
A. Taxes on international trade 8.8 9.1 8.6 8.4 8.5 8.4
(i. Revenue from trade taxes (% of trade sector) 8.9 [1.7] 9.2 [1.2] 9.4 [0.9] 9.4 [0.9] 9.4 [0.9] 9.4 [0.9]
ii. Mean tariff rate 8.7 [6.3] 9.0 [4.8] 9.0 [4.8] 9.0 [4.8] 9.0 [5.1] 9.0 [5.1]
iii. Standard deviation of tariff rates 7.4 [6.6] 6.7 [8.3] 7.1 [7.3] 7.0 [7.6]
B. Black market exchange rates 10.0 [0.0] 10.0 [0.0] 10.0 [0.0] 10.0 [0.0] 10.0 [0.0] 10.0 [0.0] 10.0 [0.0]
C. Capital controls 2.3 1.5 1.5 1.5 1.5 1.5
5. Regulation of Credit, Labor, and Business 6.5 6.9 7.2 6.9 6.9 6.8
A. Credit market regulations 7.0 8.0 8.4 8.0 8.0 8.0
i. Ownership of banks 8.0 8.0 8.0 8.0 8.0 8.0
ii. Foreign bank competition 8.0 8.0 8.0 8.0 8.0 8.0
iii. Interest rate controls/negative real interest rates 10.0 10.0 10.0 10.0 10.0 10.0
iv. Getting credit 2.0 6.2 7.5 6.0 6.0 6.0 6.0
a. Legal Rights Index 4.0 5.0 2.0 2.0 2.0 2.0
b. Credit Information Index 8.3 10.0 10.0 10.0 10.0 10.0
B. Labor market regulations 9.2 9.2 8.3 8.3 8.3 8.3
i. Difficulty of Hiring Index 10.0 10.0 10.0 10.0 10.0 10.0
ii. Rigidity of Hours Index 8.0 8.0 6.0 6.0 6.0 6.0
iii. Rigidity of dismissals 8.9 8.9 7.2 7.2 7.2 7.2
a. Difficulty of Firing Index 10.0 10.0 10.0 10.0 10.0
b. Firing costs (weeks of wages) 7.8 4.4 4.4 4.4 4.4
iv. Conscription 10.0 10.0 10.0 10.0 10.0 10.0
C. Business Regulations 3.3 3.4 4.8 4.4 4.4 4.2 4.1
i. Starting a business 6.6 6.8 9.6 8.7 8.7 8.3 8.1
a. Number of procedures 3.5 8.8 5.9 5.9 4.1 3.2
b. Duration (days) 6.9 9.9 9.1 9.1 9.2 9.3
c. Cost (% of income per capita) 9.2 9.9 9.9 10.0 10.0 10.0
d. Minimum capital (% of income per capita) 7.6 10.0 10.0 10.0 10.0 10.0
ii. Closing a business 0.0 0.0 0.0 0.0 0.0 0.0 0.0
a. Time (years)
b. Cost (% of estate)
c. Recovery rate (cents on the dollar) 0.0 0.0 0.0 0.0 0.0 0.0 0.0
Trend is based primarily on preliminary data for 2016. p = up; = unchanged, uncertain; q = down.

42 / Economic Freedom of the Arab World: 2017 Annual Report
Friedrich Naumann Foundation / International Research Foundation / Fraser Institute
Somalia2002 2005 2010 2013 2014 2015 2016
Summary Ratings (Rank) � 7.1 [9] Trend Rating [Data] Rating [Data] Rating [Data] Rating [Data] Rating [Data] Rating [Data] Rating [Data]
1. Size of Government 8.5 8.5 8.5
A. General government consumption spending 10.0 [3.7] 10.0 [5.1] 10.0 [4.9]
B. Transfers and subsidies as a percentage of GDP
C. Government enterprises and investment
D. Top marginal tax rate 7.0 [35] 7.0 [35] 7.0 [35] 7.0 [35]
2. Commercial, Economic Law & Property Rights 2.5 1.3 1.3 1.3 1.3 4.2 4.2
A. Military interference in rule of law and politics 1.7 1.7 1.7 1.7 1.7 1.7 1.7
B. Integrity of the legal system 3.3 0.8 0.8 0.8 0.8 0.8 0.8
C. Regulatory restrictions on the sale of real property 8.5 8.5
i. Number of procedures 8.0 8.0
ii. Time(days) 8.0 8.0
iii. Cost (% of property value) 9.5 9.5
D. Legal enforcement of contracts 5.9 5.9
i. Quality of judicial processes 1.9 1.9
ii. Time (days) 6.5 6.5
iii. Cost (% of claim) 9.3 9.3
3. Access to Sound Money 9.6 9.9 7.4
A. Money growth
B. Standard deviation of inflation
C. Inflation: most recent year 9.1 [4.5] 9.7 [1.3] 9.7 [1.4]
D. Freedom to own foreign currency bank accounts 0.0 0.0 10.0 10.0 10.0 5.0
4. Freedom to Trade Internationally 5.0 5.0 5.0 6.3 9.6 9.7
A. Taxes on international trade 8.9 8.9 9.0
i. Revenue from trade taxes (% of trade sector) 8.9 [1.6] 8.9 [1.7] 9.0 [1.6]
ii. Mean tariff rate
iii. Standard deviation of tariff rates
B. Black market exchange rates 10.0 [0.0] 10.0 [0.0] 0.0 [371.5] 0.0 [267.5] 10.0 [0.0] 10.0 [0.0] 10.0 [0.0]
C. Capital controls 0.0 0.0 10.0 10.0 10.0 10.0
5. Regulation of Credit, Labor, and Business 5.8
A. Credit market regulations 5.0
i. Ownership of banks 10.0 10.0 10.0
ii. Foreign bank competition
iii. Interest rate controls/negative real interest rates
iv. Getting credit 0.0 0.0
a. Legal Rights Index 0.0 0.0
b. Credit Information Index 0.0 0.0
B. Labor market regulations 8.6
i. Difficulty of Hiring Index 10.0
ii. Rigidity of Hours Index 8.0
iii. Rigidity of dismissals 6.3
a. Difficulty of Firing Index 10.0
b. Firing costs (weeks of wages) 2.5
iv. Conscription 10.0 10.0 10.0 10.0 10.0 10.0
C. Business Regulations 3.8 3.8
i. Starting a business 7.6 7.6
a. Number of procedures 5.9 5.9
b. Duration (days) 6.6 6.6
c. Cost (% of income per capita) 7.9 7.9
d. Minimum capital (% of income per capita) 10.0 10.0
ii. Closing a business 0.0 0.0
a. Time (years)
b. Cost (% of estate)
c. Recovery rate (cents on the dollar) 0.0 0.0
Trend is based primarily on preliminary data for 2016. p = up; = unchanged, uncertain; q = down.

Economic Freedom of the Arab World: 2017 Annual Report / 43
Friedrich Naumann Foundation / International Research Foundation / Fraser Institute
Sudan2002 2005 2010 2013 2014 2015 2016
Summary Ratings (Rank) � 5.8 [15] 6.3 [14] 5.9 [16] 6.1 [16] 6.1 [18] Trend qRating [Data] Rating [Data] Rating [Data] Rating [Data] Rating [Data] Rating [Data] Rating [Data]
1. Size of Government 6.9 7.8 9.7 9.8 10.0
A. General government consumption spending 7.8 [13.5] 6.8 [17.0] 7.5 [14.3] 9.1 [9.1] 9.5 [7.8] 10.0 [5.8]
B. Transfers and subsidies as a percentage of GDP
C. Government enterprises and investment 7.0 8.0 10.0 10.0 10.0
D. Top marginal tax rate 10.0 [15] 10.0 [15] 10.0 [15]
2. Commercial, Economic Law & Property Rights 4.7 4.5 4.5 4.5 4.6 4.6 4.5
A. Military interference in rule of law and politics 0.0 0.0 0.0 0.0 0.0 0.0 0.0
B. Integrity of the legal system 5.0 4.2 4.2 4.2 4.2 4.2 4.2
C. Regulatory restrictions on the sale of real property 8.8 8.8 8.8 8.8 8.8 8.9 8.9
i. Number of procedures 7.5 7.5 7.5 7.5 7.5 7.5
ii. Time(days) 9.9 9.9 9.9 9.9 9.9 9.9
iii. Cost (% of property value) 8.8 9.0 9.1 9.1 9.2 9.2
D. Legal enforcement of contracts 5.0 5.0 5.1 5.1 5.3 5.3 5.1
i. Quality of judicial processes 0.9 1.1 1.1 1.9 1.9 1.1
ii. Time (days) 4.8 4.8 4.8 4.8 4.8 4.8
iii. Cost (% of claim) 9.4 9.4 9.4 9.4 9.4 9.4
3. Access to Sound Money 6.6 6.9 7.1 5.2 5.0 6.2
A. Money growth 5.3 [23.6] 4.9 [25.7] 7.1 [14.5] 6.2 [19.0] 6.5 [17.7] 6.6 [16.9]
B. Standard deviation of inflation 7.8 [5.4] 9.4 [1.5] 8.7 [3.1] 5.6 [11.1] 5.9 [10.3] 6.4 [9.0]
C. Inflation: most recent year 8.3 [8.3] 8.3 [8.5] 7.4 [13.2] 4.0 [30.0] 2.6 [36.9] 6.6 [16.9]
D. Freedom to own foreign currency bank accounts 5.0 5.0 5.0 5.0 5.0 5.0
4. Freedom to Trade Internationally 5.7 5.8 7.2 4.5 5.4 3.6
A. Taxes on international trade 5.2 5.7 5.5 4.6 4.6 4.6
i. Revenue from trade taxes (% of trade sector) 4.7 [8.0] 5.6 [6.6] 6.6 [5.1] 4.4 [8.5] 4.4 [8.5] 4.4 [8.5]
ii. Mean tariff rate 5.8 [21.1] 5.8 [21.1] 6.0 [19.9] 5.8 [21.2] 5.8 [21.2] 5.8 [21.2]
iii. Standard deviation of tariff rates 4.0 [15.1] 3.6 [15.9] 3.6 [15.9] 3.6 [15.9]
B. Black market exchange rates 10.0 [0.0] 10.0 [0.0] 10.0 [0.0] 2.7 [36.6] 5.4 [23.0] 0.0 [63.9] 0.0 [148.8]
C. Capital controls 1.8 1.8 6.2 6.2 6.2 6.2
5. Regulation of Credit, Labor, and Business 4.6 5.0 4.9 5.8 5.7 6.0
A. Credit market regulations 4.5 5.9 5.9 4.9 4.9 5.6
i. Ownership of banks 8.0 8.0 8.0 8.0 8.0 8.0
ii. Foreign bank competition 3.0 3.0 3.0 3.0 3.0 3.0
iii. Interest rate controls/negative real interest rates 10.0 10.0 7.0 7.0 10.0
iv. Getting credit 2.5 2.5 2.5 1.5 1.5 1.5 1.5
a. Legal Rights Index 5.0 5.0 3.0 3.0 3.0 3.0
b. Credit Information Index 0.0 0.0 0.0 0.0 0.0 0.0
B. Labor market regulations 5.2 5.0 4.7 5.1 4.9 4.9
i. Difficulty of Hiring Index 6.1 6.1 7.2 8.3 7.2 7.2
ii. Rigidity of Hours Index 8.0 8.0 8.0 8.0 8.0 8.0
iii. Rigidity of dismissals 5.9 5.9 3.8 4.3 4.3 4.3
a. Difficulty of Firing Index 5.0 5.0 6.0 6.0 6.0
b. Firing costs (weeks of wages) 6.7 2.5 2.5 2.5 2.5
iv. Conscription 1.0 0.0 0.0 0.0 0.0 0.0
C. Business Regulations 4.1 4.1 4.2 7.4 7.4 7.4 7.3
i. Starting a business 8.2 8.2 8.3 8.3 8.3 8.4 8.2
a. Number of procedures 5.3 5.3 5.3 5.3 5.3 5.0
b. Duration (days) 8.2 8.3 8.3 8.3 8.3 8.3
c. Cost (% of income per capita) 9.2 9.6 9.8 9.7 9.8 9.7
d. Minimum capital (% of income per capita) 10.0 10.0 10.0 10.0 10.0 10.0
ii. Closing a business 0.0 0.0 0.0 6.5 6.4 6.4 6.4
a. Time (years) 8.3 8.3 8.3 8.3
b. Cost (% of estate) 7.5 7.5 7.5 7.5
c. Recovery rate (cents on the dollar) 0.0 0.0 3.6 3.4 3.4 3.4
Trend is based primarily on preliminary data for 2016. p = up; = unchanged, uncertain; q = down.

44 / Economic Freedom of the Arab World: 2017 Annual Report
Friedrich Naumann Foundation / International Research Foundation / Fraser Institute
Syrian Arab Republic2002 2005 2010 2013 2014 2015 2016
Summary Ratings (Rank) � 5.5 [15] 5.7 [16] 6.1 [16] 4.8 [21] 5.1 [21] 4.6 [22] Trend qRating [Data] Rating [Data] Rating [Data] Rating [Data] Rating [Data] Rating [Data] Rating [Data]
1. Size of Government 4.9 5.6 7.0 6.7 6.7 6.7
A. General government consumption spending 6.8 [17.0] 6.9 [16.6] 8.1 [12.4] 6.8 [16.8] 6.8 [16.8] 6.8 [16.8]
B. Transfers and subsidies as a percentage of GDP 9.0 [4.3] 9.0 [4.3] 9.0 [4.3] 9.0 [4.3]
C. Government enterprises and investment 0.0 2.0 2.0 2.0 2.0 2.0
D. Top marginal tax rate 8.0 [27.5] 8.0 [27.5] 9.0 [22] 9.0 [22] 9.0 [22] 9.0 [22]
2. Commercial, Economic Law & Property Rights 5.6 5.6 5.7 5.5 5.6 5.6 5.5
A. Military interference in rule of law and politics 3.3 3.3 3.3 3.3 3.3 3.3 3.3
B. Integrity of the legal system 8.3 8.3 8.3 7.5 7.5 7.5 7.5
C. Regulatory restrictions on the sale of real property 6.1 6.1 6.4 6.4 6.3 6.3 6.2
i. Number of procedures 8.5 8.5 8.5 8.5 8.5 8.5
ii. Time(days) 9.7 9.8 9.8 9.8 9.8 9.5
iii. Cost (% of property value) 0.0 0.8 0.9 0.7 0.7 0.7
D. Legal enforcement of contracts 4.7 4.7 4.7 4.7 5.2 5.2 4.9
i. Quality of judicial processes 0.7 0.7 0.7 2.2 2.2 1.5
ii. Time (days) 4.3 4.3 4.3 4.3 4.3 4.3
iii. Cost (% of claim) 8.9 8.9 8.9 8.9 8.9 8.9
3. Access to Sound Money 7.8 6.3 6.3 3.3 3.3 3.3
A. Money growth 7.4 [12.8] 7.9 [10.7] 8.3 [8.5]
B. Standard deviation of inflation 8.9 [2.8] 8.9 [2.8] 7.8 [5.4] 0.0 [117.3] 0.0 [166.0] 0.0 [194.6] 0.0 [243.7]
C. Inflation: most recent year 10.0 [−0.1] 8.6 [7.2] 9.1 [4.4] 0.0 [274.3] 0.0 [354.4] 0.0 [481.9] 0.0 [693.5]
D. Freedom to own foreign currency bank accounts 5.0 0.0 0.0 10.0 10.0 10.0
4. Freedom to Trade Internationally 3.5 5.5 5.7 3.1 4.6 2.0
A. Taxes on international trade 5.2 5.4 6.2 5.2 5.2 5.2
(i. Revenue from trade taxes (% of trade sector) 7.6 [3.7] 8.3 [2.5] 8.4 [2.5] 8.4 [2.5] 8.4 [2.5] 8.4 [2.5]
ii. Mean tariff rate 6.1 [19.6] 6.1 [19.6] 7.2 [14.2] 6.7 [16.5] 6.7 [16.5] 6.7 [16.5]
iii. Standard deviation of tariff rates 1.9 [20.3] 1.9 [20.3] 3.2 [17.0] 0.6 [23.4] 0.6 [23.4] 0.6 [23.4]
B. Black market exchange rates 5.3 [23.5] 10.0 [0.0] 10.0 [0.0] 3.2 [34.1] 7.9 [10.7] 0.0 [77.7] 0.0 [142.7]
C. Capital controls 0.0 1.0 0.8 0.8 0.8 0.8
5. Regulation of Credit, Labor, and Business 5.5 5.3 5.7 5.7 5.5 5.6
A. Credit market regulations 5.3 4.8 4.7 4.2 3.9 4.2
i. Ownership of banks 2.0 2.0 2.0 2.0
ii. Foreign bank competition 6.0 6.0 6.0
iii. Interest rate controls/negative real interest rates 10.0 9.0 10.0 7.0 6.0 7.0
iv. Getting credit 0.5 0.5 2.2 1.8 1.8 1.8 1.8
a. Legal Rights Index 1.0 1.0 1.0 1.0 1.0 1.0
b. Credit Information Index 0.0 3.3 2.5 2.5 2.5 2.5
B. Labor market regulations 5.6 5.3 5.0 5.3 5.0 5.3
i. Difficulty of Hiring Index 10.0 8.9 6.1 7.2 6.1 7.2
ii. Rigidity of Hours Index 6.0 6.0 6.0 6.0 6.0 6.0
iii. Rigidity of dismissals 6.4 6.4 8.0 8.0 8.0 8.0
a. Difficulty of Firing Index 5.0 6.0 6.0 6.0 6.0
b. Firing costs (weeks of wages) 7.8 10.0 10.0 10.0 10.0
iv. Conscription 0.0 0.0 0.0 0.0 0.0 0.0
C. Business Regulations 5.7 5.7 7.4 7.5 7.5 7.2 7.1
i. Starting a business 5.4 5.4 8.8 9.0 9.0 9.0 8.9
a. Number of procedures 4.1 7.1 7.1 7.1 7.1 6.8
b. Duration (days) 8.0 9.5 9.5 9.5 9.5 9.3
c. Cost (% of income per capita) 9.6 9.5 9.9 9.8 9.9 9.9
d. Minimum capital (% of income per capita) 0.0 9.3 9.6 9.5 9.8 9.8
ii. Closing a business 6.0 6.0 6.0 6.0 6.0 5.4 5.2
a. Time (years) 6.1 6.1 6.1 6.1 6.1 6.1
b. Cost (% of estate) 8.9 8.9 8.9 8.9 8.0 8.0
c. Recovery rate (cents on the dollar) 3.1 3.0 2.8 2.9 1.9 1.4
Trend is based primarily on preliminary data for 2016. p = up; = unchanged, uncertain; q = down.

Economic Freedom of the Arab World: 2017 Annual Report / 45
Friedrich Naumann Foundation / International Research Foundation / Fraser Institute
Tunisia2002 2005 2010 2013 2014 2015 2016
Summary Ratings (Rank) � 6.3 [13] 6.4 [12] 6.7 [11] 6.8 [11] 6.8 [11] 6.7 [12] Trend Rating [Data] Rating [Data] Rating [Data] Rating [Data] Rating [Data] Rating [Data] Rating [Data]
1. Size of Government 5.6 5.5 6.7 6.3 6.5 6.5
A. General government consumption spending 5.4 [21.5] 5.4 [21.5] 5.6 [20.9] 5.2 [22.2] 5.5 [21.5] 5.5 [21.4]
B. Transfers and subsidies as a percentage of GDP 8.1 [7.5] 7.4 [10.0] 7.0 [11.5] 6.1 [14.6] 6.4 [13.7] 6.4 [13.7]
C. Government enterprises and investment 2.0 2.0 7.0 7.0 7.0 7.0
D. Top marginal tax rate 7.0 [35] 7.0 [35] 7.0 [35] 7.0 [35] 7.0 [35] 7.0 [35]
2. Commercial, Economic Law & Property Rights 7.6 7.6 7.6 7.6 7.6 7.6 7.6
A. Military interference in rule of law and politics 6.7 6.7 6.7 6.7 6.7 6.7 6.7
B. Integrity of the legal system 8.3 8.3 8.3 8.3 8.3 8.3 8.3
C. Regulatory restrictions on the sale of real property 8.7 8.7 8.7 8.7 8.7 8.7 8.7
i. Number of procedures 8.5 8.5 8.5 8.5 8.5 8.5
ii. Time(days) 9.5 9.6 9.6 9.6 9.6 9.6
iii. Cost (% of property value) 8.0 8.0 8.0 8.0 8.0 8.0
D. Legal enforcement of contracts 6.7 6.7 6.7 6.7 6.5 6.5 6.5
i. Quality of judicial processes 4.3 4.3 4.3 3.7 3.7 3.7
ii. Time (days) 6.6 6.6 6.6 6.6 6.6 6.6
iii. Cost (% of claim) 9.3 9.3 9.3 9.3 9.3 9.3
3. Access to Sound Money 7.0 7.1 6.8 6.8 6.9 7.0
A. Money growth 8.7 [6.6] 9.2 [4.0] 8.3 [8.3] 8.8 [5.8] 9.0 [5.2] 9.1 [4.3]
B. Standard deviation of inflation 9.8 [0.4] 9.7 [0.7] 9.7 [0.7] 9.6 [1.0] 9.7 [0.8] 9.7 [0.8] 9.7 [0.8]
C. Inflation: most recent year 9.5 [2.7] 9.6 [2.0] 9.1 [4.4] 8.8 [5.8] 9.0 [4.9] 9.0 [4.9] 9.3 [3.7]
D. Freedom to own foreign currency bank accounts 0.0 0.0 0.0 0.0 0.0 0.0
4. Freedom to Trade Internationally 4.7 4.8 5.0 5.9 6.0 5.6
A. Taxes on international trade 5.7 4.4 6.9 7.0 7.2 7.0
i. Revenue from trade taxes (% of trade sector) 8.1 [2.8] 8.7 [2.0] 8.9 [1.7] 8.8 [1.8] 8.8 [1.8] 8.8 [1.8]
ii. Mean tariff rate 4.0 [30.2] 4.6 [26.8] 6.7 [16.5] 6.9 [15.5] 7.2 [14.1] 6.9 [15.5]
iii. Standard deviation of tariff rates 5.0 [12.6] 0.0 [26.0] 5.2 [12.1] 5.2 [12.1] 5.5 [11.1] 5.2 [12.1]
B. Black market exchange rates 7.8 [11.1] 9.3 [3.3] 7.4 [13.0] 10.0 [0.0] 10.0 [0.0] 9.0 [4.9] 9.0 [4.9]
C. Capital controls 0.8 0.8 0.8 0.8 0.8 0.8
5. Regulation of Credit, Labor, and Business 6.7 6.8 7.3 7.1 7.1 7.0
A. Credit market regulations 6.5 6.5 7.2 6.8 6.8 6.8
i. Ownership of banks 5.0 5.0 5.0 5.0 5.0 5.0
ii. Foreign bank competition 8.0 8.0 8.0 8.0 8.0 8.0
iii. Interest rate controls/negative real interest rates 10.0 10.0 10.0 10.0 10.0 10.0
iv. Getting credit 3.2 3.2 5.7 4.1 4.1 4.1 5.3
a. Legal Rights Index 3.0 3.0 2.0 2.0 2.0 3.0
b. Credit Information Index 3.3 8.3 6.3 6.3 6.3 7.5
B. Labor market regulations 5.5 5.5 6.5 6.1 6.1 5.8
i. Difficulty of Hiring Index 7.2 7.2 8.3 6.1 6.1 6.1
ii. Rigidity of Hours Index 6.0 6.0 10.0 10.0 10.0 10.0
iii. Rigidity of dismissals 5.8 5.8 4.9 5.4 5.4 4.3
a. Difficulty of Firing Index 2.0 2.0 3.0 3.0 3.0
b. Firing costs (weeks of wages) 9.5 7.8 7.8 7.8 5.5
iv. Conscription 3.0 3.0 3.0 3.0 3.0 3.0
C. Business Regulations 8.2 8.3 8.3 8.3 8.3 8.3 8.4
i. Starting a business 8.5 8.7 8.7 8.7 8.7 8.7 8.8
a. Number of procedures 5.3 5.3 5.3 5.3 5.3 5.9
b. Duration (days) 9.6 9.6 9.6 9.6 9.6 9.6
c. Cost (% of income per capita) 9.9 9.9 9.9 9.9 10.0 9.9
d. Minimum capital (% of income per capita) 9.9 10.0 10.0 10.0 10.0 10.0
ii. Closing a business 7.9 7.9 7.9 8.0 8.0 8.0 8.0
a. Time (years) 9.1 9.1 9.1 9.1 9.1 9.1
b. Cost (% of estate) 9.2 9.2 9.2 9.2 9.2 9.2
c. Recovery rate (cents on the dollar) 5.6 5.6 5.6 5.6 5.6 5.6
Trend is based primarily on preliminary data for 2016. p = up; = unchanged, uncertain; q = down.

46 / Economic Freedom of the Arab World: 2017 Annual Report
Friedrich Naumann Foundation / International Research Foundation / Fraser Institute
United Arab Emirates2002 2005 2010 2013 2014 2015 2016
Summary Ratings (Rank) � 7.8 [3] 8.0 [1] 8.0 [2] 8.1 [1] 8.0 [2] 8.0 [1] Trend Rating [Data] Rating [Data] Rating [Data] Rating [Data] Rating [Data] Rating [Data] Rating [Data]
1. Size of Government 6.8 8.0 7.7 7.0 7.0 6.9
A. General government consumption spending 7.6 [14.2] 8.2 [12.3] 7.2 [15.4] 5.2 [22.3] 5.5 [21.4] 5.1 [22.6]
B. Transfers and subsidies as a percentage of GDP 9.7 [1.6] 9.7 [1.6] 9.7 [1.6] 9.0 [4.2] 8.5 [5.9] 8.4 [6.5]
C. Government enterprises and investment 0.0 4.0 4.0 4.0 4.0 4.0
D. Top marginal tax rate 10.0 [0.0] 10.0 [0.0] 10.0 [0.0] 10.0 [0.0] 10.0 [0.0] 10.0 [0.0]
2. Commercial, Economic Law & Property Rights 7.5 7.5 7.7 7.7 8.2 8.3 8.2
A. Military interference in rule of law and politics 8.3 8.3 8.3 8.3 8.3 8.3 8.3
B. Integrity of the legal system 6.7 6.7 6.7 6.7 6.7 6.7 6.7
C. Regulatory restrictions on the sale of real property 9.4 9.4 9.8 9.8 9.8 9.8 9.8
i. Number of procedures 9.0 10.0 9.5 9.5 9.5 9.5
ii. Time(days) 9.9 10.0 9.9 10.0 10.0 10.0
iii. Cost (% of property value) 9.4 9.4 9.9 10.0 10.0 10.0
D. Legal enforcement of contracts 5.7 5.7 6.0 6.1 7.9 8.2 8.0
i. Quality of judicial processes 1.8 2.0 2.0 7.4 8.1 7.4
ii. Time (days) 6.3 6.8 6.9 6.9 7.1 7.1
iii. Cost (% of claim) 9.1 9.1 9.4 9.4 9.4 9.3
3. Access to Sound Money 9.2 8.7 8.6 9.7 9.5 9.4
A. Money growth 8.4 [8.0] 7.0 [14.9] 6.8 [16.1] 9.0 [4.9] 8.9 [5.5] 8.9 [5.4]
B. Standard deviation of inflation 9.0 [2.6] 9.0 [2.6] 7.8 [5.4] 9.9 [0.3] 9.7 [0.7] 9.4 [1.4]
C. Inflation: most recent year 9.4 [2.9] 8.8 [6.2] 9.8 [0.9] 9.8 [1.1] 9.5 [2.3] 9.2 [4.1]
D. Freedom to own foreign currency bank accounts 10.0 10.0 10.0 10.0 10.0 10.0
4. Freedom to Trade Internationally 8.4 8.3 8.2 8.2 8.2 8.2
A. Taxes on international trade 8.9 8.9 8.7 8.8 8.8 8.8
i. Revenue from trade taxes (% of trade sector) 10.0 [0.0] 10.0 [0.0] 10.0 [0.0] 10.0 [0.0] 10.0 [0.0] 10.0 [0.0]
ii. Mean tariff rate 9.2 [4.0] 9.0 [4.8] 9.0 [4.9] 9.1 [4.7] 9.1 [4.7] 9.1 [4.4]
iii. Standard deviation of tariff rates 7.6 [6.1] 7.6 [6.1] 7.0 [7.5] 7.4 [6.6] 7.4 [6.4] 7.2 [7.1]
B. Black market exchange rates 10.0 [0.0] 10.0 [0.0] 10.0 [0.0] 10.0 [0.0] 10.0 [0.0] 10.0 [0.0] 10.0 [0.0]
C. Capital controls 6.2 6.2 5.8 5.8 5.8 5.8
5. Regulation of Credit, Labor, and Business 7.2 7.3 7.6 7.9 7.1 7.1
A. Credit market regulations 6.7 6.7 7.3 6.9 7.1 7.1
i. Ownership of banks 5.0 5.0 5.0 5.0 5.0 5.0
ii. Foreign bank competition 8.0 8.0 8.0 8.0 8.0 8.0
iii. Interest rate controls/negative real interest rates 10.0 10.0 10.0 10.0 10.0 10.0
iv. Getting credit 3.7 3.7 6.2 4.8 5.4 5.4 5.4
a. Legal Rights Index 4.0 4.0 2.0 2.0 2.0 2.0
b. Credit Information Index 3.3 8.3 7.5 8.8 8.8 8.8
B. Labor market regulations 8.7 8.7 9.0 9.0 6.5 6.5
i. Difficulty of Hiring Index 10.0 10.0 10.0 10.0 10.0 10.0
ii. Rigidity of Hours Index 6.0 6.0 6.0 6.0 6.0 6.0
iii. Rigidity of dismissals 8.8 8.8 10.0 10.0 10.0 10.0
a. Difficulty of Firing Index 10.0 10.0 10.0 10.0 10.0
b. Firing costs (weeks of wages) 7.7 10.0 10.0 10.0 10.0
iv. Conscription 10.0 10.0 10.0 10.0 0.0 0.0
C. Business Regulations 6.4 6.4 6.5 7.6 7.6 7.6 7.7
i. Starting a business 8.6 8.6 8.9 9.3 9.3 9.3 9.5
a. Number of procedures 6.5 6.5 7.6 7.6 7.6 8.5
b. Duration (days) 9.3 9.4 9.7 9.7 9.7 9.7
c. Cost (% of income per capita) 9.6 9.9 9.9 9.9 9.9 9.8
d. Minimum capital (% of income per capita) 9.2 10.0 10.0 10.0 10.0 10.0
ii. Closing a business 4.1 4.2 4.1 5.9 5.9 5.9 5.9
a. Time (years) 5.1 5.1 7.1 7.1 7.1 7.1
b. Cost (% of estate) 6.1 6.1 7.5 7.5 7.5 7.5
c. Recovery rate (cents on the dollar) 1.3 1.2 3.2 3.1 3.1 3.1
Trend is based primarily on preliminary data for 2016. p = up; = unchanged, uncertain; q = down.

Economic Freedom of the Arab World: 2017 Annual Report / 47
Friedrich Naumann Foundation / International Research Foundation / Fraser Institute
Yemen, Republic of2002 2005 2010 2013 2014 2015 2016
Summary Ratings (Rank) � 6.9 [9] 7.0 [9] 7.3 [8] 7.5 [9] 7.5 [8] 6.8 [11] Trend qRating [Data] Rating [Data] Rating [Data] Rating [Data] Rating [Data] Rating [Data] Rating [Data]
1. Size of Government 5.2 5.4 6.7 7.7 7.8 7.3
A. General government consumption spending 6.5 [18.1] 7.1 [16.0] 8.0 [12.8] 7.9 [13.1] 8.1 [12.3] 8.3 [11.9]
B. Transfers and subsidies as a percentage of GDP 7.8 [8.7] 9.0 [4.1] 9.0 [4.1] 9.0 [4.1]
C. Government enterprises and investment 2.0 2.0 4.0 4.0 4.0 2.0
D. Top marginal tax rate 7.0 [35] 7.0 [35] 7.0 [35] 10.0 [20] 10.0 [20] 10.0 [20]
2. Commercial, Economic Law & Property Rights 6.4 6.4 6.5 6.1 5.9 5.5 5.5
A. Military interference in rule of law and politics 6.7 6.7 6.7 5.8 5.8 4.2 4.2
B. Integrity of the legal system 3.3 3.3 3.3 3.3 3.3 3.3 3.3
C. Regulatory restrictions on the sale of real property 8.7 8.7 8.7 8.7 8.9 8.9 8.9
i. Number of procedures 7.5 7.5 7.5 7.5 7.5 7.5
ii. Time(days) 9.8 9.8 9.8 9.8 9.8 9.8
iii. Cost (% of property value) 8.7 8.8 8.8 9.4 9.4 9.4
D. Legal enforcement of contracts 7.1 7.1 7.2 6.7 5.7 5.7 5.5
i. Quality of judicial processes 4.8 5.0 5.0 2.2 2.2 1.5
ii. Time (days) 7.0 7.0 6.0 6.0 6.0 6.0
iii. Cost (% of claim) 9.5 9.5 9.1 8.9 8.9 8.9
3. Access to Sound Money 8.4 8.7 8.3 8.5 8.8 6.3
A. Money growth 7.5 [12.4] 7.5 [12.3] 7.6 [11.9] 8.1 [9.6] 8.5 [7.5] 8.2 [9.1]
B. Standard deviation of inflation 8.6 [3.4] 9.7 [0.6] 8.0 [5.1] 8.0 [5.1] 8.2 [4.4] 4.8 [13.0]
C. Inflation: most recent year 7.6 [12.2] 7.6 [11.8] 7.8 [11.2] 7.8 [11.0] 8.4 [8.1] 2.1 [39.4]
D. Freedom to own foreign currency bank accounts 10.0 10.0 10.0 10.0 10.0 10.0
4. Freedom to Trade Internationally 8.4 8.7 8.5 8.4 8.3 8.3
A. Taxes on international trade 8.4 8.5 8.6 8.2 8.1 8.1
(i. Revenue from trade taxes (% of trade sector) 8.5 [2.3] 8.8"[1.9] 9.0 [1.5] 8.9 [1.6] 8.9 [1.6] 8.9 [1.6]
ii. Mean tariff rate 8.6 [7.1] 8.6 [7.1] 8.6 [7.1] 8.5 [7.5] 8.5 [7.5] 8.5 [7.5]
iii. Standard deviation of tariff rates 8.2 [4.5] 8.2 [4.5] 8.1 [4.7] 7.9 [5.3] 7.9 [5.3] 7.9 [5.3]
B. Black market exchange rates 10.0 [0.0] 10.0 [0.0] 10.0 [0.0] 10.0 [0.0] 10.0 [0.0] 10.0 [0.0] 10.0 [0.0]
C. Capital controls 6.9 7.7 6.9 6.9 6.9 6.9
5. Regulation of Credit, Labor, and Business 6.0 5.7 6.4 6.7 6.5 6.4
A. Credit market regulations 6.3 5.5 5.9 4.5 4.3 4.0
i. Ownership of banks 5.0 5.0 5.0 5.0
ii. Foreign bank competition 3.0 3.0 3.0
iii. Interest rate controls/negative real interest rates 10.0 10.0 10.0 10.0 9.0 8.0
iv. Getting credit 2.7 1.0 2.7 0.0 0.0 0.0 0.0
a. Legal Rights Index 2.0 2.0 0.0 0.0 0.0 0.0
b. Credit Information Index 0.0 3.3 0.0 0.0 0.0 0.0
B. Labor market regulations 5.4 5.4 5.4 7.9 7.9 7.9
i. Difficulty of Hiring Index 10.0 10.0 8.9 8.9 8.9 8.9
ii. Rigidity of Hours Index 4.0 4.0 8.0 8.0 8.0 8.0
iii. Rigidity of dismissals 7.8 7.8 4.8 4.8 4.8 4.8
a. Difficulty of Firing Index 6.0 7.0 7.0 7.0 7.0
b. Firing costs (weeks of wages) 9.5 2.5 2.5 2.5 2.5
iv. Conscription 0.0 0.0 0.0 10.0 10.0 10.0
C. Business Regulations 6.3 6.1 7.8 7.5 7.3 7.4 7.2
i. Starting a business 6.0 5.7 9.0 8.7 8.7 8.7 8.6
a. Number of procedures 4.1 7.6 7.6 7.6 7.6 7.4
b. Duration (days) 7.0 9.5 8.1 8.1 8.1 8.1
c. Cost (% of income per capita) 7.1 9.0 9.2 9.2 9.2 9.0
d. Minimum capital (% of income per capita) 4.7 10.0 10.0 10.0 10.0 10.0
ii. Closing a business 6.5 6.5 6.5 6.3 5.9 6.0 5.9
a. Time (years) 7.3 7.3 7.3 7.3 7.3 7.3
b. Cost (% of estate) 9.1 9.1 9.1 8.1 8.1 8.1
c. Recovery rate (cents on the dollar) 3.0 3.1 2.6 2.4 2.5 2.2
Trend is based primarily on preliminary data for 2016. p = up; = unchanged, uncertain; q = down.

48 / Economic Freedom of the Arab World: 2017 Annual Report
Friedrich Naumann Foundation / International Research Foundation / Fraser Institute
Appendix: Explanatory Notes and Data Sources
The index published in Economic Freedom of the Arab World was derived from 39 distinct pieces of data (“components”). The overall rating was computed by averaging the five areas and area scores were derived by averaging the compo-nents within each area. Economic freedom is measured on a scale from zero to 10 where a higher value indicates a greater degree of economic freedom.
Note that the minimums and maximums used to compute the individual scores were taken from Economic Freedom of the World instead of the 22 coun-tries included in the index. For those variables not used in Economic Freedom of the World, minimums and maximums were calculated using data for the coun-tries included in the Doing Business database (World Bank). We used “global” instead of regional minimums and maximums because some of the components show little variability among the Arab countries.
Area 1 Size of Government: Expenditures, Taxes, and Enterprises
A General government consumption spending as a percentage of total consumptionThis component measures general government final consumption expenditure as a percentage of final consumption expenditure (formerly known as total consumption). The rating for this component was derived using the following formula: (Vmax – Vi) / (Vmax – Vmin) multiplied by 10. Vi is the country’s actual government consumption as a proportion of final consumption, while Vmax and Vmin were the maximum and minimum values set to 40% and 6%, respectively. The 1990 data in Economic Freedom of the World were used to derive maximum and minimum value for this component. Nations with higher government expen-diture relative to final consumption receive lower scores.
Sources World Bank (2017), World Development Indicators 2015 (on-line); United Nations (2017), National Accounts Main Aggregates Database (on-line).
B Transfers and subsidies as a percentage of GDPThis component measures government subsidies and other transfers as a per-centage of GDP. The rating for this component was derived using the following formula: (Vmax – Vi) / (Vmax – Vmin) multiplied by 10. Vi is the country’s ratio of transfers and subsidies to GDP, while Vmax and Vmin were the maximum and
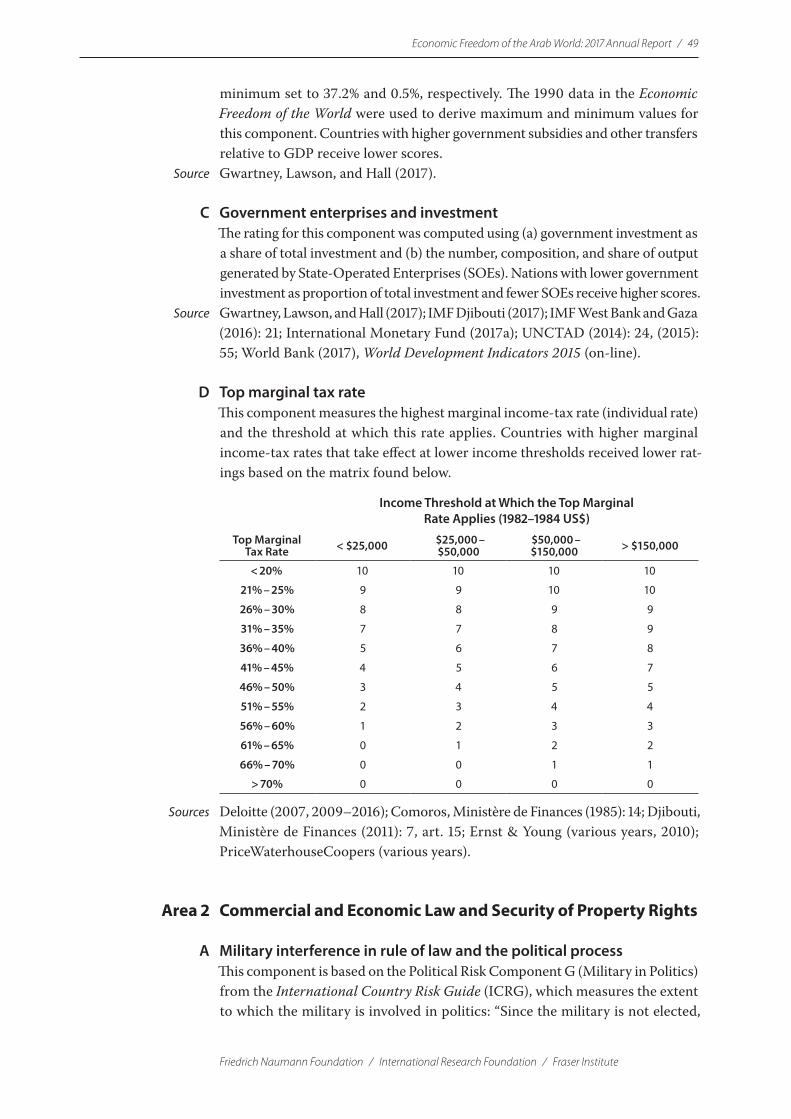
Economic Freedom of the Arab World: 2017 Annual Report / 49
Friedrich Naumann Foundation / International Research Foundation / Fraser Institute
minimum set to 37.2% and 0.5%, respectively. The 1990 data in the Economic Freedom of the World were used to derive maximum and minimum values for this component. Countries with higher government subsidies and other transfers relative to GDP receive lower scores.
Source Gwartney, Lawson, and Hall (2017).
C Government enterprises and investmentThe rating for this component was computed using (a) government investment as a share of total investment and (b) the number, composition, and share of output generated by State-Operated Enterprises (SOEs). Nations with lower government investment as proportion of total investment and fewer SOEs receive higher scores.
Source Gwartney, Lawson, and Hall (2017); IMF Djibouti (2017); IMF West Bank and Gaza (2016): 21; International Monetary Fund (2017a); UNCTAD (2014): 24, (2015): 55; World Bank (2017), World Development Indicators 2015 (on-line).
D Top marginal tax rateThis component measures the highest marginal income-tax rate (individual rate) and the threshold at which this rate applies. Countries with higher marginal income-tax rates that take effect at lower income thresholds received lower rat-ings based on the matrix found below.
Income Threshold at Which the Top Marginal Rate Applies (1982–1984 US$)
Top Marginal Tax Rate < $25,000 $25,000 –
$50,000$50,000 – $150,000 > $150,000
< 20% 10 10 10 10
21% – 25% 9 9 10 10
26% – 30% 8 8 9 9
31% – 35% 7 7 8 9
36% – 40% 5 6 7 8
41% – 45% 4 5 6 7
46% – 50% 3 4 5 5
51% – 55% 2 3 4 4
56% – 60% 1 2 3 3
61% – 65% 0 1 2 2
66% – 70% 0 0 1 1
> 70% 0 0 0 0
Sources Deloitte (2007, 2009–2016); Comoros, Ministère de Finances (1985): 14; Djibouti, Ministère de Finances (2011): 7, art. 15; Ernst & Young (various years, 2010); PriceWaterhouseCoopers (various years).
Area 2 Commercial and Economic Law and Security of Property Rights
A Military interference in rule of law and the political processThis component is based on the Political Risk Component G (Military in Politics) from the International Country Risk Guide (ICRG), which measures the extent to which the military is involved in politics: “Since the military is not elected,
50 / Economic Freedom of the Arab World: 2017 Annual Report
Friedrich Naumann Foundation / International Research Foundation / Fraser Institute
involvement, even at a peripheral level, diminishes democratic accountability. Military involvement might stem from an external or internal threat, be symp-tomatic of underlying difficulties, or be a full-scale military takeover. Over the long term, a system of military government will almost certainly diminish effec-tive governmental functioning, become corrupt, and create an uneasy environ-ment for foreign businesses”. The International Country Risk Guide measures military involvement on a scale from zero to 6 where a higher value indicates a lower potential risk. These values were then transformed into a zero-to-10 scale.
Source PRS Group (Various Years).
B Integrity of the legal systemThis component is based on the Political Risk Component I (Law and Order) from the International Country Risk Guide. Component I is based on “two mea-sures comprising one risk component. Each sub-component equals half of the total. The ‘law’ sub-component assesses the strength and impartiality of the legal system, and the ‘order’ sub-component assesses popular observance of the law”. The International Country Risk Guide measures law and order on a scale from zero to six, where a higher value indicates a lower potential risk. These values were then transformed into a zero-to-ten scale.
Source PRS Group (Various Years).
C Regulatory restrictions on the sale of real propertyThis component is based on the World Bank’s Doing Business dataset and it measures the steps, time, and cost involved in registering property. The World Bank uses “a standardized case of an entrepreneur who wants to purchase land and a building in the largest business city—already registered and free of title dispute”. The cost includes such items “as fees, transfer taxes, stamp duties, and any other payment to the property registry, notaries, public agencies or lawyers. The cost is expressed as a percentage of the property value, assuming a property value of 50 times income per capita”.
The rating for this component was derived using the following formula: (Vmax – Vi) / (Vmax – Vmin) multiplied by 10. Vi represents the steps, time, and cost as a percentage of property value. Vmax was set to 21.0 procedures, 956 days, and 30.4% and Vmin to 1.0 procedure, 1.0 day, and 0.1%. Nations with values that fall below Vmin received a score of 10 whereas those nations that have values above Vmax received a score of zero.
i number of procedures ii time (days) iii cost (% of property value)
Source World Bank (various years, 2004–2017), Doing Business database.
D Legal enforcement of contractsThis component is based on the World Bank’s Doing Business dataset. The compo-nent measures “the efficiency of contract enforcement by following the evolution of a sale of goods dispute and tracking the time, cost, and number of procedures involved from the moment the plaintiff files the lawsuit until actual payment”. The

Economic Freedom of the Arab World: 2017 Annual Report / 51
Friedrich Naumann Foundation / International Research Foundation / Fraser Institute
quality of judicial processes index, 2Di, is based on scores from 0 to 18. Scores for this index where derived using the following formula: (Vi– Vmin) / (Vmax – Vmin) multiplied by 10; Vmax = 15.5 and Vmin = 2.0. Nations with values that fall below Vmin received a score of 10 whereas those nations that have values above Vmax received a score of zero. The ratings for the sub-components 2Dii and 2Diii were derived using the following formula: (Vmax – Vi) / (Vmax – Vmin) multiplied by 10. Vi represents the time and cost as a percentage of debt. Vmax was set at 1,459.0 days and 227.3% and Vmin to 109.0 days and 5.5%.
i quality of judicial processes ii time (days) iii cost (% of claim)
Source World Bank (various years, 2004–2017), Doing Business database.
Area 3 Access to Sound Money
A Money growthThe M1 money supply figures were used to measure the growth rate of the money supply. This component measures the growth of the money supply in the last five years minus the annual growth of real GDP in the last 10 years. The rating for this component was derived using the following formula: (Vmax – Vi) / (Vmax – Vmin) multiplied by 10. Vi represents the average annual growth rate of the money sup-ply during the last five years adjusted for the growth of real GDP during the previ-ous 10 years. The values for Vmin and Vmax were set at zero and 50%, respectively. If money growth equals the long-term growth of real output (i.e., growth of real GDP in the last 10 years), then a nation gets a rating of 10. If the growth of the money supply is greater than the long-run growth in real output, a nation gets a score less than 10. Nations with a value greater than 50% receive a rating of zero.
Source World Bank (2017), World Development Indicators 2015 (on-line).
B Standard deviation of inflationThe Consumer Price Index (CPI) was used as the measure of inflation for this component. The following formula was used to determine the zero-to-10 scale rating for each country: (Vmax – Vi) / (Vmax – Vmin) multiplied by 10. Vi represents the country’s standard deviation of the annual rate of inflation during the last five years. The values for Vmin and Vmax were set at zero and 25%, respectively. If there is no variation in inflation rate over the past five years, a nation gets a score of 10. The higher the variability of inflation, the lower the rating a nation receives. Those nations that have a standard deviation greater than 25% get a score of zero.
Sources World Bank (2017), World Development Indicators 2017 (on-line); International Monetary Fund (2006–2017), World Economic and Financial Surveys. Regional Economic Outlook: Middle East and Central Asia; International Monetary Fund (2006–2017), World Economic and Financial Surveys. Regional Economic Outlook: Sub-Saharan Africa; International Monetary Fund (2017), International Financial Statistics; Economist Intelligence Unit (2017).

52 / Economic Freedom of the Arab World: 2017 Annual Report
Friedrich Naumann Foundation / International Research Foundation / Fraser Institute
C Inflation: Most recent yearThe Consumer Price Index (CPI) was used as the measure of inflation for this component. The zero-to-10 country ratings were derived by the following for-mula: (Vmax – Vi) / (Vmax – Vmin) multiplied by 10. Vi represents the rate of inflation during the most recent year. The values for Vmin and Vmax were set at zero and 50%, respectively. The lower the rate of inflation, the higher the rating. Those nations that have an inflation rate higher than 50% get a score of zero.
Sources World Bank (2017), World Development Indicators 2015 (on-line); International Monetary Fund (2006–2017), World Economic and Financial Surveys. Regional Economic Outlook: Middle East and Central Asia; International Monetary Fund (2006–2017), World Economic and Financial Surveys. Regional Economic Outlook: Sub-Saharan Africa (2017); International Monetary Fund (2017), Somalia; International Monetary Fund (2017), International Financial Statistics; Economist Intelligence Unit (2016).
D Freedom to own foreign-currency bank accounts If foreign bank accounts are allowed both domestically and abroad without any restrictions, a nation gets a score of 10. If foreign bank accounts are allowed domestically but not abroad, or vice versa, a nation gets a rating of 5.
Source International Monetary Fund (2004–2016), Annual Report on Exchange Arrangements and Exchange Restrictions.
Area 4 Freedom to Trade Internationally
A Taxes on international trade i Revenue from trade taxes (% of trade sector)
This sub-component measures taxes on international trade as a percentage of imports and exports. The zero-to-10 country ratings were derived by the follow-ing formula: (Vmax – Vi) / (Vmax – Vmin) multiplied by 10. Vi represents the revenue derived from taxes on international trade as a share of imports and exports. The values for Vmin and Vmax were set at zero and 15%, respectively. The greater the taxes on international trade as a share of exports and imports, the lower the score. Nations that have a value greater than 15% get a rating of zero.
Source Gwartney, Lawson, and Hall (2017); International Center for Tax Development (2017); Saudi Arabia, Ministry of Finance, Saudi Customs (2013); International Monetary Fund (2017), Somalia; Wahab al-Awdi, Yemen Customs Authority (2017): personal communication via e-mail, June 20; Central Bank of Libya (2016): 61; Comoros, Direction Générale des Douanes (2012).
ii Mean tariff rateThis sub-component measures the unweighted average of tariff rates. The zero-to-10 country ratings were derived by the following formula: (Vmax – Vi) / (Vmax – Vmin) multiplied by 10. Vi represents the country’s mean tariff rate. The values for Vmin and Vmax were set at zero and 50%, respectively. A higher mean tariff rate results in a lower rating. Nations with a mean tariff rate over 50% get a score of zero.

Economic Freedom of the Arab World: 2017 Annual Report / 53
Friedrich Naumann Foundation / International Research Foundation / Fraser Institute
Sources World Bank (various years, 2005–2017), World Development Indicators; World Trade Organization (various years 2006–2016); Gwartney, Lawson, and Hall (2017); Deloitte (2015), Guide to Fiscal Information: Key Economies in Africa 2014/15: 165; Deloitte (2015), Oil and Gas Taxation in Iraq.
iii Standard deviation of tariff ratesThis sub-component measures the standard deviation of tariff rates. The zero-to-10 country ratings were derived by the following formula: (Vmax – Vi) / (Vmax– Vmin) multiplied by 10. Vi represents the standard deviation of the country’s tariff rates. The values for Vmin and Vmax were set at zero and 25%, respectively. Countries with greater variation in their tariff rates get lower ratings. Nations with standard devia-tion of over 25% get a score of zero.
Sources Gwartney, Lawson, and Hall (2017); World Trade Organization (various years 2006–2016); Iraq, Ministry of Finance (2008); Deloitte, Guide to Fiscal Information: Key Economies in Africa 2014/15: 165.
B Black-market exchange ratesThis component measures the difference between the official rate and parallel black-market exchange rate. The zero-to-10 country ratings were derived by the following formula: (Vmax – Vi) / (Vmax – Vmin) multiplied by 10. Vi is the country’s black-market premium on the exchange rate. The values for Vmin and Vmax were set at zero and 50%, respectively. If there is no black-market exchange rate, a nation gets a score of 10. The greater the difference between the two rates, the lower the rating. Nations with a value greater than 50% get a score of zero.
Source Monetary Research (2003–2015). MRI Bankers’ Guide to Foreign Currency.
C Capital controlsThis component measures restrictions on capital transactions, looking at 13 types of international capital controls reported by the International Monetary Fund. The zero-to-10 country ratings were derived by computing the number of controls not levied as a percentage of the total number of controls, and then multiplying the result by 10.
Source International Monetary Fund (2004–2016). Annual Report on Exchange Arrangements and Exchange Restrictions.
Area 5 Regulation of Credit, Labor, and Business
A Credit market regulations i Ownership of banks
The rating for this sub-component is based on the percentage of bank deposits held in privately owned banks. When private deposits were between 95% and 100%, nations received a score of 10. When private deposits totaled between 75% and 95%, countries received a score of 8. When private deposits were between 40% and 75%, nations received a score of 5. When private deposits were between 10% and 40%, nations received a score of 2. Nations received a rating of zero if private deposits were less than 10% of total bank deposits.

54 / Economic Freedom of the Arab World: 2017 Annual Report
Friedrich Naumann Foundation / International Research Foundation / Fraser Institute
Sources Bankscope (2011); Banque centrale de Comores (2012, 2014); Banque centrale de Djibouti (2017); Banque centrale de Mauritanie (2017); Central Bank of Somalia (2017); Mialy Ranaivoson, Responsable investissement Océan Indien, Investisseurs & Partenaires (I&P) (2016): personal communication via e-mail (May 30); World Bank Group (2003, 2007, 2012).
ii Foreign bank competitionThis sub-component is based on two variables: percentage of banking assets held by foreign-owned banks and the number of applications for commercial bank-ing licenses from foreign entities denied as a percentage of the total number of applications for commercial banking licenses received from foreign entities. If a country approved all or most applications for licenses from foreign banks and foreign banks held a large share of the banking sector’s assets, then the country received a higher rating, according to table below.
Foreign Bank License Denial Rate (Denials/Applications)
0% 0%–49% 50%–100%
Foreign bank assets as a share of total banking
sector assets
80%–100% 10 8 5
40%–79% 9 7 4
0%–39% 8 6 3
Source World Bank Group (2003, 2007, 2012).
iii Interest rate controls/negative real interest ratesThis sub-component is based on two variables: real interest rate (i.e., lending interest rate minus inflation as measured by the Consumer Price Index) and the difference between the lending and deposit interest rates. When the real interest rate was positive and interest rates were determined primarily by market forces (i.e., the lending interest rate is less than 8% higher than the deposit interest rate), countries were given a rating of 10. When the real rates were sometimes slightly negative (less than 5%) and the differential between the deposit and lending rates was 8% or more, countries received a rating of 8. When the real lending interest rate was persistently negative by a single-digit amount and the differential between the lending and deposit interest rate was 16% or higher, nations received a score of 6. When the real rates were often negative by 10% or more and the lending and deposit interest rates differ by 24% or more, countries were assigned a rating of 4. When the real lending rate was persistently negative by a double-digit amount and the difference between the lending and deposit rate was 32% or more, countries received a rating of 2. A zero rating was assigned when the deposit and lending rates differ by 36% or more and real lending rates were persistently negative by double-digit amounts or hyperinflation had virtually eliminated the credit market.
Sources World Bank (various years, 2005–2017); Economist Intelligence Unit (2017).
iv Getting credit The following two sub-components are based on the Legal Rights Index and the Credit Information Index from the World Bank’s Doing Business dataset.

Economic Freedom of the Arab World: 2017 Annual Report / 55
Friedrich Naumann Foundation / International Research Foundation / Fraser Institute
a Legal Rights IndexThe “legal rights index measures the degree to which collateral and bankruptcy laws protect the rights of borrowers and lenders and thus facilitate lending. The index includes 7 aspects related to legal rights in collateral law and 3 aspects in bankruptcy law”. A score of 1 is assigned for each aspect of the index. “The index ranges from 0 to 10, with higher scores indicating that collateral and bankruptcy laws are better designed to expand access to credit”.
b Credit Information IndexThe “credit information index measures rules affecting the scope, accessibility and quality of credit information available through either public or private credit reg-istries”. A score of 1 is assigned for each of the six aspects of the index. “The index ranges from 0 to 6, with higher values indicating the availability of more credit information, from either a public registry or a private bureau, to facilitate lending decisions”. The values from zero to 6 were then transformed into a zero-to-10 scale.
Source World Bank (2004 to 2017), Doing Business database, <http://www.doingbusiness.org>.
B Labor market regulations i Difficulty of hiring
“The difficulty of hiring index measures (i) whether term contracts can be used only for temporary tasks; (ii) the maximum cumulative duration of term con-tracts; and (iii) the ratio of the minimum wage for a trainee or first-time employee to the average value added per worker.” The index is measured on a scale from 0 to 100 (where higher values indicate more rigid regulation), which was transformed into a zero-to-10 scale, where a higher value indicates more flexible regulation.
ii Rigidity of hours“The rigidity of hours index has 5 components: (i) whether night work is unre-stricted; (ii) whether weekend work is unrestricted; (iii) whether the workweek can consist of 5.5 days; (iv) whether the workweek can extend to 50 hours or more (including overtime) for 2 months a year; and (v) whether paid annual vacation is 21 working days or fewer.” For each of these questions, the answer “no” indicates more rigid regulation. The index is measured on a scale from 0 and 100 (where higher values indicate more rigid regulation), which was then transformed into a zero-to-10 scale, where a higher value indicates more flexible regulation.
iii Rigidity of dismissals a Difficulty of firing
“The difficulty of firing index has 8 components: (i) whether redundancy is dis-allowed as a basis for terminating workers; (ii) whether the employer needs to notify a third party (such as a government agency) to terminate one redundant worker; (iii) whether the employer needs to notify a third party to terminate a group of 25 redundant workers; (iv) whether the employer needs approval from a third party to terminate one redundant worker; (v) whether the employer needs approval from a third party to terminate a group of 25 redundant workers; (vi) whether the law requires the employer to consider reassignment or retraining options before redundancy termination; (vii) whether priority rules apply for
56 / Economic Freedom of the Arab World: 2017 Annual Report
Friedrich Naumann Foundation / International Research Foundation / Fraser Institute
redundancies; and (viii) whether priority rules apply for reemployment.” The index is measured on a scale from 0 to 100 (where higher values indicate more rigid regulation), which was transformed into a zero-to-10 scale, where a higher value indicates more flexible regulation.
b Firing costs (weeks of wages)This sub-component measures “the cost of advance notice requirements, sev-erance payments and penalties due when terminating a redundant worker, expressed in weeks of wages”. The rating for this component was equal to: (Vmax – Vi) / (Vmax – Vmin) multiplied by 10. Vi represents the cost of firing an employee. Vmax and Vmin were set to 57.91 weeks and 0.0 weeks, respectively. Nations with values that fall below Vmin received a score of 10 whereas those nations that have values above Vmax received a score of zero.
Source World Bank (2004 to 2017), Doing Business database, <http://www.doingbusiness.org>.
iv Conscription This sub-component measures the duration of military conscription. Nations without military conscription received a rating of 10. If the duration of conscrip-tion was six months or less, nations were given a score of 5. When the length of the conscription was more than 6 months but not more than 18 months, coun-tries were given a rating of 3. If the duration of conscription was more than 12 months but not more than 18 months, countries were given a score of 1. Nations with military conscription of over 18 months were given a score of zero.
Source Coalition to Stop the Use of Child Soldiers (2008); Child Soldiers International (2012); International Institute for Strategic Studies (2007–2016); War Resisters’ International (2017).
C Business regulations i Starting a business
This sub-component measures how easy it is to start a business. It looks at the number of procedures, the time it takes to go through these procedures, the costs (such as fees) of starting a business, and minimum capital requirement needed to formally start a business. The rating for this component was equal to: (Vmax – Vi) / (Vmax – Vmin) multiplied by 10. Vi represents the number of procedures, time (in days), cost as a percentage of income per capita, and minimum capital require-ment as a percentage of income per capita. Vmax was set to 19.0 procedures, 203.0 days, 835.4%, 5,111.9%; and Vmin to 2.0 procedures, 2.0 days, 0.0%, 0.0%. Nations with values that fall below Vmin received a score of 10 whereas those nations that have values above Vmax received a score of zero.
a number of procedures b duration (days) c cost (% of income per capita) d minimum capital (% of income per capita)
Source World Bank (2004 to 2017), Doing Business database, <http://www.doingbusiness.org>.
Economic Freedom of the Arab World: 2017 Annual Report / 57
Friedrich Naumann Foundation / International Research Foundation / Fraser Institute
ii Closing a businessThis sub-component measures the time and costs (as a percentage of the estate) of closing a business as well as the recovery rate (cents on the dollar). The time and cost rating was equal to: (Vmax – Vi) / (Vmax – Vmin) multiplied by 10. For the recovery rate, the following formula was used: (Vi – Vmin) / (Vmax – Vmin) multi-plied by 10. Vi represents the time, cost, and the recovery rate. Vmax was set to 10.0 years, 76.0%, 92.6%; and Vmin to 0.4 years, 1.0%, 0.0%.
a time (years) b cost (% of estate) c recovery rate (cents on the dollar)
Source World Bank (2004 to 2017), Doing Business database, <http://www.doingbusiness.org>.
58 / Economic Freedom of the Arab World: 2017 Annual Report
Friedrich Naumann Foundation / International Research Foundation / Fraser Institute
References
Al Ismaily, Salem Ben Nasser, Amela Karabegović, and Fred McMahon (2005). Economic Freedom of the Arab World. In Augusto Lopez-Claros and Klaus Schwab (eds.), The Arab World Competitiveness Report 2005 (World Economic Forum, 2005): 129–141.
Ayal, E.B., and K. Georgios (1998). Components of Economic Freedom and Growth: An Empirical Study. Journal of Developing Areas 32 (Spring): 327–338.
Amin, Magdi, Ragui Assaad, Nazar al-Baharna, Kemal Dervis, Raj M. Desai, Navtej S. Dhillon, Ahmed Galal, Hafez Ghanem, and Carol Graham (2012). After the Spring: Economic Transitions in the Arab World. Oxford University Press.
Bengoa, M., and B. Sanchez-Robles (2003). Foreign Direct Investment, Economic Freedom and Growth: New Evidence from Latin America. European Journal of Political Economy 19, 3 (September): 529–545.
Berggren, Niclas (2003). The Benefits of Economic Freedom: A Survey. The Independent Review 8, 2 (Fall): 193–211.
Carlsson, F., and S. Lundstrom (2002). Economic Freedom and Growth: Decomposing the Effects. Public Choice 112, 3/4 (September): 335–344.
Dawson, John W. (1998). Institutions, Investment, and Growth: New Cross-Country and Panel Data Evidence. Economic Inquiry 36 (October): 603–619.
Dawson, John W. (2003). Causality in the Freedom-Growth Relationship. European Journal of Political Economy 19, 3 (September): 479–495.
De Haan, J., and J-E. Sturm (2000). On the Relationship between Economic Freedom and Economic Growth. European Journal of Political Economy 16: 215–241.
De Haan, Jakob, and C.L.J. Sierman (1998). Further Evidence on the Relationship between Economic Freedom and Economic Growth. Public Choice 95: 363–380.
De Soysa, Indra, and Krishna Chaitanya Vadlamannati (2014). Free Markets and Civil Peace: Some Theory and Empirical Evidence. Fraser Institute.

Economic Freedom of the Arab World: 2017 Annual Report / 59
Friedrich Naumann Foundation / International Research Foundation / Fraser Institute
Doucouliagos, Chris, and Mehmet Ali Ulubasoglu (2006). Freedom and Economic Growth: Does Specification Make a Difference? European Journal of Political Economy 22, 1: 60–81.
Easton, S.T., and M.A. Walker (1997). Income, Growth, and Economic Freedom. American Economic Review 87, 2 (May): 328–332.
Feldmann, Horst (2010). Economic Freedom and Unemployment. In James Gwartney, Joshua C. Hall, and Robert Lawson, Economic Freedom of the World: 2010 Annual Report (Fraser Institute): 187–201.
Fike, Rosemarie (2017). Adjusting for Gender Disparity in Economic Freedom and Why It Matters. In James Gwartney, Robert Lawson, and Joshua Hall, Economic Freedom of the World: 2017 Annual Report (Fraser Institute): 189–211.
Grin, Gilles (2012). The Arab Spring and the European Neighbourhood Policy: An Economic Outlook. Foundation Pierre du Bois.
Griswold, Daniel T. (2004). Trading Tyranny for Freedom: How Open Markets Till the Soil for Democracy. Trade Policy Analysis 26 (January).
Gwartney, James, Robert Lawson, and Walter Block (1996). Economic Freedom of the World: 1975–1995. Fraser Institute.
Gwartney, James, and Robert Lawson (2004). Economic Freedom of the World: 2004 Annual Report. Fraser Institute.
Gwartney, James, and Robert Lawson (2006). Economic Freedom of the World: 2006 Annual Report. Fraser Institute.
Gwartney, James D., Robert Lawson, and Joshua C. Hall (2015). Economic Freedom of the World: 2015 Annual Report. Fraser Institute.
Gwartney, James D., Robert Lawson, and Joshua C. Hall (2016). Economic Freedom of the World: 2016 Annual Report. Fraser Institute.
Gwartney, James D., Robert Lawson, and Joshua C. Hall (2017). Economic Freedom of the World: 2017 Annual Report. Fraser Institute.
Hall, Joshua, and Robert Lawson (2014). Economic Freedom of the World: An Accounting of the Literature. Contemporary Economic Policy 32, 1: 1–19. <http:// http://onlinelibrary.wiley.com/doi/10.1111/coep.2014.32.issue-1/issuetoc>.
Hourani, Albert (1992). A History of the Arab People. Warner Brothers.
Lopez-Claros, Augusto, and Klaus Schwab, eds. (2005). The Arab World Competitiveness Report 2005. World Economic Forum.
60 / Economic Freedom of the Arab World: 2017 Annual Report
Friedrich Naumann Foundation / International Research Foundation / Fraser Institute
Malik, Adeel, and Bassem Awadalla (2011). The Economics of the Arab Spring. Centre for the Study of African Economics, University of Oxford.
Mulupi, Dinfin (2012, June 18). Opening a Bank in Somalia? Not a Crazy Idea, Says Businessman. How We Made It in Africa: Insight into Business in Africa. <http://www.howwemadeitinafrica.com/why-we-decided-to-open-a-bank-in-somalia/17530/>.
Norton, Seth W., and James D. Gwartney (2008). Economic Freedom and World Poverty. In James Gwartney and Robert Lawson, Economic Freedom of the World: 2008 Annual Report (Fraser Institute): 23–40.
Pitlik, Hans, Dulce M. Redín, and Martin Rode (2015). Economic Freedom, Individual Perceptions of Life Control, and Life Satisfaction. In James Gwartney, Robert Lawson, Joshua Hall, Economic Freedom of the World: 2015 Annual Report (Fraser Institute): 185–202.
Sala-i-Martin, Xavier (2002). The Disturbing “Rise” of Global Income Inequality. Published in the JEL; available at: <http://www.columbia.edu/~xs23/papers/GlobalIncomeInequality.htm>, as of July 19, 2014
Sidahmed, Alsir (2014, February 23). Arab Spring Back to Economy. Arab News. <http://www.arabnews.com/news/530091?quicktabs_stat2=1>, posted February 24; latest update February 23, 2014, 10:39 pm.
Data sources
Bankscope (2011). [Information on world banking.] <https://bankscope.bvdep.com> (subscription is required).
Banque Centrale de Comores (2012). Rapport annuel. <http://www.banque-comores.km/DOCUMENTS/Rapport_annuel_2012.pdf>, as of June 4, 2014.
Banque Centrale de Comores (2014). La structure du système bancaire comorien. <http://www.banque-comores.km/index.php?pg=etablissements-de-credit>, as of June 4, 2014.
Banque Centrale de Djibouti (2017). Supervision des Institutions. <http://www.banque-centrale.dj>, as of July 6 , 2017.
Banque Centrale de La Mauritanie (2017). Structure du système bancaire. <http://www.bcm.mr/-structure-du-systeme-bancaire->, as of June 17, 2017.
Central Bank of Libya (2016). Economic Bulletin 4th Quarter 2016. <https://cbl.gov.ly/en/wp-content/uploads/sites/2/2016/03/Economic-Bulletin-4th-Quarter-2016.pdf>.

Economic Freedom of the Arab World: 2017 Annual Report / 61
Friedrich Naumann Foundation / International Research Foundation / Fraser Institute
Central Bank of Somalia (2017). Licensed Banks. <http://www.centralbank.gov.so/banks.html>, as of June 6, 2017.
Child Soldiers International (2012). Louder than Words: An Agenda for Action to End State Use of Child Soldiers. Report published to mark the tenth anniversary year of entry into force of the Optional Protocol on the involvement of children in armed conflict. <http://www.child-soldiers.org/global_report_reader.php?id=562>, as of August 28, 2015.
Comoros, Ministère de Finances (1985–2001). Code Général des Impôts (LOI n° 85-018/AF du 24 décembre 1985 et lois annexes). <http://www.finances.gouv.km/v1/files/textes_nationaux/30_Code_Impots_Comores_2_original-2.pdf>, as of June 7, 2017.
Comoros, Direction Générale des Douanes (2012). Analyse des Recettes Douanieres. <http://www.douanes.km/v1/files/rapports_statistiques/analyse_2012_recette.pdf>, as of July 6, 2017.
Deloitte (2007). Investing in Africa, Somalia Country Study.
Deloitte (2009–2016). International Tax and Business Guide Highlights. <http://www.deloitte.com/view/en_GX/global/services/tax/international-tax/international-tax-and-business-guides/all-jurisdictions/index.htm>, as of June 8, 2017.
Deloitte (2015a). Guide to Fiscal Information: Key Economies in Africa 2014/15. <http://www2.deloitte.com/na/en/pages/tax/articles/guide-to-fiscal-information-key-economies-on-africa-2015.html>, as of August 8, 2016.
Deloitte (2015b). Oil and Gas Taxation in Iraq. <https://www2.deloitte.com/content/dam/Deloitte/global/Documents/Energy-and-Resources/gx-er-iraq-oil-gas.pdf>, as of July 7, 2017,
Djibouti, Ministère de Finances (2011). Code Général d’Impôt. <www.ministere-finances.dj/TVA/CGI%20%202010.pdf>, as of June 20, 2017.
Economist Intelligence Unit (2017). Data request, June 26, 2017. <http://www.economistgroup.com>.
Ernst & Young (2010). Libyan Income Tax Law 7/2010. Issued January 28, 2010.
Ernst & Young (various years ). Worldwide Personal Tax Guide. <http://www.ey.com/GL/en/Services/Tax/Global-tax-guide-archive>, as June 20, 2017.
Information Builders (2012). Saudi Credit Bureau Reduces Financial Risk with BI and ETL. <http://www.informationbuilders.com/applications/simah>, as of October 19, 2012.
62 / Economic Freedom of the Arab World: 2017 Annual Report
Friedrich Naumann Foundation / International Research Foundation / Fraser Institute
International Center for Tax Development (2017). The ICTD Government Revenue Dataset. <http://www.ictd.ac/datasets/the-ictd-government-revenue-dataset>, as of July 8, 2017.
International Institute for Strategic Studies (2007–2016). The Military Balance [2007–2016]. International Institute for Strategic Studies.
International Monetary Fund (2004–2016). Annual Report on Exchange Arrangements and Exchange Restrictions. IMF.
International Monetary Fund (2006–2017a). World Economic and Financial Surveys. Regional Economic Outlook: Middle East and Central Asia. IMF.
International Monetary Fund (2006–2017b). World Economic and Financial Surveys. Regional Economic Outlook: Sub-Saharan Africa. IMF.
International Monetary Fund (2016). West Bank and Gaza: Staff Report. Prepared for the September Meeting of the Ad Hoc Liaison Committee, (August 26). <http://www.imf.org/~/media/Files/Countries/ResRep/WBG/2016WBGRR.ashx>, as of June 20, 2017.
International Monetary Fund (2017a). Djibouti: Press Release: IMF Executive Board Concludes 2016 Article IV Consultation with Djibouti (April 6). <http://www.imf.org/external/np/sec/pr/2015/pr15587.htm>, as of June 20, 2017.
International Monetary Fund (2017b). International Financial Statistics. <http://data.imf.org>, as of August 13, 2017.
International Monetary Fund (2017c). Somalia: 2016 Article IV Consultation—Press Release; Staff Report; and Statement by the Executive Director for Somalia. IMF Country Report No. 17/61 (February 27). <https://www.imf.org/~/media/Files/Publications/CR/2017/cr1761.ashx>. as of June 8, 2017.
Iraq, Ministry of Finance, Public Commission of Customs (2008). Customs Tariff Table According to the Harmonized System. Republic of Iraq. <http://www.iraq-businessnews.com/wp-content/uploads/2011/02/Iraqi-DRAFT-Tariff-Schedule.pdf>, as of June 15, 2015.
Monetary Research (2003–2016). MRI Bankers’ Guide to Foreign Currency. Monetary Research, Inc.
PricewaterhouseCoopers (various years). Worldwide Tax Summaries. <http://taxsummaries.pwc.com/uk/taxsummaries/wwts.nsf/ID/PPAA-85RDKF>.
PRS Group (1979–2017). International Country Risk Guide. Data purchased from <http://www.prsgroup.com>.

Economic Freedom of the Arab World: 2017 Annual Report / 63
Friedrich Naumann Foundation / International Research Foundation / Fraser Institute
Saudi Arabia, Ministry of Finance, Saudi Customs (2013). Revenues from Customs Duties. Chapter one (pp. 13–24 ) in Annual Report Saudi Custom 2013G. <http://www.customs.gov.sa/sites/sc/en/AnnualReport/>, as of June 30, 2016.
War Resisters’ International (2017). World Survey of Conscription and Conscientious Objection to Military Service. <www.wri-irg.org>.
World Bank (various years, 2005–2016). World Development Indicators (editions 2005–2016). International Bank for Reconstruction and Development and World Bank.
World Bank (various years, 2004–2017). Doing Business Database. <http://www.doingbusiness.org>.
World Bank (2014). World Development Indicators 2014 (on-line). World Bank. <http://data.worldbank.org/data-catalog/world-development-indicators>, retrieved between May 31 and June 10, 2014.
World Bank (2017). World Development Indicators 2015 (on-line). World Bank. <http://data.worldbank.org/data-catalog/world-development-indicators>.
World Bank Group (2003). World Bank Survey of Bank Regulation and Supervision. <http://www.worldbank.org/research/interest/2003_bank_survey/2003_bank_regulation_database.htm>, as of July 24, 2007.
World Bank Group (2007). World Bank Survey of Bank Regulation and Supervision. <http://econ.worldbank.org/WBSITE/EXTERNAL/EXTDEC/EXTRESEARCH/0,,contentMDK:20345037~pagePK:64214825~piPK:64214943~theSitePK:469382,00.html#Survey_III>, as of July 24, 2007.
World Bank Group (2012). World Bank Survey of Bank Regulation and Supervision. <http://econ.worldbank.org/WBSITE/EXTERNAL/EXTDEC/EXTGLOBALFINREPORT/0,,contentMDK:23267421~pagePK:64168182~piPK:64168060~theSitePK:8816097,00.html>, as of June 4, 2014.
World Trade Organization (2006–2016). World Tariff Profiles. <https://www.wto.org/english/res_e/publications_e/world_tariff_profiles16_e.htm>, as of June 27, 2017.
United Nations (2017). National Accounts Main Aggregates Database. <http://unstats.un.org/unsd/snaama/selCountry.asp>.
United Nations Conference on Trade and Development [UNCTAD] (2014). Economic Development in Africa Report 2014: Catalyzing Investment for Transformative Growth in Africa. <http://unctad.org/en/PublicationsLibrary/aldcafrica2014_en.pdf>, as of June 19, 2017.
64 / Economic Freedom of the Arab World: 2017 Annual Report
Friedrich Naumann Foundation / International Research Foundation / Fraser Institute
United Nations Conference on Trade and Development [UNCTAD] (2015). World Investment Report 2015: Reforming International Investment Governance. <http://unctad.org/en/PublicationsLibrary/wir2015_en.pdf>, as of June 4, 2016.
Preparatory studies
Walker, Michael A., ed. (1988). Freedom, Democracy, and Economic Welfare. Proceedings of an International Symposium (Volume 1). Fraser Institute.
Block, Walter E., ed. (1991). Economic Freedom: Toward a Theory of Measurement. Proceedings of an International Symposium (Volume 2). Fraser Institute.
Easton, Stephen T., and Michael A. Walker, eds. (1992). Rating Global Economic Freedom. Fraser Institute.
Publishing history
Al Ismaily, Salem Ben Nasser, Amela Karabegović, and Fred McMahon (2007). Economic Freedom of the Arab World: Report and Index – 2006–07. Fraser Institute.
Al Ismaily, Salem Ben Nasser, Amela Karabegović, and Fred McMahon (2008). Economic Freedom of the Arab World: 2008 Annual Report. Friedrich Naumann Foundation for Liberty; International Research Foundation of Oman; Fraser Institute.
Al Ismaily, Salem Ben Nasser, Amela Karabegović, and Fred McMahon, with Marisha Warrington (2009). Economic Freedom of the Arab World: 2009 Annual Report. Friedrich Naumann Foundation for Liberty; International Research Foundation of Oman; Fraser Institute.
Al Ismaily, Salem Ben Nasser, Fred McMahon, Miguel Cervantes, and Amela Karabegović (2010). Economic Freedom of the Arab World: 2010 Annual Report. Friedrich Naumann Foundation for Liberty; International Research Foundation of Oman; Fraser Institute.
Al Ismaily, Salem Ben Nasser, Miguel Cervantes, and Fred McMahon, (2011). Economic Freedom of the Arab World: 2011 Annual Report. Friedrich Naumann Foundation for Liberty; International Research Foundation of Oman; Fraser Institute.
Al Ismaily, Salem Ben Nasser, Azzam Al-Busaidi, Miguel Cervantes, and Fred McMahon (2012–2016). Economic Freedom of the Arab World: 2012 Annual Report–2016 Annual Report. Friedrich Naumann Foundation for Liberty; International Research Foundation of Oman; Fraser Institute.