economic growth and social development
TRANSCRIPT

Illinois State UniversityISU ReD: Research and eData
Master's Theses - Economics Economics
6-2010
Economic Growth and Social DevelopmentJanelle JonesIllinois State University
Follow this and additional works at: https://ir.library.illinoisstate.edu/mte
Part of the Economics Commons
This Article is brought to you for free and open access by the Economics at ISU ReD: Research and eData. It has been accepted for inclusion in Master'sTheses - Economics by an authorized administrator of ISU ReD: Research and eData. For more information, please contact [email protected].
Recommended CitationJones, Janelle, "Economic Growth and Social Development" (2010). Master's Theses - Economics. 7.https://ir.library.illinoisstate.edu/mte/7

Economic Growth and Social Development
Janelle Jones
Advisor: Dr. Ram
Masters of Applied Economics
Capstone
Illinois State University
June 2010

2
Abstract
The goal of this paper is to examine the relationship between economic growth
and social development. The paper looks at the effect of changes in national income in a
country on social development of the citizens. Other factors like democratic
characteristics and government stability are also considered at a secondary level.
Although the main focus is on annual cross-country data for the period 1996-2006,
estimates for shorter subperiods are also considered. The role of income relative to 16
proxies for social development is studied, and simple regression models are estimated
through the fixed-effects format and also by using instrumental variables. While higher
incomes do seem to lead to social development, the effect on several dimensions is not
clear or sharp, and the impact seems to vary over time and across countries.

3
1. Introduction
In a passage from his book Dilemmas of Development, John Toye (1993) writes:
…the sickness, ignorance, and premature death, not to mention the
violence, ugliness and despair of daily life which accompany poverty and
underemployment, …revolt most people. Those things can be found in any
Third World country on a scale that would never be tolerated elsewhere
and they must be eliminated as quickly as humanly possible…economic
development should have as its fundamental objective the reduction of
poverty.
For decades there was the belief in economics that economic growth was the way to
reach nearly all social objectives, poverty reduction, increased literacy, better medical
services, etc. However, evidence of countries becoming richer as global poverty rises has
challenged this belief. Given the vast amounts of wealth created in the twenty-first
century, researchers are calling the completion of some social objectives, like
environmental sustainability and poverty reduction, a moral imperative. The relationship
between social outcomes and economic growth is complex and interesting.
This paper will focus on the effect of economic growth on several quality-of-life
indicators. More specifically, the cross-country effects of economic growth on social
outcomes in the areas of education and employment, health, and overall development will
be examined. It has been widely documented that women are most often found in
poverty, compared to their male counterparts, and face the hardships that accompany that
state, so special attention will be given to outcomes that are important to women’s
development, such as maternal mortality rate and the rate of female progression to
secondary school.
The abundance of research around this topic in a number of disciplines has
demonstrated its importance to policy makers at the national and global level. The intense
pursuit of higher incomes by government officials is usually justified because positive
social outcomes are guaranteed by-products. Determining the consequences of economic
growth can affect government policies on trade, foreign aid, and inter-country relations;
all of which directly impact citizens. Moreover, research in this area might shed some
indirect light on how individuals determine or perceive their well being.
The issue of causality between economic growth and social development raises
endogeneity concerns in the application of econometric techniques. The empirical results

4
in this study have been obtained by using a fixed-effects model as well as instrument
variables to address such concerns. The countries are also separated according to their
level of economic development to test for a possible nonlinear effect of income. The
estimates broadly suggest that, besides the effect on other variables, the two social
development measures that seem to respond most to economic growth are the proportion
of women in the national government and public health expenditures. The role of
“democracy” and government “stability” in the effect of income appears minor.
2. Background of Topic
The relationship between economic growth and quality of life has given rise to a
large and extensive body of literature. There is no shortage of questions that have been
analyzed within this research area. Some examples are: does growth lead to an increased
quality of life, does a country need to have passed certain social benchmarks to
experience sustainable economic growth, and should data be taken from national
accounts or household surveys? As mentioned above, this paper will focus on the impact
of economic growth on social outcomes across countries.
Development economics involves applying economic theories, concepts, and
models to the study of the development process. Within this branch of economics, per
capita gross domestic product is commonly used as a measure of overall well being of a
country’s citizens. To the extent that this measure gives some indication of standards of
living, it can indicate how income change directly impacts the quality of life within a
country. However, social indicators can be used as a more specific and direct way to
measure quality of life. The link between economic growth and social development is
that both capture some aspects of well-being. The economic measure of GDP focuses on
households’ financial abilities; while social indicators are able to reflect public services,
like education and health, and how those change in the development process.
Researchers need to make a decision about how best to capture changes in quality
of life with available data. Different studies place different importance on social
indicators when measuring quality of life. Sen (1998) argues that mortality statistics are
as important as traditional income variables because they highlight social inequalities,
gender biases, and racial disparities. This paper partly follows Sen’s argument by using

5
two mortality variables to measure social development. Guiso, Sapienza, and Zingales
(2006) focus only on those dimensions of social outcomes that are inherited from
previous generations, thus avoiding causality problems due to economic growth and
social outcomes both influencing and affecting each other.
There have been results and conclusions found at both ends of the spectrum
around this issue. One group has found that economic growth leads to an improvement in
nearly every aspect of life. Barro (1996) and Barro and Lee (1997) have found education,
health, civil liberties, and environmental policies all become better during periods of
positive economic growth. Dollar and Kraay (2002) find that the incomes of the poorest
households move with average incomes in low and middle-income countries. On the
other hand, recent literature has challenged these results illustrating the importance of the
distribution of incomes and growth benefits across different groups in the population.
Reuveny and Li (2003) find that depending on the types of economic policies
implemented, income inequality may worsen or improve with economic growth. One
study of the Pacific Islands region finds that “social objectives can contribute to
economic growth” as long as some portion of government resources are being dedicated
to social services (Prasad, 2008).
There is a sub-set of this literature that focuses on women’s development by
examining economic growth and women’s development with an approach similar to the
one used in this paper. Forsythe, Korzeniewicz, and Durrant (2000) divide the literature
into three theoretical frameworks: modernization or neo-classical, women in development
(WID), and gender and development (GAD). “Modernization” view states the
inequalities between genders will lessen with economic growth. WID postulates that
gender inequalities follow a U-shape because at the beginning of the growth process they
will become exacerbated, and will lessen in the long run after the country passes some
threshold. GAD takes a completely different perspective stating that inequalities are due
to institutional factors and the process of economic growth may only worsen matters.
“Modernization” appears to be the theme pursued in several studies in the area, and a few
examples of that research are mentioned here.
Dollar and Gatti (1999) find that growth does lead to improvements in gender
equality, and gender inequality in education leads to lower long term growth rates.

6
Moreover, they conclude that religious characteristics, civil freedom, and other regional
variables explain the majority of gender inequality. Klasen ‘s (1999) results show that
gender inequality in education can also stall progress in health, specifically in reducing
fertility and mortality rates. Using the gender-related development index (GDI)
developed by the United Nations, Forsythe, Korzeniewicz and Durrant (2000) find that
economic development reduces gender inequality when using cross-sectional and
longitudinal analyses of 130 countries. Guiso, Sapienze and Zingales (2006) conclude
that development that shrinks gender inequality must include increased productivity in
female-dominated industries, promote high wage industries, and demand-side
management strategies. However, the authors acknowledge the challenge in
implementing such policies, especially by small, undeveloped countries up against
political and institutional weakness.
3. Model, Data, and Main Results
3.1 Model
Following the methodology of previous studies the model used in my research
may be written as:
(1)
where O is a social outcome indicator, i is the country index, t is the time index, and yit is
the log of GDP per capita. The model is estimated using two econometric approaches.
The first, a fixed-effects model, is commonly used in the literature for cross-country
panel data. Certain permanent characteristics of a country, like endowment of natural
resources, history of colonization, and distance from large bodies of water, will effect
social outcomes and need to be accounted for in the empirical analysis. A fixed-effects
model accounts for these time-constant and country specific factors.1 Also, one must
deal with endogeneity issues when studying the relationship between economic growth
and social development. In judging how growth affects social outcomes, the empirical
model needs to account for the effect that social indicators might have on growth. The
most common method used to handle potential endogenous explanatory variables in the
1 A random-effects model is an alternative to the fixed-effects model for this type of data. However,
Hausman’s test indicates the fixed-effect format is more appropriate.

7
literature, and that will be applied here, is the Instrumental Variables (IV) approach. The
IV model uses variables, or instruments, in the equation that are uncorrelated with the
error terms but correlated with the regressors. For the models that follow, a one period
lag of GDP per capita is used as the instrument. Since it is pre-determined, it is likely to
be uncorrelated with the error term, but should still have considerable predictive power in
determining the current period income.
The outcomes chosen are proxies for aspects of life that are hard to measure. We
can describe social development as including three areas of social objectives: (1)
employment and education, (2) health, and (3) overall development. The employment and
education variables include female unemployment rate, ratio of girls to boys in primary
school, male progression to secondary school, female progression to secondary school,
female labor force participation rate, and the proportion of seats in national government
held by women. The variables measuring health are access to safe water, access to
sanitation services, prevalence of contraceptive use, and public health expenditures as a
percent of GDP. The overall development measures are gini coefficient, life expectancy,
literacy rate, maternal mortality rate, and adult mortality rate. A list of the variable and
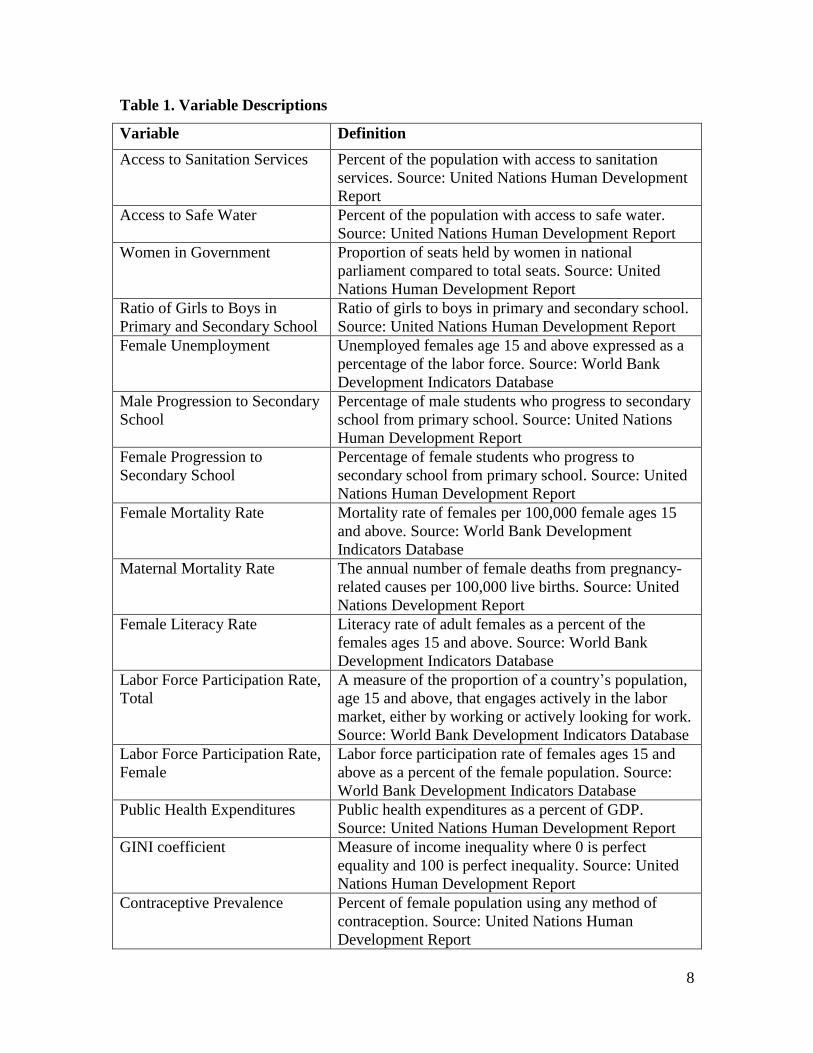
their definitions can be found in Table 1. The questions of reliability and validity are not
answered here as these measures have been used widely in the literature. I will test the
null hypothesis of β1 being equal to zero against the alternative that it is statistically
different from zero. A positive β1 means that a country’s income and quality of life move
in the same direction. In other words, any increase in GDP has a positive effect on the
social outcome being measured. A coefficient that is greater than zero supports the
hypothesis that economic growth has a positive effect on the social aspects of a country’s
residents.
3.2 Data
Data on a variety of social outcomes and economic development variables are
available form the World Bank and United Nations. Using the World Development
Indicators database and United Nations Human Development Reports a panel data set
was created. Social outcomes were chosen based on their availability for the period
studied and their impact on the quality of life. Due to data limitations, the sample
8
Table 1. Variable Descriptions
Variable Definition
Access to Sanitation Services Percent of the population with access to sanitation
services. Source: United Nations Human Development
Report
Access to Safe Water Percent of the population with access to safe water.
Source: United Nations Human Development Report
Women in Government Proportion of seats held by women in national
parliament compared to total seats. Source: United
Nations Human Development Report
Ratio of Girls to Boys in
Primary and Secondary School
Ratio of girls to boys in primary and secondary school.
Source: United Nations Human Development Report
Female Unemployment Unemployed females age 15 and above expressed as a
percentage of the labor force. Source: World Bank
Development Indicators Database
Male Progression to Secondary
School
Percentage of male students who progress to secondary
school from primary school. Source: United Nations
Human Development Report
Female Progression to
Secondary School
Percentage of female students who progress to
secondary school from primary school. Source: United
Nations Human Development Report
Female Mortality Rate Mortality rate of females per 100,000 female ages 15
and above. Source: World Bank Development
Indicators Database
Maternal Mortality Rate The annual number of female deaths from pregnancy-
related causes per 100,000 live births. Source: United
Nations Development Report
Female Literacy Rate Literacy rate of adult females as a percent of the
females ages 15 and above. Source: World Bank
Development Indicators Database
Labor Force Participation Rate,
Total
A measure of the proportion of a country’s population,
age 15 and above, that engages actively in the labor
market, either by working or actively looking for work.
Source: World Bank Development Indicators Database
Labor Force Participation Rate,
Female
Labor force participation rate of females ages 15 and
above as a percent of the female population. Source:
World Bank Development Indicators Database
Public Health Expenditures Public health expenditures as a percent of GDP.
Source: United Nations Human Development Report
GINI coefficient Measure of income inequality where 0 is perfect
equality and 100 is perfect inequality. Source: United
Nations Human Development Report
Contraceptive Prevalence Percent of female population using any method of
contraception. Source: United Nations Human
Development Report
9
Female Life Expectancy Female life expectancy at birth in years. Source: World
Bank Development Indicators Database
GDP per capita Gross domestic product, in US dollars, divided by mid-
year population. Source: World Bank Development
Indicators Database
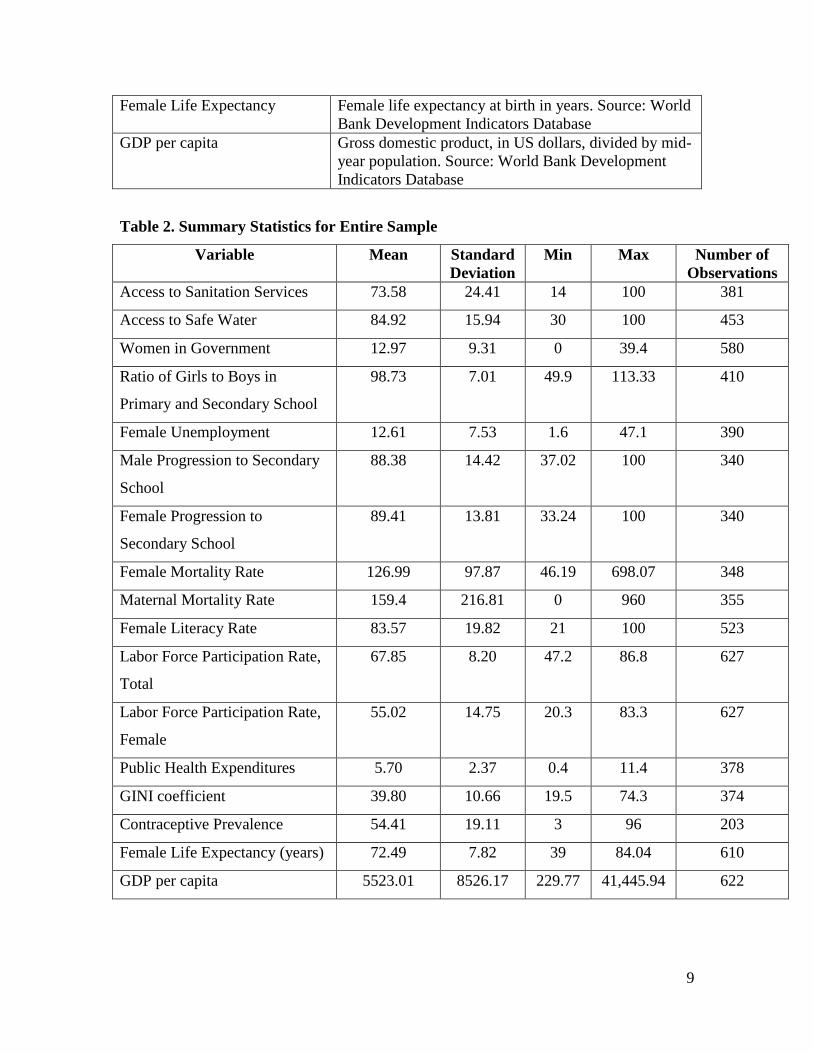
Table 2. Summary Statistics for Entire Sample
Variable Mean Standard
Deviation
Min Max Number of
Observations
Access to Sanitation Services 73.58 24.41 14 100 381
Access to Safe Water 84.92 15.94 30 100 453
Women in Government 12.97 9.31 0 39.4 580
Ratio of Girls to Boys in
Primary and Secondary School
98.73 7.01 49.9 113.33 410
Female Unemployment 12.61 7.53 1.6 47.1 390
Male Progression to Secondary
School
88.38 14.42 37.02 100 340
Female Progression to
Secondary School
89.41 13.81 33.24 100 340
Female Mortality Rate 126.99 97.87 46.19 698.07 348
Maternal Mortality Rate 159.4 216.81 0 960 355
Female Literacy Rate 83.57 19.82 21 100 523
Labor Force Participation Rate,
Total
67.85 8.20 47.2 86.8 627
Labor Force Participation Rate,
Female
55.02 14.75 20.3 83.3 627
Public Health Expenditures 5.70 2.37 0.4 11.4 378
GINI coefficient 39.80 10.66 19.5 74.3 374
Contraceptive Prevalence 54.41 19.11 3 96 203
Female Life Expectancy (years) 72.49 7.82 39 84.04 610
GDP per capita 5523.01 8526.17 229.77 41,445.94 622

10
covers 57 countries at various levels of development between the years 1996 and 2006.
The countries are listed in the Appendix, and Table 2 provides sample statistics.
In addition to studying the relationship in the entire sample, I also estimate the
model using three different subsets of countries. This is motivated by the consideration
that the structure may differ across income levels. By splitting the sample, it should be
possible to shed light on this view. The income cutoffs used for the subsets are based on
the World Bank classification. Developed countries are those with an average GDP per
capita above US$9,300 between 1996 and 2006. Developing countries have a range
between US$761 and US$9,300 for average GDP per capita during the period, and may
be perceived as constituting the middle-income group. Finally, having an average GDP
per capita at or below US$760 identifies Under-Developed countries, or the low-income
group. Using these subsets, one can judge whether initial level of GDP per capita affects
the relationship between economic growth and social outcomes.
As an additional exercise, equation (1) is modified to study the possible role of
institutions and political stability in regard to the effect of income on social development.
The literature discusses at length the importance of political structures and institutions in
the economic growth and development of countries. It might be expected that a more
democratic government can better translate higher incomes into social development for
the citizens. The democracy variables used in this paper come from the Polity IV data
which is collected by political scientists and contains data on a number of political
indicators. Two measures of institutions and government that are used from the Polity IV
database are DEMOC and DURABLE. The DEMOC variable compiles measures of
political participation, openness and competitiveness of executive recruitment, and
constraints on the chief executive into a 10 point scale, with 10 being “strongly
democratic.” DURABLE is the number of years since the last national regime change.
Thus, a larger value indicates a higher level of government stability.
3.3 Empirical Results
3.3.1 Entire Sample
Table 3 contains the main results. In general, while GDP per capita has a significant
effect with the expected signs in most cases in the fixed-effects format, the IV estimates
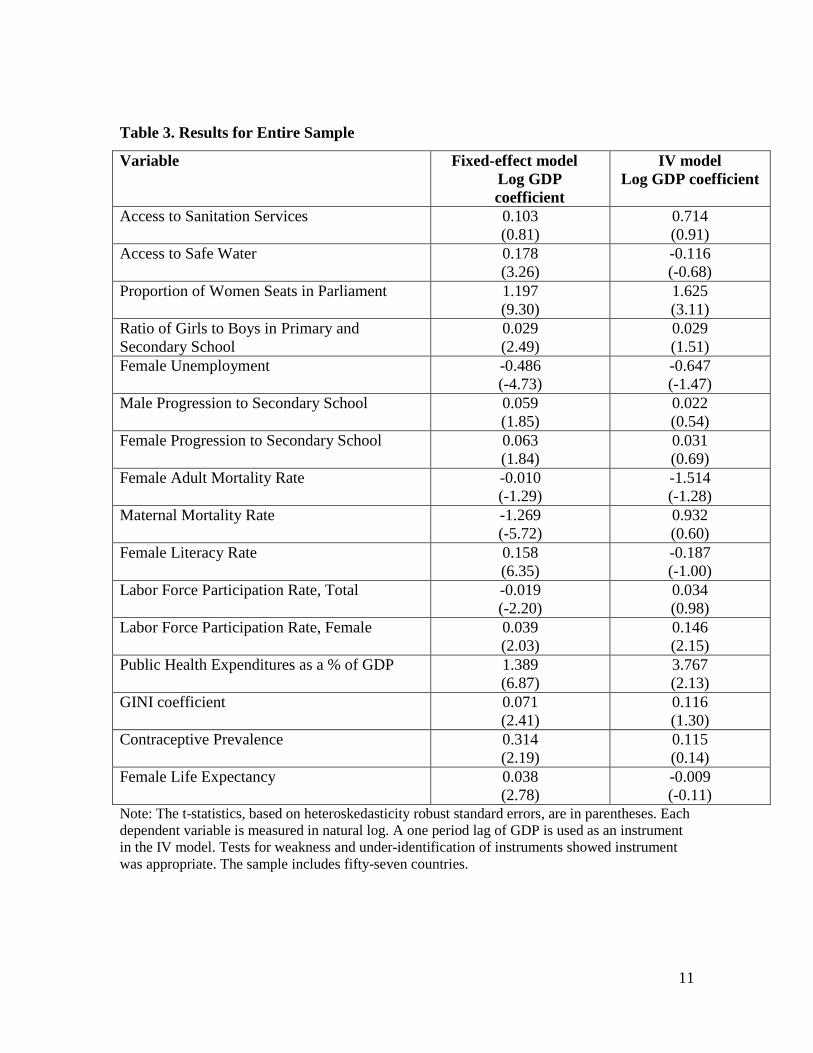
11
Table 3. Results for Entire Sample
Variable Fixed-effect model
Log GDP
coefficient
IV model
Log GDP coefficient
Access to Sanitation Services 0.103
(0.81)
0.714
(0.91)
Access to Safe Water 0.178
(3.26)
-0.116
(-0.68)
Proportion of Women Seats in Parliament 1.197
(9.30)
1.625
(3.11)
Ratio of Girls to Boys in Primary and
Secondary School
0.029
(2.49)
0.029
(1.51)
Female Unemployment -0.486
(-4.73)
-0.647
(-1.47)
Male Progression to Secondary School 0.059
(1.85)
0.022
(0.54)
Female Progression to Secondary School 0.063
(1.84)
0.031
(0.69)
Female Adult Mortality Rate -0.010
(-1.29)
-1.514
(-1.28)
Maternal Mortality Rate -1.269
(-5.72)
0.932
(0.60)
Female Literacy Rate 0.158
(6.35)
-0.187
(-1.00)
Labor Force Participation Rate, Total -0.019
(-2.20)
0.034
(0.98)
Labor Force Participation Rate, Female 0.039
(2.03)
0.146
(2.15)
Public Health Expenditures as a % of GDP 1.389
(6.87)
3.767
(2.13)
GINI coefficient 0.071
(2.41)
0.116
(1.30)
Contraceptive Prevalence 0.314
(2.19)
0.115
(0.14)
Female Life Expectancy 0.038
(2.78)
-0.009
(-0.11) Note: The t-statistics, based on heteroskedasticity robust standard errors, are in parentheses. Each
dependent variable is measured in natural log. A one period lag of GDP is used as an instrument
in the IV model. Tests for weakness and under-identification of instruments showed instrument
was appropriate. The sample includes fifty-seven countries.

12
seem considerably weaker. The following patterns are suggested by the estimates.
First, there are three outcome variables for which the fixed effects (FE) and
instrumental-variable (IV) models yield a consistent pattern in terms of signs and
statistical significance. These are (a) proportion of women seats in parliament, (b) female
labor force participation rate, and (c) public health expenditures. It seems, therefore, that
increased income enhances several aspects of social development, particularly for
women, and the magnitude of the impact seems generally sizable..
Second, access to safe water, girls-boys ratio at primary and secondary levels,
female unemployment, maternal mortality, female literacy, contraceptive prevalence, and
female life expectancy have the expected signs and show statistical significance at the
usual levels in the FE format, but lose significance in the IV estimates, and even have
unexpected signs for access to safe water, maternal mortality, female literacy, and female
life expectancy. It is, therefore, difficult to make a clear statement about the effect of
increased income on these variables.
Third, variables representing male and female progression to secondary level are
marginally significant in FE format, but lack significance in IV models, and thus a clear
statement about the role of income relative to these variables is problematic.
Fourth, overall labor force participation rate has a significant negative sign in FE
model, but is positive and insignificant in terms of IV estimates. Similarly, Gini has a
significant positive sign in FE model, but lacks significance in IV format. It is, therefore,
difficult to say how income affects these dimensions of social development.
The overall scenario appears to be that full-sample estimates show income having
a significant and possibly sizable role in enhancing social development along three
dimensions in terms of both FE and IV models. For other variables, it is difficult to make
a clear statement since FE and IV estimates are not consistent in terms of significance or
sign.
3.3.2 Developed Countries
Table 4 reports the relevant estimates. The discussion of the results is brief since
the study focuses on the less-developed world, and the group includes only seven
countries with a relatively small sample size.

13
Table 4. Results for Developed Countries
Variable Fixed-effect model
Log GDP
coefficient
IV model
Log GDP coefficient
Access to Sanitation Services -0.930
(-2.98)
-0.127
(-0.05)
Access to Safe Water -0.025
(-1.39)
0.069
(0.51)
Proportion of Women Seats in Parliament 2.115
(7.50)
2.12
(2.22)
Ratio of Girls to Boys in Primary and
Secondary School
-0.109
(-6.16)
-0.110
(-4.96)
Female Unemployment -0.880
(-2.58)
-0.558
(-0.56)
Male Progression to Secondary School 0.013
(0.64)
-0.005
(-0.18)
Female Progression to Secondary School -0.028
(-1.41)
-0.022
(-0.87)
Female Adult Mortality Rate -0.737
(-7.83)
-0.737
(-7.83)
Maternal Mortality Rate -3.87
(-2.91)
-6.146
(-2.64)
Female Literacy Rate 0.070
(1.34)
0.038
(1.06)
Labor Force Participation Rate, Total 0.106
(8.28)
0.157
(4.14)
Labor Force Participation Rate, Female 0.222
(4.82)
0.437
(2.77)
Public Health Expenditures as a % of GDP 1.025
(3.83)
1.207
(2.54)
GINI coefficient 0.026
(0.29)
0.031
(0.044)
Contraceptive Prevalence 0.101
(1.91)
-0.002
(-0.60)
Female Life Expectancy 0.133
(5.64)
0.158
(3.07) Note: The t-statistics, based on heteroskedasticity robust standard errors, are in parentheses. Each
dependent variable is measured in natural log. A one period lag of GDP is used as an instrument
in the IV model. Tests for weak and under identification of instruments showed instrument was
appropriate. The sample includes seven countries.

14
The first point to note is that FE and IV estimates are consistent in being
significant and having the expected signs for seven variables, namely, (a) women in
parliament, (b) female mortality, (c) maternal mortality, (d) overall labor force
participation, (e) female labor force participation, (f) public health expenditures, and (g)
female life expectancy. It is thus interesting to see that, despite its high income, increased
income in this group appears to enhance social development along more dimensions than
is observed for the full sample.
Second, girls-boys ratio at primary and secondary levels has a negative sign that
carries statistical significance in both FE and IV formats. It is difficult to interpret this
pattern.
Third, variables representing access to safe water, male and female progression to
secondary level, female literacy, and contraceptive prevalence lack significance. This is
probably due to the high level of these variables in this group. Access to sanitation and
female unemployment have negative sign and show significance in FE model, but lack
significance in IV estimates. Gini has insignificant estimates in both models.
3.3.3 Developing (Middle-Income) Countries
Table 5 reports the estimates for this group. The following patterns may be noted.
First, maternal mortality is the only variable for which both FE and IV estimates
show the effect to have the expected (negative) sign and carry statistical significance. For
the other 15 variables, either the IV estimates lack statistical significance, while FE is
significant, or both FE and IV lack significance. This is surprising since in the developed
group, despite a much smaller sample size, seven variables showed significant effects in
the expected directions in both models. At any rate, it is difficult to make a clear
statement about the role of income relative to these 15 variables in the developing
(middle-income) group, which constitutes the largest subset of the sample countries.
Second, however, women’s seats in parliament, female unemployment, female
literacy, female labor force participation, and female life expectancy show expected signs
and statistical significance in the FE format and provide a hint of increased income
contributing to social development on these dimensions that reflect female well-being.
However, lack of significance in IV estimates makes a clear inference difficult.

15
Table 5. Results for Developing (Middle-Income) Countries
Variable Fixed-effect model
Log GDP
coefficient
IV model
Log GDP coefficient
Access to Sanitation Services 0.159
(1.63)
0.334
(0.86)
Access to Safe Water 0.124
(2.02)
-0.189
(-0.55)
Proportion of Women Seats in Parliament 1.275
(7.79)
1.048
(1.84)
Ratio of Girls to Boys in Primary and
Secondary School
0.004
(0.52)
0.007
(0.54)
Female Unemployment -0.498
(4.55)
-0.360
(-0.97)
Male Progression to Secondary School 0.071
(1.50)
0.020
(0.42)
Female Progression to Secondary School 0.061
(1.25)
0.010
(0.21)
Female Adult Mortality Rate -0.170
(-1.89)
0.045
(0.15)
Maternal Mortality Rate -1.226
(-5.91)
-2.600
(-2.80)
Female Literacy Rate 0.145
(5.58)
0.053
(0.44)
Labor Force Participation Rate, Total -0.007
(-0.75)
-0.034
(-0.70)
Labor Force Participation Rate, Female 0.085
(3.94)
0.057
(0.55)
Public Health Expenditures as a % of GDP 0.925
(3.00)
-0.094
(-0.04)
GINI coefficient 0.099
(2.99)
0.245
(1.50)
Contraceptive Prevalence 0.219
(0.97)
-2.030
(-1.35)
Female Life Expectancy 0.026
(2.07)
-0.050
(-0.65) Note: The t-statistics, based on heteroskedasticity robust standard errors, are in parentheses. Each
dependent variable is measured in natural log. A one period lag of GDP is used as an instrument
in the IV model. Tests for weakness and under-identification of instruments showed instrument
was appropriate. The sample includes forty countries.

16
Third, positive sign on Gini and its significance in the FE format might indicate a
disequalizing effect of income growth in this group.
Fourth, girls-boys ratio, progression to secondary school, overall labor force
participation, and contraceptive use lack significance in both models.
Last, one may, therefore, say that, except for the role of income in lowering
maternal mortality, the effect of increased income on most dimensions of social
development appears uncertain or weak in middle-income countries.
3.3.4 Under-developed (Low-income) Countries
Table 6 reports the estimates. The following points seem noteworthy.
First, there are four variables which have the expected signs and show
significance both FE and IV models. These are (a) women in parliament, (b) girls-boys
ratio at primary and secondary levels, (c) female literacy, and (d) public health
expenditure. Thus despite a smaller sample size, IV estimates show expected signs and
significance in more cases in this group than in the full sample or the developing-country
group. Moreover, the magnitude of the effects is sizable, particularly for public health
outlays.
Second, overall and female labor force participation rates carry statistical
significance in both FE and IV models, but carry negative signs. It is difficult to interpret
these estimates.
Third, access to safe water and maternal mortality have the expected signs and
carry significance in the FE format, but lack significance in the IV models. Thus one
might say there is weak evidence that increased income helps in terms of greater safe-
water access and reduced maternal mortality.
Fourth, the other eight variables show lack of statistical significance in both
models, and may be deemed to be not affected significantly by increased income or
economic growth.

17
Table 6. Results for Under-Developed (Low-Income) Countries
Variable Fixed-effect model
Log GDP
coefficient
IV model
Log GDP coefficient
Access to Sanitation Services 0.061
(0.20)
-0.845
(-0.54)
Access to Safe Water 0.367
(2.74)
1.403
(1.61)
Proportion of Women Seats in Parliament 0.931
(3.23)
2.085
(2.63)
Ratio of Girls to Boys in Primary and
Secondary School
0.134
(3.10)
0.136
(3.16)
Female Unemployment -0.147
(-0.54)
3.997
(0.79)
Male Progression to Secondary School 0.046
(0.48)
0.040
(1.03)
Female Progression to Secondary School 0.110
(1.12)
0.125
(1.61
Female Adult Mortality Rate -0.211
(0.95)
5.297
(1.91)
Maternal Mortality Rate -1.156
(-2.65)
-1.344
(-1.27)
Female Literacy Rate 0.145
(5.58)
1.192
(2.26)
Labor Force Participation Rate, Total -0.066
(-6.05)
-0.242
(-2.60)
Labor Force Participation Rate, Female -0.077
(-4.28)
-0.344
(-2.31)
Public Health Expenditures as a % of GDP 3.190
(7.41)
4.174
(3.72)
GINI coefficient -0.055
(-0.75)
-0.040
(-0.28)
Contraceptive Prevalence 0.573
(1.89)
3.500
(1.43)
Female Life Expectancy 0.087
(1.56)
-0.105
(-0.24) Note: The t-statistics, based on heteroskedasticity robust standard errors, are in parentheses. Each
dependent variable is measured in natural log. A one period lag of GDP is used as an instrument
in the IV model. Tests for weakness and under-identification of instruments showed instrument
was appropriate. The sample includes ten countries.
.

18
3.3.5 Democratic Institutions and government Stability
To study the role of political institutions and the stability of the national
government relative to the effect of increased income on social outcomes, interaction
terms were added. The variables DEMOC and DURABLE which measure democratic
characteristics and stability were interacted with GDP per capita and added as
explanatory variables. Table 7 presents the estimates, which are based on the IV format
and the full sample.
The main point conveyed by the table is that neither “democracy” nor government
stability affects the role of income in social development. Of the 32 interaction terms,
only one (for female unemployment) is significant at the 5% level. Even in this case, the
estimate is somewhat perverse since it indicates that a more “democratic” regime lowers
the female-unemployment-reducing effect of increased income.
It is also to be noted that estimated coefficients of most interaction terms are tiny.
Moreover, quality of the estimated parameters of the main variables seems to have been
adversely affected by the introduction of interaction terms. Despite lack of significance of
most interaction terms, magnitudes of the main parameters show sizable differences in
many cases from the corresponding numbers in Table 3. It is possible that collinearity
between the main variables and the interaction terms has lowered the statistical
significance of all estimates and has also caused the main parameter estimates to diverge
substantially from the corresponding numbers in Table 3.
The main conclusion from Table 7 is that “democracy” or “stability” seems to
have little significant influence relative to the role of increased income in enhancing
social development. It is possible that collinearity between the main variables and the
interaction terms has lowered the precision of all estimates, and has thus made it more
difficult to derive a clear inference on the role of democracy and government stability in
regard to the effect of increased income on social development. It is also possible that
while one does not see a clear role of these institutional characteristics in the full sample,
the position is less hazy in some of the subsets of countries. Alternatively, one might find
a somewhat clearer position if the number of sample countries or the years covered were
larger.

19
Table 7. Results Using Policy Interaction Terms
Variable Log GDP coefficient GDP X
Democracy
GDP X
Stability
Access to Sanitation Services
0.764
(0.78)
-0.002
(-0.36)
0.708
(0.79)
-0.001
(-0.072)
Access to Safe Water
-1.915
(-0.86))
0.011
(0.94)
0.112
(0.50)
0.000
(0.56)
Proportion of Women Seats
in Parliament
1.539
(2.82)
0.006
(1.64)
2.014
(2.90))
-0.001
(-0.89)
Ratio of Girls to Boys in
Primary and Secondary
School
0.035
(1.57)
0.000
(-0.15)
0.040
(1.85)
0.000
(-0.77)
Female Unemployment
-0.740
(-1.43)
0.006
(2.59)
-0.397
(-0.54)
0.000
(0.11)
Male Progression to
Secondary School
0.062
(1.72)
-0.000
(-0.77)
0.054
(1.29)
0.000
(0.10)
Female Progression to
Secondary School
0.065
(1.52)
0.001
(0.66)
0.053
(1.02)
0.000
(0.36)
Female Adult Mortality Rate
-1.673
(-1.21)
0.009
(1.09)
-0.984
(-1.26)
0.001
(1.09)
Maternal Mortality Rate
-11.201
(-0.65)
0.043
(0.46)
2.252
(0.99)
-0.008
(-1.80)
Female Literacy Rate
-0.384
(-1.18)
0.002
(-1.18)
-0.479
(-0.89)
0.001
(0.50)
Labor Force Participation
Rate, Total
0.184
(1.16)
-0.001
(-1.31)

20
0.295
(0.89)
0.000
(-0.77)
Labor Force Participation
Rate, Female
0.125
(1.82)
-0.001
(-0.87)
-0.120
(-1.76)
0.000
(1.78)
Public Health Expenditures as
a % of GDP
4.286
(1.90)
0.006
(0.57)
6.238
(1.89)
-0.004
(-0.77)
GINI coefficient
0.094
(1.05)
0.001
(1.50)
0.259
(1.27)
-0.000
(-1.04)
Contraceptive Prevalence
0.675
(0.75)
-0.002
(-0.34)
-0.196
(-0.19)
0.001
(0.68)
Female Life Expectancy
0.030
(0.17)
0.000
(0.11)
0.018
(0.08)
0.000
(-0.10)
Note: Results are from an IV model with lag of GDP per capita as the only instrument. t-
statistics are listed in parentheses. The sample includes fifty-seven countries.
3.3.6 Short Term Changes
The 10-year panels studied in the preceding sections indicate the scenario for a
fairly long period. Since the structure of the relations may change over a 10-year period,
it is useful to do at least a preliminary study of the relations over shorter periods. For that
purpose, the 10-year period is divided into three subperiods covering 1996-1999, 2000-
2003, and 2004-2006, and pooled OLS regressions are run for each subperiod. These
regressions are different from those in earlier tables; neither a fixed-effect nor an IV
format is used, but OLS regressions are run on pooled data with logarithm of current-
period GDP per capita as the regressor for each of the 16 social development indicators.
Therefore, these estimates are not quite comparable with those in earlier tables, and need
to be interpreted with caution due to (a) potential problem of endogeneity, and (b) lack of
control for cross-country heterogeneity. Table 8 contains the estimates for the 16
variables covering each subperiod, and suggest the following observations.

21
Table 8. OLS Regression Estimates Based on Pooled Data for Sub-periods
Variable Years GDP
Coefficient t-stat
Access to Sanitation Services
1996-1999 0.262
(0.042) 6.24
2000-2003 0.187
(0.030) 6.25
2004-2006 0.238
(0.028) 8.62
Variable Years GDP
Coefficient t-stat
Access to Safe Water
1996-1999 0.156
(0.020) 7.63
2000-2003 0.105
(0.015) 7.23
2004-2006 0.091
(0.012) 7.33
Variable Years GDP
Coefficient t-stat
Proportion of Women Seats in
Parliament
1996-1999 0.331
(0.045) 7.39
2000-2003 0.317
(0.039) 8.12
2004-2006 0.299
(0.050) 6.00
Variable Years GDP
Coefficient t-stat
Ratio of Girls to Boys in Primary and
Secondary School
1996-1999 0.031
(0.015) 2.12
2000-2003 0.023
(0.006) 4.09
2004-2006 0.013
(0.006) 2.16
Variable Years GDP
Coefficient t-stat
Female Unemployment
1996-1999 -0.118
(-0.069) -1.70
2000-2003 -0.151
(0.062) -2.42
2004-2006 -0.183
(0.079) -2.30

22
Variable Years GDP
Coefficient t-stat
Male Progression to Secondary
School
1996-1999 0.059
(0.024) 2.46
2000-2003 0.052
(0.010) 5.41
2004-2006 0.059
(0.019) 3.17
Variable Years GDP
Coefficient t-stat
Female Progression to Secondary
School
1996-1999 0.065
(0.026) 2.55
2000-2003 0.060
(0.011) 5.67
2004-2006 0.070
(0.021) 3.36
Variable Years GDP
Coefficient t-stat
Female Adult Mortality Rate
1996-1999 -0.222
(0.021) -10.67
2000-2003 -0.277
(0.020) -13.66
2004-2006 0.284
(0.029) -9.83
Variable Years GDP
Coefficient t-stat
Maternal Mortality Rate
1996-1999 -0.662
(0.067) -9.93
2000-2003 -0.819
(0.055) -15.01
2004-2006 -0.901
(0.110) -8.21
Variable Years GDP
Coefficient t-stat
Female Literacy Rate
1996-1999 0.133
(0.019) 7.11
2000-2003 0.124
(0.019) 6.60
2004-2006 0.112
(0.017) 6.44

23
Variable Years GDP
Coefficient t-stat
Labor Force Participation Rate, Total
1996-1999 0.017
(0.007) 2.42
2000-2003 0.022
(0.007) 3.18
2004-2006 0.025
(0.008) 3.04
Variable Years GDP
Coefficient t-stat
Labor Force Participation Rate,
Female
1996-1999 0.019
(0.018) 1.07
2000-2003 0.033
(0.017) 1.96
2004-2006 0.048
(0.019) 2.56
Variable Years GDP
Coefficient t-stat
Public Health Expenditures as a
percent of GDP
1996-1999 0.340
(0.038) 9.01
2000-2003 0.076
(0.021) 3.57
2004-2006 0.080
(0.030) 2.65
Variable Years GDP
Coefficient t-stat
GINI Coefficient
1996-1999 -0.029
(0.022) -1.30
2000-2003 -0.060
(0.012) -4.84
2004-2006 -0.059
(0.016) -3.81
Variable Years GDP
Coefficient t-stat
Contraceptive Prevalence
1996-1999 0.299
(0.051) 5.82
2000-2003 0.206
(0.094) 2.21
2004-2006 0.111
(0.093) 1.20

24
Variable Years GDP
Coefficient t-stat
Female Life Expectancy
1996-1999 0.057
(0.004) 14.47
2000-2003 0.061
(0.005) 12.10
2004-2006 0.063
(0.007) 9.29
Note: The results are from OLS regressions with log of GDP per capita as the
explanatory variable. Standard errors, which are in parentheses, and t-statistics are
corrected for heteroskedasticity. The sample includes all fifty-seven countries.
First, in a sharp contrast from Table 3 (and Tables 4, 5 and 6), almost all estimates
have the expected signs and carry statistical significance at the usual levels. The contrast
seems remarkable, but makes the interpretation of the sub-period estimates difficult.
Second, magnitude of some of the sub-period estimates tends to be similar to that
in Table 3 for FE or IV models, but is quite different for many others. For example, while
Table 3 indicates fairly high positive FE and IV estimates for women in parliament and
public health expenditures, the corresponding coefficients are much smaller in Table 8,
but still carry statistical significance.
Third, despite some exceptions, most estimates are fairly stable across the three
sub-periods. This is interesting and makes it harder to see why several sub-period
estimates differ markedly from the 10-year estimates in terms of statistical significance,
signs, and magnitudes. One possible view is that the sub-period estimates might be
contaminated by endogeneity or cross-country heterogeneity, and may need to be
interpreted with considerable caution.
Fourth, the main conclusion appears to be that while OLS estimates from pooled
observations for the sub-periods indicate GDP per capita to be associated with social
development along most of the 16 indicators, it is difficult to draw a clear conclusion
because of the divergence between these estimates and the full-period FE and IV
estimates.
3.4 A General Summary of Indicators Where Income Helps
Public health expenditures, female life expectancy, maternal mortality rate, and
proportion of seats in parliament held by women seem significantly responsive to higher

25
incomes. By way of a general illustration, Table 9 summarizes the coefficients of three of
these variables from FE and IV models for the entire sample and the three subsamples.
Table 9. Coefficients of Variables with Strongest Effects of Income
Countries Model Regressor
Public
Health
Expenditures
Maternal
Mortality
Rate
Proportion of
Women Seats
in
Parliament
Entire
Sample
Fixed-
effects
Log GDP per
capita
1.389
(6.87)
-1.269
(-5.72)
1.197
(9.30)
IV Log GDP per
capita
3.767
(2.13)
0.932
(0.60)
1.625
(3.11)
Developed
Countries
Fixed-
effects
Log GDP per
capita
1.025
(3.83)
-3.87
(-2.91)
2.115
(7.50)
IV Log GDP per
capita
1.207
(2.54)
-6.146
(-2.64)
2.12
(2.22)
Developing
Countries
Fixed-
effects
Log GDP per
capita
0.925
(3.00)
-1.226
(5.91)
1.275
(7.79)
IV Log GDP per
capita
-0.094
(-0.04)
-2.600
(2.80)
1.048
(1.84)
Under-
Developed
Countries
Fixed-
effects
Log GDP per
capita
3.19
(7.41)
-1.156
(-2.65)
0.931
(3.23)
IV Log GDP per
capita
4.174
(3.72)
-1.344
(-1.27)
2.085
(2.63) Notes: Related t-statistics are in parentheses. Each dependent variable is measured in natural logs. The
numbers are taken from Tables 3, 4, 5, and 6.
It may be seen that the FE models show these indicators responding well to
income growth in all cases. The IV format also generally supports that scenario, but
indicates a weak response or unexpected sign for (a) health expenditure in developing
countries, and (b) maternal mortality in the full sample. However, one can make a general
statement that social development along these indicators is helped by income growth. For
other indicators, the position is somewhat ambiguous. It is possible that income helps
social development along some of those indicators also in some countries and during
certain periods, but it is difficult to make a general statement. While Table 9 is intended
to show a quick and general picture, the next section provides a slightly more detailed
indication of the cases where income helps.

26
4. Summarizing and Concluding Observations
This paper studies the effect of income growth on social development. Data for 57
countries on 16 indicators of social development covering the period 1996-2006 are used.
The relation is studied for the 10-year panel for the entire sample and for three subsets of
countries. A preliminary analysis is also done for three subperiods. In most cases, each
social indicator is regressed on real GDP per capita. In addition, the possible role of
democratic institutions and government stability relative to the effect of income on social
development is also considered. Estimates for the 10-year panels are obtained by using
the fixed-effects (FE) format and also through a simple instrumental-variable (IV)
approach in which one-period lag of GDP per capita is used as an instrument. Ten points
summarize the main findings.
First, there is considerable divergence between FE and IV estimates in many
cases, and the latter tend to show significance in fewer cases. This makes a clear or
general inference difficult for many indicators.
Second, in the 10-year panel of 57 countries, both FE and IV coefficients show
that increased income significantly helps social development in terms of women’s
representation in parliament, female labor force participation, and public health
expenditure. For other indicators, a clear conclusion is difficult due to FE and IV
estimates being different.
Third, for the group of developed countries, FE and IV estimates in the 10-year
panel show that increased income helps social development in terms of women’s
representation in parliament, female mortality, maternal mortality, female and total labor-
force participation, public health expenditure, and female life expectancy. The estimates,
however, show a decline in girls-boys ratio in school with increased income. It is
interesting to note that the developed-country group indicates a more pervasive effect of
income on social development than the rest of the sample.
Fourth, for the middle-income (developing) group, the 10-year panel shows that
only women’s representation in parliament and maternal mortality are helped by
increased income in terms of both FE and IV models, although the former is only

27
marginally significant in terms of the IV estimate.. For other indicators, the position is
ambiguous.
Fifth, for the low-income (underdeveloped) group, both FE and IV estimates from
the 10-year panel suggest that increased income helps in terms of women’s representation
in parliament, girls-boys ratio in school, female literacy, and public health expenditure.
Increased income, however, seems to lower overall and female labor-force participation.
Sixth, looking at the entire sample, democratic institutions and government
stability seem to have little role in the relation between income and social development.
The estimates in this part, which is based on addition of interaction terms, appear to have
been weakened by collinearity between income and the interaction terms. Despite lack of
significance of the interaction terms in most cases, coefficients of the income variable are
quite different from those without the interaction term in many cases.
Seventh, estimates from three shorter panels of the entire 57-country sample show
statistical significance and expected signs for almost all indicators and subperiods.
However, since these are OLS estimates from pooled panels, it is difficult to draw strong
conclusions due the potential problems of endogeneity and cross-country heterogeneity.
Eighth, the overall message from the study seems to be that the role of income in
enhancing social development is significant and possibly sizable in terms of at least three
or four indicators, but is ambiguous for others.
Ninth, study of the relation across subsets of countries that have different income
levels, and across subperiods, suggests that the role of income in social development
probably varies across countries and time. Considering that and the preceding paragraph,
one may say that it is not evident that income growth by itself may be expected to
generate “adequate” social development. The role of public policy may be important in
helping income growth to generate commensurable social development.
Last, there are several ways in which this research can be refined. These include
(a) expansion of the country coverage, (b) consideration of other indicators of social
development, (c) use of richer models and better estimation procedures, (d) robustness
analysis, (e) greater attention to the quantitative magnitude of the impact of income on
various dimensions of social development, and (f) use of an income measure that has
greater cross-country comparability.

28
References
Barro, Robert. 1996. “International Measures of Schooling Years and Schooling
Quality.” The American Economic Review.
Barro, Robert and Jong-Wha Lee. 1997. “Schooling Quality in a Cross-Section of
Countries.” Working paper 6198. Cambridge, Mass.:National Bureau of
Economic Research.
Dollar, David and Aart Kraay. 2002. “Growth is Good for the Poor.” Journal of
Economic Growth. Vol. 7 No. 3, pp. 195.
Dollar, David and Roberta Gatti. 1999. “Gender Inequality, Income, and Growth: Are
Good Times Good for Women?” Gender and Development, Working Paper
Series, No. 1. The World Bank.
Easterly, William. 1999. “Life During Growth.” Journal of Economic Growth. Vol. 4 No.
3, pp. 239.
Forsythe, Nancy, Roberto Patricio Korzeniewicz, and Valerie Durrant. 2000. “Gender
Inequalities and Economic Growth: A Longitudinal Evaluation.” Economic
Development and Cultural Change. Vol. 48 No. 3, pp. 573-617.
Guiso, Luigi, Paola Sapienza, and Luigi Zingales. 2006. “Does Culture Affect Economic
Outcomes?” The Journal of Economic Perspectives. Vol. 20 No. 2, pp. 23-48.
Klasen, Stephan. 1999. “Does Gender Inequality Reduce Growth and Development?
Evidence from Cross-Country Regression.” Gender and Development, Working
Paper Series, No. 7. The World Bank.
Mankiw, Gregory, David Romer, and David Weil. 1992. “A Contribution to the Empirics
of Economic Growth.” The Quarterly Journal of Economics.” Vol. 107 No. 2, pp.
407-437.
Prasad, Naren. 2008. “Growth and social development in the Pacific Island countries.”
International Journal of Social Economics. Vol. 35 No. 12, pp. 930-950.
Reuveny, Rafael and Quan Li. 2003. “Economic Openness, Democracy, and Income
Inequality: An Empirical Analysis.” Comparative Political Studies. Vol. 36 No. 5,
pp. 575

29
Sen, Amartya. 1998. “Mortality as an Indicator of Economic Success and Failure.” The
Economic Journal.” Vol. 108 No. 446, pp. 1-25.
Solow, Robert. 1956. “A Contribution to the Theory of Economic Growth.” The
Quarterly Journal of Economics.
Toye, John. Dilemmas in Development. Cambridge Publications: Blackwell Publishers,
1993.

30
Appendix. List of Countries
Algeria2 Germany
1 Morocco
2
Argentina2 Ghana
3 Namibia
2
Barbados2 Hungary
2 Norway
1
Belarus2 Iceland
1 Panama
2
Belize2 India
3 Paraguay
2
Bolivia2 Iran, Islamic Rep.
2 Peru
2
Botswana2 Jamaica
2 Samoa
2
Bulgaria2 Kazakhstan
2 Slovak Republic
2
Cambodia3 Korea, Rep.
1 St. Lucia
2
Colombia2 Latvia
2 Switzerland
1
Costa Rica2 Lebanon
2 Syrian Arab Republic
2
Croatia2 Lesotho
3 Tonga
2
Czech Republic2 Lithuania
2 Trinidad and Tobago
2
Ecuador2 Macedonia, FYR
2 Tunisia
2
Egypt, Arab Rep.2 Mauritania
3 United Arab Emirates
1
El Salvador2 Mauritius
2 Vanuatu
2
Estonia2 Mexico
2 Venezuela, RB
2
Finland1 Moldova
3 Vietnam
3
Georgia3 Mongolia
3 Yemen, Rep.
3
Note: * 1, 2, and 3 indicate inclusion in the Developed, Developing, and Under-developed
country subsets, respectively