economic growth of korea under the japanese...
TRANSCRIPT

Hitotsubashi University Repository
Title
Economic Growth of Korea under the Japanese
Occupation -Background of Industrialization of
Korea 1911-1940-
Author(s) Mizoguchi, Toshiyuki
Citation Hitotsubashi Journal of Economics, 20(1): 1-19
Issue Date 1979-06
Type Departmental Bulletin Paper
Text Version publisher
URL http://doi.org/10.15057/7960
Right

ECONOMIC GROWTH OF KOREA UNDER THE JAPANESE OCCUPATION
BACKGROUND OF INDUSTRIALIZATION OF KOREAt 1911-1940
By TOSHIYUKI MIZOGUCHI*
Introd uction
This paper aims to show the trend of industrialization of Korea under Japanese occupation and to present a preliminary hypothesis to explain it. This attempt would be
meaningful, at least, for two different kinds of studies. The first is to supply the informa-
tion of basic situation of industrialization for the development after the Liberation of Korea.
Many economists are now interested in the recent industrial development in Korea. In order to evaluate the development, we need to remember the level of industry under Japanese
occupation as the initial condition of the post-war Korean economic development. Of course, there are many problems to judge whether or not we could relate the pre-war situa-
tion of industry with the industrial development after the Liberation. No duobt, most
of industries in Korea were occupied by Japanese before 1945. The Korean War destroyed
most of equipments which were left in Korea in 1945. Since the Korean people engaged
mainly in unskilled works, they could hardly get the job treating under Japanese rule. In
this sense, general arguments seem to stress that the Korean industrial development can
be treated without respect to the industrialization under Japanese occupation. This may
be probably true but we need to examine in detail to get the final conclusion because, generally
speaking, the economic development usually depends on the past condition. The work in this paper would supply some numerical information for this question although we must
supplement them with historical evidences to get our firm conclusions.
The second aspect seems to be more important than the first. The Japan Empire occupied two area under her control before 1 945: Taiwan and Korea. However, there existed some differences in her policies between Taiwan and Korea. One of them was the
policy for industrialization. While the Taiwanese industry was restricted only for food
industry, various kinds of industries were setted in Korea. This rose two kinds of questions.
The first is why the industries were developed by Japanese rulers in Korea. The second
is what impacts were found in Korea by the policy.
In order to answer these problems we must examine them from historical and economical
approaches. These would request the interdisciplinary cooperation and the time expensive
* Professor (Kyo~'ju) of the Institute of Economic Research, Hitotsubashi University. t This paper was originally written as a report for the Multi-Disciplinary Conference on the Korean In-
dustrialization in University of Hawaii in May, 1977. The revision of the draft was done as one of works of
Joint Project on the Quantitative Economic Historical Analysis of the "Japan Empire" (Chairman, Pro-fessor Mataji Umemura) sponsored by the Ministry of Education, [A-341006].

2 HITOTSUBAsm JOURNAL OF ECoNoMlcs [June research. To promote such an attempt is beyond the writer's ability. What he is intending
here is to supply, the statistical data for these studies and to present assumptions . which he
could arrive only by investigating statistical figures. '
The statistics used here are taken from this writer's study as well as other Japanese
researchers. This writer tried to estimate the GDE indicators for Taiwan and Korea under
Japanese rule.1 The original purpose of this work is to niake cleai the economic activities
of Japan Empire before 1945 as a whole by combining the estimate of GDE for Japan by
Ohkawa's project.2 Therefore, the writer's estimates would be incomplete when some want to study the problem of colonial policies. For instance, although he estimated the
capital formation depending on the GDE concepts, he did not divide the figures into those
for Japanese and Korean firms. However, within such a restriction, we can discuss some
kinds of problems. His estimate includes the industrial production index for Korea which
can be used for our purpose. The other kinds of data he used are as follows :
Shigeru Ishikawa's estimates on agricultural production in Korea and Taiwan,
Miyohei Shinohara's estimates on the industrial production in Taiwan,
Konosuke Odaka's estimates on employments and wages in Taiwan and Korea.3 This paper is composed of five sections. After describing the general economic level
by using the GDE indicator as well as the production indices of agriculture and manufactur-
ing industries, we shall examine the economic changes by the composition of GDE, private
and government consumptions, capital formation and foreign trade. The role of foreign trade will be examined intensively, because this writer believes that this could explain the
different type of economic growth between Taiwan and Korea under Japanese occupation.
Based on this study we shall examine the industrialization in Korea and Taiwan, and
analyze its impact on the Korean economy including the employment and wages.
I tf Growth in Korea and Taiwan General Feature o Economic
It is said that the economic growih of Japan was remarkable before the Second World
War in the international standard. According to the estimate by Ohkawa's project, the
growth rate of the real GDP or the real GDE was above 3 % on average in this period. The
rate was nearly equal to the one of the U.S. and Sweden and higher than other developed
countries'.4 Therefore it is interesting to compare the growth rate of GDE of Korea and
Taiwan to the Japanese. Since we have no estimates covering relatively long period, we are forced to use the pre-
liminary GDE indicator of this writer. This writer calls the estimate as the "GDE indicator"
not as the GDE estimate. This is because the data is preliminary in the following sense :
(1) our GDE indicator does not cover the invisible trade as well as the changes in
* Mizoguchi (1975). ' Onkawa-Takamatsu-Yamamoto (1974). * Ishikawa (1972), (1973), Odaka (1969), (1971), (1973) and Shinohara (1972). There are some contribu-
tions to the historical statistics on Taiwan and Korea. T.H. Lee approached the Taiwanese economy from production side and estimated the GDP (T.H. Lee (1971). See also Ho (1978)). Y.K. Lee tried to estimate the GDP for Korea and the approach was succeeded by Suh (Y.K. Lee (1971) and Suh (1974)). Ban examined in detail the agricultural statistics (Ban (1979)). The comparison of these estimates with ours is now pro-ceeding as a part of joint project mentioned int), so let us use preliminarily our own estimates in this paper.
' See Kuznets (1968).

1979] EcoNoMlc GROWm OF KOREA UNDER THE JAPANESE occupAnoN 3
stocks,
(2) there remains area to be revised regarding private consumption expenditure figures by use of the commodity flow method, and
(3) it is said the coverage of statistics had been gradually increased in the early period
of Japanese occupation, so some revisons will be necessary to obtain the reliable
figures.5
However, this writer be]ieves that the indicator could be used, at least, to show a broad
trend of the economic development in this area. If his view could be accepted, we can
calculate the growth rate of real GDE as follows.6 According to these figures, the growth
TABLE 1. GROWTH RATE OF REAL GDE
Period
l 903- 1 938
1911-1938
1903-1912 1908-1917 1913-1922 1918-1927 1923-1932 1928-1937
Korea
3.57
8. 74
2. 73
o. 70
2.98
%
Taiwan
3.21% 3. 80
2. 73
3. 16
6.67
5. 09
3. 55
1.21
Ja pan
3, 24 %
3, 36
2.27
3.09 5. 2 1
1 . 50
2.35
4. 70
Source: Mizoguchi (1975) for Taiwan and Korea and Ohkawa (1974) for Japan.
rate of real GDE in Taiwan and Korea exceeded that of Japan between 1911 and 1938. To make clear the process of the economic development, two additional kinds of works will be required : (1) an examination of the over time changes of growth rate of real GDE
and (2) the decomposition of GDE into its components. Regarding the first kind, we calculated the annual rate over ten years for six divisions of period, Note that these suc-
ceeding divisions overlap with each other. The growth rate was relatively low in both
Japan and Taiwan before 1917. The high rate of growth can be investigated in the period
of 1913-22 in all area. Especially, the Korean growth rate was very remarkable. One
of the reasons may be the overestimats of the rate caused by the changes of coverages of
surveys as was mentioned earlier, but the rate was too high to be explained only this factor.
The 1920's could be considered to be a stagnant period in Japan and Korea, however, it is
interesting that the Taiwanese economy had kept its steady growth. The reverse tendency
could be investigated in the period of 1928-37. One of the purposes of this paper is to
explain these differences and to relate it to the industrializatior of Korea under the Japanese
occupation.
Regarding the approaches by the GDE components, we can consider two kinds of methods : i.e., from the production and from the expenditure. It is convenient for us to
start from the latter because we estimate the GDE indicator from the expenditure side as
is shown in Table 2. Because the growth rate of total GDE can be approximated by the weighted average of the growth rate of each component by using the percentage as its weight,
' It is probable that as the organization of administration settled in local area the coverage of statistics
enlarged. Such a trend would be remarkable in the early period of the Japanese occupation. The margin of errors caused by this situation should be examined as the future studies.
' The growth rate of variable X(t) is estimated by applying the least squares regression oftime t for the
formula, Iog.X(t)=a+bt.

4 HITOTSUBASHI JOURNAL OF ECONOMICS [June these two kinds of indicators can show the degree of contribution of each component for
the economic development. Judging from the percentages, the private consumption is, of
course, the most important factor, but the growth rate is the lowest among these components.
TABLE 2. GROWTH RATE OF GDP IN 1911-38 AND CoMPosmoN OF GDP lN 1935 (percent)
Growth Rate
Ja pan
Private Consumption 2.8 ' Government Consumption 5.1 Capital Formation
Construction 3. 1 Producer's
Equipments 2.8 Ex ports 6. 7 Imports (minus) 5.8 Total GNP 3.3
Taiwan Korea 3.2
4. l
6, 7
6. 4
6,5
4, 9
3. 8
3. l
6. 5
5.8
9.0
10.6
8.4
3.6
Composition
Japan
64. 5
15. l~
19. l
25.3
- 24. 2
100.0
Taiwan
64. 1
5.6
9. 3
2. 1
40.5
-22.0
100.0
Korea
85.7
7.3
6. 4
2.8
2'~.5
-24.7
100.0
sou,'ce: Mizoguchi (1975).
The export was the leading role in the economic development of Taiwan and Korea under
the Japanese occupation. Especially, the Korean rate was surprisingly high in the interna-
tional standard before 1940. While the Taiwanese rate was lower than the Korean, the contribution to the GDE growth was high because the export-GDE rate had been very high.
We cannot neglect the role of capital formation in Taiwan and Korea in considering the
economic development. In Taiwan, the construction investments occupied relatively large
portion of the GDE and its growth rate was also high. The Korean growth rate was high in the investments on producer's equipments. This is especially true in the late period of
the Japanese occupation and can be related to the industrialization of Korea in this period.
Turning to the production side, the growth rate of agricultural production was low
in Japan and Korea, especially, this was true in the period of 1918-32. In contrast to these,
the Taiwanese agriculture seemed to have been developing in overall period under the
Japanese occupation. The development of manufacturing industry was remarkable in Japan,
Taiwan and Korea. The growth rate was surprisingly high in Korea in the period of 1928-
37. However since amounts of agricultural production were relatively large in the GDP,
TABLE 3 . GROWTH RATE OF AGRICULTURE AND INDUSTRY PRODUCTION
1 903- 1 2
1 908-1 7
1 9 1 3--22
1 9 1 8-27
1 923-32
l 928-3 l~
1911-38 1 9 1 4-38
Agriculture
Japan
0.9
2. 7
0.4
-0.0 1.2
O. 7
0.6
Taiwan
l.5
2.0
l.8
4. 3
4. 2
3. 5
3. 4
Korea
2.4
-O.9 l.4
3. 7
1.9
Industry
Ja pan
5.4
3. 1
7. 1
2.8
5. 6
Taiwan
4. 2
6.9
7.0
4. 6
5.3
Korea
6. 1
6. 2
4. 4
12.2
6. 7
Source: Ishikawa (1973), Shinohara-Ishikawa (1968) and Mizoguchi (1975),
19791 EcoNoMlc cRowrH OF KOREA UNDER THE JAPANESE OCCUPATION
we can safely say that the economic development in Taiwan had been supported by agricultural production. However, the Korean economy had been stagnant because the slow rate of growth of agricultural production.
5
the
of
II Impacts of Foreign Trade on Economic Growth
In Section 1, we suggested that the increases of exports were one of the important factors
in the development of Korean and Taiwanese economy under the Japanese occupation. Two kinds of remarks should be written here regarding the nature of trade statistics. First,
we treat these area as independent countries, so the trade with Japan as well as that between
them is defined as a part of foreign trade. Second, the trade between Japan and China is
included in the Korean trade when the Korean railway is used for the transportation.
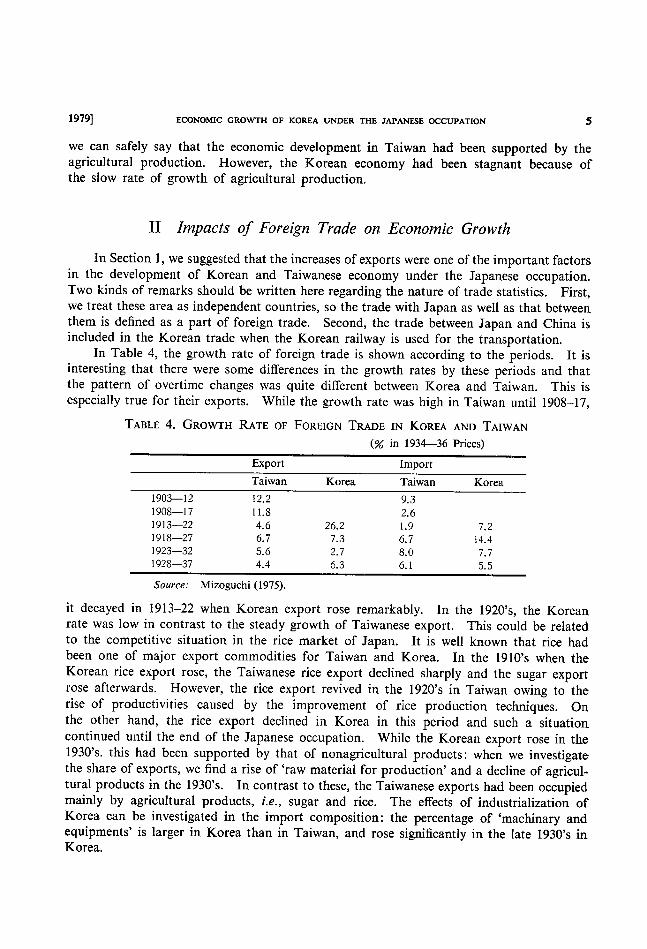
In Table 4, the growth rate of foreign trade is shown according to the periods. It is
interesting that there were some differences in the growth rates by these periods and that
the pattern of overtime changes was quite different between Korea and Taiwan. This is especially true for their exports. While the growth rate was high in Taiwan until 1908-17,
TABLE 4. GROWTH RATE OF FOREIGN TRADE IN KOREA AND TAIWAN
(% in 1934-36 Prices)
1 903- 1 2
1 908-1 7
l 9 1 3-_・2
l 9 1 8-27
1 923-32
l 928=37
Export
Taiwan
12.2
ll.8
4. 6
6. 7
5.6
4.4
Korea
26. 2
7.3
2.7
6. 3
Import
Taiwan
9. 3
2.6
l.9
6. 7
8.0 6. 1
Korea
7.2
14.4
7. 7
5. 5
source: Mizoguchi (1975).
it decayed in 1913-22 when Korean export rose remarkably. In the 1920's, the Korean
rate was low in contrast to the steady growth of Taiwanese export. This could be related
to the competitive situation in the rice market of Japan. It is well known that rice had
been one of major export commodities for Taiwan and Korea. In the 1910's when the Korean rice export rose, the Taiwanese rice export declined sharply and the sugar export
rose afterwards. However, the rice export revived in the 1920's in Taiwan owing to the
rise of productivities caused by the improvement of rice production techniques. On
the other hand, the rice export declined in Korea in this period and such a situation
continued until the end of the Japanese occupation. While the Korean export rose in the
1930's. this had been supported by that of nonagricultural products: when we investigate
the share of exports, we find a rise of 'raw material for production' and a decline of agricul-
tural products in the 1930's. In contrast to these, the Taiwanese exports had been occupied
mainly by agricultural products, i.e., sugar and rice. The effects of industrialization of
Korea can be investigated in the import composition: the percentage of 'machinary and equipments' is larger in Korea than in Taiwan, and rose significantly in the late 1930's in
Korea.

6 HlroTSUBASHI JOURNAL OF ECONOMICS [June In the analysis on the over time changes of foreign trade, it is very interesting to study
the terms of trade-the ratio of export prices to import prices-in Taiwan and Korea, which
are shown in Figure I . The Taiwanese indices declined in the early period of Japanese
FIG. I TERMS OF TRADE, CEREAL RATIO AND RJ~AL AGRICULTURAL WAGES
IN TArwAN AND KOREA UNDER JAPANESE RULE
120
~; ~:: f~
~ - 100
~ 80 ~ ;)
60
'/'c~; 1.5 ~S
~J
:!' 1.0 ~O
~;
c~
~ 0.5
/
/
/
/ '¥ Il ri ft ¥ 11,L I I / I l¥ l VL I / /
tll ~/ t L~' ~ ~J l
Tai~vanese terms of trade
¥
'b / Y 't--'
'L ¥ ¥ t
1 1 x ~
Korean terms of trade
v /
lrl L ,
l l
v
r~ // I~ f¥ f~ V ¥._ ¥ / v ~J
Cereal export ratio
Korean real lvage
/
l¥ / ~ ¥ -~ -- -~ ,. '*~ Tai¥vanese real lvage
s.()
5.0
2.0
c ~1 c,
(:,
~,
U
1900 1905 1910 1915 1920 192b 1930 1935 source: Mizoguchi (1975).
occupation then turned to rise. The Korean indices rose from 1910 to 27 and then declined
afterwards. We can find a reverse trend in the Taiwanese indices if we could exclude the
period of 1923-27. Generally speaking, it is not surprising to find reverse trends between
two countries. For instance, it is natural that the indices move inversely between developed
and less developed countries. This is also ture between two countries which are inter-
depended with each other through the foreign trade. But the trade between Taiwan and
Korea had been inactive, and the level of industrialization was not much different between
them. The figure includes so called the cereal export ratio which is defined as the ratio of
Korean cereal export to Japan to that of Taiwanese. This informs us that the share of
Korean export increased until 1922 and declined afterwards. This turning point was near
the peak of Korean terms of trade and this suggests us that the role of rice export was very
important to explain the changes of terms of trade of Taiwan and Korea. When we inves-
tigate the rice export prices a remarkable rise can be found in Korea in the 1910's. Since
the Korean rice price was lower than Japanese or Taiwanese in the ear]y 1910's; the export
of rice rose significantly and the terms of trade were improved. On the other hand, the
growth of Korean rice export reduced the relative export price of Taiwanese rice and worsened
the Taiwanese terms of trade in this period.

1 979] EcoNoMlc GRowm OF KOREA UNDER THE JAPANrsE occupAnoN 7
However, this tendency was broken by the rise of productivity of Taiwanese agriculture
through the introduction ofnew variety. The increase of investments for Taiwanese agricul-
ture was also effective to raise the productivity. Owing to the increase of Taiwanese rice
export to Japan, the relative price of rice declined and as the result, the Korean terms of
trade made worse. This was one of reasons why Korean agriculture had not developed under the Japanese occupation even though Korea got a relatively large export market.
Why then the Taiwanese terms of trade were improved regardless of the decline of relative
rice price ? It should be noted that Taiwanese agriculture had two major commodities:
rice and sugar canes. There were some descriptions to note that the wholesale price of
sugar canes was decided in such a manner as to assume the income of sugar cane producer
equal to the rice producer's.7 Owing to the low rice price in the 1910's, it was relatively
easy to spread the sugar cane's field. However, because of the rise of rice productivity, the
rice producer's income rose in spite of the decline of rice price. This pulled up the relative
price of sugar cane. In the other words while, the rise of productivity of Taiwanese rice
damaged the Korean agriculture and worsened the Korean terms of trade, it developed Taiwanese agriculture and improved the terms of trade through the rise of relative price of
sugar canes. This may be closely related to the industrialization problem of Korea and
Taiwan as will be discussed in the latter section of this paper.
These results can explain the over time changes of real wages of agricultural workers.
As is shown in Figure 1, the real wage of agricultural workers rose in the 1920's in Taiwan
and this had its origin in the increase of rice productivity as well as the up of relative price
of sugar cane. In contrast to this, the Korean real wage declined after the early 1920's and
would be explained by the down of rice relative price.
Finally, a comment should be added here about the trade balance of Taiwan and Korea
because this is closely related to the finance of capital formation. Although the Taiwanese
foreign trade had deficits before 1900, it turned to have large surplus afterwards. The ac-
cumulated claim for foreign trade exceeded I billion yen in the middle 1930's. In contrast
to this, the Korean foreign trade had deficits in most of years under the Japanese occupa-
tion, and its accumulated liabilities amounted to I billion yen in the late 1930's.
III Capital Formation
In Section I we pointed out that the capital formation was one of the important engines
to accelerate the economic growth of Korea and Taiwan under the Japanese occupation. Therefore, we shall examine here the level of capital formation and its composition regarding
these area. This is also important to consider the industrialization problem. According
to the national accounts, the capital formation consists of the following categories : (1)
construction, (2) machinary and equipments, (3) apparatus and furniture, (4) Iarge livestock
and pernnia plantings and (5) increase of stocks. We tried to estimate these catefories
by the commodity flow method, and obtained figures for (1) and the sum of (2) and (3).
" Generally speaking, the production of rice had been more profitable than sugar cane production. Therefore, Taiwanese farmers wanted to use their paddy field for rice production. In order to keep the sup-ply of sugar canes for suger industry, the price of sugar canes was decided in such a level to guarantee as
much income as one expected from the rice production.

8 HITOTSUBASHI JOURNAL OF EcoNoMlcs [June Because amounts of category (4) were generally small, we can neglect them for a broad
study. The amounts of category (5) would be too large to be neglected and about lO% of
total capital formation, but the estimation involves very difficult treatments which require
various kinds of information. Therefore, our discussions are forced to be restricted only
for the categories from (1) to (3). (In order to simplify the description we shall call
the sum of (2) and (3) as the investments for equipments in the following discussion).
Regarding our commodity flow estimate, one remark should be added here. According to the experience of Japanese estimates, the application of commodity method tended to
underestimate the residual construction regarding the historical statistics.8 However, we
had no reliable data to correct this bias unlike the case of Japanese estimates.
In Table 5, a comparison was made for the growth rate of capital formation by period.
Total amounts of investments are also shown in the table. The Korean amount of total
contruction investments was nearly equal to the Taiwanese for the period of 1911-38.
However we should note that the relatively large scale investments were done in Taiwan before 1910. Further since the construction investments had a close relation to the welfare
ofpeople, we should compare them in per capita bases. The result shows that the Taiwanese
construction investments exceeded the Japanese level and were about four times of the
Korean. Since our estimates depended on the commodity flow method, we could not know
what kinds of construction had been made. However, judging from various kinds of descriptions as well as the composition government budgets, the most dominant factor to
explain these differences would be the construction for agricultural production: the famous
construction was the dam for irrigation called Kanan-Taishu, in the late 1920's. Although
we need to admit that these construction had been done with imperfect agreement of Taiwanese farmers as was criticized by some scholars, it is also true that these investments
TABLE 5. GROWTH RATE OF CAPITAL FORMATION AND TOTAL INVESTMENTS
(1934-36 Prices)
Construction Equipments Growth Rate l 903- I _'
l 90{~ 1 7
l 9 1 3-'_2
l 9 1 8-27
l 923-32
1 928-37
l 91 1-38
Japan
6, 9
3.6
6, l
4.9
l.2
3,5
3. 1
(%)
Taiwan
14.5
2.8
11.3
4. 9
7. 5
7. 4
6.6
Tota] amounts of investments (million yen)
1 91 1-38 18,515 l,451
Per capita investments (Yen / Year)
l 91 1-38 11.01 12.08
Ko rea
2. 3
3. 4
ll.3
7.6
5. 7
1,567
3.00
Japan
11.0
9. 6
12.0
-13.9 - 0.4
12. 1
2. 8
18,370
l O. 89
Taiwan
23. 2
-17.2 15.2
5.3
9.0
6.3
6.4
3~,3,923
2.30
Korea
14.4
l.8
6. O
11.6
8. 9
699, 652
1.34
Source: Mizoguchi (1975).
B Emi-Ishi (1971) pointed out that the residential construction seemed to be underestimated when the commodity fiow method was adopted for the capital formation, by using the scarcity information from the historical statistics.
ECONOMIC GROWTH OF KOREA uNDER THE JAPANESE OCCUPATION
were effective to rise the agricultural productivities and as the results to increase farm house-
hold income. The Taiwanese construction investments grew relatively smoothly in overall period
under the Japanese occupation, though there were some fiuctuations caused mainly by the
railway construction. The construction investments grew slowly in Korea before 1920's.
Owing to large scale projects to development of North Korea and to increase the gold and
silver production, the construction investments rose in the 1930's. But it is this writer's
impression that there were relatively small investments aiming to improve agriculture pro-
duction in Korea. When we remember that the dominant part of population engaged in
agriculture the implication of the difference should be noted.
Korean investments on producer's equipments were nearly double of the Taiwanese. While the Taiwanese investments grew remarkably in the early period of Japanese occupation
they did not increase remarkably after the 1920's. This depended on the fact that the Taiwan-
ese manufacturing industry was restricted only for the sugar industry. The Korean invest-
ments rose significantly in the 1910's and the 1930's. The latter originated from the settle-
ment of heavy industry in North Korea. Now, Iet us touch upon the role of government in the capital formation. Since the
budgetary reports divide their expenditures into detailed categories, we can classify total
expenditures into (1) government consumption, (2) government capital formation, (3) government transfer expenditures and (4) expenditures to manage public enterprises such
as railway, if we admit some margins of errors. It is considered that the government capital
formation had an important role in the economic development in Taiwan and Korea under
the Japanese occupation, and so it is interesting to study the share of government capital
formation in total investments. However, in comparing the figures from budgetary data
to those from the commodity fiow method, we should remember the differences of concepts.
Although the former includes the purchase of land or old buildings or equipments, the latter
covers only new investments. But it is not meaningless to compare them if the conclusion
is used with cautions. The Korea growth rate of governmed investments was much higher
than the Taiwanese : especially the rate of Korea was high after the mid 1 920's. The average
growth rate in the period of 1911-38 was 3.6~ in Taiwan and 5.6% in Korea. If we neglect
the differences of the concept of capital formation, we can calculate the share of govern-
ment investment in the total capital formation. In contrast to the Taiwanese decline the
share had been nearly constant in Korea. The.se differences could be explained by the
avairability of investments fund in thes area. It was reported that financial situation
was relatively untight in Taiwan under the Japanese occupation because of the surplus of
trade balance.9 It is not surprising that the investments were financed by the private
sector. Further the government investments for the agricultural sector drew the invest-
ments by farmers. In contrast to this, the financial market was tight in Korea, and
the Government General must play an important role in the capital formation. Especially.
the investments on North Korea in the 1930 had been supported by the government expend-
itures. This fact should be remembered when we consider the industrialization problem
in Korea and Taiwan under the Japanese occupation.
g Such a description can be found in various kinds of publications. For mstance see Talwan JIJO (Condi
tions of Taiwan) by the Government General of Taiwan.

lO HITOTSUBASHI JOURNAL OF EOONOMICS [ June
IV Private and Government Consumption
According to the results in Section 1, the consumption expenditure grew slowly in Japan,
Taiwan and Koear. Since we have not completed our estimates on private consumption expenditures by using the commodity flow method, we must make some reservations on our figures. However, we can safely say that the growth rate was very low in these area.
In Table 6, the growih rate and level of real consumption are compared among Japan,
Taiwan and Korea. Because Japanese figures depended on the commodity flow method and our estimates were done by combining the family budget data and the time-seires of
real wages, it is problematic to compare the absolute levels. However, we can say that
the consumption level was relatively high in Taiwan. We should note that the level grew
relatively smoothly in Japan and Taiwan if we exclude the period of 1933-37.10 The Korean
consumption level was very low, and that the level did not rise after 1918.
Anyway, it is very important to remember that the per-capita real consumption expendi-
ture grew in a low rate such as from 0.8 to 1.8% in Japan, Taiwan and Korea. It is often
said that the Japanese industrial development had been supported by the low wage rate
TABLE 6. GROWTH RATE AND PER-CAPITA AMOUNTS OF PRIVATE AND GOVERNMENT CONSUMPTION EXPENDITURE (Unite : % for Growth Rate and Yen
(1934-6 Prices) for Expenditures)
Government Consumption Private Consumption Private Consumption (Per Capita)
Japan Taiwan Korea Japan Taiwan Korea Japan Taiwan Korea Growth Rate 1903-1 2 - 4. 8 1 5. l l 908- 1 7 - O. O 6. 6 19 1 3-?_2 5. 8 1 5. 6 6. 7 1918-27 2.9 6,8 14.5 1923-32 7. 3 4, O 5. 7 1928-37 5. 1 5, 1 5.3 19 1 1-38 5. 1 4. 1 6.5
Per Capita Consumption Expenditurs 1935 30. 3 30. 3 10.6
2. 4
2. 3
4. 7
3. 1
l.4
2-.5
2.8
7. l
0.9
l.O
6. 2
5. l
3.4
0.0
3. 2
l.3
0.9
7.3 3.6 3. I I .9 l . O -O. 3
2.2 1.0 3. l 0.8
181
-0.5 -0.5 5. 2 6. O 3. 2 1 . 7 1.0 -0.5
-2.6 0.3 1.5
l 53
l.8
81
source: Mizoguchi (1975) and Ohkawa (1974).
before the Second World War, and the low rate of wages had been kept owing to the relatively
low prices of food. Such an explanation can be applied for Taiwan and Korea under the
Japanese occupation.
In Section 1, we have pointed out that the growth rate of government consumption in
Korea was relatively high. It is natural that the consumption rose significantly in the early
period of Japanese rule because administrative institutions had gradually settled up and
*' Chang (1977) wrote that he could not agree the declining trend of real wages in the 1930's in Taiwan and considered that the author's CPI in thes period should be revised to some extents.

1979] EcoNOMIC GROWTH OF KOREA UNDER THE JAPANESE OCCUPATION 1 1
some new projects were scheduled. If we exclude the period of 1910-15 in Taiwan,n the
real government consumption grew steadily in both Taiwan and Korea. The level of con-
sumption expenditure was not much different between Taiwan and Korea. However, when we consider the government consumption, we need to examine its nature.
This, of course, included various kinds of expenditures to contribute to the welfare of people ;
for example, those for public health, education, agricultural production etc. However, they
also involved some expenditures which were irrelevant to the welfare : for example, ex-
penditures for the Japanese shrines, the police system to controle the colony, etc. Therefore,
the growth of government consumption cannot be related to the increase of benefits of
people. In order to solve this problem, we must reclassify the government consumption
expenditures by categories of objects. Since Taiwanese budget data had a detailed classsi-
fications, we can proceed such an attempt. According to this writer's preliminary result,12
nearly constant was the share of expenditures which could be related to the welfare of people.
Therefore, at least for the Taiwanese case, the growth of government consumption expendi-
ture had been meaningful even if we consider the welfare being of colonial people. In order
to apply such a study for Korea, we must collect the original budgetary reports because the
classification of budgets shown in Statistical Yearbook of Government General o,f Korea was
too broad. These attempts will be done in the future.
V Trend and Impacts of Industrialization in Korea and
Taiwan Under the Japanese Occupation
Based on the analysis on the GDP components, Iet us proceed our consideration for
the trend of industrialization in Korea and Taiwan under the Japanese occupation. As
was shown in Table 3, the growth rate of manufacturing production was high in Taiwan and
Korea in comparison with the international standard before the Second World War. Especially, the development of Korean manufacturing industry was significant in the 1930's.
This can be supported by the annual figures shown in Figure 2, which indicates the over
time changes of real manufacturing and mining production for Taiwan, Korea and South
Korea. The South Korea defined here corresponds to the territory ruled by the Republic of Korea.13 According to this figure, the growih rate of overall Korea was higher than the
South Korean in the 1930's and this suggests that the industrial development in the 1930's
concentrated in North Korea. It is very important to investigate the composition of manufacturing production by
area as well as the periods. Figure 3 shows that the nature of industrial development was
different among three area: Taiwan, South Korea and North Korea. In Taiwan, a large
portion of manufacturing industrial production had been occupied by food industry. It
is well known that the industrialization of Taiwan was restricted for the sugar industry
** In this period, there was the Anti-Japanese movements were spreaded in the mountain area of Taiwan. The Government General expended a relatively large amonut of budgets to improve the living conditions in these area. The exceptional high level of gevernment consumption in this period can be explained by this specia] situation.
*' See Mizoguchi (1975. a).
** We divided the total production into North and South Korea by using the information by Dons. When a Don belong to both area, we divide the production by using the proportion of area.

12 HITOTSUBASHI JOIJRNAL OF EcoNoMles [June FIG. 2. PRODUcnoN INDICES OF MANUFACTURlNG AND MINING INDUSTRIES (1934-6:=:lOO)
f
Taiwan
100 e----e Overall Korea J ,-. --' South Korea
,l ll "
/ j
l !¥. l' l ~L Ir'A"¥/' I/
/ ' _1' ' r--e --_r' l,
./' f !~"I- / . ~!~A;(~b.1/ ~1' '-e J~ t. '.' l/ ¥:_ .
7 ・・ l __ J '-- -(r' r j
l J
'25 '30
source: Shinohara (1972) and Mizoguchi (1975).
although there was a plan to promote other kinds of industries in the late 1930's. The
food industry was also the most important industry in Korea : its production share was nearly 30% in total manufacturing industry. However, we can find other kinds of industry
in Korea : textile, chemical and metal-machinary industry. Especially, the rise of share
was remarkable in chemical industry. When we compare the figures for overall Korea with
South Korean, we can find some different structures of manufacturing industry. While
one of the important industries was metal industry in South Korea, chemical and metal-
machinary industry took their position in North Korea. The development of these heavy
industry was remarkable in North Korea in the 1930's. In Table 7 the growth rates of real
production were shown by industry. While the Korean growth rate was extremly high in
luniber-wooden and ceramics industry, we need not to pay our attention to these because
the production shares were very small. In South Korea, textile industry had been developing
smoothly in the overall period of Japanese occupation, and the development seemed to have
been accerelated in the 1930's. It should be mentioned that this industry is labor intensive
in its nature, and the low wages in this area gave an incentive for the industry. In contrast
to these, the construction of heavy industry in North Korea would be oriented from the

l 979]
FIG. 3.
EcoNoMlc GROWTH OF KOREA UNDER
CoMPOSITION OF PRODUCTION
THE JAPANESE OCCUPATION
IN MANUFACTURING INDUSTRY
13
Overa]1 Korea
South Korea
Taiwan
Overall Korea
South Korea
Taiwan
1915
1 2 3 4 5
1925
1 2
Overall Korea
South Korea
Taiwan
1935
1 2 3 4 5
Overall Korea
South Korea
Taiwan
1940
ユ 2 3 4 5
Note: The numbers in the figure are as follows : (4) Metal and Machinary and (5) Others.
Source: Shinohara (1972) and Mizoguchi (1975).
(1) Food, (2) Textile, (3) Chemical and Ceramics,

14 ~lltoTSUBASEI JOURNAL OF ECONOMICS ' [June TABLE 7. INDUsfRIAL GROWTH RATES OF REAL PRODUCTION IN KOREA AND TAIWAN
Growth Rates (Annual)
All Korea South Korea North Korea Taiwan
1914-27 1928~O 1914-27 192~40 1914-27 192~40 1921-38
Food products 7. 13 Textiles 4. 7 l Lumber and wood products 1 6, 34 Chemicals 8. 87 Ceramics 1 5. 04 Metal products 3.20 Machinery 6. 52 Other Industry 2.42 All industry 5. 13
8.43
l0.00
6. 89
21.62
1 1.81
1 1.55
12.98
5. 22
12.37
7.26 8.88 5. 43 1 O . 53
l 7. 38 4. 83
4. 44 1 2. 63
18.55 7.03 O. OO* 2 1 . 8_2
8.89 10.77 1.07 6. 17 4. 86 9. 70
6.88 4.98 3 . 05 7 . 99
14.90 13.41 7.49 27. 1 8 9.82 14.42 5. 79 6. 78 0.00~ 19.8~/ 0.00* 3. 1 7
6.22 1 5.50
2.60
2.36
3.97
1.06
3. OO '
4.03
4.47
3. 17
2.48
1914-27 1928-36 1914 27 1928-36 1914-27 1928~0 1912 38
Minings 6. 63 Minings and industry 5.33
1 9. 70
1 1 . 56
6.68
4.87
25.28
9.34
6. 47
6.25
18.67
14.31
2.48
Note.' 1. The growth rate is caleulated by applying the least squares regression on log.X(t)=a+bt where X(t) is the industry outputs and t is time variable.
2. o.oo~ means that the estimate of b is insignificant.
Source: Shinohara (1972) and Mizoguchi (1975).
different reasons. No doubt, North Korea had an advantage in the abundance of electricity
regarding the chemical industry. The metal and machinary industry would be supported by the increases of production of minings as well as the supply of raw material from North
China. Although these industries are capital intensive, their remarkable development rose the job opportunity. From the employment problem, the development of minings in
North Korea would be also important. It is interesting that the growth rate of Taiwanese
industry was not much different by the types of industries. However, as said before, the
Taiwanese industry had been supported by sugar industry so we need not to make many
discussions on this fact.
In considering the impacts of industrialization on the Korean and the Taiwanese eco-
nomy, we should consider the employment problem. In the early stage of industrialization,
the wage of manufacturing industry was higher than agricultural wages. Therefore, the
increases of employment in industry benefited people's livings. Since we can find wage
data in the Statistical Yearbook of Government General, we can make the wage index for
manufacturing workers. According to Odaka's index, which were calculated from these data, there was a large differences between manufacturing and agricultural wage in the
1910's in Korea. The difference increased untile 1920's and declined sharply afterwards.
When we investigate the over time changes of real wages, it had risen until 1931, then declined
afterwards. Regarding Taiwan, the real wage rose before 1930 then declined remarkably.
The wage differences between manufacturing and agriculture were not so large in the 1930's.
This can be related to the rise agricultural productivity and the increase of farmer's income
in this period.
The next problem is to estimate the number of employment of manufacturing industry
in Korea and Taiwan. However, the data were not abundant regarding the topic. It is

1979]
FIG. 4.
ECONOMIC GROWTH
OVERTIME CHANGES
OF KORl~A UNDER THE 'JAPANESE OCCUPATION
OF Rl3AL WAGES IN MANurACTURlNG INDUSTRY
(1934-6 Prices)
IS
CJ
>
2.0
1.5
1.0
0.5
O
Korea (Male)
- --d' Taiwan (Male) IF-'- "-' Taiwan (Femal)
lr~~ 1-~ .,, .t
,
,
d・'d"
..,,,
/ '1'b',,__dl
1・ 't,1p I" '~ - 1..1--
r t
t ll
,L
' -'Ata~ / *'1'f
t ~-1L¥. .A.1--d!
/
f .
//' l'
l"'~'..-4. . 4',."'r' ._..../'~"~'It '_.1'1' 'r'~ """~ 1~.
,,
190J'
Source.'
'10
Odaka (1971) (1972).
'l5 '20 '25 '30 '35 '40
l
true that the Statistical Yearbook of Government General gave us the figures on the number
of workers in manufacturing factories. But the figures seem to cover only the factories
with 5 or more workers. Another kinds of data are also used for Taiwan to cover overall
period of the Japanese occupation : they are Statistical Yearbook of Commerce and Industry
by Government General of Taiwan and Yearbook of Economic Statistics by Tokyo Keizai Shimposa. The data were systematically examined by Odaka,14 and we can use his figures
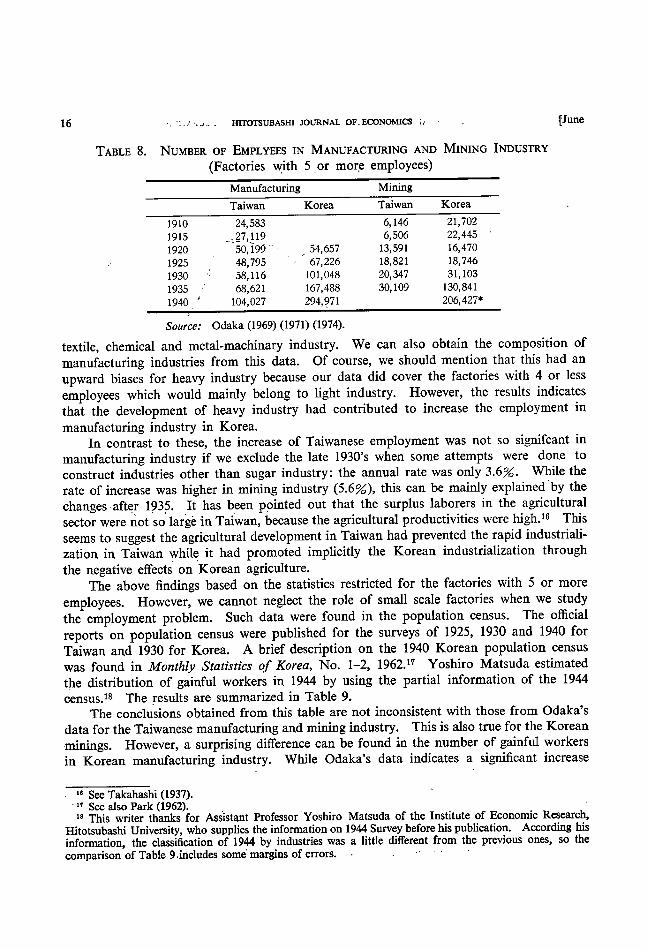
as time series. According to the result in Table 8, the Korean employment rose significantly
in manufacturing and mining industry : the annual rate of increase was 9.4% in manufactur-
ing and 14.1% in mining industry in the period of 1920~S0.15 The employment in mining industry rose in a high rate after 1 930 and this can be mainly explained by the development
of gold and silver minings : nearly 60% of mining workers enaged in these minings in the
late 1930's. The increase of workers in manufacturing industry could be found mainly in
*' Odaka (1969), (1970) and (1972). ** Regarding the minings we estimated the growth rate for the period of 192C~1938.
1 6 . - HrroTSUBASHI JOURNAL oF:EcoNoMles t, , ~June TABLE 8. NuMBER OF EMPLYEES IN MANuFACTURlNG AND MlNlNG INDUSTRY
(Factories with 5 _or mor,e employees)
Manufacturing
Taiwan
1910 24,583 1915 _. _ 2_7, 1 19 1920 50,~199 ~ 1925 48,795 1 930 ' , 58, 1 1 6
l 935 , 68, 62 l 1940 . ' 104,027
Korea
54, 657
67, 226
101,048
167,488 294,9, 7 1
Mining
Taiwan Korea 6, 146
6, 506
13,591
18,821
20, 347
30, 109
2 1 , 702
22,445 16, 470
18,746
31, 103
l 30, 84 1
206,427*
source: Odaka (1969) (1971) (1974).
textile, chemical and metal-machinary industry. We can also obtain the composition of
manufacturing industries from this data. Of course, we should mention that this had an
upward biases for heavy industry because our data did cover the factories with 4 or less
employees which would mainly belong to light industry. However, the results indicates
that the development of heavy industry had contributed to increase the employment in
manufacturing industry in Korea. In contrast to these, the increase of Taiwanese employment was not so signifcant in
manufacturing industry if we exclude the late 1930's when some attempts were done to
construct industries other than sugar industry : the annual rate was only 3.6%・ While the rate of increase was higher in mining industry (5.6%), this can be mainly explained by the
changes-aft~r 193~・ It has been ppinted out that the surplus laborers in the agricultural sector were not so lar~~ in Taiwan, because the agricultural productivities were high.16 This
seems to suggest the agricultural development in Taiwan had prevented the rapid industriali-
zation in Taiwan whil~ it had promoted implicitly the Korean industrialization through
the negative effects on Korean agriculture. The above findings based on the statistics restricted for the factories with 5 or more
employees. However, we cannot neglect the role of small scale factories when we study
the employment problem. Such data were found in the population census. The official
e s of 1925 1930 and 1940 for reports on population census were published for the surv y , Taiwan and 1930 for Korea. A brief description on the 1940 Korean population census
was found in Monthly Statistics of Korea, No. 1-2, 1962.17 Yoshiro Matsuda estimated
the distribution of gainful workers in 1944 by using the partial information of the 1944
census.18 The results are summarized in Table 9. The conclusions obtained from this table are not inconsistent with those from Odaka's
data for the Taiwanese manufacturing and mining industry. This is also true for the Korean
,minings. However, a surprising difference can be found in the number of gainful workers
in Korean manufacturing industry. While Odaka's data indicates a significant increase
16 See Takahashi (1937). IT See also Park (1962). 18 Tbis writer thanks for Assistant Professor ~Yoshiro Matsuda of the Institute of Economic Research,
Hitotsubashi University, who supplies the information on 1944 Survey before his publication. According his information, the classification of 1944 by industries was a little different from the previous ones, so the
comparison of Table 9 ,includes somi margins of errors. ・ . " ' ' '

19791 EcoNoMIC GROWTH OF KOREA UNDER mE JAPANl3SE occupATION
TABLE 9. NUMBERS' OF EMPJ~OYEES lN POPULATION CENSUS (uni.t : thousand)
Agriculture
Fishing
Mining Manufacturing
Comrnerce Trans portation
Government Service
Others
No Job
Korea
1 930
7,644
122
34
586 56 2
l 08
1 83
121
386 1 1 , 293
1 940
6, 685
1 35
1 76
495 60 1
l 52
239 1 73
539 1 5, 058
l 949
7,421
7 08
1,718
362
36 1 78
15,316
Taiwan
l 930
l , 197
29
20 l 54
l 78
63
76
10
63
2,802
1940
1 , 400
34
44 22 1
230
63 '117
17
118
3, 629
17
source: See text.
of the number, the corresponding figure declined from 1930 to 1940 in the population census.
How can we explain this difference ? Since we have'nt accessed the detailed report of 1940
ipopulation census in Korea, we cannot present our final conclusion. However, when we
calculate the number of manufacturing gainful workers by sexes, the number of male workers
rose from 291 thousands to 432 thousands in this period. A sharp decline can be found
in femal manufacturing workers : they decrease from 278 thousands to 56 thousands. Odaka's data suggested that the increase of employment can be found in the heavy industry.
No doubt, the industry was composed of large scale factories and its employees were mainly
male workers. If we exclude the textile industry, female workers would be employed in
small scale factories which were composed of traditional industries. It is very probable that
these traditional industries decayed after the recession in the late 1920's and this situation
had a negative effect on the job oppotunity for female workers. However, the decline seems
to be too large to be explained only by this fact. Therefore the re-examination of data 'would be one of the important works in the future.
Finally, we should consider the effects of job treatning by the industrialization in Korea
under Japanese occupation. We should mention that the most of large scaled factories
were occupied by Japanese as was suggested by previous contributions but also that numbers
of Korean managers and craftsmen were not so small. According to 1 944 Population Census,
the Korean managers amounted to 7,421,000 and craftsmen increased up to 28,267,000. Further when we remember the recent experience in developing countries, we cannot neglect
the effects of job treatning even for unskilled workers. However, the evaluation on this
aspect should be dohe by refering also other non statistical information.
Final Re,1~ark
In order to avoid the misunderstanding on the intention of this paper, the writer would
like to stress that this paper does not try to evaluate the policy of ipdustrialization by the
.Japanese government. However, we canuot deny that the industrialization had been ~up-
ported by various kinds of economic situation in that period .and this had some effects on
the livings o~ Korean and Taiwanese people. Strictly speaking, it is this writer's impression
that the critics of the Japanese Imperialism had concentrated . for the intension of the

18 ErrOTsuBASHI JOURNAL OF ECONOMICS Japanese rulers. Such an attempt is, of course, very important. But 'we remember that the intension did not necessarily realize in the actual situation.
it is also interesting to analyze what was the actual economic situation was.
hopes that this paper could support some attempts in this direction.
[ June
should also Theref ore,
The writer
REFERENCES
Barclay, G.W. (1954), Colonial Development and Population in Taiwan, Princeton University
Press.
Ban, Sung Hwan (1974), Growth of Korean Agriculture, Korea Development Institute, (in
Korean with English summary). Chang, Han-yu (1977), "Book Review on 'Economic Growih of Taiwan and Korea' by
T. Mizoguchi", Keizai Kenkyu Vol. 28, No 2 (in Japanese) ,
Emi, Koichi and Yoshimitsu Ishi (1971), Capital Formation, (Estimate of Long-Term Economic Statistics of Japan Since 1868, No. 4), Tokyo Keizai Shimposha (in Japanese).
Ho, Samuel P.S. (1978), Economic Development of Taiwan, 1860-1970, Yale University.
Ishikawa, Shigeru (1972), "Changes of Taiwanese Agriculture under Japanese Rule" in
Shinohara-Ishikawa (1972), (in Japanese).
(1973), "Estimate of Agricultural Production of Korea, 1910-1970", In-stitute of Economic Research, Hitotsubashi University, (mimeographed, in Japanese).
Kawano, Shigeto (1941), The Taiwanese Rice Economy, Yuhikaku, (in Japanese).
Kim, Tetsu (1965), Population and Economy of Korea, Iwanami Shoten, (in Japanese).
Korean Trader's Association (1972), Korean Trade History, The Association, (in Korean).
Kuznets, Simon (1968), "Notes on Japanese Economic Growth" in Klein, L. and Ohkawa, S. (ed.) Economic Growth, The Japanese Experience Since Melji Era, Richard D Irwin.
Lee, Teng-hui (1971), Intersectoral Capital Flows in the Economic Development of Taiwan,
l 895-1960. Ithaca, Cornell University.
Lee, Yun-Keun (1971), "National Income Estimate of Korea (192(~1935)" in Lee Y.K et al. (ed.), History of People's Livings Under the Japanese Occupation Minjung
Seokwan, (in Korean). Mizoguchi, Toshiyuki (1975), Economic Growth of Taiwan and Korea, Iwanami Shoten,
(in Japanese).
(1975. a), "Analysis of Taiwanese Public Finance", Institute of Economic
Research, Hitotsubashi University, (mimeographed, in Japanese).
Odaka, Konosnke (1969), "Employment and Wages in Taiwan: 1897-1938", Keizai Kenkyu,
Vol. 20, No. 2, (in Japanese).
(1971), "Wages and Employment of Korea Under Japanese Rule", Institute
of Economic Research, Hitotsubashi University (mimeographed, in Japanese).
(1972), "Industrialization and Foreign Trade in Taiwan" in Shinohara-
Ishikawa (1972) (in Japanese).
Ohkawa, K.S. Takamatsu and Y. Yamamoto (1974), National Income, (Estimate of Long-Term Statistics of Japan Since 1968, No. 1) Toyo Keizai Shimposha (in Japanese).
Park, Chai Bin (1962), "A Review of Korean Population Statistics", Monthly Statistics of
Korea, No, 1-2. 1962.
l 979]
Takahashi, nese) .
ECONOM JC GROWm
Kamekichi (1937),
OF KOREA UNDER THE JAPANESE
Modern Talwanese Economy,
OCCUPATION 19
Chikura Shobo, 1937 (in Japa-
Tohata, Seiichi and Kazushi Ohkawa (1955), Korean Rice Economy, Nihon Gakujitsu Shinko-kwai .
Shinohara Mryohel (1972) "Industnalizatron and Forergn Trade m Tarwan", in Shinohara-
Ishikawa (1972).
Shinohara, Miyohei and Shigeru Ishikawa (ed.) (1972), Ecomonic Development in Taiwan,
Institute of Developing Economy, (in Japanese).
Suh, Sang-Chul (1978), Growth and Structural Changes in the Korean Economy, Harvard University.