economic history association – 70 annual meeting
TRANSCRIPT

Economic History Association – 70th Annual Meeting Evanston - September 24-26, 2010
Education Performance: Was It All Determined 100 Years Ago? Evidence From São Paulo, Brazil
Irineu de Carvalho Filho and Renato P. Colistete1
Abstract
This paper deals with institutional persistence in long-term economic development. We investigate the historical record of education in one of the fastest growing and most unequal societies in the twentieth century – the state of São Paulo, Brazil. Based on historical data from an agricultural census and education statistics, we assess the role played by factors such as land concentration, immigration and type of economic activity in determining supply and demand of education during the early twentieth century, and to what degree these factors help explain current educational performance and income levels. We find a positive and enduring effect of the presence of foreign-born immigrants on the supply of public instruction, as well as a negative effect of land concentration. Immigrant farm-laborers established their own community schools, and pressured for public funding for those schools or for public schools. The effects of early adoption of public instruction can be detected more than one hundred years later in the form of better test scores and higher income per capita. These results are suggestive of an additional mechanism generating inequality across regions: the places that received immigration from countries with an established public education system benefited from an earlier adoption of the revolutionary idea of public education.
August 18 2010
1 Irineu de Carvalho Filho is an Economist at the Research Department of the International Monetary Fund (e-mail: [email protected]); Renato P. Colistete is a Professor of Economic History at the Department of Economics of the Universidade de São Paulo (e-mail: [email protected]) (Disclaimer: This Working Paper should not be reported as representing the views of the IMF. The views expressed in this Working Paper are those of the author(s) and do not necessarily represent those of the IMF or IMF policy). This paper benefited from the excellent research assistance of Bruno Gabriel Witzel. Joana Naritomi and Eustáquio Reis gently provided data on soil quality. Walter Belluzzo, Rafael G. Duarte and Ricardo Madeira helped us to obtain and understand the ENEM test scores data.
2
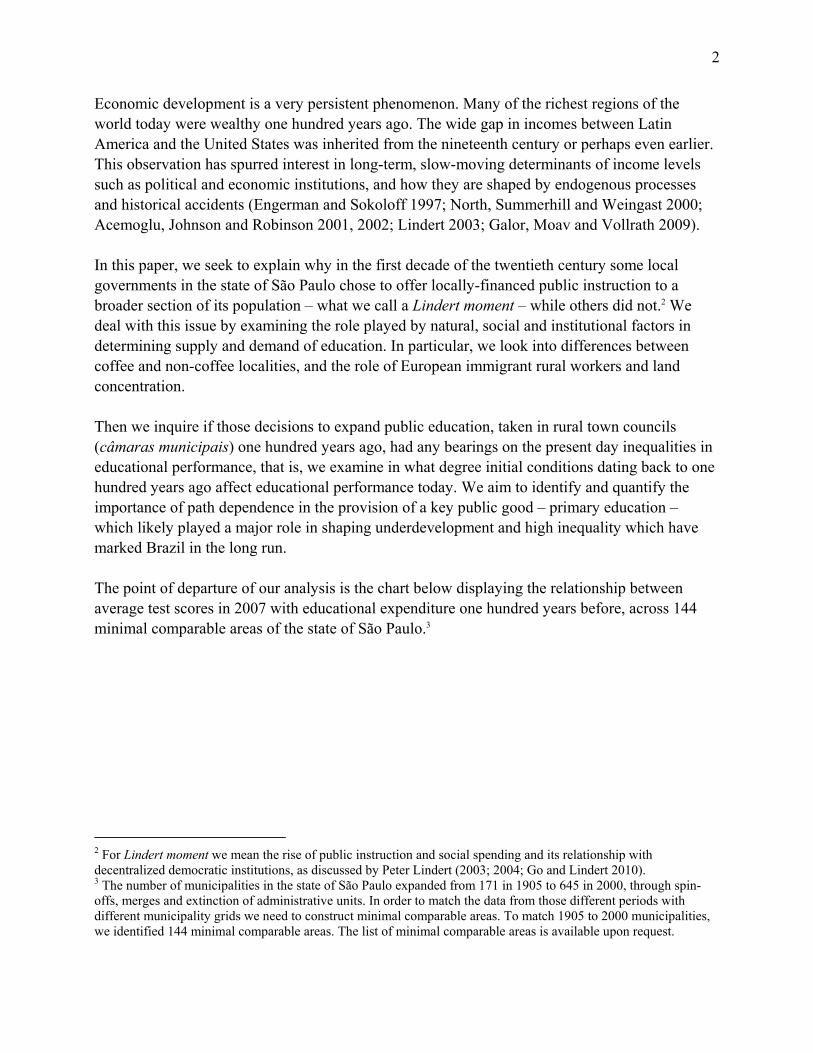
Economic development is a very persistent phenomenon. Many of the richest regions of the world today were wealthy one hundred years ago. The wide gap in incomes between Latin America and the United States was inherited from the nineteenth century or perhaps even earlier. This observation has spurred interest in long-term, slow-moving determinants of income levels such as political and economic institutions, and how they are shaped by endogenous processes and historical accidents (Engerman and Sokoloff 1997; North, Summerhill and Weingast 2000; Acemoglu, Johnson and Robinson 2001, 2002; Lindert 2003; Galor, Moav and Vollrath 2009). In this paper, we seek to explain why in the first decade of the twentieth century some local governments in the state of São Paulo chose to offer locally-financed public instruction to a broader section of its population – what we call a Lindert moment – while others did not.2 We deal with this issue by examining the role played by natural, social and institutional factors in determining supply and demand of education. In particular, we look into differences between coffee and non-coffee localities, and the role of European immigrant rural workers and land concentration. Then we inquire if those decisions to expand public education, taken in rural town councils (câmaras municipais) one hundred years ago, had any bearings on the present day inequalities in educational performance, that is, we examine in what degree initial conditions dating back to one hundred years ago affect educational performance today. We aim to identify and quantify the importance of path dependence in the provision of a key public good – primary education – which likely played a major role in shaping underdevelopment and high inequality which have marked Brazil in the long run. The point of departure of our analysis is the chart below displaying the relationship between average test scores in 2007 with educational expenditure one hundred years before, across 144 minimal comparable areas of the state of São Paulo.3
2 For Lindert moment we mean the rise of public instruction and social spending and its relationship with decentralized democratic institutions, as discussed by Peter Lindert (2003; 2004; Go and Lindert 2010). 3 The number of municipalities in the state of São Paulo expanded from 171 in 1905 to 645 in 2000, through spin-offs, merges and extinction of administrative units. In order to match the data from those different periods with different municipality grids we need to construct minimal comparable areas. To match 1905 to 2000 municipalities, we identified 144 minimal comparable areas. The list of minimal comparable areas is available upon request.

3
Figure 1. ENEM Test Scores in 2007 and Educational Expenditure in the 1900s by Municipalities, São Paulo
-.1
5-.
1-.
05
0.0
5.1
0 .2 .4 .6Municipal expenditure in public schools, 1904-1907, per capita
Coffee Non-Coffee
Sta
ndar
dize
d te
st s
core
Coffee area: More than 30 coffee trees per capita in 1905Bubbles are proportional to population in 1907Sources: see in the text
This chart nicely summarizes many pieces of information. First, revenue from the coffee tax seems to have been associated with higher municipal expenditure in public schools in the early twentieth century, as non-coffee municipalities (i.e., those with a ratio of coffee trees per person smaller than 30) cluster around zero expenditure. Second, there is a clear positive relationship between local public expenditure per capita one hundred years ago and test scores today. Third, the latter relationship holds regardless of the specialization of the county in coffee during the beginning of the past century, but almost all municipalities with public education expenditures higher than the state average were specialized in coffee one hundred years ago. Fourth, the choice of funding public schools locally is not trivial as many municipalities showed zero expenditure.4 Last but not the least, there seems to be a positive association between municipality population in 1907 and test scores today after controlling for educational expenditures per capita in the early 1900s. Thus we focus on differences across municipalities (municípios) in a large state – São Paulo – that became the leading export economy in nineteenth century Brazil. In 1907, this state alone produced 64.3 per cent of the whole coffee crop of the world. Production was shipped through the local Santos port, whose exports represented 73.7 and 60.8 per cent of all Brazil and world exports of coffee in 1909, respectively (Graham 1912, pp. 10-1, 15). The state of São Paulo was also one of the main recipients of European immigrants, who started to arrive en masse just 4 The large blue bubble on the left of the Figure 1 refers to the capital (São Paulo) of the state São Paulo, which received funds from the state government.

4
before the abolition of slavery in 1889. Compared to its relatively low numbers (21,548) in 1874-1883, immigration to São Paulo grew more than twenty times (443,839) in 1884-1893, peaking at 617,374 in 1894-1903 and declining slightly to 562,750 in 1904-1913. These figures represented a very sharp increase in São Paulo’s share of the total immigrants entering Brazil: from 9.3 per cent between 1874 and 1883 to 71.6 per cent between 1894 and 1903.5 One of the consequences of the dislocation of labor and capital caused by the coffee boom was that the first decades of the twentieth century in Brazil reinforced divergence in regional incomes and economic structures in Brazil (Williamson 1965; Azzoni 1997; Monasterio and Reis 2008; Martínez-Fritscher and Musacchio 2009). By 1940, the state of São Paulo had become the source of 45.3 per cent of Brazil’s manufacturing output, the main commercial center for agriculture, and the country’s financial hub (Brasil 1940; Cano 1981, pp. 227-56). A lesser noticed fact is that the state of São Paulo also pulled ahead in human capital in the same period. Having started from the same level of enrollment in primary schools as the Brazilian average in 1872, São Paulo became one of the highest providers of primary education in Brazil by 1940 – although still far below international standards (Brazil 1916a, pp. CCIX-CCX; Brasil 1939/40, p. 1398; Love 1982, pp. 132-6). Fast economic and social transformation occurred amidst sharp differences in municipality characteristics. Agricultural expansion took place over wide variations in the natural endowment, in the quality of the soil, and the slope of the terrain (James 1932; Monbeig 1984). Some areas were settled as early as the sixteenth century, others were sparsely populated virgin forest until the twentieth century; most of them saw the scourge of slavery, others received a huge number of highly footloose European immigrants who toiled along with local free labor and slaves; some regions were dominated by large properties with hundreds of thousands of coffee trees and workforce in the hundreds; others were the site of colonial experiments with small landholdings (Denis 1911; Milliet 1939; Monbeig 1984; Dean 1976). More interestingly, São Paulo municipalities showed significant differences in their approach to social infrastructure, in particular the provision of primary education, as measured by enrollment rates and public spending (São Paulo 1914, pp. 39-40). This paper relates to a burgeoning literature exploring how history shapes economic development, which has expanded manifold since Stanley Engerman and Kenneth Sokoloff’s 1997 piece on Americas’ growth path argued that a former colony’s initial conditions – its factor endowments, colonial economic activities and institutions – determine its level of economic inequality, whether a large portion of its population was excluded from economic opportunities, and, consequently, long-run underdevelopment. Subsequent contributions have emphasized the burden of slavery in Caribbean island countries (Nunn 2007); have shifted the emphasis to political instead of economic inequality as determinant of long-term economic growth (Acemoglu, Bautista, Querubin and Robinson 2008); and have argued that differences in 5 Calculated from São Paulo 1928, pp. 342-4 and Smith 1954, pp. 222-3.

5
European settler mortality affected the nature of economic institutions (Acemoglu, Johnson and Robinson 2001). Naritomi, Soares and Assunção (2009) find that the sugar-cane and mining colonial cycles had long-term consequences for the local institutional development that were settled during those historical episodes. Summerhill (2010) convincingly argues that late term slavery in the state of São Paulo was not an impediment to future social and economic development in the coffee-producing regions and finds a surprising positive relationship between aldeamentos, a potentially coercive colonial institution created to fix semi-nomadic indigenous in place, and per capita income today. I. SETTING THE STAGE: EDUCATION, AGRICULTURE AND IMMIGRATION IN SÃO PAULO
In this section we provide a panoramic view of the 1900s in São Paulo which helps to establish the key issues to be addressed in our subsequent empirical analysis. While for a great part of the nineteenth century much of Latin America was involved in internal bloodshed, Brazil was governed by a relatively stable monarchy. The transition from Monarchy to Republic in 1889, to a large degree orchestrated by an alliance between sections of the military and the urban middle class involved in politics, and the coffee plantation owners from the west of São Paulo, was also a successful and smooth enterprise (Love 1982; Bethell and Carvalho, 1989; Costa 1989; Fausto 1989). Coffee production and exports were the driving force of Brazilian social and economic change at the time, leading to unprecedented economic transformation and integration to the world economy through the flow of goods and people. Brazil’s share in the world exports of coffee reached 76.3 per cent in 1909, fuelled by rocketing demand from the industrial economies. In that year, the United States alone accounted for 41.8% of Brazil’s coffee sales, followed by Germany (19.5%), France (9.9%), Netherlands (8.6%) and the Austro-Hungarian Empire (6.3%) (Graham 1912, pp. 10-1, 21). The immigrant stream also peaked in the same period. Whereas 231,802 immigrants disembarked at Brazilian ports between 1874 and 1883, their numbers jumped to 883,668 in the next decade. From 1894 to 1903 the flow of immigrants into Brazil remained high (862,110) and, in the decade before the World War I, it reached 1,066,617.6 The average annual number of Italians entering Brazil rose from 12,600 in 1882-1886 to 68,847 in 1887-1891 and 94,019 in 1892-1896, surpassing for a while both the United States and Argentina as the main recipients (Foerster 1919, p. 15; Hatton and Williamson 1998, pp. 100-1). Much of the state of São Paulo in 1905 was virgin land that was just converted to coffee, or was about to be converted in the coming years. Once an isolated province with few roads good enough for an ox cart (coffee harvest from the plateau was transported on the back of mules), with the advent of railroads both virgin forests and already settled, but scarcely populated areas producing sugar and other goods for the internal market became preferred land for expansion of the coffee frontier (Simonsen 1973; Monbeig 1984, pp. 129-179; Luna and Klein 2006, ch. 1-2).
6 Calculated from Brasil (1939/40), p. 1307 and Smith (1954), pp. 221-8.

6
In 1867 the São Paulo Railway Company linked the Santos port to the state capital and the nearby Jundiaí, localized in the plateau. In the following years the railway reached several localities farther inland, such as Campinas (1872), Amparo (1873), Sorocaba (1875), Rio Claro (1876), Piracicaba (1877) and Ribeirão Preto (1883). The railway stimulated the trade of coffee and other agricultural goods, reduced costs of transport and time of travel, then becoming essential to the exceptional growth of coffee plantations in the following decades (Pinto 1903; Saes 1981; Summerhill 2003). The expansion of the coffee frontier took place in a framework of high concentration of land ownership, which had its roots in the royal grants of immense tracts of land (the sesmarias) during colonial times. After Independence, a new Land Law was enacted by Congress in 1850 after years of controversies and disputes. The law determined the revalidation of old land concessions, the legalization of squatters’ holdings, and the selling off of public lands (terras devolutas). Yet the Land Law was at most only partially implemented. Landowners in the municipalities resisted the legal registration of their holdings in order to be legitimized. Public land continued to be usurped by individuals with special connections in local and provincial governments (Vasconcellos 1885, pp. 7-89; Laerne 1885, ch. VI; Dean 1971).7 In view of the predominance of large states, and the lack of a homestead policy in Brazil, smallholdings in São Paulo’s coffee zone were more often found in areas with poor soil, occupied by squatters who had settled before the arrival of the highly valued crops. Those who held a fertile piece of land were likely evicted by rich landowners and had to move on with the frontier. Smallholders who remained in their land often could not earn a living with their production throughout the year and had to work part-time in large farms. Others established themselves as tenants in large estates, also being a complementary source of labor for the several jobs required in the plantation, along with African slaves. Landless workers – or camaradas – had only a casual association with the plantation and sold their labor for daily or monthly wages. In all these categories, free labor was not a guarantee of independence in an economy based on plantations and slavery – in fact it was always on the reach of the political weight of the planters who controlled the justice, the police and the local assembly (Leal 1948, ch. 1; Dean 1976, ch. 1; Lamounier 2008, ch. 3-4). The proclamation of Republic in 1889 did not change the situation. In a rare attempt to discipline access to land, the new government of São Paulo passed a law in 1900 aiming to regularize ownership titles, separating private land and public land. Even though the penalty for not
7 The central government reported in 1862 that only in certain provinces (São Pedro, Santa Catarina, Paraná and Espírito Santo) there was some acceptance of the Law – in others predominated a “repugnance by squatters and sesmeiros [owners of royal grants] in recognizing the advantages offered to them” by the Land Law. In São Paulo, the engineer appointed by the central government to measure public land in the capital and vicinity had his work suspended by order of the president of province because of the conflicts aroused. When the engineer visited another area around the capital, he found a huge tract of land invaded and devastated by “intruders” who “perpetrated such abuses after the law of 18 September 1850” (Brasil 1862, pp. 9, 18).

7
complying with the law was harsh – the land would be declared public –, there was total indifference by landowners. The secretary of agriculture frankly recognized that “it was not possible to make the law effective because of the variety of interests at stake” (São Paulo [1902], pp. 95-6). Planters had gained even more influence with the advent of Republic. In the words of a keen contemporaneous observer: “[a]s a coffee-producing country the State of San Paolo remains perhaps the most definite type in the world of a country of large landowners” (Denis 1905, p. 234). While land was plenty, the culture of coffee requires labor throughout the year and more so during harvest time. Even though formally prohibited in 1830, the effective end of the Atlantic slave trade in Brazil came only in 1850 as a result of strong British diplomacy (Manchester [1933]; Bethell 1970). São Paulo planters faced then the problem of tapping ever more labor in a rapidly expanding coffee economy, at the same time that their traditional source of labor was soon to be in a scarce supply. Inter and intra-provincial traffic, pulling slaves from stagnant to growing areas, represented a short-term alternative that provided farms with part of their labor needs. Nonetheless, slave prices soared in São Paulo and other provinces such as Rio de Janeiro, Minas Gerais and Pernambuco (Dean 1976, p. 54-5; Mello 1977, pp. 49-51; Bergad 1999, pp. 163-73; Versiani and Vergolino 2002). Planters looked for some source of cheap and abundant labor and began to devise and experiment with new schemes to replace – only in the long run in their view – the work of slaves. European immigrants and, in a lesser degree, local Brazilians were the main targets (Beiguelman 1968, pp. 121-32; Dean 1976, ch. 4; Lamounier 2007).8 The first experiences with new labor arrangements took place in the new coffee area of Rio Claro and Limeira, in northwest São Paulo, during the 1840s. In 1847, Nicolau Vergueiro, a Portuguese-born merchant and landowner with close connections with provincial and central governments, established a so-called colony (colônia) in one of his large farms (Ibicaba), hiring 423 Germans and Swiss in Europe as well as 92 Portuguese and Spanish remnant from a failed attempt in 1840. Ibicaba also employed 14 local Brazilians as colonists, apart from 215 slaves already toiling in the farm (São Paulo 1852, Appendix; Tschudi [1866], pp. 133-5; Géntil 1851, p. 36) The colonists’ contract was a form of sharecropping (parceria) which, however, left families to repay the cost of transport from Europe and other advances, and gave households no control of the sale of their product in the market. Other planters adopted Vergueiro’s parceria system so that by 1857/1858 there were at least 3,958 colonists in São Paulo farms – 3,390 Europeans (German, Swiss, French, Belgian and Portuguese immigrants) and 568 Brazilians.9 Heavy indebtedness, lack of transparency, strict vigilance, precarious infrastructure, overcharges, and a farmer’s view deeply shaped by the master-slave relation led to successive conflicts between planters and colonists, culminating in a high-profile rebellion in Ibicaba involving Swiss 8 Planters also entertained Chinese (coolies) immigration, but the project failed. See Laerne 1885, pp. 123-6; Conrad 1975. 9 This is only a lower-bound figure, comprising 26 farms visited by Manuel de Jesus Valdetaro in 1857 plus 12 ones recorded in the presidential message of São Paulo province in 1858 (São Paulo 1858, Appendix). Between 1847 and 1857, 6,412 immigrants entered São Paulo through the Santos port. Calculated from São Paulo (1928), pp. 342-4.
8
and German immigrants, in 1857 (Davatz [1858]; Tschudi [1866], pp. 135-43; Costa 1994; Dean 1976, ch. 4). In the following years, the decline of the parceria gave way to a variety of pay systems that coexisted sometimes even within the same plantation – fixed piece rates for a volume of coffee harvested, annual pay for the trees under the colonist’s care, daily or monthly wages, contracts under the labor-leasing law (lei de locação de serviços) of 1837 and adapted forms of the very parceria system, with colonists keeping the excess of their subsistence production and having more cultivation and pasture rights. Disappointed planters increased their demand for slaves from other regions, and those who maintained their colonies contracted more Brazilians.10 Such was the state of the supply of labor for farms in São Paulo when there were further attempts to promote large-scale European immigration from the 1870s. Initially, the São Paulo government remained half-heartedly engaged in the immigration program. In March 1871, the provincial assembly authorized the issue of bonds to finance immigration, but only in the form of loans to farmers at 6 per cent interest rate, to be repaid within eleven years. More important was an initiative by capitalists and farmers to set up the Association for Colonization and Immigration in São Paulo in August 1871, an agency with capital raised through public offer of shares that aimed to attract European immigrants. Within three months, the new Association managed to sign a contract with the Imperial government to subsidize the transport of 15,000 European workers, with a renewal in 1873. It was only in the early 1880s that the São Paulo provincial administration took the lead in the immigration program, playing a decisive role in designing an institutional framework and mobilizing public resources for immigration. At the time, the slavery institution was under check by growing contestation and revolts by slaves and sympathizers of their cause (Beiguelman 1968, pp. 82-109; Conrad 1972, ch. 15-16; Dean 1976, ch. 5-6; Mello 1977, ch. 5). The landmark of the new orientation of São Paulo provincial government towards immigration was a law of March 1884, which fully subsidized the transport of working families from Europe and the Canary and Azores Islands. In the same year and in 1885, the provincial assembly approved new taxes on the property of slaves to subsidize the immigration service and the construction of a lodging house for immigrants. In 1887, the province signed a contract with a new organization set up by farmers, the Sociedade Promotora de Imigração, to introduce 100,000 European immigrants – and other agreements ensued in the following years. This was at last the definitive start of a mass immigration program (Grossi 1905, pp. 396-8; Hall 1969, pp. 92-115; Hutter 1972, ch. 3). Immigrants entering São Paulo rose from 9,536 in 1886 to 32,112 in 1887, totaling 1,790,937 between 1887 and 1920. The provincial government’s mobilization in favor of massive public funding and the last minute success of the immigration program was
10 On the changes in the original parceria contracts, see São Paulo (1868), pp. 78-9; Brasil (1874), pp. 284-9; (1877b), pp. 73-7; Holanda (1941), pp. 29-34; Hall (1969), pp. 11-27; Holloway (1974), pp. 81-94. For the increased demand for slaves and local labor, see São Paulo (1859), p. 21; (1868), pp. 78-9; (1871), pp. 40-1; Godoy (1875), pp. 135-6; Denis (1905), pp. 187-90.

9
more than welcome for planters in view of the upsurge in slave unrest from 1886, which was putting agricultural production in disarray. The abolition of slavery in May 1888 coincided with flooding labor markets in the countryside. Immigrants who flocked to coffee farms were now hired under a reformed pay system, which usually comprised a piece-rate for volume of harvested coffee, an annual remuneration for 1,000 coffee trees cared for by the family, a variable sum for occasional services in the farm, plus the right of pasture and cultivation of a specified part of land whose produce could be freely disposed of by the household. The reformed colonato system did not halt the sometimes fierce disputes between farmers and colonists, but the extreme instability of the parceria system was overcome. Contracts were now for one year and, at the end of the harvest, immigrants moved on after better piece-rates and conditions for household production offered by farms (Coletti 1908; Perrod 1888, Appendix B; Denis 1905, pp. 190-3, 206-7; Dean 1976, ch. 6). The coffee boom and the massive arrival of immigrants gave rise to deep changes in São Paulo society. The capital city grew fast and new urban centers sprang up in the countryside, leading to the diversification of consumption, the increased production of foodstuffs, and the expansion of workshop and factory production of manufactured goods. Prosperity also brought about a higher concern for the supply of public goods and services. The reform of public education was seen at the time as one of the most pressing needs in São Paulo and Brazil, because of the low levels of school attendance even when compared to the rest of Brazil (São Paulo 1870, pp. 9-10; 1877, p. 74). Education was one of the least of the priorities of the Brazilian Empire. The Constitution of 1824 declared primary education as free and universal, and a law of 1834 formally established that provinces would be responsible for primary education, but there was no provision in it as to how provinces and municipalities would finance public schooling for all. The result was that the levels of spending and matriculation rested upon the decision of provincial and local assemblies, and of the elites who controlled them, about how to allocate their limited fiscal resources (Tavares Bastos 1870, pp. 236-47; Nagle 1974, pp. 279-82). By the turn of the century, Brazil’s education was in a deplorable state. Lack of funding, schools and professors translated into the very low rates of matriculation of children by international standards. Matriculation in primary schools totaled 29 children per 1,000 inhabitants in 1907. From an international perspective, this number meant one of the lowest levels of enrollment in elementary education in the world. The highest levels – 203 per 1,000 inhabitants – were recorded in the United States, with other countries following suit: for example, Belgium, 188; Canada, 185; Netherlands, 172; Great Britain and Ireland, 171; Germany, 158; Norway, 157 and Japan, with 114 children per 1,000 inhabitants. Countries with the lowest figures in Europe, such as Russia (45), Serbia (47) and Portugal (59), were well above Brazil. Comparisons were also unfavorable to Brazil in Latin America. Argentina (98), Uruguay (79), Peru (72) and Chile (68) had relatively three or two times more children enrolled in the schools than Brazil. In Latin America, only Venezuela (14), Guatemala (22), Bolivia (24), Dominican Republic (24), and El
10
Salvador (27) exhibited lower per capita levels of enrollment in primary education than Brazil (Brazil 1916a, pp. CCXX-CCXXI).11 The supply of education in São Paulo was substandard even when compared with the low levels achieved in Brazil, but it started to catch up in the second half of the nineteenth century. São Paulo had 14 children enrolled in primary schools per 1,000 non-slave inhabitants in 1872, a figure that was exactly the same as Brazil’s average and below several other states such as Sergipe (29), Rio Grande do Sul (23), Santa Catarina (21), Espírito Santo (21), Amazonas (21), Maranhão (16) and Alagoas (15) (Brasil, 1939/40, p. 1398). A contemporary source showed an even worse performance when children between 6 and 15 years old were taken into account. Only 8.0 per cent of children of this age group attended any sort of formal education in São Paulo in 1876, a rate below Brazil’s average of 9.3 per cent. Rio de Janeiro (21.8%), Pará (18.0%), Amazonas (16.4%), Rio Grande do Sul (15.9%), Sergipe (14.2%), Rio Grande do Norte (12.3%), Mato Grosso (12.2%) and Minas Gerais (8.8%) were some of the provinces whose matriculation rates were higher than those recorded in São Paulo (Brasil 1877a, p. 9). The deficiencies of the public education in São Paulo were long acknowledged by provincial authorities, but the dominant view was that of one of the Presidents: “in face of other essential expenditures, it was impossible to increase spending on education” (São Paulo 1868, pp. 68-9). Early measures to tackle low enrollment rates were not enforced, such as a provincial law of 1874 that set up education local councils and made enrollment compulsory with penalties against recalcitrant parents. From the 1870s, it became routine for provincial authorities to claim that the “intellectual development” lagged behind the “economic progress” achieved by São Paulo (São Paulo 1875, Appendix S1; 1877, pp. 74-5; 1880, p. 57) Even so, the first significant legislation only came about with a reform of public education in April 1887. The provincial law established a “school fund” constituted by a new tax on all individuals more than 21 years old, national or foreign, who were able to earn a living. The law also specified that the resources must be spent with the construction of new schools and equipment, and that the school fund would be administered by local councils for education, made up by three members. It was the first time that municipalities obtained specific fiscal revenues for primary education (São Paulo 1887, p. 49; 1888, pp. 11-3; São Paulo 1918, pp. 91-4). The 1887 education law, however, sparked opposition among São Paulo’s municipalities, which postponed the election of the education councils and argued about the practical issues involved in the enforcement of the new tax. The matter was only settled when the government which came to power with the proclamation of Republic in 1889 abolished the education tax (São Paulo 1918, p. 94). From then on, primary schooling would be funded by ordinary fiscal resources drawn from municipal and provincial budgets. Despite the reactions against the education tax and its final
11 For other similar comparisons of Brazil in the international context, see Lindert (2004), pp. 90-3; Engerman, Mariscal and Sokoloff (2009), pp. 109, 131-2.

11
suppression, the budget for education did increase during the early Republic. The rapidly growing economy and the revenue decentralization brought about by the federative pact consolidated by the Republican Constitution of 1891 gave a strong boost to the fiscal resources of states like São Paulo with a dynamic export sector, since they gained full control over the revenues of the export tax (Love 1982, ch. 8). Municipalities also benefited from economic growth through taxes on coffee and urban activities and professions. Overall local councils devoted more resources for primary schooling although there remained substantial variation in the pattern of spending among municipalities.12 São Paulo introduced another educational reform in 1892 which set up primary schools (grupos escolares) with modern buildings, graded classes and trained teachers. In face of limited funding for the initiative, the municipalities which required the installation of grupos escolares should provide the adequate premises. The first such schools were established in 1894. By 1905 there were 62 grupos escolares in the state of São Paulo, most of them located in cities of the coffee production area (São Paulo 1913, pp. 462-4). Low school enrollment rates, illiteracy and lack of funding continued to be a matter of concern during the whole period, and more so regarding the rural areas. Compared to other states in Brazil, however, São Paulo showed a clear improvement in educational performance. In 1907, the enrollment figures for São Paulo – 34 students per 1,000 inhabitants – grew higher than the national Brazilian average (30) and was surpassed by fewer states – Rio Grande do Sul (55), Santa Catarina (52), Pará (43), Paraná (35) and the Federal Capital (69). Thirty years later, matriculation in primary schools reached 101 children per 1,000 inhabitants in São Paulo, well above Brazil’s average (67) and now only behind Santa Catarina (128) and the Federal Capital (123) (Brasil 1939/40, p. 1398). Another factor may have complemented the impact of greater fiscal revenues flowing to the state and municipalities as a cause behind the improvement in primary education in São Paulo: the coffee-led economic growth also brought about changes in social composition and urbanization. Overall the expansion of new manufacturing and commercial activities tends to raise the demand for literacy, numeracy and skills in general. More importantly, the growing presence of immigrants seems to have increased the demand for primary education at the local level, reflecting on municipal and state level policies. The proportion of foreigners in the total agricultural population in São Paulo was already 44.2 per cent in 1901 and rose to 55.6 per cent in 1906 (São Paulo [1901]; [1906]). Immigrants who worked in the farms often went to new urban nuclei in the countryside or to the capital after a couple of years. Cities like Rio Claro and Limeira, the stage of the first immigration experiments in the mid-nineteenth century, saw many immigrants coming to open new artisanal, commercial and service businesses. As Sérgio Buarque de Holanda noted, the 1873 catalogue of industries and professions of Rio Claro was full of
12 For example, while Campinas exhibited 47.9 per cent of its children enrolled in schools in 1909, only 14.8 per cent were enrolled in Atibaia. Both municipalities were located in the same coffee region (central) of the state of São Paulo (São Paulo [1909], pp. 201-4).

12
German names, and in certain trades they were the majority (Holanda 1941, pp. 23-4).13 The same was true in several other cities in São Paulo recorded in the catalogue of industries and professions of 1891, but now including a substantial number of Italian names too (Almanach 1891; Perrod 1888, pp. 35-80). While the historiography has traditionally concentrated on government measures and illustrated reformers (Nagle 1974, Marcílio 2005), the documented experience of some localities highlights the importance of grass-root initiatives in favor of primary education in rural areas during São Paulo’s educational catch-up from late nineteenth century. As immigrants from countries with a greater school tradition (Germans first, Italians and Japanese later) filled the countryside, they demanded the state and local government to open public schools in the villages, established their own rural community schools when the government was not forthcoming, and often even managed to have the local government to cover some of the expenses of their community schools (Alves 2007).14 These initiatives were commonplace in the states of south and southeast Brazil which received a major flux of immigrants, including São Paulo. Community schools were very often associated with the religious and national background of the immigrants (Kreutz 2000a; 2000b). There were 115 primary schools in the state of São Paulo (out of 232 in Brazil) receiving some type of subsidy by the Italian government in 1908 (Trento 1989, p. 182).15 Examples of mobilization by immigrants to pressure for public schools or set up community schools can be found in São Paulo municipalities since the nineteenth century. One such case is the Pires bairro set up in Limeira in 1872 by German former colonists of Ibicaba and other farms who had finished their contracts of parceria. They bought a piece of land, divided it and soon after built up a school, in 1874. Another community school in the same village was established in 1897, and both merged in 1908 (Bezerra 2001, pp. 161-7 and Annex 20). Indaiatuba, in turn, is a good example of a municipality where immigrant groups, mostly Swiss and Italians, strove to provide elementary education in view of the lack of adequate investment by the government. The colony of Swiss immigrants, Colônia Helvetia, set up its rural school as early as 1893. Italians who started to arrive in the city in the 1880s also had an important influence in the definition of local educational policies. In 1895 political groups were able to bring a grupo escolar to the municipality. In the following years, the local council consistently sought to improve teacher salary levels and grant better facilities and public funding for schools (including for the Helvetia rural school) despite little availability of resources. In 1906, Indaiatuba spent 17.3 percent of its budget with education, while the nearby larger town of Itu spent only 2.3 percent. When an 13 Foreign names in Rio Claro were a majority in metallurgical, machinery, transport and brewing trades (Almanak 1873, pp. 35-43). 14 Enrollment rates of children age 5-14 were over 70 percent in Germany in the 1870s; over 35 percent in Italy in 1890; and about 60 percent in Japan in 1910 (Lindert 2004, pp. 91-93). The same source has enrollment rates of 10 percent for Brazil in 1900. 15 The number of these schools in São Paulo was greater than in Argentina (59) and the United States (80), what likely reflects the dearth of public schools in Brazil at the time. Brazil’s ethnic schools faced progressive restrictions since the early twentieth century and were nationalized by a series of federal decrees in 1938-9. See Kreutz (2000a), pp. 364-7.
13
inquiry carried out by the city council found that many very poor children remained outside the school because their families were not even able to dress them to attend classes, the council passed a law instituting a school assistance fund disbursing cash to help poor families send their children to school (as a modern-day conditional cash transfer program would do). The fund was made up of 1.5 percent of the municipal budget plus donations by the public (Alves 2007, pp. 73-134; Grininger 1991, ch. 6). II. DATA AND EMPIRICAL STRATEGY
This section describes the empirical basis for the analysis of educational performance in the long-run. Our strategy is to examine the variation in natural, economic and institutional conditions at the micro level of municipalities of the state of São Paulo to try to understand how they may have shaped institutional outcomes and persistence in educational performance. We use three basic data sets for the beginning of the twentieth century. The first one is an official census prepared by the Secretary of Agriculture of the state of São Paulo in the early twentieth century, the “Estatística Agrícola e Zootécnica do Estado de São Paulo no Ano Agrícola de 1904-1905” (São Paulo, 1904-5). This census offers a wealth of information on several aspects of each farm in the state of São Paulo in the golden age of the coffee export economy. The data is organized at the level of the administrative divisions of the state, totaling 171 municipalities. For each municipality, landowners are listed by name and nationality, with a detailed description of their farms – 57,182 ones in our database. The description includes, for example, the size of the farm, the type and quality of soil, the crops cultivated (such as coffee, sugar cane, cotton, maize and beans) with their respective areas and production, the price of land per hectare, and the number and nationality of the workers employed. This is a very rich, although scarcely used source in the studies of Brazilian economic history.16 We calculate land ownership Gini indexes by municipalities and minimal comparable areas, both restricting the calculation to the distribution of land ownership among landowners or including agricultural workers who presumably did not own land. The second major source employed in our investigation is the statistics on public education in the state of São Paulo for 1909. These data show matriculation in public (state and municipal) and private primary schools as well as estimates of the children outside the school system for each one of the 171 municipalities of São Paulo (São Paulo [1909]). The third sources we employed are statistics on municipality and occupational distribution of voters in the state of São Paulo for 1904 (São Paulo [1904]). An important feature to be
16 Among those who used this source, see Milliet (1939), Holloway (1974), Dean (1976) and, recently, Summerhill (2010).
14
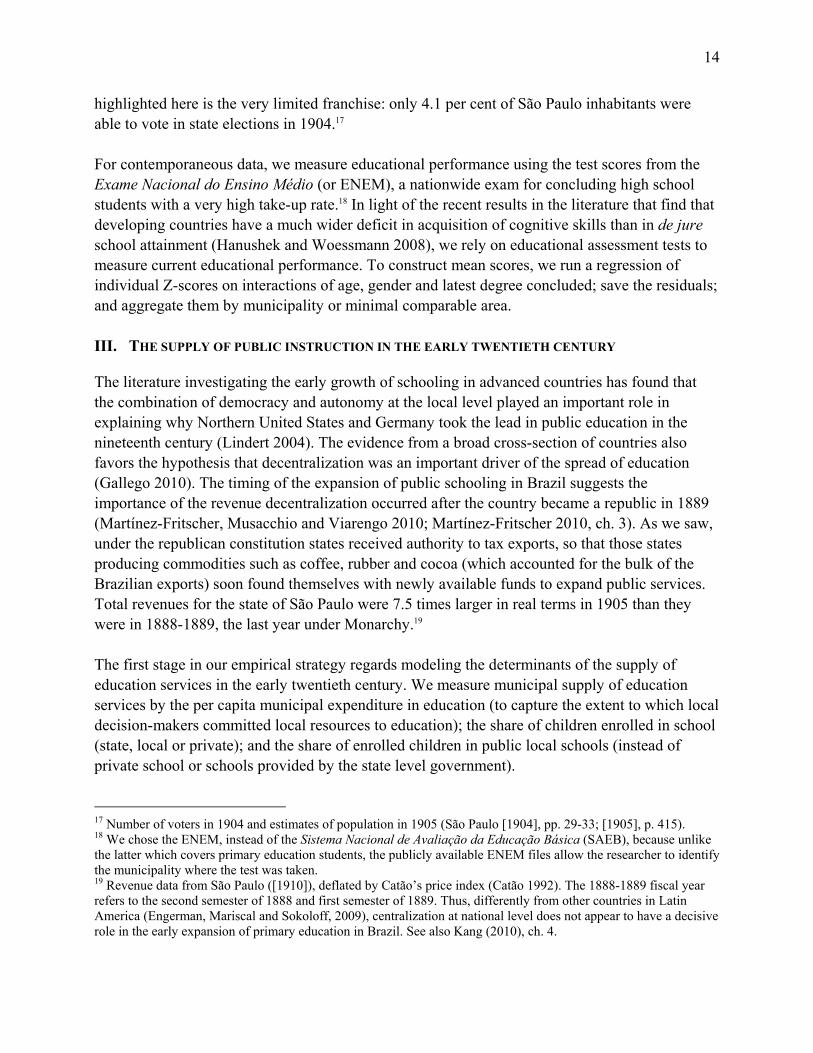
highlighted here is the very limited franchise: only 4.1 per cent of São Paulo inhabitants were able to vote in state elections in 1904.17 For contemporaneous data, we measure educational performance using the test scores from the Exame Nacional do Ensino Médio (or ENEM), a nationwide exam for concluding high school students with a very high take-up rate.18 In light of the recent results in the literature that find that developing countries have a much wider deficit in acquisition of cognitive skills than in de jure school attainment (Hanushek and Woessmann 2008), we rely on educational assessment tests to measure current educational performance. To construct mean scores, we run a regression of individual Z-scores on interactions of age, gender and latest degree concluded; save the residuals; and aggregate them by municipality or minimal comparable area. III. THE SUPPLY OF PUBLIC INSTRUCTION IN THE EARLY TWENTIETH CENTURY
The literature investigating the early growth of schooling in advanced countries has found that the combination of democracy and autonomy at the local level played an important role in explaining why Northern United States and Germany took the lead in public education in the nineteenth century (Lindert 2004). The evidence from a broad cross-section of countries also favors the hypothesis that decentralization was an important driver of the spread of education (Gallego 2010). The timing of the expansion of public schooling in Brazil suggests the importance of the revenue decentralization occurred after the country became a republic in 1889 (Martínez-Fritscher, Musacchio and Viarengo 2010; Martínez-Fritscher 2010, ch. 3). As we saw, under the republican constitution states received authority to tax exports, so that those states producing commodities such as coffee, rubber and cocoa (which accounted for the bulk of the Brazilian exports) soon found themselves with newly available funds to expand public services. Total revenues for the state of São Paulo were 7.5 times larger in real terms in 1905 than they were in 1888-1889, the last year under Monarchy.19 The first stage in our empirical strategy regards modeling the determinants of the supply of education services in the early twentieth century. We measure municipal supply of education services by the per capita municipal expenditure in education (to capture the extent to which local decision-makers committed local resources to education); the share of children enrolled in school (state, local or private); and the share of enrolled children in public local schools (instead of private school or schools provided by the state level government). 17 Number of voters in 1904 and estimates of population in 1905 (São Paulo [1904], pp. 29-33; [1905], p. 415). 18 We chose the ENEM, instead of the Sistema Nacional de Avaliação da Educação Básica (SAEB), because unlike the latter which covers primary education students, the publicly available ENEM files allow the researcher to identify the municipality where the test was taken. 19 Revenue data from São Paulo ([1910]), deflated by Catão’s price index (Catão 1992). The 1888-1889 fiscal year refers to the second semester of 1888 and first semester of 1889. Thus, differently from other countries in Latin America (Engerman, Mariscal and Sokoloff, 2009), centralization at national level does not appear to have a decisive role in the early expansion of primary education in Brazil. See also Kang (2010), ch. 4.

15
First, to control for the political factors mentioned in the literature for advanced countries, we use variables that measure the extent of the suffrage and economic inequality. The conjectured effect is that the more limited the suffrage, the greater the dominance of local government by landed interests (“Toryism”, according to Lindert 2004), and smaller the propensity of local government to provide egalitarian primary schooling. For a very limited suffrage (as is the case of São Paulo in the early twentieth century), the effect of inequality is to widen the differences between the typical voter and the masses, so one would expect that with low suffrage rates, a less egalitarian municipality would have less provision of schools by the local government (Engerman, Mariscal and Sokoloff 2009, p. 96). Second, to control for availability of resources to finance schools, we focus on the revenues of the tax on coffee production collected by the municipalities. The rationale for using that variable is that, within the state of São Paulo, the coffee tax is arguably exogenous to the local school provision decision, as its upper bound rates were established by the state legislature in 1891 and its tax base was determined by the conditions determining the productivity of coffee trees in the lands of each municipality.20 We actually can double-check our estimates by using the determinants of coffee productivity as instruments for the coffee tax revenues. Finally, we also control for the nationality of the work force. As we have shown, immigrants set up community schools, asked for more funding for them and demanded public schools, so that their presence might be associated with more provisions of schools than warranted by the other determinants of schooling. We start by presenting the results of simple regressions between education determinants recognized by the literature and our measures of provision of education from the early 1900s (see Table 1). The goal of the exercise at this stage is exploratory and descriptive, but we understand that it helps set up the stage for our main econometric exercise. We find that all measures of local education performance 100 years ago are positively correlated with population – larger municipalities were more likely to offer locally funded public schools (row 1); those with higher per capita revenue from the coffee tax tended to have higher local expenditure levels on education and a larger proportion of students registered at local public schools, but no difference in terms of total education enrollment – which may reflect the interplay of two opposing forces: a larger public education budget and more child labor opportunities in coffee areas (row 2).21 The effect of farm size is ambiguous as we find a positive effect of workers per farm on local expenditure in public instruction, but no effect for the other education
20 Conf. Law n. 16, 13 November 1891, Ch. IV, article 38, 3rd paragraph, approved by the São Paulo state assembly. 21 As noted by a contemporaneous writer, an immigrant’s success as colonist in the farms depended on “a large family, when he could rely upon many arms and three or four children (who at five or six years old might already help him in the harvest) and, even more, when there was an active, lively and intelligent wife” (Ferrero 1908, pp. 56-7). Kruger (2007) finds that even in the 1990s coffee production drew children to work and away from school in Brazil.
16
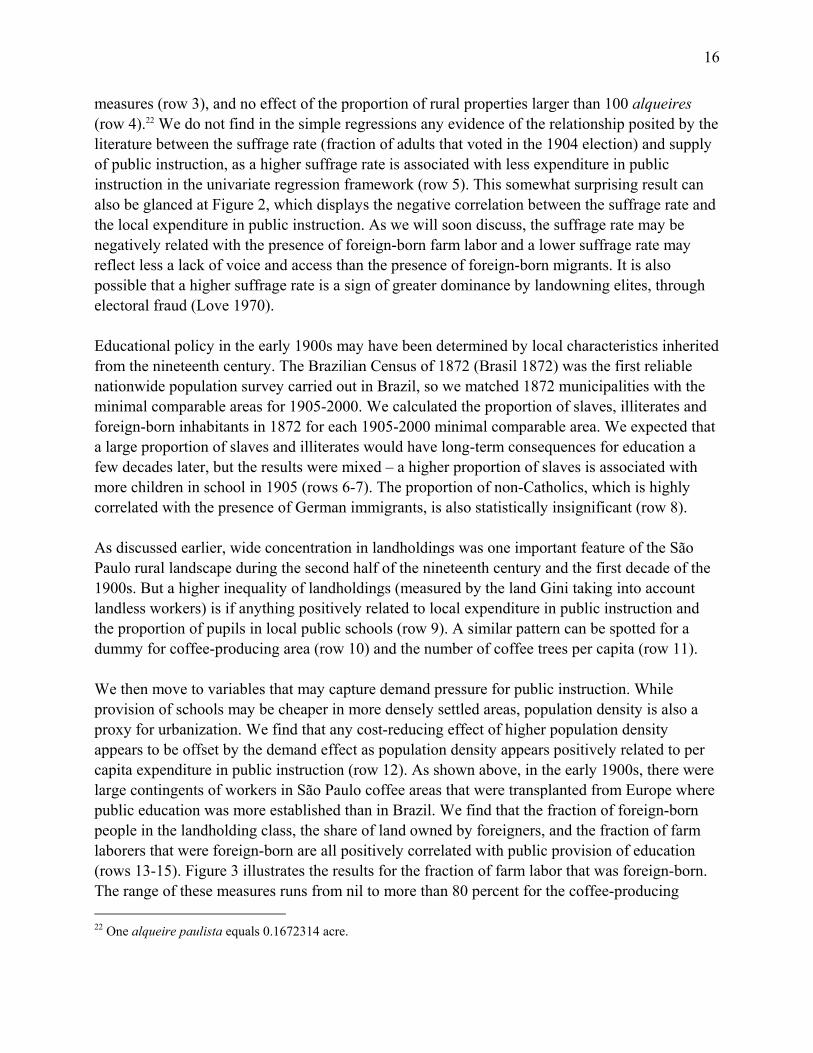
measures (row 3), and no effect of the proportion of rural properties larger than 100 alqueires (row 4).22 We do not find in the simple regressions any evidence of the relationship posited by the literature between the suffrage rate (fraction of adults that voted in the 1904 election) and supply of public instruction, as a higher suffrage rate is associated with less expenditure in public instruction in the univariate regression framework (row 5). This somewhat surprising result can also be glanced at Figure 2, which displays the negative correlation between the suffrage rate and the local expenditure in public instruction. As we will soon discuss, the suffrage rate may be negatively related with the presence of foreign-born farm labor and a lower suffrage rate may reflect less a lack of voice and access than the presence of foreign-born migrants. It is also possible that a higher suffrage rate is a sign of greater dominance by landowning elites, through electoral fraud (Love 1970). Educational policy in the early 1900s may have been determined by local characteristics inherited from the nineteenth century. The Brazilian Census of 1872 (Brasil 1872) was the first reliable nationwide population survey carried out in Brazil, so we matched 1872 municipalities with the minimal comparable areas for 1905-2000. We calculated the proportion of slaves, illiterates and foreign-born inhabitants in 1872 for each 1905-2000 minimal comparable area. We expected that a large proportion of slaves and illiterates would have long-term consequences for education a few decades later, but the results were mixed – a higher proportion of slaves is associated with more children in school in 1905 (rows 6-7). The proportion of non-Catholics, which is highly correlated with the presence of German immigrants, is also statistically insignificant (row 8). As discussed earlier, wide concentration in landholdings was one important feature of the São Paulo rural landscape during the second half of the nineteenth century and the first decade of the 1900s. But a higher inequality of landholdings (measured by the land Gini taking into account landless workers) is if anything positively related to local expenditure in public instruction and the proportion of pupils in local public schools (row 9). A similar pattern can be spotted for a dummy for coffee-producing area (row 10) and the number of coffee trees per capita (row 11). We then move to variables that may capture demand pressure for public instruction. While provision of schools may be cheaper in more densely settled areas, population density is also a proxy for urbanization. We find that any cost-reducing effect of higher population density appears to be offset by the demand effect as population density appears positively related to per capita expenditure in public instruction (row 12). As shown above, in the early 1900s, there were large contingents of workers in São Paulo coffee areas that were transplanted from Europe where public education was more established than in Brazil. We find that the fraction of foreign-born people in the landholding class, the share of land owned by foreigners, and the fraction of farm laborers that were foreign-born are all positively correlated with public provision of education (rows 13-15). Figure 3 illustrates the results for the fraction of farm labor that was foreign-born. The range of these measures runs from nil to more than 80 percent for the coffee-producing 22 One alqueire paulista equals 0.1672314 acre.
17
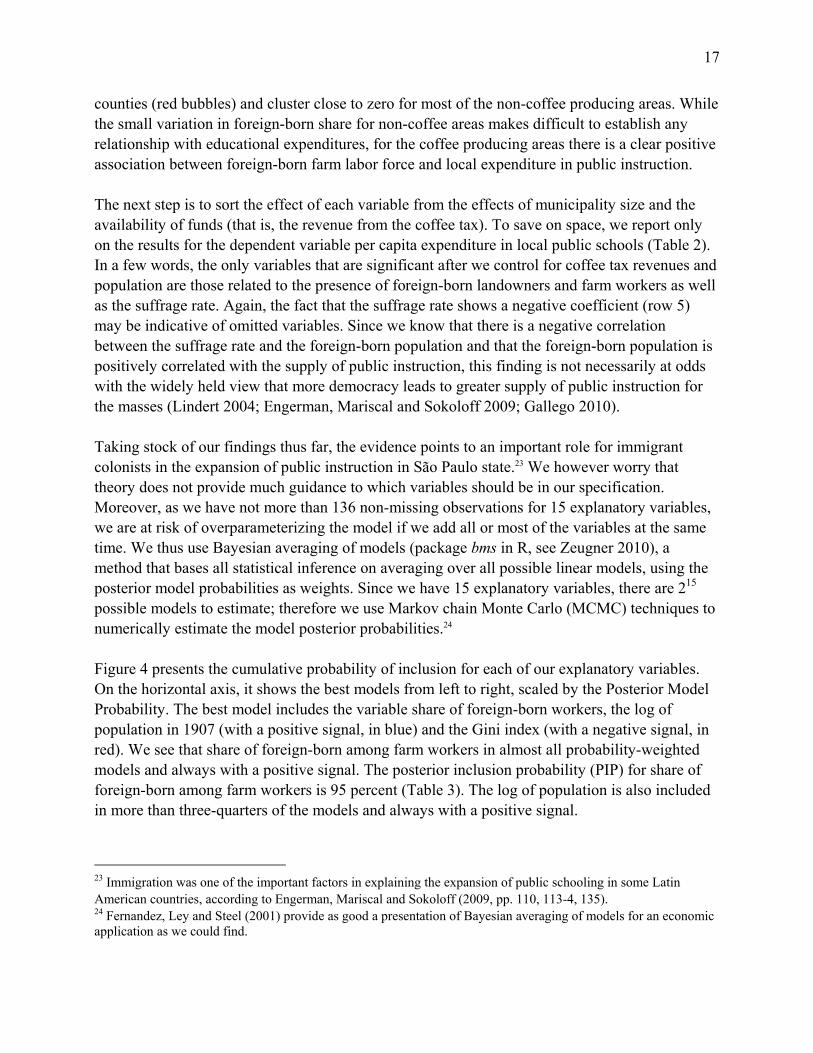
counties (red bubbles) and cluster close to zero for most of the non-coffee producing areas. While the small variation in foreign-born share for non-coffee areas makes difficult to establish any relationship with educational expenditures, for the coffee producing areas there is a clear positive association between foreign-born farm labor force and local expenditure in public instruction. The next step is to sort the effect of each variable from the effects of municipality size and the availability of funds (that is, the revenue from the coffee tax). To save on space, we report only on the results for the dependent variable per capita expenditure in local public schools (Table 2). In a few words, the only variables that are significant after we control for coffee tax revenues and population are those related to the presence of foreign-born landowners and farm workers as well as the suffrage rate. Again, the fact that the suffrage rate shows a negative coefficient (row 5) may be indicative of omitted variables. Since we know that there is a negative correlation between the suffrage rate and the foreign-born population and that the foreign-born population is positively correlated with the supply of public instruction, this finding is not necessarily at odds with the widely held view that more democracy leads to greater supply of public instruction for the masses (Lindert 2004; Engerman, Mariscal and Sokoloff 2009; Gallego 2010). Taking stock of our findings thus far, the evidence points to an important role for immigrant colonists in the expansion of public instruction in São Paulo state.23 We however worry that theory does not provide much guidance to which variables should be in our specification. Moreover, as we have not more than 136 non-missing observations for 15 explanatory variables, we are at risk of overparameterizing the model if we add all or most of the variables at the same time. We thus use Bayesian averaging of models (package bms in R, see Zeugner 2010), a method that bases all statistical inference on averaging over all possible linear models, using the posterior model probabilities as weights. Since we have 15 explanatory variables, there are 215
possible models to estimate; therefore we use Markov chain Monte Carlo (MCMC) techniques to numerically estimate the model posterior probabilities.24 Figure 4 presents the cumulative probability of inclusion for each of our explanatory variables. On the horizontal axis, it shows the best models from left to right, scaled by the Posterior Model Probability. The best model includes the variable share of foreign-born workers, the log of population in 1907 (with a positive signal, in blue) and the Gini index (with a negative signal, in red). We see that share of foreign-born among farm workers in almost all probability-weighted models and always with a positive signal. The posterior inclusion probability (PIP) for share of foreign-born among farm workers is 95 percent (Table 3). The log of population is also included in more than three-quarters of the models and always with a positive signal.
23 Immigration was one of the important factors in explaining the expansion of public schooling in some Latin American countries, according to Engerman, Mariscal and Sokoloff (2009, pp. 110, 113-4, 135). 24 Fernandez, Ley and Steel (2001) provide as good a presentation of Bayesian averaging of models for an economic application as we could find.

18
We find that the Gini index always has a negative coefficient and is included in about 40 percent of the models – which is in line with the view that land inequality is a deterrent for the development of broad-based public instruction (see Galor, Moav and Vollrath 2009), although not with the results of our simple regressions (Table 1). The latter result happens because the probability of inclusion of the variable proportion of foreign-born farm laborers is very close to one and the land Gini enters the equation with a negative sign when that variable is included. We also find some evidence of a positive conditional effect from the other variables that measure the presence of foreign-born individuals in the agricultural sector (PIP of almost 40 percent and 100 percent probability of a positive effect). For all other variables, inclusion probabilities are lower than inclusion priors. IV. EDUCATIONAL PERFORMANCE AND INCOME IN THE LONG-RUN
The second stage of our study looks out for the connection between current educational outcomes and the drivers of local public schooling in the early twentieth century. In the previous section we have found some strong evidence that minimal comparable areas where foreign-born individuals composed a larger share of the agricultural labor force were more prone to use local revenues to finance public schooling. We also found some evidence of a negative association between land inequality and locally financed public schooling, as obtained from the Bayesian averaging of models. We are interested in the issue of persistence of outcomes. As the Constitution of 1891 transferred revenue from the federal government to the states, there was a large increase in resources available to local governments. We do not know much about the decision-making process at the local level, but some municipalities chose to use local revenues to pay for public schools, while others did not. In this section we investigate whether these public choices had long-term consequences to education performance: was education performance determined 100 years ago? We start by presenting the results of simple regressions of our measure of current education performance (the average standardized score in the ENEM) and measures of public school provision from the beginning of the twentieth century. We find that all measures of local supply of public instruction are positively related to average test scores today (Table 4, rows A-C). But test scores today are also positively related to a plethora of other historical variables: total population and population density; historical tax revenues from the coffee export tax; the proportion of slaves and non-Catholics in 1872; land inequality and the average number of workers per farm in 1905; both continuous and discrete measures of coffee intensity; and the presence of foreign-born landowners and farm workers. To be sure, the only variables that we found not correlated with test scores today were the proportion of large farms and the suffrage rate in the 1900s, as well as the proportion of illiterates in 1872. But those simple regressions most likely suffer from omitted variables problems. For instance, the proportion of slaves in 1872 is correlated with specialization in coffee and the estimated positive effect of slavery on test scores may reflect the effect of coffee-related wealth. To

19
minimize this problem, we estimate the effect of each covariate while controlling for population in 1907 and the tax revenue from coffee in 1904-07. The results are reported on Table 5. Once we move to a multivariate setting, we find six covariates that are (positively) associated with higher test scores today: the proportion of children in school in 1905; the dummy for area specialized in coffee and the number of coffee trees per capita in 1905; population density in 1907; and proportion of foreign-born landowners and farm laborers.25 Figure 5 presents the cumulative probability of inclusion for each of our explanatory variables in the equation for average test scores. The results from the Bayesian averaging of models are consistent with a positive role for the presence of foreign-born farm workers, and a negative role for the prevalence of large farms in the early nineteenth century in the determination of present-day test scores. Therefore, the more a minimal comparable area was specialized in coffee; the more its agricultural sector was dominated by foreign-born landowners and farm laborers; the higher the enrollment rate 100 hundred years ago; the higher are test scores today. 26 Finally, the interest in persistent educational differences across municipalities rests ultimately on the connection between human capital and output levels. We have shown that the children from the municipalities that had moved ahead in the broadening of public instruction in the early twentieth century have on average higher test scores nowadays. In Table 6, we estimate the effects of our covariates on the present-day per capita income, controlling for population and coffee tax revenue per capita in the 1900s. Since the importance of agriculture has declined as the industrial and services sector expanded over the last one hundred years, one may expect that variables correlated with productivity in coffee agriculture in the 1900s ought not to have predictive power for per capita income today.27 We control for the tax revenue from coffee in the beginning of the twentieth century (in all but one specifications, it has a positive coefficient, but in most cases insignificant) and population in 1907 (negative effect, statistically significant).Nevertheless, we find that education supply (as measured by percent of children in school); the number of workers per farm; population density; and proportion of foreign-born landowners in the 1900s are positively related to income per
25 We have also estimated the regressions on Table 5 correcting for a lagged special correlation representation and found basically the same pattern of signals and significance. The only remarkable differences are that the effects of large farms (negative) and the share of total land area owned by the foreign-born (positive) become significant. Results are available from the authors. 26 De Carvalho Filho and Monasterio (2010) find that in the state of Rio Grande do Sul, where European immigration was often associated with government subsidized colonies of yeomen in isolated forested lands, there is a significant positive impact of closeness to a colony on test scores nowadays. 27 Agriculture accounted for more than 20% of state value added in 1939, the earliest date this statistic is available, and less than 2% in 2007.
20
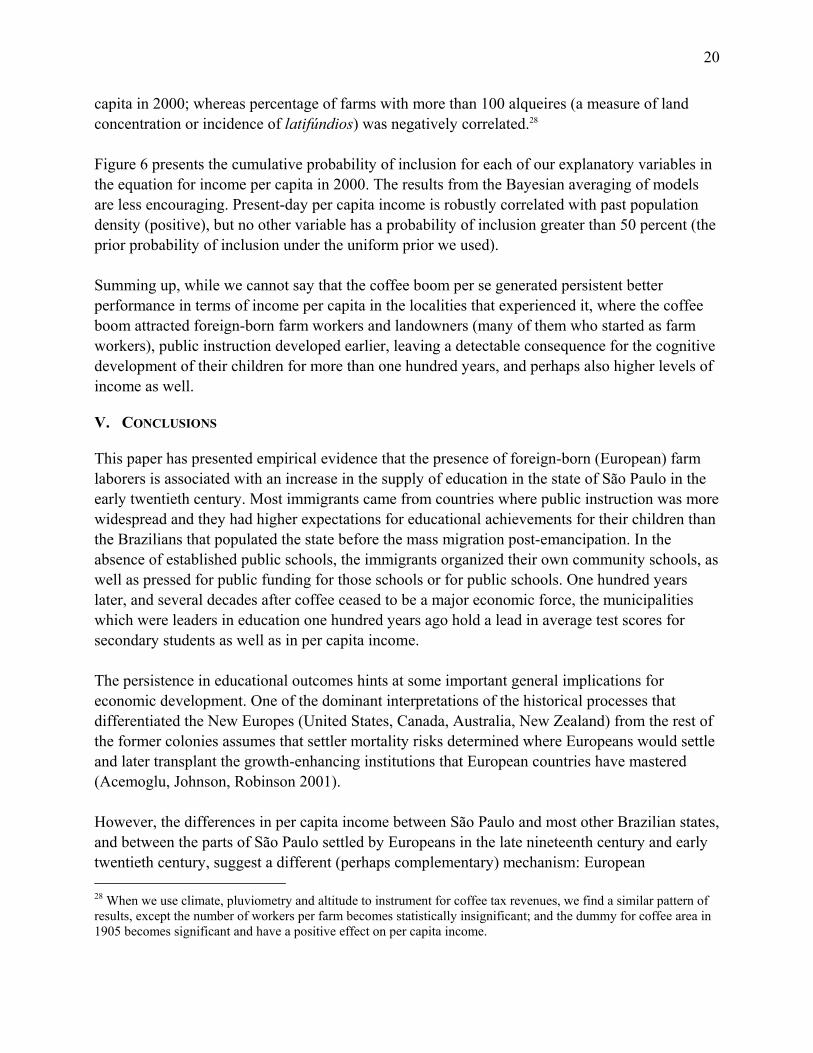
capita in 2000; whereas percentage of farms with more than 100 alqueires (a measure of land concentration or incidence of latifúndios) was negatively correlated.28 Figure 6 presents the cumulative probability of inclusion for each of our explanatory variables in the equation for income per capita in 2000. The results from the Bayesian averaging of models are less encouraging. Present-day per capita income is robustly correlated with past population density (positive), but no other variable has a probability of inclusion greater than 50 percent (the prior probability of inclusion under the uniform prior we used). Summing up, while we cannot say that the coffee boom per se generated persistent better performance in terms of income per capita in the localities that experienced it, where the coffee boom attracted foreign-born farm workers and landowners (many of them who started as farm workers), public instruction developed earlier, leaving a detectable consequence for the cognitive development of their children for more than one hundred years, and perhaps also higher levels of income as well.
V. CONCLUSIONS
This paper has presented empirical evidence that the presence of foreign-born (European) farm laborers is associated with an increase in the supply of education in the state of São Paulo in the early twentieth century. Most immigrants came from countries where public instruction was more widespread and they had higher expectations for educational achievements for their children than the Brazilians that populated the state before the mass migration post-emancipation. In the absence of established public schools, the immigrants organized their own community schools, as well as pressed for public funding for those schools or for public schools. One hundred years later, and several decades after coffee ceased to be a major economic force, the municipalities which were leaders in education one hundred years ago hold a lead in average test scores for secondary students as well as in per capita income. The persistence in educational outcomes hints at some important general implications for economic development. One of the dominant interpretations of the historical processes that differentiated the New Europes (United States, Canada, Australia, New Zealand) from the rest of the former colonies assumes that settler mortality risks determined where Europeans would settle and later transplant the growth-enhancing institutions that European countries have mastered (Acemoglu, Johnson, Robinson 2001). However, the differences in per capita income between São Paulo and most other Brazilian states, and between the parts of São Paulo settled by Europeans in the late nineteenth century and early twentieth century, suggest a different (perhaps complementary) mechanism: European 28 When we use climate, pluviometry and altitude to instrument for coffee tax revenues, we find a similar pattern of results, except the number of workers per farm becomes statistically insignificant; and the dummy for coffee area in 1905 becomes significant and have a positive effect on per capita income.

21
immigrants may have brought with them the education institutions of their home countries to the areas of the New World where they settled in the nineteenth century through World War I. Finally, these results also have consequences for the interpretation of the relative (and sometimes absolute) decline of New World areas such as the Caribbean and the Brazilian Northeast. As these regions suffered through the nineteenth century with decline in sugar prices, the direct losses in export revenue may have been amplified by missing on the benefits of more education-minded immigrants, since these economies were not able to attract a large flow of foreign workers from Europe during the age of mass immigration. VI. REFERENCES
Acemoglu, Daron, Simon Johnson, and James Robinson, “The Colonial Origins of Comparative Development: An Empirical Investigation,” American Economic Review, 91 (2001), 1369-401.
Acemoglu, Daron, Simon Johnson, and James Robinson, “Reversal of Fortune: Geography and Institutions in the Making of the Modern World Income Distribution,” Quarterly Journal of Economics, 117 (2002), 1231-1294.
Acemoglu, Daron, Maria Angelica Bautista, Pablo Querubin, and James Robinson, “Economic and Political Inequality in Development: The Case of Cundinamarca, Colombia,” in Institutions and Economic Performance, Elhanan Helpman, ed. (Cambridge: Harvard University Press, 2008).
Almanak de S. João do Rio Claro para 1873 (Campinas: Typ. da Gazeta de Campinas, 1873).
Almanach do Estado de São Paulo para 1891 (São Paulo: Editora Companhia Industrial de São Paulo, 1891).
Alves, Silvane R. L., A Instrução Pública em Indaiatuba: 1854-1930. Contribuição para a História da Educação Brasileira (Master Dissertation, Universidade Estadual de Campinas, 2007).
Azzoni, Carlos R., “Concentração Regional e Dispersão das Rendas Per Capita Estaduais: Análise a partir das Séries Históricas Estaduais de PIB, 1939-1995,” Estudos Econômicos, 27(1997), 341-393.
Beiguelman, Paula, A Formação do Povo no Complexo Cafeeiro: Aspectos Políticos (São Paulo: Pioneira, 1968).
Bergad, Laird W., Slavery and the Demographic and Economic History of Minas Gerais, Brazil, 1720-1888 (Cambridge: Cambridge University Press, 1999).
Bethell, Leslie, The Abolition of the Brazilian Slavery Trade. Britain, Brazil and the Slave Trade Question, 1807-1869 (Cambridge: Cambridge University Press, 1970).
Bethell, Leslie, and José Murilo Carvalho, “Empire: 1822-1850”, in Brazil: Empire and Republic, 1822-1930, Leslie Bethell, ed. (Cambridge: Cambridge University Press, 1989).
Bezerra, Maria Cristina S. Imigração, Educação e Religião: um Estudo Histórico-Sociológico do Bairro dos Pires de Limeira, uma Comunidade Rural de Maioria Teuto-Brasileira (Master Thesis, Universidade Estadual de Campinas, 2001).

22
Brasil, Directoria Geral de Estatistica, Recenseamento Geral do Brazil de 1872 (Rio de Janeiro, 1872).
Brasil, Diretoria Geral de Estatistica, Relatorio e Trabalhos Estatisticos Apresentados ao Ilm. e Exmo. Sr. Conselheiro Dr. José Bento da Cunha e Figueiredo, Ministro e Secretario de Estado dos Negócios do Imperio, pelo Diretor Geral Conselheiro Manoel Francisco Correia, em 31 de dezembro de 1876 (Rio de Janeiro: Typographia de Hippolito José Pinto, 1877a).
Brasil, Directoria Geral de Estatistica, Estatistica da Instrucção. Primeira Parte, Estatistica Escolar (Rio de Janeiro: Typographia da Estatistica, 1916a).
Brasil, Directoria Geral de Estatistica, Annuario Estatistico do Brazil, 1908-1912, Vol. 1 (Rio de Janeiro: Typographia da Estatistica, 1916b).
Brasil, Instituto Brasileiro de Geografia e Estatística. Anuário Estatístico do Brasil, 1939/1940 (Rio de Janeiro: IBGE, 1939/40).
Brasil, Instituto Brasileiro de Geografia e Estatística, Censos Econômicos. Agrícola, Industrial, Comercial e dos Serviços. Recenseamento Geral do Brasil, 1o de Setembro de 1940, Série Nacional, Vol. III (Rio de Janeiro: IBGE, 1940).
Brasil, Ministerio dos Negocios da Agricultura, Commercio e Obras Publicas, Relatorio das Terras Publicas e da Colonisação, Apresentado em 28 de Fevereiro de 1862 pelo Diretor da Terceira Diretoria, Bernardo Augusto Nascentes de Azambuja (Rio de Janeiro: Typographia de João Ignacio da Silva, 1862).
Brasil, Ministerio dos Negocios da Agricultura, Commercio e Obras Publicas, Relatorio Apresentado à Assembléa Geral Legislativa pelo Ministro José Fernandes da Costa Pereira Junior (Rio de Janeiro: Typographia Americana, 1874).
Brasil, Ministerio dos Negocios da Agricultura, Commercio e Obras Publicas, Relatorio Apresentado à Assembléa Geral Legislativa pelo Ministro João Lins Vieira Cansansão de Sinimbú (Rio de Janeiro: Imprensa Industrial, 1877b).
Cano, Wilson, Raízes da Concentração Industrial em São Paulo, 2nd ed. (São Paulo: T.A.Queiroz, 1981).
Catão, Luis A.V., “A New Wholesale Price Index for Brazil During the Period 1870-1913,” Revista Brasileira de Economia, 46(1992), 519-533.
Coletti, Lucio, “L’Emigrazione Italiana nel Brasile,” Bolletino Delle’Emigrazione, 16 (1908), 3-16.
Conrad, Robert, The Destruction of Brazilian Slavery, 1850-1888 (Berkeley: University of California Press, 1972).
Conrad, Robert, “The Planter Class and the Debate over Chinese Immigration to Brazil, 1850-1893,” International Migration Review, 9 (1975), 41-55.
Costa, Emília Viotti, “Empire: 1870-1889,” in Brazil: Empire and Republic, 1822-1930, Leslie Bethell, ed. (Cambridge: Cambridge University Press, 1989).
Costa, Emília Viotti. 1994. “Colônias de Parceria na Lavoura de Café: Primeiras Experiências,” in Da Monarquia à República. Momentos Decisivos, 6th ed. (São Paulo: Brasiliense, 1994).
23
Davatz, Thomas, Memórias de um Colono no Brasil (1850) (São Paulo: Martins Fontes, [1858] 1941).
de Carvalho Filho, Irineu, and Leonardo Monasterio, “How Bodo Became Brazilian: European Migration to Nineteenth Century Southern Brazil,” 2010, mimeo.
Dean, Warren, “Latifundia and Land Policy in Nineteenth-Century Brazil,” Hispanic American Historical Review, 51(1971), 606-25.
Dean, Warren, Rio Claro: A Brazilian Plantation System, 1820-1920 (Stanford: Stanford University Press, 1976).
Denis, Pierre, Brazil (London: T. Fisher Unwin, 1911).
Engerman, Stanley L., and Kenneth L. Sokoloff, “Factor Endowments, Inequality, and Paths of Development among New World Economies: A View from Economic Historians of the United States,” in How Latin America Fell Behind: Essays on the Economic Histories of Brazil and Mexico, 1800-1914, Stephen Haber, ed. (Stanford: Stanford University Press, 1997).
Engerman, Stanley L., Elisa V. Mariscal and Kenneth L. Sokoloff, “The Evolution of Schooling in the Americas, 1800-1925,” in Human Capital and Institutions. A Long-Run View, David Eltis, Frank D. Lewis and Kenneth L. Sokoloff, eds. (Cambridge: Cambridge University Press, 2009).
Fausto, Boris, “Republic: Society and Politics,” in Brazil: Empire and Republic, 1822-1930, Leslie Bethell, ed. (Cambridge, Cambridge University Press, 1989).
Fernández, Carmen, Eduardo Ley, and Mark F. J. Steel, “Model Uncertainty in Cross-Country Growth Regressions,” Journal of Applied Econometrics, 16 (2001), 563-576.
Ferrero, Gina Lombroso, Nell’America Meridionale (Brasile, Uruguay, Argentina) (Milano: Fratelli Treves Editore, 1908).
Foerster, Robert F., The Italian Emigration of Our Times (Cambridge: Harvard University Press, 1919).
Gallego, Francisco A., “Historical Origins of Schooling: The Role of Democracy and Political Decentralization,” The Review of Economics and Statistics, 92(2010), 228-243.
Galor, Oded, Omer Moav, and Dietrich Vollrath, “Inequality in Landownership, the Emergence of Human-Capital Promoting Institutions and the Great Divergence,” The Review of Economic Studies, 76 (2009), 143-179.
Géntil, Carlos Perred, A Colonia Senador Vergueiro (Santos: Typographia Imparcial, 1851).
Go, Sun and Peter H. Lindert, “The Uneven Rise of American Public Schools to 1850,” Journal of Economic History, 70 (2010), 1-26.
Godoy, Joaquim Floriano de, A Provincia de S. Paulo. Trabalho Estatistico Historico e Noticioso Destinado à Exposição Industrial de Philadelphia (Estados-Unidos) (Rio de Janeiro: Typ. do Diario, 1875).
Graham, Harry C., Coffee. Production, Trade, and Consumption by Countries (Washington: U.S. Department of Agriculture, 1912).

24
Grininger, Valdemar, Imigração Suiça em São Paulo: A História da Colônia Helvetia (Master Thesis, Universidade Estadual de Campinas, 1991).
Grossi, Vincenzo, Storia della Colonizzazione Europea al Brasile e della Emigrazione Italiana nello Stato di S. Paulo (Roma: Oficina Poligrafica Romana, 1905).
Hall, Michael, The Origins of Mass Immigration in Brazil, 1871-1914 (Phd Thesis, Columbia University, 1969).
Hanushek, Eric A., and Ludger Woessmann, “The Role of Cognitive Skills in Economic Development,” Journal of Economic Literature, 46(2008), 607–68.
Hatton, Timothy J., and Jeffrey G. Williamson, The Age of Mass Immigration. Causes and Economic Impact (Oxford: Oxford University Press, 1998).
Holanda, Sergio Buarque de, “Prefácio do Tradutor,” in Thomas Davatz, Memórias de um Colono no Brasil (1850) (São Paulo: Martins Fontes, 1941).
Holloway, Thomas, Migration and Mobility: Immigrants as Laborers and Landowners in the Coffee Zone of São Paulo, Brazil, 1886-1934 (PhD Thesis, University of Wisconsin, 1974).
Hutter, Lucy M., Imigração Italiana em São Paulo (1880-1889). Os Primeiros Contactos do Imigrante com o Brasil (São Paulo: IEB-USP, 1972).
James, Preston, “The Coffee Lands of Southeastern Brazil,” Geographical Review, 22 (1932), 225-244.
Kang, Thomas H., Instituições, Voz Política e Atraso Educacional no Brasil: 1930-1964 (Master Thesis, Universidade de São Paulo, 2010).
Kreutz, Lúcio, “A Educação de Imigrantes no Brasil,” in 500 Anos de Educação no Brasil, Lopes, Eliana M.T., Luciano Faria Filho, and Cynthia G. Veiga, eds. (Autêntica: Belo Horizonte, 2000a).
Kreutz, Lúcio, “Escolas Comunitárias de Imigrantes no Brasil: Instâncias de Coordenação e Estruturas de Apoio,” Revista Brasileira de Educação, 15 (2000b), 159-176.
Kruger, Diana, “Coffee Production Effects on Child Labor and Schooling in Rural Brazil,” Journal of Development Economics, 82 (2007), 448-463.
Laerne, C.F. van Delden, Le Brésil et Java. Rapport sur la Culture du Café en Amérique, Asie et Afrique (Haye/Paris: Martinus Nijhoff/Challamel Ainé, 1885).
Lamounier, Maria Lucia, “Agricultura e Mercado de Trabalho: Trabalhadores Brasileiros Livres nas Fazendas de Café e na Construção de Ferrovias em São Paulo, 1850-1890,” Estudos Econômicos, 37(2007), 353-372.
Lamounier, Maria Lucia, Ferrovias, Agricultura de Exportação e Mão-de-Obra no Brasil no Século XIX (Postdoctoral Thesis, Universidade de São Paulo, 2008).
Leal, Victor Nunes, Coronelismo, Enxada e Voto. O Município e o Regime Representativo no Brasil (Rio de Janeiro: Revista Forense, 1948).
Lindert, Peter H., “Voice and Growth: Was Churchill Right?,” Journal of Economic History, 63(2003), 315-350.
25
Lindert, Peter H., Growing Public: Social Spending and Economic Growth Since the Eighteenth Century (Cambridge: Cambridge University Press, 2004).
Love, Joseph L., “Political Participation in Brazil, 1881-1969,” Luso-Brazilian Review, 7 (1970), 3-24.
Love, Joseph L., São Paulo na Federação Brasileira, 1889-1937 (São Paulo: Paz e Terra, 1982).
Luna, Francisco Vidal, and Herbert Klein, Evolução da Sociedade e Economia Escravista de São Paulo, de 1750 a 1850 (São Paulo: Edusp, 2006).
Manchester, Alan K., Preeminência Inglesa no Brasil (São Paulo: Brasiliense, [1933] 1973).
Marcílio, Maria Luiza, História da Escola em São Paulo e no Brasil (Instituto Fernand Braudel: São Paulo, 2005).
Martínez-Fritscher, André Carlos, Three Essays on the Economic History of Latin America: Fiscal Federalism, Causes and Consequences (Ph.D. Thesis, Boston University, 2010).
Martínez-Fritscher, André Carlos, and Aldo Musacchio, “Can Endowments Explain Regional Inequality? State Governments and the Provision of Public Goods in Brazil, 1889-1930,” 2009, mimeo.
Martínez-Fritscher, André Carlos, Aldo Musacchio, and Martina Viarengo, “The Great Leap Forward: The Political Economy of Education in Brazil, 1889-1930,” Harvard Business School Working Paper, No. 10-075, 2010.
Mello, Pedro Carvalho, The Economics of Labor in Brazilian Coffee Plantations, 1850-1888 (PhD Thesis, University of Chicago, 1977).
Milliet, Sérgio, Roteiro do Café e Outros Ensaios: Contribuição para o Estudo da História Econômica e Social do Brasil (São Paulo: Departamento de Cultura, 1939).
Monasterio, Leonardo and Eustáquio Reis, “Mudanças na Concentração Espacial das Ocupações nas Atividades Manufatureiras no Brasil: 1872-1920,” IPEA Texto para Discussão, no. 1361, 2008.
Monbeig, Pierre, Pioneiros e Fazendeiros de São Paulo (São Paulo: Hucitec/Polis, 1984).
Nagle, Jorge, Educação e Sociedade na Primeira República (Rio de Janeiro: Fundação Nacional de Material Escolar, 1974).
Naritomi, Joana, Rodrigo R. Soares, and Juliano J. Assunção, “Institutional Development and Colonial Heritage in Brazil,” IZA Discussion Paper, No. 4276, 2009.
North, Douglass, William Summerhill, and Barry Weingast, “Order, Disorder, and Economic Change: Latin America versus North America,” Governing for Prosperity, Bruce Bueno de Mesquita, and Hilton Root, eds. (New Haven: Yale University Press, 2000).
Nunn, Nathan, “Slavery, Inequality, and Economic Development in the Americas: An Examination of the Engerman-Sokoloff Hypothesis,” MPRA Paper, No. 5869, 2007.
Perrod, Enrico, La Provincia di San Paolo (Brasile) (Roma: Tipografia del Ministero degli Affari Esteri, 1888).
Pinto, Adolpho, Historia da Viação Publica de S. Paulo (Brasil) (São Paulo: Typographia e Papelaria de Vanorden & Cia., 1903).

26
Saes, Flávio A. M., As Ferrovias de São Paulo, 1870-1940 (São Paulo: Hucitec, 1981).
São Paulo, Discurso com que o Illustrissimo e Excellentissimo Senhor dr. José Thomaz Nabuco d'Araujo, Presidente da Provincia de São Paulo, Abrio a Assembléa Legislativa Provincial no Dia 1.o de Maio de 1852 (São Paulo: Typ. do Governo Arrendada por Antonio Louzada Antunes, 1852).
São Paulo, Discurso com que o Illustrissimo e Excellentissimo Senhor Senador José Joaquim Fernandes Torres, Presidente da Provincia de S. Paulo, Abrio a Assembléa Legislativa Provincial no Anno de 1859 (S. Paulo: Typ. Imparcial de Joaquim Roberto de Azevedo Marques, 1859).
São Paulo, Documentos com que o Illustrissimo e Excellentissimo Senhor, Senador José Joaquim Fernandes Torres, Presidente da Provincia de S. Paulo, Instruio o Relatorio da Abertura da Assembléa Legislativa Provincial no Dia 2 de fevereiro de 1858 (S. Paulo: Typ. Dous de Dezembro de Antonio Louzada Antunes, 1858).
São Paulo, Exposição com que o Exmo. Sr. Visconde Parnahyba Passou a Administração da Provincia de São Paulo ao Exmo. Sr. ao Dr. Francisco de Paulo Rodrigues Alves, Presidente desta Provincia, no Dia 19 de novembro de 1887 (São Paulo: Typographia a Vapor de Jorge Seckler & Comp., 1887).
São Paulo, Relatorio Apresentado à Assembléa Legislativa Provincial de São Paulo na Primeira Sessão da Decima Oitava Legislatura no Dia 2 de Fevereiro de 1868 pelo Presidente da mesma Provincia, Conselheiro Joaquim Saldanha Marinho (São Paulo: Typ. do Ypiranga, 1868).
São Paulo, Relatorio Apresentado à Assembléa Legislativa Provincial de São Paulo pelo Presidente da Província, o Exm. Sr. Dr. Antonio Candido da Rocha, no Dia 2 de fevereiro de 1870 (São Paulo: Typographia Americana, 1870).
São Paulo, Relatorio Apresentado à Assembléa Legislativa Provincial de S. Paulo pelo Exm. Sr. Dr. João Theodoro Xavier, Presidente da Provincia, no Dia 14 de fevereiro de 1875 (S. Paulo: Typ. do “Diario,” 1875).
São Paulo, Relatorio Apresentado à Assembléa Legislativa Provincial de São Paulo pelo Presidente da Província, o Exm. Sr. Dr. Sebastião José Pereira, em Fevereiro de 1877 (São Paulo: Typographia do “Diario”, 1877).
São Paulo, Relatorio Apresentado à Assembléa Legislativa Provincial de S. Paulo pelo Presidente da Provincia, Laurindo Abelardo de Brito, no Dia 5 de Fevereiro de 1880 (Santos: Typ. a Vapor do Diario de Santos, 1880).
São Paulo, Relatorio Apresentado à Assembléa Legislativa Provincial de São Paulo pelo Presidente da Provincia, Exm. Snr. Dr. Francisco de Paula Rodrigues Alves, no Dia 10 de Janeiro de 1888 (São Paulo: Typ. a Vapor de Jorge Seckler & Comp., 1888).
São Paulo, Directoria Geral da Instrucção Publica, Annuario do Ensino do Estado de São Paulo, 1913 (São Paulo, 1913).
São Paulo, Directoria Geral da Instrucção Publica, Annuario do Ensino do Estado de São Paulo, 1914 (São Paulo, 1914).

27
São Paulo, Directoria Geral da Instrucção Publica, Annuario do Ensino do Estado de São Paulo, 1918 (São Paulo, 1918).
São Paulo, Repartição de Estatistica e do Archivo de São Paulo, Annuario Estatistico do Estado de São Paulo, 1901 (São Paulo: Typographia do “Diario Official”, [1901] 1904).
São Paulo, Repartição de Estatistica e do Archivo de São Paulo, Annuario Estatistico do Estado de São Paulo, 1904 (São Paulo: Typographia do “Diario Official”, [1904], 1907).
São Paulo, Repartição de Estatistica e do Archivo de São Paulo, Annuario Estatistico do Estado de São Paulo, 1905 (São Paulo: Typographia Espindola & Comp., [1905] 1907).
São Paulo, Repartição de Estatistica e do Archivo de São Paulo, Annuario Estatistico do Estado de São Paulo, 1906 (São Paulo: Typographia Espindola & Comp., [1906] 1908).
São Paulo, Repartição de Estatistica e do Archivo de São Paulo, Annuario Estatistico do Estado de São Paulo, 1907 (São Paulo: Duprat & Comp., [1907] 1910).
São Paulo, Repartição de Estatística e do Archivo do Estado, Annuario Estatistico de São Paulo, 1909 (São Paulo: Casa Vanorden, [1909] 1911).
São Paulo, Repartição de Estatística e do Archivo do Estado, Annuario Estatistico de São Paulo, 1910 (São Paulo: Duprat & Comp., [1910] 1912).
São Paulo, Secretaria dos Negocios da Agricultura, Commercio e Obras Publicas, Relatorio Apresentado ao Dr. Bernardino de Campos, Presidente do Estado, pelo Dr. João Baptista Mello Peixoto, Secretario da Agricultura. Anno de 1902 (São Paulo: Typographia do “Diario Official”, [1902] 1903).
São Paulo, Secretaria dos Negocios da Agricultura, Commercio e Obras Publicas, Estatistica Agrícola e Zootécnica do Estado de São Paulo, 1904-1905 (São Paulo, 1904-5).
São Paulo, Secretaria dos Negocios da Agricultura, Commercio e Obras Publicas, Relatorio da Agrigultura, 1928. Apresentado ao Dr. Julio Prestes de Albuquerque, Presidente do Estado, pelo Dr. Fernando Costa, Secretario da Agricultura (São Paulo, 1928).
Simonsen, Roberto, “Aspectos da História Econômica do Café,” in Evolução Industrial do Brasil e Outros Estudos (São Paulo: Cia Editora Nacional/Editora USP, 1973).
Smith, T. Lynn, Brazil. People and Institutions (Baton Rouge: Lousiana State University Press, 1954).
Summerhill, William R., Order Against Progress: Government, Foreign Investment, and Railroads in Brazil, 1854-1913 (Stanford: Stanford University Press, 2003).
Summerhill, William R., “Colonial Institutions, Slavery, Inequality, and Development: Evidence from São Paulo, Brazil,” MPRA Paper, No. 22162, 2010.
Tavares Bastos, Aureliano, A Província. Estudo sobre a Descentralização no Brasil (Rio de Janeiro: B.L. Garnier, 1870).
Trento, Angelo, Do Outro Lado do Atlântico. Um Século de Imigração Italiana no Brasil (São Paulo: Nobel, 1989).
Tschudi, J.J. von, Viagem às Províncias do Rio de Janeiro e S. Paulo (São Paulo, Martins, [1866] 1953).

28
Vasconcellos, J.M.P., Livro das Terras ou Colecção da Lei, Regulamentos e Ordens, 4th ed. (Rio de Janeiro: H. Laemmert & C., 1885).
Versiani, Flávio R., and José Raimundo Vergolino, “Preços de Escravos em Pernambuco no Século XIX,” Textos para Discussão – Departamento de Economia UnB, No. 252, 2002.
Villela, André, “Distribuição Regional das Receitas e Despesas do Governo Central no II Reinado, 1844-1889,” Estudos Econômicos, 37(2007), 247-274.
Williamson, Jeffrey, “Regional Inequality and the Process of National Development: a Description of the Patterns,” Economic Development and Cultural Change, 13 (1965), 1-84.
Zeugner, Stegan, “Bayesian Model Averaging with BMS,” 2010, mimeo.

Table 1. The Determinants of Public Instruction Supply in the 1900s: Simple Regressions and Summary Statistics
I II III
Independent variable1 Population (in logs), 1907 9.565 [0.730] 0.0949 [0.0268] 0.0265 [0.0128] 0.0486 [0.0176]
2 Tax revenue from coffee per capita, 1904-07 0.214 [0.249] 0.2313 [0.0639] 0.1278 [0.0600] 0.0168 [0.0424]
3 # Workers per farm, 1905 10.892 [12.864] 0.0034 [0.0008] -0.0008 [0.0007] 0.0002 [0.0006]
4 % Farms larger than 100 alqueires , 1905 0.182 [0.128] -0.0588 [0.1483] 0.2028 [0.1302] -0.0847 [0.1209]
5 % Voters/Population, 1904 0.039 [0.018] -3.2397 [1.0836] -0.1598 [1.0658] -0.2378 [0.8091]
6 % Slaves, 1872 0.168 [0.088] 0.4237 [0.2830] -0.0172 [0.1267] 0.4068 [0.1182]
7 % Illiterates, 1872 0.84 [0.070] 0.0335 [0.3887] -0.0906 [0.1250] -0.5313 [0.2088]
8 % Non-Catholics, 1872 0.002 [0.006] 3.2712 [4.4907] -0.8964 [1.1283] 3.2268 [2.1834]
9 Land Gini (incl. landless peasants), 1905 0.939 [0.078] 0.4835 [0.3987] 0.4033 [0.1695] -0.0211 [0.2735]
10 Coffee area, 1905 0.761 [0.428] 0.0819 [0.0610] 0.0997 [0.0231] -0.0067 [0.0499]
11 Coffee trees per capita, 1905 0.217 [0.184] 0.3572 [0.1084] 0.1327 [0.0713] 0.0134 [0.0701]
12 Population density, 1907 24.317 [16.797] 0.0029 [0.0011] -0.0003 [0.0007] 0.0018 [0.0009]
13 % Foreign-born landowners, 1905 0.163 [0.158] 0.5762 [0.1353] 0.1056 [0.0794] 0.2974 [0.0928]
14 % Land area owned by foreigners, 1905 0.096 [0.086] 0.7546 [0.2154] 0.1784 [0.1478] 0.3692 [0.1334]
15 % Foreign-born workers, 1905 0.359 [0.321] 0.287 [0.0535] 0.1124 [0.0352] 0.0556 [0.0364]
Dependent variable statisticsMean 0.168 0.114 0.215
Standard deviation 0.155 0.157 0.107
10th percentile 0.000 0.000 0.087
90th percentile 0.391 0.349 0.356
Number of observations 144 144 144
Simple Regression Results
Summary Statistics
Mean [S.D.]
Expenditure in local
public schools, per capita
1904-07
% Pupils in local public
schools, 1905
% of Children in school,
1905
Notes: The regression coefficients are based on a cross-section of minimal comparable areas 1905-2000. A constant is included in the each regression.
Observations are weighted by 1907 population in the regressions, but summary statistics for both independent and dependent variables are unweighted.
Standard errors are in square brackets; shaded cells represent statistical significance at the 5% level.
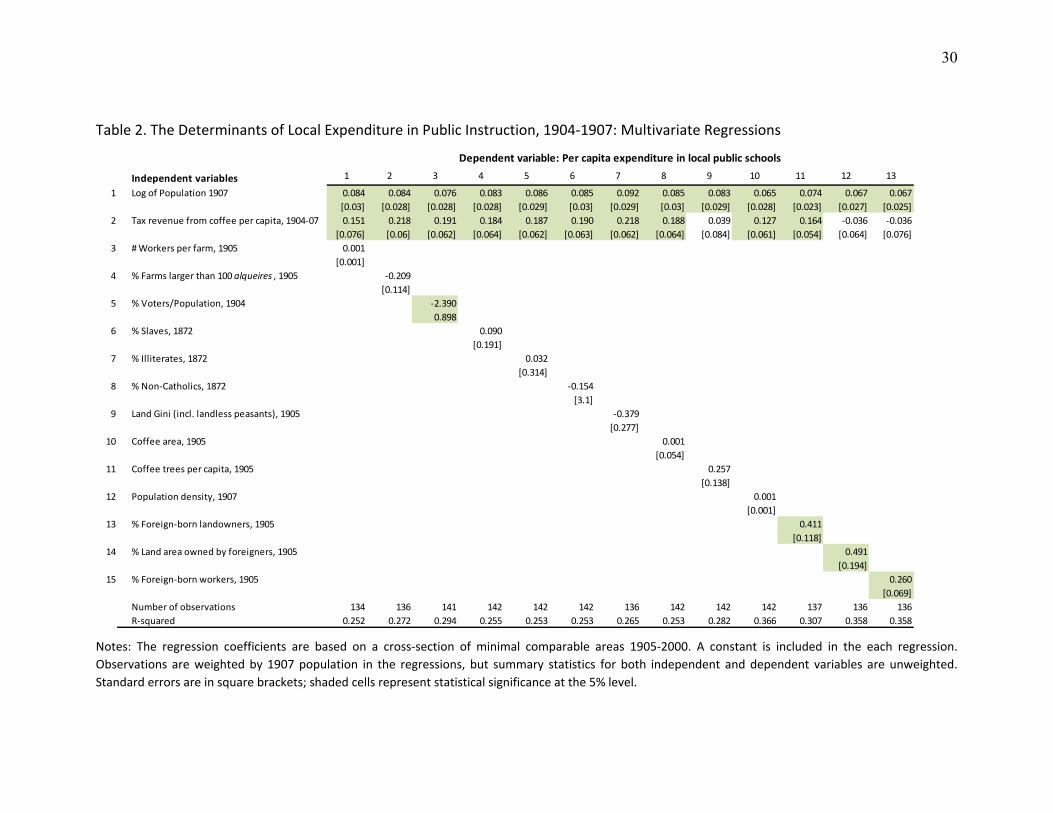
30
Table 2. The Determinants of Local Expenditure in Public Instruction, 1904-1907: Multivariate Regressions
Independent variables 1 2 3 4 5 6 7 8 9 10 11 12 13
1 Log of Population 1907 0.084 0.084 0.076 0.083 0.086 0.085 0.092 0.085 0.083 0.065 0.074 0.067 0.067
[0.03] [0.028] [0.028] [0.028] [0.029] [0.03] [0.029] [0.03] [0.029] [0.028] [0.023] [0.027] [0.025]
2 Tax revenue from coffee per capita, 1904-07 0.151 0.218 0.191 0.184 0.187 0.190 0.218 0.188 0.039 0.127 0.164 -0.036 -0.036
[0.076] [0.06] [0.062] [0.064] [0.062] [0.063] [0.062] [0.064] [0.084] [0.061] [0.054] [0.064] [0.076]
3 # Workers per farm, 1905 0.001
[0.001]
4 % Farms larger than 100 alqueires , 1905 -0.209
[0.114]
5 % Voters/Population, 1904 -2.390
0.898
6 % Slaves, 1872 0.090
[0.191]
7 % Illiterates, 1872 0.032
[0.314]
8 % Non-Catholics, 1872 -0.154
[3.1]
9 Land Gini (incl. landless peasants), 1905 -0.379
[0.277]
10 Coffee area, 1905 0.001
[0.054]
11 Coffee trees per capita, 1905 0.257
[0.138]
12 Population density, 1907 0.001
[0.001]
13 % Foreign-born landowners, 1905 0.411
[0.118]
14 % Land area owned by foreigners, 1905 0.491
[0.194]
15 % Foreign-born workers, 1905 0.260
[0.069]
Number of observations 134 136 141 142 142 142 136 142 142 142 137 136 136
R-squared 0.252 0.272 0.294 0.255 0.253 0.253 0.265 0.253 0.282 0.366 0.307 0.358 0.358
Dependent variable: Per capita expenditure in local public schools
Notes: The regression coefficients are based on a cross-section of minimal comparable areas 1905-2000. A constant is included in the each regression.
Observations are weighted by 1907 population in the regressions, but summary statistics for both independent and dependent variables are unweighted.
Standard errors are in square brackets; shaded cells represent statistical significance at the 5% level.

Table 3. The Determinants of Local Expenditure in Public Instruction, 1904-1907: Bayesian
Model Averaging Estimates
Bayesian Estimates
PIP Post Mean Post SD Cond. Pos.Sign Idx
% Foreign-born workers, 1905 0.9504 0.4197 0.1484 1.0000
Log of Population 1907 0.7624 0.1693 0.1176 1.0000
Land Gini (incl. landless peasants), 1905 0.4113 -0.0738 0.1032 0.0000
% Foreign-born landowners, 1905 0.3799 0.0748 0.1122 1.0000
% Land area owned by foreigners, 1905 0.3722 0.0648 0.0982 1.0000
% Non-Catholics, 1872 0.1867 -0.0212 0.0543 0.0000
% Voters/Population, 1904 0.1515 -0.0156 0.0467 0.0000
Coffee trees per capita, 1905 0.1262 0.0195 0.0706 0.9964
Tax revenue from coffee per capita, 1904-07 0.1141 0.0159 0.0627 0.9999
# Workers per farm, 1905 0.0799 -0.0055 0.0341 0.0180
% Illiterates, 1872 0.0784 0.0040 0.0247 0.9950
% Farms larger than 100 alqueires, 1905 0.0686 -0.0005 0.0228 0.4200
Population density, 1907 0.0671 0.0018 0.0217 0.8331
Coffee area, 1905 0.0648 -0.0001 0.0226 0.4187
% Slaves, 1872 0.0636 -0.0007 0.0199 0.3017
PIP: posterior probability of inclusion
Post. Mean: Posterior mean of the coefficient
Post. SD Cond: Posterior standard deviation of coefficient conditional on inclusion
Pos. Sign. Idx: Posterior probability of positive signal, conditional on inclusion.
Estimates based on 200,000 burned iterations, 400,000 iterations, uniform prior over the space of models.
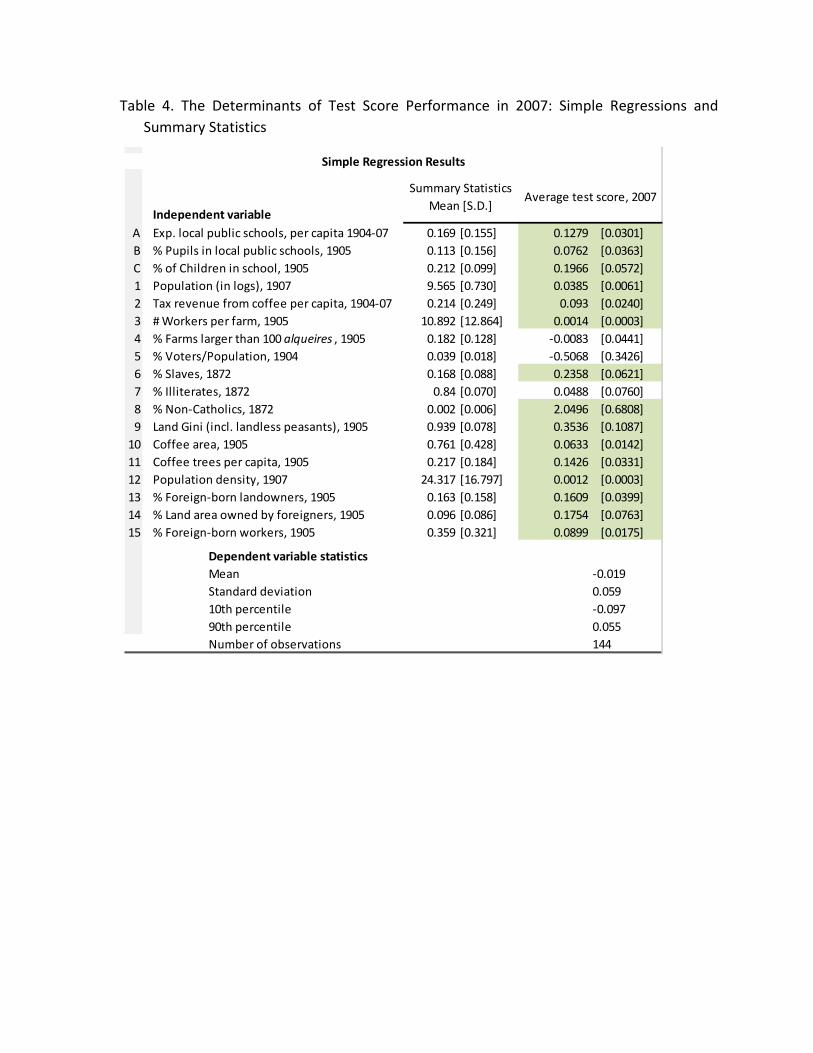
Table 4. The Determinants of Test Score Performance in 2007: Simple Regressions and
Summary Statistics
Independent variableA Exp. local public schools, per capita 1904-07 0.169 [0.155] 0.1279 [0.0301]
B % Pupils in local public schools, 1905 0.113 [0.156] 0.0762 [0.0363]
C % of Children in school, 1905 0.212 [0.099] 0.1966 [0.0572]
1 Population (in logs), 1907 9.565 [0.730] 0.0385 [0.0061]
2 Tax revenue from coffee per capita, 1904-07 0.214 [0.249] 0.093 [0.0240]
3 # Workers per farm, 1905 10.892 [12.864] 0.0014 [0.0003]
4 % Farms larger than 100 alqueires , 1905 0.182 [0.128] -0.0083 [0.0441]
5 % Voters/Population, 1904 0.039 [0.018] -0.5068 [0.3426]
6 % Slaves, 1872 0.168 [0.088] 0.2358 [0.0621]
7 % Illiterates, 1872 0.84 [0.070] 0.0488 [0.0760]
8 % Non-Catholics, 1872 0.002 [0.006] 2.0496 [0.6808]
9 Land Gini (incl. landless peasants), 1905 0.939 [0.078] 0.3536 [0.1087]
10 Coffee area, 1905 0.761 [0.428] 0.0633 [0.0142]
11 Coffee trees per capita, 1905 0.217 [0.184] 0.1426 [0.0331]
12 Population density, 1907 24.317 [16.797] 0.0012 [0.0003]
13 % Foreign-born landowners, 1905 0.163 [0.158] 0.1609 [0.0399]
14 % Land area owned by foreigners, 1905 0.096 [0.086] 0.1754 [0.0763]
15 % Foreign-born workers, 1905 0.359 [0.321] 0.0899 [0.0175]
Dependent variable statisticsMean -0.019
Standard deviation 0.059
10th percentile -0.097
90th percentile 0.055
Number of observations 144
Simple Regression Results
Summary Statistics
Mean [S.D.]Average test score, 2007

Table 5. The Determinants of Test Score Performance in 2007: Multivariate Regressions
Independent variable 1 2 3 4 5 6 7 8 9 10 11 12 13 14 15 16
1 Log of Population 1907 0.0323 0.0342 0.0294 0.033 0.033 0.035 0.032 0.036 0.033 0.033 0.034 0.034 0.030 0.031 0.033 0.0307
[0.007] [0.005] [0.006] [0.005] [0.005] [0.006] [0.006] [0.005] [0.006] [0.006] [0.005] [0.005] [0.006] [0.006] [0.005] [0.006]
2 Tax revenue from coffee per capita, 1904-07 0.071 0.0737 0.0767 0.052 0.079 0.077 0.069 0.072 0.075 0.063 0.047 0.017 0.071 0.064 0.067 0.0246
[0.022] [0.023] [0.022] [0.026] [0.025] [0.023] [0.022] [0.024] [0.022] [0.023] [0.022] [0.027] [0.022] [0.021] [0.023] [0.027]
3 Exp. local public schools, per capita 1904-07 0.0261
[0.032]
4 % Pupils in local public schools, 1905 0.0185
[0.024]
5 % of Children in school, 1905 0.105
[0.049]
6 # Workers per farm, 1905 0.0005
[0.0004]
7 % Farms larger than 100 alqueires , 1905 -0.062
[0.037]
8 % Voters/Population, 1904 -0.122
[0.27]
9 % Slaves, 1872 0.109
[0.061]
10 % Illiterates, 1872 0.052
[0.056]
11 % Non-Catholics, 1872 0.719
[0.461]
12 Land Gini (incl. landless peasants), 1905 0.078
[0.065]
13 Coffee area, 1905 0.040
[0.014]
14 Coffee trees per capita, 1905 0.101
[0.041]
15 Population density, 1907 0.001
[0.0003]
16 % Foreign-born landowners, 1905 0.082
[0.031]
17 % Land area owned by foreigners, 1905 0.062
[0.063]
18 % Foreign-born workers, 1905 0.0534
[0.024]
Number of observations 142 142 142 134 136 141 142 142 142 136 142 142 142 142 137 136
R-squared 0.379 0.376 0.406 0.371 0.382 0.383 0.398 0.379 0.381 0.371 0.432 0.413 0.407 0.414 0.38 0.413
F-stat 29 31.2 26.2 30.5 29.3 30.3 26.3 31.7 29.1 28.6 34.5 31.1 35.2 30.6 28.0 28.8
Dependent variable: Average test scores 2007
Notes: The regression coefficients are based on a cross-section of minimal comparable areas 1905-2000. A constant is included in the each regression.
Observations are weighted by 1907 population in the regressions, but summary statistics for both independent and dependent variables are unweighted.
Standard errors are in square brackets; shaded cells represent statistical significance at the 5% level.

34
Table 6. The Determinants of Per Capita Income in 2000: Multivariate Regressions
Independent variable 1 2 3 4 5 6 7 8 9 10 11 12 13 14 15 16
1 Log of Population 1907 -0.253 -0.184 -0.288 -0.211 -0.211 -0.203 -0.239 -0.186 -0.208 -0.190 -0.201 -0.202 -0.336 -0.241 -0.188 -0.207
[0.11] [0.086] [0.098] [0.087] [0.077] [0.091] [0.098] [0.084] [0.094] [0.092] [0.092] [0.087] [0.08] [0.09] [0.074] [0.101]
2 Tax revenue from coffee per capita, 1904-07 0.478 0.663 0.629 0.129 0.839 0.620 0.501 0.589 0.599 0.567 0.340 -0.072 0.442 0.460 0.562 0.326
[0.292] [0.337] [0.3] [0.329] [0.364] [0.326] [0.312] [0.319] [0.325] [0.326] [0.306] [0.341] [0.259] [0.289] [0.343] [0.405]
3 Exp. local public schools, per capita 1904-07 0.72
[0.521]
4 % Pupils in local public schools, 1905 -0.411
[0.418]
5 % of Children in school, 1905 1.95
[0.666]
6 # Workers per farm, 1905 0.0111
[0.004]
7 % Farms larger than 100 alqueires , 1905 -1.880
[0.606]
8 % Voters/Population, 1904 -3.440
[3.98]
9 % Slaves, 1872 1.770
[0.861]
10 % Illiterates, 1872 0.339
[1]
11 % Non-Catholics, 1872 7.920
[8.1]
12 Land Gini (incl. landless peasants), 1905 -0.181
[0.85]
13 Coffee area, 1905 0.384
[0.277]
14 Coffee trees per capita, 1905 1.180
[0.602]
15 Population density, 1907 0.020
[0.004]
16 % Foreign-born landowners, 1905 1.020
[0.465]
17 % Land area owned by foreigners, 1905 -0.044
[1]
18 % Foreign-born workers, 1905 0.276
[0.38]
Number of observations 142 142 142 134 136 141 142 142 142 136 142 142 142 142 137 136
R-squared 0.104 0.0843 0.162 0.111 0.179 0.0821 0.127 0.078 0.0828 0.0724 0.119 0.119 0.371 0.125 0.0712 0.0791
F-stat 2.33 2.24 3.54 3.4 3.8 2.1 2.6 2.0 2.1 2.4 2.0 2.1 8.4 2.9 2.7 1.95
Dependent variable: Log of Income Per Capita, Census 2000
Notes: The regression coefficients are based on a cross-section of minimal comparable areas 1905-2000. A constant is included in the each regression.
Observations are weighted by 1907 population in the regressions, but summary statistics for both independent and dependent variables are unweighted.
Standard errors are in square brackets; shaded cells represent statistical significance at the 5% level.

Figure 2. The Cross-Sectional Relationship between Local Expenditure in Public Instruction
and the Fraction of Adults Voting in the 1904 Elections
0.2
.4.6
.02 .04 .06 .08 .1 .12% Voters/Population in 1904
Coffee Non-Coffee
1904
/07
loca
l ed
ucat
iona
l exp
.
Coffee area: More than 30 coffee trees per capita in 1905Bubbles are proportional to population in 1907
1904/07 local educational exp. X % voters/population, 1904
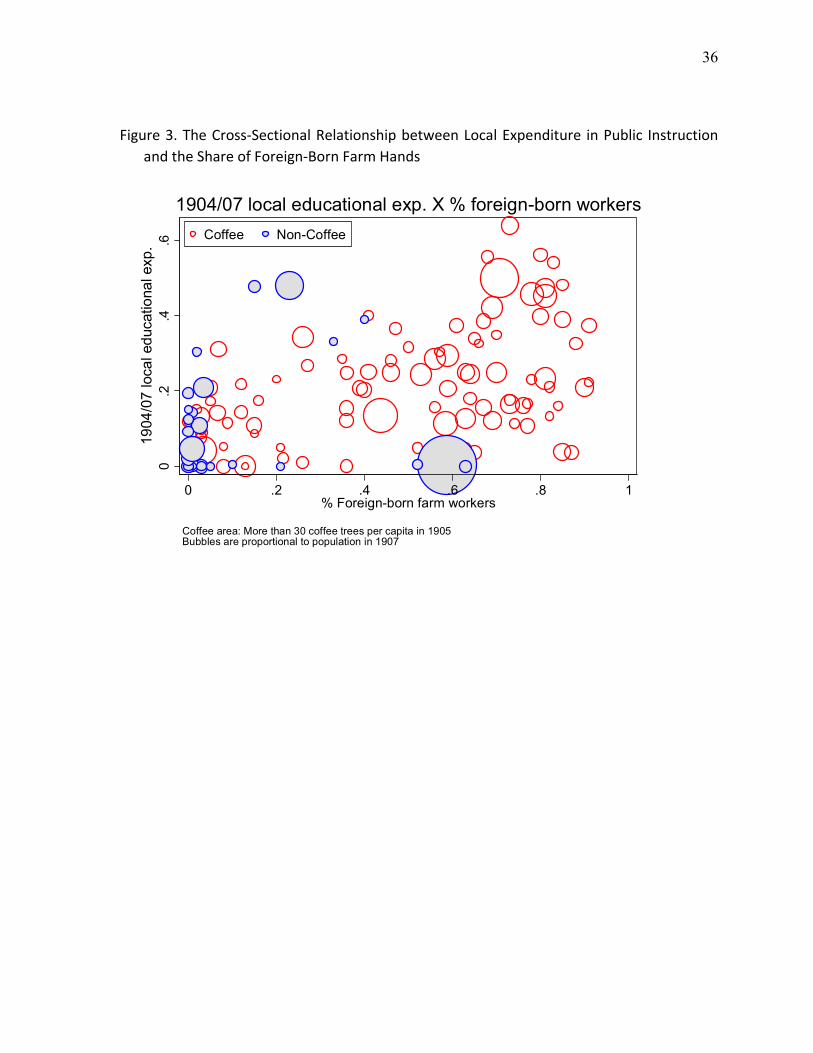
36
Figure 3. The Cross-Sectional Relationship between Local Expenditure in Public Instruction
and the Share of Foreign-Born Farm Hands 0
.2.4
.6
0 .2 .4 .6 .8 1% Foreign-born farm workers
Coffee Non-Coffee
1904
/07
loca
l ed
ucat
iona
l exp
.
Coffee area: More than 30 coffee trees per capita in 1905Bubbles are proportional to population in 1907
1904/07 local educational exp. X % foreign-born workers
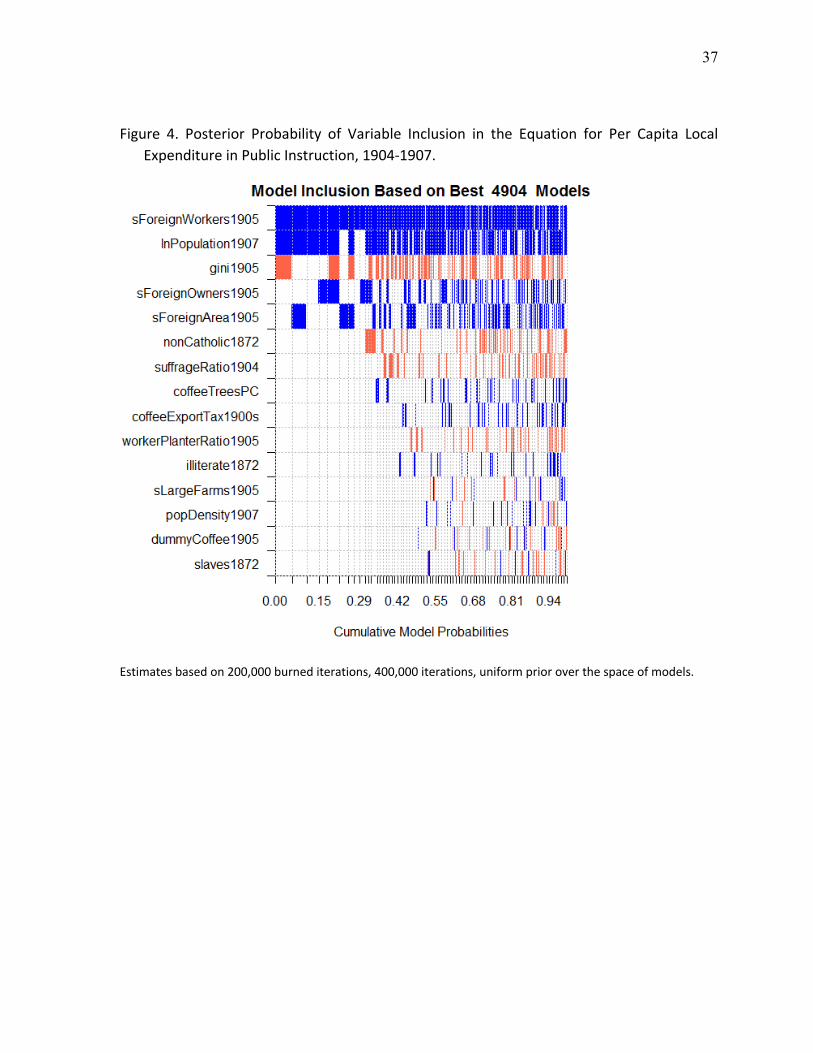
37
Figure 4. Posterior Probability of Variable Inclusion in the Equation for Per Capita Local
Expenditure in Public Instruction, 1904-1907.
Estimates based on 200,000 burned iterations, 400,000 iterations, uniform prior over the space of models.

38
Figure 5. Posterior Probability of Variable Inclusion in the Equation for Average ENEM Test
Score 2007
Estimates based on 200,000 burned iterations, 400,000 iterations, uniform prior over the space of models.

39
Figure 6. Posterior Probability of Variable Inclusion in the Equation for Per Capita Income,
2000
Estimates based on 260,000 burned iterations, 600,000 iterations, uniform prior over the space of models.

40
Data Appendix
Variables Description
Log of Population 1907
Calculated by the authors, based on Brasil (1916b), 345-9.
Tax revenue from coffee per capita, 1904-07
Calculated by the authors, based on São Paulo ([1904], [1905] and [1907]).
# Workers per farm, 1905
Calculated by the authors, based on the agricultural census of 1905 (São Paulo 1904-5).
% Farms larger than 100 alqueires, 1905
Calculated by the authors, based on the agricultural census of 1905 (São Paulo 1904-5).
Fraction of adults voting in 1904 Calculated by the authors, based on São Paulo ([1904]).
% Slaves, 1872
Ratio of slaves to total population in the Census of 1872 (Brasil 1872).
% Illiterates, 1872
Ratio of illiterates to total population in the Census of 1872 (Brasil 1872).
% Non-Catholics, 1872
Ratio of non-Catholics to total population in the Census of 1872 (Brasil 1872).
Land Gini (incl. landless peasants), 1905
Calculated by the authors, based on the agricultural census of 1905 (São Paulo 1904-5).
Coffee area, 1905
Calculated by the authors, based on the agricultural census of 1905 (São Paulo 1904-5).
Coffee trees per capita, 1905
Calculated by the authors, based on the agricultural census of 1905 (São Paulo 1904-5).
Population density, 1907
Calculated by the authors, based on Brasil (1916b), 345-9.
% Foreign-born landowners, 1905
Calculated by the authors, based on the agricultural census of 1905 (São Paulo 1904-5).
% Land area owned by foreigners, 1905
Calculated by the authors, based on the agricultural census of 1905 (São Paulo 1904-5).
% Foreign-born workers, 1905
Calculated by the authors, based on the agricultural census of 1905 (São Paulo 1904-5).
Rain (mm per month) Trimester averages of rain, in millimeters per month (December to February; March to May; June to August; September to November) over a 30 year period (1961-1990). These estimates were built based on the database CRU CL 2.0 10' of the Climate Research Unit at University of East Anglia (CRU-UEA) in the UK (New et al. 2002 e http://www.cru.uea.ac.uk). Downloaded from www.ipeadata.gov.br
Temperature (°C) Trimester averages of temperature, in Celsius, per month (December to February; March to May; June to August; September to November) over a 30 year period (1961-1990). These estimates were built based on the database CRU CL 2.0 10' of the Climate Research Unit at University of East Anglia (CRU-UEA) in the UK (New et al. 2002 e http://www.cru.uea.ac.uk). Downloaded from www.ipeadata.gov.br
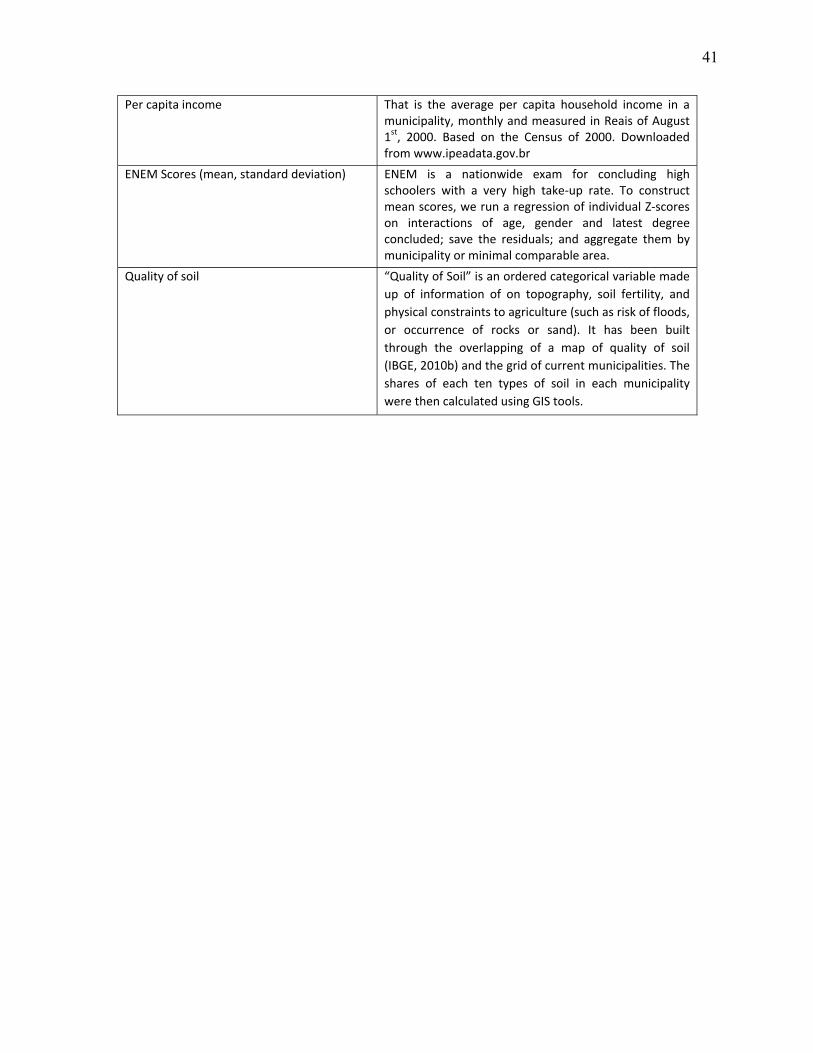
41
Per capita income That is the average per capita household income in a municipality, monthly and measured in Reais of August 1st, 2000. Based on the Census of 2000. Downloaded from www.ipeadata.gov.br
ENEM Scores (mean, standard deviation) ENEM is a nationwide exam for concluding high schoolers with a very high take-up rate. To construct mean scores, we run a regression of individual Z-scores on interactions of age, gender and latest degree concluded; save the residuals; and aggregate them by municipality or minimal comparable area.
Quality of soil “Quality of Soil” is an ordered categorical variable made
up of information of on topography, soil fertility, and
physical constraints to agriculture (such as risk of floods,
or occurrence of rocks or sand). It has been built
through the overlapping of a map of quality of soil
(IBGE, 2010b) and the grid of current municipalities. The
shares of each ten types of soil in each municipality
were then calculated using GIS tools.

Appendix
Table 1IV Univariate Regression Results, Using Instrumental Variables
1 2 3 4
Independent variableTax revenue from coffee per capita, 1904-07 0.3495 [0.1835] 0.3713 [0.1203] -0.1047 [0.1297] 0.1471 [0.0446]
# Workers per farm, 1905 0.0068 [0.0034] 0.0067 [0.0032] -0.0017 [0.0022] 0.0021 [0.0008]
% Farms larger than 100 alqueires , 1905 0.7599 [0.5071] 0.7942 [0.3123] -0.2929 [0.2575] 0.1855 [0.1267]
Fraction of adults voting, 1904 15.5044 [13.6477] 19.1998 [12.9383] -3.9983 [4.9121] 6.3536 [4.7975]
% Slaves, 1872 0.2834 [0.4674] -0.1115 [0.2597] 0.3944 [0.2714] 0.4124 [0.1036]
% Illiterates, 1872 0.2241 [1.1873] 1.06 [0.9745] -1.2225 [0.3486] 0.3649 [0.3974]
% Non-Catholics, 1872 1.7438 [10.2447] -8.2211 [7.0599] 8.9284 [4.8714] 5.2952 [2.2319]
Land Gini (incl. landless peasants), 1905 1.3471 [1.2992] 1.2874 [0.5220] -0.5051 [0.8503] 0.7827 [0.3280]
Coffee area, 1905 0.1021 [0.1050] 0.1142 [0.0388] -0.0458 [0.0775] 0.078 [0.0232]
Coffee trees per capita, 1905 0.3782 [0.2073] 0.4069 [0.1295] -0.119 [0.1496] 0.1705 [0.0464]
% Foreign-born landowners, 1905 0.8843 [0.2135] 0.4896 [0.1953] 0.2807 [0.1245] 0.2703 [0.0823]
% Acreage owned by foreigners, 1905 1.5217 [0.5897] 0.6271 [0.3540] 0.7614 [0.4383] 0.2482 [0.1888]
% Foreign-born workers, 1905 0.2386 [0.0900] 0.2041 [0.0624] -0.0327 [0.0724] 0.0803 [0.0234]
Notes: Excluded variables are the dummies for weather and altitude based on James (1932).
Univariate Regression Results (Instrumental variables estimates)
Per capita expenditure
in local public schools
% Pupils in local public
schools, 1905
% of Children in school,
1905Average test score, 2007
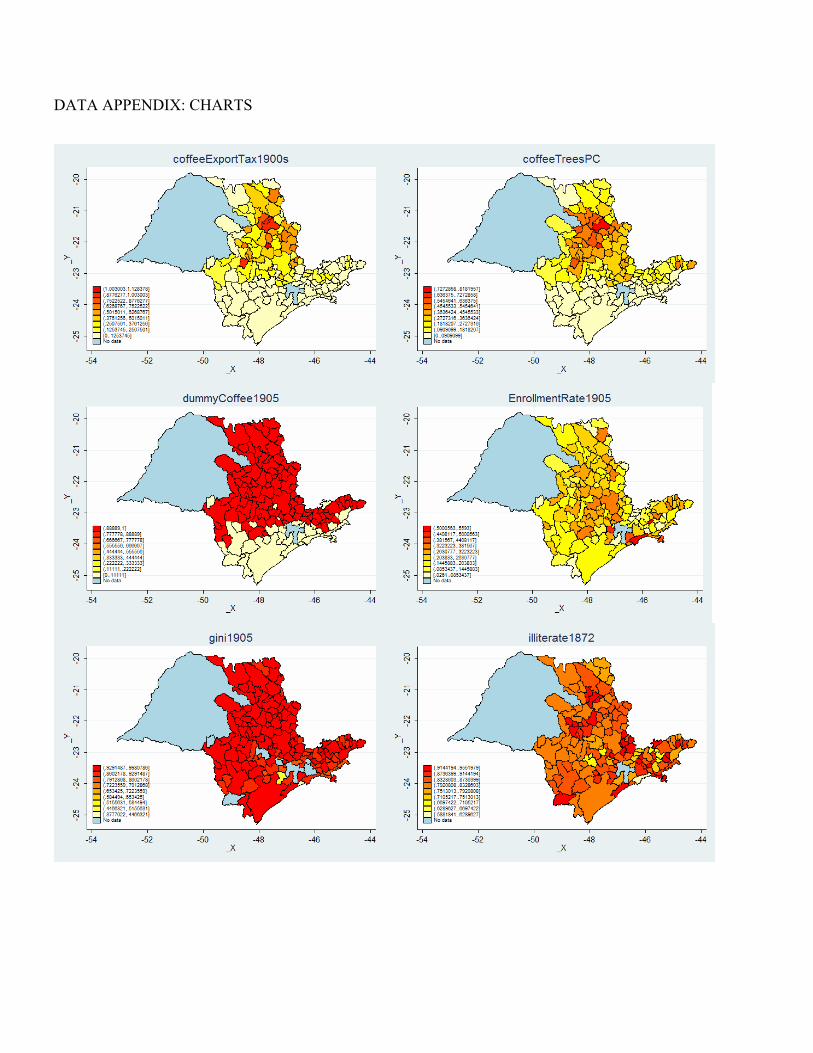
DATA APPENDIX: CHARTS
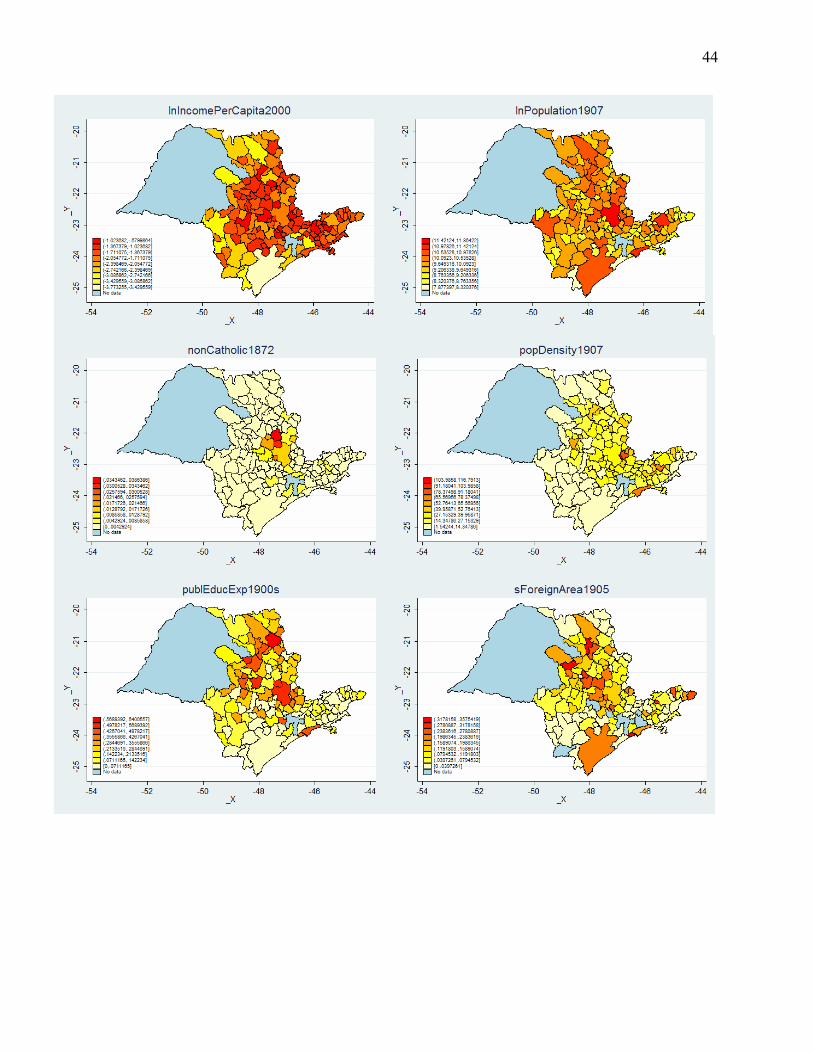
44

45

46