economic impact of cruise ship passengers in portland, maine
TRANSCRIPT

ECONOMIC IMPACT OF CRUISE SHIP PASSENGERS IN PORTLAND, MAINE*
SOE Staff Paper 578
July 2009
Todd Gabe and James C. McConnon, Jr.**
School of Economics University of Maine
Orono, Maine Summary: This report examines the demographic characteristics and economic impact of cruise ship passengers in Portland, Maine, and its surrounding region. In 2008, the city hosted an estimated 47,841 passengers from 32 ships. Information collected from surveys distributed during the fall of 2008 suggests that cruise ship passengers spend an average of $80.51 on goods and services in the Portland region. This amount increases to $109.68 with the inclusion of passenger expenditures on cruise-line sponsored tours. The total economic impact of cruise ship passenger spending, including multiplier effects, is between $5.8 million and $8.0 million in sales revenue throughout the Portland region. Economic activity associated with this spending supported between 69 and 96 full- and part-time jobs, and provided between $2.0 million and $3.2 million in wages and salaries. * This study was funded, in part, by the City of Portland. We would like to recognize the following individuals for assistance provided on the project: Patricia Finnigan, Toni Doucette, Patrick Arnold, Amy Powers, Sam Michie, Michael Correia, Emma Kilgore, Bernardita Silva, Caroline Noblet and Lisa Bragg. ** Todd Gabe (corresponding author: [email protected]) is Associate Professor of Economics, and CenTRO Fellow at the University of Maine. James McConnon is Extension Specialist and Professor of Economics at the University of Maine.

ECONOMIC IMPACT OF CRUISE SHIP PASSENGERS IN PORTLAND, MAINE
1. Introduction
The North American cruise industry has experienced substantial growth in recent
years. Within the United States, direct spending by cruise lines and passengers increased
from $14.70 billion to $18.68 billion (27 percent) between 2004 and 2007 (Business
Research & Economic Advisors 2008). Including multiplier effects, the North American
cruise industry supported 354,690 U.S. jobs and provided $15.44 billion in wages and
salaries in 2007.
Spending by cruise ship passengers and crew provide a stimulus to the economies
of U.S. ports of embarkation (i.e., where cruises originate) and ports-of-call (i.e., where
ships visit). Cruise ship passengers spent an average of $135.36 while at the port of
embarkation (Business Research & Economic Advisors 2008). Those who stayed one or
more nights before or after the voyage spent an average of $284.88, while passengers in
town only for the day of embarkation spent an average of $30.83. Cruise ship passengers
spent an average of $122.73 per port-of-call visit, while crew members spent an average
of $44.68 (Business Research & Economic Advisors 2008).
In recent years, the cruise industry has seen remarkable growth in Portland,
Maine. The city hosted an estimated 47,841 cruise ship passengers in 2008, a 45 percent
increase above the 33,000 passengers who visited in 2003.1 This report examines the
demographic characteristics and economic impact of cruise ship passengers in the
1 Cruise ship passenger figures for 2008 are from the Port of Portland website. Passenger estimates
for 2003 are from Cruise Maine statistics.
1

Portland region.2 The analysis is based on 1,287 completed passenger surveys
distributed in September and October of 2008. The surveys asked questions concerning
the amount of money passengers spent in the Portland region, the activities they pursued
while in port, time constraints they may have faced, plans for return travel to Portland,
and several personal characteristics.
The economic impact analysis presented in this report focuses primarily on the
expenditures that cruise ship passengers made while in port. Although crew members
may also spend substantial amounts of money in the region and cruise lines pay
anchorage fees to the city of Portland, these expenditures are beyond the scope of this
study. Further, it should be noted upfront that the economic impact figures are based on a
total of 47,841 passengers, which is the capacity of the 32 cruise ships that were
scheduled to visit Portland in 2008. Since some of the ships may have arrived at less than
full capacity, the impact figures presented in the report can be interpreted as an upper-
bound estimate of the passenger impact. Spending by ship personnel, however, may
offset the diminished realized impact caused by ship vacancies and/or passengers that
chose not to disembark in Portland.3
When interpreting the study findings, it is also important to note that there are
costs and benefits associated with Portland’s cruise ship industry unrelated to its
economic impact as presented in this report. Beyond the industry’s impact on sales
revenue, income and employment, cruise ships may generate additional costs and
2 The Portland region includes the city of Portland and other towns that passengers may visit while
in port. For example, some passengers visit Kennebunkport or Freeport as part of a cruise-line sponsored tour.
3 Anecdotal evidence, based on our observation of people returning to the ship, suggests that crew members spend substantial amounts of money in the Portland region. Many crew members take a shuttle bus to the Maine Mall where they purchase electronic goods and other products.
2

benefits. Thus, findings presented in this report should be interpreted as a part, but not
the whole, of the evidence in evaluating the effects of Portland’s cruise ship industry.
2. Data Collection
During September and October of 2008, surveys were distributed on seven
different days to 2,484 passengers as they returned to the ship after spending the day in
the Portland region.4 Passengers were surveyed from the Grandeur of the Seas and Jewel
of the Seas, part of the Royal Caribbean International cruise line fleet, and the
Constellation, operated by Celebrity Cruises. We received 1,287 returned surveys, which
translates into an overall response rate of about 52 percent. In Table 1, we show the
number of questionnaires distributed and the return rates for each day that we distributed
surveys.
Table 2 outlines the 2008 cruise season in Portland, which began in July and
continued until early November. The general trend, in all years including 2008, is that
Portland welcomes more ships in the fall months of September and October than during
the summer. The ships included in this study carried, on average, a larger number of
passengers (an average capacity of 2,186 people) than the average cruise ship that docked
in Portland during 2008 (1,495 passengers). The observed differences in passenger
expenditures across the ships included in the study suggest that differences may also exist
between the survey respondents and passengers on ships that were not included in our
study. Thus, the information obtained from survey respondents in our study may not be
representative of all cruise ship passengers who visited Portland in 2008.
4 Surveys were returned to the University of Maine by mail in a pre-addressed, stamped envelope.
3

As shown in table 3, the cruise ships included in the study typically arrived in
Portland during the early morning (between 6:30am and 8:00am) and left port in the early
evening (i.e., at 7:00pm). On September 25, the Constellation departed at 4:30pm, which
was two and one-half hours earlier than the other ships included in the study. As shown
later in the report, the average passenger expenditures on September 25 are substantially
lower than the other days that we distributed surveys.
3. Passenger Demographics and Place of Origin
Tables 4 and 5 show the gender and age distribution of Portland’s cruise ship
passengers. We received surveys from a high percentage of female passengers (69
percent female compared to 31 percent male) and those who are older than the general
population. The average survey respondent is 62 years old and 46 percent of the
passengers are between the ages of 60 and 69. In addition, more than 20 percent of the
passengers are over the age of 70, compared to only two and one-half percent of the
survey respondents who are under the age of 40. The age distribution of Portland cruise
ship passengers may be explained, in part, by the time of year when surveys were
conducted. Surveys were distributed in late September and early October, when fewer
“young families” tend to travel due to the K-12 school schedule.
Tables 6 and 7 summarize the education and income distribution of Portland
cruise ship passengers. These two variables typically exhibit high levels of correlation in
economic studies, given the substantial earnings premium associated with a college
degree (and higher levels of formal education). Over 60 percent of the survey
respondents have at least a 4-year college degree, which suggests that Portland’s cruise
4

ship passengers are quite the educated crowd. It should, then, come as no surprise that
survey respondents reported high levels of household income. Indeed, over 55 percent of
the Portland cruise ship passengers included in the study have annual household incomes
of $75,000 or more.
In tables 8 and 9, we report information related to the survey respondents’ past
experience with cruising, as well as the number of past visits to the Portland area. Most
of the survey respondents are “veteran” cruisers; over 40 percent have taken at least five
other cruises. The voyage that visited Portland represented the respondent’s first such
vacation for only 10 percent of the passengers that completed the survey. Although the
survey respondents had considerable past experience with cruising, very few had spent
substantial time in Portland prior to the cruise ship visit. For over 75 percent of the
respondents, the one-day visit in Portland represented the passenger’s first time to the
area. Less than two and one-half percent of the survey respondents had made five or
more trips to Portland previous to the cruise ship visit.
Tables 10 and 11 show the country and state of origin, respectively, of Portland’s
cruise ship passengers. Although we received surveys from individuals representing nine
different countries, 95 percent of the respondents are from the United States. Looking at
table 11, we see that over 30 percent of the passengers are from the states of Maryland
(15.6 percent), Virginia (7.6 percent) and Pennsylvania (7.1 percent). This is explained,
in part, by the fact that several of the ships included in the study departed from the port of
Baltimore, Maryland. It is also interesting to note that over 20 percent of the survey
respondents hail from the states of California (9.5 percent), Texas (6.8 percent), Missouri
(3.0 percent) and Arizona (2.5 percent), which are located west of the Mississippi River.
5

Maine’s tourism market is heavily dominated by places located within a one-day’s drive;
over 50 percent of overnight trips made by out-of-state visitors come from Massachusetts
(31 percent), New Hampshire (10 percent), New York (8 percent) and Connecticut (7
percent) (Longwoods International 2007). This means that the cruise industry helps
extend Maine’s tourism market beyond its usual borders.
4. Passenger Expenditure Profile
The survey asked passengers about their expenditures in nine categories: food and
beverages, drug and beauty items, apparel items, household items, fine art and jewelry,
transportation, tours (not sponsored by the cruise line), rentals, and other expenditures.
Table 12 presents expenditure information based on all survey respondents, including
individuals that did not spend any money in one or more of the categories. Cruise ship
passengers that we surveyed spent a total of $80.51 while in port, with a large amount of
this money spent on food and beverages ($28.10) and apparel items ($21.18).5 On the
other hand, the average respondent spent very little on drug and beauty items ($2.00) and
rentals ($0.95).
The right-hand side column of Table 12 displays the percentage of survey
respondents that reported expenditures greater than zero in the given category. As shown
at the bottom of the table, 93.7 percent of the survey respondents reported an expenditure
figure greater than zero for at least one of the spending categories. By a wide margin, the
category of “food and beverages” has the largest percentage (77.8 percent) of respondents
that reported expenditures greater than zero. On the other hand, less than ten percent of
5 The average spending figure of $80.51 is slightly lower than the average expenditure of $85.26
reported by Bar Harbor (Maine) cruise ship passengers in 2002 (Gabe et al. 2003).
6

respondents indicated that, while in the Portland region, they spent money on fine art and
jewelry, or rentals.
Table 13 shows average expenditures for each of the days that we distributed
surveys. These averages range from a high of $97.25 on September 21 (Jewel of the
Seas) to a low of $62.77 on September 25 (Constellation). As noted earlier in the report,
the Constellation left port at 4:30pm on September 25th, which was two and one-half
hours earlier than the other days that we distributed surveys. Passengers from the
Constellation spent an average of $81.21, close to the average across all ships, on
October 7 when it left port at 7:00pm.
Adjusting the Expenditure Figures to Include Cruise-line Sponsored Tours
Along with the expenditures that passengers make while in port (see Tables 12
and 13), they also provide an economic impact to the Portland region through their
purchases of cruise-line sponsored tours. A portion of the money that passengers pay to
the cruise lines for organized tours is used to cover the costs of transportation (e.g.,
expenses related to operating the tour bus) and other services provided as part of the
package.
Table 14 summarizes the amount of money that survey respondents paid for
cruise-line sponsored tours. About 57 percent of the survey respondents indicated that
they took a cruise-line sponsored tour while in Portland. Some of the more popular
excursions indicated by tour-goers include visiting the sites of Portland, traveling to
Kennebunkport, and shopping in Freeport. Of the survey respondents that indicated they
took a cruise-line sponsored tour, the average amount paid to the cruise line was $51.28.
7

Applying this amount to all passengers, including those that did not take a cruise-line
sponsored tour, we arrive at an average spending figure of $29.17 on cruise-line
sponsored tours.
As noted above, one of the tour packages offered by the cruise lines is a
“shopping trip” to Freeport, Maine. Freeport is the home of L.L. Bean, as well as a wide
array of outlet stores associated with nationally-known retailers such as the Gap and
Banana Republic. Given its strong emphasis on shopping, it is likely that passengers who
took the Freeport tour spent more money than passengers who took tour-sponsored visits
to other sites or did not take an organized tour at all.
Table 15 summarizes the amount that survey respondents spent in Freeport,
Maine. About five percent of all survey respondents – not just those that took an
organized tour – indicated that they visited Freeport on a cruise-line sponsored tour. Of
those passengers that took a shopping tour, the average respondent spent $146.60 in
Freeport. In some cases, the amount spent in Freeport represented the entire amount the
passenger spent while in port. In other cases, it did not.
We are able to estimate spending in Freeport using a survey question that asks,
“How much of the total amount (spent in port) was spent at local businesses while on
tour?” Information from this question, as well as a different survey question about the
sites visited while on tour, allows us to isolate passenger spending in Freeport. Applying
the average figure of $146.60 spent in Freeport to all passengers (including those that did
not visit Freeport on a cruise-line sponsored tour), we find that the average survey
respondent spent $6.80 in Freeport.
8

Table 16 presents a spending profile of the average cruise ship passenger in
Portland, Maine. The table highlights four average spending figures ranging from a low
of $73.71 to a high of $109.68. The expenditure estimate of $109.68 can be interpreted
as the average amount spent in the Portland region (including Freeport), assuming that
the cruise lines impose a zero percent mark-up on cruise-line sponsored tours. The
expenditure estimate of $73.71 can be interpreted as the average amount spent in the
Portland region (excluding Freeport), assuming that the cruise lines do not pass any of the
tour-related passenger expenditures to tour operators. Both of these cases, related to our
assumptions about the mark-up on cruise-line sponsored tours, are extremely unlikely.
The amount of money that tour operators receive from the cruise lines falls somewhere
between zero and the full amount paid to the cruise line by the passenger.
5. Economic Impact of Cruise Ship Passengers
Cruise ship passengers impact the Portland regional economy both through their
direct expenditures made while in port and the “multiplier effect” that this spending has
on local businesses and workers. Estimates of the total amount of money spent directly
by cruise ship passengers are based on the average expenditures made by the survey
respondents and the number of passengers that visited Portland. As discussed in the
introduction, the analysis uses a total passenger count of 47,841 people, which is the full
capacity of the 32 cruise ships that were scheduled to visit Portland in 2008.
The associated multiplier effects are estimated using an input-output model for
the Portland regional economy. The Portland IMPLAN (input-output) model traces the
circular flows of expenditures and income through the economy with a complex system
9

of accounts that are uniquely tailored to the area. Underlying these accounts is detailed
information regarding transactions occurring between businesses located in the region,
the purchasing patterns of local households, and transactions occurring between the
Portland region and the rest of the world. Some of the data sources used to build the
IMPLAN model include County Business Patterns from the U.S. Census Bureau,
Regional Economic Information System (REIS) data and the input-output accounts from
the U.S. Bureau of Economic Analysis, and the ES-202 statistics from the U.S. Bureau of
Labor Statistics.
Table 17 summarizes the economic impact, including multiplier effects, of cruise
ship passengers in Portland. The top panel of the table is the estimated economic impact
based on a per-passenger expenditure figure of $109.68, which includes spending in
Freeport and the full cost of the cruise-line sponsored tours. The bottom panel of the
table is the economic impact based on a per-passenger expenditure of $80.51, which
includes spending in Freeport but not money paid for cruise-line sponsored tours. Based
on the higher spending figure, we estimate a total economic impact (including multiplier
effects) of $8.0 million in sales revenue, of which an estimated $3.2 million is paid in
wages and salaries to support 96 full- and part-time jobs. Based on the lower passenger
spending figure, we estimate a total economic impact of $5.8 million in sales revenue,
$2.0 million in wages and salaries, and 69 full- and part-time jobs.
Looking at the top panel of Table 17, we find that the ratio of total-to-direct
spending generates a sales multiplier of 1.52. This means that each $1.00 of passenger
spending in the Portland region contributes a total of $1.52 in overall sales revenue. The
$0.52 in multiplier effects per $1.00 spent by cruise ship passengers represents additional
10

spending by businesses (i.e., indirect effect) and workers (i.e., induced effect) that are
impacted by the Portland cruise ship industry. The income and employment multipliers
are 1.38 and 1.35, respectively.
6. Conclusions
This report provides a summary of the demographic characteristics and economic
impact of cruise ship passengers in Portland, Maine. Our analysis is based on a large
sample of cruise ship passenger surveys conducted in the fall of 2008. Portland’s cruise
ship passengers tend to be older, more educated, and earn higher annual incomes than the
general population. They tend to be “veteran” cruisers, having taken several cruises prior
to their trip to Portland; however, very few had spent substantial time in the region prior
to the cruise ship visit. Although passengers surveyed in our study come from nine
countries, 95 percent of the respondents are from the United States. Within the United
States, Portland’s cruise ship passengers come from all regions of the country.
Cruise ship passenger survey results show that the average respondent spends a
combined total of $109.68 on cruise-line sponsored tours, and goods and services while
in port. Excluding the money paid to cruise lines for organized tours, we find that the
typical passenger spends $80.51 in the Portland region. The results from an economic
impact model show that cruise ship passengers generate an estimated impact, including
multiplier effects, of between $5.8 million and $8.0 million in sales revenue, and support
between 69 and 96 full- and part-time jobs.
11

References:
Business Research & Economic Advisors, “The Contribution of the North America Cruise Industry to the U.S. Economy in 2007.” Report prepared for the Cruise Lines International Association, 2008.
Gabe, Todd, Colleen Lynch, James McConnon and Thomas Allen, “Economic Impact of
Cruise Ship Passengers in Bar Harbor, Maine.” Department of Resource Economics and Policy, University of Maine, Staff Paper 518, March 2003.
Longwoods International, “Travel and Tourism in Maine: The 2006 Visitor Study.”
Report prepared for the Maine Office of Tourism, June 2007.
12
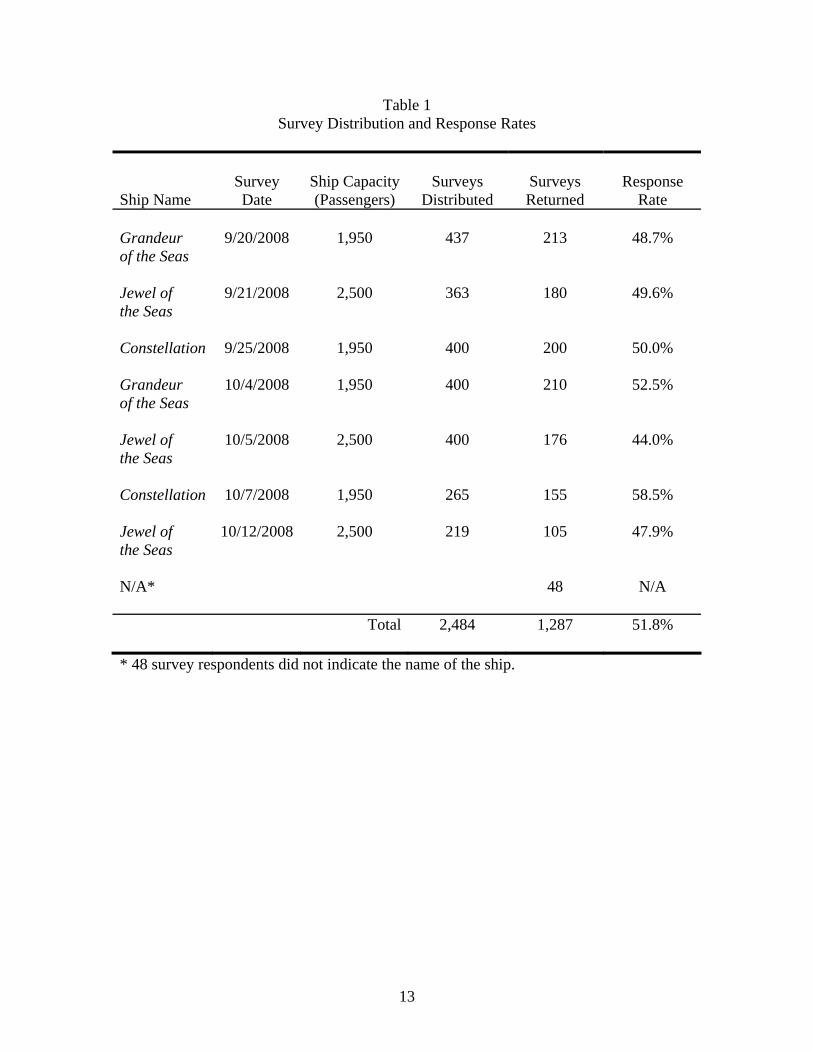
Table 1 Survey Distribution and Response Rates
Survey Ship Capacity Surveys Surveys Response Ship Name Date (Passengers) Distributed Returned Rate Grandeur 9/20/2008 1,950 437 213 48.7% of the Seas Jewel of 9/21/2008 2,500 363 180 49.6% the Seas Constellation 9/25/2008 1,950 400 200 50.0% Grandeur 10/4/2008 1,950 400 210 52.5% of the Seas Jewel of 10/5/2008 2,500 400 176 44.0% the Seas Constellation 10/7/2008 1,950 265 155 58.5% Jewel of 10/12/2008 2,500 219 105 47.9% the Seas N/A* 48 N/A
Total 2,484 1,287 51.8% * 48 survey respondents did not indicate the name of the ship.
13

Table 2 Cruise Ships Visiting Portland, Maine in 2008
Number Total Passengers Month of Ships* Passengers* Crew** and Crew*,** July 6 5,413 999 6,412 August 6 6,571 2,184 8,755 September 10 21,025 9,018 30,043 October 9 14,122 8,451 22,573 November 1 710 373 1,083
Total 32 47,841 21,025 68,866 * Cruise ship schedule and passenger capacity figures are from Port of Portland website. ** Crew figures are from the CruiseMaine website. Information on the number of crew was not available for all ships.
14

Table 3 Scheduled Arrival and Departure Times for Ships Included in the Study
Survey Scheduled Scheduled Total Time Ship Name Date Arrival Time* Departure Time* in Port Grandeur 9/20/2008 8:00am 7:00pm 11 hours of the Seas Jewel of 9/21/2008 7:00am 7:00pm 12 hours the Seas Constellation 9/25/2008 6:30am 4:30pm 10 hours Grandeur 10/4/2008 8:00am 7:00pm 11 hours of the Seas Jewel of 10/5/2008 7:00am 7:00pm 12 hours the Seas Constellation 10/7/2008 7:00am 7:00pm 12 hours Jewel of 10/12/2008 7:00am 7:00pm 12 hours the Seas * Scheduled arrival and departure times are from Port of Portland website.
15

Table 4
Gender Profile of Survey Respondents Number of Percentage of Gender Respondents Respondents Female 818 68.6% Male 375 31.4%
Total 1,193 100.0%
16

Table 5 Age Profile of Survey Respondents
Number of Percentage of Age Respondents Respondents Less than 30 10 0.8% 30 to 39 21 1.8% 40 to 49 79 6.7% 50 to 59 274 23.1% 60 to 69 539 45.5% 70 to 79 222 18.7% 80 to 89 39 3.3% 90 or older 1 0.1%
Total 1,185 100.0%
Average Age 62 years old
17

Table 6 Education Profile of Survey Respondents
Number of Percentage of Highest Level of Formal Education Respondents Respondents Less than High School Degree 4 0.3% High School Degree (or Equivalent) 293 23.8% 2-Year College Degree 189 15.4% 4-Year College Degree 380 30.9% MA/MS Degree 250 20.3% Ph.D./Professional Degree 113 9.2%
Total 1,229 100.0%
18

Table 7 Income Profile of Survey Respondents
Number of Percentage of Annual Household Income Respondents Respondents Less than $25,000 24 2.1% $25,000 to $49,999 173 15.5% $50,000 to $74,999 278 24.9% $75,000 to $99,999 201 18.0% $100,000 to $149,999 254 22.7% $150,000 or more 188 16.8%
Total 1,118 100.0%
19

Table 8 Past Experience with Cruising
Number of Percentage of Cruise Experience Respondents Respondents First Cruise 126 10.0% 1 to 4 Other Cruises 599 47.6% 5 to 9 Other Cruises 323 25.7% 10 to 20 Other Cruises 143 11.4% Over 20 Other Cruises 67 5.3%
Total 1,258 100.0%
20

Table 9 Past Visits to Portland
Number of Percentage of Past Visits to Portland Respondents Respondents First Visit 858 75.5% 1 to 4 Past Visits 255 22.4% 5 to 9 Past Visits 14 1.2% 10 to 20 Past Visits 6 0.5% Over 20 Past Visits 4 0.4%
Total 1,137 100.0%
21

Table 10 Country of Origin
Number of Percentage of Country Respondents Respondents United States 1,186 95.0% United Kingdom 36 2.9% Canada 16 1.3% Germany 4 0.3% Australia 2 0.2% Mexico 2 0.2% Argentina 1 0.1% France 1 0.1% Japan 1 0.1% 1,249 100.0%
22

Table 11 U.S. Place of Origin
Number of Percentage of State Respondents Respondents Maryland 184 15.6% California 112 9.5% Virginia 90 7.6% Pennsylvania 84 7.1% Texas 80 6.8% Florida 63 5.4% New York 51 4.3% Illinois 48 4.1% Ohio 37 3.1% Missouri 35 3.0% Tennessee 35 3.0% New Jersey 31 2.6% Arizona 29 2.5% Georgia 24 2.0% Massachusetts 24 2.0% Michigan 23 2.0% North Carolina 20 1.7% Louisiana 19 1.6% Connecticut 17 1.4% Kansas 17 1.4% Colorado 15 1.3% South Carolina 14 1.2% Indiana 11 0.9% Minnesota 10 0.8% Nevada 10 0.8% Arkansas 9 0.8% Wisconsin 9 0.8% Alabama 8 0.7% Oklahoma 8 0.7% Kentucky 7 0.6% West Virginia 7 0.6% Iowa 6 0.5% Oregon 6 0.5% Delaware 5 0.4% New Hampshire 5 0.4% New Mexico 5 0.4% Table is continued on the following page.
23

Table 11 U.S. Place of Origin, continued
Number of Percentage of State Respondents Respondents Washington 5 0.4% Utah 4 0.3% Montana 3 0.3% Puerto Rico 2 0.2% Alaska 1 0.1% Hawaii 1 0.1% Idaho 1 0.1% Mississippi 1 0.1% Rhode Island 1 0.1%
Total 1,177 100.0%
24

Table 12 Average Expenditures of Survey Respondents, by Spending Category,
Excluding Cruise-Line Sponsored Tours Percentage of Respondents Expenditure Category Average Expenditure that Reported Expenditures Food and beverages $28.10 77.8% Drug and beauty items $2.00 14.2% Apparel items $21.18 33.1% Household items $4.97 12.9% Fine art and jewelry $6.15 9.4% Transportation $4.72 16.4% Tours (not sponsored $6.02 18.6% by cruise line) Rentals $0.95 1.0% Other $6.42 27.4% Total $80.51 93.7%
25

Table 13 Average Expenditures of Survey Respondents,
Excluding Cruise-Line Sponsored Tours Number of Average Ship Name Survey Date Survey Respondents* Expenditures Grandeur 9/20/2008 201 $74.09 of the Seas Jewel of 9/21/2008 173 $97.25 the Seas Constellation 9/25/2008 190 $62.77 Grandeur 10/4/2008 204 $82.68 of the Seas Jewel of 10/5/2008 168 $91.51 the Seas Constellation 10/7/2008 153 $81.21 Jewel of 10/12/2008 100 $80.52 the Seas N/A 40 $64.53 Total 1,229 $80.51 * The number of survey respondents differs from Table 1 because some survey respondents did not provide information about expenditures in port.
26

Table 14 Participation Rates and Average Costs of Cruise-Line Sponsored Tours
Yes No Cruise-Line Sponsored Tour 715 542 56.9% 43.1% Tour-Goers All Passengers Average Cost of Tour $51.28 $29.17 (Paid to Cruise Line)
27
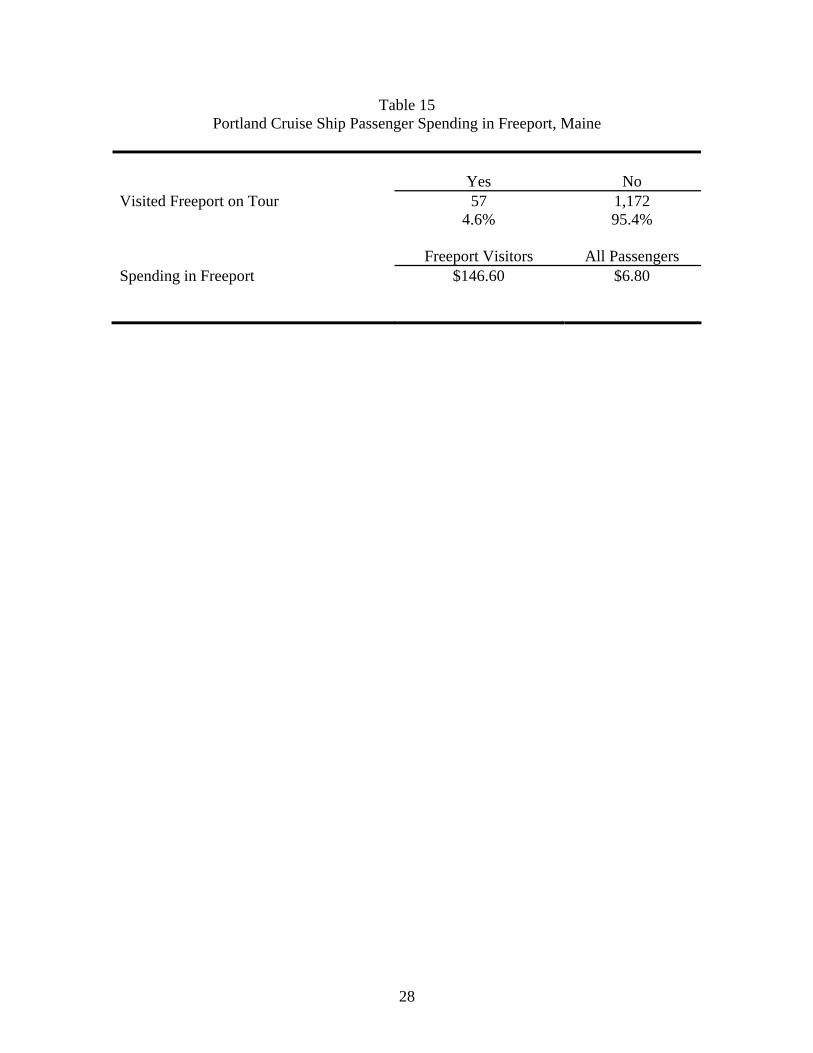
Table 15 Portland Cruise Ship Passenger Spending in Freeport, Maine
Yes No Visited Freeport on Tour 57 1,172 4.6% 95.4% Freeport Visitors All Passengers Spending in Freeport $146.60 $6.80
28

Table 16 Portland Cruise Ship Passenger Spending Profile
Expenditure Category Average Expenditure Food and beverages $28.10 Drug and beauty items $2.00 Apparel items $21.18 Household items $4.97 Fine art and jewelry $6.15 Transportation $4.72 Tours (not sponsored by cruise line) $6.02 Rental equipment $0.95 Other $6.42
Subtotal $80.51 Tours (cruise-line sponsored) $29.17 Total Spending $109.68 Spending in Freeport $6.80 Total Spending (less money spent in Freeport) $102.88 Total Spending (less money spent in Freeport $73.71 and spending on cruise-line sponsored tours)
29
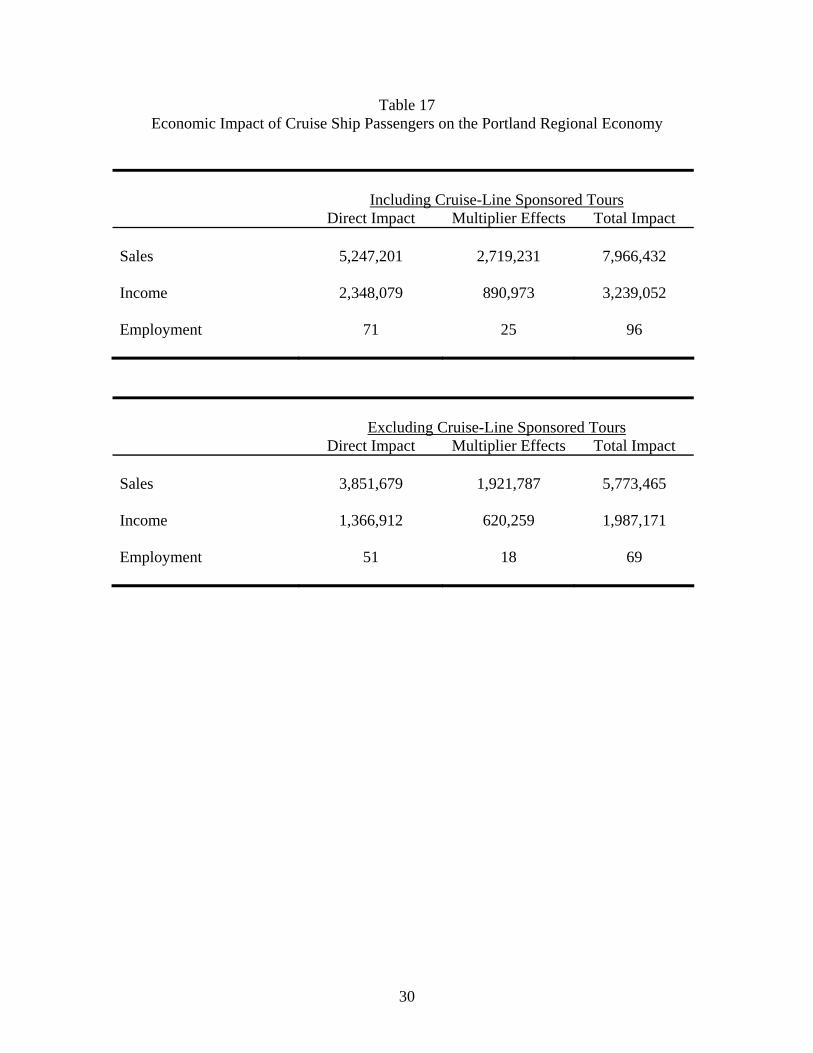
Table 17 Economic Impact of Cruise Ship Passengers on the Portland Regional Economy
Including Cruise-Line Sponsored Tours Direct Impact Multiplier Effects Total Impact Sales 5,247,201 2,719,231 7,966,432 Income 2,348,079 890,973 3,239,052 Employment 71 25 96 Excluding Cruise-Line Sponsored Tours Direct Impact Multiplier Effects Total Impact Sales 3,851,679 1,921,787 5,773,465 Income 1,366,912 620,259 1,987,171 Employment 51 18 69
30