economic impact of extending the section 1603 … this study analyzes the economic impact of...
TRANSCRIPT

Economic Impact of Extending the
Section 1603 Treasury Program
EuPD Research – Exclusive Research Services October 12, 2011 Prepared for the Solar Energy Industries Association® (SEIA ®)

2
Executive Summary
A. U.S. Solar Electric
B. Photovoltaics
C. Concentrating Solar Power
Appendix
About EuPD Research
Table of Contents

3
This study analyzes the economic impact of extending the Section 1603 Treasury Program (TGP). It finds that
extending the program would yield thousands of additional jobs and that longer extensions would result in even
greater employment gains. EuPD examined the impact of extending the TGP for one, two and five years on
additional employment and installed capacity for the years 2011-2016.
The 1603 Treasury Program was created to address the shortage of tax equity available to renewable energy
projects due to the collapse of the financial markets. The TGP allows developers to receive a cash grant in lieu of
the Section 48 Investment Tax Credit (ITC). The TGP has supported more than a thousand solar projects
representing over $3 billion in total investment, contributing to a nearly two-fold increase in solar electric capacity in
2010.
Introduction

4
Executive Summary

5
Executive Summary
A. U.S. Solar Electric | B. Photovoltaics | C. Concentrating Solar Power
The U.S. solar market has experienced rapid growth in the last few years and is poised to continue growing
over the next five years according to our baseline forecast. However, extending the TGP would significantly
accelerate this growth, increasing investment, employment and deployment across the U.S. While an extension
would benefit all sectors of the solar industry, utility-scale solar development would see some of the longest
lasting impacts due to the long project development process.
Extension of the 1603 Treasury Program
A one-year extension of the 1603 Treasury Program through 2012 would have the greatest impact on economic
activity in 2012 and 2013, as well as enable growth through 2016 as projects complete construction and come
online.
An additional 37,000 jobs would be supported by the solar energy industry in 2012, a 12% increase over
baseline.
The additional cumulative capacity installed through 2016 would be 2,000 megawatts over baseline, enough
to power 400,000 homes.

6
Executive Summary (cont.)
Two-Year Extension
A two-year extension of the TGP commence construction deadline through 2013, would yield 51,000 additional jobs
in the solar energy industry in 2013, a 16% increase over baseline, and would result in 3,650 megawatts of
cumulative additional capacity installed through 2016.
Five-Year Extension
A. U.S. Solar Electric | B. Photovoltaics | C. Concentrating Solar Power
A five-year extension of the TGP to coincide with the term of the investment tax credit would support an
additional 114,000 jobs in the solar energy industry in 2015, a 32% increase over baseline, and would result in
7,450 megawatts of cumulative additional capacity installed through 2016. A predictable five year policy
framework will generate an environment that fosters industry growth larger than the potential year-to-year
extensions and would create sustained momentum for the industry.

7
Additional Employment by Extension Scenario
Additional Employment Supported by the U.S. Solar Energy Industry in 2012, 2013 and 2016
Note:
Employment is calculated in job-years for calendar year 2016. Direct employment includes solar workers in installation of PV systems, construction of CSP and PV
power plants, manufacturing of PV modules and components and key CSP components. Indirect employment includes employment at suppliers to the solar
industry. Induced employment is the result of the broader economic activity created by the solar industry.
The baseline U.S. solar employment
forecast calls for significant growth.
However, if the program is extended
by 1 year, total employment will
exceed the baseline forecast by
over 37,000 in 2012. Of that, over
18,000 will be directly employed by
solar companies or employed
indirectly by firms that support the
solar industry. An additional 19,000
jobs will be induced by the
industry’s economic activity.
If the program is extended by 2
years, total employment will grow an
additional 51,000 in 2013.
A 5-year extension will push the U.S.
employment supported by the solar
energy industry to almost 114,000
over baseline including 55,000
direct & indirect solar workers.
A. U.S. Solar Electric | B. Photovoltaics | C. Concentrating Solar Power
18,33924,812
55,26819,055
25,826
58,669
-
20,000
40,000
60,000
80,000
100,000
120,000
1 year ext . (2012) 2 year ext . (2013) 5 year ext . (2016)
Tota l d irect & indirect employment Tota l induced employment
Em
plo
ym
en
t o
ve
r B
ase
lin
e
Source : EuPD Research 2011
37,394
50,639
113,937
8
2012 2013 2014 2015 2016
1 year ext. 37,394 17,015 10,171 14,464 17,364
2 years ext. 47,505 50,639 22,588 20,454 24,293
5 years ext. 54,373 71,973 89,516 113,924 113,937
0
20,000
40,000
60,000
80,000
100,000
120,000
Em
plo
ym
en
t
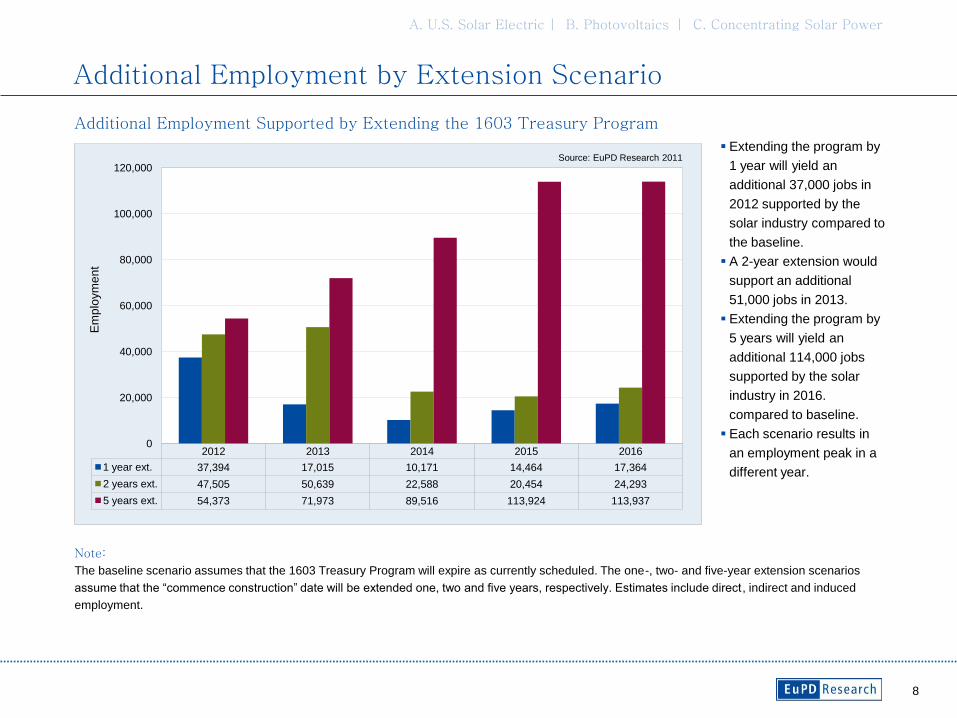
Additional Employment by Extension Scenario
Additional Employment Supported by Extending the 1603 Treasury Program
Note:
The baseline scenario assumes that the 1603 Treasury Program will expire as currently scheduled. The one-, two- and five-year extension scenarios
assume that the ―commence construction‖ date will be extended one, two and five years, respectively. Estimates include direct, indirect and induced
employment.
Extending the program by
1 year will yield an
additional 37,000 jobs in
2012 supported by the
solar industry compared to
the baseline.
A 2-year extension would
support an additional
51,000 jobs in 2013.
Extending the program by
5 years will yield an
additional 114,000 jobs
supported by the solar
industry in 2016.
compared to baseline.
Each scenario results in
an employment peak in a
different year.
A. U.S. Solar Electric | B. Photovoltaics | C. Concentrating Solar Power
Source: EuPD Research 2011

9
Additional Installations of CSP and PV Systems in the U.S. above the Baseline Forecast
Note:
The baseline scenario assumes that the 1603 Treasury Program will expire as currently scheduled. The one-, two- and five-year extension scenarios
assume that the program’s ―commence construction‖ date will be extended one, two and five years, respectively.
Additional Installations by Extension Scenario
Extending the program by 1
year would result in an
additional 276 MW installed in
2016 and 1,979 MW of
cumulative additional
installations from 2012-2016.
Extending the program by 2
years would drive additional
installations of 525 MW in
2016 and 3,614 MW of
cumulative additional
installations from 2012-2016.
Compared to the baseline
scenario, extending the
program by 5 years will
support an additional 1,974
MW in installations in 2016
and 7,334 MW of cumulative
additional installations from
2012-2016.
A. U.S. Solar Electric | B. Photovoltaics | C. Concentrating Solar Power
0
500
1,000
1,500
2,000
2,500
2012 2013 2014 2015 2016
Source : EuPD Research 2010
Inst
all
ati
on
(M
W)
Tota l 2012-2016
1 year ext . 498 754 222 229 276 1,979
2 years ext . 500 1,266 933 390 525 3,614
5 years ext . 565 1,394 1,483 1,926 1,974 7,334

10
A. U.S. Solar Electric

11
Executive Summary
A. U.S. Solar Electric
1. U.S. Employment by State
2. U.S. Installation by State
B. Photovoltaic
C. Concentrating Solar Power
Appendix
About EuPD Research
Contents

12
A.1.2.
Employment Supported in 2012 by a 1- Year Program Extension
Note:
The map shows the 2012 U.S. employment level associated with the solar electric (Photovoltaic & Concentrating Solar Power) power industry, including
direct, indirect and induced jobs. This scenario evaluates a 1-year extension of the 1603 Treasury Program.
Extending the program for
one year will spur
additional employment
growth in all states
analyzed.
States that deploy CSP
plants or build CSP
components, like Arizona
and Texas, will benefit the
most.
Arizona, California, New
Mexico and North
Carolina show the
greatest percentage gain
over baseline.
The major growth in
Texas is driven by the
state’s manufacturing
base.
A. U.S. Solar Electric | B. Photovoltaics | C. Concentrating Solar Power
HI: 2,076
CT: 2,371
NJ: 11,132
MA: 9,863
TN
2,261
NC
3,818
FL
3,698
MI
28,224
OH
15,684
NY
6,120
PA
8,038
CO
7,443
NM
16,920
TX
32,158
OR
18,312
WA
8,088
NV
9,758
AZ
22,811
CA
98,102
Gains over
Baseline:
> 20 %
0 – 10 %
10 – 20 %
Increased Employment Supported by the U.S. Solar Energy Industry by State

13
A.1.3.
Employment Supported in 2013 by a 2- Year Program Extension
Note:
The map shows the 2013 U.S. employment level associated with the solar electric (Photovoltaic & Concentrating Solar Power) power industry, including
direct, indirect and induced jobs. This scenario evaluates a 2-year extension of the 1603 Treasury Program.
A two-year extension
would spur further
employment growth in all
states.
In this scenario California
would support over
106,000 solar jobs in
2013.
The solar industry in
Texas would support over
33,000 jobs in 2013.
A. U.S. Solar Electric | B. Photovoltaics | C. Concentrating Solar Power
HI: 2,026
CT: 3,148
NJ: 12,412
MA: 11,196
TN
2,581
NC
3,698
FL
4,531
MI
28,326
OH
18,976
NY
6,912
PA
8,586
CO
7,407
NM
16,153
TX
33,023
OR
20,883
WA
8,104
NV
11,584
AZ
26,249
CA
106,556
Gains over
Baseline:
> 20 %
0 – 10 %
10 – 20 %
Increased Employment Supported by the U.S. Solar Energy Industry by State

14
Increased Employment Supported by the U.S. Solar Energy Industry by State
A.1.4.
Employment Supported in 2016 by a 5- Year Program Extension
Note:
The map shows the 2016 U.S. employment level associated with the solar electric (Photovoltaic & Concentrating Solar Power) power industry, including
direct, indirect and induced jobs. This scenario evaluates a 5-year extension of the 1603 Treasury Program.
All 19 states shown
except for Hawaii show
more than 10% solar job
growth over the baseline
scenario.
Arizona shows a
tremendous level of job
creation in 2016 under this
scenario – surpassing
67,000 jobs.
Arizona, Texas and New
Mexico show the greatest
percentage gain over
baseline.
9 out of 19 analyzed
states will generate over
10,000 solar-related jobs
in 2016, with three others
close to that mark.
A. U.S. Solar Electric | B. Photovoltaics | C. Concentrating Solar Power
HI: 1,916
CT: 7,917
NJ: 17,645
MA: 13,711
TN:3,402
NC
3,191
FL
7,475
MI
66,396
OH
70,238
NY
7,291
PA
9,933
CO
8,971
NM
12,385
TX
56,767
OR
27,880
WA
9,211
NV
5,442
AZ
67,266
CA
111,252
Gains over
Baseline:
> 20 %
0 – 10 %
10 – 20 %

15
Solar Electric Installations by State
A.2.1.
Baseline Installation Forecast 2011-2016 (MW)
Note:
The map shows the cumulative 2011-2016 installed solar electric (Photovoltaic & Concentrating Solar Power) power capacity in peak megawatts (MW).
This assumes that the Section 1603 Treasury Program will expire as currently scheduled.
California will remain the
leading state in terms of
solar installations – adding
a cumulative 16,000 MW
between 2011 and 2016,
just over a third of the
national total.
Driven by its strong CSP
sector, Arizona will
approach 4,800 MW in
new installations between
2011 and 2016.
New Jersey, Nevada and
Texas also show
significant growth in solar
deployment over the next
five years.
A. U.S. Solar Electric | B. Photovoltaics | C. Concentrating Solar Power
HI: 534
CT: 1,089
NJ: 3,316
MA: 1,032
TN:157
NC
362
FL
1,131
MI
200
OH
590
NY
1,347
PA
1,478
CO
1,066
NM
811
TX
2,044
OR
989
WA
225
NV
2,241
AZ
4,795
CA
16,329
over 10 %
up to 5 %
5 – 10 %
US Share:

16
Increased Solar Electric Installations by State
A.2.2.
Installation Forecast with a 1-Year Program Extension (Cumulative megawatts added 2011-2016)
Note:
The map shows the cumulative 2011-2016 installed solar electric (Photovoltaic & Concentrating Solar Power) power capacity in peak megawatts (MW).
This scenario assumes that the 1603 Treasury Program will be extended for one year through 2012.
All states analyzed show
increased solar
deployment under a 1-
year extension.
The increases are most
significant for the
southwestern states that
have a strong CSP
component in their
installation mix, including
Arizona and California.
A. Total Solar Electric | B. Photovoltaics | C. Concentrating Solar Power
HI: 552
CT: 1,118
NJ: 3,419
MA: 1,063
TN: 161
NC
373
FL
1,164
MI
206
OH
605
NY
1,389
PA
1,524
CO
1,127
NM
841
TX
2,104
OR
1,015
WA
231
NV
2,336
AZ
5,104
CA
17,336
Gains over
Baseline:
> 20 %
0 – 10 %
10 – 20 %

17
Increased Solar Electric Installations by State
A.2.3.
Installation Forecast with a 2-Year Program Extension (Cumulative megawatts added 2011-2016)
Note:
The map shows the cumulative 2011-2016 installed solar electric (Photovoltaic & Concentrating Solar Power) power capacity in peak megawatts (MW).
This scenario assumes that the 1603 Treasury Program will be extended for two years through 2013.
Compared to the baseline
scenario, all 19 states
analyzed show 5-11%
growth in cumulative solar
electric power installed.
Arizona and California
show the strongest
growth, in large part
driven by newly installed
CSP systems.
Nevada and Colorado
also show growth of 7-
8% driven by the CSP
sector.
A. U.S. Solar Electric | B. Photovoltaics | C. Concentrating Solar Power
HI: 567
CT: 1,147
NJ: 3,510
MA: 1,091
TN: 165
NC
383
FL
1,194
MI
211
OH
621
NY
1,427
PA
1,565
CO
1,155
NM
861
TX
2,161
OR
1,041
WA
237
NV
2,438
AZ
5,339
CA
18,136
Gains over
Baseline:
> 20 %
0 – 10 %
10 – 20 %
18
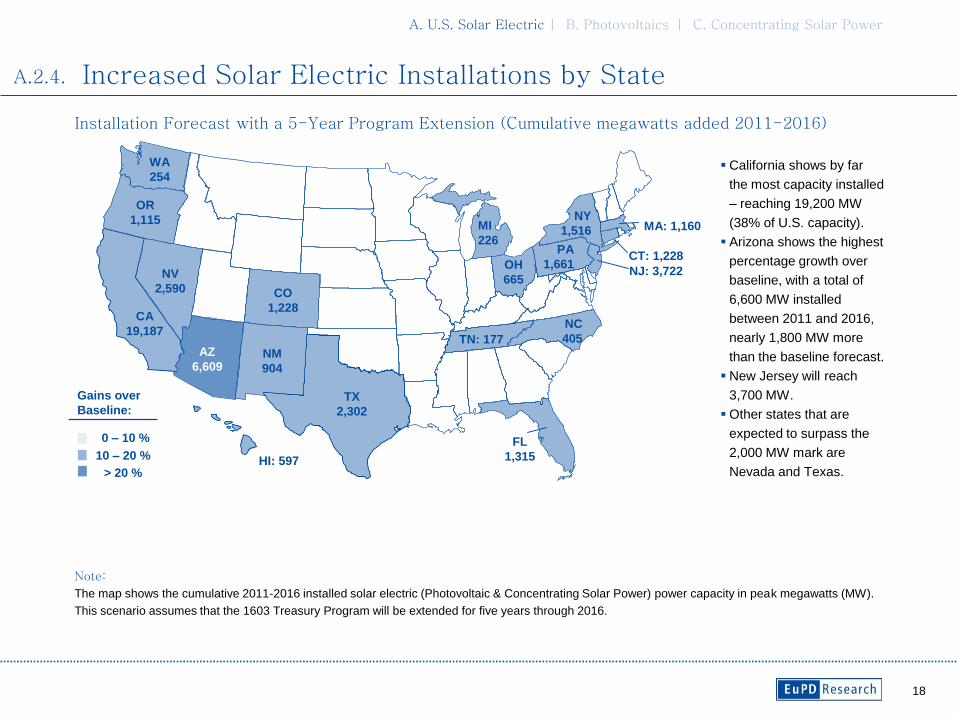
Increased Solar Electric Installations by State
A.2.4.
Installation Forecast with a 5-Year Program Extension (Cumulative megawatts added 2011-2016)
Note:
The map shows the cumulative 2011-2016 installed solar electric (Photovoltaic & Concentrating Solar Power) power capacity in peak megawatts (MW).
This scenario assumes that the 1603 Treasury Program will be extended for five years through 2016.
California shows by far
the most capacity installed
– reaching 19,200 MW
(38% of U.S. capacity).
Arizona shows the highest
percentage growth over
baseline, with a total of
6,600 MW installed
between 2011 and 2016,
nearly 1,800 MW more
than the baseline forecast.
New Jersey will reach
3,700 MW.
Other states that are
expected to surpass the
2,000 MW mark are
Nevada and Texas.
A. U.S. Solar Electric | B. Photovoltaics | C. Concentrating Solar Power
HI: 597
CT: 1,228
NJ: 3,722
MA: 1,160
NC
405
FL
1,315
MI
226
OH
665
NY
1,516
PA
1,661
CO
1,228
NM
904
TX
2,302
OR
1,115
WA
254
NV
2,590
AZ
6,609
CA
19,187
Gains over
Baseline:
TN: 177
> 20 %
0 – 10 %
10 – 20 %

19
B. Photovoltaics

20
Agenda/Outline
Executive Summary
A. U.S. Solar Electric
B. Photovoltaics
1. Employment Supported by PV Sector vs. Baseline Forecast (through 2016)
2. Photovoltaic Installations vs. Baseline Forecast (through 2016)
C. Concentrating Solar Power
Appendix
About EuPD Research
Contents

21
Additional U.S. Employment Supported by the PV Sector vs. Baseline Forecast
Note:
The employment estimates for all scenarios includes all direct, indirect and induced jobs.
2012 2013 2014 2015 2016
1 year ext. 16,491 4,429 4,992 6,317 8,119
2 years ext. 16,491 22,145 8,708 11,116 14,448
5 years ext. 17,816 22,980 25,402 31,901 40,290
0
5,000
10,000
15,000
20,000
25,000
30,000
35,000
40,000
45,000
Em
plo
ym
en
t
Employment Supported by the PV Sector vs. Baseline Forecast
B.1.
This graph shows
estimates for PV only.
The 1-year extension has
the greatest impact in
2012, yielding more than
16,000 additional jobs.
A 2-year extension results
in an additional 22,000
jobs in 2013.
Extending the program by
5 years will have the
strongest positive impact
on employment in the
U.S., with an additional
40,000 jobs supported in
2016.
A. U.S. Solar Electric | B. Photovoltaics | C. Concentrating Solar Power
Source: EuPD Research 2011

22
Additional U.S. PV Installations vs. Baseline Forecast
Photovoltaic Installations vs. Baseline Forecast
B.2.
This slide shows estimates for
PV only.
Cumulatively (2012-2016), a 1-
year extension would result in
1,012 MW of additional
installations, the 2-year
extension would yield over
1,995 MW of additional
installations, and the 5-year
extension would deploy over
4,193 MW of additional PV
capacity.
A. U.S. Solar Electric | B. Photovoltaics | C. Concentrating Solar Power
0
200
400
600
800
1,000
1,200
1,400
2012 2013 2014 2015 2016
Source : EuPD Research 2010
Inst
all
ati
oin
[M
W]
Tota l 2012-2016
1 year ext . 370 122 137 170 215 1,012
2 years ext . 370 610 267 331 418 1,995
5 years ext . 433 714 800 992 1,255 4,193

23
C. Concentrating Solar Power

24
Agenda/Outline
Executive Summary
A. U.S. Solar Electric
B. Photovoltaics
C. Concentrating Solar Power
1. Employment Supported by the CSP Sector vs. Baseline Forecast (through 2016)
2. Increased CSP Installations vs. Baseline Forecast (through 2016)
Appendix
About EuPD Research
Contents

25
Additional U.S. Employment Supported by the CSP Sector vs. Baseline Forecast
Note:
The employment estimates for all scenarios includes all direct, indirect and induced jobs.
2012 2013 2014 2015 2016
1 year ext. 20,903 12,586 5,180 8,148 9,245
2 years ext. 31,015 28,494 13,880 9,337 9,845
5 years ext. 36,558 48,993 64,114 82,023 73,647
0
10,000
20,000
30,000
40,000
50,000
60,000
70,000
80,000
90,000
Em
plo
ym
en
t
Employment Supported by the CSP Sector vs. Baseline Forecast
C.1.
This slide shows
concentrating solar
power (CSP) only.
A 1-year extension
yields an additional
21,000 jobs and a 2-
year extension would
add 31,000 jobs in
2012.
The 5-year extension
would have the
strongest positive
impact on CSP-related
employment in the U.S.
Under this scenario, an
additional 82,000 CSP
jobs will be supported
in 2015.
A. U.S. Solar Electric | B. Photovoltaics | C. Concentrating Solar Power
Source: EuPD Research 2011 Source: EuPD Research 2011
26
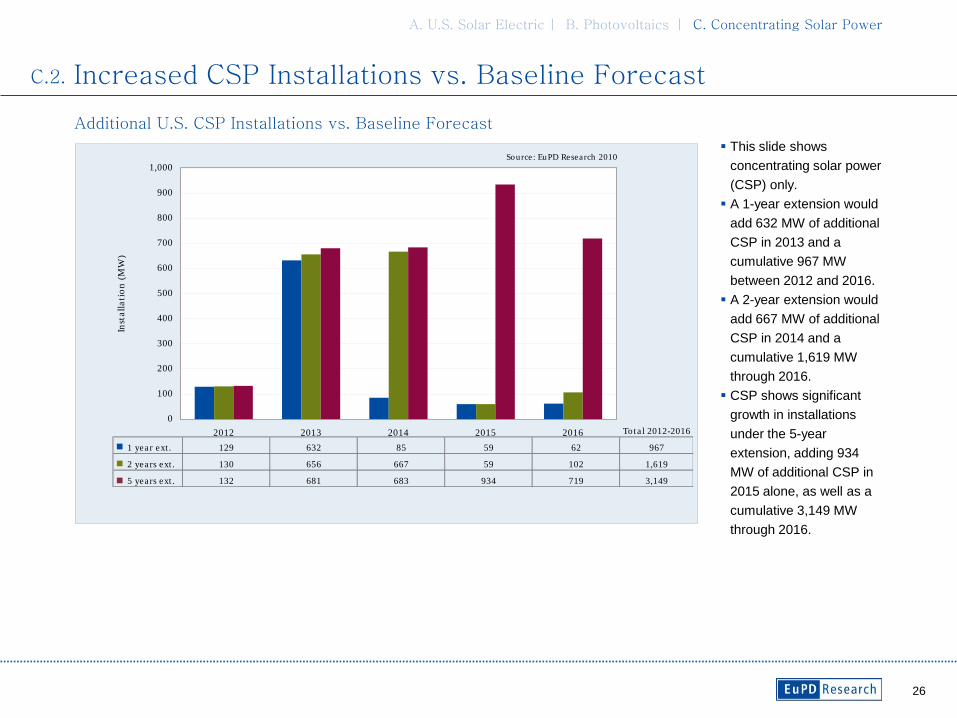
Additional U.S. CSP Installations vs. Baseline Forecast
Increased CSP Installations vs. Baseline Forecast
C.2.
This slide shows
concentrating solar power
(CSP) only.
A 1-year extension would
add 632 MW of additional
CSP in 2013 and a
cumulative 967 MW
between 2012 and 2016.
A 2-year extension would
add 667 MW of additional
CSP in 2014 and a
cumulative 1,619 MW
through 2016.
CSP shows significant
growth in installations
under the 5-year
extension, adding 934
MW of additional CSP in
2015 alone, as well as a
cumulative 3,149 MW
through 2016.
A. U.S. Solar Electric | B. Photovoltaics | C. Concentrating Solar Power
0
100
200
300
400
500
600
700
800
900
1,000
2012 2013 2014 2015 2016
Source : EuPD Research 2010
Inst
all
ati
on
(M
W)
Tota l 2012-2016
1 year ext . 129 632 85 59 62 967
2 years ext . 130 656 667 59 102 1,619
5 years ext . 132 681 683 934 719 3,149

27
Appendix 1

28
Executive Summary
A. U.S. Solar Electric
B. Photovoltaics
C. Concentrating Solar Power
Appendix 1
Additional Research Results
About EuPD Research
Contents

29
2012 2013 2014 2015 2016
Baseline 301,220 313,130 298,358 351,954 432,061
1 year ext. 338,614 330,145 308,529 366,418 449,425
2 years ext. 348,725 363,768 320,946 372,408 456,354
5 years ext. 355,593 385,103 387,874 465,878 545,998
0
100,000
200,000
300,000
400,000
500,000
600,000
700,000
Em
plo
ym
en
t
Total Employment by Scenario
U.S. Jobs in the Solar and Supporting Industries
Note:
The baseline scenario assumes that the 1603 Treasury Program will expire as currently scheduled. The one-, two- and five-year extensions assume that
the ―commence construction‖ date will be extended one, two and five years, respectively.
A. U.S. Solar Electric | B. Photovoltaics | C. Concentrating Solar Power
Source: EuPD Research 2011
30
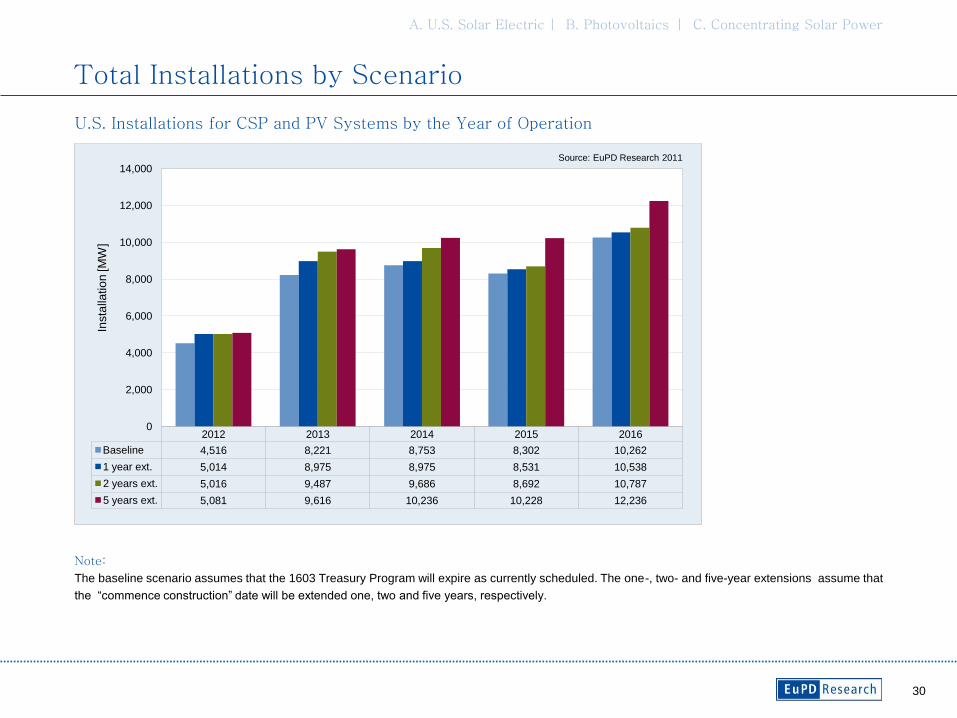
U.S. Installations for CSP and PV Systems by the Year of Operation
Note:
The baseline scenario assumes that the 1603 Treasury Program will expire as currently scheduled. The one-, two- and five-year extensions assume that
the ―commence construction‖ date will be extended one, two and five years, respectively.
2012 2013 2014 2015 2016
Baseline 4,516 8,221 8,753 8,302 10,262
1 year ext. 5,014 8,975 8,975 8,531 10,538
2 years ext. 5,016 9,487 9,686 8,692 10,787
5 years ext. 5,081 9,616 10,236 10,228 12,236
0
2,000
4,000
6,000
8,000
10,000
12,000
14,000
Insta
llatio
n [M
W]
Total Installations by Scenario
A. U.S. Solar Electric | B. Photovoltaics | C. Concentrating Solar Power
Source: EuPD Research 2011

31
Employment Supported by the U.S. Solar Energy Industry by State
Baseline Employment Forecast 2016
Note:
The map shows the 2016 U.S. employment level associated with the solar electric (Photovoltaic & Concentrating Solar Power) power industry. Included
are direct, indirect and induced jobs in 2016.
While California is
expected to host more
solar jobs than any other
state, it will account for
less than one quarter of
the national total with
93,000 jobs supported by
the solar industry in the
state in 2016.
Other major solar
employment hubs include
Ohio, Michigan, Arizona
and Texas —benefiting
from more than 35,000
jobs each.
Due to its strong
manufacturing base, the
solar industry in Ohio will
support over 61,000 jobs
in 2016.
A. U.S. Solar Electric | B. Photovoltaics | C. Concentrating Solar Power
up to 5 %
HI: 1,766
CT: 7,078
NJ: 15,827
MA: 12,028
TN:2,706NC: 2,211
FL
6,305
MI
55,133
OH
61,589
NY
6,107
PA
8,421
CO
7,667
NM
8,304
TX
36,464
OR
24,707
WA
7,942
NV
4,271
AZ
41,648
CA
93,306
over 10 %
5 – 10 %
US Share:
32
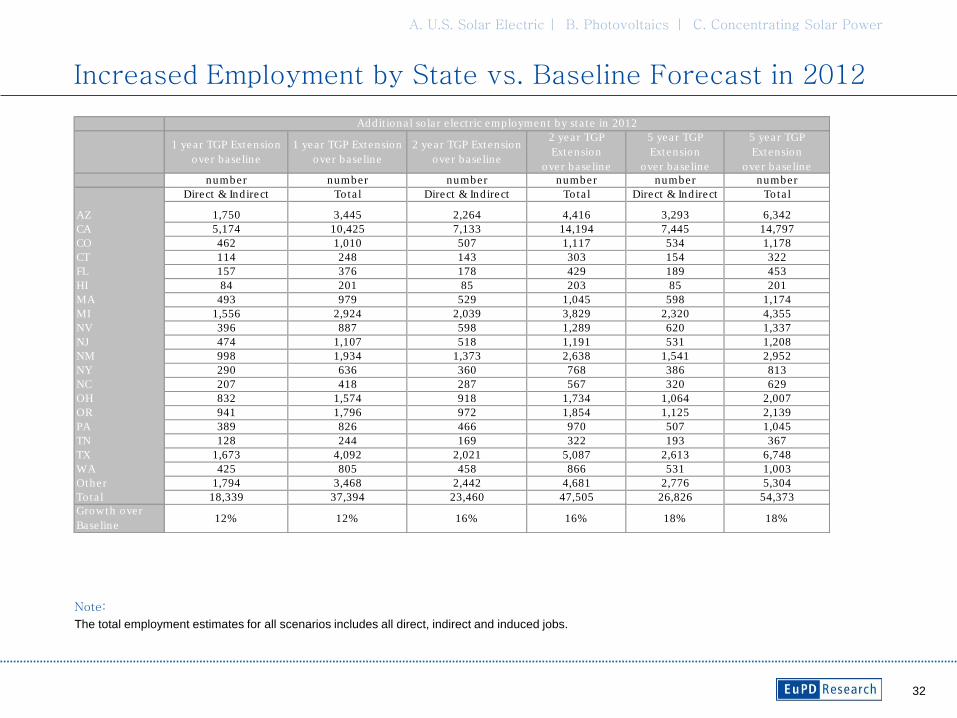
Increased Employment by State vs. Baseline Forecast in 2012
A. U.S. Solar Electric | B. Photovoltaics | C. Concentrating Solar Power
Note:
The total employment estimates for all scenarios includes all direct, indirect and induced jobs.
1 year TGP Extension
over base line
1 year TGP Extension
over base line
2 year TGP Extension
over base line
2 year TGP
Extension
over base line
5 year TGP
Extension
over base line
5 year TGP
Extension
over base line
number number number number number number
Direct & Indirect Tota l Direct & Indirect Tota l Direct & Indirect Tota l
AZ 1,750 3,445 2,264 4,416 3,293 6,342
CA 5,174 10,425 7,133 14,194 7,445 14,797
CO 462 1,010 507 1,117 534 1,178
CT 114 248 143 303 154 322
FL 157 376 178 429 189 453
HI 84 201 85 203 85 201
MA 493 979 529 1,045 598 1,174
MI 1,556 2,924 2,039 3,829 2,320 4,355
NV 396 887 598 1,289 620 1,337
NJ 474 1,107 518 1,191 531 1,208
NM 998 1,934 1,373 2,638 1,541 2,952
NY 290 636 360 768 386 813
NC 207 418 287 567 320 629
OH 832 1,574 918 1,734 1,064 2,007
OR 941 1,796 972 1,854 1,125 2,139
PA 389 826 466 970 507 1,045
TN 128 244 169 322 193 367
TX 1,673 4,092 2,021 5,087 2,613 6,748
WA 425 805 458 866 531 1,003
Other 1,794 3,468 2,442 4,681 2,776 5,304
Tota l 18,339 37,394 23,460 47,505 26,826 54,373
Growth over
Base line12% 12% 16% 16% 18% 18%
Addit iona l so lar e lect ric employment by sta te in 2012

33
Increased Employment by State vs. Baseline Forecast in 2013
A. U.S. Solar Electric | B. Photovoltaics | C. Concentrating Solar Power
Note:
The total employment estimates for all scenarios includes all direct, indirect and induced jobs.
1 year TGP Extension
over base line
1 year TGP Extension
over base line
2 year TGP Extension
over base line
2 year TGP
Extension
over base line
5 year TGP
Extension
over base line
5 year TGP
Extension
over base line
number number number number number number
Direct & Indirect Tota l Direct & Indirect Tota l Direct & Indirect Tota l
AZ 879 1,703 2,085 4,161 5,374 10,316
CA 2,877 5,395 7,850 15,892 9,148 18,384
CO 258 484 466 1,042 597 1,319
CT 62 116 179 395 217 461
FL 76 143 226 540 255 607
HI 24 45 89 218 83 202
MA 159 297 634 1,264 749 1,473
MI 733 1,374 2,077 3,905 2,943 5,528
NV 236 443 704 1,535 899 1,929
NJ 180 338 608 1,413 642 1,448
NM 517 970 1,322 2,534 1,896 3,605
NY 141 264 401 878 496 1,043
NC 112 210 278 554 404 787
OH 291 546 1,156 2,194 1,442 2,728
OR 264 496 1,191 2,287 1,405 2,684
PA 165 310 505 1,070 626 1,285
TN 66 123 187 358 263 502
TX 955 1,791 1,962 4,816 3,661 9,801
WA 121 227 489 929 605 1,146
Other 928 1,741 2,406 4,653 3,520 6,726
Tota l 9,075 17,015 24,812 50,639 35,226 71,973
Growth over
Base line6% 5% 16% 16% 23% 23%
Addit iona l so lar e lect ric employment by sta te in 2013

34
Increased Employment by State vs. Baseline Forecast in 2016
A. U.S. Solar Electric | B. Photovoltaics | C. Concentrating Solar Power
Note:
The total employment estimates for all scenarios includes all direct, indirect and induced jobs.
1 year TGP Extension
over base line
1 year TGP Extension
over base line
2 year TGP Extension
over base line
2 year TGP
Extension
over base line
5 year TGP
Extension
over base line
5 year TGP
Extension
over base line
number number number number number number
Direct & Indirect Tota l Direct & Indirect Tota l Direct & Indirect Tota l
AZ 1,465 2,812 1,754 3,382 13,531 25,618
CA 1,911 3,860 2,652 5,353 8,925 17,946
CO 104 233 163 353 588 1,304
CT 83 193 113 267 379 839
FL 70 169 102 242 533 1,169
HI 16 40 25 61 63 150
MA 153 310 257 515 856 1,682
MI 934 1,757 1,507 2,837 5,994 11,263
NV 106 239 124 282 512 1,171
NJ 180 405 268 604 845 1,818
NM 305 581 358 686 2,158 4,081
NY 102 221 128 283 578 1,184
NC 74 145 83 165 510 980
OH 775 1,470 1,438 2,722 4,582 8,650
OR 294 585 527 1,038 1,630 3,173
PA 132 280 179 384 746 1,512
TN 56 110 76 150 361 696
TX 843 2,324 1,073 2,845 7,095 20,304
WA 111 216 188 363 662 1,269
Other 712 1,417 874 1,761 4,718 9,127
Tota l 8,424 17,364 11,889 24,293 55,268 113,937
Growth over
Base line4% 4% 6% 6% 26% 26%
Addit iona l so lar e lect ric employment by sta te in 2016

35
Increased Installations vs. Baseline Forecast
Note:
The table shows the additional solar electric capacity installed between 2011 and 2016 in megawatts (MW) compared to the baseline forecast.
Under each scenario of
the program extension, all
19 analyzed states show
a significant increase in
solar electric capacity.
State markets that grow
the most with the
extension are the
southwestern states of
Arizona, California,
Colorado and Nevada.
A. U.S. Solar Electric | B. Photovoltaics | C. Concentrating Solar Power
1 year TGP Extension
over base line
2 year TGP Extension
over base line
5 year TGP Extension
over base line
MW MW MW
AZ 309 544 1,814
CA 1,007 1,807 2,857
CO 61 89 162
CT 29 58 139
FL 33 64 184
HI 18 33 63
MA 30 59 128
MI 5 11 26
NV 95 197 349
NJ 103 195 406
NM 31 51 93
NY 42 80 169
NC 11 21 43
OH 16 31 75
OR 26 52 127
PA 46 86 183
TN 4 8 20
TX 60 117 259
WA 6 12 29
Other 72 138 323
Tota l 2,003 3,651 7,449
Growth over
Base line5% 8% 17%
Addit iona l so lar e lect ric insta lla t ion by sta te 2011-2016

36
Appendix 2

37
Executive Summary
A. U.S. Solar Electric
B. Photovoltaics
C. Concentrating Solar Power
Appendix 1
Appendix 2
Methodology, assumptions & sources
About EuPD Research
Contents
38
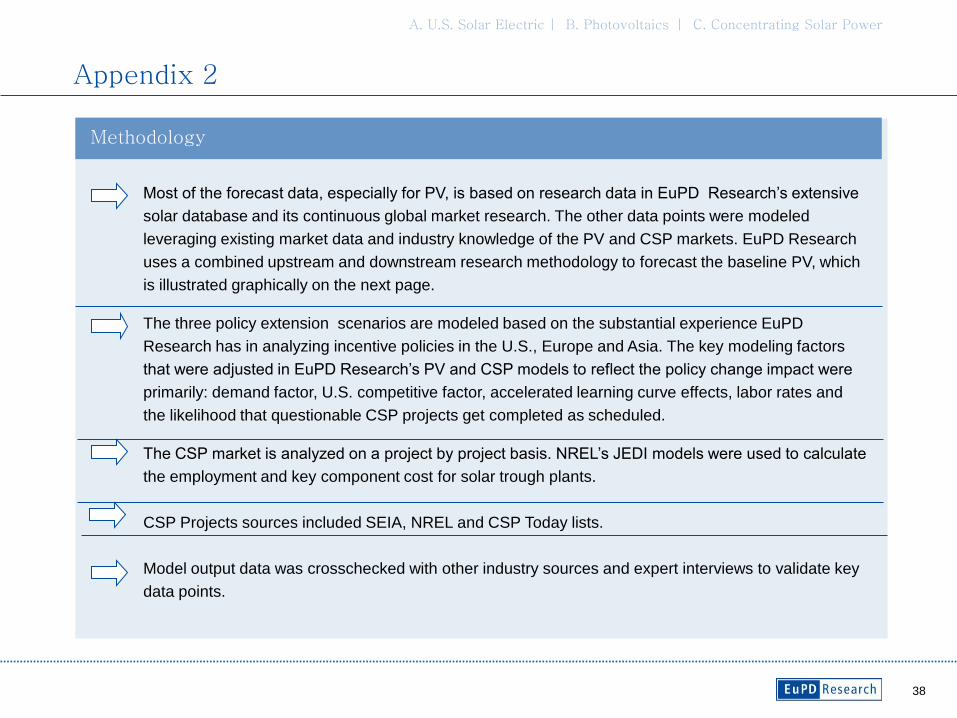
Appendix 2
Most of the forecast data, especially for PV, is based on research data in EuPD Research’s extensive
solar database and its continuous global market research. The other data points were modeled
leveraging existing market data and industry knowledge of the PV and CSP markets. EuPD Research
uses a combined upstream and downstream research methodology to forecast the baseline PV, which
is illustrated graphically on the next page.
The three policy extension scenarios are modeled based on the substantial experience EuPD
Research has in analyzing incentive policies in the U.S., Europe and Asia. The key modeling factors
that were adjusted in EuPD Research’s PV and CSP models to reflect the policy change impact were
primarily: demand factor, U.S. competitive factor, accelerated learning curve effects, labor rates and
the likelihood that questionable CSP projects get completed as scheduled.
The CSP market is analyzed on a project by project basis. NREL’s JEDI models were used to calculate
the employment and key component cost for solar trough plants.
CSP Projects sources included SEIA, NREL and CSP Today lists.
Model output data was crosschecked with other industry sources and expert interviews to validate key
data points.
Methodology
A. U.S. Solar Electric | B. Photovoltaics | C. Concentrating Solar Power
39
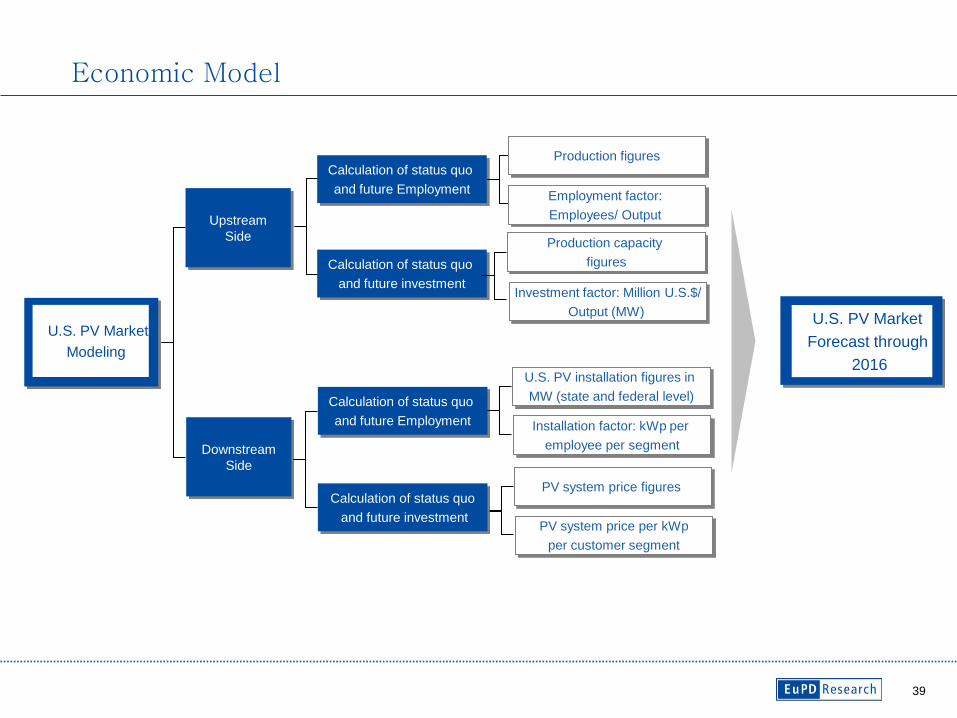
Economic Model
Upstream
Side
Calculation of status quo
and future Employment
Calculation of status quo
and future investment
U.S. PV Market
Modeling
Calculation of status quo
employment effects
Production capacity
figures
U.S. PV installation figures in
MW (state and federal level)
Downstream
Side
Calculation of status quo
and future Employment
Calculation of status quo
and future investment
Installation factor: kWp per
employee per segment
Investment factor: Million U.S.$/
Output (MW)
PV system price figures
PV system price per kWp
per customer segment
Production figures
Employment factor:
Employees/ Output
U.S. PV Market
Forecast through
2016
40
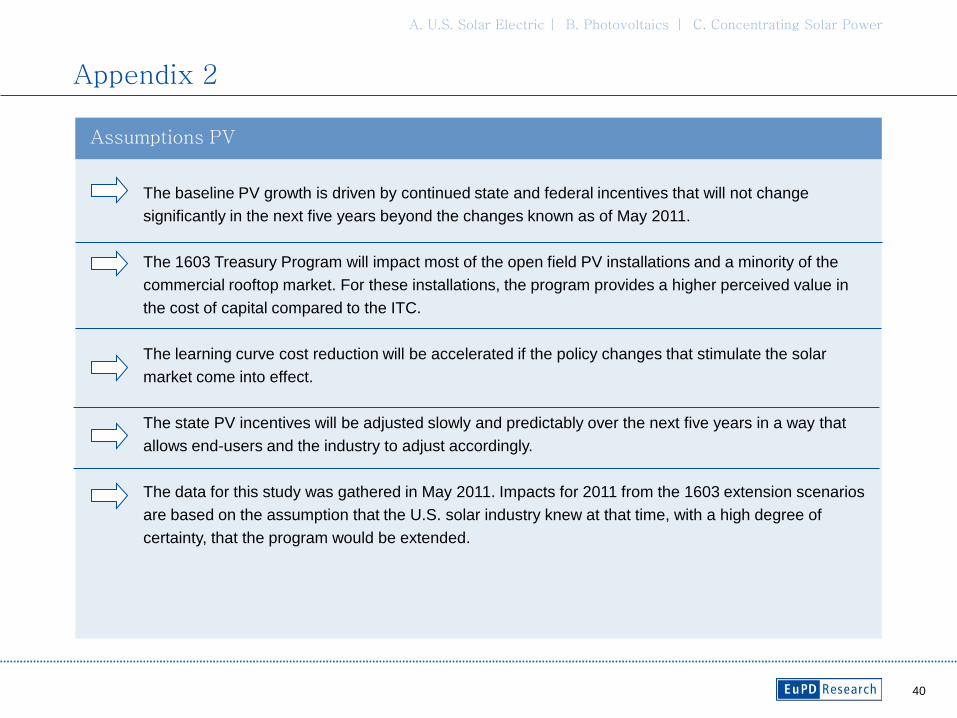
Appendix 2
The baseline PV growth is driven by continued state and federal incentives that will not change
significantly in the next five years beyond the changes known as of May 2011.
The 1603 Treasury Program will impact most of the open field PV installations and a minority of the
commercial rooftop market. For these installations, the program provides a higher perceived value in
the cost of capital compared to the ITC.
The learning curve cost reduction will be accelerated if the policy changes that stimulate the solar
market come into effect.
The state PV incentives will be adjusted slowly and predictably over the next five years in a way that
allows end-users and the industry to adjust accordingly.
The data for this study was gathered in May 2011. Impacts for 2011 from the 1603 extension scenarios
are based on the assumption that the U.S. solar industry knew at that time, with a high degree of
certainty, that the program would be extended.
Assumptions PV
A. U.S. Solar Electric | B. Photovoltaics | C. Concentrating Solar Power

41
Appendix 2
The investment environment for CSP will remain favorable in the southwestern U.S. The CSP industry
will continue to receive support at the state and local level.
The Treasury program will impact most projects. It will be strongest for projects that would otherwise
have difficulty obtaining financing.
Implementing CSP for base load reasons, is considered to be a major strategic issue for the US.
The learning curve cost reduction will be accelerated if the policy changes that stimulate the solar
market come into effect.
Assumptions CSP
A. U.S. Solar Electric | B. Photovoltaics | C. Concentrating Solar Power

42
About EuPD Research
Hoehner Research & Consulting USA Corp.
Headquarters USA
7905 SW 96 Street | Miami | FL 33156
Phone +1 (305)-274-3689
www.hrc-usa-corp.com
Contact
Markus A.W. Hoehner
CEO
Wolfgang Schlichting
Research Director, North America
EuPD Research® is a brand of HOEHNER RESEARCH & CONSULTING GROUP GmbH.
Member of ESOMAR World Research

43
Disclaimer NEITHER HOEHNER RESEARCH & CONSULTING GROUP GMBH NOR ANY OF ITS EMPLOYEES MAKES ANY WARRANTY, EXPRESS OR IMPLIED, OR
ASSUMES ANY LEGAL LIABILITY OR RESPONSIBILITY FOR THE ACCURACY, COMPLETENESS, OR USEFULNESS OF ANY INFORMATION, PRODUCT, OR
PROCESS DISCLOSED. THIS PRODUCT WAS PREPARED USING PROFESSIONAL METHODS AND WITH GREAT CARE, TAKING ACCOUNT OF RELEVANT
LEGISLATION. THE DATA CONATINED IN THIS PRODUCT IS BASED ON SURVEYS OF SAMPLE POPULATIONS, CONDUCTED USING STANDARD STATISTICAL
METHODS. AS SUCH, THE STUDY IS SUBJECT TO A CERTAIN STATISTICAL ERROR RATE AND IS BASED EXCLUSIVELY ON THE FACTS WHICH WERE
AVAILABLE AT THE TIME OF THE SURVEY.THE AUTHORS MAKE NO GUARANTEES THAT ANY DECISION BASED ON THE INFORMATION PROVIDED WILL
BENEFIT YOU IN SPECIFIC APPLICATIONS, OWING TO THE RISK THAT IS INVOLVED IN DECISION-MAKING OF ALMOST ANY KIND.
REFERENCE TO ANY SPECIFIC COMMERCIAL PRODUCT, PROCESS, OR SERVICE BY TRADE NAME, TRADEMARK, MANUFACTURER, OR OTHERWISE DOES
NOT NECESSARILY CONSTITUTE OR IMPLY ITS ENDORSEMENT, RECOMMENDATION, OR FAVORING BY HOEHNER RESEARCH & CONSULTING GROUP
GMBH. OUR SALESPEOPLE, RESEARCH ANALYSTS, AND OTHER PROFESSIONALS MAY PROVIDE ORAL OR WRITTEN MARKET COMMENTARY TO OUR
CLIENTS THAT REFLECT OPINIONS THAT ARE CONTRARY TO VIEWS AND OPINIONS EXPRESSED IN THIS PUBLICATION. THE VIEWS AND OPINIONS OF
AUTHORS EXPRESSED HEREIN DO NOT NECESSARILY STATE OR REFLECT THOSE OF HOEHNER RESEARCH & CONSULTING GROUP GMBH.
NO PART OF THIS PUBLICATION MAY BE COPIED OR DUPLICATED IN ANY FORM BY ANY MEANS OR REDISTRIBUTED OR PUBLISHED WITHOUT THE
PRIOR WRITTEN CONSENT OF HOEHNER RESEARCH & CONSULTING GROUP GMBH. UNAUTHORIZED COPYING OF THIS PUBLICATION IS CONSIDERED A
BREACH OF COPYRIGHT.