economic impact of japanese nuclear...
TRANSCRIPT
Economic Impact of Japanese nuclear shutdown
Tokyo – 17-18 February 2014
Hiroaki Ishigaki
Vice President
Edward Kee
Vice President

1
Topics
Nuclear units shutdown after March 2011 earthquake and tsunami
Nuclear electricity replaced by thermal– Initial surge of oil-fired generation– Now more gas and coal generation– FIT program increased renewable generation
Impact on economy is large, but lowering
Long-term implications of nuclear shutdown
2
Nuclear situation
FY
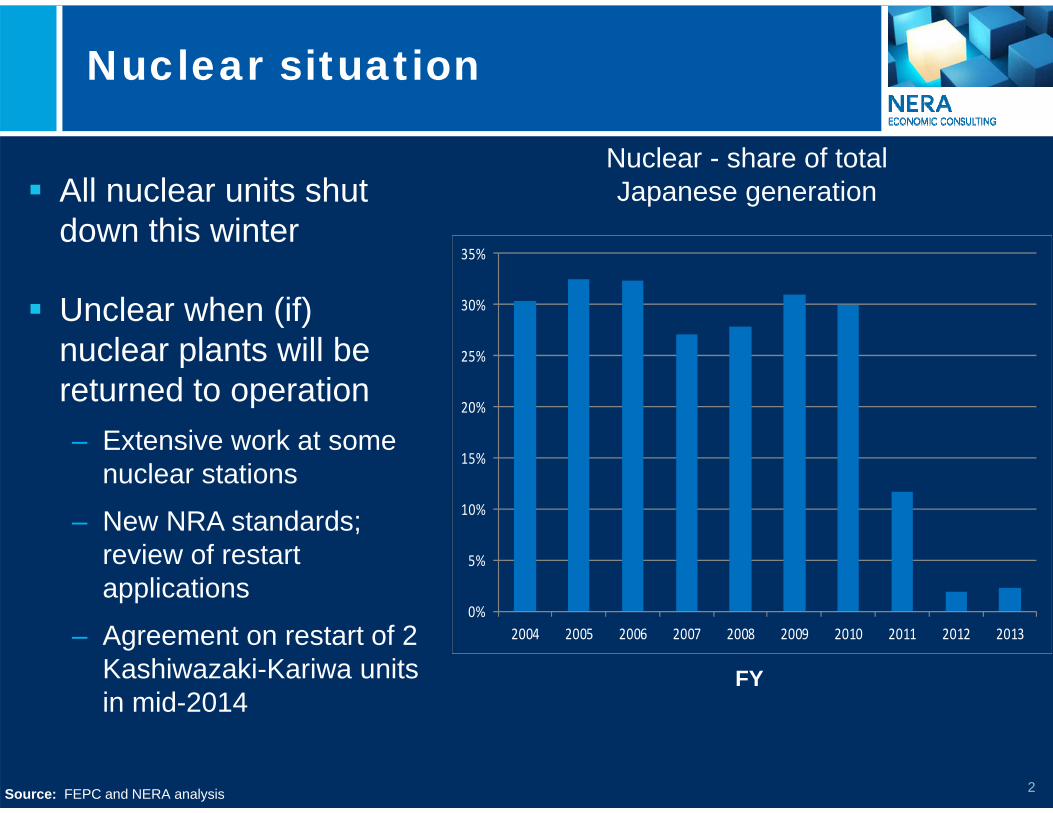
Nuclear - share of total Japanese generation
0%
5%
10%
15%
20%
25%
30%
35%
2004 2005 2006 2007 2008 2009 2010 2011 2012 2013
All nuclear units shut down this winter
Unclear when (if) nuclear plants will be returned to operation– Extensive work at some
nuclear stations
– New NRA standards; review of restart applications
– Agreement on restart of 2 Kashiwazaki-Kariwa units in mid-2014
Source: FEPC and NERA analysis

3
Nuclear replaced by thermal
FY
Generation by Type(10-company total) Nuclear generation
mostly replaced by thermal generation
Use of existing thermal power plants with low utilization and return of old mothballed units
Mix of oil, LNG, and coal, with changes over time
Source: FEPC and NERA analysis
TWh
‐
100
200
300
400
500
600
700
800
900
1,000
2004 2005 2006 2007 2008 2009 2010 2011 2012 2013(1stHalf)
Thermal
Nuclear
Hydro
Other

4
Oil for electricity generation
Prior to 2011 earthquake, much of the oil-fired generation was used for peaking units or was mothballed because of high costs
After earthquake, utilities increased output from operational oil-fired plants and returned some mothballed oil-fired plants to service – avoiding blackouts at a high cost
Increase in gas and coal generation allowed utilities to lower oil consumption by late 2013

5
Oil consumption changes
Crude oil burned for power increased by 230% from 2010 to 2012
Heavy Fuel Oil for power increased by 180% from 2010 to 2012
By first half of FY 2013, oil use for power was reduced
HFO (billion liters)
Crude Oil (billion liters)
‐
2
4
6
8
10
12
14
16
18
2004 2005 2006 2007 2008 2009 2010 2011 2012 2013
Second Half
First Half
‐
2
4
6
8
10
12
14
16
2004 2005 2006 2007 2008 2009 2010 2011 2012 2013
Second Half
First Half
FYSource: FEPC and NERA analysis
6
Gas-fired Generation
FY
Source: FEPC and NERA analysis
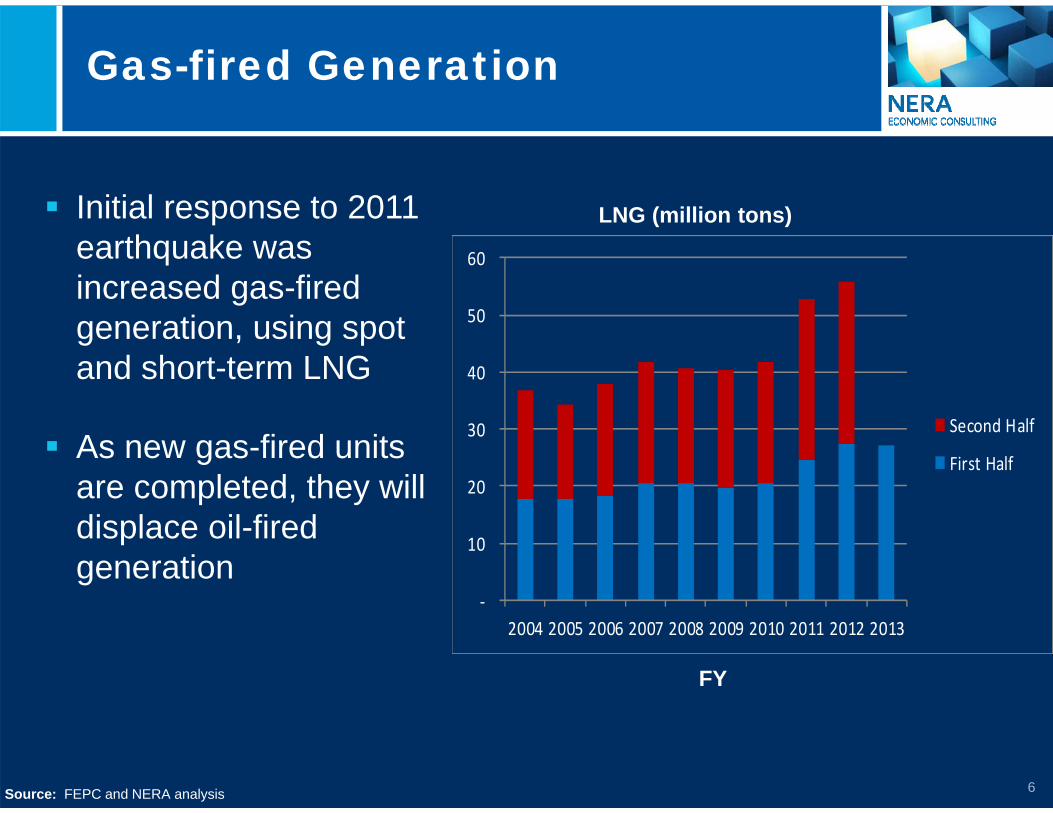
LNG (million tons)
‐
10
20
30
40
50
60
2004 2005 2006 2007 2008 2009 2010 2011 2012 2013
Second Half
First Half
Initial response to 2011 earthquake was increased gas-fired generation, using spot and short-term LNG
As new gas-fired units are completed, they will displace oil-fired generation

7
Gas-fired Generation
Utilities plan to build a significant number of new gas-fired power plants over the next few years
New gas-fired generation allows reduction of generation using expensive crude and fuel oil
The new gas-fired plants, even if not operated heavily in future (i.e., if nuclear restarted) will provide additional reliability
8
LNG contract approach
Qatar, 18%
Australia, 18%
Malaysia, 17%
Russia, 10%
Brunei, 7%
Indonesia, 7%
Other, 7%
UAE, 6%
Nigeria, 5%
Oman, 5%
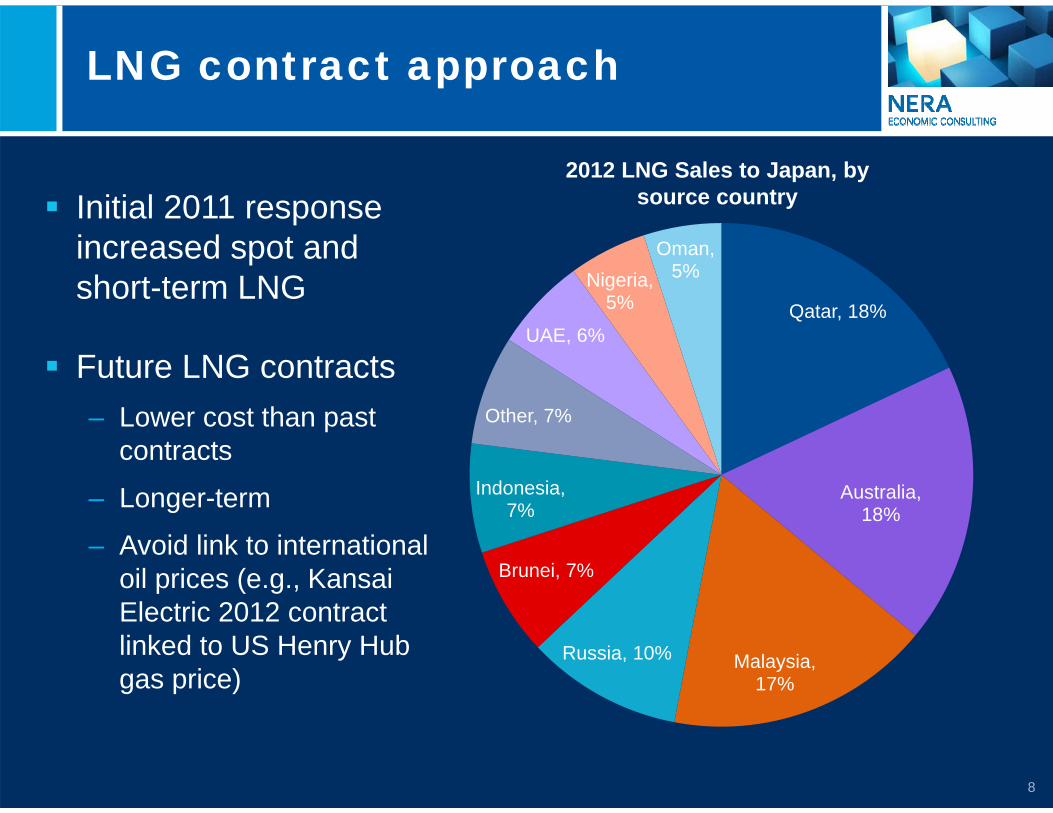
Initial 2011 response increased spot and short-term LNG
Future LNG contracts– Lower cost than past
contracts
– Longer-term
– Avoid link to international oil prices (e.g., Kansai Electric 2012 contract linked to US Henry Hub gas price)
2012 LNG Sales to Japan, by source country

9
TEPCO LNG Purchasing Group
TEPCO’s recovery plan includes joining with other big LNG purchasers (e.g., Kansai Electric Power and Tokyo Gas) to negotiate LNG contracts
A unified purchasing group of electric utilities and gas companies could enhance negotiating power and bring down prices
Purchases of up to 40m tons of LNG per year
10
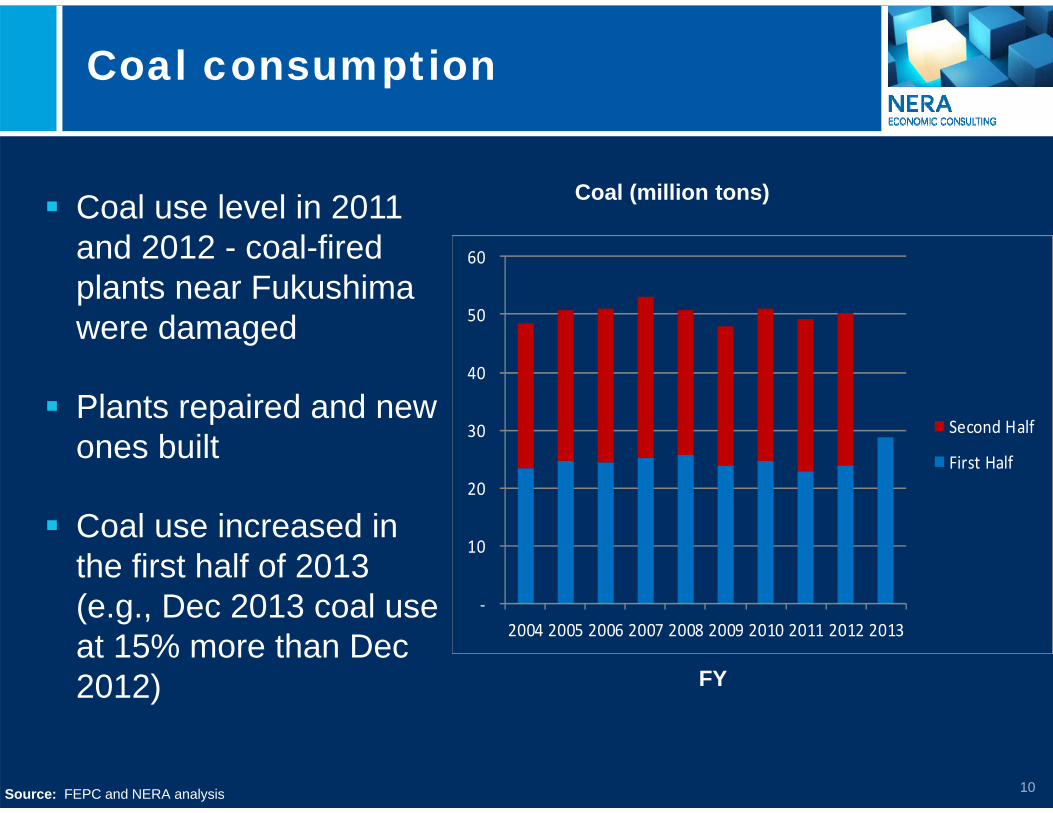
Coal consumption
FY
Source: FEPC and NERA analysis
Coal (million tons)
‐
10
20
30
40
50
60
2004 2005 2006 2007 2008 2009 2010 2011 2012 2013
Second Half
First Half
Coal use level in 2011 and 2012 - coal-fired plants near Fukushima were damaged
Plants repaired and new ones built
Coal use increased in the first half of 2013 (e.g., Dec 2013 coal use at 15% more than Dec 2012)

11
Coal-fired Generation
Coal generation is lower cost than oil or LNG
3 new coal-fired power plants with a combined capacity of 1.85 GW came online in 2013
2 GW of capacity at the Haramachi plant came back online in 2013 after 2011 earthquake damage was repaired
Utilities building more coal-fired capacity due to less stringent environmental regulations for construction and for burning coal

12
Planned Coal Generation
Company Plant Output (MWe) Ops StartJoban Kyodo Nakoso No.10 250 April 2013
TEPCO Hirono No.6 600 Dec 2013
TEPCO Hitachinaka No.2 1,000 Dec 2013
Osaki CoolGen Osaki 166 Mar 2017
TEPCO, Mitsubishi group Nakoso 500 Around 2020
TEPCO, Mitsubishi group Hirono 500 Around 2020
TEPCO, Chubu Hitachinaka 600 2020/21
J-Power Takehara New No.1 600 2020/21
Nippon Steel, J-Power Kashima 600 2020/21
Kyushu Electric Matsuura No.2 1,000 2023 at earliest
Chugoku Electric Misumi No.2 400 2027 at earliest
Tohoku Electric Noshiro No.3 600 2028 at earliest
12 units 6,816
Source: Ministry of Economy Trade and Industry, Tokyo Electric Power Co, Chubu, Electric Power co, Kyushu Electric Power Co, Tohoku Electric, Power Co, Electric, Power Development Co, and NERA analysis

13
Renewable Generation
New renewable feed-in tariff (FIT) approved after 2011 earthquake:– FIT contracts are 10 to 20 years, depending on the
type and amount of energy– Wind, solar, geothermal, biomass and hydropower– Costs shared by government and end users
Effective– Renewables now about 10% of total generation– About 1.4 GW of renewable energy capacity installed
between July 2012 and February 2013

14
Impact on Economy
The shift from nuclear to thermal avoided electricity outages, but at a high cost
METI estimates that 9 nuclear utilities would spend ¥7.5 trillion on thermal fuel in this FY– ¥3.6 trillion more due to closed nuclear power plants– Lower than earlier estimate of ¥3.8 trillion in April 2013– 8 of 9 nine nuclear utilities posted net losses in the
last fiscal year due to the higher fuel bills
Total added fuel costs for thermal power stations will amount to ¥9.2 trillion by the end of 2013

15
Impact on Economy
Added cost to run thermal power stations is compounded by weaker yen
Japan is now running trade deficits for the first time in three decades
Added thermal power plant fuel costs were a third of Japan’s total imports, increasing Japan's trade deficit through 2013
Businesses and consumers face much higher electricity costs in Japan than in many countries
16
Near-term Implications
In face of uncertain nuclear restart, Japan is – Adding coal and natural gas generation– Adding long-term LNG contracts– Adding renewables with long-term FIT contracts
If nuclear restart is delayed or not allowed, power sector will be ready for long-term shift to thermal generation
If nuclear restart is approved, additional thermal and renewable generation available

17
Long-Term Implications
Investment in new thermal power plants will make system more reliable, but at a cost
Permanently replacing nuclear with thermal generation will make electricity more expensive
Significant shift to coal generation (even if nuclear restart) is likely due to low cost
Japan’s nuclear power industry, without new investments in Japan, will shift focus to export markets (e.g., UK and Turkey)

Contact UsHiroaki Ishigaki
Vice PresidentNERA — Tokyo+81 3 3500 [email protected]
© Copyright 2014National Economic Research Associates, Inc.NERA Economic Consulting, a Division of Oliver Wyman Group KK
All rights reserved.
Edward Kee
Vice PresidentNERA — Washington, DC+1 202 370 [email protected]

NERA Overview
20
About Our Firm
For over half a century, NERA's economists have been creating strategies, studies, reports, expert testimony, and policy recommendations for government authorities and the world's leading law firms and corporations– We bring academic rigor, objectivity, and real world industry experience
to bear on issues arising from competition, regulation, public policy, strategy, finance, and litigation
Clients value our ability to apply and communicate state-of-the-art approaches clearly and convincingly, our commitment to deliver unbiased findings, and our reputation for quality and independence– Our clients rely on the integrity and skills of our unparalleled team of
economists and other experts backed by the resources and reliability of one of the world's largest economic consultancies
NERA Economic Consulting is a global firm of experts dedicated to applying economic, finance, and quantitative principles to complex business and legal challenges

21
Our Areas of Focus
Objective analysis
Expert testimony
Regulatory insight
Economics Services that include economic analysis and advice in litigation and regulation. We provide:
Economic analysis of the impact of competition, regulation, and management decisions on firm and market performance
Assistance in devising profitable cost, pricing, and product strategies
Advisory Services that help to shape business strategies. We provide:

22
Our Founding Principles
Focus: We maintain a single-minded focus on rigorously applying the highest quality economic expertise on behalf of our clients
Independence: We are dedicated to the truth and to delivering unbiased findings. We do not tell clients what they want to hear; we tell them what they need to hear
Defensibility: Our testimony and analysis are respected and effective because they are always defensible. Our reputation and our business depend on an unflagging commitment to quality and integrity in everything we do
Clarity: Even the most rigorous economic analysis can have impact only if it is clear and understandable. We are experts at making complex economics clear to juries, regulators, and other audiences
NERA is known for innovation in the application of economics—applying new methods and perspectives to achieve results for our clients. However, our work is grounded in a set of core principles that have always guided our pioneering efforts:

23
Our Global Presence
Our global team of more than 500 professionals operates in more than 20 offices across North America, Europe, and Asia Pacific
Sydney
MelbourneAuckland
Wellington
TokyoShanghai
BeijingAustin
ChicagoDenverSan Francisco
Los Angeles
Boston
New York CityPhiladelphia
Washington, DC
White PlainsToronto
Madrid Rome
Frankfurt
London Brussels
ParisBerlin
Geneva

24
Relationship to MMC
NERA Economic Consulting is a unit of Oliver Wyman Group and of Marsh & McLennan Companies (MMC)
Marsh & McLennan Companies
Consulting
NERA Economic Consulting
Oliver Wyman Group
Mercer
Lippincott Oliver Wyman
Risk andInsurance Services
GuyCarpenter
Marsh

25
Our Clients
For over half a century, NERA experts have played critical roles in client success in some of the world’s highest-profile cases related to litigation, regulation, and business challenges– NERA has worked with all 100 of the American Lawyer Global 100
largest law firms
– 87 of the Fortune 100 largest corporations have been NERA clients
– NERA experts have worked with clients in 120 countries around the world
Clients come to NERA when they need an innovative approach to the economics of a tough problem, when they need a partner that they know has the right experience and expertise, and when they are facing a challenge where the stakes are too high to risk failure

26
Visit www.nera.comSubscribe to the NERA Weekly
Complimentary weekly newsletter that features our latest thinking
Updates on new publications, events, and client case/project work on our website
Subscribe now online at www.nera.com/neraweekly
Learn More About Us