economic impact of the eagle ford shale of oil and gas activities ... to calculate the economic...
TRANSCRIPT

1
Economic Impact of the Eagle Ford Shale
February 2011
Prepared by:
Center for Community and Business Research
The University of Texas at San Antonio Institute for Economic Development

2
This study was performed by The University of Texas at San Antonio Institute for Economic Development’s Center for Community and Business Research. The project was supported with funding from the America’s Natural Gas Alliance. Any findings, conclusions or opinions are those of the authors and not necessarily those reflected by The University of Texas at San Antonio or the America’s Natural Gas Alliance.
Acknowledgments: This report was prepared by Dominique Halaby, Javier Oyakawa, Christine Shayne, Carter Keairns and Alan Dutton. A special thanks to Adam Haynes with Chesapeake Energy and the entire ANGA organization for their support and assistance in collecting data.

3
Economic Impact of the Eagle Ford Shale
Table of Contents
Executive Summary ....................................................................................................................................... 4
Introduction .................................................................................................................................................. 5
Current Activities .......................................................................................................................................... 7
Combined impacts of the Eagle Ford Shale in 2010 ........................................................................... 10
Extraction of oil and gas activities....................................................................................................... 13
Drilling and completion activities ....................................................................................................... 14
Lease payments................................................................................................................................... 15
Royalties .............................................................................................................................................. 16
Midstream Development .................................................................................................................... 16
Counties .............................................................................................................................................. 17
Future Impacts in 2020 ............................................................................................................................... 20
Combined future impacts of the Eagle Ford shale .............................................................................. 22
Future Impacts in Counties ................................................................................................................. 23
Discussion.................................................................................................................................................... 25
APPENDIX A ............................................................................................................................................. 28
APPENDIX B ............................................................................................................................................. 29
APPENDIX C ............................................................................................................................................. 31
APPENDIX D ............................................................................................................................................. 32
APPENDIX E ............................................................................................................................................. 35

4
Executive Summary
Since the 2008 discovery of Hawkville Field, the Eagle Ford Shale has experienced a tremendous amount of activity. In less than three years, the shale play is already accounting for roughly six percent of the Gross Regional Product for the 24 county area. It creates close to $1.3 billion of gross state product impact, 1 supports 12,601 full-time jobs, and adds $2.9 billion in total economic output (or revenues).This in turn generates close to $60.9 million in State’s revenues and $47.6 million in local government revenues.2 Additionally, counties like Bexar benefits with close to $58.0 million in gross state product, close to $103.8 million in economic output, and 590 full-time jobs as a result of the Eagle Ford shale activities in the surrounding counties. Jim Wells County benefits importantly with $6.5 million in gross state product, close to $15.9 million in economic output, and 86 full-time jobs. In the report, other selected surrounding counties, like Uvalde and Victoria, also show positive impacts from the shale activities.
Under moderate assumptions, by 2020 (in 2010 dollars), the Eagle Ford Shale is expected to account for close to $11.6 billion in gross state product, $21.6 billion in total economic output (or revenues) impact, and support close to 67,971 full-time jobs in the area. This will add close to $1.2 billion in State’s revenues and more than $450.6 million in local government revenues. Also, Bexar County is going to benefit with close to $702.9 million in economic output, around $394.5 million in gross state product, and 3,924 full-time jobs from the activities of the shale. Jim Wells County is estimated to benefit with $97.5 million in gross state product, close to $239.3 million in output, and close to 1,334 full-time jobs.
Analysts, investors and industry experts agree that due to a high reservoir quality, the Eagle Ford Shale will likely become a premiere oil and gas play in 2011. High yield condensate and oil production together with a favorable business climate are very attractive to individual operators, and they are likely to play a key role in spurring economic development and contributing to the economic prosperity of the region. For the future, both oil and condensate will drive production in the area as producers of oil shale perfect and develop their technologies.
1 Gross state product is also named Value Added. For presentation purposes, this value is presented as contributions to the gross state product rather than to the gross regional product.
2 These local governments include county, city, independent school districts, area hospitals, among other regional institutions.
5
Introduction
In 2008, Petrohawk Energy Corporation began exploration of the Eagle Ford Shale when it drilled the first well in Hawkville Field of LaSalle County.3 This hydrocarbon producing formation is the source rock for Austin Chalk and is approximately 4,000 to 14,000 feet below the surface, with the core focus being between 10,000 and 12,000 feet. This discovery is of significant importance in that the formation contains both natural gas and oil deposits. As a result, drillers and explorers, large and small, are quickly establishing a presence in the 50 mile wide by 400 mile long shale play that runs from the southern portion of the state to the east. Such a sizable discovery has many community leaders and interested parties wondering: Just what does this discovery mean for the communities located in this region? And what does it mean for the Texas economy?
To appropriately estimate the economic impact that Eagle Ford Shale activity is having on the communities in South and South-East Texas, the America’s Natural Gas Alliance contracted with the Center for Community and Business Research (CCBR) at the University of Texas at San Antonio’s Institute for Economic Development.
To estimate these impacts, CCBR used the input-output software IMPLAN.4 Direct, indirect, and induced impacts from the operations of the firms in the Eagle Ford Shale are obtained with this software. The direct impacts include the actual production and employment by the firms operating in the shale. The indirect impacts include the revenue and personnel expenses of the suppliers while the induced impacts include expenses of the workers. The software organizes the information based on data from the Bureau of Economic Analysis (BEA) and several other federal and state agencies.
Other studies similar to ours used IMPLAN differently. Usually, based on survey data, they built new linkages between economic sectors to accommodate the fact that the IMPLAN database predates much of the shale gas drilling. Our analysis relies on existing oil and gas sector linkages in the IMPLAN economic database, producing results which may appear relatively more conservative. To quantify the impact of the Eagle Ford Shale, we focused on four economic sectors where the oil and gas industries operate: 5
1. Oil and gas extraction (NAICS 211);
3 The Discovery, Reservoir Attributes, and Significance of the Hawkville Field and Eagle Ford Shale Trend, Texas, Cusack et al. Gulf Coast Association of Geological Societies Transactions, v. 60, p. 165-179
4 From the Minnesota IMPLAN Group, Inc., IMPLAN System (data and software), 502 2nd Street, Suite 301, Hudson, WI 54016 www.implan.com
5 Similar to the report The Economic Impact of the Oil and Gas Industry in Pennsylvania, prepared by Pennsylvania Economy League of Southwestern Pennsylvania, LLC, November 2008 but different from that report, here we are adding pipeline construction activities, lease and royalty payments.

6
2. Drilling oil and gas wells (NAICS 213111);
3. Support activities for oil and gas operations (NAICS 213112); and
4. Oil and gas pipeline and related structures construction (NAICS 237120).
Additionally, we included the economic impacts of royalty and lease payments 6 to households that in turn will spend their money creating induced effects and supporting more jobs.
As mentioned before, our approach differs from other impact studies that rely heavily on survey data. In this report, the use of publicly available data together with the information from the IMPLAN database represent the main sources of information. In addition, information from industry officials, professors at the University of Texas at San Antonio, and data from other industry sources helped in designing the methodology implemented in the present report.
To calculate the economic impact of the Eagle Ford Shale in 2010, we estimated the production of gas and oil for that year. We collected Eagle Ford related production information from the Railroad Commission of Texas up to September 2010, and used that information to project the final total for the year.7 Using price information from the Energy Information Administration (EIA) we obtained estimation, in dollars, of revenues from oil and gas extraction for the year. This dollar-production amount was used with the software IMPLAN to obtain direct, indirect, and induced impacts in the area of analysis. 8 Oil and Gas Extraction is practically the only sector related to this dollar value.9 Based on information about drilling and completion costs 10 per well and by estimating the number of wells drilled
6 Similar to Timothy J. Considine in The Economic Impacts of the Marcellus Shale: Implications for New York, Pennsylvania, and West Virginia, July 14, 2010; and to Anthony M. Zammerilli in Projecting the Economic Impact of Marcellus Shale Gas Development in West Virginia: A Preliminary Analysis Using Publicly Available Data, March 31, 2010; a report by the National Energy Technology Laboratory
7 The methodology to obtain these results is explained in Appendix C.
8 See Appendix B for the list of counties included in the area of study.
9 According to the Commodity Balance Sheet from IMPLAN, of the oil and gas extraction industry production 99.992 percent corresponds to the commodity oil and gas extracted in the area. This indicates that the full value of the revenues from the extraction of oil and gas industry can be allocated to only one commodity: oil and gas extracted.
10 We are treating drilling and completion costs in a way similar to how we treat construction of pipelines: they represent a different activity that is not represented in the average linkages calculated in input-output tables. For instance, in IMPLAN the production function of the oil and gas extraction industry does not include any activity from the drilling of oil and gas wells industry, therefore, to account for the latter industry contributions to the economy we have to add it as a separate direct impact.

7
and completed in 2010, 11 we were able to obtain a total amount of drilling and completion activity that was allocated to two different sectors in IMPLAN. 12
Information on pipeline construction for 2010 relied on industry officials data and represent very conservative values. Unlike other studies that have assumed a 25 percent royalty payment we recognize that not all the funds remain in the target area and hence assumed to use a more conservative estimate. For this study, royalties represent 20 percent of total revenues from oil and gas extraction, while lease payments were obtained as the product of acreage leased in 2010 times an average dollar amount per acre.
Current Activities One need only look at the sudden surge in permits issued to get a sense of the industry’s expectations for the Eagle Ford Shale play. In 2008, only 33 permits were issued for drilling in the Eagle Ford Shale. For the first 11 months of 2010, 1018 permits were issued.13
11 Based on information from HPDI we obtained the number of wells completed up to September 2010, and use this information to obtain a yearly total of wells for the area. A drilling cost of $6.5 million was assumed for horizontal wells, and $1.5 million for vertical wells, based on information found and comments from professionals working in the area.
12 Drilling oil and gas wells (NAICS 213111), on one hand, and support activities for oil and gas operations (NAICS 213112) on the other.
13 Texas Railroad Commission

8
We recognize that not all permits issued will translate into completed wells; however, the sharp increase in permits is a strong indicator of increased drilling activity and production. From January through September of 2010,14 there were 293 active wells, of which 239 were horizontal and 54 were vertical. Not all of the active wells were new or drilled and completed in 2010. The location of these wells is as depicted below:
Though we recognize that the primary area of Eagle Ford Shale activity is between 15 and 17 counties in South Texas, for the purposes of this analysis we analyze the impact based on the 24-county geographic area in which Eagle Ford Shale well activity was reported by the Railroad Commission of Texas. For 2010, we estimated 241 wells completed, of which 180 were horizontal and 61 were vertical. The distribution among oil wells and gas wells were 143 and 98 respectively. These wells were managed by over 50 operators. The ten largest in terms of active well count are as follows:
14 Based on information from HPDI. See Appendix A for

9
Not surprisingly, as the number of wells has increased so too has the aggregate well production. In 2009, roughly 16,000 mmcf of natural were reported to have come from the Eagle Ford Shale. From January to October 2010, that number increased to 49,000 mmcf. 15
Oil and condensate production has also sharply increased from a combined 0.8 million barrels in 2009 to roughly 3.9 million barrels in just the first ten months of 2010.
15 RRC web site.
Well Gas Production (mmcf)

10
For the 875,095 (2008) people that reside in the 24 counties of the Eagle Ford Shale, the jobs brought to the area as a direct result of the shale play have wages considerably higher than the average for the region. According to the Texas Workforce Commission, the average wage for all employees in the region was $32,680 in 2009, while Texas workers in oil and gas extraction industry earned an average annual wage of $76,874.16 In 2009, the area employed close to 375,600 full- and part-time jobs, including the self-employed and farm jobs. 17
Though initially it is expected that some skilled workers will be imported from other areas of the state, the Eagle Ford Shale activity will likely present important employment opportunities for area residents provided that they have the required skills.
Combined impacts of the Eagle Ford Shale in 2010 For 2009, the Eagle Ford Shale area counties produced close to $2.9 billion and employing 12,601 workers.18 Table 1 summarizes the impacts of the Eagle Ford Shale wells for 2010: 19
a. Close to $2.9 billion in total economic output (or revenues) impact;
b. Supports 12,601 full-time jobs in the area;
16 Texas Workforce Commission Texas Industry Profiles, November 2009 mail survey
17 Based on the IMPLAN 2009 database which in turn uses information from the Bureau of Economic Analysis.
18 Based on the IMPLAN 2009 database.
19 According to the Railroad Commission of Texas (RRCT) there are 24 counties where the Eagle Ford Shale expands. See Appendix B for a list of counties. Population and personal income data comes from the BEA.

11
c. $511.8 million in salaries and benefits paid to workers;
d. Close to $1.3 billion of gross state product;
e. Close to $60.9 million in State revenues including $36.3 million in severance taxes;
f. Close to $47.6 million in local government revenues.
TABLE 1
Economic ImpactsDirect Indirect Induced Total
Output $2,134,859,702 $367,352,508 $366,575,786 $2,868,787,997Employment 6,769 2,579 3,254 12,601Payroll $310,931,653 $99,478,695 $101,407,067 $511,817,415
Fiscal ImpactsDirect Indirect Induced Total
Gross State Product $896,550,821 $200,772,666 $221,149,408 $1,318,472,895Estimated Local Government Revenues $47,606,063
$60,998,530Estimated State Revenue, incl. severance taxes
Estimated Impacts for Eagle Ford Shaleat the Regional Level (2010)
These are the combined impacts from oil and gas extraction activities, drilling and completion activities, and pipeline development by the firms operating in the shale. On the other hand, royalty and lease payments to landowners created additional induced impacts in the area.
The top ten industries affected by these firms in terms of employment, output, or gross state product are shown in Tables 2 through 4. Table 2 shows the top ten industries impacted in terms of employment. At the top is the construction of new nonresidential structures (or the construction of pipelines) with 2,528 jobs followed by the three related oil and gas industries with support activities for oil and gas operations first with 2,259 workers. These three related industries are followed by food services and drinking places (473), wholesale trade (376), and architectural and engineering services (334).

12
TABLE 2
Top Ten Industries Affected: By Employment (2010)
Industry EmploymentConstruct other new nonresidential structures 2,528Support activities for oil and gas operations 2,259Extraction of oil and natural gas 1,192Drilling oil and gas wells 979Food services 473Wholesale trade businesses 376Architectural- engineering- and related services 334Retail Stores - Food and beverage 187Monetary authorities and depository credit intermediaries 205Transport by truck 198
Table 3 shows the top ten affected industries in terms of gross state product (or value added). In this case, the three related industries appear on top with the extraction of oil and natural gas industry in first place ($342.8 million). The three industries are followed by construction of other new nonresidential structures (pipeline construction) with $114.9 million, then by imputed rental activity for owners ($47.5 million), wholesale trade ($35.8 million), and real estate establishments ($20.8 million).
TABLE 3
Top Ten Industries Affected: By Gross State Product (Value Added, 2010)
IndustryGross State Product
(Value added)Extraction of oil and natural gas $342,797,662Drilling oil and gas wells $292,268,957Support activities for oil and gas operations $160,112,620Construct other new nonresidential structures $114,950,797Imputed rental activity for owner-occupied dwellings $47,469,066Wholesale trade businesses $35,789,988Real estate establishments $20,751,314Architectural- engineering- and related services $20,561,886Monetary authorities and depository credit intermediaries $19,807,793Legal services $16,638,613
Finally, Table 4 shows the top ten affected industries in terms of output (or revenues). It shows drilling oil and gas wells in first place ($848.2 million). The three industries are followed by construction of other new nonresidential structures (pipeline construction) with $280.0 million, imputed rental activity for

13
owners ($67.7 million) 20, wholesale trade ($53.1 million), and monetary authorities and depository credit intermediaries ($41.9million).
TABLE 4
Top Ten Industries Affected: By Output (2010)
Industry OutputDrilling oil and gas wells $848,162,429Extraction of oil and natural gas $593,103,334Support activities for oil and gas operations $451,753,688Construct other new nonresidential structures $280,000,001Imputed rental activity for owner-occupied dwellings $67,679,218Wholesale trade businesses $53,084,627Monetary authorities and depository credit intermediaries $41,972,558Architectural- engineering- and related services $37,079,873Food services and drinking places $30,349,670Commercial and industrial machinery and equipment $28,456,725
Extraction of oil and gas activities To estimate the impacts of the extraction activities of oil and gas, the sector with NAICS code 211 was chosen.21 In 2010, the oil and gas extraction firms in the Eagle Ford Shale had an estimated $721.9 million total impact in output (or revenues) and a gross state product (or value added) total impact close to $412.9 million. These activities supported a total of 2,137 full-time jobs. 22
TABLE 5
Economic ImpactsDirect Indirect Induced Total
Output $592,859,706 $76,210,429 $52,911,478 $721,981,614Employment 1,192 476 469 2,137Payroll $70,451,631 $19,751,972 $14,657,279 $104,860,883Gross State Product $342,656,852 $38,501,439 $31,807,906 $412,966,197
Estimated Extraction Operations Impact for Eagle Ford Shaleat the Regional Level (2010)
20 Imputed rental activity for owners estimates what owner/occupants would pay in rent if they rented rather than owned their homes (from IMPLAN manual, p. 229). Impacts on these sectors give an indication of the relationship between market activity and housing demand (from IMPLAN forum web site).
21 This sector has code 20 in IMPLAN. NAICS codes 211, 2111 and 21111 represent the same sectors and industries.
22 The methodology to obtain these results is explained in Appendix C.

14
Drilling and completion activities To estimate these impacts, the sectors drilling oil and gas wells (NAICS 213111) and support activities for oil and gas operations (NAICS 213112) were chosen.23 The total amount of dollars from these activities was divided among these two industries based on current data from the counties that benefit from the Barnett shale gas. In those areas the combined output of the two aforementioned sectors is the result of a 67 percent contribution from the drilling oil and gas wells, and 33 percent from the support activities for oil and gas operations.
For 2010, based on information from HPDI and the RRC of Texas, we estimated 241 completed wells that were drilled that same year. Of the 241 wells, 180 wells were horizontal and 61 were vertical. Drilling and completion costs were assumed to be $6.5 million for horizontal wells, and $1.5 million for vertical wells.24 Some sources would suggest lower costs (Wells Fargo Securities) 25 but information from industry representatives suggested a wider range of values. These activities had an estimated total impact close to $1.7 billion in output (or revenues) in 2010, $666.6 million in gross state product, and supported 6,125 full-time jobs.
TABLE 6
Economic ImpactsDirect Indirect Induced Total
Output $1,261,999,996 $236,078,166 $162,016,555 $1,660,094,717Employment 3,049 1,638 1,438 6,125Payroll $163,454,086 $63,584,569 $44,820,343 $271,858,997Gross State Product $438,943,172 $130,149,469 $97,534,846 $666,627,487
Estimated Drilling and Completion Impact for Eagle Ford Shaleat the Regional Level (2010)
23 These sectors have code 28 and 29 in IMPLAN.
24 Based on reports from different companies and information from members of the oil and gas industry. From HPDI, the total amount of active wells by September 2010 was 181, of these 135 were horizontal and 46 were vertical. To estimate the total for the year, it was assumed that double the amount of monthly wells from the previous nine months were completed in the last quarter of the year.
25 Wells Fargo Securities, Equity Research: In 2010, The Eagle Ford Shale Could Be It. March 9, 2010.

15
Lease payments Lease contracts in the region typically run for three years with a renewable two year option. This guarantees the owner of the mineral rights with income while also enables the drilling company the entire length of the agreement to yield production and begin paying royalties. These initial lease payments are typically reported to range from as little as $150 per acre to as high as $5,000 per acre26. Without specific data, such a wide range poses a significant problem in approximating the aggregate lease payments made for a specific year. Based on conversations with industry experts and public reports, we estimate that more than 4.6 million acres have been leased across the play27. Furthermore, we estimate that prior to 2010, close to 2.6 million acres may have already been leased28. Therefore to approximate the impact of lease payments, we estimated that close to 2.0 million acres were leased in 2010 alone. Based on information from industry officials, the price of $1,200 per acre seems to be a fair valuation for the area. Using the described parameters, we estimate the area enjoyed close to $2.4 billion in lease payments 29 in 2010.
One way to estimate the impacts of such large amount of money is to treat these lease payments not as income but as a sudden increase in wealth. 30 Following the study by Loren C. Scott, only five percent of the lease payments should be included in the impact analysis (this is called a “wealth effect”). Under this assumption, only $120.0 million are considered as expenditures in the area. Landowners receiving these payments also spend part of this money in other regions and pay income taxes. Therefore, these payments translate into only $78.6million in total output impact, $47.8 million in total gross state product, and support 697 jobs.
26 Different from a regular increase in income, these sudden increases in wealth are treated as “winning the lottery.” Some information can be found at http://eaglefordshaleblog.com
27 Enterprise Products Partners, Midwest Marketing June 28-29, 2010
28 Regency Energy Partners 2009 Annual Report
29 Some companies may report large quantities of acres been leased by them, but for the present report only the part that has been leased and completed in 2010 is been considered for the impact analysis.
30 Based on a study by Dr. Loren C. Scott & Associates (April 2010) Economic Impact of the Haynesville Shale on the Louisiana Economy, who used a study by Yash Mehra, Federal Reserve Bank of Richmond Quarterly Review, Spring 2001.

16
TABLE 7
Total Economic Impacts
Output $78,585,671Employment 697Payroll $21,722,558Gross State Product $47,787,273
Estimated Lease Payments Impact for Eagle Ford Shale
at the Regional Level (2010)
Royalties As previously stated, royalties were estimated at 20 percent of total revenues. This percentage represents close to $116.9 million in royalty payments to the landowners. Similar to the lease payments, these royalties are considered as having the same “wealth effect” as the lease payments. These royalties serve as an important source of income to the owners of mineral producing property. Approximately, $118.6 million in royalty payments were included in 2010. For the impact analysis, only five percent of that amount was spent the same year in the area. Because of these royalties the area enjoyed close to $3.8 million in total output impact and $2.3 million in total gross state product impact. These payments also supported 34 jobs.
TABLE 8
Economic Impacts
Total
Output $3,831,016
Employment 34
Payroll $1,058,965
Gross State Product $2,329,608
Estimated Royalty Payments Impact for Eagle Ford Shaleat the Regional Level (2010)
Midstream Development
Apart from the exploration and production activities associated with the Eagle Ford Shale, there were significant investments in the infrastructure necessary to process, store and transport the extracted oil, gas and condensate. This is commonly referred to as midstream development and includes the

17
acquisition of right-of-way acreage, pipeline construction, and other related infrastructural improvements related to the gathering and movement of the produced liquids.
In 2010, based on confidential information received by several energy partners in the region and adjusted to reflect publicly available expenditure information, it is estimated that $280 million was spent on midstream development. These investments had a $404.3 million output impact on the region, had $188.8 million gross state product impact, and supported 3,608 full-time jobs.
Table 9
Economic Impacts
Direct Indirect Induced Total
Output $280,000,000 $55,063,913 $69,231,067 $404,294,981
Employment 2,528 465 615 3,608
Payroll $77,025,937 $16,142,154 $19,147,922 $112,316,013
Gross State Product $114,950,797 $32,121,758 $41,689,776 $188,762,330
Estimated Midstream Development Impact for Eagle Ford Shaleat the Regional Level (2010)
Due to the lack of complete information, we recognize that this may be a conservative estimate of the actual midstream development activities in the region. However, we felt it an important component of calculating the economic activities of the region for 2010, and needed to be reflected in these estimates.
With over 130 miles of new pipeline activity including the continued development of the Chisholm, Dilley, Dos Hermanas, Leona, and Fox Creek pipelines, all indications are that over the next three to five years midstream activities will continue to play a significant role in the construction activities of the region. However, since this report focuses on estimating the economic impact of activities in 2010 and 2020 only, it is assumed that the infrastructure necessary to sustain future production will be completed prior to 2020. Therefore midstream development expenditures are only reflected in 2010 impact estimates.
Counties Apart from the county’s within which companies reported as having Eagle Ford Shale activity, several communities are expected to receive auxiliary benefits from the shale play primarily as a result of their proximity to those counties with active drilling. These include Bexar, Jim Wells, Victoria and Uvalde counties. For the purposes of this study, impacts relating to each of these counties are reported separately and are presented in the following sections.

18
Impacts on Bexar County in 2010
The impacts of the Eagle Ford Shale are not limited to the drilling sites. Given San Antonio’s proximity to the majority of shale play sites, Bexar County is likely to have a significant role in staging exploration, production and other related activities.31 Two companies, EOG Resources and Chesapeake Energy, have already opened satellite offices and hired 120 and 50 employees, respectively32. Table 10 shows the estimated impacts of the shale on Bexar County By 2010, it is estimated that 590 jobs are been supported by the Eagle Ford Shale. These jobs are indirect because they are from suppliers to the main firms working in the shale.
TABLE 10
Economic ImpactsDirect Indirect Induced Total
Output $0 $65,828,923 $38,000,993 $103,829,916Employment 0 332 258 590Payroll $0 $17,436,361 $10,813,466 $28,249,827Gross State Product $0 $35,410,363 $22,561,849 $57,972,212
Estimated Impacts of the Eagle Ford Shaleon Bexar County (2010)
Bexar will benefit from its proximity to the shale with close to $103.8 million in total output impacts, around $57.9 million in total gross state product impacts, and close to $28.2 million in payroll.
Impacts on Jim Wells County in 2010
The impacts of the Eagle Ford Shale also affect other surrounding counties, like Jim Wells. Table 11 shows the estimated impacts of the shale on this County. By 2010, it is estimated that 86 jobs are been supported by the Eagle Ford Shale. The shale also has an impact of $15.9 million in output and close to $6.5 million contributions to the gross state product.
31 Based on information from HPDI, in the year ending on September 31, 2010, more than 94 percent of the liquids produced in the shale came from counties closer to Bexar than to other larger economic areas (for example, Austin or Houston). Furthermore, more than 99 percent of the gas extracted came from counties located closer to Bexar than to other major areas.
32 Houston Chronicle article “Alamo City or Energy City? Shale boosts San Antonio” December 29, 2010

19
TABLE 11
Economic ImpactsDirect Indirect Induced Total
Output $0 $13,978,775 $1,959,427 $15,938,202Employment 0 68 18 86Payroll $0 $4,196,059 $544,441 $4,740,500Gross State Product $0 $5,379,061 $1,157,146 $6,536,207
Estimated Impacts of the Eagle Ford Shaleon Jim Wells County (2010)
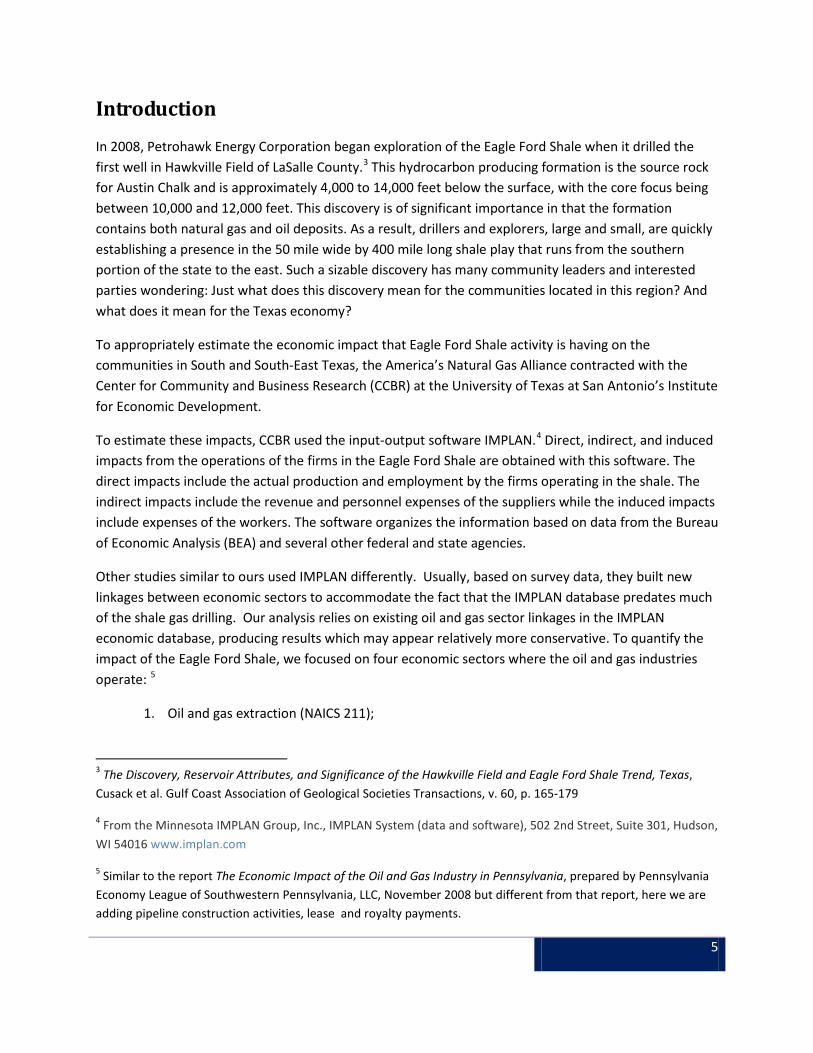
Impacts on Uvalde and Victoria Counties in 2010
Similarly, the counties of Uvalde and Victoria are going to benefit from the Eagle Ford Shale activities but not as much as in the previous cases. By 2010, it is estimated that Uvalde benefited with 9 full-time jobs and Victoria with 12 full-time jobs as a result of the shale activities. In terms of output, Uvalde benefited with $1.3 million and Victoria with $2.1 million.
TABLE 12
Economic ImpactsDirect Indirect Induced Total
Output $0 $961,937 $299,896 $1,261,833Employment 0 6 3 9Payroll $0 $277,965 $84,294 $362,259Gross State Product $0 $533,494 $174,623 $708,117
Estimated Impacts of the Eagle Ford Shaleon Uvalde County (2010)
The impacts also translate into payroll dollars that ultimately will create more revenues for local businesses. Payroll for Uvalde is close to $362.3 thousand and for Victoria is close to $511.6 thousand.
20
TABLE 13
Economic ImpactsDirect Indirect Induced Total
Output $0 $1,550,653 $532,068 $2,082,721Employment 0 7 4 12Payroll $0 $359,156 $152,429 $511,584Gross State Product $0 $738,614 $322,897 $1,061,511
Estimated Impacts of the Eagle Ford Shaleon Victoria County (2010)
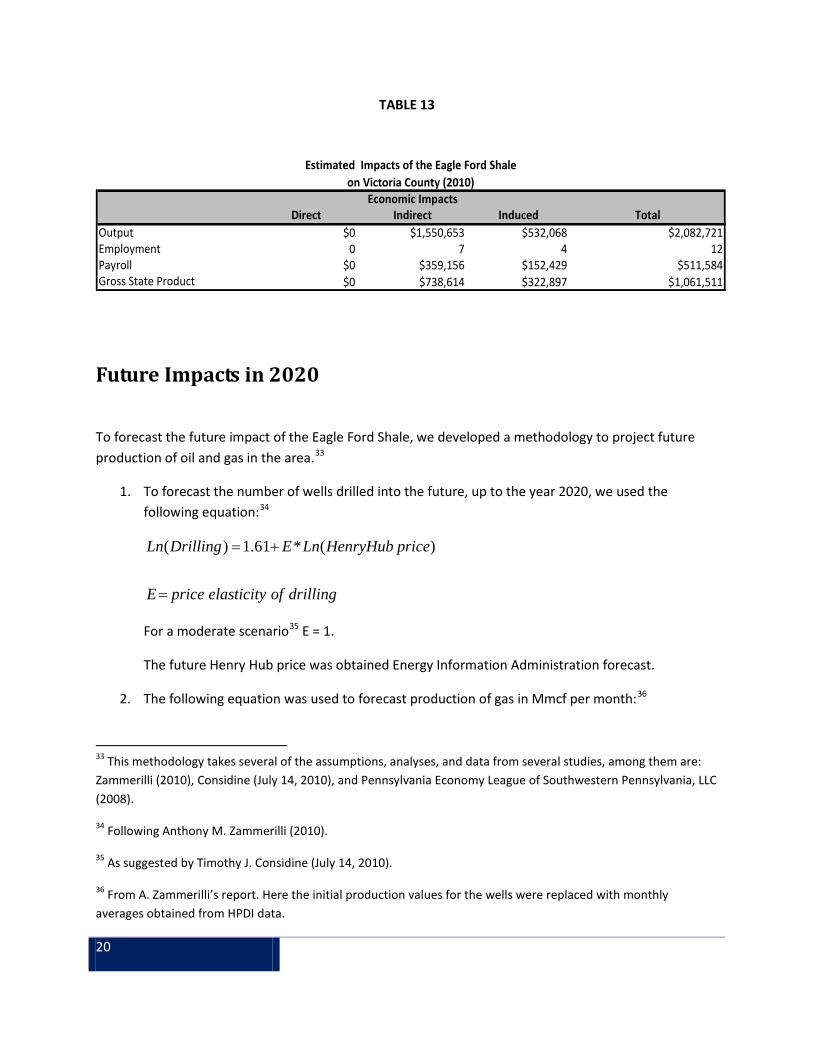
Future Impacts in 2020
To forecast the future impact of the Eagle Ford Shale, we developed a methodology to project future production of oil and gas in the area.33
1. To forecast the number of wells drilled into the future, up to the year 2020, we used the following equation:34
drillingofelasticitypriceE
priceHenryHubLnEDrillingLn
=
+= )(*61.1)(
For a moderate scenario35 E = 1.
The future Henry Hub price was obtained Energy Information Administration forecast.
2. The following equation was used to forecast production of gas in Mmcf per month:36
33 This methodology takes several of the assumptions, analyses, and data from several studies, among them are: Zammerilli (2010), Considine (July 14, 2010), and Pennsylvania Economy League of Southwestern Pennsylvania, LLC (2008).
34 Following Anthony M. Zammerilli (2010).
35 As suggested by Timothy J. Considine (July 14, 2010).
36 From A. Zammerilli’s report. Here the initial production values for the wells were replaced with monthly averages obtained from HPDI data.

21
585.0*644.72)( −= ttF Monthly Mmcf for horizontal wells;
The average for daily production is 2.421 Mmcf for horizontal wells.
3. The future production of condensate and casing head gas were kept as a proportion 37 for each mcf of gas production according to 2010 data from the Railroad Commission of Texas.
4. Prices were obtained from the Energy Information Administration.
5. We forecasted the amount of oil produced by an average well, and the number of new wells to be completed in the future.38 These calculations allowed us to make a forecast of future production of oil in the shale.
We forecast 4,890 new wells completed between 2010 and 2020. We have assumed that all of them are horizontal but some of them are for gas and others for oil production (Table 14).
TABLE 14
Forecasted Oil and Gas New Wells (2010-2020)
Year Total new wells Gas new wells Oil new wells
2010 241 98 1432011 408 102 3052012 429 113 3162013 441 114 3272014 451 115 3362015 463 120 3422016 474 125 3492017 482 127 3552018 492 131 3612019 501 134 3662020 511 140 371
4,890 1,319 3,571
37 This relationship gave a moderate forecast for the future gas activities in the Eagle shale when compared with the Barnett shale future projections.
38 Using information from another shale as a reference for predicting future oil activity, we depicted a probable production profile of an oil well in the Eagle shale and forecasted production for the whole area. See Appendix D for an explanation of this methodology.

22
Using the assumptions mentioned earlier, by the year 2020 we estimate a production of 111 million bbls of oil and 1.1 billion cubic feet of gas by that year (Table 15).
TABLE 15
Forecasted Oil and Gas Production From
New Wells (2010-2020)
Year
Oil production in
Bbls
Gas Production in
Mmcf
2010 2,127,465 64,4742011 8,673,576 117,4522012 18,485,377 186,5382013 29,225,609 267,7872014 40,296,983 359,5472015 51,639,932 462,3502016 63,217,045 575,6852017 75,010,869 698,6602018 87,012,134 831,1442019 99,201,449 973,1602020 111,556,708 1,125,227
Combined future impacts of the Eagle Ford shale Future impacts will also include oil and gas extraction, oil and gas drilling and completion, royalties, and lease payments. The combined total impacts are shown in Table 10, which summarizes the impacts of the Eagle Ford Shale in the area for the year 2020 (in 2010 dollars):
a. Close to $21.5 billion in total economic output (or revenues) impact;
b. Supports close to 67,971 full-time jobs in the area;
c. Close to $3.2 billion in salaries and benefits paid to workers;
d. More than $11.6 billion of gross state product (or value added);
e. Close to $1.1 billion in State revenues including $780.8 million in severance taxes;

23
f. More than $450.6 million in local government revenues.
These results are presented in 2010 dollars to facilitate the comparison with current activities.
TABLE 16
Economic Impacts
Direct Indirect Induced Total
Output $17,333,839,302 $2,422,467,380 $1,828,629,981 $21,584,936,663
Employment 36,193 15,560 16,218 67,971
Payroll $2,095,314,529 $634,156,313 $506,308,043 $3,235,778,886
Gross State Product $9,254,496,960 $1,252,453,785 $1,100,702,663 $11,607,653,408
$450,603,252
$1,162,518,476Estimated State Revenue incl. severance taxes
Estimated Local Revenues
Estimated Combined Impacts for Eagle Ford Shaleat the Regional Level (2020) in 2010 dollars
The direct output impact corresponds to the sum of extraction of oil and gas, and drilling and completion activities. For this scenario, the direct dollar value of extraction of oil and gas 39 is estimated at close to $14.0 billion by 2020 (in 2010 dollars). The direct dollar value of drilling and completion activities is estimated to be $3.3 billion by 2020 (in 2010 dollars). The combined output of these two activities is close to $17.3 billion (as shown as direct impacts for output in Table 16). On the other hand, royalty payments close to $2.8 billion add more impacts to the area in the form of induced effects (also included in Table 16). The State receives close to $780.8 million in severance taxes, already included in the amount shown in the table. 40
Future Impacts in Counties
By 2020, it is expected that Bexar, Jim Wells, Victoria and Uvalde counties will continue to benefit from their proximity to those counties with active drilling. These impacts are reported separately and are as follows:
39 Appendix E shows forecasted production of gas, oil, condensate, and casing head gas, together with prices for oil and gas. It also shows the impact by type of activity.
40 See Appendix E for more detail on these impacts.

24
Future Impacts on Bexar County
As with the 2010 impacts, in the year 2020, Bexar County will be positively impacted by the activities in the Eagle Ford shale. Table 17 summarizes these impacts.
TABLE 17
Economic ImpactsDirect Indirect Induced Total
Output $0 $456,480,795 $246,475,565 $702,956,360Employment 0 2,208 1,716 3,924Payroll $0 $120,470,667 $70,379,040 $190,849,707Gross State Product $0 $247,418,152 $147,095,734 $394,513,886
Estimated Impacts for Eagle Ford Shaleon Bexar County (2020)
Future impacts on Jim Wells County in 2020
Similar to the 2010 impacts, surrounding counties will benefit from the shale activities. Among the counties selected, Jim Wells shows important indirect effects that by 2020 will support 1,334 full-time jobs, close to $239.3 million in output, around $97.5 million contributions to the gross state product, and close to $73.8 million in payroll payments (Table 18).
TABLE 18
Economic ImpactsDirect Indirect Induced Total
Output $0 $210,157,524 $29,159,510 $239,317,034Employment 0 1,057 277 1,334Payroll $0 $65,669,257 $8,178,652 $73,847,909Gross State Product $0 $80,256,303 $17,282,503 $97,538,806
Estimated Impacts of the Eagle Ford Shaleon Jim Wells County(2020)
Future impacts on Uvalde and Victoria Counties in 2020
Similar to the 2010 impacts, the counties of Uvalde and Victoria are going to benefit from the Eagle Ford Shale but not as much as in the previous cases. By 2020, it is estimated that the positive impacts will increase for both: Uvalde will benefit with 47 full-time jobs and Victoria with 57 full-time jobs as a result

25
of the shale activities. In terms of output, using 2010 dollars, Uvalde benefits with $7.1 million and Victoria with $9.4 million.
TABLE 19
Economic ImpactsDirect Indirect Induced Total
Output $0 $5,463,726 $1,632,800 $7,096,526Employment 0 31 15 47Payroll $0 $1,468,450 $456,491 $1,924,941Gross State Product $0 $2,892,598 $952,009 $3,844,606
Estimated Impacts of the Eagle Ford Shaleon Uvalde County(2020)
On the other hand, gross state products contributions from both counties will reach $3.8 million and $5.0 million for Uvalde and Victoria counties, respectively. This is related to payrolls of $1.9 million for Uvalde and $2.4 million for Victoria.
TABLE 20
Economic ImpactsDirect Indirect Induced Total
Output $0 $6,876,206 $2,569,262 $9,445,468Employment 0 35 21 57Payroll $0 $1,682,600 $736,579 $2,419,179Gross State Product $0 $3,439,410 $1,557,044 $4,996,454
Estimated Impacts of the Eagle Ford Shaleon Victoria County(2020)
Discussion Since its initial discovery in 2008, activity related to the Eagle Ford Shale has grown exponentially. All indications are that there still remains an enormous potential to continue this meteoric growth through 2011. There are, however, some external limitations which could slow the rate of activity and should be noted. First, the level of activity is directly dependent on the price of oil and gas. Severe reductions in the market price of oil and gas could impact the operators’ profitability and likely reduce the rate of growth of production. On the other hand, the diversity of the play and a lower reported breakeven point seems to indicate that the Eagle Ford Shale activity may be more resilient to natural gas prices as compared to other shale plays because of its oil and condensate production.

26
Another potentially limiting factor relates to the availability of suitable water. The fracture stimulation (frac) process enables the gas to be extracted from the very low permeable shale. Fracturing or fracking the shale requires a large amount of water. Each horizontal well is said to require between 5 and 6 million gallons of water. When coupled by the expectation that an increase in activity will also lead to an increase in demand for other residential and commercial goods and services (i.e. hotels, restaurants, real estate, etc.), there is some concern that the rate of gas production may be hindered by the lack of available suitable water.41 It remains unclear as to whether (1) there is available freshwater in the Carrizo-Wilcox Aquifer to meet all fracking needs, (2) the proportion of water needs that can be met by surface water or other groundwater sources, and (3) other water sources including brackish water and recycled water can be obtained and used in significant quantities. Such an analysis is beyond the scope of this report. However, the economic impact when compared to alternative agricultural usage does appear to be greater for the individual landowner. When compared to certain agricultural activity, a royalty payment of 25 percent has the potential to yield $520,000 per acre-foot of water for the landowners as opposed to $250 per acre-foot of irrigation water.42 Nevertheless, the potential limitation in water may ultimately hinder the projected rate of oil and gas production thus imposing in internal limitation in the economic analysis for the year 2020. Should an environmental assessment be performed, it must consider (1) a range of projected withdrawals that has an upper bound of the amount of water needed for maximizing oil and gas production, (2) whether the source of waters (i.e. freshwater or brackish water, surface water or groundwater, as well as the specific aquifer), and (3) how much water can be recycled.
Finally, apart from the availability of water, there also appears to be discussion regarding the supply of skilled labor and construction materials. For example, several companies throughout the industry are struggling to receive an adequate supply of proppant (resin-coated sand). However, in other regions of the state several companies such as Chesapeake Energy and Devon Energy have aggressively promoted internships and job training programs to entice unemployed and underemployed area residents to pursue employment in the oil and gas industry43.
Despite these limitations, analysts, investors and industry experts agree that due to a high reservoir quality, the Eagle Ford Shale will likely become a premiere oil and gas play in 2011. When you consider that the Eagle Ford did not appear on "shale gas resource" maps two years ago, the 2009 impacts of the shale are extremely noteworthy. As best practices for drilling and completion are continually being discovered and thus lead to increased reserves/production), the internal limitations that may affect 2020 oil, condensate, and gas production levels may be offset by improvements in the production process. In any event, the Eagle Ford Shale is not a blanket reservoir. The production capabilities are not
41 Ritter, S., Nicot, J., and Hebel, A., Water Requirements for Texas Shale Gas Industry: Will We Meet Projected Needs? The University of Texas at Austin
42Brownlow, D., Eagle Ford Shale Play and the Carrizo Aquifer, Fountainhead, Q4 2010
43 Barnet Shale Job Training and Internships, Star-Telegram July 8, 2008

27
distributed equally across its extent. There are 'sweet spots' where wells are extremely economic, and areas where wells are marginal at best. Only a significant amount of drilling and mapping will reveal the true nature of the Eagle Ford Shale. Regardless, high yield condensate and a favorable business climate are very attractive to individual operators and are likely to play a key role in spurring economic development and contributing to the economic prosperity of the region.

28
APPENDIX A
From January through September, there were 293 active wells, of which 239 were horizontal and 54 were vertical. Not all of the active wells were drilled and completed in 2010; some were completed in earlier years.
gas wells horizontal vertical121 118 3
2 0 21 0 1
Subtotal 124 118 6
oil wells horizontal vertical142 98 44
22 20 25 3 2
Subtotal 169 121 48
Total 293 239 54
AMOUNT OF ACTIVE WELLS PRODUCING IN EAGLE FORD SHALE (Jan-Sept 2010)
Source: HPDI
Based on this information, assuming that the new 2010 wells were drilled and completed the same year, we calculated the number of wells drilled and completed during the period January-September 2010.
Drilled and completed in 2010 (Jan-Sept) horizontal vertical
181 135 46
Assuming that in the last quarter of 2010 the rate of completion doubles with respect to previous quarters, we calculated that by the end of 2010 there are 45 new horizontal and 15 vertical wells drilled and completed. Therefore, we estimate that 241 wells were completed in 2010, of which 180 were horizontal and 61 were vertical.
Of the 241 wells completed in 2010, 143 were oil wells and 98 were gas wells.

29
APPENDIX B
This list is from the Texas Railroad Commission (RRC): 44
COUNTIES IN REGION RRCT territory
ATASCOSA District 1BEE District 2BRAZOS District 3BURLESON District 3DE WITT District 2DIMMIT District 1EDWARDS District 1FRIO District 1GONZALES District 1GRIMES District 3HOUSTON District 6KARNES District 2LA SALLE District 1LAVACA District 2LEE District 3LEON District 5LIVE OAK District 2MAVERICK District 1MCMULLEN District 1MILAM District 1WEBB District 4WOOD District 6WILSON District 1ZAVALA District 1
44 From RRC web site at http://www.rrc.state.tx.us/eagleford/index.php; taken on December 9, 2010.

30
From the Bureau of Economic Analysis (BEA) regional economic information system (REIS) for 2008 we obtained the following table:
County
Personal income
thousand of dollars
2008Population
2008
Per capita Personal income
2008
Atascosa $1,194,562 43,925 $27,195Bee $699,577 32,325 $21,642Brazos $4,807,959 174,864 $27,495Burleson $519,279 16,566 $31,346Dewitt $569,485 19,626 $29,017Dimmit $231,067 9,739 $23,726Edwards $47,864 1,944 $24,621Frio $358,751 16,138 $22,230Gonzales $530,154 19,498 $27,190Grimes $690,291 25,946 $26,605Houston $614,325 22,531 $27,266Karnes $329,385 15,076 $21,848La Salle $133,573 5,818 $22,959Lavaca $623,325 18,539 $33,622Lee $530,623 16,224 $32,706Leon $511,002 16,843 $30,339Live Oak $303,317 11,201 $27,079Mcmullen $26,289 840 $31,296Maverick $968,658 51,833 $18,688Milam $707,761 24,846 $28,486Webb $5,386,686 235,937 $22,831Wilson $1,246,392 40,350 $30,890Wood $1,179,352 42,757 $27,583Zavala $195,727 11,729 $16,687
$22,405,404 875,095 $25,603

31
APPENDIX C
For 2010, based on the Railroad Commission of Texas (RRCT), up to September of 2010, production of gas, oil, condensates, and casing head is presented in the following table:45
Actual Production for first 9 months
OIL GAS CONDENSATE CASINGHEAD1,595,599 48,355,441 2,321,959 1,912,324
Bbls Mcf Bbls Mcf
To estimate production for the whole year, it was assumed that the last three months will show double the monthly production of the previous nine months:
Estimated Production for 2010
OIL GAS CONDENSATE CASINGHEAD2,127,465 62,778,891 2,896,000 2,549,765
Bbls Mcf Bbls Mcf
Based on information from the Average prices for 2010, where the price of condensate has been assumed at 57 percent the price of oil:46
OIL GAS CONDENSATE CASINGHEAD$72.42 $4.64 $41.28 $4.64
Bbls Mcf Bbls Mcf
Production in dollars for 2010, for a combined total of $584,994,772:
OIL GAS CONDENSATE CASINGHEAD$154,071,039 $291,294,055 $127,798,766 $11,830,911
45 From RRC web site at http://webapps.rrc.state.tx.us/DP/initializePublicQueryAction.do
46 From EIA web site at http://www.eia.gov/dnav/ng/ng_pri_sum_dcu_nus_m.htm. “Average 2009 propane spot
prices at Mt.Belvieu were 43 percent below the cost of the West Texas Intermediate (WTI) marker crude oil price when measured in dollars per barrel.” Taken from 2010 Propane Market Outlook from the Propane Education and Research Council at : http://www.propanecouncil.org/uploadedFiles/Ad/2010_Propane_Market_Outlook_Final.pdf

32
APPENDIX D
The Bakken shale covers parts of North Dakota and Montana in the United States. Since the mid 1970s, the area has been known as having important oil reserves but the technology to obtain the resource has not been economically available until recently.
Bakken Shale Historical Oil Production, 2007-2009
Year Oil in bblsNumber of wells
Calculated number of new wells
Calculated bbls per
well2007 7,382,025 457 457 16,1532008 27,233,329 881 424 30,9122009 49,293,744 1341 460 36,759
Source: North Dakota Industrial Commission, Department of Mineral Resources, Oil and Gas Division web site.
The shale has become one of the more important sources of oil in North Dakota, and its growth has been fast and large. Because of the characteristics of the technology, both with “shale oil,” the Bakken statistics could help in offering some hints of future production in the Eagle Ford shale. The previous table shows not only an important increase in the production of oil but also shows that from year to year the number of new wells has not varied much from the low to mid 400s. It also shows that the average bbls of oil per well has increased over the years. This fact allows us to use a plausible profile of the oil production in the Bakken shale.
As depicted in the following figure, 47 usually production of oil in giant fields follows a profile with rapid first years of increase in the production per field (the buildup segment in the graph), followed by a peak production that initiates a plateau for several years. After a period, a decline process begins up to the abandonment of the field. The specific periods for each stage vary per field but usually takes years from one stage to the other.
47 From The Evolution of Giant Oil Field Production Behavior by Mikael Hook, Bengt Soderbergh, Kristofer Jakobsson, and Kjell Aleklet, from Natural Resources Research, Vol. 18, No. 1, March 2009 (_ 2009) DOI: 10.1007/s11053-009-9087-z. online version

33
Source: Taken from The Evolution of Giant Oil Field Production Behavior by Mikael Hook, Bengt Soderbergh, Kristofer Jakobsson, and Kjell Aleklet, from Natural Resources Research, Vol. 18, No. 1, March 2009 (_ 2009) DOI: 10.1007/s11053-009-9087-z. online version
Assuming a plausible profile for the first three years of production in the Bakken shale the production would show that based on a vintage definition, the wells would begin producing 16,153 bbls in the first year, then 44,605 bbls in the second year, and finally 50,221 in the third year, after that we could assume that the field reaches its peak and therefore the plateau stage begins. All of these numbers are consistent with the historic data, as shown in the following table:
Assumed buildup stage in the Bakken shale
Increase in bbls per
wellNumber of new wells
Calculated oil bbls per
well
12.59% 457 50,221176.14% 424 44,605
460 16,153
Based on data from 2010, assumed to be a first year of production for the Eagle Ford shale, we developed a table showing a plausible production profile for the oil wells in the Eagle Ford shale. In order to avoid overestimating the production per well, different from the increase for the second year in the Bakken shale, shown in the previous table as 176.14 percent, in the case of the Eagle Ford shale we assumed only a 107.11 percent increase, from 14,416 bbls to 29,857 bbls. For the third year, there is an

34
increase of 12.59 percent, and after that the well is assumed to reach its peak and begin a plateau stage, as shown in the following table:
Assumed build-up stage in the
Eagle Ford shale
YearBbls per
well
1 14,4162 29,8573 33,6164 33,6165 33,6166 33,6167 33,6168 33,6169 33,616
10 33,61611 33,616
The production profile for the Eagle Ford shale wells is depicted in the following figure:
0
5,000
10,000
15,000
20,000
25,000
30,000
35,000
40,000
1 2 3 4 5 6 7 8 9 10 11
The decline stage usually takes several years and it is assumed not to affect our time horizon.

35
APPENDIX E
Production from the forecasted wells is shown in the following table:
YearGas Production
(thousands Mcf)Casinghead
(thousands Mcf)Oil (thousands
Bbls)Condensate
(thousands Bbls)
2011 117,451.895 4,644.898 8,673.576 5,639.8722012 186,537.555 7,377.045 18,485.377 8,957.2662013 267,786.558 10,590.218 29,225.609 12,858.7272014 359,547.220 14,219.098 40,296.983 17,264.9422015 462,349.958 18,284.663 51,639.932 22,201.3832016 575,685.467 22,766.769 63,217.045 27,643.5912017 698,659.685 27,630.059 75,010.869 33,548.6372018 831,144.253 32,869.457 87,012.134 39,910.3562019 973,160.095 38,485.791 99,201.449 46,729.7542020 1,125,226.589 44,499.601 111,556.708 54,031.769
Production of gas and oil is transformed into revenues by multiplying the production values by the forecasted prices given in the following table:48
Year Henry hub pricePrice of crude oil per
bbl2010 $4.64 $72.422011 $5.93 $76.252012 $6.53 $84.052013 $6.60 $92.362014 $6.67 $99.612015 $6.99 $105.332016 $7.23 $111.432017 $7.38 $116.952018 $7.57 $122.862019 $7.80 $127.602020 $8.11 $132.33
48 From EIA at web site at http://www.eia.doe.gov/oiaf/forecasting.html. “All long-term forecasts are stated in terms on
constant dollars, to depict trends across time. These prices are imported refiner acquisition costs, rather than West Texas Intermediate.” http://www.globalsecurity.org/military/intro/oil.htm

36
The following four tables show the future impacts of extraction of oil and gas, drilling and completion activities, and royalties for the year 2020, in 2010 dollars.
Economic ImpactsDirect Indirect Induced Total
Output $14,014,403,633 $1,801,511,472 $1,250,755,944 $17,066,671,049Employment 28,562 11,820 12,566 52,948Payroll $1,665,381,613 $466,909,955 $346,478,304 $2,478,769,873Gross State Product $8,099,945,788 $910,121,917 $751,895,973 $9,761,963,678
Estimated Extraction Operations Impact for Eagle Ford Shaleat the Regional Level (2020) in 2010 dollars
Economic ImpactsDirect Indirect Induced Total
Output $3,319,435,670 $620,955,908 $426,151,701 $4,366,543,279Employment 8,131 4,610 4,289 17,030Payroll $429,932,916 $167,246,358 $117,890,831 $715,070,104
Gross State Product $1,154,551,172 $342,331,868 $256,545,638 $1,753,428,678
Estimated Drilling Impact for Eagle Ford Shaleat the Regional Level (2020) in 2010 dollars
Economic ImpactsDirect Indirect Induced Total
Output $0 $0 $151,722,335 $151,722,335Employment 0 0 1,528 1,528Payroll $0 $0 $41,938,908 $41,938,908Gross State Product $0 $0 $92,261,052 $92,261,052
Estimated Royalty Payments Impact for Eagle Ford Shaleat the Regional Level (2020) in 2010 dollars

37
-This Page Intentionally Left Blank-

38
-This Page Intentionally Left Blank-

39
About the Center for Community and Business Research
The Center for Community and Business Research (CCBR) is one of ten centers within the University of Texas at San Antonio’s Institute for Economic Development. Each center is specifically designed to address different economic, community, and small to medium sized business development needs. CCBR conducts regional evaluation, assessment, and long-term applied research on issues related to community and business development.
CCBR serves the needs of economic development agencies, workforce development boards, businesses, associations, city, state and federal governments and other community stakeholders in search of information to make better informed decisions.
CCBR develops, conducts, and reports on research projects that shed light on how organizations, communities, or the economy work. This is done through the use of various techniques including, but not limited to:
· Economic impact analyses · Feasibility studies · Surveys of business and community organizations · Analysis of secondary data · Report writing and presentation
For more information about CCBR or the Institute for Economic Development, please contact (210) 458-2020.
The mission of the Institute for Economic Development is to provide ongoing consulting, training, technical, research and information services in tandem with University-based assets and resources and other state, federal and local agencies, to facilitate economic, community and business development throughout South Texas and the Border Region.
Working together to build the economy one business at a time.

40