economic impact of the tax cap 3 - uaa institute of … economic effects of the tax cap 2 of 23 •...
TRANSCRIPT

10/10/00 Economic Effects of the Tax Cap 1 of 23
ECONOMIC EFFECTS OF THE TAX CAP &
POSSIBLE FISCAL RESPONSES
Scott Goldsmith and Alexandra Hill Institute of Social and Economic Research
University of Alaska Anchorage October 10, 2000
PART 1. ECONOMIC EFFECTS OF THE TAX CAP
SUMMARY Passage of the tax cap would result in a substantial shift in purchasing power away from local government toward households, the federal government, state government, certain businesses, and non-residents. It would reduce the cost of owning property and impact the price of real estate. It would change the way local government finances public services. It would change the quality of life.
The shift in purchasing power would result in a loss in jobs that would only be recouped after many years. Initially total household income will also fall, but after a few years it would be higher. The average household would see an increase in its discretionary income, but the total number of households would fall. The average property tax bill would fall, but the private cost of owning property might increase. The price of real estate could be higher or lower. Homeowners who stay in their homes would enjoy a tax break compared to their more mobile neighbors. Local governments would become more imaginative in funding capital and operating expenditures. The change in the quality of life could stimulate or retard economic growth and development.
Whether one views these economic changes as positive or negative depends on the perspective of the viewer. Clearly the tax cap would have far reaching economic effects that should be carefully considered before deciding whether it would be good or bad for the economy.
A. JOBS Several factors are important for understanding why job loss would result from imposition of the tax cap.

10/10/00 Economic Effects of the Tax Cap 2 of 23
• About $0.20 of every dollar of reduced taxes would go to the federal government, rather than staying in Alaska’s economy;
• The employment multiplier is typically higher for a dollar of public spending compared to household spending. This is because a high proportion of government spending goes to pay salaries, and less to purchase goods manufactured outside the state. Thus, there is generally a net loss from shifting spending from local governments to households.
• The tax cap would almost immediately eliminate virtually all local government spending for capital projects. Households would not see a comparable increase in their purchasing power from this cut until the grandfathered debt service has been paid off.
In the first year of a statewide 10 mill tax cap, local government operating budgets would be cut about $137 million and in the first few years capital construction would be cut about $179 million. Private sector purchasing power would increase by about $109 million in that first year. The net effect of these changes in dollar flows would be a statewide loss of 3,564 jobs in the first few years—1,641 in the public sector and 1,923 in the private sector. Over time the loss would diminish as the tax revenue from grandfathered debt service was freed up for additional private spending. Eventually the job loss would fall to 1,863.
Although the North Slope Borough has only one percent of the population in communities with bonded debt, it carries about 40 percent of the total local bonded debt in the state that would be grandfathered under the tax cap. North Slope Borough debt will tend to dominate the state average and obscure the analysis for communities with most of the state’s residents. Therefore, we present our job loss data both statewide and excluding the North Slope Borough. Excluding the North Slope Borough, the net early year job loss would be 1,556 which would eventually become a job gain of 66 after many years.1 Table 1 summarizes the statewide job ga ins and losses. Table 2, at the end of this section, shows the net job effect by community for communities affected by the tax cap. Table 3., at the end of this paper, has a more detailed analysis.
Table 1. Job Impact of the 10 Mill Tax Cap
Alaska Total Alaska net of
NSB Jobs Lost from reduced government spending
Local Govt Personnel 1,641 1,215 Local Govt Procurement 273 202 Construction 893 252
1 This result depends upon the state redistributing its additional petroleum property tax revenues as a cash payment to households. See the discussion below.

10/10/00 Economic Effects of the Tax Cap 3 of 23
Support 1,850 961 Total Job Loss 4,657 2,631
Job Gain from increased household spending Early Years 1,094 1,075 Out Years 2,795 2,697
Net Job Losses Early Years 3,564 1,556 Out Years 1,863 (66)
JOB LOSS FROM REDUCED PUBLIC SPENDING The tax cap would result in a loss of 4,657 jobs as local governments were forced to cut their operating budgets for personnel and procurement spending and reduce their capital expenditures.
Local Government Jobs—Delivering local government services—education, police and fire protection, road maintenance, etc.—is labor intensive. About 75 cents of every dollar of local government spending goes into salaries and benefits. Consequently it is inconceivable that a 40 to 60 percent reduction in property tax revenues would not lead to layoffs of local government workers.
Since many local government workers are union members, cutting wage rates and benefits in the short run is not an option. In the long run savings might be realized in this way, but the law of supply and demand dictates that if the wage offered to public employees falls, the quality of the labor force attracted to those jobs also falls. Rural Alaska school districts are already faced with the problem of hiring teachers in competition with districts Outside that are able to offer more attractive wage and benefits packages.
If 75 percent of the budget cuts fell on local government workers, 1,641 public employees would lose their jobs. Most of these workers, highly educated and experienced, would leave the state since they would likely be able to find more attractive employment opportunities Outside the state. Within Alaska most employment growth in recent years has been in the relatively low wage trade and service sectors.
Local Government Procurement—The remaining 25 percent of local government operating budgets pays for the procurement of goods and services from private businesses. Examples include the Anchorage School District contract for bus service. A reduction here means the loss of private sector employment of 273 jobs mostly among contract services and goods providers.

10/10/00 Economic Effects of the Tax Cap 4 of 23
Some of these workers would be able to find other employment in the economy, but some in highly specialized positions would not and would also leave the state.
Construction Jobs—The tax cap initiative would force debt service payments for new construction to fall within the 10 mill cap. In communities now above or at 10 mills for operations, debt service for any new bonds would have to compete with operations expenditures for funding. For those communities, this means that capital spending funded by local general obligation bonds would essentially disappear.
We estimate the loss of construction spending from the tax cap based on the level of spending the current debt load would support. After accounting for interest and inflation, about $179 million in construction spending annually would be lost in the first few years of the cap2.
The direct employment effect of the loss of this construction spending would be 893 jobs. Although these workers are likely to be able to find work elsewhere within the economy, they will take jobs tha t otherwise would have gone to 893 other workers, Alaskans and non-residents.
The Economic Multiplier –The loss of government and private construction and procurement jobs will have a multiplier effect in other sectors of the economy. About 1,850 additional jobs would be lost, mostly in the support industries of trade, services, and finance. The multiplier jobs loss comes from the loss of purchasing power associated with the direct loss of 2,807 relatively high paying jobs attributable to the budget cuts.
The job losses from procurement and construction spending reductions and the economic multiplier will not be limited to the communities where public spending is reduced. Rather they will be concentrated in urban Alaska. For example Anchorage, as the trade and service center of the state, will share some of the job losses attributable to reduced spending in the North Slope Borough.
JOB GAIN FROM REDUCED TAX BURDEN Gain in Discretionary Income--Private purchasing power in Alaskan communities would increase $109 million in the first year of a statewide 10 mill cap. The private purchasing power gain is only about 80 cents for each $1 of tax reduction. This is primarily because many property owners can deduct property tax payments from their 2 Some construction spending would carry over into the first years of the cap as communities spent the proceeds of bonds already issued. If the tax cap passes in November, some communities may choose to issue bonds before January 1, 2001, since their debt service would be grandfathered—allowed above the 10 mill cap.

10/10/00 Economic Effects of the Tax Cap 5 of 23
taxable federal income, paying from $0.15 to $0.33 less in federal taxes for each dollar of property tax paid. In addition, visitors to Alaska would take some of the savings through lower prices due to reduced property taxes on businesses. Stockholders of businesses that sell in world markets (so price isn’t affected by local Alaska conditions) would also see some of the tax savings, as costs for those businesses decline, and profits rise.
Over time the increase in discretionary income would grow as grandfathered debt service was retired and the taxes used to pay that debt service got passed onto households as lower tax bills. Eventually the direct discretionary income gain would be $280 million.
This discretionary income adds to private sector purchasing power but it does not directly create any jobs in the economy. Jobs are created only when the additional purchasing power is actually spent within the economy.
The Economic Multiplier --When this additional discretionary income is spent it creates jobs in the economy, mostly in trade and services. In the first year 1,094 jobs would be added. When all grandfathered debt service was paid off the discretionary income would produce 2,795 jobs.
The job gains from discretionary income spending would not all be created in the communities where the tax cuts occur. As with job losses, Anchorage would experience some of the job gains attributable to spending in other communities because it is the trade, service, and construction center for much of the state.
Table 2. Net Job Losses by Community
Early Years Out Years Alaska 3,564 1,863 Alaska, net of North Slope Borough 1,556 (66) Anchorage 1,109 230 North Slope Borough 2,007 1,929 Fairbanks 233 39 Valdez 169 161 Matanuska-Susitna Borough 94 (33) Juneau 25 (59) Nome 2 (5) Cordova 4 (4) Wrangell 1 (4) Bristol Bay Borough - (2) Unalaska 3 (10) Rest of State (83) (381)
10/10/00 Economic Effects of the Tax Cap 6 of 23
Note: Numbers in Parentheses indicate job gains.
Petroleum Property Tax Revenues--State government would get the largest share of discretionary income from the tax cut--$44.5 million in the first year. This is because under the tax cap the state would retain a large r share of the petroleum property tax revenues that now passes to local governments. No one can say what the state might do with this additional revenue. In this analysis we assume that it is immediately distributed throughout the state as additional discretionary income for all residents equally. In the first year this accounts for 326 of the new jobs created. Eventually this accounts for 1,485 of the new jobs.
NET CHANGE IN JOBS The net change in jobs in the first year would be a loss of 3,564 of which 1,641 are public and 1,923 are private. The ratio of jobs gains from additional private purchasing power to jobs lost from reduced public spending is .23 percent—4 jobs are lost for each job gained. When the grandfathered debt service has been retired the net loss would fall to 1,863 jobs.
B. THE COST OF ECONOMIC DISRUPTION
It is sometimes suggested that local governments would immediately find alternative revenue sources to offset the ir loss in property tax revenues so that public service delivery would not be interrupted and jobs will not be lost. For this to happen would require both immediate agreement on what alternative revenue sources should be used and immediate implementation of those alternative sources. This may require public votes, establishment of new bureaucracies, etc. A more likely scenario is that of an interruption in service delivery accompanied by a loss of jobs followed by a period of public debate over how to respond and finally the establishment of new revenue sources and the rehiring of public employees. The cost of this process, in both dollars and human terms, would be quite large.
C. INCOME The $137 million in tax cuts would directly add about $109 million to the disposable income of households in the first year. Higher federal income tax liability of residents, lower prices for non-resident purchases, and lower corporation taxes would claim the rest. If the state chose not to distribute its increased petroleum property tax revenues the increase would be $76.8 million.

10/10/00 Economic Effects of the Tax Cap 7 of 23
Spending of this additional discretionary income would generate $24.8 million of wage income for other private sector workers for a total gain of $134.2 million. More than offsetting this increase would be the loss in income from the reduction in public spending, $148.7 million. Consequently in the early years of the tax cap there would be a net loss of aggregate income for Alaska of $14.5 million.
Over time the amount of discretionary income retained by households would increase as the retirement of grandfathered debt service drove the tax cap down to 10 mills. When all this debt was retired the gain in discretionary income for households would be $279.5 million ($131 million without state redistribution of petroleum property tax revenues). With the multiplier the total increase in income would be $342.9 million. After subtracting the loss of income from reduced government spending of $148.7 million, there would be a net gain in aggregate income for Alaska of $194.2 million.
These changes in aggregate income of course mask the increase in per capita discretionary income produced by the tax cap. Since about 453 thousand Alaskans live in the communities directly impacted by the tax cap in the first year, the increase in discretionary income would be about $240 per person--$20 per month. Eventually the increase would be considerably larger--$600 per person annually and $50 per month as the grandfathered debt service was retired. (The comparable figures without state redistribution of petroleum tax revenues would be $170 and $290 annually per person.)
The increase in discretionary income would not be shared with those Alaskans forced to leave the state because of the loss of jobs. The early year net job loss of 3,564 would impact about 2,227 households.
The reduction in property taxes would benefit lower income households proportionately more than higher income households. The property tax is slightly regressive--lower income households tend to spend a larger share of their income on shelter than higher income households. Higher income households would gain a larger amount, but lower income households would gain a larger share of their income.
D. HOUSING COSTS AND PRICES
DIRECT EFFECTS
Renters Rental Rate Falls--A drop in the property tax reduces the cost of owning and operating residential rental property. Property owners at the time of the tax cut enjoy a “windfall” profit equal to their tax savings in the current year plus their estimated savings in future

10/10/00 Economic Effects of the Tax Cap 8 of 23
years (discounted by the time value of money). Initially there is no change in residential rents as property owners try to hold onto this windfall as long as possible. The supply of residential rental property may increase slightly while returns to investments in rental property are higher than before.
Over time competitive market forces will drive down the rental rate and eliminate the higher than normal profits being earned by owners of residential rental property. Eventually the residential rent will fall by most of the amount of the tax cut, shifting most of the tax savings to renter households.
Price of Rental Property Unchanged--Initially, the price of rental real estate would tend to rise, because the financial return from holding it would increase with windfall profits from the tax cut. This higher price reduces the rate of return to be in equilibrium with holding other assets. Owners who sell during this period capture the windfall gain reflected in a higher price.
As time passes, competition drives the rental rate down and with it the profit. This in turn puts downward pressure on the price, which eventually returns to the pre tax cut level. At this level the rate of return and profit from owning commercial real estate is the same as before the tax cut.
Homeowners A drop in the property tax reduces the cost of ownership for current homeowners. Property owners at the time of the tax cut enjoy a “windfall” equal to their tax savings in the current year plus their estimated savings in future years (discounted by the time value of money). The windfall will not be converted into a higher price for housing, as all properties will be affected, and the number of households is initially unchanged.
INDIRECT EFFECTS
Cost of Owning Property--The tax cut reduces the cost of owning property and makes it more attractive. However this may be partially or totally offset by new or higher private costs associated with property ownership. An example of this would be additional fire insurance costs to offset a reduction in the budget and staffing level of the fire department. These private costs raise the rental rate as well as the cost of home ownership.
Demand for Property--The drop in the rental rate and the cost of home ownership will stimulate the demand for real estate. This will tend to increase its price. Also, the

10/10/00 Economic Effects of the Tax Cap 9 of 23
reduced cost of home ownership will increase the demand for single family homes relative to rentals. On the other hand, the loss in jobs from the tax cut will reduce the demand for real estate. We estimate that in the first year the loss of 3,564 jobs would result in 2,227 households leaving the state. This reduced demand would put downward pressure on housing prices.
The loss of public spending could also reduce the demand for real estate to the extent that public amenities were reduced or eliminated. For residents not tied to the community by a job, the loss of amenities could lead to out migration3.
In the end the price of residential property could be higher or lower than before the tax cut. It is likely to be higher if demand is particularly sensitive to the cost of using property –the rental rate. It is likely to be lower to the extent that the drop in employment reduces the aggregate demand for housing.
E. COMMERCIAL REAL ESTATE RENTALS AND PRICES
DIRECT EFFECTS Rental Rates Gradually Drop--A drop in the property tax reduces the cost of owning commercial property. Property owners at the time of the tax cut enjoy a “windfall” profit equal to their tax savings in the current year plus their estimated savings in future years (discounted by the time value of money). Initially there is no change in rental rates as property owners try to hold onto this windfall as long as possible. The supply of commercial real estate may increase slightly while landlords are able to keep their tax savings in higher profits.
However, over time competitive market forces will drive down the rental rate and eliminate the higher than normal profits being earned in commercial real estate. Eventually the rental rate will fall by most of the amount of the tax cut. The savings thus gets shifted to the renters of commercial real estate.
Businesses that own their own real estate see the tax savings as a reduction in the cost of business. Both owner and renter businesses may pass on their tax savings (reduced rents or reduced costs of business) or keep them, depending on the amount of market competition they face.
3 If amenities fall on one piece of property but not others, its price will fall relative to the price of surrounding property. But if amenities fall for all property, there is no effect on price unless aggregate demand changes.

10/10/00 Economic Effects of the Tax Cap 10 of 23
Businesses selling to the local market, assuming it is competitive, will pass on the lower rental rate as lower prices of goods and services, reducing the cost of living. Businesses selling to the world market will not drop their selling prices, since world market conditions, and not local market competition, determine the price they can charge. The lower rental rate becomes additional company profit.
Prices of Property Initially Rise and Then Return to Former Level--The price of commercial real estate would tend to rise initially because the higher profit means that the financial return from holding commercial property has increased. A higher price reduces the rate of return to be in equilibrium with holding other assets. Owners who sell during this period capture the windfall gain reflected in a higher price.
As time passes, competition drives the rental rate down and with it the profit. This in turn puts downward pressure on the price, which eventually returns to the pre tax cut level. At this level the rate of return on holding commercial real estate is the same as before the tax cut since the profit is the same as before the tax cut.
INDIRECT EFFECTS
Cost of Owning Property--As with residential property, the tax cut reduces the cost of owning property, but this may be partially or totally offset by new or higher private costs associated with property ownership as a result of reduced government services. Some effects are direct, such as increased fire insurance costs to offset slower fire services. These private costs raise the rental rate as well as the cost of ownership. Businesses might also face increased labor costs if they have to pay higher wages to attract high quality labor to communities with reduced cultural and recreational amenities.
Demand for Property--The drop in the rental rate and owner costs will stimulate the demand for commercial real estate, which will tend to increase its price. However, the loss in jobs from the tax cut will reduce the demand for real estate. The smaller economy will need fewer support sector businesses. In the end the price of commercial property could be higher or lower than before the tax cut. It is likely to be higher if demand is particularly sensitive to the cost of using property –the rental rate. It is likely to be lower to the extent that the drop in employment and the slightly smaller economy reduces the demand for commercial property.
F. COST OF LIVING

10/10/00 Economic Effects of the Tax Cap 11 of 23
If a reduction in the property tax caused the rental rate to fall, and there were no offsetting private costs imposed on property owners, the cost of living would fall. The lower cost of rents would reduce the cost of shelter and the cost of locally supplied goods and services. This in turn would marginally reduce the cost of labor. Since the monthly per capita increase in discretionary income in the first year would be $20, the cost of living effect would be quite small.
G. EQUAL TREATMENT OF EQUALS The tax cap would limit growth in assessed values to 2 percent per year except when the property was sold. At that time the property would be reassessed to market value.
Since most property does not change hands very often, and because inflation and demand often pushes property values up at rates in excess of 2 percent, the result of this feature of the tax cap would be that properties of equal value would often pay different amounts of taxes. For example in California there are cases where one homeowner is paying 5 times the property tax of his neighbor in an identical house. The only difference is that the neighbor with the higher tax is a recent buyer while his neighbor has been in his home for many years.
The tax cap thus rewards non-movers at the expense of movers and new arrivals, whether they are homeowners or landlords.
H. ECONOMIC INCENTIVES The unequal treatment of equal property would introduce several unintended incentives into the real estate market and the economy in general. First there would be a disincentive for property upgrades. One of the costs of upgrading would be moving from a property with a tax assessment below the market to a property with an assessment at the market.
This same phenomenon puts new comers to Alaskan communities, both households and businesses, at a disadvantage compared to residents and established businesses. New comers purchasing property are burdened with higher property taxes than those who have owned their property for several years. Of course there are other benefits of “incumbency” and this is simply an additional disincentive to enter the community and the market.
I. QUALITY OF LIFE

10/10/00 Economic Effects of the Tax Cap 12 of 23
Businesses find it easier to attract employees to places where the quality of life is high. If the spending cuts necessitated by the tax cap reduce the quality of public services in Alaska communities it will be harder for businesses to attract workers and for communities to attract new businesses. Of course if the reduction in property taxes is viewed as an enhancement to the quality of life, it might become easier to attract workers and businesses.
J. COST OF BORROWING FOR PUBLIC CONSTRUCTION The tax cap would cripple the ability of most local governments to float general obligation bonds to pay for the construction of schools, roads, and other community facilities. Furthermore the cost of any new general obligation bonds that were sold would be higher with the cap. This is because potential borrowers would view the cap as a constraint on the ability of local government to repay the bonds. Governments forced to choose between using their limited tax capacity to fund necessary operations or to repay debt, might opt to default on the debt. Lenders would require a higher rate of return as compensation for this additional risk.
K. FINANCING LOCAL GOVERNMENT
Capping the property tax limits the ability of local governments to access one of the three main sources of revenue available to fund local government spending. The other two are the sales tax and state revenue assistance. This is more limiting for local governments that are, for whatever reason, fully utilizing their revenue capacity. While some places might have revenue sources that can substituted for the property tax, others do not. Furthermore this limitation has had two unintended consequences in California—the “fiscalization of land use” and the growth of arcane financing techniques.
Fiscalization of Land Use—This means that land use decisions have been increasingly made on the basis of their revenue generating capacity for the community rather than their overall job, quality of life, or environmental benefits. The reduction of revenue raising capability from the tax cap has led many local governments in California to focus on new development either as a source of revenue, or as a drain on city budgets and consequently something to be avoided. New developments, through fees and other mechanisms, fund services and facilities formerly shared by the community at large. This effectively increases the cost threshold for new development. In other instances communities avoid new developments since they add more in public costs than they contribute in revenues. Particularly disadvantaged have been low income housing and non-retail commercial development. On the other hand, local sales tax generating developments have been favored.

10/10/00 Economic Effects of the Tax Cap 13 of 23
Growth of Arcane Financing Techniques—The inability of local government to use their property tax base has led in California to more complex, expensive, and arcane methods of financing government. The result is a system of public finance that is difficult for the public to understand, which further erodes public confidence and trust in government. These complex financing techniques include both methods to fund capital expenditures and methods to collect revenues for operations. For example, the allocation of property tax revenues in California, which has now fallen under the control of state government, is based on a complex and changing formula leading to confusion and errors in distributions.
PART 2. POSSIBLE FISCAL RESPONSES—HOW TO RAISE $200 MILLION In the first year $137 million of local revenues would be lost under the tax cap, growing to $349 million as grandfathered debt service is retired and assessment lag grows. Partially offsetting this loss would be the additional petroleum property taxes retained by the state, primarily at the expense of the North Slope Borough. The net loss in public revenues (state plus local governments) would thus be closer to $100 million in the first year, ultimately growing to about $200 million. If Alaskans want to maintain the current level of services, and the state used its additional petroleum revenues for local revenue assistance, then ultimately an additional $200 million in annual revenues would need to be found.
STATE-WIDE SOLUTIONS A number of suggestions rely on revenues from the state supplanting those lost from the cut in the property tax. This would require a reversal in the trend in state assistance to local government. Since the mid 1980s local government assistance through such mechanisms as revenue sharing and assistance for education have been falling.
This downward trend is due to falling state revenues. The state has responded by reducing many programs and local government assistance is one area that has experienced particularly large reductions. Furthermore the decline in state revenues is expected to continue as revenues from oil continue to fall. Thus it will become increasingly difficult in future years to maintain the current level of local government assistance.
An important consideration with any state wide solution is how the funds would be allocated to local governments. There is no guarantee that the communities that lost property tax revenues would be the ones that would be made whole by increased state

10/10/00 Economic Effects of the Tax Cap 14 of 23
assistance. In fact it is likely that there would be winners and losers in this restructuring process.
Reallocation of Resources--Not withstanding the history of declining local government assistance there are several proposals for using state resources to offset lost property tax revenues. In evaluating these proposals it is important to remember that each involves a cost—there is no free lunch.
1. Petroleum Property Taxes
As we have seen the tax cap would redirect back into the state treasury much of the petroleum property taxes now going to local governments. These revenues could be shared with local governments without adversely affecting state finances. However, this proposal does not deal with the $200 million long term shortfall, or the $100 million immediate shortfall. It does not result in any new revenues but rather reshuffles a portion of existing revenues from the communities now receiving them to the entire state.
2. Assets of AIDEA, AHFC, and Student Loan Fund
The combined equity of Alaska Industrial Development and Export Authority, Alaska Housing Finance Corporation, and the Alaska Student Loan Corporation was $2.9 billion at the end of fiscal year 1999. It has been suggested that combining these corporations would make some of this money available for other purposes. One such use would be to create an account to fund an annual payment to local governments.
There is broad agreement that the state can do a better job in managing its financial assets. However the assets of these corporations currently serve two important purposes. They provide necessary collateral for corporate borrowing to carry out agency missions as determined by the legislature, and they generate income for those purposes as well as for dividends paid to the state general fund. If some of the assets of these corporations were instead used to fund a program of local government assistance the activities of these corporations would be reduced due to higher borrowing costs and lower revenues. Furthermore since these corporations have very different missions, combining them could entail institutional and administrative costs.
Not withstanding these concerns we can ask what the revenue generating power of these assets would be. The Permanent Fund target rate of return after inflation proofing is 5 percent. Earnings of 5 percent on the entire assets of the three corporations –$2.9 billion- would be $145 million per year–less than the $200 million needed. Further, practically speaking even major gains in efficiency would free up only a fraction of these assets to assist local governments, so this approach could raise only a small amount of what would be needed.
10/10/00 Economic Effects of the Tax Cap 15 of 23
3. “Excess” Permanent Fund Earnings
In a normal investment environment (excluding the last few years during which financial returns have been extremely high by historical standards) about 85 percent of total Permanent Fund earnings have been used to pay the dividend and inflation proofing. At the current size of the Permanent Fund, between $250 and $300 million of “excess” earnings is potentially available each year.
These “excess” earnings have in the past either been added to the corpus of the fund or left on deposit in the earnings reserve. Saving the excess earnings in this way increases the size of future dividend and cash available for other future public purposes. In addition, carrying a balance in the earnings reserve insures that there will be sufficient money to pay the dividend in a year of unusually low fund earnings.
Although “excess” earnings could compensate for the loss of local property tax revenues, any decision should be made within the context of an overall state fiscal plan. Alaskan have shown great reluctance to use Permanent Fund earnings to fund government operations. If they were willing to do so, these Permanent Fund earnings, along with a personal income tax, are the two most obvious tools available to the state to balance its budget as petroleum revenues continue to fa ll and the fiscal gap grows.
Untapped Tax Bases: Another set of state solutions involves the collection of revenues in ways that attempt to pass the tax burden off of the shoulders of Alaskans onto others—non-resident workers or tourists. Shifting the burden is justified either because it is possible, or because non-residents should pay for the use of public services. Unfortunately, and in contrast with public perception, these groups are too small to pick up much of the tax burden.
1. Flat Tax of $500 on Every Worker Years ago the state imposed a one time tax of $10 on every worker known as the school tax. Because there are about 400 thousand workers in the state (including the self employed but excluding active duty military), such a tax would need to be about $500 per worker to produce revenues of $200 million.
The apparent attractive feature of this tax is that it would fall on non-resident workers who comprised about 20 percent of all workers in 1998 (although this includes people new to the state who subsequently became permanent residents).
However this is the most regressive tax possible, falling with equal weight on every worker, whether their total earnings are $1 or $100 thousand. Furthermore non-resident workers on average are not concentrated in the highest paying jobs. Over 2/3 of non residents work in manufacturing (mostly fish processing), trade, and services—relatively low wage industries. Non-residents

10/10/00 Economic Effects of the Tax Cap 16 of 23
working in construction, petroleum, and transportation (including utilities and communications) would pay only between 3 and 4 percent of this tax.
Imposing such a regressive tax on residents in order to collect such a small amount from non-residents in high wage occupations is not a good tradeoff.
2. Tourist Tax Since there are about 1 million non-resident visitors to Alaska each year a $200 assessment from each would generate $200 million. How such a levy might be imposed remains to be determined. Furthermore a levy of that size might be a disincentive for some potential visitors.
COMMUNITY SPECIFIC SOLUTIONS:
A second group of fiscal solutions rely on the resources of individual communities. The property tax, sales, tax, and state assistance as usually considered the foundation of a local government fiscal system. Thus the sales tax is the most likely candidate to pick up some of the burden from a reduction in the property tax if state assistance is not forthcoming. However most Alaska communities, with the exception of Anchorage, already rely upon a sales tax for a portion of their revenues. Time and space precludes a detailed analysis of the unutilized tax capacity and other resources in each community, but since Anchorage is the largest community in the state and would lose the most tax revenue in the first year of a tax cap, we look at a couple of options for that community. Although the initial year revenue loss has been estimated at $64 million, eventually the loss would grow to about $125 million as grandfathered debt is retired and assessment lag erodes the tax base.
1. Use the Municipality Savings Account
This account was created in 1999, when the Municipality sold ATU. The money was invested and income from those investments was intended to replace the annual contribution that ATU made to the city’s general fund each year. This provided $9.4 million in revenues in 1999. Cashing out this account would result in several years of lower taxes. However, once the fund were gone, the annual revenues it currently generates would also be gone, leaving the city with fewer sources of revenue than before the ATU sale.
2. Sales tax or Seasonal Sales Tax
A sales tax on all retail sales of about 3.5 percent would produce about $125 million for Anchorage. A seasonal tax on all retail sales, in effect for three months during the summer, would need to be about 10 percent to produce $125 million in annual revenues.

10/10/00 Economic Effects of the Tax Cap 17 of 23
Compared to the property tax, a sales tax is more regressive, and a larger share of the tax would fall on Anchorage residents because unlike the property tax, the sales tax is not deductible from income for federal income tax purposes. A seasonal sales tax would shift some of the burden to non-Anchorage residents, but because the rate would need to be so high, it would create a disincentive to make purchases within the city when it was in effect.
10/10/00 Economic Effects of the Tax Cap 18 of 23
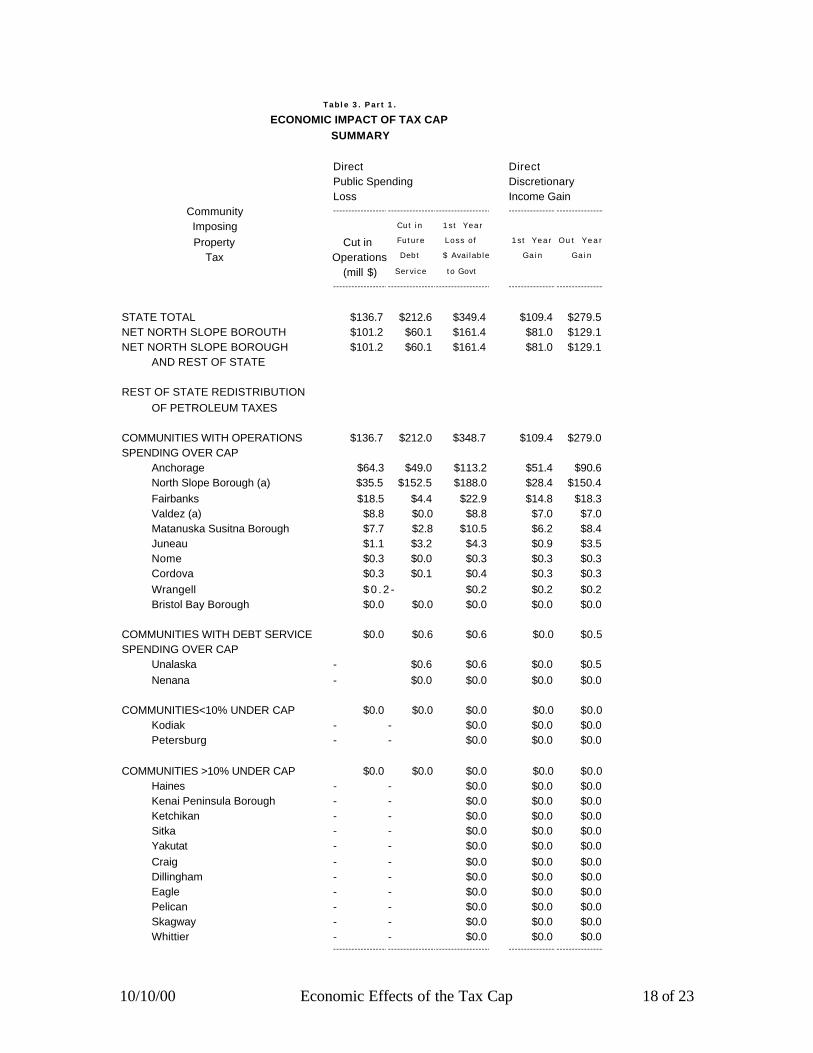
Table 3. Part 1.
ECONOMIC IMPACT OF TAX CAPSUMMARY
Direct DirectPublic Spending DiscretionaryLoss Income Gain
Community ------------------------------------------------------- ----------------------------------
Imposing Cut in 1st Year
Property Cut in Future Loss of 1st Year Ou t Yea r
Tax Operations Debt $ Available Gain Gain
(mill $) Service to Govt
------------------------------------------------------- ----------------------------------
STATE TOTAL $136.7 $212.6 $349.4 $109.4 $279.5NET NORTH SLOPE BOROUTH $101.2 $60.1 $161.4 $81.0 $129.1NET NORTH SLOPE BOROUGH $101.2 $60.1 $161.4 $81.0 $129.1
AND REST OF STATE
REST OF STATE REDISTRIBUTION OF PETROLEUM TAXES
COMMUNITIES WITH OPERATIONS $136.7 $212.0 $348.7 $109.4 $279.0SPENDING OVER CAP
Anchorage $64.3 $49.0 $113.2 $51.4 $90.6North Slope Borough (a) $35.5 $152.5 $188.0 $28.4 $150.4Fairbanks $18.5 $4.4 $22.9 $14.8 $18.3Valdez (a) $8.8 $0.0 $8.8 $7.0 $7.0Matanuska Susitna Borough $7.7 $2.8 $10.5 $6.2 $8.4Juneau $1.1 $3.2 $4.3 $0.9 $3.5Nome $0.3 $0.0 $0.3 $0.3 $0.3Cordova $0.3 $0.1 $0.4 $0.3 $0.3Wrangell $ 0 . 2 - $0.2 $0.2 $0.2Bristol Bay Borough $0.0 $0.0 $0.0 $0.0 $0.0
COMMUNITIES WITH DEBT SERVICE $0.0 $0.6 $0.6 $0.0 $0.5SPENDING OVER CAP
Unalaska - $0.6 $0.6 $0.0 $0.5Nenana - $0.0 $0.0 $0.0 $0.0
COMMUNITIES<10% UNDER CAP $0.0 $0.0 $0.0 $0.0 $0.0Kodiak - - $0.0 $0.0 $0.0Petersburg - - $0.0 $0.0 $0.0
COMMUNITIES >10% UNDER CAP $0.0 $0.0 $0.0 $0.0 $0.0Haines - - $0.0 $0.0 $0.0Kenai Peninsula Borough - - $0.0 $0.0 $0.0Ketchikan - - $0.0 $0.0 $0.0Sitka - - $0.0 $0.0 $0.0Yakutat - - $0.0 $0.0 $0.0Craig - - $0.0 $0.0 $0.0Dillingham - - $0.0 $0.0 $0.0Eagle - - $0.0 $0.0 $0.0Pelican - - $0.0 $0.0 $0.0Skagway - - $0.0 $0.0 $0.0Whittier - - $0.0 $0.0 $0.0
------------------------------------------------------- ----------------------------------

10/10/00 Economic Effects of the Tax Cap 19 of 23
Table 3. Part 2.
ECONOMIC IMPACT OF TAX CAPPUBLIC SPENDING
First Year Early YearPublic Operations Spending Public Construction Spending Total
Community --------------------------------------------------------------------------------------------------------------------------- ------------------------------------------------------------------------ -----------------
Imposing Cut in Cut in Local Procure- Total Support Total Construc- Construc- Indirect/ Total Total
Property Personnel Procure- Govt ment Direct Jobs Jobs tion tion Induced Jobs Job
Tax Spending ment Jobs Jobs Jobs Lost Lost $$ Jobs Jobs L o s t Loss
Lost L o s t Lost Lost L o s t Lost
--------------------------------------------------------------------------------------------------------------------------- ------------------------------------------------------------------------ -----------------
STATE TOTAL $102.6 $34.2 1,641 273 1,914 957 2,872 $178.6 893 893 1,786 4,657NET NORTH SLOPE BOROUTH $75.9 $25.3 1,215 202 1,417 709 2,126 $50.5 252 252 505 2,631NET NORTH SLOPE BOROUGH $75.9 $25.3 1,215 202 1,417 709 2,126 $50.5 252 252 505 2,631
AND REST OF STATE
REST OF STATE REDISTRIBUTION OF PETROLEUM TAXES
COMMUNITIES WITH OPERATIONS $102.6 $34.2 1,641 273 1,914 957 2,872 $178.1 890 890 1,781 4,652SPENDING OVER CAP
Anchorage $48.2 $16.1 771 129 900 450 1,349 $41.1 206 206 411 1,761North Slope Borough (a) $26.6 $8.9 426 71 497 249 746 $128.1 641 641 1,281 2,027Fairbanks $13.9 $4.6 222 37 259 129 388 $3.7 19 19 37 425Valdez (a) $6.6 $2.2 106 18 123 62 185 $0.0 0 0 0 185Matanuska Susitna Borough $5.8 $1.9 93 15 108 54 162 $2.3 12 12 23 185Juneau $0.8 $0.3 13 2 15 8 23 $2.7 14 14 27 50Nome $0.2 $0.1 4 1 4 2 7 $0.0 0 0 0 7Cordova $0.2 $0.1 4 1 4 2 7 $0.1 0 0 1 8Wrangell $0.2 $0.1 2 0 3 1 4 $0.0 0 0 0 4Bristol Bay Borough $0.0 $0.0 1 0 1 0 1 $0.0 0 0 0 1
COMMUNITIES WITH DEBT SERVICE $0.0 $0.0 0 0 0 0 0 $0.5 3 3 5 5SPENDING OVER CAP
Unalaska $0.0 $0.0 0 0 0 0 0 $0.5 2 2 5 5Nenana $0.0 $0.0 0 0 0 0 0 $0.0 0 0 0 0
COMMUNITIES<10% UNDER CAP $0.0 $0.0 0 0 0 0 0 $0.0 0 0 0 0Kodiak $0.0 $0.0 0 0 0 0 0 $0.0 0 0 0 0Petersburg $0.0 $0.0 0 0 0 0 0 $0.0 0 0 0 0
COMMUNITIES >10% UNDER CAP $0.0 $0.0 0 0 0 0 0 $0.0 0 0 0 0Haines $0.0 $0.0 0 0 0 0 0 $0.0 0 0 0 0Kenai Peninsula Borough $0.0 $0.0 0 0 0 0 0 $0.0 0 0 0 0Ketchikan $0.0 $0.0 0 0 0 0 0 $0.0 0 0 0 0Sitka $0.0 $0.0 0 0 0 0 0 $0.0 0 0 0 0Yakutat $0.0 $0.0 0 0 0 0 0 $0.0 0 0 0 0Craig $0.0 $0.0 0 0 0 0 0 $0.0 0 0 0 0Dillingham $0.0 $0.0 0 0 0 0 0 $0.0 0 0 0 0Eagle $0.0 $0.0 0 0 0 0 0 $0.0 0 0 0 0Pelican $0.0 $0.0 0 0 0 0 0 $0.0 0 0 0 0Skagway $0.0 $0.0 0 0 0 0 0 $0.0 0 0 0 0Whittier $0.0 $0.0 0 0 0 0 0 $0.0 0 0 0 0
--------------------------------------------------------------------------------------------------------------------------- ------------------------------------------------------------------------ -----------------

10/10/00 Economic Effects of the Tax Cap 20 of 23
Table 3. Part 3.
ECONOMIC IMPACT OF TAX CAPPRIVATE SPENDING
DirectDiscretionaryIncome Gain Private Spending Jobs Gain
Community ---------------------------------- --------------------------------------------------- ---------------------------------------------------
Imposing 1st Year Ou t Yea r
Property 1st Year Ou t Yea r Before Redistri- After Before Redistri- After
Tax Gain Gain Redistri- bution Redistri- Redistri- bution Redistri-
bution bution bution bution
---------------------------------- --------------------------------------------------- ---------------------------------------------------
STATE TOTAL $109.4 $279.5 1,094 1,094 1,094 2,795 2,795 2,795NET NORTH SLOPE BOROUTH $81.0 $129.1 810 1,080 1,075 1,291 2,720 2,697NET NORTH SLOPE BOROUGH $81.0 $129.1 810 754 1,043 1,291 1,234 2,554
AND REST OF STATE
REST OF STATE REDISTRIBUTION 326 31 1,485 143OF PETROLEUM TAXES
COMMUNITIES WITH OPERATIONS $109.4 $279.0 1,094 768 1,008 2,790 1,305 2,398SPENDING OVER CAP
Anchorage $51.4 $90.6 514 514 651 906 906 1,531North Slope Borough (a) $28.4 $150.4 284 14 19 1,504 75 98Fairbanks $14.8 $18.3 148 148 192 183 183 386Valdez (a) $7.0 $7.0 70 14 16 70 14 24Matanuska Susitna Borough $6.2 $8.4 62 62 91 84 84 219Juneau $0.9 $3.5 9 9 25 35 35 109Nome $0.3 $0.3 3 3 5 3 3 11Cordova $0.3 $0.3 3 3 4 3 3 10Wrangell $0.2 $0.2 2 2 3 2 2 8Bristol Bay Borough $0.0 $0.0 0 0 1 0 0 4
COMMUNITIES WITH DEBT SERVICE $0.0 $0.5 0 0 3 5 5 16SPENDING OVER CAP
Unalaska $0.0 $0.5 0 0 2 5 5 15Nenana $0.0 $0.0 0 0 0 0 0 1
COMMUNITIES<10% UNDER CAP $0.0 $0.0 0 0 9 0 0 42Kodiak $0.0 $0.0 0 0 7 0 0 33Petersburg $0.0 $0.0 0 0 2 0 0 8
COMMUNITIES >10% UNDER CAP $0.0 $0.0 0 0 43 0 0 196Haines $0.0 $0.0 0 0 1 0 0 6Kenai Peninsula Borough $0.0 $0.0 0 0 26 0 0 118Ketchikan $0.0 $0.0 0 0 8 0 0 34Sitka $0.0 $0.0 0 0 5 0 0 21Yakutat $0.0 $0.0 0 0 0 0 0 2Craig $0.0 $0.0 0 0 1 0 0 5Dillingham $0.0 $0.0 0 0 1 0 0 6Eagle $0.0 $0.0 0 0 0 0 0 0Pelican $0.0 $0.0 0 0 0 0 0 0Skagway $0.0 $0.0 0 0 0 0 0 2Whittier $0.0 $0.0 0 0 0 0 0 1
---------------------------------- --------------------------------------------------- ---------------------------------------------------

10/10/00 Economic Effects of the Tax Cap 21 of 23
Table 3. Part 4.
ECONOMIC IMPACT OF TAX CAPNET JOBS IMPACT
Net Job Loss Ratio HHCommunity --------------------------------------------- --------------- ----------------- -----------------
Imposing Early Year Ou t Job Gain/ Ear l y Year
Property Total Public Private Y e a r Job Loss Net Loss
Tax Total 1st
Year
--------------------------------------------- --------------- ----------------- -----------------
STATE TOTAL 3,564 1,641 1,923 1,863 23% 2,227NET NORTH SLOPE BOROUTH 1,556 1,215 341 (66) 41% 973NET NORTH SLOPE BOROUGH 1,588 1,215 373 77 40% 992
AND REST OF STATE
REST OF STATE REDISTRIBUTION (31) 0 (31) (143) na (20)OF PETROLEUM TAXES
COMMUNITIES WITH OPERATIONS 3,644 1,641 2,004 2,254 22% 2,278SPENDING OVER CAP
Anchorage 1,109 771 338 230 37% 693North Slope Borough (a) 2,007 426 1,581 1,929 1% 1,255Fairbanks 233 222 11 39 45% 146Valdez (a) 169 106 63 161 9% 105Matanuska Susitna Borough 94 93 2 (33) 49% 59Juneau 25 13 12 (59) 50% 16Nome 2 4 (2) (5) 68% 1Cordova 4 4 (0) (2) 51% 2Wrangell 1 2 (1) (4) 71% 1Bristol Bay Borough (0) 1 (1) (2) 105% (0)
COMMUNITIES WITH DEBT SERVICE 3 0 3 (11) 49% 2SPENDING OVER CAP
Unalaska 3 0 3 (10) 46% 2Nenana (0) 0 (0) (1) 135% (0)
COMMUNITIES<10% UNDER CAP (9) 0 (9) (42) na (6)Kodiak (7) 0 (7) (33) na (5)Petersburg (2) 0 (2) (8) na (1)
COMMUNITIES >10% UNDER CAP (43) 0 (43) (196) na (27)Haines (1) 0 (1) (6) na (1)Kenai Peninsula Borough (26) 0 (26) (118) na (16)Ketchikan (8) 0 (8) (34) na (5)Sitka (5) 0 (5) (21) na (3)Yakutat (0) 0 (0) (2) na (0)Craig (1) 0 (1) (5) na (1)Dillingham (1) 0 (1) (6) na (1)Eagle (0) 0 (0) (0) na (0)Pelican (0) 0 (0) (0) na (0)Skagway (0) 0 (0) (2) na (0)Whittier (0) 0 (0) (1) na (0)
--------------------------------------------- --------------- ----------------- -----------------

10/10/00 Economic Effects of the Tax Cap 22 of 23
Table 3. Part 5.
ECONOMIC IMPACT OF TAX CAPNET INCOME IMPACT
(MILLION $)
Public Spending Discretionary DiscretionaryLoss Income Gain -- 1st Year Income Gain -- Out Year
Community --------------------------------------------------- ----------------------------------------------------------------------------------------------------------- -----------------------------------------------------------------------------------------------------------
Imposing Direct Direct Direct Direct
Property Opera- Const- Sum Before Reallo- After Indirect Net Before Reallo- After Indirect Net
Tax tions ruction Reallo- cate Reallo- Gain Sum Change Reallo- cate Reallo- Gain Sum Change
cate cate cate cate
--------------------------------------------------- ------------------------------------------------------------------------------------- ----------------- ------------------------------------------------------------------------------------- -----------------
STATE TOTAL $87.6 $61.1 $148.7 $109.4 $109.4 $109.4 $24.8 $134.2 ($14.5) $279.5 $279.5 $279.5 $63.4 $342.9 $194.2
NET NORTH SLOPE BOROUTH $64.8 $17.3 $82.1 $81.0 $108.0 $107.5 $24.4 $131.9 $49.7 $129.1 $272.0 $269.7 $61.2 $330.9 $248.8NET NORTH SLOPE BOROUGH $64.8 $17.3 $82.1 $81.0 $75.4 $104.3 $23.7 $128.0 $45.9 $129.1 $123.4 $255.4 $58.0 $313.4 $231.2
AND REST OF STATE
REST OF STATE REDISTRIBUTION $32.6 $3.1 $0.7 $3.9 $3.9 $148.5 $14.3 $3.2 $17.5 $17.5OF PETROLEUM TAXES
COMMUNITIES WITH OPERATIONS $87.6 $61.0 $148.6 $109.4 $76.8 $100.8 $22.9 $123.7 ($24.9) $279.0 $130.5 $239.8 $54.4 $294.3 $145.7SPENDING OVER CAP
Anchorage $41.2 $14.1 $55.2 $51.4 $51.4 $65.1 $14.8 $79.9 $24.7 $90.6 $90.6 $153.1 $34.7 $187.8 $132.6North Slope Borough (a) $22.7 $43.9 $66.6 $28.4 $1.4 $1.9 $0.4 $2.4 ($64.2) $150.4 $7.5 $9.8 $2.2 $12.0 ($54.6)
Fairbanks $11.8 $1.3 $13.1 $14.8 $14.8 $19.2 $4.4 $23.6 $10.5 $18.3 $18.3 $38.6 $8.8 $47.3 $34.2Valdez (a) $5.6 $0.0 $5.6 $7.0 $1.4 $1.6 $0.4 $2.0 ($3.6) $7.0 $1.4 $2.4 $0.5 $3.0 ($2.7)
Matanuska Susitna Borough $4.9 $0.8 $5.7 $6.2 $6.2 $9.1 $2.1 $11.2 $5.5 $8.4 $8.4 $21.9 $5.0 $26.8 $21.1Juneau $0.7 $0.9 $1.6 $0.9 $0.9 $2.5 $0.6 $3.1 $1.4 $3.5 $3.5 $10.9 $2.5 $13.3 $11.7
Nome $0.2 $0.0 $0.2 $0.3 $0.3 $0.5 $0.1 $0.6 $0.3 $0.3 $0.3 $1.1 $0.3 $1.4 $1.2
Cordova $0.2 $0.0 $0.2 $0.3 $0.3 $0.4 $0.1 $0.5 $0.2 $0.3 $0.3 $1.0 $0.2 $1.2 $0.9Wrangell $0.1 $0.0 $0.1 $0.2 $0.2 $0.3 $0.1 $0.4 $0.2 $0.2 $0.2 $0.8 $0.2 $1.0 $0.8
Bristol Bay Borough $0.0 $0.0 $0.0 $0.0 $0.0 $0.1 $0.0 $0.1 $0.1 $0.0 $0.0 $0.4 $0.1 $0.4 $0.4
COMMUNITIES WITH DEBT SERVICE $0.0 $0.2 $0.2 $0.0 $0.0 $0.3 $0.1 $0.3 $0.1 $0.5 $0.5 $1.6 $0.4 $2.0 $1.8SPENDING OVER CAP
Unalaska $0.0 $0.2 $0.2 $0.0 $0.0 $0.2 $0.1 $0.3 $0.1 $0.5 $0.5 $1.5 $0.3 $1.8 $1.7
Nenana $0.0 $0.0 $0.0 $0.0 $0.0 $0.0 $0.0 $0.0 $0.0 $0.0 $0.0 $0.1 $0.0 $0.1 $0.1
COMMUNITIES<10% UNDER CAP $0.0 $0.0 $0.0 $0.0 $0.0 $0.9 $0.2 $1.1 $1.1 $0.0 $0.0 $4.2 $0.9 $5.1 $5.1Kodiak $0.0 $0.0 $0.0 $0.0 $0.0 $0.7 $0.2 $0.9 $0.9 $0.0 $0.0 $3.3 $0.8 $4.1 $4.1
Petersburg $0.0 $0.0 $0.0 $0.0 $0.0 $0.2 $0.0 $0.2 $0.2 $0.0 $0.0 $0.8 $0.2 $1.0 $1.0
COMMUNITIES >10% UNDER CAP $0.0 $0.0 $0.0 $0.0 $0.0 $4.3 $1.0 $5.3 $5.3 $0.0 $0.0 $19.6 $4.4 $24.0 $24.0Haines $0.0 $0.0 $0.0 $0.0 $0.0 $0.1 $0.0 $0.2 $0.2 $0.0 $0.0 $0.6 $0.1 $0.7 $0.7
Kenai Peninsula Borough $0.0 $0.0 $0.0 $0.0 $0.0 $2.6 $0.6 $3.2 $3.2 $0.0 $0.0 $11.8 $2.7 $14.5 $14.5
Ketchikan $0.0 $0.0 $0.0 $0.0 $0.0 $0.8 $0.2 $0.9 $0.9 $0.0 $0.0 $3.4 $0.8 $4.2 $4.2Sitka $0.0 $0.0 $0.0 $0.0 $0.0 $0.5 $0.1 $0.6 $0.6 $0.0 $0.0 $2.1 $0.5 $2.6 $2.6
Yakutat $0.0 $0.0 $0.0 $0.0 $0.0 $0.0 $0.0 $0.1 $0.1 $0.0 $0.0 $0.2 $0.0 $0.2 $0.2Craig $0.0 $0.0 $0.0 $0.0 $0.0 $0.1 $0.0 $0.1 $0.1 $0.0 $0.0 $0.5 $0.1 $0.6 $0.6
Dillingham $0.0 $0.0 $0.0 $0.0 $0.0 $0.1 $0.0 $0.2 $0.2 $0.0 $0.0 $0.6 $0.1 $0.7 $0.7Eagle $0.0 $0.0 $0.0 $0.0 $0.0 $0.0 $0.0 $0.0 $0.0 $0.0 $0.0 $0.0 $0.0 $0.0 $0.0
Pelican $0.0 $0.0 $0.0 $0.0 $0.0 $0.0 $0.0 $0.0 $0.0 $0.0 $0.0 $0.0 $0.0 $0.0 $0.0Skagway $0.0 $0.0 $0.0 $0.0 $0.0 $0.0 $0.0 $0.1 $0.1 $0.0 $0.0 $0.2 $0.0 $0.2 $0.2
Whittier $0.0 $0.0 $0.0 $0.0 $0.0 $0.0 $0.0 $0.0 $0.0 $0.0 $0.0 $0.1 $0.0 $0.1 $0.1--------------------------------------------------- ------------------------------------------------------------------------------------- ----------------- ------------------------------------------------------------------------------------- -----------------

10/10/00 Economic Effects of the Tax Cap 23 of 23
Table 3. Part 6.
ECONOMIC IMPACT OF TAX CAPASSUMPTIONS
0.75personnel share of local operating budgets based on Anchorage population shares
16direct operating employees per $1 million of operating expenditures based on Anchorage
0.5operating budget jobs multiplier Alaska IO model 615000 state
8 direct operating employees per $1 million of procurement expenditures Author's assumption based 258782 42.1% AnchorageAlaska IO Model 9389 1.5% North Slope Borough (a)
0.84Ratio of construction $ to debt service $ Author's assumption 83928 13.6% Fairbanks5Construction jobs per $1 million of capital expenditures Alaska IO Model 4155 0.7% Valdez (a)1Indirect and Induced construction jobs multiplier Alaska IO Model 55747 9.1% Matanuska Susitna Borough
30684 5.0% Juneau10Indirect and Induced jobs per $1 million of additional discretionary income Alaska IO Model 3706 0.6% Nome0.8Share of property tax cut passed to residents Author's assumption 2571 0.4% Cordova
2589 0.4% Wrangell(a) 0.95Share of tax cut in NSB distributed as additional purchasing power statewide Author's assumption 1297 0.2% Bristol Bay Borough
0.8Share of tax cut in Valdez distributed as additional purchasing power statewide Author's assumption
1.6Jobs per Household Anchorage, including military
and self employed 4285 0.7% Unalaska435 0.1% Nenana
$34,908 local govt wage Employment and Earnings, ADOL
$31,380 procurement wage and author's assumption 13848 2.3% Kodiak$45,768 construction wage 3398 0.6% Petersburg$22,698 support wage
2476 0.4% Haines48815 7.9% Kenai Peninsula Borough14231 2.3% Ketchikan8779 1.4% Sitka
810 0.1% Yakutat2145 0.3% Craig2332 0.4% Dillingham
168 0.0% Eagle149 0.0% Pelican814 0.1% Skagway306 0.0% Whittier
xxxxx 9.6%rest of state