economic impact of the turfgrass industry in new england
TRANSCRIPT

Economic Impact of the Turfgrass Industry in New England
Raub, K.1, B.L. Campbell1, V. Wallace2, J. Henderson3, J. Inguagiato, and S. Rackliffe3
1Department of Agricultural and Resource Economics. 2Department of Extension, 3Department of Plant Science and Landscape Architecture, University of Connecticut
April 2015

1
ABSTRACT
Turfgrass is a major industry in the six states of New England: Connecticut, Maine, Massachusetts, New Hampshire, Rhode Island and Vermont. The purpose of this study was to determine the regional and state specific effects of the turfgrass industry on the New England economy in terms of direct sales, employment (jobs), value added, labor, and total impacts created by these economic activities. Six primary sectors of the turfgrass industry were studied in detail: 1) sod farm production, 2) lawn equipment manufacturing, 3) lawn care services, 4) golf courses, 5) non-equipment wholesalers, and 6) lawn care retailing. Six secondary sectors were also evaluated: 1) airports, 2) roadways, 3) municipal grounds maintenance, 4) school grounds, 5) athletic fields, and 6) cemeteries. IMPLAN was used to create an input-output model that includes transactions between industries, employees, households and the government within a specific economy (Miller and Blair, 1985). Results show that the New England turfgrass industry contributed $11.3 billion and 134,467 jobs to the regional economy, and had $7.1 billion in value-added.

2
TABLE OF CONTENTS LIST OF TABLES ………….......……………………………..………….………..…...……….....3 LIST OF FIGURES …………….……………………….…….…………………..…………….....4 INTRODUCTION .………………………..……………………………………….……...……….5 RESEARCH METHODOLOGY .…………………………….…..……………….………...……….5 RESULTS .……………………………………………………………………………....……….8 State by State Impacts …………………………..…………………….…………….….8 New England Impact - Total .……………….………………………………….8 State Impacts .……………………………………………………….………….11 Sector by Sector Impacts .…………………………………..……….………………….25 Sod Farm Production……….………………………………………………………….25
Lawn Equipment Manufacturing….………………………….…………………26 Lawn Care Wholesaling.……….…….……………..………….……………….27 Lawn Care Services……………..………..……………………..………………28 Lawn Care Retailing .……………………………..…………….……...……….30 Golf Courses .……………………………………………………………………32 Other Wholesaling Consumers .……………………………………………...….33
CONCLUSIONS .…………………………………..………………………............................…….38 LITERATURE …………….………..…………..…...……………………………………………...39 APPENDIX A – Economic Multipliers.…………………………….………………..…………….40

3
LIST OF TABLES Table 1. Industry sectors, information sources, economic impact analysis………………………6 Table 2. Turfgrass industry total impacts for New England………………………...……………8 Table 3. Impacts by sector for the New England region………………………...……………….9 Table 4. Turfgrass total output per state………………………………………………………....11 Table 5. Impact per sector for Connecticut ……………………………………………………...13 Table 6. Impact per sector for Maine………………………………………………………..…...15 Table 7. Impact per sector for Massachusetts……………………………………………….…...17 Table 8. Impact per sector for New Hampshire …………………………………….…………...19 Table 9. Impact per sector for Rhode Island ………………………………………..…………...21 Table 10. Impact per sector for Vermont………………………………………………………...23 Table 11. Sod farms and acreage per state in New England………………………………...…...25 Table 12. Total impact for New England by sod producers………………………...…………...26 Table 13. Total impact for New England by the lawn equipment manufacturing sector………………………………………………………………………………………..……27 Table 14. Total impact for New England by the lawn care wholesaling sector ………………...28 Table 15. Lawn care service firms and sales per state; 2002 and 2012 comparison……….……29 Table 16. Total impact for New England by the lawn care services sector……………………...29 Table 17. Total impact for New England by the lawn care services sector: subsector residential……………………………………………………………………………..…….……29 Table 18. Total impact for New England by the lawn care services sector: subsector commercial………………………………………………………………………………….…...30 Table 19. Total impact for New England by the lawn care services sector: subsector landscape architecture and design services………………………………………………………..………..30 Table 20. Total impact for New England by the lawn care services sector: subsector landscape construction………………………………………………………………………………….…...30 Table 21. Distribution of store types per state…………………………………………………...31 Table 22. Total impact for New England by the lawn care retailing sector………...…………...31 Table 23. Number of golf courses per state in 2012……………………………...……………...32 Table 24. Total impact of New England golf courses…………………………………………...33 Table 25. Total impact of New England golf courses: subsector playing (green fees and memberships)……………………………………………………………………………..……..33 Table 26. Total impact of New England golf courses: subsector equipment and apparel sales...33 Table 27. Breakdown of acres associated with various turf operations…………….……….…..34 Table 28. Impact of golf turf input purchasing, not including labor………………..…………...34 Table 29. Total impact for New England by the other wholesaling consumers’ sector ………...35 Table 30. Total impact for New England from municipal grounds maintenance ………………35 Table 31. Total impact for New England from airport grounds maintenance …………….....…36 Table 32. Total impact for New England from roadway maintenance ……….…………….…..36 Table 33. Total impact for New England from athletic fields………………….………...……...37 Table 34. Total impact for New England from school grounds…………………………..……..37 Table 35. Total impact for New England from cemetery maintenance ………………….……...38

4
LIST OF FIGURES
Figure 1. Percent of total regional output from sod farms by state……………………………...25 Figure 2. Percent of total regional output from lawn care equipment manufacturing by state….26 Figure 3. Percent of total regional output from lawn care wholesaling by state………...………27 Figure 4. Percent of total regional output from lawn care services by state……...……………..28 Figure 5. Percent of total regional output from lawn care retailing by state……………...……..31 Figure 6. Percent of total regional output from golf courses (greens, memberships, and equipment/apparel sales) by state………………………………………………………………..32

5
INTRODUCTION Humans have used turfgrass for over 10 centuries (Beard and Green, 1994). It is estimated that two percent of U.S. land area (Milesi et al. 2005) is covered with turfgrass and in 2002 the lawn care industry was estimated at $57.8 billion (Haydu, Hodges, and Hall 2006). There have been numerous environmental benefits attributed to the use of turfgrass including, stabilizing sediment to control erosion, improving groundwater recharge, and aiding CO2 conversion (Beard and Green 1994). Turfgrass has also been shown to reduce noise pollution and it can delay, or prevent, the movement of chemicals from lawns and agricultural areas to watersheds (Blanco-Montero et al. 1995). Further, it provides an inexpensive surface for sports/outdoor activities and helps cushion against personal impact injuries (Beard and Green 1994), while also improving mental health and work productivity due to its’ aesthetics (Beard and Green, 1994). Given the numerous benefits, it is essential to understand the structure and impact of the growing turfgrass industry. The industry can be broken into two main sectors, 1) suppliers and 2) consumers of turf products and services. Suppliers include sod and seed producers, manufacturers, wholesalers, and retailers. Consumers, on the other hand, include golf courses, athletic fields, commercial institutions, non-profits, municipal properties and households. The economic significance of specialty crops, including turfgrass, has grown considerably over the past 20+ years (Haydu et al. 2008). While over 60 state level studies have been performed on nursery crops and turfgrass between 1978 and 2004 (Haydu et al. 2008), the most recent study of the industry was done approximately ten years ago and only four studies have included, or specifically concentrated on, New England. These studies have focused on five primary sectors- sod production, lawn care services, lawn equipment manufacturing, golf courses, and retail sales- and three secondary sectors- cemeteries, airports, and school grounds. This study takes a more in-depth approach and includes six primary sectors and six secondary sectors: sod production, lawn care services, lawn equipment manufacturing, golf courses, retail, and lawn care wholesaling (i.e., equipment); and cemeteries, airports, school grounds, athletic fields, roadways, and municipal.
RESEARCH METHODOLOGY IMPLAN was used to generate an input-output model that accounts for transactions between industries, employees, households, and government within a specified economy (Miller and Blair 1985). The IMPLAN sectors correspond to the North American Industrial Classification System (NAICS), which classify industries based on the dominant good or service produced (Haydu et al. 2008). Table 1 details the IMPLAN sectors, and corresponding NAICS codes, included in this study. As we are using the latest version of IMPLAN (version 3 with 2012 data) we list the older corresponding IMPLAN sector codes used in previous studies.

6
Table 1. Industry Sectors, Information Sources, Economic Impact Analysis. Sector NAICS
IMPLAN
Industry Sector
Description Code Industry Sector
Description Code
Old New Sod Farms Nursery and
floriculture production 11142 Nursery & Greenhouse 6 6
Lawn care services
Landscaping services
56173
Services to buildings and dwellings 458 388
Lawn care retail stores
Lawn and garden equipment and supplies stores (1) and home centers (2)
4442 & 44411
Building material and garden supply stores 404 323
Lawn equipment manufacturing
Lawn and garden tractor and home lawn and garden equipment manufacturing 333112
Lawn & garden equipment manufacturing 258 204
Golf Courses Golf courses and country clubs
71391
Amusement, gambling and recreation services 458 410
Cemeteries Cemeteries and crematories 812220
Death care services N/A 420
Lawn equipment wholesaling
Merchant wholesalers of specialized machinery, equipment, and parts 423820
Wholesale trade businesses N/A 319
IMPLAN derives economic multipliers to estimate the total economic impact of each turfgrass industry sector in a user specified area (Haydu et al. 2008). Direct, indirect, and induced effect multipliers for output, employment and value added are provided per sector in Appendix A.
• Direct Effects: Direct sales by industry firms. • Indirect Effects: Effects of intermediate purchases by industry firms from other economic
sectors. • Induced Effects: Effects of industry employee household consumer spending.
• Output: Total impact generated. • Employment: Jobs (full and part time) created by a sector. • Value Added: Total personal and business net income (Haydu, Hodges and Hall, 2006).
Value-added is the most accurate estimate of the turfgrass industries impact to the regional economy because it represents the net impact after direct effects have been subtracted (Haydu et al. 2008).

7
Primary data was collected from a variety of sources and inputted into IMPLAN to run a regional analysis of New England. Data sources are detailed below:1
• Sod production: 2012 Agricultural Census (USDA-National Agricultural Statistics Service)
• Lawn equipment manufacturing: U.S. Census Bureau 2012 Manufacturing and Industry Series2
• Lawn equipment wholesaling: IBIS Word Reports3 • Landscape services: 2012 U.S. Census Bureau Economic Census – sales per firm were
estimated by dividing U.S. value of sales by number of U.S. firms as state level data was not available.4 State firm numbers were from the 2012 U.S. Census Bureau County Business Patterns. Subsectors within landscape services were found by calculating the percentage of firms out of all firms in the U.S. participating in a specific activity, such as commercial landscaping, residential landscaping, landscape architectural and design services, or landscape construction services, and then multiplying by the number of firms in each state. Calculations do not contain snow removal related activities.
• Golf: Number of firms for each state were from a 2011 AARP report. Value per firm was from the 2007 U.S. Census Bureau Economic Census and adjusted to real dollars. Values only include memberships and green fees associated with playing golf and do not include other amenities at country clubs, such as food/beverage sales. Equipment apparel and equipment sales were estimated from reports by Bloomberg and Statista. Turf related expenditures were from the GCSAA 2012 Maintenance Budget Survey.
• Municipalities: Data came from examining budgets from 5-7 towns/cities per state, including the largest towns/cities and multiplying the total number of towns/cities.
• Cemeteries: Number of cemeteries came from expertgps.com with average cemetery size received from personal communications with state/regional cemetery association members.
• Roadways: Total road miles per state were from the Department of Transportation with expenditure per mile from a variety of state reports.
• Airports: Total number of airports per state were from the Department of Transportation with acres and per acre expenditures from a variety of state and governmental reports.
• School athletic fields: Number of fields per sport by state were from maxpreps.com, including football, baseball, soccer, lacrosse, and softball.
• School grounds: Number of schools was taken from www.educationbug.org with average area being eleven acres.
• Retailing: 2010 National Gardening Survey
1 More details about the report and specific data sources are available from the report authors. 2 The number of firms per state was available in 2012 but sales were not available by state. The per state sales was calculated by estimating the U.S. average per firm (which was available) and then multiplying the average by the number of firms per state. 3 http://clients1.ibisworld.com/reports/us/industry/productsandmarkets.aspx?entid=947 4 The estimated value per firm is similar to that obtained from the Dunn and Bradstreet report.

8
RESULTS
The results are presented as totals for all of New England with percentage breakdowns per New England state. The results are impacts associated with a sectors/sub-sectors impact on the New England economy, not just on the state economy. However, impacts outside the state are minimal for all sectors/sub-sectors. STATE BY STATE IMPACTS NEW ENGLAND IMPACT – TOTAL The turfgrass industry contributes to over 134,000 jobs with direct sales of $10.7 billion (Table 2). Furthermore, there was approximately $11.3 billion in economic activity attributable to the industry in 2012. Labor earned income was around $5 billion while valued added was at $7.1 billion. In total, the direct output for the turfgrass sector was $6.8 billion in economic activity with another $1.7 billion and $2.8 billion coming from the indirect (i.e. intermediate firm purchases) and induced (i.e. employee household spending). To put the numbers in perspective, this equates to $777 dollars of output per New England resident. In real dollar terms, the turfgrass industry would have direct sales around $11 billion with a total economic impact of $11.7 billion in 2014 dollars. Table 2. Turfgrass Industry Total Impacts for New England. Total Direct
Sales (dollars in millions)
Total Employment
(jobs)
Total Labor Income
(dollars in millions)
Total Value Added
(dollars in millions)
Total Output
(dollars in millions)
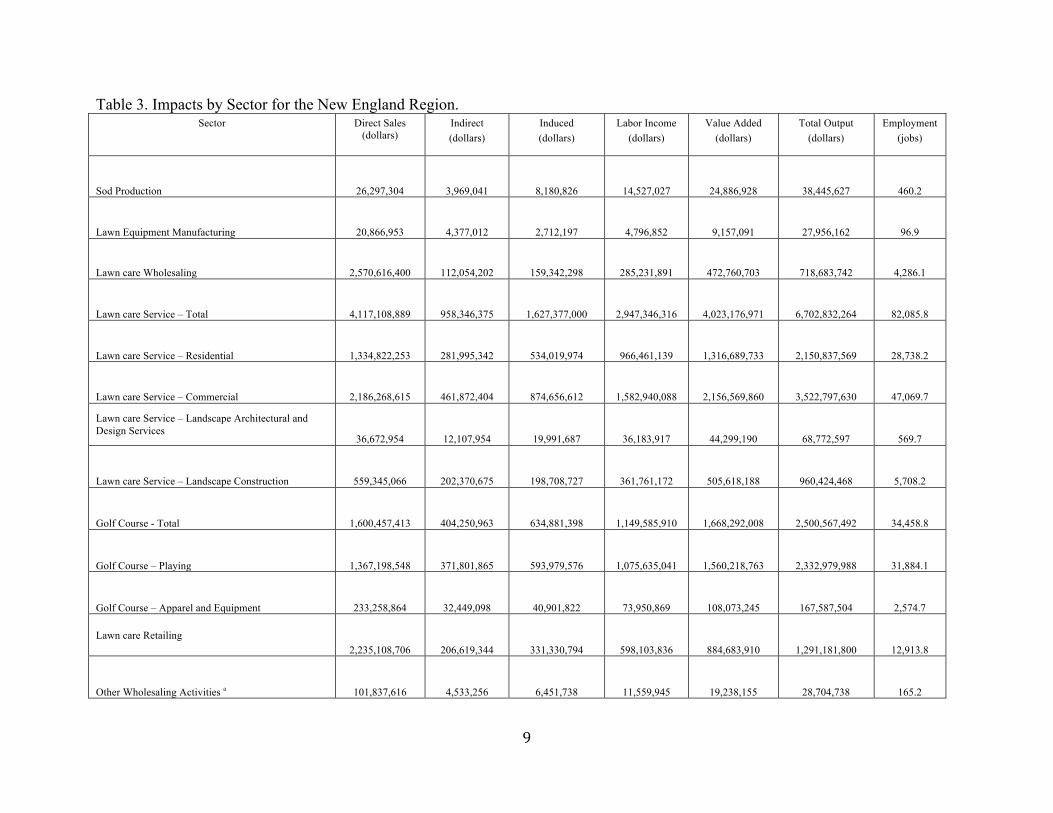
Direct 10,672 100,468 3,232 4,172 6,844 Indirect 12,403 705 1,108 1,694 Induced 21,595 1,074 1,822 2,770 Total 134,467 5,011 7,102 11,308 When examining sector specific impacts it is apparent that lawn care services is an extremely important driver of the turfgrass industry (Table 3). Lawn care services had direct sales of over $4 billion with a total impact of $6.7 billion. Within lawn care services, commercial maintenance contributes over half of direct sales, total output, and employment. Golf has a $2.5 billion dollar impact on the New England regional economy contributing almost 35,000 jobs. The golf impact is not the true impact of golf in that this report only looked at facets of the game directly related to turf. For instance, we include green fees and club memberships as well as equipment and apparel sales. We do not include food/drink sales at country clubs, charitable giving by golf organizations, or other similar activities.
9
Table 3. Impacts by Sector for the New England Region. Sector Direct Sales
(dollars) Indirect (dollars)
Induced (dollars)
Labor Income (dollars)
Value Added (dollars)
Total Output (dollars)
Employment (jobs)
Sod Production 26,297,304 3,969,041 8,180,826 14,527,027 24,886,928 38,445,627 460.2
Lawn Equipment Manufacturing 20,866,953 4,377,012 2,712,197 4,796,852 9,157,091 27,956,162 96.9
Lawn care Wholesaling 2,570,616,400 112,054,202 159,342,298 285,231,891 472,760,703 718,683,742 4,286.1
Lawn care Service – Total 4,117,108,889 958,346,375 1,627,377,000 2,947,346,316 4,023,176,971 6,702,832,264 82,085.8
Lawn care Service – Residential 1,334,822,253 281,995,342 534,019,974 966,461,139 1,316,689,733 2,150,837,569 28,738.2
Lawn care Service – Commercial 2,186,268,615 461,872,404 874,656,612 1,582,940,088 2,156,569,860 3,522,797,630 47,069.7
Lawn care Service – Landscape Architectural and Design Services
36,672,954 12,107,954 19,991,687 36,183,917 44,299,190 68,772,597 569.7
Lawn care Service – Landscape Construction 559,345,066 202,370,675 198,708,727 361,761,172 505,618,188 960,424,468 5,708.2
Golf Course - Total 1,600,457,413 404,250,963 634,881,398 1,149,585,910 1,668,292,008 2,500,567,492 34,458.8
Golf Course – Playing 1,367,198,548 371,801,865 593,979,576 1,075,635,041 1,560,218,763 2,332,979,988 31,884.1
Golf Course – Apparel and Equipment 233,258,864 32,449,098 40,901,822 73,950,869 108,073,245 167,587,504 2,574.7
Lawn care Retailing 2,235,108,706 206,619,344 331,330,794 598,103,836 884,683,910 1,291,181,800 12,913.8
Other Wholesaling Activities a 101,837,616 4,533,256 6,451,738 11,559,945 19,238,155 28,704,738 165.2
10
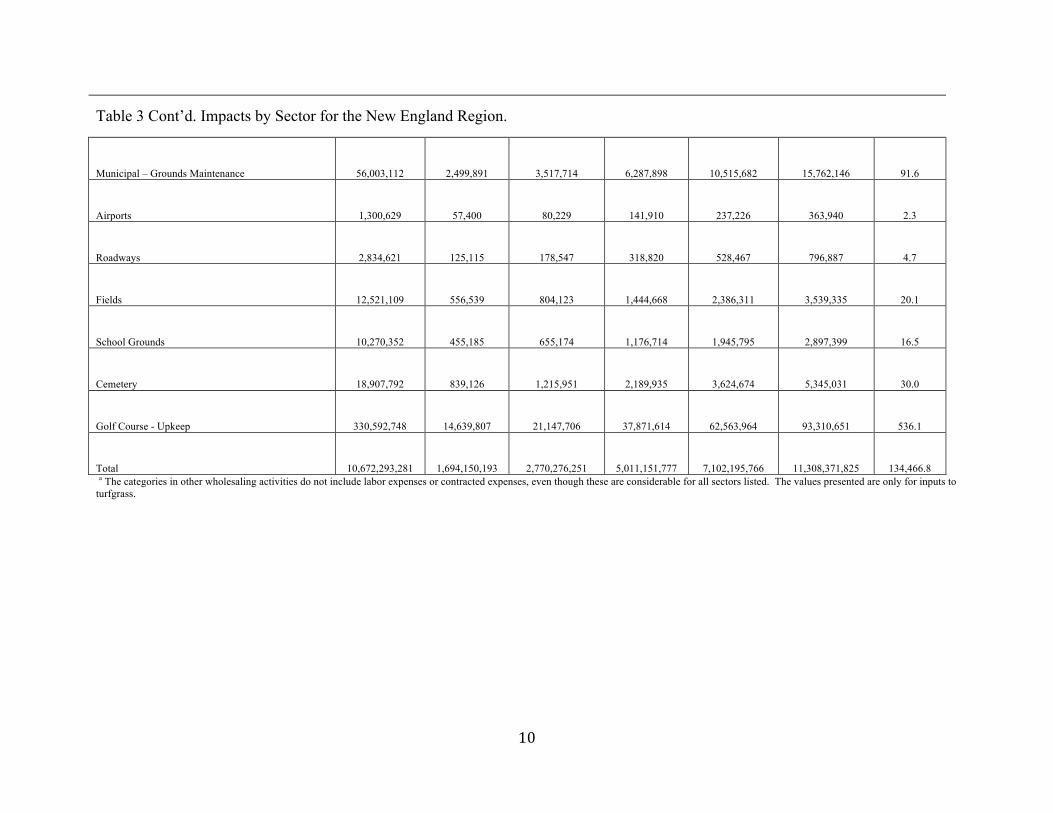
Table 3 Cont’d. Impacts by Sector for the New England Region.
Municipal – Grounds Maintenance 56,003,112 2,499,891 3,517,714 6,287,898 10,515,682 15,762,146 91.6
Airports 1,300,629 57,400 80,229 141,910 237,226 363,940 2.3
Roadways 2,834,621 125,115 178,547 318,820 528,467 796,887 4.7
Fields 12,521,109 556,539 804,123 1,444,668 2,386,311 3,539,335 20.1
School Grounds 10,270,352 455,185 655,174 1,176,714 1,945,795 2,897,399 16.5
Cemetery 18,907,792 839,126 1,215,951 2,189,935 3,624,674 5,345,031 30.0
Golf Course - Upkeep 330,592,748 14,639,807 21,147,706 37,871,614 62,563,964 93,310,651 536.1
Total 10,672,293,281 1,694,150,193 2,770,276,251 5,011,151,777 7,102,195,766 11,308,371,825 134,466.8 a The categories in other wholesaling activities do not include labor expenses or contracted expenses, even though these are considerable for all sectors listed. The values presented are only for inputs to turfgrass.

11
Examining the total impacts at the state level, MA has the largest turfgrass industry with direct sales almost double that of CT, the state with the second largest turfgrass industry (Table 4). MA has direct sales of $4.3 billion with an economic output of almost $5 billion. Over 57,000 MA jobs can be attributed to turf. On the other end of the spectrum Rhode Island generated $609 million in total output with only 7,430 turf jobs. However, to put these numbers in perspective, Vermont had the highest total output to resident value with $973 output generated per resident, while Maine had the lowest per resident output at $690 per resident. A major factor in the economic impacts by state and per resident totals is the type of industry and its value (see multipliers in Appendices A1-A7) to the state. For instance, some sectors provide a larger output per dollar and/or jobs per dollar than other sectors. Revenue from playing golf (i.e. green fees, memberships, etc.) in MA generates the largest impact per dollar of sales at $1.74. However, NH generates the highest employment per million dollars of sales at 27.35. MA, on the other hand, generates 24.5 jobs per million dollars in sales. This implies that impacts by state are a function of the size of a sector as well as the value generated by the sector throughout the region. Table 4. Turfgrass Industry Total Output per State. State Direct Sales
(dollars in millions)
Total Employment
Total Labor Income
(dollars in millions)
Total Value Added
(dollars in millions)
Total Output (dollars in millions)
CT 2,473 33,536 1,312 1,813 2,853
ME 1,067 11,781 363 547 918
MA 4,270 57,620 2,273 3,157 4,976
NH 1,164 13,846 468 689 1,098
RI 772 10,253 372 541 855
VT 928 7,430 223 356 609
All States 10,672 134,467 5,011 7,102 11,308 STATE IMPACTS CONNECTICUT The turfgrass industry in Connecticut contributes over 33,000 jobs with direct sales of $2.5 billion (Table 5). Further, there is around $2.9 billion in economic activity attributable to the industry. The largest sector is lawn care services with $1 billion in direct sales and $1.7 billion in economic activity generated. The lawn care services sector also contributes 61% of the jobs within the CT turfgrass industry. Commercial maintenance is the largest sub-sector within lawn

12
care services contributing almost 12,000 of the 20,000 jobs and over half of the economic output for the sector. Lawn care retailing is the second largest with respect to direct sales but is third, after golf, with respect to economic activity. MAINE The turfgrass industry in Maine contributes almost 12,000 jobs with direct sales of $1.1 billion (Table 6). Total economic output generated was $918 million with value added output at $547 million. The largest sector with respect to direct sales was lawn care wholesaling, however, lawn care services had the highest total output at $544 million. MASSACHUSETTS The turfgrass industry in Massachusetts has the largest turfgrass sector in New England with almost $5 billion in total output and employing over 57,000 people (Table 7). Turfgrass in Massachusetts is led by lawn care services followed by golf and lawn care retailing. With respect to golf numbers provided in this report, total output numbers are similar to those found in the 2012 Massachusetts Golf Economy Full Report (SRI International 2014). NEW HAMPSHIRE The turfgrass industry in New Hampshire has $1.2 billion in direct sales with a total economic output of $1.1 billion. Due to the nature of the NH turfgrass industry, direct sales flow out of the region leading to lower economic output than direct sales. Further, the industry contributes 13,846 jobs (Table 8). The value added impact is $689 million with labor income of $468 million. The largest sector in terms of direct sales was lawn care services with $410 million in direct sales followed closely by lawn care wholesaling at $406 million. However, lawn care services contributed almost six times the regional total impact as lawn care wholesaling, $646 million to $117 million, respectively. RHODE ISLAND The turfgrass industry in Rhode Island contributes over 10,000 jobs with direct sales of $772 million (Table 9). Further, there is around $855 million in economic activity attributable to the industry. The largest sector is lawn care services with $321 million in direct sales and $514 million in economic activity generated. Further, turfgrass production in Rhode Island is the largest of any New England state with respect to direct sales and economic impact. Production of turfgrass contributes $17 million to the regional economy and employs 222 people. VERMONT The turfgrass industry in Vermont contributes to over 7,000 jobs with direct sales of $928 million with total output around $609 million (Table 10). Vermont and Connecticut are the only two states in New England that currently have lawn equipment manufacturing. With respect to Vermont, lawn equipment manufacturing contributes over $17 million to the regional economy. Further, the largest sector in Vermont turfgrass is lawn care wholesaling, but lawn care services has the largest total output.

13
Table 5. Impacts by Sector for Connecticut. Sector Direct Sales Indirect Induced Labor Income Value Added Output Employment
Sod Production 6,106,160 1,048,999 2,075,378 3,983,477 6,004,548 9,230,537 96.9
Lawn Equipment Manufacturing 7,825,108 1,839,002 1,207,407 2,292,114 4,871,008 10,871,517 33.0
Lawn care Wholesaling 405,886,800 18,512,685 25,759,953 49,042,112 80,169,021 114,896,940 610.2
Lawn care Service – Total 1,032,477,048 256,441,398 400,725,494 767,773,909 1,023,302,135 1,689,643,940 20,502.8
Lawn care Service – Residential 334,742,990 77,161,517 130,176,115 249,045,329 333,754,893 542,080,622 7,180.3
Lawn care Service – Commercial 548,266,326 126,380,723 213,211,875 407,904,488 546,647,949 887,858,924 11,760.5
Lawn care Service – Landscape Architectural and Design Services
9,196,741 3,322,892 4,816,513 9,221,709 11,187,813 17,336,146 143.0
Lawn care Service – Landscape Construction 140,270,991 49,576,266 52,520,991 101,602,383 131,711,480 242,368,248 1,419.0
Golf Course - Total 443,901,545 115,749,632 176,574,288 334,947,104 473,360,485 701,950,358 9,178.3
Golf Course – Playing 386,392,976 106,287,102 166,715,812 316,127,142 446,805,876 659,395,890 8,550.5
Golf Course – Apparel and Equipment 57,508,569 9,462,530 9,858,476 18,819,962 26,554,609 42,554,468 627.8
Lawn care Retailing 551,052,596 54,710,809 79,093,477 150,631,470 219,797,514 319,509,018 3,077.2
Other Wholesaling Activities a 25,213,991 1,150,021 1,600,226 3,046,532 4,980,159 7,137,481 38.0

14
Table 5 Cont’d. Impacts by Sector for Connecticut.
Municipal – Grounds Maintenance 15,481,714 706,128 982,560 1,870,610 3,057,882 4,382,506 23.3
Airports 181,732 8,289 11,534 21,958 35,895 51,444 0.3
Roadways 517,467 23,602 32,841 62,524 102,208 146,482 0.8
Fields 2,862,904 130,578 181,696 345,916 565,468 810,420 4.3
School Grounds 2,322,585 105,934 147,405 280,631 458,747 657,468 3.5
Cemetery 3,847,589 175,490 244,190 464,893 759,959 1,089,161 5.8
Golf Course - Upkeep 63,003,757 2,873,630 3,998,587 7,612,559 12,444,232 17,834,871 94.7
Total 2,472,463,247 449,452,546 687,036,223 1,311,716,718 1,812,484,870 2,853,239,791 33,536.4 a The categories in other wholesaling activities do not include labor expenses or contracted expenses, even though these are considerable for all sectors listed. The values presented are only for inputs to turfgrass.

15
Table 6. Impacts by Sector for Maine. Sector Direct Sales Indirect Induced Labor Income Value Added Output Employment
Sod Production 5,094,869 737,603 2,731,950 4,578,242 5,496,025 8,564,422 89.6
Lawn Equipment Manufacturing - - - - - - -
Lawn care Wholesaling 405,886,800 18,803,601 24,231,445 40,302,250 70,864,343 113,659,347 753.7
Lawn care Service – Total 340,781,422 76,994,480 126,195,286 210,683,499 302,617,300 543,971,190 7,565.1
Lawn care Service – Residential 110,485,935 22,133,536 42,339,888 70,678,939 99,899,964 174,959,360 2,655.6
Lawn care Service – Commercial 180,961,871 36,251,910 69,347,338 115,763,088 163,623,402 286,561,119 4,349.6
Lawn care Service – Landscape Architectural and Design Services
3,035,495 918,776 1,600,028 2,670,611 3,343,653 5,554,299 52.9
Lawn care Service – Landscape Construction 46,298,121 17,690,258 12,908,032 21,570,861 35,750,281 76,896,412 507.0
Golf Course - Total 92,164,674 18,288,620 33,673,254 56,155,748 87,056,463 131,437,468 2,065.0
Golf Course – Playing 70,874,272 16,285,317 30,213,614 50,382,521 77,505,004 117,373,203 1,802.9
Golf Course – Apparel and Equipment 21,290,402 2,003,303 3,459,640 5,773,227 9,551,459 14,064,265 262.1
Lawn care Retailing 204,006,661 16,057,061 29,659,665 49,478,123 77,628,489 114,466,973 1,271.2
Other Wholesaling Activities a 19,356,455 896,730 1,155,579 1,921,985 3,379,469 5,420,333 36.0

16
Table 6 Cont’d. Impacts by Sector for Maine.
Municipal – Grounds Maintenance 12,897,559 597,508 769,984 1,280,654 2,251,803 3,611,667 24.0
Airports 406,224 18,819 24,251 40,336 70,923 113,754 0.8
Roadways 551,949 25,570 32,951 54,805 96,365 154,561 1.0
Fields 1,773,153 82,145 105,857 176,064 309,577 496,531 3.3
School Grounds 1,478,808 68,509 88,285 146,837 258,187 414,106 2.7
Cemetery 2,248,762 104,179 134,251 223,289 392,614 629,714 4.2
Golf Course - Upkeep 49,553,517 2,295,676 2,958,345 4,920,382 8,651,618 13,876,333 92.0
Total 1,067,290,881 131,778,095 217,647,179 363,119,847 547,042,089 917,519,733 11,780.6 a The categories in other wholesaling activities do not include labor expenses or contracted expenses, even though these are considerable for all sectors listed. The values presented are only for inputs to turfgrass.

17
Table 7. Impacts by Sector for Massachusetts.
Sector Direct Sales Indirect Induced Labor Income Value Added Output Employment
Sod Production 2,053,208 352,400 745,121 1,338,145 2,045,916 3,150,729 41.1
Lawn Equipment Manufacturing - - - - - - -
Lawn care Wholesaling 676,478,000 29,882,458 45,173,963 81,095,232 133,539,187 192,763,590 1,025.0
Lawn care Service – Total 1,795,102,140 428,603,551 760,804,223 1,366,552,495 1,824,828,789 2,984,509,915 34,565.1
Lawn care Service – Residential 581,996,335 123,181,254 246,296,177 442,502,393 596,702,954 951,473,766 11,994.6
Lawn care Service – Commercial 953,235,772 201,755,184 403,401,726 724,762,485 977,323,338 1,558,392,682 19,645.7
Lawn care Service – Landscape Architectural and Design Services
15,989,788 5,228,749 9,324,670 16,751,235 20,321,302 30,543,208 233.0
Lawn care Service – Landscape Construction 243,880,245 98,438,364 101,781,650 182,536,382 230,481,195 444,100,259 2,691.8
Golf Course - Total 742,135,506 207,179,060 302,584,660 543,508,936 780,535,102 1,188,452,074 16,219.7
Golf Course – Playing 635,680,551 190,186,547 283,125,445 508,560,558 730,873,607 1,108,992,542 15,064.9
Golf Course – Apparel and Equipment 106,454,955 16,992,513 19,459,215 34,948,378 49,661,495 79,459,532 1,154.8
Lawn care Retailing 1,020,061,543 99,297,720 154,078,290 276,803,117 409,251,913 597,136,763 5,718.1
Other Wholesaling Activities a 33,632,972 1,485,689 2,245,947 4,031,872 6,639,269 9,583,772 51.0

18
Table 7 Cont’d. Impacts by Sector for Massachusetts.
Municipal – Grounds Maintenance 12,927,317 571,046 863,262 1,549,708 2,551,899 3,683,661 19.6
Airports 274,379 12,120 18,322 32,892 54,163 78,185 0.4
Roadways 875,991 38,696 58,497 105,012 172,924 249,615 1.3
Fields 5,335,975 235,709 356,327 639,669 1,053,341 1,520,495 8.1
School Grounds 3,946,417 174,327 263,534 473,091 779,036 1,124,537 6.0
Cemetery 10,272,894 453,791 686,005 1,231,500 2,027,906 2,927,279 15.6
Golf Course - Upkeep 133,440,542 5,894,547 8,910,915 15,996,665 26,341,642 38,024,115 202.2
Total 4,269,463,369 766,800,878 1,265,632,204 2,273,329,797 3,156,840,176 4,975,596,843 57,620.0 a The categories in other wholesaling activities do not include labor expenses or contracted expenses, even though these are considerable for all sectors listed. The values presented are only for inputs to turfgrass.

19
Table 8. Impacts by Sector for New Hampshire. Sector Direct Sales
Indirect Induced Labor Income Value Added Output Employment
Sod Production 301,714 39,513 89,266 155,770 280,189 430,494 7.9
Lawn Equipment Manufacturing - - - - - - -
Lawn care Wholesaling 405,886,800 17,729,448 28,246,771 49,274,752 75,920,904 116,600,520 716.4
Lawn care Service – Total 409,577,672 85,118,925 151,517,050 265,775,802 390,824,529 646,213,645 8,278.2
Lawn care Service – Residential 132,790,608 26,054,701 51,827,709 90,866,523 127,875,345 210,673,017 2,953.0
Lawn care Service – Commercial 217,494,080 42,674,277 84,887,177 148,827,776 209,443,507 345,055,533 4,836.6
Lawn care Service – Landscape Architectural and Design Services
3,648,294 1,178,449 1,937,429 3,396,573 4,260,531 6,764,171 59.9
Lawn care Service – Landscape Construction 55,644,691 15,211,498 12,864,735 22,684,930 49,245,146 83,720,924 428.7
Golf Course - Total 140,014,244 32,804,773 54,585,982 95,352,836 140,661,505 214,796,817 3,491.1
Golf Course – Playing 118,859,575 30,959,996 50,697,876 88,526,857 130,580,569 200,517,447 3,251.4
Golf Course – Apparel and Equipment 21,154,669 1,844,777 3,888,106 6,825,979 10,080,936 14,279,370 239.7
Lawn care Retailing 202,706,057 17,719,575 32,606,159 57,038,582 79,972,512 118,637,678 1,343.6
Other Wholesaling Activities a 5,280,639 230,663 367,494 641,071 987,740 1,516,987 9.2

20
Table 8 Cont’d. Impacts by Sector for New Hampshire.
Municipal – Grounds Maintenance 1,597,310 69,772 111,161 193,914 298,776 458,865 2.8
Airports 185,295 8,094 12,895 22,495 34,659 53,230 0.3
Roadways 387,914 16,944 26,996 47,093 72,559 111,437 0.7
Fields 1,211,532 52,921 84,314 147,080 226,616 348,041 2.1
School Grounds 1,037,143 45,303 72,178 125,909 193,997 297,944 1.8
Cemetery 861,446 37,629 59,950 104,580 161,133 247,470 1.5
Golf Course - Upkeep 39,996,767 1,747,090 2,783,484 4,855,617 7,481,373 11,490,011 70.6
Total 1,163,767,125 153,642,897 267,412,722 468,238,813 688,647,379 1,098,196,141 13,846.4 a The categories in other wholesaling activities do not include labor expenses or contracted expenses, even though these are considerable for all sectors listed. The values presented are only for inputs to turfgrass.

21
Table 9. Impacts by Sector for Rhode Island. Sector Direct Sales Indirect Induced Labor Income Value Added Output Employment
Sod Production 12,625,310 1,774,771 2,364,345 4,143,358 10,867,175 16,764,426 221.6
Lawn Equipment Manufacturing - - - - - - -
Lawn care Wholesaling 135,295,600 5,814,927 8,413,128 14,709,559 24,796,474 37,769,489 224.3
Lawn care Service – Total 320,515,860 68,825,955 124,509,121 218,412,255 302,179,550 513,850,936 6,430.0
Lawn care Service – Residential 103,915,567 20,764,338 41,841,956 73,379,676 99,726,654 166,521,860 2,266.4
Lawn care Service – Commercial 170,200,445 34,009,337 68,531,787 120,186,550 163,339,540 272,741,569 3,712.0
Lawn care Service – Landscape Architectural and Design Services
2,854,980 888,352 1,469,117 2,578,689 3,248,616 5,212,450 46.7
Lawn care Service – Landscape Construction 43,544,868 13,163,928 12,666,261 22,267,340 35,864,740 69,375,057 404.9
Golf Course - Total 128,863,928 21,318,856 52,466,276 91,860,541 138,205,534 192,622,487 2,418.6
Golf Course – Playing 112,040,821 19,923,748 49,717,786 87,037,183 130,379,820 181,682,354 2,238.0
Golf Course – Apparel and Equipment 16,823,106 1,395,108 2,748,490 4,823,358 7,825,714 10,940,133 180.6
Lawn care Retailing 161,200,612 12,284,650 23,347,453 40,901,116 62,870,287 89,956,711 936.9
Other Wholesaling Activities a 13,168,064 565,955 818,832 1,431,653 2,413,393 3,676,030 21.9

22
Table 9 Cont’d. Impacts by Sector for Rhode Island.
Municipal – Grounds Maintenance 10,999,533 472,754 683,987 1,195,887 2,015,953 3,070,660 18.2
Airports 32,070 1,378 1,994 3,487 5,878 8,952 0.1
Roadways 156,483 6,725 9,730 17,013 28,679 43,683 0.3
Fields 698,622 30,026 43,442 75,955 128,041 195,029 1.2
School Grounds 727,318 31,260 45,227 79,075 133,300 203,040 1.2
Cemetery 554,037 23,812 34,452 60,236 101,542 154,666 0.9
Golf Course - Upkeep 20,175,360 867,125 1,254,570 2,193,498 3,697,665 5,632,208 33.4
Total 771,669,373 110,585,114 211,919,155 371,458,482 541,332,413 854,640,079 10,253.3 a The categories in other wholesaling activities do not include labor expenses or contracted expenses, even though these are considerable for all sectors listed. The values presented are only for inputs to turfgrass.

23
Table 10. Impacts by Sector for Vermont. Sector Direct Sales Indirect Induced Labor Income Value Added Output Employment
Sod Production 116,044 15,755 174,766 328,035 193,075 305,019 3.1
Lawn Equipment Manufacturing 13,041,846 2,538,010 1,504,790 2,504,738 4,286,083 17,084,645 63.9
Lawn care Wholesaling 541,182,400 21,311,083 27,517,038 50,807,986 87,470,774 142,993,856 956.5
Lawn care Service – Total 218,654,747 42,362,066 63,625,826 118,148,356 179,424,668 324,642,638 4,744.6
Lawn care Service – Residential 70,890,819 12,699,996 21,538,129 39,988,279 58,729,923 105,128,944 1,688.3
Lawn care Service – Commercial 116,110,121 20,800,973 35,276,709 65,495,701 96,192,124 172,187,803 2,765.3
Lawn care Service – Landscape Architectural and Design Services
1,947,657 570,736 843,930 1,565,100 1,937,275 3,362,323 34.2
Lawn care Service – Landscape Construction 29,706,150 8,290,361 5,967,058 11,099,276 22,565,346 43,963,568 256.8
Golf Course - Total 53,377,516 8,910,022 14,996,938 27,760,745 48,472,919 71,308,288 1,086.1
Golf Course – Playing 43,350,353 8,159,155 13,509,043 25,000,780 44,073,887 65,018,552 976.4
Golf Course – Apparel and Equipment 10,027,164 750,867 1,487,895 2,759,965 4,399,032 6,289,736 109.7
Lawn care Retailing 96,081,238 6,549,529 12,545,750 23,251,428 35,163,195 51,474,657 566.8
Other Wholesaling Activities a 5,185,495 204,198 263,660 486,832 838,125 1,370,135 9.1

24
Table 10 Cont’d. Impacts by Sector for Vermont.
Municipal – Grounds Maintenance 2,099,680 82,683 106,760 197,125 339,369 554,787 3.7
Airports 220,929 8,700 11,233 20,742 35,708 58,375 0.4
Roadways 344,817 13,578 17,532 32,373 55,732 91,109 0.6
Fields 638,923 25,160 32,487 59,984 103,268 168,819 1.1
School Grounds 758,081 29,852 38,545 71,171 122,528 200,304 1.3
Cemetery 1,123,064 44,225 57,103 105,437 181,520 296,741 2.0
Golf Course - Upkeep 24,422,805 961,739 1,241,805 2,292,893 3,947,434 6,453,113 43.2
Total 927,639,286 81,890,663 120,628,768 223,288,120 355,848,839 609,179,238 7,430.1 a The categories in other wholesaling activities do not include labor expenses or contracted expenses, even though these are considerable for all sectors listed. The values presented are only for inputs to turfgrass.

25
SECTOR BY SECTOR IMPACTS SOD PRODUCERS Sod producers are farms either partially or exclusively dedicated to growing sod. Based on 2012 Agricultural Census estimates New England has 121 sod farms covering 5,869 acres. Table 11 shows a breakdown of farms and acreage per state with Figure 1 indicating the state breakdown based on total regional output. Table 11. Sod Farms and Acreage per State in New England.
State Number of Farms Acres Value of Sales ($ millions)
CT 8 1,357 6.1 ME 9 958 5.1 MA 6 607 2.1 NH 1 65 0.3 RI 15 2,857 12.6 VT 1 25 0.1 TOTAL 40 5,869 26.4 Figure 1.
The regional impact of sod producers is detailed below in Table 12, including the induced and indirect impacts for employment, labor income, value added, and total output. In total, this sector provides 460 jobs and $14.5 million in labor income to the New England economy. The total output is around $38.5 million.
24%
22%
8%
1%
44%
1%
Percent of Total Regional Output from Sod Farms by State
CT
ME
MA
NH
RI
VT

26
Table 12. Total Impact for New England by Sod Producers. Direct Sales
(in thousands) Total
Employment Total Labor Income (in thousands)
Total Value Added (in thousands)
Total Output (in thousands)
Direct 26,297 346 9,867 17,301 26,296 Indirect 47 1,622 2,254 3,969 Induced 67 3,039 5,331 8,181 Total 460 14,527 24,887 38,446 LAWN EQUIPMENT MANUFACTURING “The lawn equipment manufacturing sector includes firms that manufacture commercial turf and grounds care equipment (including parts and attachments), push type lawnmowers, powered lawn edgers/trimmers, yard vacuums and blowers, lawn tractors and riding mowers, and parts and attachments for consumer lawn and garden equipment” (Haydu et al. 2006). In 2012, only Vermont (1) and Connecticut (2) had lawn equipment manufacturing as measured by the U.S. Census Bureau 2012 Manufacturing and Industry Series. Interestingly, since 2004 every state except Rhode Island had lawn equipment manufacturing at some point. Figure 2 shows the percentage contribution of each of the six New England states to the regional output. Figure 2.
The regional impact of the lawn care equipment manufacturing sector is detailed below in Table 13. In total, this sector provides 97 jobs and $4.8 million in labor income to the New England economy. Value added and total output were $9.1 million and $28 million, respectively.
39%
0 0 0 0
61%
Percent of Total Regional Output from Lawn Care
Equipment Manufacturing by State
CT
ME
MA
NH
RI
VT
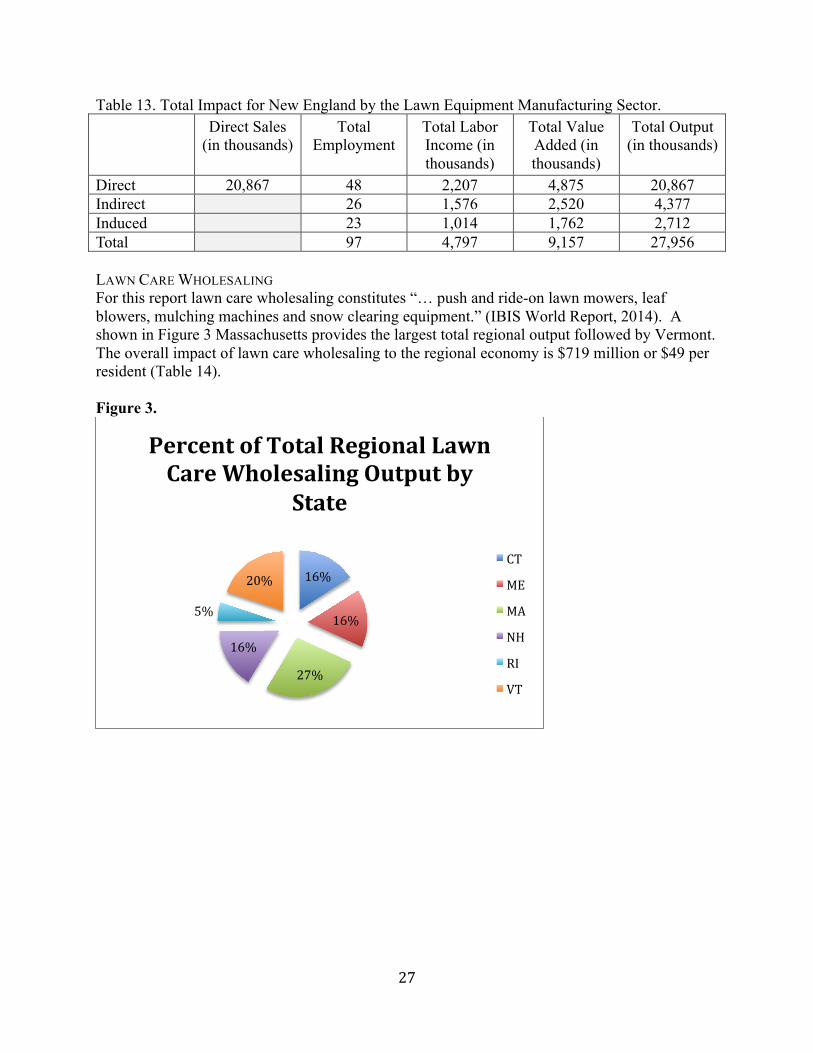
27
Table 13. Total Impact for New England by the Lawn Equipment Manufacturing Sector. Direct Sales
(in thousands) Total
Employment Total Labor Income (in thousands)
Total Value Added (in thousands)
Total Output (in thousands)
Direct 20,867 48 2,207 4,875 20,867 Indirect 26 1,576 2,520 4,377 Induced 23 1,014 1,762 2,712 Total 97 4,797 9,157 27,956 LAWN CARE WHOLESALING For this report lawn care wholesaling constitutes “… push and ride-on lawn mowers, leaf blowers, mulching machines and snow clearing equipment.” (IBIS World Report, 2014). A shown in Figure 3 Massachusetts provides the largest total regional output followed by Vermont. The overall impact of lawn care wholesaling to the regional economy is $719 million or $49 per resident (Table 14). Figure 3.
16%
16%
27%
16%
5%
20%
Percent of Total Regional Lawn Care Wholesaling Output by
State
CT
ME
MA
NH
RI
VT

28
Table 14. Total Impact for New England by the Lawn Care Wholesaling Sector. Direct Sales
(in millions) Total
Employment Total Labor Income (in millions)
Total Value Added (in millions)
Total Output (in millions)
Direct 2,571 2,115 177 298 447
Indirect 865 49 71 112
Induced 1,306 60 104 159
Total 4,286 285 473 719
LAWN CARE SERVICES The lawn care service sector includes residential and commercial lawn care, landscape and design services, and landscape construction. For this analysis we did not include snow plow/removal as part of the sector. Massachusetts has the greatest contribution accounting for 45% of the total regional output while Vermont has the smallest with only 5% of the output. The percentage contribution per state is shown in Figure 4. Figure 4.
Table 15 shows a breakdown of lawn care service contributions per state and a comparison to 2002 values. The lawn care service sector has grown by 4,689 firms and $3.3 billion in sales over the past 10 years.
25%
8% 45%
10%
8% 5%
Percent of Total Regional Lawn Care Services Output
by State
CT
ME
MA
NH
RI
VT

29
Table 15. Lawn Care Service Firms and Sales per State, 2002 and 2012 Comparison. 2002 a 2012
State Number of Firms Sales (dollars in millions – real
dollars) b
Number of Firms Sales (in millions)
CT 897 320 1,936 1,032 ME 227 62 639 341 MA 1,237 479 3,366 1,795 NH 278 85 768 410 RI 251 58 601 321 VT 141 33 410 219
TOTAL 3,031 1,037 7,720 4,109 a 2002 numbers come from Haydu, Hodges, and Hall 2006. b Adjusted to 2012 real dollars.
The regional impact of the lawn care services sector is detailed below in Table 16. In total, the New England lawn care services sector provides 82,086 jobs and $2.9 billion in labor income to the regional economy. Tables 16-19 give the direct, indirect, induced and total impacts for lawn care service sub-sectors of residential, commercial, landscape architectural and design services, and landscape construction, respectively.
Table 16. Total Impact for New England by the Lawn Care Services Sector. Direct Sales
(dollars in millions)
Employment Labor Income (dollars in millions)
Value Added (dollars in millions)
Output (dollars in millions)
Direct 4,117 62,312 1,905 2,331 4,117 Indirect 7,103 410 622 958 Induced 12,670 631 1,071 1,627 Total 82,086 2,947 4,023 6,703
Table 17. Total Impact for New England by the Lawn Care Services Sector: Sub-sector Residential. Direct Sales
(dollars in millions)
Employment Labor Income (dollars in millions)
Value Added (dollars in millions)
Output (dollars in millions)
Direct 1,335 22,496 638 780 1,335 Indirect 2,080 122 185 282 Induced 4,162 207 351 534 Total 28,738 967 1,317 2,151
Table 18. Total Impact for New England by the Lawn Care Services Sector: Sub-sector Commercial.
30
Direct Sales (dollars in millions)
Employment Labor Income (dollars in millions)
Value Added (dollars in millions)
Output (dollars in millions)
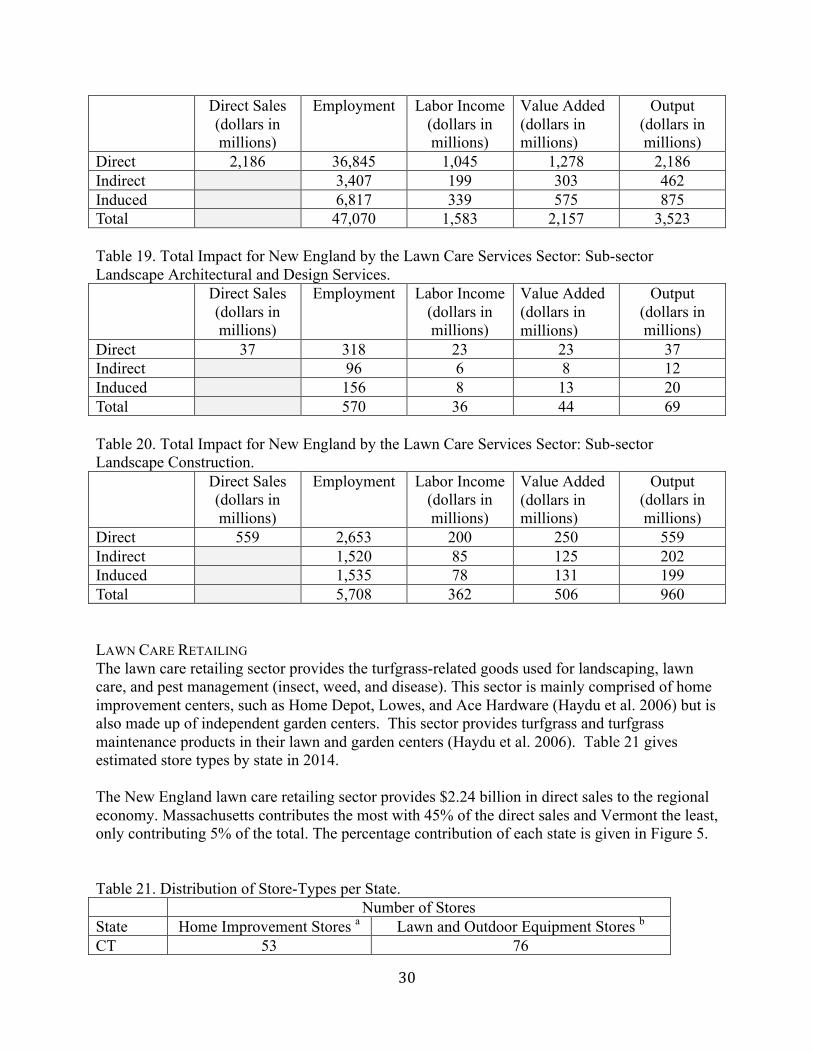
Direct 2,186 36,845 1,045 1,278 2,186 Indirect 3,407 199 303 462 Induced 6,817 339 575 875 Total 47,070 1,583 2,157 3,523 Table 19. Total Impact for New England by the Lawn Care Services Sector: Sub-sector Landscape Architectural and Design Services. Direct Sales
(dollars in millions)
Employment Labor Income (dollars in millions)
Value Added (dollars in millions)
Output (dollars in millions)
Direct 37 318 23 23 37 Indirect 96 6 8 12 Induced 156 8 13 20 Total 570 36 44 69 Table 20. Total Impact for New England by the Lawn Care Services Sector: Sub-sector Landscape Construction. Direct Sales
(dollars in millions)
Employment Labor Income (dollars in millions)
Value Added (dollars in millions)
Output (dollars in millions)
Direct 559 2,653 200 250 559 Indirect 1,520 85 125 202 Induced 1,535 78 131 199 Total 5,708 362 506 960 LAWN CARE RETAILING The lawn care retailing sector provides the turfgrass-related goods used for landscaping, lawn care, and pest management (insect, weed, and disease). This sector is mainly comprised of home improvement centers, such as Home Depot, Lowes, and Ace Hardware (Haydu et al. 2006) but is also made up of independent garden centers. This sector provides turfgrass and turfgrass maintenance products in their lawn and garden centers (Haydu et al. 2006). Table 21 gives estimated store types by state in 2014. The New England lawn care retailing sector provides $2.24 billion in direct sales to the regional economy. Massachusetts contributes the most with 45% of the direct sales and Vermont the least, only contributing 5% of the total. The percentage contribution of each state is given in Figure 5. Table 21. Distribution of Store-Types per State. Number of Stores State Home Improvement Stores a Lawn and Outdoor Equipment Stores b CT 53 76

31
ME 27 34 MA 96 76 NH 48 38 RI 16 11 VT 32 19 a Reference: IBIS World Reports (http://clients1.ibisworld.com/reports/us/industry/productsandmarkets.aspx?entid=1031) b Reference: IBIS World Reports (http://clients1.ibisworld.com/reports/us/industry/default.aspx?entid=1036) The regional impact of the lawn care retailing sector is detailed below in Table 22. In total, the New England lawn care retailing sector provides 12,914 jobs and almost $600 million in labor income to the regional economy. As can be seen in Figure 5, MA and CT are the largest states for lawn care retailing. Table 22. Total Impact for New England by the Lawn Care Retailing Sector. Direct Sales
(dollars in millions)
Employment Labor Income (dollars in millions)
Value Added (dollars in millions)
Output (dollars in millions)
Direct 2,235 8,932 390 528 753 Indirect 1,399 80 139 207 Induced 2,583 128 218 331 Total 12,914 598 885 1,291 Figure 5.
GOLF COURSES New England’s 934 golf courses directly contribute $2.5 billion to the regional economy (Tables 23 - 26) with MA having both the largest number of courses but also the most economic impact of any New England state (Figure 6). When breaking the numbers down further, we see playing golf (i.e. green fees and memberships) contributes the bulk of the impact.
25%
8% 45%
10%
8% 5%
Percent of Total Regional Lawn Care Retailing Output by State
CT
ME
MA
NH
RI

32
Table 23. Number of Golf Courses per State in 2012. State Courses Population/Course CT 178 20,170 ME 140 9,494 MA 377 17,629 NH 113 11,688 RI 57 18,426 VT 69 9,073 Total 934 15,592 a Reference: American Association of Retired People (http://www.aarp.org/entertainment/arts-leisure/info-08-2011/golf-courses.html)
Figure 6.
28%
5% 48%
8% 8% 3%
Percent of Total Regional Golf Course (Greens Fees, Memberships and Equipment/Apparel Sales) by
State
CT
ME
MA
NH
RI
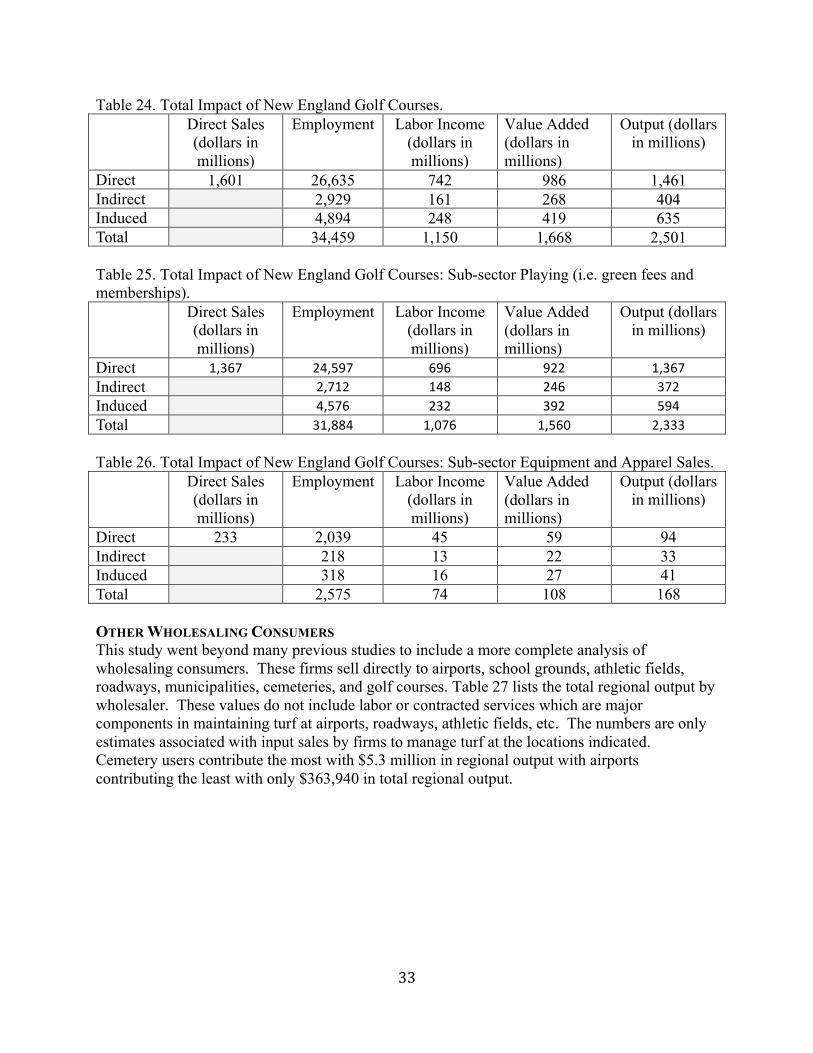
33
Table 24. Total Impact of New England Golf Courses. Direct Sales
(dollars in millions)
Employment Labor Income (dollars in millions)
Value Added (dollars in millions)
Output (dollars in millions)
Direct 1,601 26,635 742 986 1,461 Indirect 2,929 161 268 404 Induced 4,894 248 419 635 Total 34,459 1,150 1,668 2,501 Table 25. Total Impact of New England Golf Courses: Sub-sector Playing (i.e. green fees and memberships). Direct Sales
(dollars in millions)
Employment Labor Income (dollars in millions)
Value Added (dollars in millions)
Output (dollars in millions)
Direct 1,367 24,597 696 922 1,367 Indirect 2,712 148 246 372 Induced 4,576 232 392 594 Total 31,884 1,076 1,560 2,333 Table 26. Total Impact of New England Golf Courses: Sub-sector Equipment and Apparel Sales. Direct Sales
(dollars in millions)
Employment Labor Income (dollars in millions)
Value Added (dollars in millions)
Output (dollars in millions)
Direct 233 2,039 45 59 94 Indirect 218 13 22 33 Induced 318 16 27 41 Total 2,575 74 108 168 OTHER WHOLESALING CONSUMERS This study went beyond many previous studies to include a more complete analysis of wholesaling consumers. These firms sell directly to airports, school grounds, athletic fields, roadways, municipalities, cemeteries, and golf courses. Table 27 lists the total regional output by wholesaler. These values do not include labor or contracted services which are major components in maintaining turf at airports, roadways, athletic fields, etc. The numbers are only estimates associated with input sales by firms to manage turf at the locations indicated. Cemetery users contribute the most with $5.3 million in regional output with airports contributing the least with only $363,940 in total regional output.

34
Table 27. Breakdown of Acres Associated with Various Turf Operations. LOCATION NUMBER IN NEW
ENGLAND APPROX. ACREAGE
Airports (number) 365 14,600 Roadways (miles) 117,473 284,783 a Athletic Fields (number) 14,846 14,219 School Grounds (number) 7,132 50,707 Municipalities/Towns (number)
1,662 NA
Cemetery (number) 6,130 120,499 Golf Courses (number) 934 93,867 Household lawns (number) 5,625,126
3,937,588
a Assumed 10 feet on each side of roadway as maintained. This is an overestimate as an unknown amount of area is not turf related. In the various turf locations listed in Table 27, the impact of household lawns is captured in the lawn care retailing sector discussed above, so it will not be discussed here. Further, the results for turf-related expenditures at golf courses are presented in order to detail the impact associated with direct turf input purchasing. Golf turf expenditures in the context of this report can be thought of as sales by wholesalers/retailers to golf courses. The estimates for golf related turf expenditures are not incorporated into the sum of other wholesaler impacts because they are accounted for in the golf sector. Golf turf inputs expenditures, not including labor, was estimated to be $331 million with a regional total output of $93 million. Total direct employment, golf course level, was 262 with indirect and induced employment at 107 and 168, respectively. Table 28. Impact of Golf Turf Input Purchasing, not Including Labor. ab Direct Sales
(in million dollars)
Total Employment
Total Labor Income (in
million dollars)
Total Value Added (in
million dollars)
Total Output (in million
dollars)
Direct 331 262 23 39 58
Indirect 107 7 10 15
Induced 168 8 14 21
Total 536 38 63 93
a These values do not include labor or contracted services. b Sales at these operations can also be thought of as expenditures on turf related items or sales to suppliers selling the inputs.

35
The regional impact of the other wholesalers (not including golf course input expenditures) is detailed in Table 29. In total, this sector provides 165 jobs and $12 million in labor income to the New England economy. Detailed impacts for each sub-sector within other wholesaling are in Tables 29-35. Table 29. Total Impact for New England by the Other Wholesaling Consumers’ Sector. ab Direct Sales
(in million dollars)
Total Employment
Total Labor Income (in
million dollars)
Total Value Added (in
million dollars)
Total Output (in million
dollars)
Direct 102 81 7 12 18
Indirect 33 2 3 5
Induced 51 3 4 7
Total 165 12 19 29
a These values do not include labor or contracted services. b Sales at these operations can also be thought of as expenditures on turf related items or sales to suppliers selling the inputs. Table 30. Total Impact for New England from Municipal Grounds Maintenance. ab Direct Sales
(in million dollars)
Total Employment
Total Labor Income (in
million dollars)
Total Value Added (in
million dollars)
Total Output (in million
dollars)
Direct 56 45 4 7 10
Indirect 19 1 2 3
Induced 28 1 2 4
Total 92 6 11 16
a These values do not include labor or contracted services. b Sales at these operations can also be thought of as expenditures on turf related items or sales to suppliers selling the inputs.
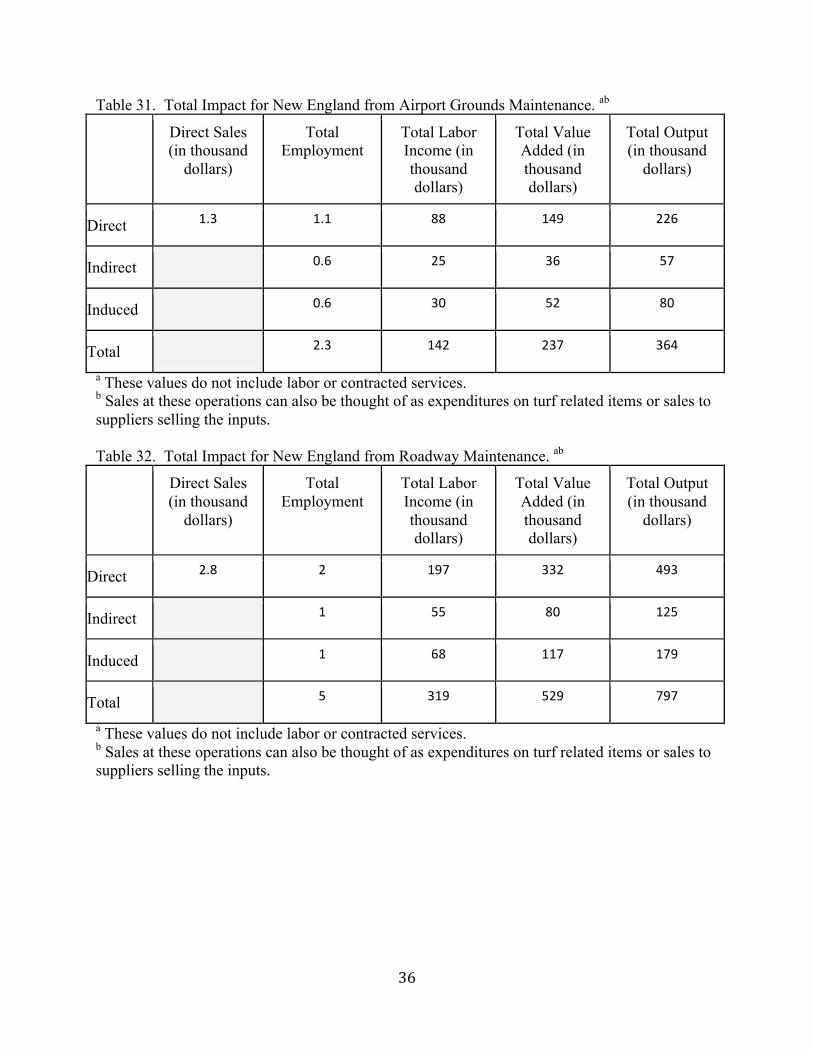
36
Table 31. Total Impact for New England from Airport Grounds Maintenance. ab Direct Sales
(in thousand dollars)
Total Employment
Total Labor Income (in thousand dollars)
Total Value Added (in thousand dollars)
Total Output (in thousand
dollars)
Direct 1.3 1.1 88 149 226
Indirect 0.6 25 36 57
Induced 0.6 30 52 80
Total 2.3 142 237 364
a These values do not include labor or contracted services. b Sales at these operations can also be thought of as expenditures on turf related items or sales to suppliers selling the inputs. Table 32. Total Impact for New England from Roadway Maintenance. ab Direct Sales
(in thousand dollars)
Total Employment
Total Labor Income (in thousand dollars)
Total Value Added (in thousand dollars)
Total Output (in thousand
dollars)
Direct 2.8 2 197 332 493
Indirect 1 55 80 125
Induced 1 68 117 179
Total 5 319 529 797
a These values do not include labor or contracted services. b Sales at these operations can also be thought of as expenditures on turf related items or sales to suppliers selling the inputs.

37
Table 33. Total Impact for New England from Athletic Fields Maintenance. ab Direct Sales
(in thousand dollars)
Total Employment
Total Labor Income (in thousand dollars)
Total Value Added (in thousand dollars)
Total Output (in thousand
dollars)
Direct 12,521 10 887 1,495 2,179
Indirect 4 248 364 557
Induced 6 310 528 804
Total 20 1,445 2,386 3,539
a These values do not include labor or contracted services. b Sales at these operations can also be thought of as expenditures on turf related items or sales to suppliers selling the inputs. Table 34. Total Impact for New England from School Grounds. ab Direct Sales
(in thousand dollars)
Total Employment
Total Labor Income (in thousand dollars)
Total Value Added (in thousand dollars)
Total Output (in thousand
dollars)
Direct 10,270 8 724 1,220 1,787
Indirect 3 202 296 455
Induced 5 251 430 655
Total 17 1,177 1,946 2,897
a These values do not include labor or contracted services. b Sales at these operations can also be thought of as expenditures on turf related items or sales to suppliers selling the inputs.

38
Table 35. Total Impact for New England from Cemetery Maintenance ab Direct Sales
(in thousand dollars)
Total Employment
Total Labor Income (in thousand dollars)
Total Value Added (in thousand dollars)
Total Output (in thousand
dollars)
Direct 18,908 15 1,344 2,275 3,290
Indirect 6 374 552 839
Induced 9 472 798 1,216
Total 30 2,190 3,625 5,345
a These values do not include labor or contracted services. b Sales at these operations can also be thought of as expenditures on turf related items or sales to suppliers selling the inputs.
CONCLUSIONS Based on the results presented in this report it is clear that the turfgrass industry has a substantial impact on the regional New England economy. The turfgrass industry contributes over $10.6 billion in direct sales, $5 billion in labor income, $7.1 billion in value added, with a total output impact of $11.3 billion in 2012. Furthermore 134,000 people are either directly or indirectly impacted by the turfgrass industry. These contributions to the economy do not take into account aesthetic or sectors (such as golf) that have impacts farther away from turf than this report examined. With respect to state differences, MA had the largest impact while VT had the smallest impact on the regional economy. However, each state makes important contributions through the various turfgrass sectors and as an entire industry.

39
LITERATURE AND INFORMATION SOURCES CITED
Beard, J.B. and Green, R.L. 1994. The role of turfgrasses in environmental protection and their benefits to humans. Journal of Environmental Quality, 23, 452-460.
Blanco-Montero, C.A., Bennett, T.B., Neville, P., Crawford, C.S., Milne, B.T., and Ward, C.R.
1995. Potential environmental and economic impacts of turfgrass in Alburqurque, New Mexico (USA). Landscape Ecology, 10(2), 121-128.
Haydu, J.J., Hodges, A.W., and Hall, C.R. 2008. Estimating the economic impact of the U.S.
golf course industry: challenges and solutions. HortScience, 43(3), 759-763. Haydu, J.J., Hodges, A.W., and Hall, C.R. 2006. Economic impacts of the turfgrass and lawncare
industry in the United States. Food & Res. Econ. Dept. FCES, IFAS, UF IMPLAN Group, LLC, IMPLAN System (Versoion 3.0 with 2012 data), 16740 Birkdale
Commons Parkway, Suite 206, Huntersville, NC 28078 www.IMPLAN.COM Miller, R.E. and Blair, P.D. 1985. Input-‐output analysis: foundations and extensions.
Prentice-‐Hall, Englewood Cliffs, NJ, 464. Milesi, C., S. W. Running, C. D. Elvidge, J. B. Dietz, B. T. Tuttle, and R. R. Nemani. 2005.
Mapping and modeling the biogeochemical cycling of turf grasses in the United States. Environmental Management 36 (3): 426–38
SRI International. 2014. The Massachusetts golf economy: Full report. Available at:
http://www.massgolfeconomy.com/uploads/9/3/9/3/9393486/ma_golf_full_rpt_sri_final_2014.pdf
40
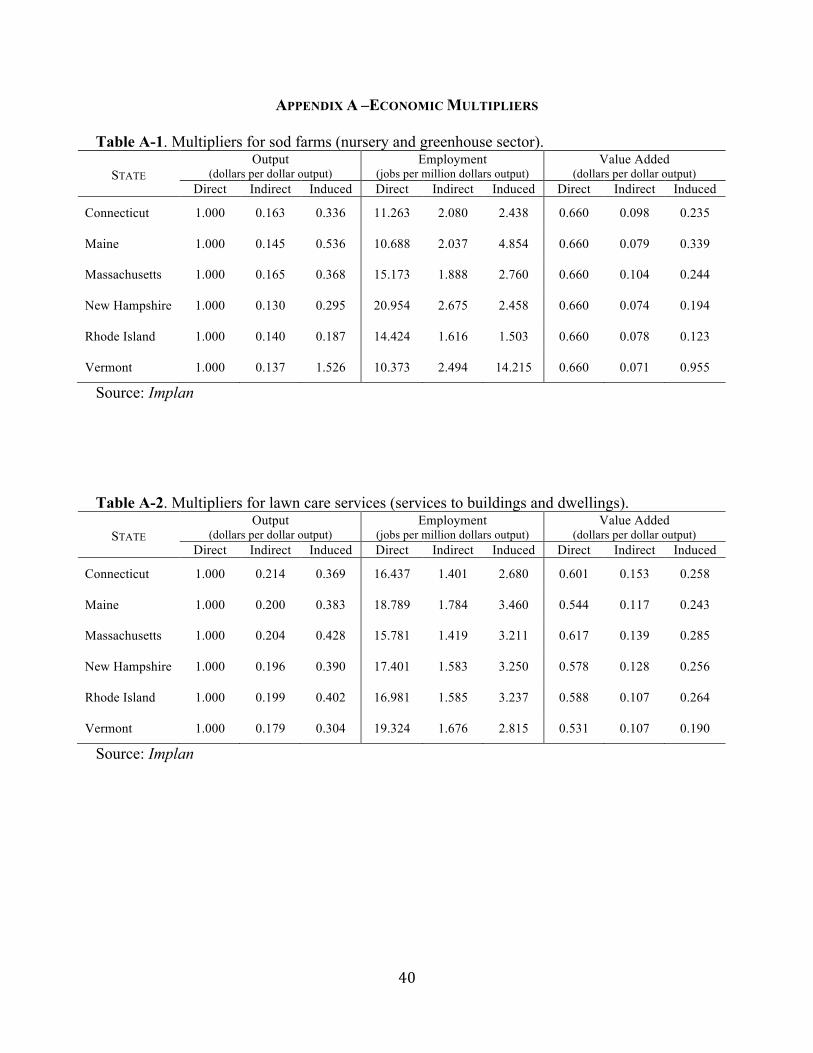
APPENDIX A –ECONOMIC MULTIPLIERS Table A-1. Multipliers for sod farms (nursery and greenhouse sector).
STATE Output
(dollars per dollar output) Employment
(jobs per million dollars output) Value Added
(dollars per dollar output) Direct Indirect Induced Direct Indirect Induced Direct Indirect Induced
Connecticut 1.000 0.163 0.336 11.263 2.080 2.438 0.660 0.098 0.235
Maine 1.000 0.145 0.536 10.688 2.037 4.854 0.660 0.079 0.339
Massachusetts 1.000 0.165 0.368 15.173 1.888 2.760 0.660 0.104 0.244
New Hampshire 1.000 0.130 0.295 20.954 2.675 2.458 0.660 0.074 0.194
Rhode Island 1.000 0.140 0.187 14.424 1.616 1.503 0.660 0.078 0.123
Vermont 1.000 0.137 1.526 10.373 2.494 14.215 0.660 0.071 0.955
Source: Implan Table A-2. Multipliers for lawn care services (services to buildings and dwellings).
STATE Output
(dollars per dollar output) Employment
(jobs per million dollars output) Value Added
(dollars per dollar output) Direct Indirect Induced Direct Indirect Induced Direct Indirect Induced
Connecticut 1.000 0.214 0.369 16.437 1.401 2.680 0.601 0.153 0.258
Maine 1.000 0.200 0.383 18.789 1.784 3.460 0.544 0.117 0.243
Massachusetts 1.000 0.204 0.428 15.781 1.419 3.211 0.617 0.139 0.285
New Hampshire 1.000 0.196 0.390 17.401 1.583 3.250 0.578 0.128 0.256
Rhode Island 1.000 0.199 0.402 16.981 1.585 3.237 0.588 0.107 0.264
Vermont 1.000 0.179 0.304 19.324 1.676 2.815 0.531 0.107 0.190
Source: Implan
41
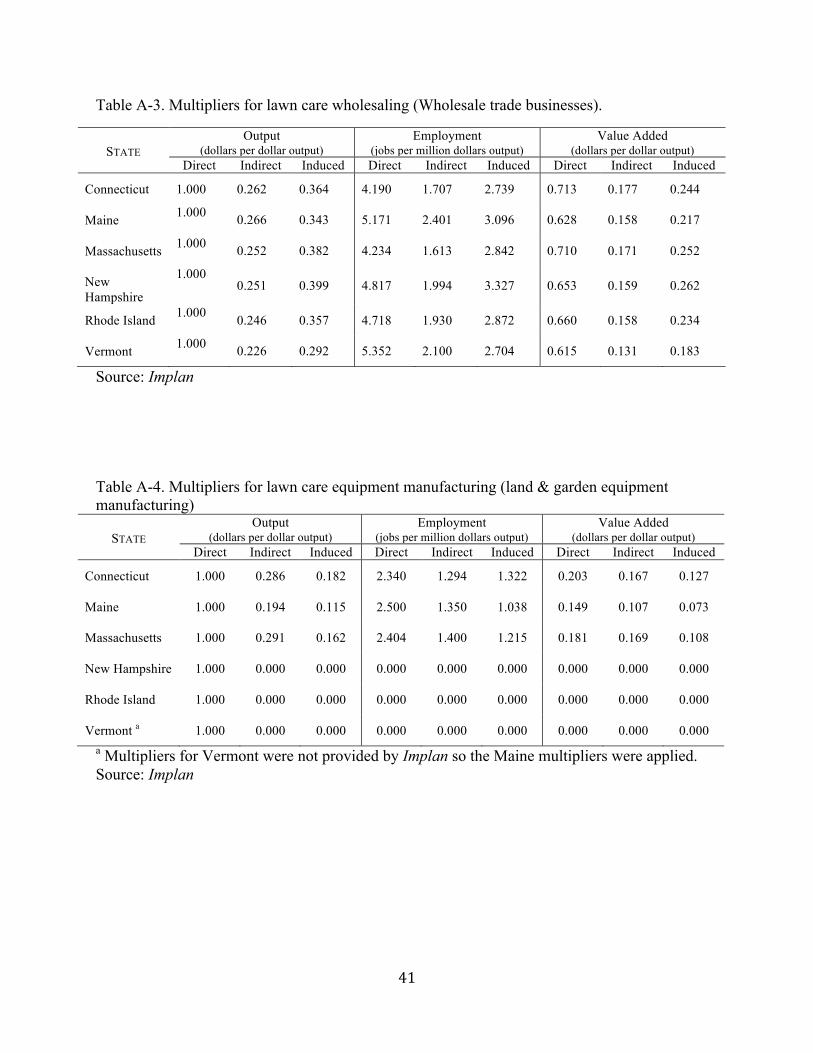
Table A-3. Multipliers for lawn care wholesaling (Wholesale trade businesses).
STATE Output
(dollars per dollar output) Employment
(jobs per million dollars output) Value Added
(dollars per dollar output) Direct Indirect Induced Direct Indirect Induced Direct Indirect Induced
Connecticut 1.000 0.262 0.364 4.190 1.707 2.739 0.713 0.177 0.244
Maine 1.000 0.266 0.343 5.171 2.401 3.096 0.628 0.158 0.217
Massachusetts 1.000 0.252 0.382 4.234 1.613 2.842 0.710 0.171 0.252
New Hampshire
1.000 0.251 0.399 4.817 1.994 3.327 0.653 0.159 0.262
Rhode Island 1.000 0.246 0.357 4.718 1.930 2.872 0.660 0.158 0.234
Vermont 1.000 0.226 0.292 5.352 2.100 2.704 0.615 0.131 0.183
Source: Implan Table A-4. Multipliers for lawn care equipment manufacturing (land & garden equipment manufacturing)
STATE Output
(dollars per dollar output) Employment
(jobs per million dollars output) Value Added
(dollars per dollar output) Direct Indirect Induced Direct Indirect Induced Direct Indirect Induced
Connecticut 1.000 0.286 0.182 2.340 1.294 1.322 0.203 0.167 0.127
Maine 1.000 0.194 0.115 2.500 1.350 1.038 0.149 0.107 0.073
Massachusetts 1.000 0.291 0.162 2.404 1.400 1.215 0.181 0.169 0.108
New Hampshire 1.000 0.000 0.000 0.000 0.000 0.000 0.000 0.000 0.000
Rhode Island 1.000 0.000 0.000 0.000 0.000 0.000 0.000 0.000 0.000
Vermont a 1.000 0.000 0.000 0.000 0.000 0.000 0.000 0.000 0.000 a Multipliers for Vermont were not provided by Implan so the Maine multipliers were applied. Source: Implan

42
Table A-5. Multipliers for lawn care retailing (building material and garden supply stores).
STATE Output
(dollars per dollar output) Employment
(jobs per million dollars output) Value Added
(dollars per dollar output) Direct Indirect Induced Direct Indirect Induced Direct Indirect Induced
Connecticut 1.000 0.253 0.414 11.591 1.561 3.000 0.736 0.181 0.289
Maine 1.000 0.233 0.431 12.601 1.992 3.893 0.713 0.143 0.273
Massachusetts 1.000 0.270 0.486 12.361 1.737 3.642 0.718 0.187 0.323
New Hampshire 1.000 0.259 0.477 13.767 1.924 3.971 0.686 0.171 0.313
Rhode Island 1.000 0.226 0.429 12.155 1.630 3.454 0.723 0.152 0.282
Vermont 1.000 0.202 0.387 12.186 1.733 3.587 0.722 0.121 0.243
Source: Implan Table A-6. Multipliers for golf courses (amusement, gambling and recreation services).
STATE Output
(dollars per dollar output) Employment
(jobs per million dollars output) Value Added
(dollars per dollar output) Direct Indirect Induced Direct Indirect Induced Direct Indirect Induced
Connecticut 1.000 0.217 0.387 15.875 1.454 2.808 0.744 0.153 0.271
Maine 1.000 0.229 0.426 19.512 2.075 3.846 0.685 0.138 0.270
Massachusetts 1.000 0.269 0.466 19.123 1.887 3.491 0.692 0.180 0.310
New Hampshire 1.000 0.260 0.426 21.710 2.091 3.546 0.650 0.168 0.280
Rhode Island 1.000 0.177 0.443 14.977 1.425 3.565 0.758 0.114 0.291
Vermont 1.000 0.188 0.312 17.907 1.732 2.882 0.711 0.110 0.195
Source: Implan
43
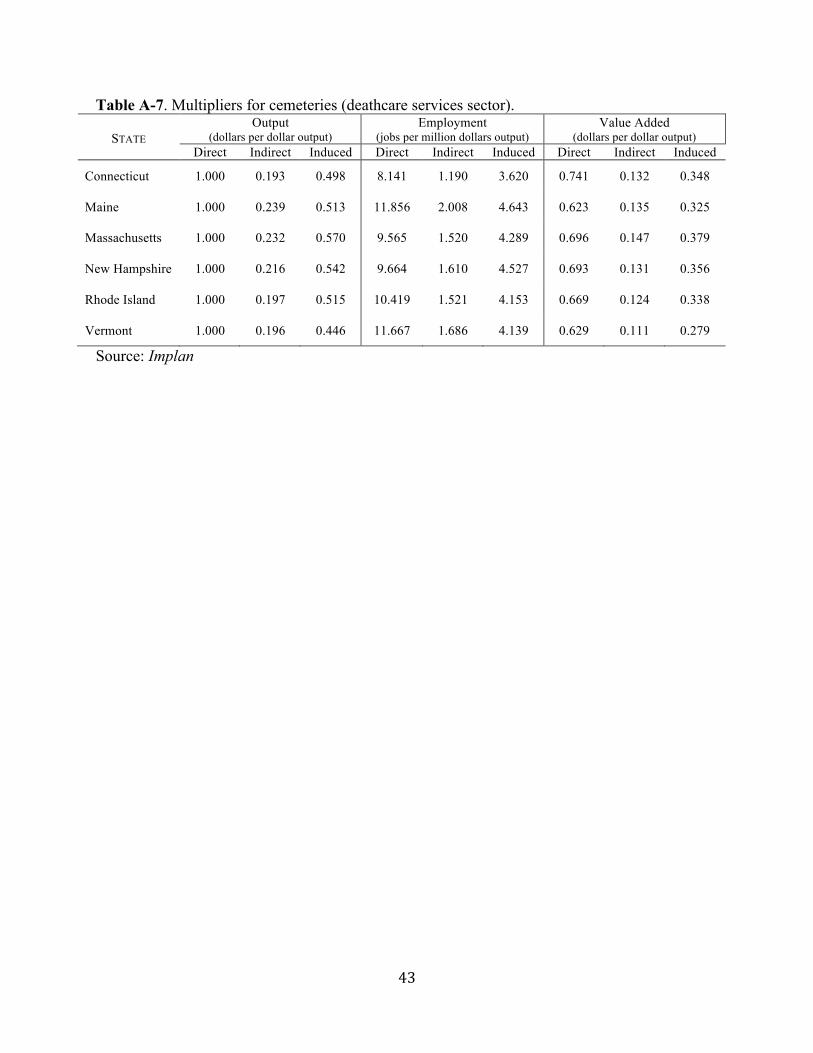
Table A-7. Multipliers for cemeteries (deathcare services sector).
STATE Output
(dollars per dollar output) Employment
(jobs per million dollars output) Value Added
(dollars per dollar output) Direct Indirect Induced Direct Indirect Induced Direct Indirect Induced
Connecticut 1.000 0.193 0.498 8.141 1.190 3.620 0.741 0.132 0.348
Maine 1.000 0.239 0.513 11.856 2.008 4.643 0.623 0.135 0.325
Massachusetts 1.000 0.232 0.570 9.565 1.520 4.289 0.696 0.147 0.379
New Hampshire 1.000 0.216 0.542 9.664 1.610 4.527 0.693 0.131 0.356
Rhode Island 1.000 0.197 0.515 10.419 1.521 4.153 0.669 0.124 0.338
Vermont 1.000 0.196 0.446 11.667 1.686 4.139 0.629 0.111 0.279
Source: Implan