economic impact of trade exhibitions on the city-state ... · the exhibition industry can have...
TRANSCRIPT
1
Economic Impact of Trade Exhibitions on the City-state
Singapore Economy
Dr Cao Yong &
Dr Michael Li Zhi-feng
Nanyang Technological University Singapore
1. The Objective This paper aims to study the economic impact of the trade exhibitions on the
city-state Singapore economy from an intensive nation-wide survey as well as
secondary source data for year 2000. An analytical model is developed to
measure the economic impact on the following parameters:
• Output;
• Value added (or GDP);
• GST and gross tax revenue;
• Employment or jobs;
• Income (remuneration)
• Export, import and net foreign exchange earnings;
In all these parameters, the direct, indirect and induced impacts will be
assessed to cover all aspects of the Singapore economy to be affected by the
trade exhibition industry. Hence, the study will also provide detailed
description of the trade exhibition industry’s impact and economic multiplier on
the various relevant industries such as hotels, food & beverage, transportation
and other business service industries. In other words, there will be detailed
breakdowns of the total impact according to the related industries.
2. The Conceptual Framework of Economic Impact of Industry Activities

2
Economic impacts are defined in this study as the changes in economic
activity resulting from the activities in the trade exhibition industry. These
changes have been expressed in terms of industrial output, value added,
employment, foreign exchange earning and good and service taxes (GST).
Traditionally, an important use of the economic impact assessment tools is to
measure or predict the economic effects of changes in tourism development
and activity. Spending of tourists in a host community or region creates sales,
income, jobs, tax revenues, and related economic activity. Recently, many
such economic impact studies have been applied to exhibition industry as it
not only includes the feature of tourism industry but also stimulate other
export-related income from sectors such as freight transportation,
advertisement and other business services. The exhibition industries in the
internationalized cities such as Hong Kong, New York and Singapore are
especially so.
The exhibition industry can have successive and magnified influences on a
local economy in three ways.
• The initial injection of the exhibition spending (including spending from
companies involved in the exhibitions and from exhibitors and visitors)
provides direct revenues for organisers, contractors, venue operators,
freight forwarders, hotels, food & beverage, retailers, airlines, sightseeing
and creations, telecommunications and other local services.
• Second, the recipients of these direct expenditures spend some of that
money to purchase the necessary inputs such as labour and materials. For
instance, contractors purchase materials to build exhibition equipment and
facilities; hotels purchase raw food for their restaurants, etc. This
economic activity constitutes the indirect effect. One may have to notice
the subtle revolving effect of these changes resulting from the initial trade
exhibition activities between all economic sectors. Simply speaking, the

3
indirect effect would also feed back to the industries initially involved in the
trade exhibitions in many rounds. Hence, the multiplier effect is named to
account such revolving effect of changes in all sectors. If these multiplier
effects, for example in sales revenue, are added to the above direct sales
revenue of the industries initially involved in the trade exhibitions, the total
sales revenue of these industries from trade exhibitions should become
obviously more than their initial sales revenue. One will see very soon
that such distinction between the original sales revenue and the total sales
revenue from trade exhibitions is quite critical while considering the
multiplier impact of trade exhibitions in the whole economy.
• Third, the beneficiaries of these direct and indirect revenues in turn spend
their newly acquired income on unrelated goods and services, such as,
housing, transportation and entertainment. This activity spurs successive
rounds of purchases, with each round having diminishing effects because
of leakage due to savings and purchase of imported products and
services. This third type of spending creates the induced effect that is
usually termed as the Keynesian consumption multiplier effect.
Taking together, the total effect of successive rounds of spending is a
multiplier of original sales revenue from industries involved in the trade
exhibitions. A simple measure of economic impact of trade exhibition would
be the total effect itself. This simple measure means that the opportunity
cost or the benefit forgone for not having the trade exhibition industry is the
total effect. However, if one would like to measure the multiplier impact of
the trade exhibition activities in the whole economy, there are two alternative
measures:
(a) The total effect over the original sales revenue from industries initially
involved in trade exhibitions.
(b) The total effect over the total sales revenue from industries initially
involved in the trade exhibition.

4
As explained above, the total sales revenue should be higher than the original
sales revenue. Hence, the first measure of multiplier impact should have
higher magnitude than the second.
3. Data for the Key Industries in the Trade Exhibition
Since the aim of this study is to assess the economic impact in Singapore for
year 2000, one of the key tasks of this study is to obtain a complete industrial
data from a comprehensive nation-wide survey and to utilize some secondary
data sources provided by government bodies, such as Singapore Trade
Development Board (TDB), Singapore Tourism Board (STB) and the
Department of Statistics (DOS). The design of the survey and the compilation
of data from secondary data sources are based on the understanding of the
industrial structure for industries that directly involve in and are affected by
trade exhibition.
3.1. The Industrial Structure for the Industries in Trade Exhibition The exhibition industry in Singapore directly involves four kinds of players:
(1) The venue operators: They provide exhibition space and exhibition-
related services. Their revenue includes
♦ Rentals for the exhibition spaces
♦ Service charges for exhibition functions
(2) The exhibition organizers: They organize regular and irregular
(annualized or other irregular) exhibitions. If the organizers are not the
venue operators, they will rent the exhibition spaces from various
exhibition centers and partition the spaces into small standard shell booths
and, eventually, sublet these booths to participants. Their revenue will
include
♦ Rentals from standard shell booths

5
♦ Service charge
♦ To the regular exhibition participants: (a) charges of
advertisement in local papers and media, (b) other
management fees if the participant would trust the organizers
to manage their product exhibitions.
♦ To the irregular exhibition participants: (a) charges of
advertisement in local papers and media, (b) other services
charges such as providing hotel booking, teas and food for
the exhibition and tourism arrangements.
(3) The exhibitors: They demonstrate their products in the exhibitions. They
can be further divided into local and foreign participants. Most of
exhibitors will have their staff attending the exhibitions. However, some
exhibitors will only send their products for the exhibitions and trust the
organizers to manage the exhibitions for them.
(4) Visitors: They participate exhibitions in order to view the products and
make potential orders. They can be further divided into local and foreign
visitors. There may be some visitors who do not have direct business
interest from visiting the exhibitions but just have general interest on the
exhibitions. They are mostly tourists.
The exhibition industry will have their impact on various industries. Based on
the degree of impact, we can categorize the related industries in the following
tiers:
(1) The first tier: the directly related industries
♦ Freight forwarders
♦ Designer/stand
♦ Supply of various exhibition-related equipment
♦ Transportation industry: airline, port, taxis
♦ Packaging and storage
(2) The second tier: these indirectly related supporting industries

6
♦ Hotels
♦ Food & Beverage (Restaurants)
♦ Telecommunication and postage
♦ Banking and financing
♦ Advertisement and publication
♦ Retail trade: spending by the exhibitors and visitors
♦ Entertainment
♦ Tourism
(3) Third tier:
♦ The supporting industries to all the above industries. For example,
relevant equipment rental industries, food, fruit, meat and diary import
industries, clothing and fashion industries, labor service industry.
In the conventional wisdom, industries in the 1st and 2nd tiers are considered
as industries directly involved in trade exhibitions since a trade show will not
be possible without their active involvement. Although all these industries in
the 1st tier and 2nd tier industries will generate output from trade exhibitions,
their roles in trade exhibitions are substantially different. The first tier
industries actively and directly contribute to the trade exhibition events while
the 2nd tier industries eventually derive revenue from the expenditures of
exhibitors and visitors. In other words, the first tier industries play more active
and direct roles in trade exhibitions than the second tier industries. Following
the conventional industry grouping for the trade exhibition industries, a
relatively large industrial base will have to be used for the impact study. The
derived multiple times1 of impact will thus be relatively small. If only the first
1 Readers may wonder why we use the term “multiple times” instead of the normal term of
“multiplier”. The reason is that we do not want to cause any confusion with the various
multipliers derived from the Input-Output Table in the coming sections. In fact, the purpose
of this paragraph is to warn the readers to be aware of the fact that the magnitude of the
actual impact depends on the selection of the base.

7
tier industries are considered as industries in trade exhibition industries, a
relatively small industrial base will be applied for impact study. Consequently
the derived multiple times of impact will have to be larger. In the following
analysis of multiple times of economic impact of trade exhibition, we will try to
explore the sensitivities by applying the two different industry groupings.
3.2. The Primary Data from the Nation-wide Survey
At the beginning of the study, we were informed by the Study Committee that
there have been about 50 companies actively involved in the trade exhibition
before the survey was designed. However, based on the information from the
Exhibition Industry Directory compiled by TDB, our survey has tried to cover
more than 200 companies in the following sectors of exhibition industry (See
Appendix I for list of these companies):
(1) Professional exhibition organizers: 41 companies
(2) Venue operators: 14 companies
(3) Design & stand contactors: 116 companies
(4) Fright forwarders: 13 companies
(5) Suppliers: 14 companies
(6) Destinations: 11 companies
(7) Other: 10 companies
The aim of this wide coverage is to make such survey a comprehensive
nation-wide survey for this industry. It should nevertheless be noticed that the
number of companies in the category of Design & Stand Contractors consists
of more than half of the companies in the survey. We found from the survey
that many companies in this category were either no longer in operation for
the trade exhibition or too small to be able to report their involvement in trade
exhibition statistically meaningfully. We also found the same situation, to a
less extend, in other categories. Therefore, the number of companies that
participated in the survey was effectively restricted to 44, very close to the
number suggested by the Study Committee. By considering such reasonable

8
omission of these insignificant companies from the survey, we believe that the
survey has covered the majority of key players in all categories (see Appendix
I for these companies).
Before finalizing the survey forms, we have conducted brainstorming sessions
with various key players in the exhibition industry. In the end, six survey forms
were created for the primary data collection. Details of these survey forms are
attached in Appendix II.
The data of the following statistics has been collected from the survey:
(1) Operation revenue or total sales
(2) Operation expenditure including key expenditure components
for events organizers
(3) GST payment
(4) Corporate tax
(5) Other indirect taxes
(6) Remuneration
(7) The number of full time employees
(8) The number of part time employees
(9) Aggregate events statistics of foreign and local exhibitors and
visitors from event organizers
(10) Individual event statistics of foreign and local exhibitors and
visitors, exhibition space, period of shows.
Except for the event statistics, the rest of the data in the above list are
confidential information. To protect the interests of responding companies,
these data will remain to be confidential and will not available to anyone else
except the two neutral government bodies, namely TBD and STB, with the
sole purpose of cross-checking the model.
Additional questions in regarding to the competitive situations of exhibition
industry are also asked in the survey forms. From these qualitative questions

9
through survey, we will be able to collect additional qualitative information on
many aspects of the industry, such as, perception on the industry
performance, the role of government agencies, the impact of government
services and policies, fee structures. These tangible and intangible aspects
will be important for both government and industry initiatives in helping and
positioning the industry in the coming years. They are also very useful to
unlock the linkages between the industry performance and the various
multipliers generated by the model.
3.3. Secondary Data Sources
TDB, STB and the Department of Statistics (DOS) have been approached to
obtain the following data.
(1) The Number of Foreign Exhibitors and Visitors and the Number of Days
that Foreign Exhibitors and Visitors Stayed in Singapore
Initially, TDB has provided the data from 29 trade exhibitions approved or
endorsed by TDB in 2000. STB has subsequently provided the data from 41
trade exhibitions that overlap 25 trade exhibitions provided by TDB. During
our survey exercise, we obtained data for a few more additional trade
exhibitions. In the end, these three sources have provided the data of foreign
exhibitors and visitors from 51 trade exhibitions (See Appendix III for the
data). These shows together provide a fairly comprehensive coverage of
trade exhibition activities in Singapore for year 2000.
Since the exhibition companies only reported the number of exhibition
companies participated in exhibition instead of the number of individuals from
the exhibition companies, we considered the following two scenarios to covert
the company numbers into number of individuals from companies for the
empirical sensitivity studies:

10
• Multiplying the number of exhibition companies by 3 by conservatively
assuming that each company only sent 3 people to exhibition.
• Based on our survey of the four trade exhibitions in 2001, namely, MTA
Asia, Sial Asia, CommunicAsia and Pala, the average number of
individuals from exhibition companies is very close to 6 people. We hence
multiply the number of exhibition companies by 6.
In regarding to how many days that foreign exhibitors and visitors stayed in
Singapore for the exhibition, we basically relied on the actual days of each
exhibition. On average, exhibitions last about 3-4 days. However, it is usually
believed that most of exhibition companies would send their staff to Singapore
about 2-3 days in advance to make preparation for exhibition and will leave
Singapore one day after the exhibition. Nevertheless, most visitors will only
stay in Singapore about 3 nights during the exhibition, approximately, the
arriving day, one day or two for visiting the exhibition and the leaving day.
This means that the number of days visitors stay in Singapore is quite close to
the average days of exhibitions. Our survey from the 4 exhibitions in 2001
(MTA2001, Sial 2001, CommunicAsia 2001 and PALA 2001) basically
confirmed such pattern (see Section II of this study - upcoming). We hence
assumed the following scenarios for the empirical sensitivity studies:
• The conservative consideration: all exhibitors arrive and visitors in
Singapore one day before the exhibition. The exhibitors leave Singapore
one day after the closing day and visitors leave Singapore just in the
closing day. Hence, the number of days staying in Singapore for foreign
exhibitors is the actual days of each exhibition plus one more day and the
days staying Singapore for visitors are the actual days of exhibitions.
• The more realistic consideration: The number of days staying in
Singapore for foreign exhibitors are the actual days of each exhibition
plus three more days. The number of days for the foreign visitors will
remain as that in the above scenario.

11
To summarize the about assumptions about the number of individuals from
exhibition companies and the days that exhibitors and visitors stay in
Singapore, we have the following 4 scenarios that would generate different
data sets of the number of staying days from foreign exhibitors and visitors
(Table 1):
Table 1: Four Scenarios Considered in the Study
Numbers of Foreign Exhibition companies (E)
Number of Foreign Visitors (V)
Scenario 1 (3 x E) x (1 day + actual exhibition days) V x (actual exhibition days)
Scenario 2 (3 x E) x (3 days + actual exhibition days) V x (actual exhibition days)
Scenario 3 (6 x E) x (1 day + actual exhibition days) V x (actual exhibition days)
Scenario 4 (6 x E) x (3 days + actual exhibition days) V x (actual exhibition days)
(2) Expenditures by Foreign Exhibitors and Visitors and Airticket Expenditure
for Singapore Airlines
STB has provided the aggregate data of per diem expenditure for both foreign
exhibitors and visitors and the percentage breakdown of the per diem
expenditure in the categories of hotel, food & beverage, shopping,
sightseeing, transport, entertainment & recreation and others. Applying the
per diem expenditure data to the number of foreign exhibitors and visitors (on
the person-day basis), we generated the total expenditure from foreign
exhibitors and visitors in the various sectors.
Airticket expenditure for Singapore Airlines from foreign exhibitors and visitors
is considerable revenue for the Singapore economy. Based on the survey
from the 4 exhibitions in 2001, about 40% foreign exhibitors and visitors took
Singapore airlines and, among them, approximately 25% took business class
and 75% took economy class. We accordingly derived the airticket
expenditure for Singapore Airlines based on the country distribution of foreign

12
exhibitors and visitors and the various fees charged to different countries by
Singapore Airlines.
(3) Singapore’s 1990 I-O Table
We obtained the 1990 I-O Table from Singapore Department of Statistics
(DOS). The Singapore’s 1990 I-O Table captures 173 I/O inputs. The trade
exhibition industry was aggregated into the Other Business and Technical
Services Industry in I-O Table (Code 160).
The 1990 I-O table provides the matrix of input-output linkage between 174
sectors in 1990. Such linkage eventually indicates an industrial linkage or
relationship model of the Singapore economy. We applied the collected data
to the industrial linkage model specified from the 1990 I-O table to verify how
much the exhibition industry impacted the whole Singapore economy in 2000.
It should hence be noticed that the validation of our estimates is largely
restricted to how representative the 1990 I-O table could be for the industrial
relationship of Singapore economy in 2000. The Singapore economy
completed its transformation from a relatively labor-intensive economy into a
capital-intensive economy in early 1980s and has entered into a stable
economic growth since 1986 (Lim Chong Yah and Associates 1988). We thus
assert that the basic industrial relationship in 1990 should largely remain the
same in 2000.
(4) Time-series data for trade exhibition and business and technology service
industries
We also obtained this time-series data from DOS. Since the trade exhibition
industry was aggregated into the Other Business and Technical Services
Industry in I-O Table, we intended to use these time-series data to understand
how the trade exhibition industry has been weighted in the Other Business
and Technical Services Industry over time.

13
3.4. Data Processing
After obtaining the above data from survey and secondary sources, we have
done the following data editing to obtain the final data for modeling:
• Compiling the sales revenue data for the sectors of events organizers,
venue operators, freight forwarders, design & stand contractors, suppliers
and destinations based on the data collected from the nation-wide survey.
The sales revenue of freight forwarders from the survey was distributed
into the sectors of freight transport services (road, shipping line), freight
shipping agent, freight agent (airline), forwarding, packaging & crating
services, storage & warehousing services, courier services, cargo
surveying services, crane & container services according to their
corresponding percentages in the freight forwarding industry in the 1990 I-
O Table.2
These compilations led to sales revenues of the following 5 key industries in
trade exhibition or 10 sectors in the 1990 I-O Table (Table 2):
Table 2: The Key Industries in the Trade Exhibition and Their Corresponding Sectors in the 1990 I-O Table
Key industries in trade
exhibition Industries in the I-O Table
Industry Code
in I-O Table
1. Exhibition organizers Business & technical services 160
2. Designers & stand
contractors
Business & technical services 160
2 The percentage distributions are: freight transport services (road): 6.69%; freight transport
services (shipping line): 27.76%; freight shipping agent: 7.92%; freight agent (airline):
36.28%; forwarding, packaging & crating services, storage & warehouse: 6%; courier
services, cargo surveying services: 14.43%; container services and crane services: 0.9%.

14
3. Freight forwarders Freight transport services (shipping line) 139
Freight shipping agent 140
Freight transport service (road) 138
Freight agent (airline) 141
Forwarding, packing & crating services,
storage & warehousing
142
Cargo surveying and courier services 143
Container services (incl rental) and crane
services
144
4. Suppliers Rental of office machinery & equipment, sound
reproducing & recording equipment, etc.
158
5. Venue operators Letting & operating of self-owned real estate
except hotels, lodging & boarding houses
151
• Compiling the sales revenue data for the sectors of hotel, food &
beverage, shopping (retails), sightseeing, transport, entertainment &
recreation, telecommunication and medical, Singapore Airlines (or air
transport) based on the data of per diem expenditure, the number of days
staying in Singapore from foreign visitors and exhibitors in each trade
exhibition.
It is obvious that the above two sources of sale revenues are directly
generated from trade exhibitions. These data are hence considered as the
preliminary data that will be applied to the analytical model based on 1990 I-
O Table.
• Distributing (or margining) the sales revenue from the above two sources
into the final demands of all 173 sectors in the 1990 I-O Table. It is clear
that data from this distributing process is the derived data in nature as the
economic relationship between sectors implied in the 1990 I-O Table is
already applied in the distributing process.
3.5. Preview of the Preliminary Data

15
Appendix IV reports the summary of the preliminary data complied from both
survey and secondary source. Some key features of the relative importance
of industries initially involved in trade exhibitions can be observed from the
preliminary data. Table 3 uses the sales revenues of these industries to
illustrate such of these features. The industries that provide preliminary data
from survey are the industries directly involved in the trade exhibitions. The
industries which sales revenues are derived from secondary source data are
the industries affected initially from the trade exhibitions. Under the first two
scenarios with the conservative assumptions about the individual whom the
exhibition companies send to exhibitions and the extra days foreign exhibitors
and visitors stay in Singapore, the total sales revenue of the industries from
survey is slightly more than that from the secondary source data. The
application of moderate assumptions just reverses this ratio. The application
of 6 individuals per exhibiting company led to considerable change of the
ratio.
Table 3: The Sales Revenue of Industries Initially Generated from Trade Exhibitions
S$ millions
(1) Data from survey
Organizers 155.80 Designer/Stand 102.89 Freight forwarders 17.92 Destinations 9.86 Suppliers 3.23
Sub-total 289.71 (2) Data from secondary source Scenario 1 Scenario 2 Scenario 3 Scenario 4
Airtickets 112.95 112.95 149.08 149.08Hotel 84.23 97.76 117.57 144.63Food & Beverage 34.12 39.84 48.23 59.68Shopping 38.97 43.4 49.88 58.73Sightseeing 3.76 4.09 4.59 5.26Local transport 12.32 14.37 17.38 21.50Entertainment & Recreation 11.74 13.71 16.60 20.53Others 2.02 2.47 3.12 4.02
Sub-total 300.11 328.61 406.45 463.43 Grand total* 589.83 618.32 696.16 753.15

16
% of sub-total from survey in the grand total 49.1% 46.9% 41.6% 38.5%(*) The grand total is the sum of sub-total from survey and sub-total from secondary data by each scenario.
4. The Analytical Model of Economic Impact and Its Implementation
We used the input-output approach to estimate the direct, indirect and
induced economic effects as the approach has been widely accepted as the
most comprehensive approach for the study of economic impact. The full
explanation of input-output methodology in the study of economic impact is
quite technical and rather tedious. We hence leave those technical
explanations to Appendix V. The following section will only focus on the basic
structure of the model and its implementation.
4.1. The Basic Features of Leontief’s Input-Output Model
The basic structure of the original Leontief’s input-output model can be
illustrated by the following table (Table 4):
Table 4: A Highly Simplified Input-Output Accounting Framework
Industries Net final demand Total output
Industries Z Y X
Value added (primary inputs) V
Total output X Source: United Nations (1999).
In the above table,

17
• The first row characterizes the “purchasing sectors” (purchasers),
while the first column captures the “selling sectors” (sellers);
• Each data column under “Industries” represents the sales from
other sectors to sector i, that is, i’s purchases of the products of
• various producing sectors in the economy. Hence the column
represents the sources and magnitudes of sector i’s inputs.
• On the other hand, in engaging in production, a sector also pays for
other items – for example, labour and capital – and uses other
inputs as well, such as inventoried items. All of these together are
termed the value added in sector i. In addition, imported goods
may be purchased as inputs by sector i. All of these inputs (value
added and imports) are lumped together as purchases from what is
called the payments sector, whereas the Z’s on the right-hand side
of (I.1) serve to record the purchases from the processing sector. In other words, Z captures the so-called interindustry inputs.
• In the case of Singapore, the net final demand is the sum of the
following items:3
• Private consumption;
• Government consumption expenditure;
• Gross capital formation;
• Change in stocks; and
• Exports.
• For Singapore, the total value added is the sum of the following
items:
• Imports of goods and services;
• Commodity taxes;
• Other indirect taxes;
• Remuneration; and
3 Hence, the distribution of preliminary data from the survey and secondary source in the
industries involved initially in the trade exhibitions into the final demand of each sector in
the economy will eventually assign the corresponding values of these items in each
sector.

18
• Gross operating surplus.
There are whole ranges of impact studies based on the input-output table.
The underlying principle is quite simple (Miller and Blair (1985)):
∆X = (I – A)-1 ∆Y (1)
where ∆Y captures the change in the final demand as a result of a particular
event or policy or by a particular sector and ∆X captures the impact on
outputs of all sectors.
A multiplier is a ratio which measures the impact on the total economy as a
result of an initial autonomous change in any of the final demand components.
The common multipliers used are output, valued-added (VA), employment,
import and income multipliers. For comparative purposes, multipliers are
usually expressed with respect to a unit of autonomous change in final
demand. Each of the multipliers can be generated from two different models:
open and closed. The intrinsic difference between them is the treatment of
household income and personal consumption expenditure. In the open model,
all final demand components are assumed to be exogenous. Hence the open
model captures the production-induced effects resulting from a change in final
demand. The multipliers generated using the open model are also known as
simple multipliers or Leontief multipliers. This kind of model is described
as open because at each round of the multiplier process, there are leakage
from the system. The leakage consists of payments for imports and primary
inputs and the recipients are assumed to make no use of their receipts. Even
if a small part of the receipts were spent on goods and services, there would
be further multiplier repercussions.
• In our context, Leontief multipliers will capture the direct and indirect effects of an autonomous change in final demand.

19
Conversely, in the closed model, the household sector is treated as
endogenous to the system. The household sector receiving income from the
work done in the production process would spend some of this income on
local products. This increase in consumption would in turn increase the level
of output of the products. In other words, the closed model accounts for both
the production-induced effects as well as the consumption-induced effects.
The multipliers generated using the closed model are commonly known as the
total multipliers or Leontief-Keynes multipliers.
• In our context, Leontief-Keynes multipliers will capture the direct, the indirect AND the induced effects.
Therefore, in our calibration of the input-output model, we will derive both the
Leontief multipliers and Leontief-Keynes multipliers for output, VA, import and
export (hence net foreign exchange earnings), and employment.
4.2. The Four Principal Steps of Modeling
Four principal steps were taken in modeling of economic impact of the
exhibition industry in Singapore.
Step 1 - Define the sectors that are directly affected by the exhibition industry
and distribute total output into these sectors
• Based on the availability of primary data and secondary data source, the
following sectors are identified as the sectors directly involved in or
affected by trade exhibitions (Table 5):
Table 5: The Key Industries in Trade Exhibitions
Key players in Trade Exhibitions
Industries in the I-O Table Industry Code in I-O Table
(1) Exhibition organizers
& venue operators
Business & technical services 160

20
(2) Designers & stand
contractors
Business & technical services 160
(3) Freight Forwarders Freight transport services (shipping line) 139
Freight shipping agent 140
Freight transport service (road) 138
Freight agent (airline) 141
Forwarding, packing & crating services,
Storage & warehousing
142
Cargo surveying and courier services 143
Container services (incl rental) and crane
services
144
(4) Suppliers Rental of office machinery & equipment,
sound reproducing & recording
equipment, etc.
158
(5) Venue operators Letting & operating of self-owned real
estate except hotels, lodging &
boarding houses
151
(6) Foreign Exhibitors and
Visitors
Singapore airline 141
Hotels 136
Food & beverage 135
Shopping 134
Sightseeing 168
Local transportation 137
Entertainment & recreation 167
Telecommunication 145
Medical & health services 164
As discussed before, the first 5 types of players are in the first tier industries
of trade exhibitions. They actively and directly contribute to the trade
exhibition events. The type 6 players are in the second tier industry. They
derive revenue from the expenditures of exhibitors and visitors. In other
words, the first 5 types of players play more active and direct roles in trade
exhibitions than the type 6 players. In the following analysis of multiple times
of economic impact of trade exhibition, we will thus treat these two groups of
industries differently.
21
• Distribute the total output to all these industries. Specifically, the
expenditure data from STB for foreign visitors and exhibitors and numbers
of foreign visitors and exhibitors from various exhibitions were used to
determine the exhibition-related output of industries of hotel, food &
beverage, shopping (retails), sightseeing, local transportation,
entertainment & recreation, telecommunication and medical service.4 The
output data for the rest of industries listed in the above Table are from our
survey. However, the distribution of output of freight forwarders into the
various industries (code 139 - 144 in I-O Table) was done based on the
percentage of these industries output in their total in the 1990's I-O table.5
Step 2 - Bridging the output of each industry specified in step 1 into the final
demand of all industries in the I-O Table.
From the 1990's I-O Table, we identified the final industrial demand from all
industries in terms of output of each industry specified in step 1. The obtained
output of each industry specified in step 1 was then bridged into all industries
in the 173 industries in the I-O Table. Such bridging can be expressed as:
4 The STB data does specify how much percentage spending from per diem of foreign
exhibitors and visitors was on telecommunication and medical services. We believe that
spending on such two services could be necessary. We simply distribute the percentage of
the residual term "Other" in the STB data into these two services. 60% of the "other
expenditure" was distributed to telecommunication and 40% was distributed to medical
service. However, it is also likely that these two services were not recorded in the STB
data. If so, some measures may have to be taken to consider expenditures for these two
services. 5 The distribution ratios are freight transport service (road) 6.69%; freight transport services
(shipping line) 27.76%; freight shipping agent 7.92%; freight agent (airline) 36.28%,
forwarding, packaging & crating services, storage & warehouse 6%; courier services,
cargo surveying services 14.43%, container services (incl rental) and crane services 0.9%.
The member from freight forwarders in the Study Committee may want to have a judgment
on the suitability of such distribution ratios from 1990's I-O Table as an approximation for
the 2000's situation.

22
jk
n
jjk BYFD ×∑=
=1
(2)
Where FD indicates final industrial demand and is for K industries (eventually
173 industries in the I-O table), Y is output of the industries specified in step 1
and is for number of j industries (eventually 18 industries as specified in step
1), B is the percentage of final industrial demand in terms of the related
industry's output. Therefore, the result from implementing equation (6) is a
vector of final demand for 173 industries in the entire Singapore economy
covered in the 1990's I-O table.
Step 3 - Applying the final demand vector to the Singapore economic model
verified by 1990's I-O Table.
Impacts are estimated by multiplying the final demand vector by the various
sets of multipliers R,
kFDRI *= (3)
where I’s are impacts expressed as changes in output, value added, import
requirement, exchange earning and employment. Since there are no matrix
for income multipliers and government revenue multipliers, some other
information from the I-O Table or secondary source data have to be used in
terms of the derived final demand vector to obtain the impact on income and
government revenue.
Step 4 - Interpret the estimated result
The estimated result were analyzed from the components of direct, indirect,
induced and total impact in terms of the entire Singapore economy as well as
the top 10 industries affected the most.
23
The direct impact and indirect impact are derived from the estimates using
Open Model multipliers. The direct impacts are drawn from the estimated
result for the 18 industries specified in step1; the indirect impacts are drawn
from the estimated result of the rest of 155 industries.
Induced impacts are derived as the difference between the estimated results
from using open model and close model multipliers. The total impact is
eventually the estimated results from using the close model multipliers.
Some comparisons of the estimated result to the information from some
specific cases and international benchmarks were implemented in order to
check the reliability of the estimated result and also assess the position of
Singapore exhibition industry in the world.
5. The Analysis of the Estimation Results
5.1. The Development of Singapore Exhibition Industry
While the DOS designed the Singapore I-O Table in 1983, the industry of
exhibition fair and convention organizers was too small to be established as
an individual industry in the I-O table. It was then grouped in to the industry of
other business and technical services (coded 160, see Appendix VI for the
definition of sectors in 1990 I-O Table). As for 1998, output and value added
of the industry of exhibition fair and convention organizers consisted of 3.77%
and 3% of that of other business and technical services respectively.
However, this industry expanded rapidly over time. Compare the output from
exhibition fair and convention organizers in 1998 to that in 1986, the growth
rate is about 800%, or an average increase of 6.5% per year. Figures 1 and 2
show the historical trends of employment and value added of the industries of
"exhibition fair and convention organizers" and "other business and technical
services", three features can be observed:

24
(1) The two industries have increased substantially in all three indicators;
(2) The growth rates in the three indicators over time are quite similar.
(3) The industry of exhibition fair and convention organizers has demonstrated
clear cyclical growth pattern. Employment, output and value added have
all fluctuated over time. It is interesting to notice that this industry has on
average performed better in the even years than that in odd years. Such
pattern may have been largely due to some key exhibition events that
have only been hold in even years. On the other hand, the growth in the
industry of "other business and technical services" has been rather steady.
Figure 1: Economic Contribution of "Other Business& Technical Services" Industries, 1986-1999
0
500
1,000
1,500
2,000
2,500
3,000
1986
1987
1988
1989
1990
1991
1992
1993
1994
1995
1996
1997
1998
1999
0
10,000
20,000
30,000
40,000
50,000
Value Added Total Employment
Date Source: DOS

25
Figure 2: Economic Contribution of Exhibition Fair &Convention Organisors, 1986-1999
0
20
40
60
80
1986
1987
1988
1989
1990
1991
1992
1993
1994
1995
1996
1997
1998
1999
0
400
800
1,200
Value Added Total Employment
Date Source: DOS
One may have to notice that the industry of exhibition fair and convention
organizers in the above table is just a part of industries directly involved in
trade exhibitions. If we define all industries that directly involve in the trade
exhibitions as we defined above, the exhibition industry will be much bigger in
size. Moreover, the exhibition industry will have substantial economic impact
in other economy. Hence, the economic significance of the exhibition industry
can never be judged just from the narrowly defined industry of exhibition fair
and convention organizers but must be assessed from its overall economic
impact. The following estimated result would prove exactly this point.
5.2. Output Effects
Corresponding to the 4 scenarios discussed above, 4 types of output effects
are estimated and are reported in Table 6.
Table 6: The Output Effects of Trade Exhibitions Scenarios
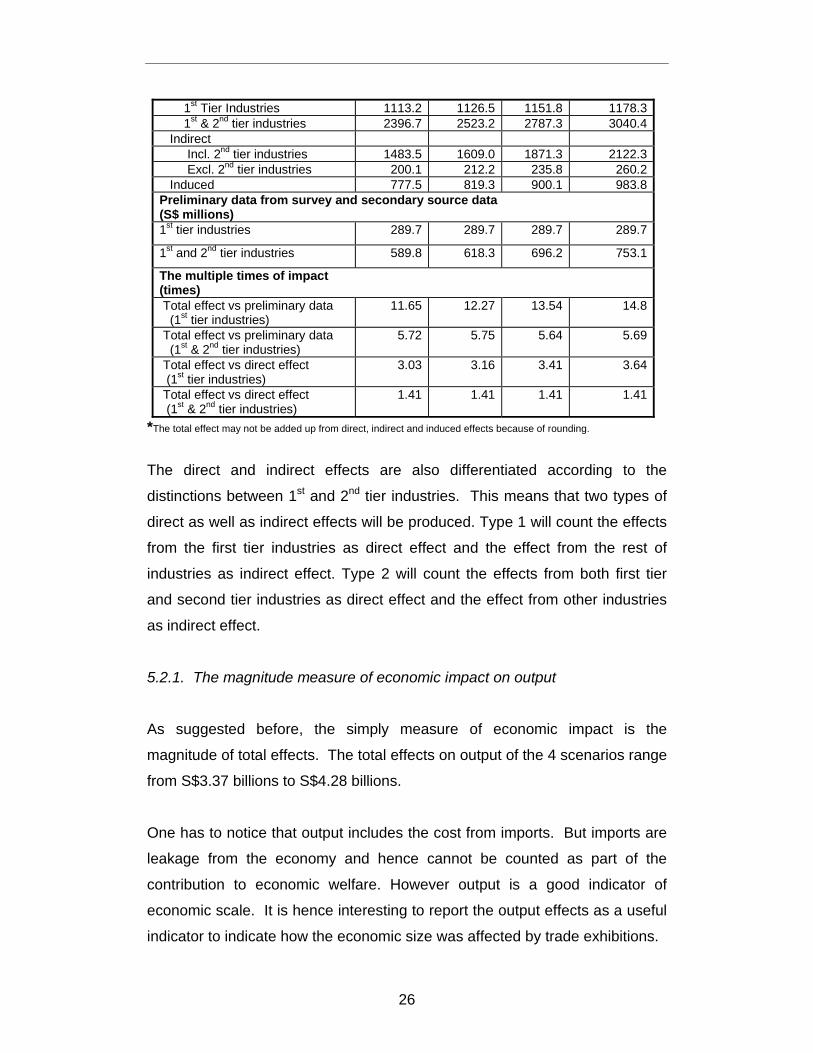
1 2 3 4 Estimated effects from I-O Table (S$ millions) Total* 3374.2 3554.8 3923.2 4284.4 Direct
26
1st Tier Industries 1113.2 1126.5 1151.8 1178.3 1st & 2nd tier industries 2396.7 2523.2 2787.3 3040.4 Indirect Incl. 2nd tier industries 1483.5 1609.0 1871.3 2122.3 Excl. 2nd tier industries 200.1 212.2 235.8 260.2 Induced 777.5 819.3 900.1 983.8 Preliminary data from survey and secondary source data (S$ millions) 1st tier industries 289.7 289.7 289.7 289.7 1st and 2nd tier industries 589.8 618.3 696.2 753.1
The multiple times of impact (times) Total effect vs preliminary data (1st tier industries)
11.65 12.27 13.54 14.8
Total effect vs preliminary data (1st & 2nd tier industries)
5.72 5.75 5.64 5.69
Total effect vs direct effect (1st tier industries)
3.03 3.16 3.41 3.64
Total effect vs direct effect (1st & 2nd tier industries)
1.41 1.41 1.41 1.41
*The total effect may not be added up from direct, indirect and induced effects because of rounding.
The direct and indirect effects are also differentiated according to the
distinctions between 1st and 2nd tier industries. This means that two types of
direct as well as indirect effects will be produced. Type 1 will count the effects
from the first tier industries as direct effect and the effect from the rest of
industries as indirect effect. Type 2 will count the effects from both first tier
and second tier industries as direct effect and the effect from other industries
as indirect effect.
5.2.1. The magnitude measure of economic impact on output
As suggested before, the simply measure of economic impact is the
magnitude of total effects. The total effects on output of the 4 scenarios range
from S$3.37 billions to S$4.28 billions.
One has to notice that output includes the cost from imports. But imports are
leakage from the economy and hence cannot be counted as part of the
contribution to economic welfare. However output is a good indicator of
economic scale. It is hence interesting to report the output effects as a useful
indicator to indicate how the economic size was affected by trade exhibitions.

27
5.2.2. The multiple times measure of economic impact on output
To assess the multiple times of economic impact of trade exhibition, it is
important to identify which part of the activities involved in the trade
exhibitions are used to compare the total effects. Four kinds of comparisons
are presented in Table 6 by using four kinds of activities:
(1) Total effects vs the 1st tier industries' sales revenue from the preliminary
data complied from surveys. As indicated in Table 2, the sales' revenues
of the 1st tier industries is about half of the total sales revenues of both the
1st and 2nd tier industries. Using only the 1st industries' sales revenue as
the denominator, the derived multiple times of the economic impact is
considerably large, ranging from 11.65 to 14.8 over the four scenarios.
(2) Total effects vs the 1st and the 2nd tier industries' sales revenue from the
preliminary data. Obviously, the denominator becomes bigger and the
derived multiple times of economic impact becomes relatively smaller,
ranging from 5.64 to 5.75 over the 4 scenarios, a quite narrow range.
(3) Total effects vs direct effects from the 1st tier industries. As discussed
before, due to the interactions between all sectors in the economy, the
output of the 1st tier industries will not be restricted to the output directly
derived from specific trade exhibitions. The 1st tier industries will also
generate some output from other industries in the multiplier process
between sectors. Hence, the estimated output from I-O Table for the 1st
tier industries will be different from and eventually more than the primary
output from the survey data. Moreover, all of the 1st tier industries are
aggregated into different industry groups in the I-O Table. For example,
the organizers of trade exhibition and designers/stand are grouped into
industry of other technical and business services (code 160). The industry
of other technical and business services includes 31 industries such as
advertising and related services. Since it is impossible to differentiate the
output of the 1st tier industries individually from the I-O Table estimates,
only aggregate output of these industry groups can be added up as a

28
proxy for the output of the 1st tier industries. Obviously, such proxy will
over-estimate the actual output of the 1st tier industries as the proxy also
includes output from other similar industries in the corresponding industry
groups that may also generate output from the impact of trade exhibitions.
The derived multiple times of multiplier impact will thus be under-estimated
to some extend. However, it is expected that the output generated from
trade exhibition-related activities from other similar industries may be quite
limited. Hence, the over-estimation of output for the 1st tier industries may
not be that substantial.6 The derived times of multiplier economic impact
range from 3 to 3.6 over the four scenarios.
(4) Total effects vs the direct effects from the 1st tier and the 2nd tier industries.
With the largest denominator used in this case, the derived multiple times
of economic impact become the smallest and is about 1.41 for all
scenarios.
In general, the various estimates of the multiple times of economic impacts
have their own merits but limitations. While the first two are subject to the
problem of over-estimation and the last two subject to the problem of under-
estimation, the reasonable multiple times of impact should be the one
between the two kinds of estimates. However, one must notice that the total
effect, i.e. the measure of magnitude of the impact, is the same no matter how
the multiple times would differ according to different denominators used in the
calculations. Hence one should not put too much emphasis on the measures
of various multiple times although it may be somehow convenient to use them
as intuitive indicators of the impact. Instead, the emphasis should be the total
effect.
6 In 1999, the total output for the technical and business services (code 160) was about
S$7.2 billions in which S$0.15 billions was for trade fairs and conventions. In our estimate,
the trade exhibition-related output of the industry (code 160) for 2000 is about S$0.78
billions, the collected preliminary output for organizers and designers/stand are about
S$0.26 billions. If consider more output generated the multiplier feedback process for
organizers and designers/stand, the final output of direct effect will be more than S$0.26
billions.

29
5.2.3. The benchmark case
The scenario 2 case based on the moderate assumptions can be treated as a
benchmark case. Under this scenario, the measures of economic impact are:
- The magnitude of economic impact on output is S$ 3.37 billions;
- The multiple times of economic impact from the 1st tier industries to the
whole economy is 12.27 by using the primary data as denominator and
3.16 by using the estimate from I-O model.
- The multiple times of economic impact from the 1st and 2nd tier industries
to the whole economy is 5.75 by using the primary data as denominator
and 1.41 by using the estimate from I-O model.
5.2.4. The Industrial Structure of the Economic Impact on Output
The distribution of economic impact among the 173 sectors in the 1990 I-O
Table can be identified from the I-O model study. The detailed distributions
over the 4 scenarios are reported in Appendix VII. The top 5 industries in the
total effects from the scenario 4 are presented in Figure 3.7
7 The industrial rankings from other scenarios are quite similar as one can see from the
Appendix VII.
Figure 3: Totp five industries in output effects
Wholesale & retail trades
29%
Air transport7% Real estate
11%
Restaurants5%
others21%
Other business & technical services
27%

30
From the figure, it shows that the top 5 industries are (2) whole sale & retail
trades; (2) other business & technical services; (3) real estate;8 (4) air
transport; (5) restaurants. Their share in the total amounts to 79% percent.
5.3. Value-Added Effects
Value-added effects are the most comprehensive measure of economic
impact as they indicate the total economic welfare generated from the trade
exhibitions. Hence, the estimates of value-added in each scenario are also
compared to GDP in 2000. The ratios of value-added and GDP are reported
in Table 7 as a simple indicator of relative importance of trade exhibitions in
the whole economy.
Table 7: The Value-Added Effects of Trade Exhibitions
Scenarios 1 2 3 4 Estimated effects from I-O Table (S$ millions) Total* 1067.0 1125.4 1236.1 1352.9 Direct 1st Tier Industries 394.7 401.6 414.0 428.0 1st & 2nd tier industries 785.5 827.7 908.0 992.4 Indirect Include 2nd tier industries 443.8 482.2 556.4 633.4 Exclude 2nd tier industries 53.0 56.2 62.4 68.9 Induced 228.6 241.5 265.6 291.6 Preliminary data from survey and secondary source data (S$ millions) 1st tier industries 89.1 89.1 89.1 89.1
1st and 2nd tier industries** 181.4 190.1 214.1 231.6
The multiplier impact (times) Total effect vs preliminary data (1st tier industries)
11.98 12.63 13.87 15.18
Total effect vs preliminary data (1st & 2nd tier industries)
5.88 5.92 5.77 5.84
Total effect vs direct effect (1st tier industries)
2.70 2.80 2.99 3.16
Total effect vs direct effect (1st & 2nd tier industries)
1.36 1.36 1.36 1.36
8 In the I-O Table, the real estate industry is coded 151 that includes the venue operators of
trade exhibitions.

31
Percentage of total VA in GDP (%) 0.67 0.71 0.78 0.85
* The total effect may not be added up from direct, indirect and induced effects because of rounding. ** Since there is no primary data of value-added for 2nd industry from survey, such value added is estimated.
The ratio of value added and sales revenues of the 1st tier industries from survey is applied to the sales revenue of the 1st and 2nd industries (see Table 2) to obtain their value added as reported above.
5.3.1. The magnitude measure of economic impact on value added
The total effects on value-added of the 4 scenarios range from S$1.07 billions
to S$1.35 billions. The ratio of these estimated value-added in GDP ranges
from 0.67% to 0.85%.
5.3.2. The multiple times measure of economic impact on value added
(1) Total effects vs the 1st tier industries' value added from the preliminary
data complied from surveys. The estimates range from 11.98 to 15.18
over the four scenarios.
(2) Total effects vs the 1st and the 2nd tier industries' value from the
preliminary data. The estimates range from 5.77 to 5.92 over the four
scenarios.
(3) Total effects vs direct effects from the 1st tier industries. The derived
multiple times of economic impact range from 2.70 to 3.16 over the four
scenarios.
(4) Total effects vs the direct effects from the 1st tier and the 2nd tier industries.
The derived multiple times of economic impact is about 1.36 for all four
scenarios.
5.3.3. The benchmark case
Under the benchmark case of the scenario 2, the measures of economic
impact are:
- The magnitude of economic impact on output is S$ 1.125 billions;

32
- The multiple times of economic impact from the 1st tier industries to the
whole economy is 12.63 by using the primary data as denominator and
2.80 by using the estimate from I-O model.
- The multiple times of economic impact from the 1st and 2nd tier industries
to the whole economy is 5.92 by using the primary data as denominator
and it becomes 1.36 by using the estimate from I-O model.
5.3.4. The Industrial Structure of the Economic Impact on Value-added
The distributions of total value-added effects from scenarios 4 are presented
in Figure 4. The top 5 industries are (1) whole sale & retail trades; (2) real
estate; (3) other business & technical services; (4) hotels; (5)
communications. Their shares in total amount to 81% percent. It is
interesting to notice that communication and hotels replace air transport and
restaurants in the top 5 ranking, indicating that the two industries are relatively
high value-added industries.
5.4. Net Foreign Exchange Earnings Effects
Figure 4. Top five industries in value-added effects
Wholesale & retail trades
26%
Real estate23%
Other business & technical services
Hotels6%
Communica-tions6%
others19%

33
The derived results on the net foreign exchange earnings are summarized in
Table 8.
5.4.1. The magnitude measure of economic impact on net foreign exchange
earnings
The total effects on net foreign exchange earnings of the four scenarios range
from S$649 millions to S$825 millions.
Table 8: Net Foreign Exchange Earnings Effects of Trade Exhibitions Scenarios 1 2 3 4 Estimated effects from I-O Table (S$ millions) Total 649.1 679.9 764.1 825.7 Direct 1st Tier Industries 195.6 196.6 197.6 199.8 1st & 2nd tier industries 658.0 686.8 783.4 841.1 Indirect Include 2nd tier industries 277.8 299.9 361.3 405.4 Exclude 2nd tier industries -184.6 -190.3 -224.5 -235.9 Induced 175.6 183.4 205.1 220.6 The multiplier impact (times) Total effect vs direct effect (1st tier industries)
3.32 3.46 3.87 4.13
Total effect vs direct effect (1st & 2nd tier industries)
0.98 0.99 0.97 0.98
5.4.2. The multiple times measure of economic impact on net foreign
exchange earnings
Since no primary data of import and export of the 1st and 2nd tier industries are
available from the survey and secondary source data, there are only following
two cases:
(1) Total effects vs direct effects from the 1st tier industries. The derived
multiple times of economic impact on net foreign exchange earning range
from 3.32 to 4.13 over the four scenarios.

34
(2) Total effects vs the direct effects from the 1st tier and the 2nd tier industries.
The derived multiple times of economic impact range from 0.97 to 0.99.
This rather small numbers of times indicate that the some other sectors
except the 1st and 2nd tier industries have to be net importers to support
the trade exhibitions. Such point is also reflected in the negative indirect
net foreign exchange effect if the 2nd tier industries are excluded from the
calculation of indirect effect.
5.4.3. The benchmark case
Under the benchmark case of the scenario 2, the measures of economic
impact are:
- The magnitude of economic impact on net foreign exchange earning is
S$679.9 millions;
- The multiple times of economic impact from the 1st tier industries to the
whole economy is 3.46 times.
- The multiple times of economic impact from the 1st and 2nd tier industries
to the whole economy is 0.99.
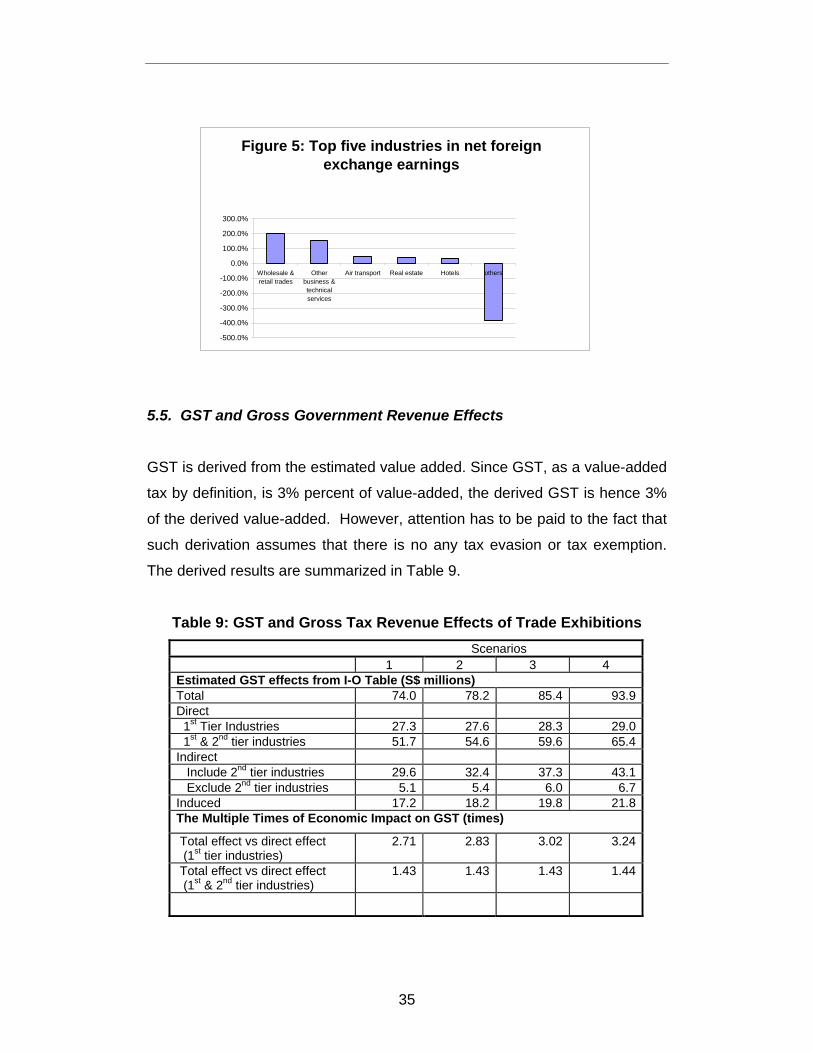
5.4.4. The Industrial Structure of the Economic Impact on net foreign
exchange earnings
The distributions of net foreign exchange earning effects from scenarios 2 are
presented in Figure 5. The top 5 industries are (1) whole sale & retail trades;
(2) other business & technical services; (3) air transport; (4) real estates; (5)
hotels. Their shares in total amount to more than 400% percent, indicating
that these sectors are net foreign exchange earning sectors while the other
supporting sectors must be net importers in the trade exhibition-related
activities.
35
5.5. GST and Gross Government Revenue Effects
GST is derived from the estimated value added. Since GST, as a value-added
tax by definition, is 3% percent of value-added, the derived GST is hence 3%
of the derived value-added. However, attention has to be paid to the fact that
such derivation assumes that there is no any tax evasion or tax exemption.
The derived results are summarized in Table 9.
Table 9: GST and Gross Tax Revenue Effects of Trade Exhibitions Scenarios 1 2 3 4 Estimated GST effects from I-O Table (S$ millions) Total 74.0 78.2 85.4 93.9 Direct 1st Tier Industries 27.3 27.6 28.3 29.0 1st & 2nd tier industries 51.7 54.6 59.6 65.4 Indirect Include 2nd tier industries 29.6 32.4 37.3 43.1 Exclude 2nd tier industries 5.1 5.4 6.0 6.7 Induced 17.2 18.2 19.8 21.8 The Multiple Times of Economic Impact on GST (times)
Total effect vs direct effect (1st tier industries)
2.71 2.83 3.02 3.24
Total effect vs direct effect (1st & 2nd tier industries)
1.43 1.43 1.43 1.44
Figure 5: Top five industries in net foreign exchange earnings
-500.0%
-400.0%
-300.0%
-200.0%
-100.0%
0.0%
100.0%
200.0%
300.0%
Wholesale &retail trades
Otherbusiness &technicalservices
Air transport Real estate Hotels others

36
Gross Tax Revenue (S$ millions)
169.5 178.8 196.4 215.0
5.5.1. The magnitude measure of economic impact on GST
The total effects on GST earning of the four scenarios range from S$74.0
millions to S$93.9 millions.
The total effects on gross tax revenue of the four scenarios range from
S$169.5 millions to S$ 215.0 millions.9
5.5.2. The multiple times measure of economic impact on GST
Since no primary data of GST for the 2nd tier industries are available from the
secondary source data and not many companies participated in the survey
from the 1st tier industries provided GST information, there are only following
two cases:
(1) Total effects vs direct effects from the 1st tier industries. The derived
multiple times of economic impact on net foreign exchange earning range
from 2.71 to 3.24 over the four scenarios.
(2) Total effects vs the direct effects from the 1st tier and the 2nd tier industries.
The derived multiple times of economic impact is about 1.43 for all the 4
scenarios.
5.5.3. The benchmark case
Under the benchmark case of the scenario 2, the measures of economic
impact are:
9 The gross tax revenue is derived according to the derived value added and the ratio of
gross tax revenue over GDP in 2000. The ratio is 15.89% in 2000.

37
- The magnitude of economic impact on GST is S$78.2 millions and on
gross tax revenue is S$178.8 millions;
- The multiple times of economic impact from the 1st tier industries to the
whole economy is 2.83 times.
- The multiple times of economic impact from the 1st and 2nd tier industries
to the whole economy is 1.43.
5.5.4. The Industrial Structure of the Economic Impact on GST
The distributions of GST effects from scenarios 4 are presented in Figure 6.
The top 5 industries are (1) other business & technical services; (2) whole
sale & retail trades; (3) real estates; (4) restaurants; (5) hotels. Their share in
total amounts to 80% percent.
5.6. Income and Employment Effects
Figure 6: Top five industries in GST effects Other
business & technical services
28%
Wholesale & retail trades
24%
Restaurants6%
Real estate16%
Hotels6%
others20%

38
5.6.1. The magnitude measure of economic impact on income and
employment
The total effects on income (remuneration) of the 4 scenarios range from
S$0.425 billions to S$ 0.541 billions.
The total effects on employment of the 4 scenarios range from millions to
millions 14819 to 18790.
5.6.2. The multiple times measure of economic impact on income
(1) Total effects vs direct effects from the 1st tier industries. The derived
multiple times of economic impact on income rang2 from 3.06 to 3.72 over
the 4 scenarios.
(2) Total effects vs the direct effects from the 1st tier and the 2nd tier industries.
The derived multiple time of economic impact is about 1.41 for all
scenarios.
5.6.3. The benchmark case
Under the benchmark case of the scenario 2, the measures of economic
impact are:
- The magnitude of economic impact on income is S$0.449 billions; the total
employment is 15630.
- The multiple times of economic impact from the 1st tier industries to the
whole economy is 3.20 times.
- The multiple times of economic impact from the 1st and 2nd tier industries
to the whole economy is 1.42.
Table 10: Income (Remuneration) Effects of Trade Exhibitions
Scenarios 1 2 3 4

39
Estimated effects from I-O Table (S$ millions) Total 425.4 449.4 493.0 541.0 Direct 1st Tier Industries 139.2 140.5 142.9 145.5 1st & 2nd tier industries 299.4 316.4 347.5 381.6 Indirect Include 2nd tier industries 182.7 199.6 230.5 264.2 Exclude 2nd tier industries 22.5 23.6 25.9 28.2 Induced 103.5 109.3 119.5 131.2 The multiplier impact (times) Total effect vs direct effect (1st tier industries)
3.06 3.20 3.45 3.72
Total effect vs direct effect (1st & 2nd tier industries)
1.42 1.42 1.41 1.41
Employment* (Heads)
14819 15630 17168 18790
*: Derived based on the estimated value-added and the national labor productivity in 2000.
5.6.4. The Industrial Structure of the Economic Impact on income
The distributions of income effects from scenarios 2 are presented in figure 6.
The top 5 industries are (1) other business & technical services; (2) whole
sale & retail trades; (3) real estates; (4) hotel; (5) restaurants. Their shares in
total amount to 80% percent.
Figure 7: Top five industries in income effects Other
business & technical services
31%
Wholesale & retail trades
29%
Real estate8%
Hotels8%
Restaurants4%
others20%

40
6. The Competitive Position of Singapore's Exhibition Industry Although the study of comparative advantage of Singapore's Exhibition
Industry is beyond the objectives of this study, the study group tried to gain
some information on this area through the optional questions in the survey
forms. Companies were asked to answer the questions such as "the
manpower for the industry is adequate" by choosing the answers from
"strongly agree" to "strongly disagree". As one can see from Table 11, the
questions covers various aspects of the comparative advantages of
Singapore's trade exhibition industry. Among the 44 companies participated
in the survey, 42 companies replied to these qualitative questions. The
results are presented in Table 11.
Table 11. The Comparative position of Singapore's Exhibition Industry % in total replies
strongly
agree
Agree Neutral Disagree Strongly
disagree
The exhibition industry is getting increasingly competitive 61.91 30.95 7.14 0 0 The venue's rental cost is in general internationally
competitive 4.76 45.24 35.71 11.9 2.39
Singapore is attractive to international exhibitors 11.9 73.81 9.52 2.39 2.39 Singapore has attracted major international shows in
recent years 11.9 64.29 16.67 7.14 0
The overall business environment for the industry is
sound 2.39 54.76 26.19 14.27 2.39
The manpower for the industry is adequate 0 33.34 23.81 35.71 7.14 The professionalism in the industry is high 4.76 66.66 14.29 14.29 0 Rules and regulations for the industry are effective 7.31 51.22 31.71 9.76 0 Government bodies (TDB,STB, etc) are playing a vital
role 4.76 71.43 21.43 2.38 0
Regional competitions have become a serious concern 30.96 54.76 28.58 7.14 0 Singapore is in a good position to face regional
competition 7.14 57.14 28.58 7.14 0
Some key observations can be drawn from the Table:

41
(1) More than half of the companies indicated "agree" for the following aspects
of Singapore's exhibition industry:
• Singapore is attractive to international exhibitors
• Singapore has attracted major international shows in recent years
• The overall business environment for the industry is sound
• The professionalism in the industry is high
• Rules and regulations for the industry are effective
• Government bodies (TDB.STB, etc) are playing a vital role
• Regional competitions have become a serious concern
• Singapore is in a good position to face regional competition
(2) Most companies indicated "Strongly agree" on that "The exhibition industry
is getting increasingly competitive".
(3) 36% of companies indicated "disagree" on that "The manpower for the
industry is adequate".
(4) Considerable companies indicated "strongly agree" on that regional
competitions have become a serious concern".
(5) It may be a concern that a considerable companies indicated "neutral" on
the following aspects:
• The venue's rental cost is in general internationally competitive
• The overall business environment for the industry is sound
• Rules and regulations for the industry are effective
• Singapore is in a good position to face regional competition
7. Conclusion
This study is based on the national survey from trade exhibition industries and
comprehensive secondary data source on exhibitors and visitors participated
in trade exhibitions in 200. The majority of key players in the trade exhibition
industry participated the survey and 51 trade exhibitions hold in 2000 are
covered by this study.

42
The input-output approach is used to assess the economic impact of trade
exhibition industries in Singapore economy. The collected output data were
distributed into final demand of each sector in the 1990 I-O table. The
obtained final demand is applied to the multipliers of output, value-added,
import and export and income. The estimated value added is used to derive
GST, gross tax revenue and employment together with the relevant statistics
in 2000.
Referring to the estimates of the benchmark scenario, the trade exhibitions
hold in Singapore in 2000 provided the Singapore economy
• S$ 3.55 billion gross output
• S$ 1.13 billion value-added, i.e. 0.71% of GDP
• S$ 0.68 billion net foreign exchange earnings
• S$ 0.18 billion gross tax revenue and S$78.2 million GST
• S$ 0.45 billion income
• 15630 employment The various measures of multiple times of economic impact suggest that the
contributions of the trade exhibition industry to the Singapore economy is
really tremendous and is eventually not parallel to the relative small size of the
trade exhibition industry. In short, the trade exhibition industry has substantial
linkage effect to the whole economy, particularly, the whole range of service
industries.

43
References
Khan, H., F.S. Chou and K.C. Wong (1990), “Tourism Multiplier Effects on
Singapore,” Annals of Tourism Research, 17, 408-418.
Khan, H, S. Phang, and R.S. Toh (1995), “Singapore’s Hospitality Industry:
The Multiplier Effect,” Cornell Hotel and Restaurant Administration
Quarterly, 36(1), 64-69.
Khan, H., R.S. Roh, and K. Fathima (2001), “Asian Contagion: Impact on
Singapore Tourism,” Annals of Tourism Research, 28(1), 224-226.
Leontief, W. (1986). Input-Output Economics. 2nd Edition. New York: Oxford
University Press.
Lim Chong Yah and Associates (1988), "Policy Options for the Singapore
Economy", McGaw-Hill Book Company.
Lin, T.B. and Y.W. Sung (1983), “The Economic Impact of Tourism on Hong
Kong,” in Tourism in Asia: The Economic Impact, ed. E.A> Pye and T.B.
Lin, pp.1-99. Singapore: Singapore University Press.
Miller, R.E. and P.D. Blair (1985). Input-Output Analysis: Foundations and
Extension. New Jersey: Prentice Hall.
Schymyck, P.W. (1983), “The Impact of Singapore’s Tourism on the
Singapore Economy,” Economic Survey of Singapore, First Quarter, 1983,
pp. 13-20.
Seow, G. (1981), “Economic Significance of Tourism in Singapore,” Singapore
Economic Review, October 1981, pp.64-79.
Singapore Department of Statistics (1997). Singapore Input-Output Table
1990. Department of Statistic, February 1997.
Singapore Department of Statistics (2000). Yearbook of Statistics 2000.
Department of Statistics, May 2001.
Singapore Tourism Board (2000), Statistics on Meeting, Incentives,
Conventions and Exhibitions Industry in Singapore 1999.
Toh, M.H. and L. Low (1990), “Economic Impact of Tourism in Singapore,”
Annals of Tourism Research, 17, 246-269.
United Nations (1999). Handbook of Input-Output Table Compilation and
Analysis. New York: United Nations.