economic impacts of agriculture and forestry tennessee, 2011
TRANSCRIPT

Institute of AgricultureDepartment of Agricultural & Resource Economics
Economic Impacts of Agriculture and Forestry in Tennessee, 2011
Agricultural Experiment StationThe University of Tennessee
Knoxville
by Jamey Menard, Burton English,
and Kim Jensen
Agri‐Industry Modeling & Analysis Group (AIM‐AG)
June 2013
ii
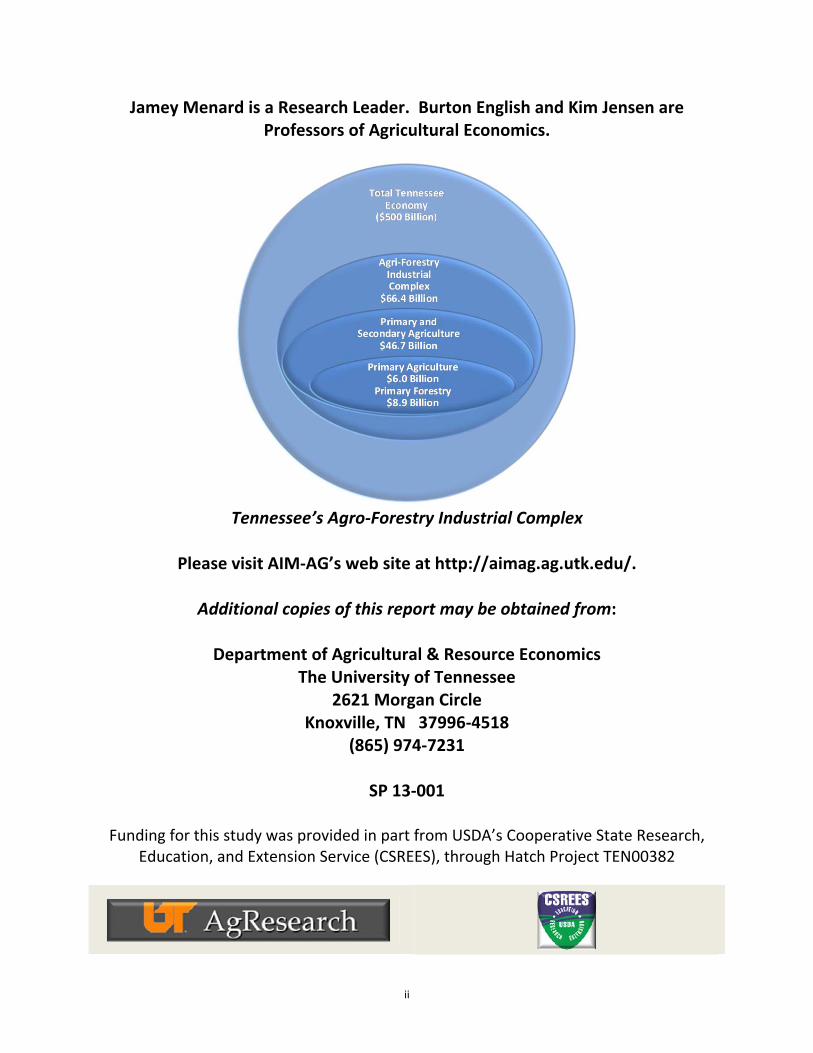
Jamey Menard is a Research Leader. Burton English and Kim Jensen are Professors of Agricultural Economics.
Tennessee’s Agro‐Forestry Industrial Complex
Please visit AIM‐AG’s web site at http://aimag.ag.utk.edu/.
Additional copies of this report may be obtained from:
Department of Agricultural & Resource Economics
The University of Tennessee 2621 Morgan Circle
Knoxville, TN 37996‐4518 (865) 974‐7231
SP 13‐001
Funding for this study was provided in part from USDA’s Cooperative State Research,
Education, and Extension Service (CSREES), through Hatch Project TEN00382
iii
Executive Summary In 2011, the agro‐forestry industrial complex contributed $66.4 billion to the Tennessee
economy, accounting for 13.3 percent of the economic activity conducted within the state, and employed an estimated 337,880 individuals, or 9.6 percent of the total number of workers. In this study the agro‐forestry industrial complex included the primary industries typically associated with agriculture and forest operations such as growing crops, the breeding and feeding of livestock, and the management and logging of trees. Also included in the industrial complex were input supply industries and value‐added sub‐sectors, which included food and beverage manufacturing, apparel and textiles, and forestry products manufacturing.
Agriculture, a subset of the agro‐forestry industrial complex, includes farming and related industries, as well as value‐added food and fiber production, processing and manufacturing. Agriculture accounted for 9.3 percent of the state’s economy and generated $46.7 billion in output. Agriculture employed close to 247,000 Tennesseans, with over 106,000 (both full‐ and part‐time) in agricultural production. In addition,
For 2011, agriculture input supplying industries – agricultural machinery and chemical
products – generated nearly $2.3 billion in cash receipts annually.
For 2011, Tennessee farmers earned more than 76.1 percent of their cash receipts from cattle and calves, soybeans, broilers, corn, cotton, and greenhouse/nursery.
Exports for Tennessee’s forest products outside the United States for 2011 totaled close to $1.0 billion. Paper products had the highest export value at $682.3 million, followed by wood products ($180.1 million), furniture and related products ($90.6 million), and forestry and logging ($79.5 million).
For 2011, major countries receiving Tennessee’s forest products exports include Mexico
for paper products, China for wood products, and Canada for furniture and fixtures and logging.
For 2011, value‐added agriculture manufacturing contributed a total of $38.4 billion to the state’s economy of which 83.3 percent came from food ($27.1 billion) and beverages ($4.9 billion) manufacturing.
Major markets for Tennessee’s 2011 exports of agricultural and livestock products included China, Mexico, Turkey, Indonesia, Viet Nam, Thailand, and Canada. This analysis was conducted using the Tennessee Agri‐Industry model (TNAIM) and the
Impact Analysis for Planning (IMPLAN) model and databases. TNAIM, an input‐output model for five trading regions within the state, traces transactions conducted within the economy and attempts to quantify the economic interdependencies within each region’s economy for a given point in time. Through these interdependencies, one can evaluate the indirect and induced impacts that economic activity in one region might have on the entire state economy.

iv
Table of Contents Page Executive Summary iii Table of Contents iv List of Tables v List of Figures vi Introduction 1 Overview of Agriculture and Forestry in Tennessee 2 State Level Changes in Livestock and Crops: 2009 to 2011 13 Livestock Changes in Inventory and Prices 13 Crop Changes in Acres Planted and Prices 14 Input‐Output Analysis: Data and Methods Used 16 Results 18
Economic Impacts at the State & In‐State Region Levels 18 Primary Agricultural Products 23 Secondary Agricultural Products 27 Primary Forest Products 30 Secondary Forest Products 32
Estimated Total Economic Impacts of Agriculture and Forestry 34 Primary Agriculture Products Total Impacts 37 Secondary Agriculture Products Total Impacts 43 Primary Forest Products Total Impacts 47 Secondary Forest Products Total Impacts 50
Tennessee Agriculture and Forestry Tax Impacts 58 Summary and Conclusion 59 Literature Cited 63 Appendix A: IMPLAN Methodology 66 Appendix B: IMPLAN Sectors with Descriptions 70 Appendix C: County Region Identification Table 82 Appendix D: Total Industry Output, Employment, Labor Income, and Total
Value‐Added by Agriculture and Forestry Sectors for Tennessee, 2011 84 Appendix E: Total Impacts from the Agriculture and Forestry Sectors, Tennessee, 2011 115
v
List of Tables Page Table 1. Crops Harvested, Acreage, State Ranking, and Cash Receipts, 2011 3 Table 2. Livestock Numbers, State Ranking, and Cash Receipts, 2011 4 Table 3. State Value of Agricultural Commodities and U.S. Market Share, 2011 5 Table 4. Manufacturing Statistics for Tennessee, 2011 12 Table 5. Comparison of Tennessee Livestock Numbers and Prices, 2009 and 2011 14 Table 6. Comparison of Tennessee Crop Acreages and Prices, 2009 and 2011 14 Table 7. Estimated Economic Indicators for Tennessee, 2011 20 Table 8. Direct Economic Activity in Agriculture and Forestry 20 Table 9. State Level: Direct Economic Activity in Farm Production 24 Table 10. Region Level: Direct Economic Activity in Farm Production (Top Ten 25 Sectors) Table 11. Direct Economic Activity in Secondary Agricultural Products 28 Table 12. Direct Economic Activity in Primary Forest Products 30 Table 13. Direct Economic Activity in Secondary Forest Products 33 Table 14. Estimated Total Economic Impacts from Agriculture and Forestry 34 Table 15. Estimated Total Economic Impacts from Secondary Agricultural Products 44 Table 16. Estimated Total Economic Impacts from Primary Forest Products 49 Table 17. Estimated Total Economic Impacts from Secondary Forest Products 51 Table 18. Output and Employment Multipliers for Selected Agriculture and Forestry
Sectors 53 Table 19. Counties with the Highest Proportion of Economic Activity for Agriculture
and Forestry by Analysis Regions, 2009 57 Table 20. State/Local and Federal Tax Revenues from Tennessee Agriculture and Forestry, 2011 58 Table 21. Regional Importance of Agriculture to that Region’s Economy, 2011 61 Table B.1. IMPLAN 440 Industry Sector Descriptions and NAICS 71 Table C.1 County Assignment to TNAIM’s Modeling Regions 83 Table D.1. Direct Impacts from Agriculture and Forestry, Tennessee, 2011 85 Table D.2. Direct Impacts from Agriculture and Forestry, Chattanooga Region, 2011 90 Table D.3. Direct Impacts from Agriculture and Forestry, Knoxville Region, 2011 95 Table D.4. Direct Impacts from Agriculture and Forestry, Memphis Region, 2011 100 Table D.5. Direct Impacts from Agriculture and Forestry, Nashville Region, 2011 105 Table D.6. Direct Impacts from Agriculture and Forestry, Tri‐Cities Region, 2011 110 Table E.1. Total Impacts from Agriculture and Forestry, Tennessee, 2011 116 Table E.2. Total Impacts from Agriculture and Forestry, Chattanooga Region, 2011 124 Table E.3. Total Impacts from Agriculture and Forestry, Knoxville Region, 2011 132 Table E.4. Total Impacts from Agriculture and Forestry, Memphis Region, 2011 140 Table E.5. Total Impacts from Agriculture and Forestry, Nashville Region, 2011 148 Table E.6. Total Impacts from Agriculture and Forestry, Tri‐Cities Region, 2011 155

vi
List of Figures Page Figure 1. Number of Food Manufacturing Establishments in Tennessee, 2010 7 Figure 2. Number of Animal Slaughtering and Processing Facilities in Tennessee, 2010 7 Figure 3. Number of Beverage and Tobacco Products Establishments in
Tennessee, 2010 8 Figure 4. Number of Textile Mills Establishments in Tennessee, 2010 8 Figure 5. Number of Textile Product Mills Establishments in Tennessee, 2010 9 Figure 6. Number of Apparel Manufacturing Establishments in Tennessee, 2010 9 Figure 7. Number of Leather and Allied Products Establishments in Tennessee, 2010 10 Figure 8. Number of Wood Product Manufacturing Establishments in Tennessee, 2010 10 Figure 9. Number of Paper Manufacturing Establishments in Tennessee, 2010 11 Figure 10. Number of Furniture and Related Products Establishments in
Tennessee, 2010 11 Figure 11. Departure from Normal Precipitation for Tennessee’s Climate Divisions 15 Figure 12. Tennessee Agri‐Industry Model Analysis Regions 16 Figure 13. Total Industry Output by Sector, Tennessee, 2011 19 Figure 14. Employment by Sector, Tennessee, 2011 19 Figure 15. Growth in Direct Agriculture and Forestry as a Percentage of Tennessee’s Total Economy 22 Figure 16. Growth in Total Agriculture and Forestry as a Percentage of Tennessee’s Total Economy 36 Figure 17. Estimated Direct, Indirect, and Induced Impacts for Oilseed Farming and
Grain Farming 38 Figure 18. Estimated Direct, Indirect, and Induced Impacts for Vegetable & Melon
Farming and Greenhouse, Nursery, & Floriculture Production 39 Figure 19. Estimated Direct, Indirect, and Induced Impacts for Tobacco Farming and
Cotton Farming 40 Figure 20. Estimated Direct, Indirect, and Induced Impacts for All Other Crops Farming
And Cattle Ranching & Farming 41 Figure 21. Estimated Direct, Indirect, and Induced Impacts for Dairy Cattle & Milk
Production and Poultry & Egg Production 42 Figure 22. Estimated Direct, Indirect, and Induced Impacts for Animal Production, Except Cattle, Poultry, & Eggs 43 Figure 23. Estimated Direct, Indirect, and Induced Impacts for Sawmills & Wood
Preservation 47 Figure 24. Estimated Direct, Indirect, and Induced Impacts for Commercial Logging 48 Figure 25. Percent of Economic Activity from Direct Agriculture, 2011 54 Figure 26. Percent of Economic Activity from Total Agriculture, 2011 54 Figure 27. Percent of Economic Activity from Direct Forestry, 2011 55 Figure 28. Percent of Economic Activity from Total Forestry, 2011 55 Figure 29. Percent of Economic Activity from Direct Agriculture and Forestry, 2011 56 Figure 30. Percent of Economic Activity from Total Agriculture and Forestry, 2011 56 Figure A.1. Social Accounting Matrix Framework 69

Economic Impacts of Agriculture and Forestry in Tennessee
Introduction
This study measures the economic importance and impacts of agricultural and forestry
industrial complexes on Tennessee’s economy in 2011. An input‐output model reflecting the
state’s 2011 economy is used to determine direct impacts on related input industries, and
impacts through resulting expenditures by households at both the state and five‐region level.
The impacts are provided for four major indicators: total industry output, employment, labor
income, and value‐added. This study continues the series of previous reports (English, Jensen,
and Menard, 2001 and 2003; Menard, English, and Jensen, 2006, 2009 and 2011) where the
economic importance and impacts of agricultural and forestry industrial complexes on
Tennessee’s economy were examined using 1997, 2000, 2003, 2006, and 2009 data,
respectively (for additional details on the previous studies and the IMPLAN version used, see
Appendix A).
For the purpose of this analysis, agriculture1 and forestry includes the production and
processing of agricultural and forest products and the input suppliers of these products. The
objectives of this analysis are to: 1) provide an overview of Tennessee’s agriculture and
forestry resource base, 2) compare livestock and crop statistics for 2009 and 2011, 3) evaluate
the economic importance and impacts of the agricultural and forestry industrial complex for the
state and for specific consumption regions within the state, and 4) evaluate agriculture and
forestry’s tax contributions to the state.
1In this report, forestry and the production of forest products were incorporated in agriculture and agribusiness, respectively.

2
This document is structured along the same theme as the objectives. First, an overview
of Tennessee’s agriculture and forestry is presented. Crop and livestock cash receipts,
Tennessee’s rank in the United States based on the production of agricultural products, exports
for both agricultural and forestry products, plus agricultural and forestry manufacturing
statistics are discussed. Next, a review of state level changes in livestock and crops for the
years 2009 and 2011 is presented. Changes in livestock inventory, crop acreages, prices,
including a brief discussion of rainfall by climate divisions in the state are discussed in the
section. Finally, the remaining part of the document evaluates the economic impacts and
importance of the agricultural and forestry industrial complex for the state and specific
consumption regions within the state with an input‐output model. After the data and
methodology section discussion, direct and total economic impact results are summarized.
Overview of Agriculture and Forestry in Tennessee
In 2011, 77,300 Tennessee farms used 10.8 million acres, or 41.0 percent of the state’s
land base. From 2007 to 2011, the number of farms in the state decreased an average of 0.7
percent annually. The average farm, in 2011, was 140 acres in size compared to 418 acres for
the United States. Approximately 70.6 percent of the total number of farms had sales in the
$1,000‐$9,999 range, 23.5 percent in the $10,000‐$99,999 range, and 5.8 percent had sales of
$100,000 or more (Tennessee Department of Agriculture, 2012; USDA/NASS, 2007a).
Cash receipts for all commodities in Tennessee totaled $3.5 billion for 2011. Of that
total, close to $2.1 billion (59.9 percent) was from crops with the balance, $1.4 billion (40.1
percent), from all livestock and livestock products. Tennessee was ranked in the upper half of
the nation for most major crops (rice and peanuts are not grown extensively in the state) (Table
1). Approximately 39.7 percent of Tennessee’s total harvested cropland acreage (roughly 4.7

3
Table 1. Crops Harvested, Acreage, State Ranking, and Cash Receipts, 2011
Crops Acreage State
Ranking Leading State Cash Receipts
% of Total3
(Thousand Acres) (Thousand $)
Hay (all types) 1,880 1 Missouri $83,457 2.4 Soybeans 1,250 17 Iowa $461,334 13.2 Corn for Grain 735 17 Iowa $456,114 13.0 Cotton, Lint 490 8 Texas $401,123 11.5 Winter Wheat 310 24 Kansas $139,578 4.0 Corn for Silage 38 30 Wisconsin ‐‐ ‐‐ All Tobacco 22 4 N. Carolina $96,875 2.8 Vegetables* 15 2 ‐‐ $47,777 1.4 *Snap beans, squash, and tomatoes 1Tennesse is ranked 4th for all hay; 31 for alfalfa 2Tennessee is ranked 5th for snapbeans; 4th for tomatoes 3For 2011, cash receipts for all commodities were $3.5 billion ($2.1 billion for crops; $1.4 billion for livestock & products) Source: Tennessee Department of Agriculture, 2012
million acres) was in hay (all types), followed by soybeans (26.4 percent), corn for grain (15.5
percent), cotton (10.3 percent), and wheat (6.5 percent). Among crops, soybeans had the
largest cash receipts, followed by corn, cotton, wheat, tobacco, hay, and vegetables.
Tennessee’s top crop counties included Robertson County for all tobacco, Obion County for
corn, Haywood County for cotton, Gibson County for wheat, Obion County for Soybeans, and
Green County for all other hay.
Cash receipts in 2011 for all livestock and livestock products in Tennessee totaled $1.4
billion. In terms of the number of head, broilers, chickens, cattle and calves, hogs and pigs,
equine, and milk cows were the predominant livestock in the state (Table 2). According to the
Tennessee Department of Agriculture for 2011, cash receipts from farm marketing for these
livestock products (except for beef cows and equine) totaled close to $1.3 billion. Of that total,
cattle and calves contributed 43.0 percent, broilers 33.9 percent, dairy products 12.8 percent,
and hogs and pigs 4.6 percent. Tennessee is ranked sixth in the United States for the number of
equine on farms, 9th for beef cows, 14th for broilers, 15th cattle and calves, 25th for hogs and
4
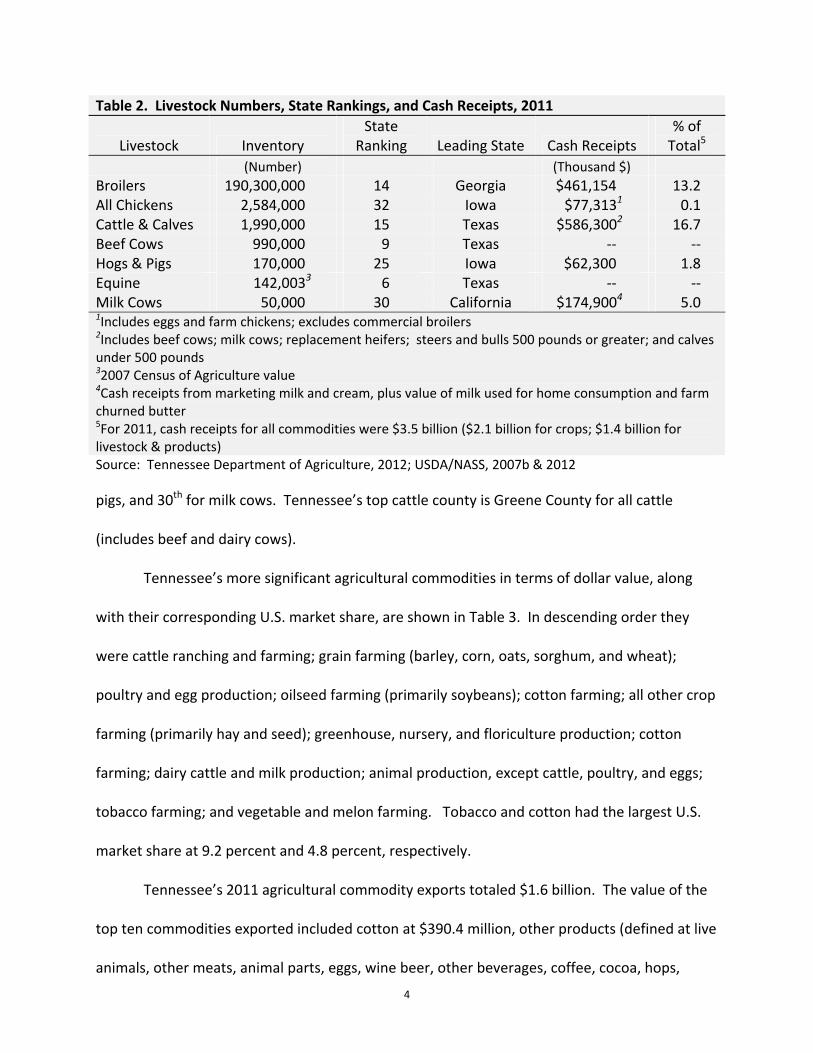
Table 2. Livestock Numbers, State Rankings, and Cash Receipts, 2011
Livestock Inventory State
Ranking Leading State Cash Receipts % of Total5
(Number) (Thousand $)
Broilers 190,300,000 14 Georgia $461,154 13.2 All Chickens 2,584,000 32 Iowa $77,3131 0.1 Cattle & Calves 1,990,000 15 Texas $586,3002 16.7 Beef Cows 990,000 9 Texas ‐‐ ‐‐ Hogs & Pigs 170,000 25 Iowa $62,300 1.8 Equine 142,0033 6 Texas ‐‐ ‐‐ Milk Cows 50,000 30 California $174,9004 5.0 1Includes eggs and farm chickens; excludes commercial broilers 2Includes beef cows; milk cows; replacement heifers; steers and bulls 500 pounds or greater; and calves under 500 pounds 32007 Census of Agriculture value 4Cash receipts from marketing milk and cream, plus value of milk used for home consumption and farm churned butter 5For 2011, cash receipts for all commodities were $3.5 billion ($2.1 billion for crops; $1.4 billion for livestock & products)
Source: Tennessee Department of Agriculture, 2012; USDA/NASS, 2007b & 2012 pigs, and 30th for milk cows. Tennessee’s top cattle county is Greene County for all cattle
(includes beef and dairy cows).
Tennessee’s more significant agricultural commodities in terms of dollar value, along
with their corresponding U.S. market share, are shown in Table 3. In descending order they
were cattle ranching and farming; grain farming (barley, corn, oats, sorghum, and wheat);
poultry and egg production; oilseed farming (primarily soybeans); cotton farming; all other crop
farming (primarily hay and seed); greenhouse, nursery, and floriculture production; cotton
farming; dairy cattle and milk production; animal production, except cattle, poultry, and eggs;
tobacco farming; and vegetable and melon farming. Tobacco and cotton had the largest U.S.
market share at 9.2 percent and 4.8 percent, respectively.
Tennessee’s 2011 agricultural commodity exports totaled $1.6 billion. The value of the
top ten commodities exported included cotton at $390.4 million, other products (defined at live
animals, other meats, animal parts, eggs, wine beer, other beverages, coffee, cocoa, hops,

5
Table 3. State Value of Agricultural Commodities and U.S. Market Share, 2011
Commodity Value U.S. Market Share
(Million $) (Percent)
Cattle Ranching & Farming $586 0.9 Grain Farming $537 0.6 Poultry & Egg Production $524 1.4 Oilseed Farming $461 1.2 Cotton Farming $401 4.8 All Other Crop Farming1 $337 1.1 Greenhouse, Nursery, & Floriculture Production $317 1.9 Dairy Cattle & Milk Production $179 0.5 Animal Production, except Cattle & Poultry & Eggs2 $120 0.4 Tobacco Farming $97 9.2 Vegetable & Melon Farming $89 0.4 Commercial Hunting & Trapping $53 1.6 Fruit Farming $10 0.04 Tree Nut Farming $1 0.01 1Primarily hay and seed farming 2Primarily hogs, sheep & goats, aquaculture, equine, and apiculture Source: Minnesota IMPLAN Group, Inc., 2011a
nursery crops, inedible materials, and prepared foods) at $311.4 million; soybeans at $215.6
million, wheat at $106.2 million, unmanufactured tobacco at $105.4 million; corn at $97.6
million; chicken meat at $82.5 million; vegetables oils at $51.9 million; feeds and fodder at
$50.6 million; and beef and veal at $50.5 million (USDA/ERS, 2012). Major markets for
Tennessee’s exports of agricultural and livestock products included China, Mexico, Turkey,
Indonesia, Viet Nam, Thailand, and Canada (USDOC/ITA, 2011).
In 2011, Tennessee’s forest products (paper products, wood products, plus furniture
and related products) exported outside the United States, including forestry and logging,
totaled close to $1.0 billion. Paper products had the highest export value at $682.3 million,
followed by wood products ($180.1 million), furniture and related products ($90.6 million), and
forestry and logging ($79.5 million). The countries receiving Tennessee’s forest products
6
exports included Mexico for paper products, China for wood products, and Canada for furniture
and fixtures and logging (USDOC/ITA, 2011).
Tennessee’s forest cover is primarily hardwoods (89 percent of the forest composition)
making it one of the top three hardwood lumber producing states in the United States. It is
estimated that over 120 tree species exist in Tennessee. White oak, red oak, hickory, yellow
poplar, and maple were some of the more predominant hardwood species. For softwoods,
loblolly pine, virginia pine, red cedar, and shortleaf pine were major species. The dominant
forest type in the state is oak‐hickory, accounting for an estimated 9.9 million acres. Of the
close to 14.0 million acres in forest, 83.7 percent is privately owned with Federal and state/local
forests comprising 10.0 percent and 6.3 percent, respectively (USDA Forest Service, 2013).
Timber sales on private lands totaled $288.0 million in 2011. Most of the state’s forests are
mature or over‐mature in age, which may lead to an unhealthy imbalance of tree ages.
Tennessee is home to 15 state forests totaling around 166,897 acres. In 2010, guidelines were
issued by the Tennessee Department of Forestry (see “Plan 2020: Harvest Plan for Sustainable
State Forests”) to sustainably harvest state owned forests in the future to achieve a more
balanced age‐class distribution (Tennessee Depart of Agriculture, 2011; Clatterbuck, 2013).
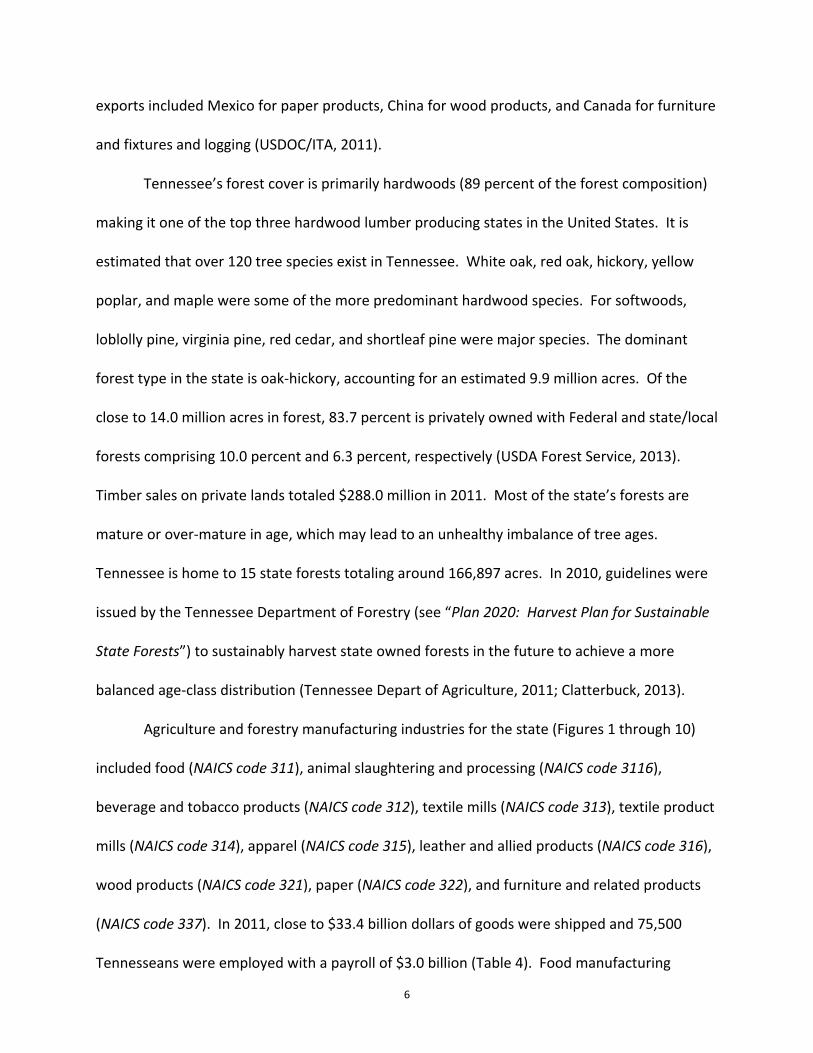
Agriculture and forestry manufacturing industries for the state (Figures 1 through 10)
included food (NAICS code 311), animal slaughtering and processing (NAICS code 3116),
beverage and tobacco products (NAICS code 312), textile mills (NAICS code 313), textile product
mills (NAICS code 314), apparel (NAICS code 315), leather and allied products (NAICS code 316),
wood products (NAICS code 321), paper (NAICS code 322), and furniture and related products
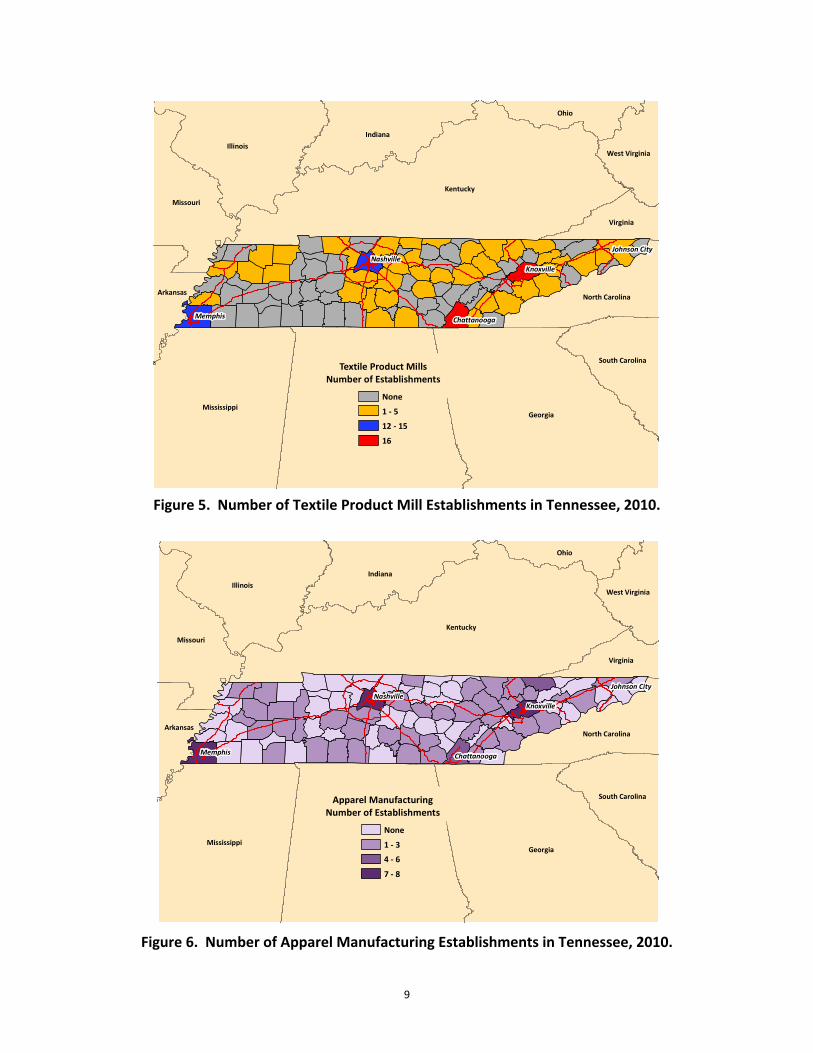
(NAICS code 337). In 2011, close to $33.4 billion dollars of goods were shipped and 75,500
Tennesseans were employed with a payroll of $3.0 billion (Table 4). Food manufacturing

7
Figure 1. Number of Food Manufacturing Establishments in Tennessee, 2010.
Figure 2. Number of Animal Slaughtering & Processing Establishments in Tennessee, 2010.
Kentucky
GeorgiaAlabama
Illinois
Mississippi
Indiana
Ohio
Missouri
South Carolina
North Carolina
Virginia
Arkansas
West Virginia
Memphis
Knoxville
Nashville
Chattanooga
Johnson City
Food ManufacturingNumber of Establishments
None
1 ‐ 5
6 ‐ 15
16 ‐ 30
31 ‐ 42
Kentucky
GeorgiaAlabama
Illinois
Mississippi
Indiana
Ohio
Missouri
South Carolina
North Carolina
Virginia
Arkansas
West Virginia
Memphis
Knoxville
Nashville
Chattanooga
Johnson City
Animal Slaughtering & ProcessingNumber of Establishments
None
1 ‐ 2
3 ‐ 4

8
Figure 3. Number of Beverage and Tobacco Products Establishments in Tennessee, 2010.
Figure 4. Number of Textile Mill Establishments in Tennessee, 2010.
Kentucky
GeorgiaAlabama
Illinois
Mississippi
Indiana
Ohio
Missouri
South Carolina
North Carolina
Virginia
West Virginia
Arkansas
Memphis
KnoxvilleNashville
Chattanooga
Johnson City
Beverage and Tobacco Products ManufacturingNumber of Establishments
None
1 ‐ 3
4 ‐ 6
7 ‐ 8
Georgia
Kentucky
AlabamaMississippi
Illinois
Indiana
Missouri
Ohio
South Carolina
North Carolina
Virginia
Arkansas
West Virginia
Memphis
Knoxville
Nashville
Chattanooga
Johnson City
Textile MillsNumber of Establishments
None
1 ‐ 2
3 ‐ 4
5 ‐ 6
9
Figure 5. Number of Textile Product Mill Establishments in Tennessee, 2010.
Figure 6. Number of Apparel Manufacturing Establishments in Tennessee, 2010.
Georgia
Kentucky
AlabamaMississippi
Illinois
Indiana
Missouri
Ohio
South Carolina
North Carolina
Virginia
Arkansas
West Virginia
Memphis
Knoxville
Nashville
Chattanooga
Johnson City
Textile Product MillsNumber of Establishments
None
1 ‐ 5
12 ‐ 15
16
Georgia
Kentucky
AlabamaMississippi
Illinois
Indiana
Missouri
Ohio
South Carolina
North Carolina
Virginia
Arkansas
West Virginia
Memphis
KnoxvilleNashville
Chattanooga
Johnson City
Apparel ManufacturingNumber of Establishments
None
1 ‐ 3
4 ‐ 6
7 ‐ 8

10
Figure 7. Number of Leather & Allied Product Establishments in Tennessee, 2010.
Figure 8. Number of Wood Product Manufacturing Establishments in Tennessee, 2010.
Kentucky
GeorgiaAlabama
Illinois
Mississippi
Indiana
Ohio
Missouri
South Carolina
North Carolina
Virginia
West Virginia
Arkansas
Memphis
Knoxville
Nashville
Chattanooga
Johnson City
Leather & Allied Product ManufacturingNumber of Establishments
None
1 ‐ 2
7
Georgia
Kentucky
AlabamaMississippi
Illinois
Indiana
Missouri
Ohio
South Carolina
North Carolina
Virginia
Arkansas
West Virginia
Memphis
Knoxville
Nashville
Chattanooga
Johnson City
Wood Product ManufacturingNumber of Establishments
None
1 ‐ 5
6 ‐ 10
11 ‐ 15
16 ‐ 31

11
Figure 9. Number of Paper Manufacturing Establishments in Tennessee, 2010.
Figure 10. Number of Furniture & Related Products Establishments in Tennessee, 2010.
Georgia
Kentucky
AlabamaMississippi
Illinois
Indiana
Missouri
Ohio
South Carolina
North Carolina
Virginia
Arkansas
West Virginia
Memphis
KnoxvilleNashville
Chattanooga
Johnson City
Paper ManufacturingNumber of Establishments
None
1 ‐ 5
6 ‐ 10
11 ‐ 15
Georgia
Kentucky
AlabamaMississippi
Illinois
Indiana
Missouri
Ohio
South Carolina
North Carolina
Virginia
Arkansas
West Virginia
Memphis
Knoxville
Nashville
Chattanooga
Johnson City
Furniture & Related Product ManufacturingNumber of Establishments
None
1 ‐ 15
16 ‐ 30
31 ‐ 35
12
Table 4. Manufacturing Statistics for Tennessee, 2011
Manufacturing Industry/NAICS Value of Code Employees Payroll Establishments1 Shipments
(Number) (Thousand $) (Number) (Thousand $) Food (311) 33,906 $1,403,198 302 $17,852,162 Animal Slaughtering & Processing (3116) 10,298 $310,206 64 $3,225,631Beverage & Tobacco Products (312) 2,765 $152,557 67 $5,556,564Textile Mills (313) 3,206 $133,191 52 $1,112,345Textile Product Mills (314) 2,682 $78,819 128 $583,628Apparel (315) 3,757 $89,481 96 DLeather & Allied Products (316) N/A N/A 29 N/AWood Products (321) 9,867 $305,284 517 $1,742,451Paper (322) 11,036 $576,741 136 $5,264,329Furniture & Related Products (337) 8,305 $282,144 357 $1,336,446
Total2 75,524 $3,021,415 1,684 $33,447,925
D = Data not disclosed N/A = Data Not available 1Latest available data is for 2010 2Values for animal slaughtering and processing are imbedded in food manufacturing (311) values Source: U.S. Census Bureau, Annual Survey of Manufacturers, Geographic Area Statistics, 2011; U.S Census Bureau, Censtats Databases, 2010.
shipped the largest value of goods, over $17.8 billion, followed by beverage and tobacco
products manufacturing at $5.5 billion, and paper manufacturing at $5.3 billion. As a group,
textile mills, including textile product mills and apparel, shipped $1.7 billion. For the forest
products group, which included wood products manufacturing, paper manufacturing, and
furniture and related products, $8.3 billion of goods were shipped. Tennessee’s national
market share for value of shipments for food manufacturing was 2.5 percent, beverage and
tobacco products at 4.1 percent, textile mills at 3.5 percent, textile product mills at 2.6 percent,
wood product manufacturing at 2.5 percent, paper manufacturing at 3.0 percent, and furniture
and related products at 2.2 percent (U.S. Census Bureau, 2011).
Of the value‐added agro‐forestry sectors, food manufacturing employed the largest
share at close to 34,000. This was followed by the forest products group (wood product
manufacturing, paper manufacturing, and furniture and related products), which employed

13
close over 29,000. The textile mills and related products, including apparel, employed over
9,600 workers.
State Level Changes in Livestock and Crops: 2009 to 2011
Comparing 2009 and 2011 agricultural data for the state revealed an increase in the
number of cattle and calves, broilers, and eggs, while the number of chickens (excluding
broilers), dairy cattle, and hogs decreased. Prices increased for all livestock products. Many of
the traditional row crops grown in the state experienced increased planted acreage except for
soybeans, wheat, and hay. Crop prices increased for all major crops grown including the
vegetable crops tomatoes and snap beans.
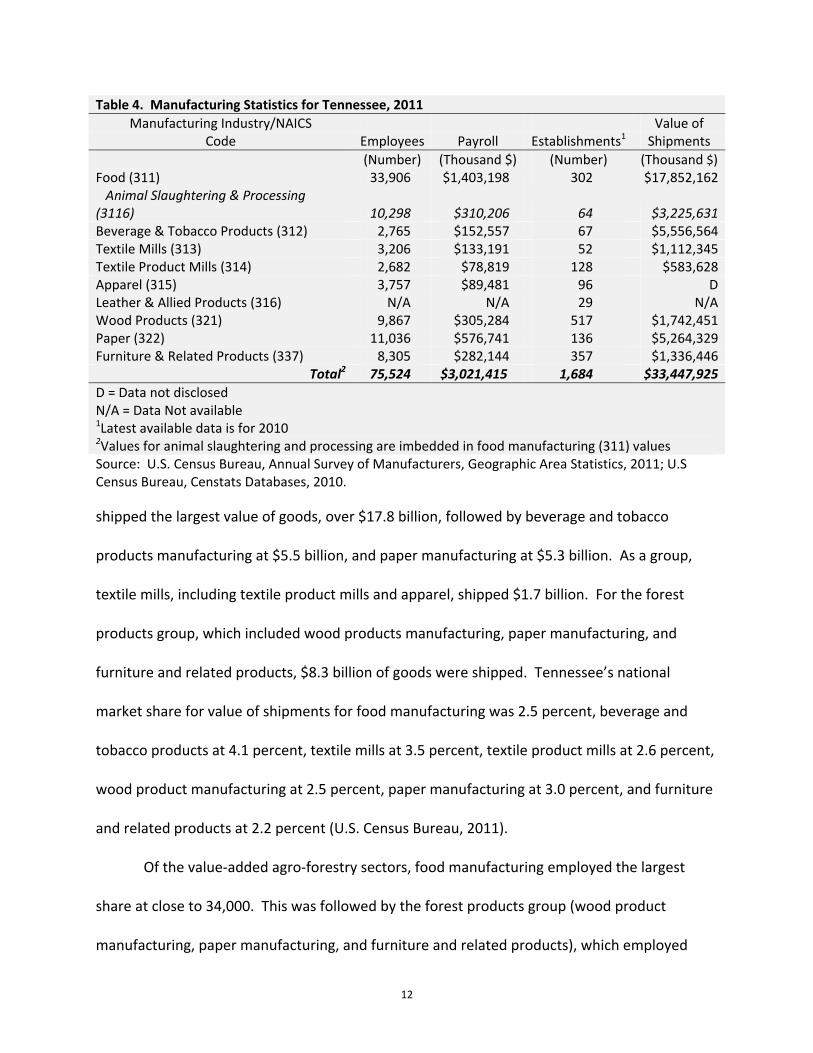
Precipitation for the state by climatic division for the timeframe reviewed in Figure 11.
Above average rainfall occurred across the state for the years 2009 and 2011. For 2008, below
normal rainfall occurred across most of the state, except for West Tennessee. For 2010, below
normal rainfall occurred across the entire state (U.S. Department of Commerce, 2011).
Livestock Changes in Inventory and Prices
Compared to 2009 production levels, eggs had the largest increase in numbers (12.4
percent), followed by cattle and calves and broilers (both under 1.0 percent) (Table 5). The
largest decrease in numbers was for hogs (17.1 percent), followed by milk cows (15.3 percent),
and all chickens (8.0 percent). Total milk production for the state declined 11.0 percent from
2009 (909 million pounds) to 2011 (810 million pounds). Livestock prices were higher for all
livestock products. Hogs had the greatest price increase at 63.4 percent, followed by eggs (36.8
percent), cattle and calves (29.9 percent), all chickens (3.0 percent), and broilers (2.2 percent)
(Tennessee Department of Agriculture, 2012).

14
Table 5. Comparison of Tennessee Livestock Numbers and Prices, 2009 and 20111
Commodity Inventory Change Units Price Change Units 2009 2011 2009 2011
% 1,000 (dollars/unit) % All Cattle & Calves 1,980 1,990 0.5 head $68.30 $88.70 29.9 100 pounds All Chickens 2,808 2,584 ‐8.0 no. $6.60 $6.80 3.0 head Broilers 189,700 190,300 0.3 no. $0.46 $0.47 2.2 pound Eggs 323,000 363,000 12.4 no. $1.44 $1.97 36.8 dozen Milk Cows 59 50 ‐15.3 head ‐‐ ‐‐ ‐‐ head All Hogs 205 170 ‐17.1 head $39.60 $64.70 63.4 100 pounds
Source: Tennessee Department of Agriculture, 2010 and 2012; USDA/NASS, 2012 1Data in nominal values.
Crop Changes in Acres Planted and Prices
With the exception of soybeans, wheat, tomatoes, and hay, acres of crops harvested
increased from 2009 to 2011 (Table 6). Cotton had the largest increase in acres harvested at
75.0 percent, followed by snap beans (58.8 percent), corn (24.6 percent), and tobacco (1.9
percent. Cotton harvested acres increased from 280 to 490 thousand acres. All the crop
commodities experienced higher prices for the timeframe examined. The largest price increase
was for corn, followed by wheat, cotton, soybeans, snap beans, tomatoes, hay, and tobacco.
Table 6. Comparison of Tennessee Crop Acreages and Prices, 2009 and 20111
Commodity Harvested Acres Change Price Change Units 2009 2011 2009 2011
1,000 acres % $/unit % Hay, All 1,915 1,880 ‐1.8 $77.49 $83.62 7.9 ton Corn 590 735 24.6 $3.65 $6.50 78.1 bushel Soybeans 1,530 1,250 ‐18.3 $9.65 $12.00 24.4 bushel Cotton 280 490 75.0 $0.63 $0.93 46.4 pound Tobacco 21.6 22 1.9 $2.10 $2.16 2.9 pound Wheat 340 310 ‐8.8 $4.64 $6.85 47.6 bushel Tomatoes 4.0 3.8 ‐5.0 $33.00 $36.00 9.1 cwt Snap Beans 6.8 10.8 58.8 $31.05 $34.97 12.6 cwt Source: Tennessee Department of Agriculture, 2010 and 2012 1Data in Nominal Values.
Changes in yields for Tennessee’s crops can be attributed to better crop varieties and
producers’ management practices. However, weather also plays an important role too.
Precipitation values from 2008 to 2011 are shown in Figure 11. The values shown were
15
Figure 11. Departure from Normal Precipitation for Tennessee’s Climate Divisions.
departure from normal precipitation. For example, for the western climate division in 2008,
rainfall was 3.21 inches above normal precipitation values. Likewise, for that same climate
division for 2010, rainfall was 2.76 inches below normal. Rainfall for years 2009 and 2011 were
above normal for much of the state. On the other hand, rainfall was below normal for all
climate divisions in 2010. For 2008, rainfall was below normal for all climate divisions except
for West Tennessee where rainfall was 3.21 inches above normal.
Changes in acres, yields, and prices impacted the total industry output (value of
production) contributed to the state’s economy from crops. Of the five major crops, cotton,
corn, and wheat had an increase in gross receipts from comparing 2009 to 2011. Soybeans and
2008 = 3.21 in.2009 = 6.48 in.2010 = ‐2.76 in.2011 = 8.92 in.
2008 = ‐3.60 in.2009 = 5.77 in.2010 = ‐0.76 in.2011 = 4.66 in.
2008 = ‐6.89 in.2009 = 8.27 in.2010 = ‐1.65 in.2011 = 12.47 in.
2008 = ‐4.89 in.2009 = 11.75 in.2010 = ‐1.30 in.2011 = 10.13 in.
Tennessee Climate Divisions
Eastern
Cumberland Plateau
Middle
Western

16
tobacco had a decrease in gross receipts during this timeframe (Tennessee Department of
Agriculture, 2010 and 2012).
Input‐Output Analysis: Data and Methods Used
The Tennessee Agri‐Industry Model (TN‐AIM) was used to model industry and
institutional interrelationships in each of five regions within Tennessee. TN‐AIM is based on the
Impact Analysis for Planning (IMPLAN) model and databases (Olson and Lindall, 1999). The five
regions followed those used by the Bureau of Economic Analysis to represent areas of
economic consumption (consumption regions), as displayed in Figure 12 (for county listings, see
Appendix C) (USDOC, 2011a). Regional values were then aggregated to the state level. For
additional information on IMPLAN see Appendix A.
Figure 12. Tennessee Agri‐Industry Model Analysis Regions.
!
!
!
!
!
Kentucky
GeorgiaAlabama
Illinois
Mississippi
Indiana
Ohio
Missouri
North Carolina
South Carolina
Virginia
West Virginia
Bristol
Memphis
Knoxville
Nashville
Chattanooga
Tennessee BEA Regions
Memphis Region
Nashville Region
Chattanooga Region
Knoxville Region
Tri‐Cities Region
17
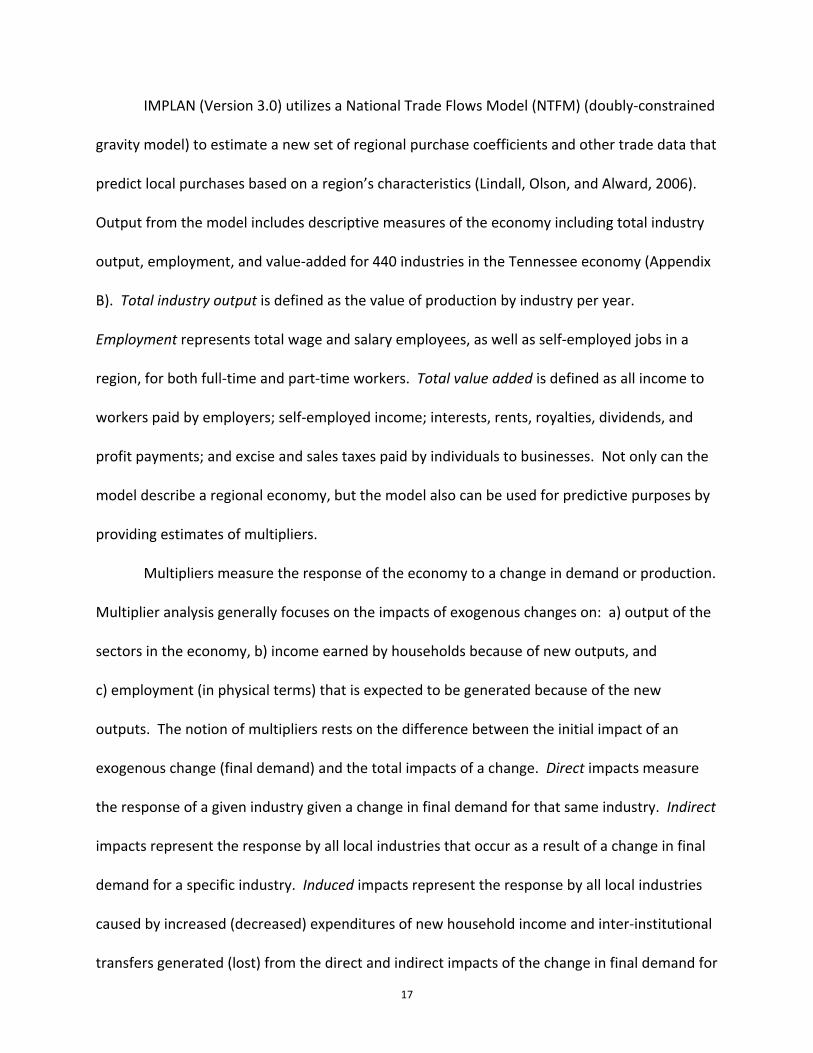
IMPLAN (Version 3.0) utilizes a National Trade Flows Model (NTFM) (doubly‐constrained
gravity model) to estimate a new set of regional purchase coefficients and other trade data that
predict local purchases based on a region’s characteristics (Lindall, Olson, and Alward, 2006).
Output from the model includes descriptive measures of the economy including total industry
output, employment, and value‐added for 440 industries in the Tennessee economy (Appendix
B). Total industry output is defined as the value of production by industry per year.
Employment represents total wage and salary employees, as well as self‐employed jobs in a
region, for both full‐time and part‐time workers. Total value added is defined as all income to
workers paid by employers; self‐employed income; interests, rents, royalties, dividends, and
profit payments; and excise and sales taxes paid by individuals to businesses. Not only can the
model describe a regional economy, but the model also can be used for predictive purposes by
providing estimates of multipliers.
Multipliers measure the response of the economy to a change in demand or production.
Multiplier analysis generally focuses on the impacts of exogenous changes on: a) output of the
sectors in the economy, b) income earned by households because of new outputs, and
c) employment (in physical terms) that is expected to be generated because of the new
outputs. The notion of multipliers rests on the difference between the initial impact of an
exogenous change (final demand) and the total impacts of a change. Direct impacts measure
the response of a given industry given a change in final demand for that same industry. Indirect
impacts represent the response by all local industries that occur as a result of a change in final
demand for a specific industry. Induced impacts represent the response by all local industries
caused by increased (decreased) expenditures of new household income and inter‐institutional
transfers generated (lost) from the direct and indirect impacts of the change in final demand for
18
a specific industry. This study uses Type I and Type SAM (Social Accounting Matrix) multipliers.
Type I multipliers are calculated by dividing direct plus indirect impacts by the direct impacts,
where the Type SAM multipliers = (direct + indirect + induced impacts)/direct impacts. The
Type SAM multipliers take into account the expenditures resulting from increased incomes of
households as well as inter‐institutional transfers resulting from the economic activity.
Therefore, Type SAM multipliers assume that as final demand changes, incomes also increase
along with inter‐institutional transfers. As consumers and institutions increase expenditures
this leads to increased demands from local industries.
Results
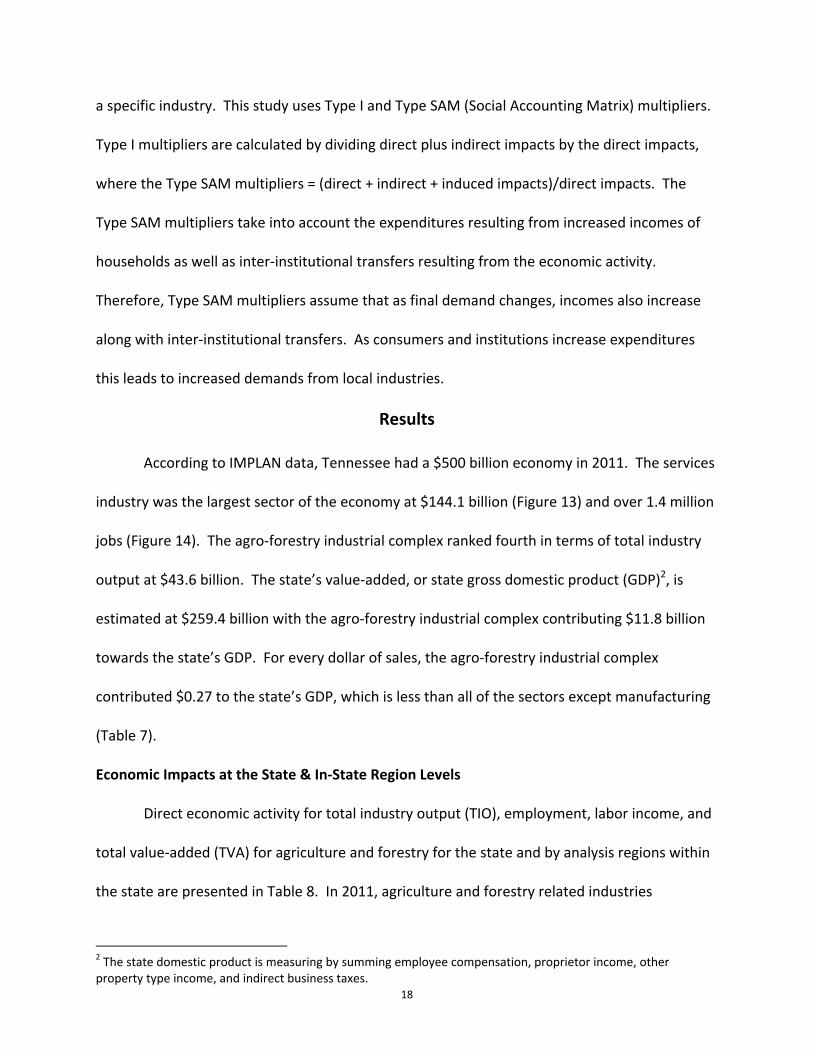
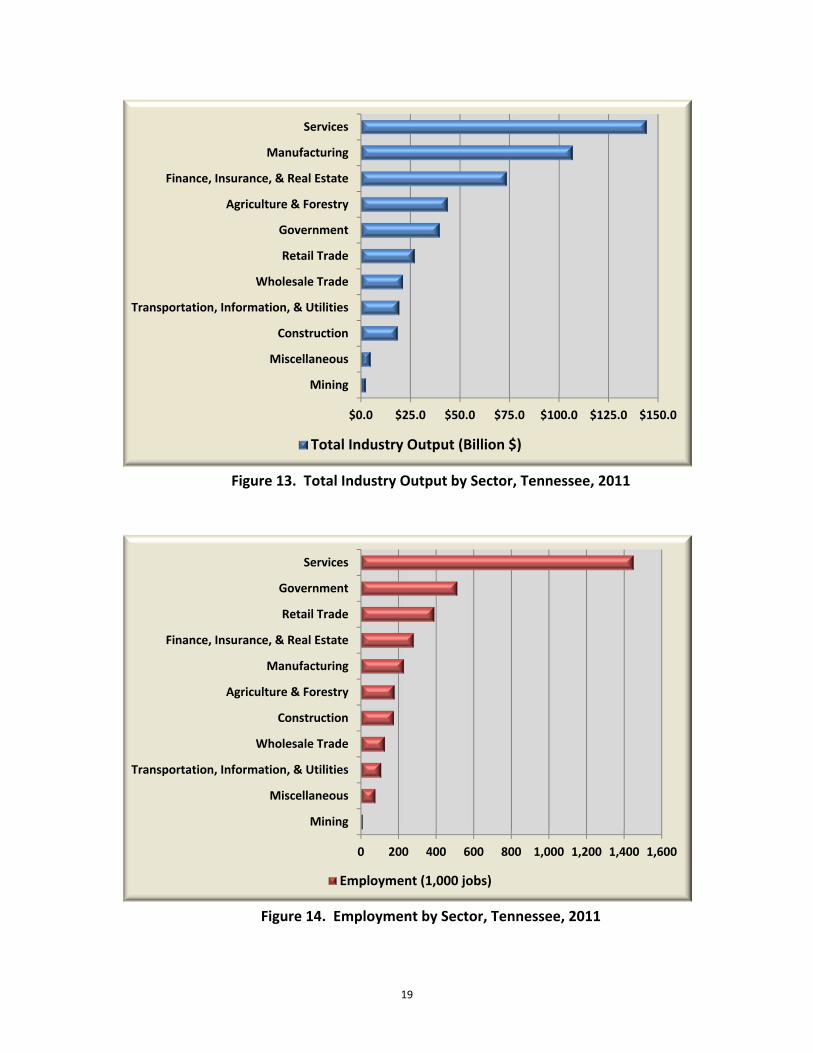
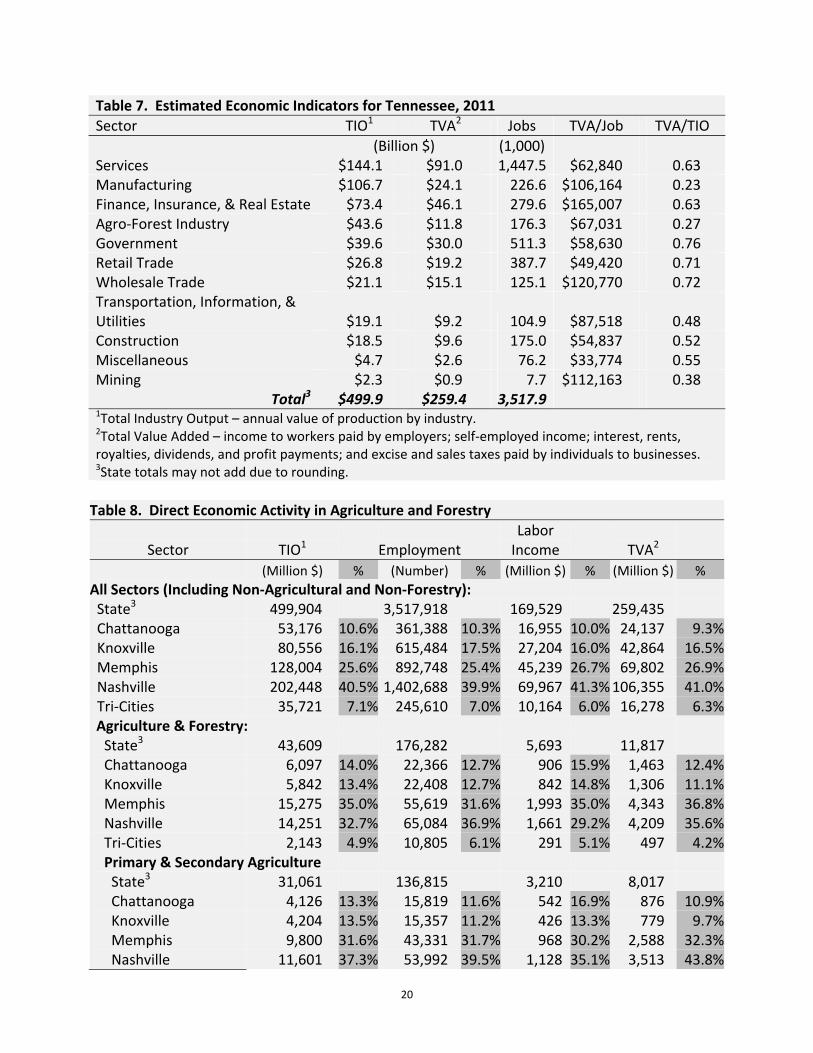
According to IMPLAN data, Tennessee had a $500 billion economy in 2011. The services
industry was the largest sector of the economy at $144.1 billion (Figure 13) and over 1.4 million
jobs (Figure 14). The agro‐forestry industrial complex ranked fourth in terms of total industry
output at $43.6 billion. The state’s value‐added, or state gross domestic product (GDP)2, is
estimated at $259.4 billion with the agro‐forestry industrial complex contributing $11.8 billion
towards the state’s GDP. For every dollar of sales, the agro‐forestry industrial complex
contributed $0.27 to the state’s GDP, which is less than all of the sectors except manufacturing
(Table 7).
Economic Impacts at the State & In‐State Region Levels
Direct economic activity for total industry output (TIO), employment, labor income, and
total value‐added (TVA) for agriculture and forestry for the state and by analysis regions within
the state are presented in Table 8. In 2011, agriculture and forestry related industries
2 The state domestic product is measuring by summing employee compensation, proprietor income, other property type income, and indirect business taxes.
19
Figure 13. Total Industry Output by Sector, Tennessee, 2011
Figure 14. Employment by Sector, Tennessee, 2011
$0.0 $25.0 $50.0 $75.0 $100.0 $125.0 $150.0
Mining
Miscellaneous
Construction
Transportation, Information, & Utilities
Wholesale Trade
Retail Trade
Government
Agriculture & Forestry
Finance, Insurance, & Real Estate
Manufacturing
Services
Total Industry Output (Billion $)
0 200 400 600 800 1,000 1,200 1,400 1,600
Mining
Miscellaneous
Transportation, Information, & Utilities
Wholesale Trade
Construction
Agriculture & Forestry
Manufacturing
Finance, Insurance, & Real Estate
Retail Trade
Government
Services
Employment (1,000 jobs)
20
Table 7. Estimated Economic Indicators for Tennessee, 2011
Sector TIO1 TVA2 Jobs TVA/Job TVA/TIO
(Billion $) (1,000) Services $144.1 $91.0 1,447.5 $62,840 0.63 Manufacturing $106.7 $24.1 226.6 $106,164 0.23 Finance, Insurance, & Real Estate $73.4 $46.1 279.6 $165,007 0.63 Agro‐Forest Industry $43.6 $11.8 176.3 $67,031 0.27 Government $39.6 $30.0 511.3 $58,630 0.76 Retail Trade $26.8 $19.2 387.7 $49,420 0.71 Wholesale Trade $21.1 $15.1 125.1 $120,770 0.72 Transportation, Information, & Utilities $19.1 $9.2 104.9 $87,518 0.48 Construction $18.5 $9.6 175.0 $54,837 0.52 Miscellaneous $4.7 $2.6 76.2 $33,774 0.55 Mining $2.3 $0.9 7.7 $112,163 0.38
Total3 $499.9 $259.4 3,517.9 1Total Industry Output – annual value of production by industry. 2Total Value Added – income to workers paid by employers; self‐employed income; interest, rents, royalties, dividends, and profit payments; and excise and sales taxes paid by individuals to businesses. 3State totals may not add due to rounding.
Table 8. Direct Economic Activity in Agriculture and Forestry
Sector
TIO1
Employment
Labor Income
TVA2
(Million $) % (Number) % (Million $) % (Million $) %
All Sectors (Including Non‐Agricultural and Non‐Forestry):
State3 499,904 3,517,918 169,529 259,435 Chattanooga 53,176 10.6% 361,388 10.3% 16,955 10.0% 24,137 9.3% Knoxville 80,556 16.1% 615,484 17.5% 27,204 16.0% 42,864 16.5% Memphis 128,004 25.6% 892,748 25.4% 45,239 26.7% 69,802 26.9% Nashville 202,448 40.5% 1,402,688 39.9% 69,967 41.3%106,355 41.0% Tri‐Cities 35,721 7.1% 245,610 7.0% 10,164 6.0% 16,278 6.3% Agriculture & Forestry:
State3 43,609 176,282 5,693 11,817 Chattanooga 6,097 14.0% 22,366 12.7% 906 15.9% 1,463 12.4% Knoxville 5,842 13.4% 22,408 12.7% 842 14.8% 1,306 11.1% Memphis 15,275 35.0% 55,619 31.6% 1,993 35.0% 4,343 36.8% Nashville 14,251 32.7% 65,084 36.9% 1,661 29.2% 4,209 35.6% Tri‐Cities 2,143 4.9% 10,805 6.1% 291 5.1% 497 4.2% Primary & Secondary Agriculture
State3 31,061 136,815 3,210 8,017 Chattanooga 4,126 13.3% 15,819 11.6% 542 16.9% 876 10.9% Knoxville 4,204 13.5% 15,357 11.2% 426 13.3% 779 9.7% Memphis 9,800 31.6% 43,331 31.7% 968 30.2% 2,588 32.3% Nashville 11,601 37.3% 53,992 39.5% 1,128 35.1% 3,513 43.8%
21
Table 8. Direct Economic Activity in Agriculture and Forestry (Cont.)
Sector
TIO1
Employment
Labor Income
TVA2
(Million $) % (Number) % (Million $) % (Million $) %
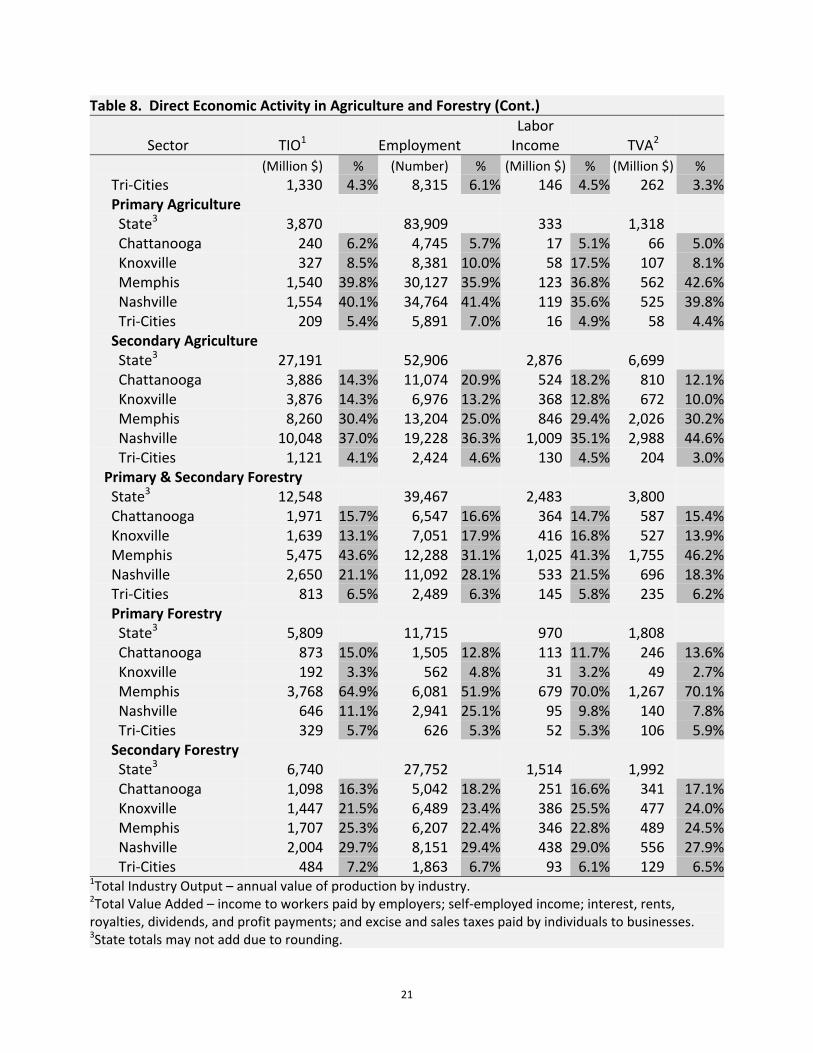
Tri‐Cities 1,330 4.3% 8,315 6.1% 146 4.5% 262 3.3% Primary Agriculture
State3 3,870 83,909 333 1,318 Chattanooga 240 6.2% 4,745 5.7% 17 5.1% 66 5.0% Knoxville 327 8.5% 8,381 10.0% 58 17.5% 107 8.1% Memphis 1,540 39.8% 30,127 35.9% 123 36.8% 562 42.6% Nashville 1,554 40.1% 34,764 41.4% 119 35.6% 525 39.8% Tri‐Cities 209 5.4% 5,891 7.0% 16 4.9% 58 4.4% Secondary Agriculture
State3 27,191 52,906 2,876 6,699 Chattanooga 3,886 14.3% 11,074 20.9% 524 18.2% 810 12.1% Knoxville 3,876 14.3% 6,976 13.2% 368 12.8% 672 10.0% Memphis 8,260 30.4% 13,204 25.0% 846 29.4% 2,026 30.2% Nashville 10,048 37.0% 19,228 36.3% 1,009 35.1% 2,988 44.6% Tri‐Cities 1,121 4.1% 2,424 4.6% 130 4.5% 204 3.0% Primary & Secondary Forestry
State3 12,548 39,467 2,483 3,800 Chattanooga 1,971 15.7% 6,547 16.6% 364 14.7% 587 15.4% Knoxville 1,639 13.1% 7,051 17.9% 416 16.8% 527 13.9% Memphis 5,475 43.6% 12,288 31.1% 1,025 41.3% 1,755 46.2% Nashville 2,650 21.1% 11,092 28.1% 533 21.5% 696 18.3% Tri‐Cities 813 6.5% 2,489 6.3% 145 5.8% 235 6.2% Primary Forestry
State3 5,809 11,715 970 1,808 Chattanooga 873 15.0% 1,505 12.8% 113 11.7% 246 13.6% Knoxville 192 3.3% 562 4.8% 31 3.2% 49 2.7% Memphis 3,768 64.9% 6,081 51.9% 679 70.0% 1,267 70.1% Nashville 646 11.1% 2,941 25.1% 95 9.8% 140 7.8% Tri‐Cities 329 5.7% 626 5.3% 52 5.3% 106 5.9% Secondary Forestry
State3 6,740 27,752 1,514 1,992 Chattanooga 1,098 16.3% 5,042 18.2% 251 16.6% 341 17.1% Knoxville 1,447 21.5% 6,489 23.4% 386 25.5% 477 24.0% Memphis 1,707 25.3% 6,207 22.4% 346 22.8% 489 24.5% Nashville 2,004 29.7% 8,151 29.4% 438 29.0% 556 27.9% Tri‐Cities 484 7.2% 1,863 6.7% 93 6.1% 129 6.5%1Total Industry Output – annual value of production by industry. 2Total Value Added – income to workers paid by employers; self‐employed income; interest, rents, royalties, dividends, and profit payments; and excise and sales taxes paid by individuals to businesses. 3State totals may not add due to rounding.

22
Relatively Stagnant Agriculture and Forestry Growth
Growth in direct agriculture and forestry as a percentage of Tennessee’s total economy has remained relatively stagnant for the years depicted. For both agricultre and forestry, the largest growth as a percentage of the state’s total economy occurred in 2003. For 2009 and 2011, growth in the agro‐forestry industry has been relatively stagnant.
Figure 15. Growth in Direct Agriculture and Forestry as a Percentage of
Tennessee’s Total Economy.
contributed a total of $43.6 billion in direct economic activity to the state of Tennessee, or 8.7
percent of the state’s economy. Employment in agriculture and forestry related industries
were over 176 thousand persons, or 5.0 percent of the workforce. Total value added was $11.8
billion, with $5.7 billion in labor income. Much of the industry output generated from
agriculture and forestry was through secondary or manufactured products. For agriculture,
approximately 38.7 percent of the workforce was employed in secondary industries (agriculture
input supplying industries plus manufacturing) and the rest (61.3 percent) in primary industries
(crop and livestock commodities). For forestry, however, 70.3 percent of the forestry
workforce was employed in secondary industries (wood products manufacturing) and 29.7
23
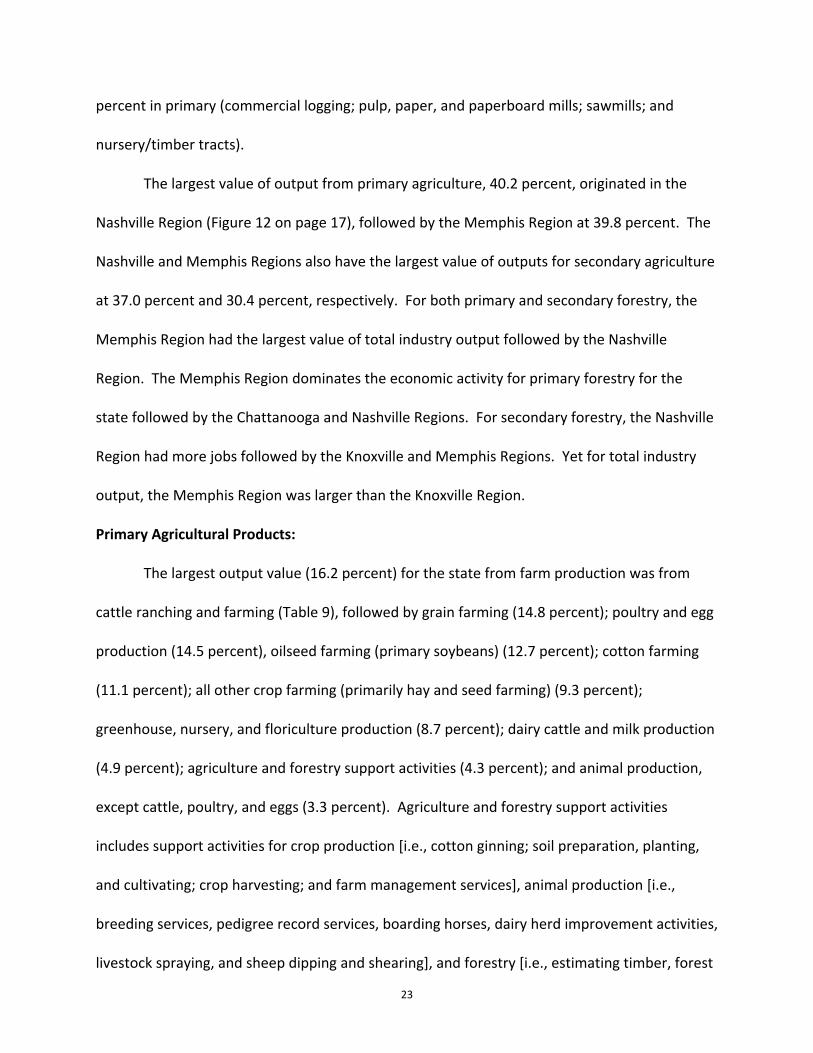
percent in primary (commercial logging; pulp, paper, and paperboard mills; sawmills; and
nursery/timber tracts).
The largest value of output from primary agriculture, 40.2 percent, originated in the
Nashville Region (Figure 12 on page 17), followed by the Memphis Region at 39.8 percent. The
Nashville and Memphis Regions also have the largest value of outputs for secondary agriculture
at 37.0 percent and 30.4 percent, respectively. For both primary and secondary forestry, the
Memphis Region had the largest value of total industry output followed by the Nashville
Region. The Memphis Region dominates the economic activity for primary forestry for the
state followed by the Chattanooga and Nashville Regions. For secondary forestry, the Nashville
Region had more jobs followed by the Knoxville and Memphis Regions. Yet for total industry
output, the Memphis Region was larger than the Knoxville Region.
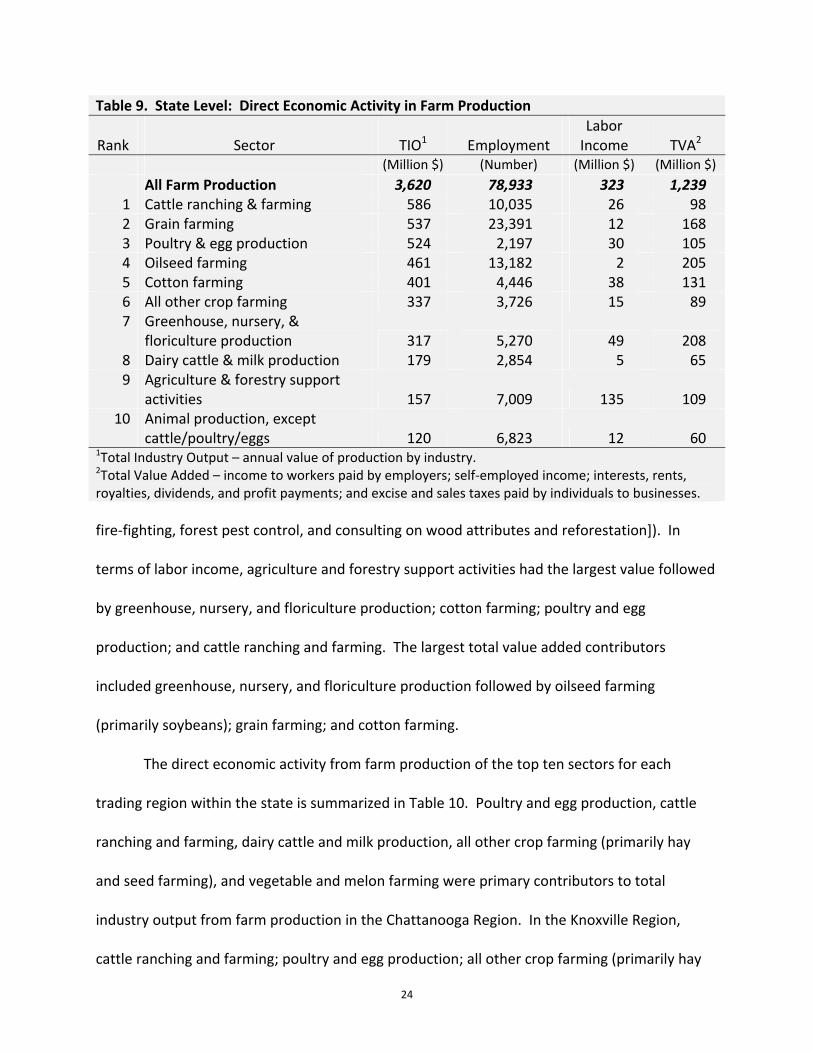
Primary Agricultural Products: The largest output value (16.2 percent) for the state from farm production was from
cattle ranching and farming (Table 9), followed by grain farming (14.8 percent); poultry and egg
production (14.5 percent), oilseed farming (primary soybeans) (12.7 percent); cotton farming
(11.1 percent); all other crop farming (primarily hay and seed farming) (9.3 percent);
greenhouse, nursery, and floriculture production (8.7 percent); dairy cattle and milk production
(4.9 percent); agriculture and forestry support activities (4.3 percent); and animal production,
except cattle, poultry, and eggs (3.3 percent). Agriculture and forestry support activities
includes support activities for crop production [i.e., cotton ginning; soil preparation, planting,
and cultivating; crop harvesting; and farm management services], animal production [i.e.,
breeding services, pedigree record services, boarding horses, dairy herd improvement activities,
livestock spraying, and sheep dipping and shearing], and forestry [i.e., estimating timber, forest
24
Table 9. State Level: Direct Economic Activity in Farm Production
Rank
Sector
TIO1
Employment
Labor Income
TVA2
(Million $) (Number) (Million $) (Million $)
All Farm Production 3,620 78,933 323 1,239 1 Cattle ranching & farming 586 10,035 26 98 2 Grain farming 537 23,391 12 168 3 Poultry & egg production 524 2,197 30 105 4 Oilseed farming 461 13,182 2 205 5 Cotton farming 401 4,446 38 131 6 All other crop farming 337 3,726 15 89 7 Greenhouse, nursery, &
floriculture production 317 5,270 49 208 8 Dairy cattle & milk production 179 2,854 5 65 9 Agriculture & forestry support
activities 157 7,009 135 109 10 Animal production, except
cattle/poultry/eggs 120 6,823 12 60 1Total Industry Output – annual value of production by industry. 2Total Value Added – income to workers paid by employers; self‐employed income; interests, rents, royalties, dividends, and profit payments; and excise and sales taxes paid by individuals to businesses.
fire‐fighting, forest pest control, and consulting on wood attributes and reforestation]). In
terms of labor income, agriculture and forestry support activities had the largest value followed
by greenhouse, nursery, and floriculture production; cotton farming; poultry and egg
production; and cattle ranching and farming. The largest total value added contributors
included greenhouse, nursery, and floriculture production followed by oilseed farming
(primarily soybeans); grain farming; and cotton farming.
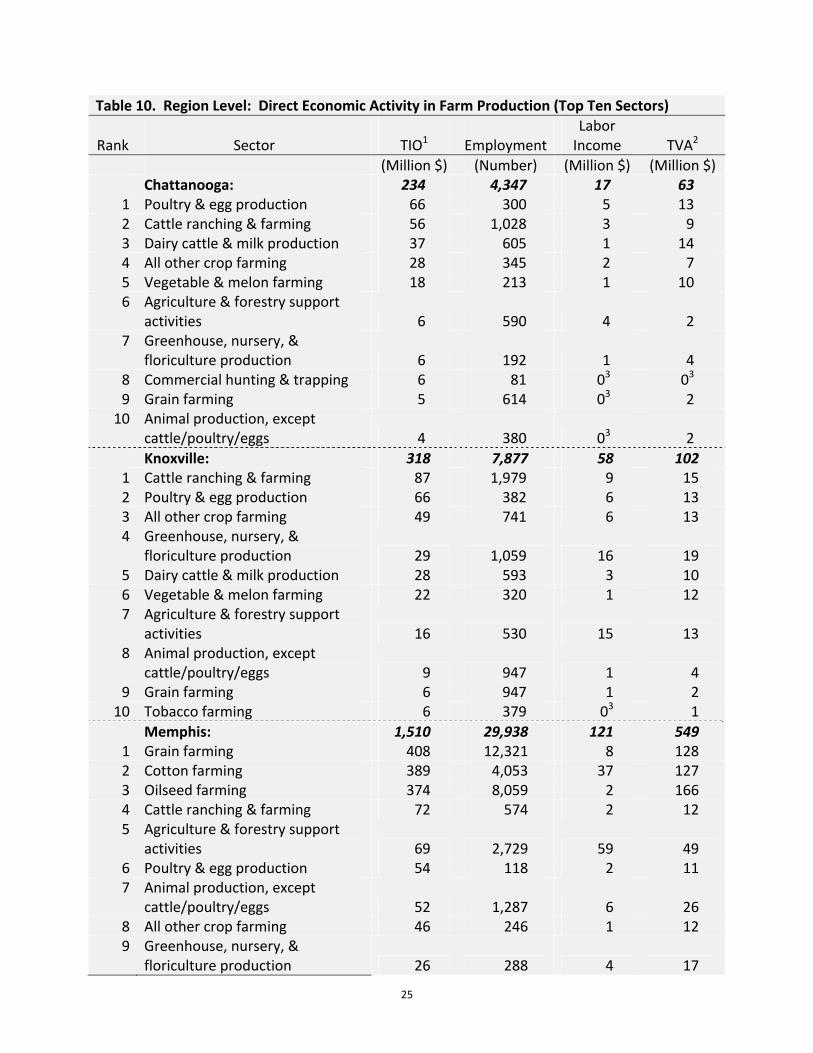
The direct economic activity from farm production of the top ten sectors for each
trading region within the state is summarized in Table 10. Poultry and egg production, cattle
ranching and farming, dairy cattle and milk production, all other crop farming (primarily hay
and seed farming), and vegetable and melon farming were primary contributors to total
industry output from farm production in the Chattanooga Region. In the Knoxville Region,
cattle ranching and farming; poultry and egg production; all other crop farming (primarily hay
25
Table 10. Region Level: Direct Economic Activity in Farm Production (Top Ten Sectors)
Rank
Sector
TIO1
Employment
Labor Income
TVA2
(Million $) (Number) (Million $) (Million $) Chattanooga: 234 4,347 17 63
1 Poultry & egg production 66 300 5 13 2 Cattle ranching & farming 56 1,028 3 9 3 Dairy cattle & milk production 37 605 1 14 4 All other crop farming 28 345 2 7 5 Vegetable & melon farming 18 213 1 10 6 Agriculture & forestry support
activities 6 590 4 2 7 Greenhouse, nursery, &
floriculture production 6 192 1 4 8 Commercial hunting & trapping 6 81 03 03 9 Grain farming 5 614 03 2
10 Animal production, except cattle/poultry/eggs 4 380 03 2
Knoxville: 318 7,877 58 102 1 Cattle ranching & farming 87 1,979 9 15 2 Poultry & egg production 66 382 6 13 3 All other crop farming 49 741 6 13 4 Greenhouse, nursery, &
floriculture production 29 1,059 16 19 5 Dairy cattle & milk production 28 593 3 10 6 Vegetable & melon farming 22 320 1 12 7 Agriculture & forestry support
activities 16 530 15 13 8 Animal production, except
cattle/poultry/eggs 9 947 1 4 9 Grain farming 6 947 1 2
10 Tobacco farming 6 379 03 1
Memphis: 1,510 29,938 121 549 1 Grain farming 408 12,321 8 128 2 Cotton farming 389 4,053 37 127 3 Oilseed farming 374 8,059 2 166 4 Cattle ranching & farming 72 574 2 12 5 Agriculture & forestry support
activities 69 2,729 59 49 6 Poultry & egg production 54 118 2 11 7 Animal production, except
cattle/poultry/eggs 52 1,287 6 26 8 All other crop farming 46 246 1 12 9 Greenhouse, nursery, &
floriculture production 26 288 4 17
26
Table 10. Region Level: Direct Economic Activity in Farm Production (Top Ten Sectors) (Cont.)
Rank
Sector
TIO1
Employment
Labor Income
TVA2
(Million $) (Number) (Million $) (Million $) 10 Commercial hunting & trapping 19 263 03 1
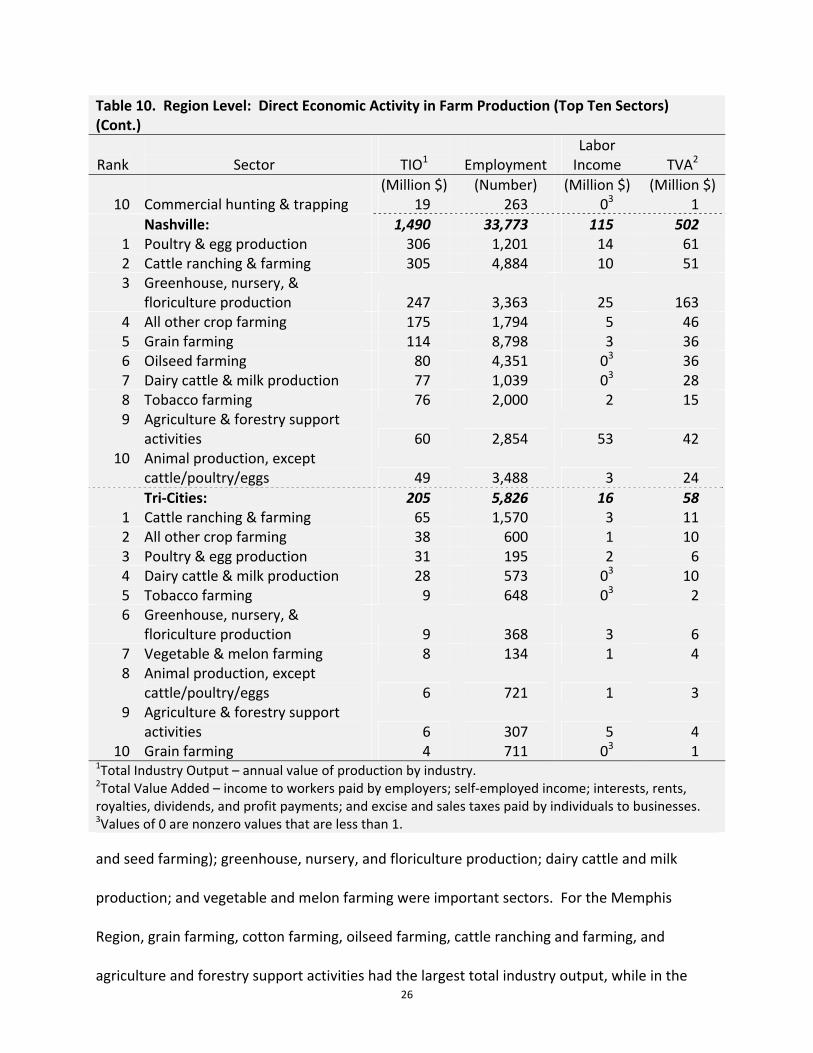
Nashville: 1,490 33,773 115 502 1 Poultry & egg production 306 1,201 14 61 2 Cattle ranching & farming 305 4,884 10 51 3 Greenhouse, nursery, &
floriculture production 247 3,363 25 163 4 All other crop farming 175 1,794 5 46 5 Grain farming 114 8,798 3 36 6 Oilseed farming 80 4,351 03 36 7 Dairy cattle & milk production 77 1,039 03 28 8 Tobacco farming 76 2,000 2 15 9 Agriculture & forestry support
activities 60 2,854 53 42 10 Animal production, except
cattle/poultry/eggs 49 3,488 3 24
Tri‐Cities: 205 5,826 16 58 1 Cattle ranching & farming 65 1,570 3 11 2 All other crop farming 38 600 1 10 3 Poultry & egg production 31 195 2 6 4 Dairy cattle & milk production 28 573 03 10 5 Tobacco farming 9 648 03 2 6 Greenhouse, nursery, &
floriculture production 9 368 3 6 7 Vegetable & melon farming 8 134 1 4 8 Animal production, except
cattle/poultry/eggs 6 721 1 3 9 Agriculture & forestry support
activities 6 307 5 4 10 Grain farming 4 711 03 1
1Total Industry Output – annual value of production by industry. 2Total Value Added – income to workers paid by employers; self‐employed income; interests, rents, royalties, dividends, and profit payments; and excise and sales taxes paid by individuals to businesses. 3Values of 0 are nonzero values that are less than 1.
and seed farming); greenhouse, nursery, and floriculture production; dairy cattle and milk
production; and vegetable and melon farming were important sectors. For the Memphis
Region, grain farming, cotton farming, oilseed farming, cattle ranching and farming, and
agriculture and forestry support activities had the largest total industry output, while in the

27
Nashville Region the greatest total industry output values were from poultry and egg
production; cattle ranching and farming; greenhouse, nursery, and floriculture production; all
other crop farming (primarily hay and seed farming); and grain farming. Cattle ranching and
farming; all other crop farming (primarily hay and seed farming); poultry and egg production;
dairy cattle and milk production; tobacco farming; and greenhouse, nursery, and floriculture
production were important contributors to total industry output for the Tri‐Cities Region. For
all regions except Memphis and Nashville, cattle ranching and farming employed the largest
number of workers. For the Memphis Region, cotton farming employed the largest numbers,
followed by oilseed and cotton farming. For Nashville, grain farming employed the largest
numbers, followed by cattle ranching and farming and oilseed farming.
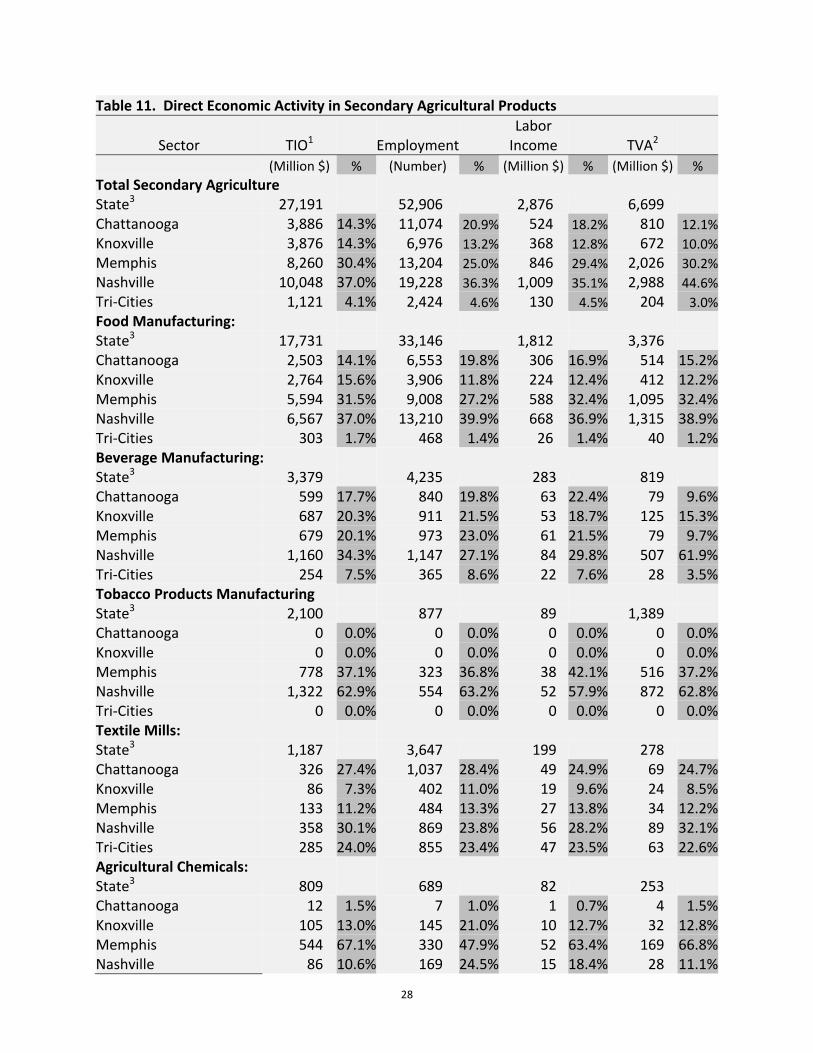
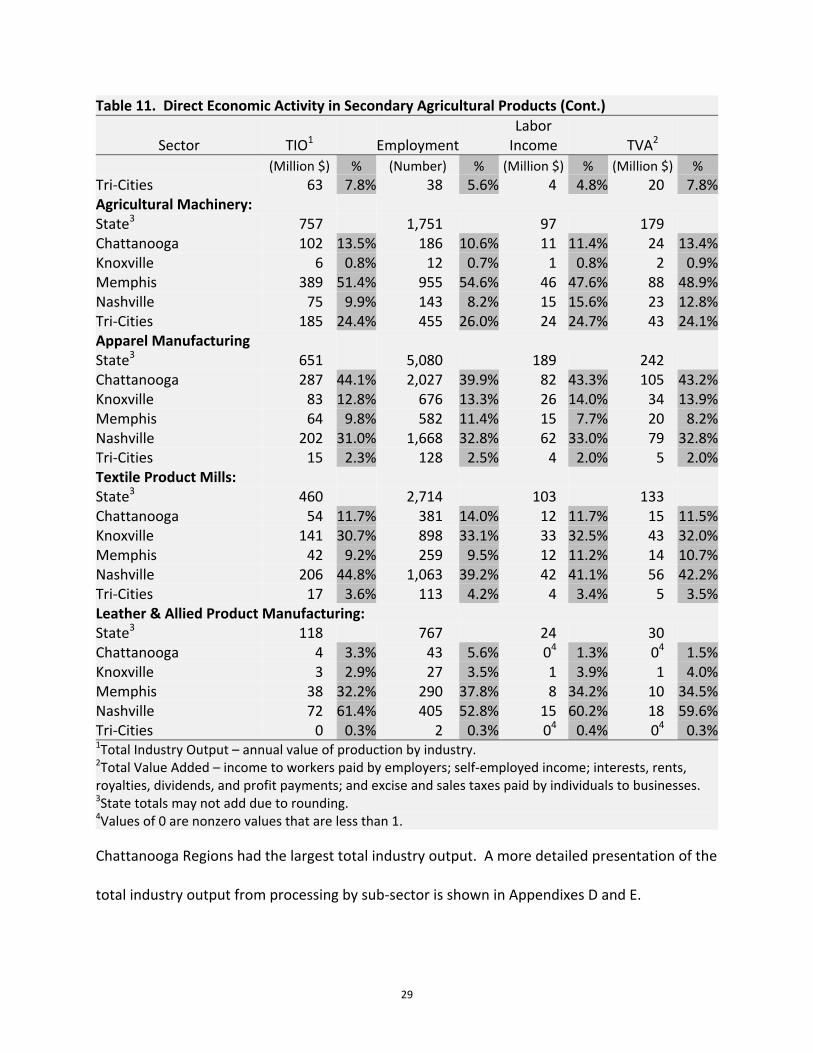
Secondary Agricultural Products:
Among secondary agricultural products, food manufacturing contributed the largest
total industry output, followed by beverage manufacturing, tobacco products manufacturing,
textile mills, agricultural chemicals, agricultural machinery, apparel manufacturing, textile
product mills, and leather and allied product manufacturing (Table 11). Approximately 65.2
percent of the value of total industry output from processed agricultural products came from
food manufacturing. In addition, food manufacturing employed the largest number of workers,
had the largest amount of labor income, and contributed the largest amount in total value
added. Both Nashville and Memphis Regions had the largest economic activity in food
manufacturing. The Nashville Region had the largest total industry output for beverage
manufacturing, tobacco products manufacturing, textile mills, textile product mills, and leather
and allied product manufacturing. The Memphis Region had the largest total industry output
for agricultural chemicals and agricultural machinery. For apparel manufacturing, the
28
Table 11. Direct Economic Activity in Secondary Agricultural Products
Sector
TIO1
Employment
Labor Income
TVA2
(Million $) % (Number) % (Million $) % (Million $) %
Total Secondary Agriculture State3 27,191 52,906 2,876 6,699 Chattanooga 3,886 14.3% 11,074 20.9% 524 18.2% 810 12.1%
Knoxville 3,876 14.3% 6,976 13.2% 368 12.8% 672 10.0%
Memphis 8,260 30.4% 13,204 25.0% 846 29.4% 2,026 30.2%
Nashville 10,048 37.0% 19,228 36.3% 1,009 35.1% 2,988 44.6%
Tri‐Cities 1,121 4.1% 2,424 4.6% 130 4.5% 204 3.0%
Food Manufacturing: State3 17,731 33,146 1,812 3,376 Chattanooga 2,503 14.1% 6,553 19.8% 306 16.9% 514 15.2%Knoxville 2,764 15.6% 3,906 11.8% 224 12.4% 412 12.2%Memphis 5,594 31.5% 9,008 27.2% 588 32.4% 1,095 32.4%Nashville 6,567 37.0% 13,210 39.9% 668 36.9% 1,315 38.9%Tri‐Cities 303 1.7% 468 1.4% 26 1.4% 40 1.2%Beverage Manufacturing: State3 3,379 4,235 283 819 Chattanooga 599 17.7% 840 19.8% 63 22.4% 79 9.6%Knoxville 687 20.3% 911 21.5% 53 18.7% 125 15.3%Memphis 679 20.1% 973 23.0% 61 21.5% 79 9.7%Nashville 1,160 34.3% 1,147 27.1% 84 29.8% 507 61.9%Tri‐Cities 254 7.5% 365 8.6% 22 7.6% 28 3.5%Tobacco Products Manufacturing State3 2,100 877 89 1,389 Chattanooga 0 0.0% 0 0.0% 0 0.0% 0 0.0%Knoxville 0 0.0% 0 0.0% 0 0.0% 0 0.0%Memphis 778 37.1% 323 36.8% 38 42.1% 516 37.2%Nashville 1,322 62.9% 554 63.2% 52 57.9% 872 62.8%Tri‐Cities 0 0.0% 0 0.0% 0 0.0% 0 0.0%Textile Mills: State3 1,187 3,647 199 278 Chattanooga 326 27.4% 1,037 28.4% 49 24.9% 69 24.7%Knoxville 86 7.3% 402 11.0% 19 9.6% 24 8.5%Memphis 133 11.2% 484 13.3% 27 13.8% 34 12.2%Nashville 358 30.1% 869 23.8% 56 28.2% 89 32.1%Tri‐Cities 285 24.0% 855 23.4% 47 23.5% 63 22.6%Agricultural Chemicals: State3 809 689 82 253 Chattanooga 12 1.5% 7 1.0% 1 0.7% 4 1.5%Knoxville 105 13.0% 145 21.0% 10 12.7% 32 12.8%Memphis 544 67.1% 330 47.9% 52 63.4% 169 66.8%Nashville 86 10.6% 169 24.5% 15 18.4% 28 11.1%
29
Table 11. Direct Economic Activity in Secondary Agricultural Products (Cont.)
Sector
TIO1
Employment
Labor Income
TVA2
(Million $) % (Number) % (Million $) % (Million $) %
Tri‐Cities 63 7.8% 38 5.6% 4 4.8% 20 7.8%Agricultural Machinery: State3 757 1,751 97 179 Chattanooga 102 13.5% 186 10.6% 11 11.4% 24 13.4%Knoxville 6 0.8% 12 0.7% 1 0.8% 2 0.9%Memphis 389 51.4% 955 54.6% 46 47.6% 88 48.9%Nashville 75 9.9% 143 8.2% 15 15.6% 23 12.8%Tri‐Cities 185 24.4% 455 26.0% 24 24.7% 43 24.1%Apparel Manufacturing State3 651 5,080 189 242 Chattanooga 287 44.1% 2,027 39.9% 82 43.3% 105 43.2%Knoxville 83 12.8% 676 13.3% 26 14.0% 34 13.9%Memphis 64 9.8% 582 11.4% 15 7.7% 20 8.2%Nashville 202 31.0% 1,668 32.8% 62 33.0% 79 32.8%Tri‐Cities 15 2.3% 128 2.5% 4 2.0% 5 2.0%Textile Product Mills: State3 460 2,714 103 133 Chattanooga 54 11.7% 381 14.0% 12 11.7% 15 11.5%Knoxville 141 30.7% 898 33.1% 33 32.5% 43 32.0%Memphis 42 9.2% 259 9.5% 12 11.2% 14 10.7%Nashville 206 44.8% 1,063 39.2% 42 41.1% 56 42.2%Tri‐Cities 17 3.6% 113 4.2% 4 3.4% 5 3.5%Leather & Allied Product Manufacturing: State3 118 767 24 30 Chattanooga 4 3.3% 43 5.6% 04 1.3% 04 1.5%Knoxville 3 2.9% 27 3.5% 1 3.9% 1 4.0%Memphis 38 32.2% 290 37.8% 8 34.2% 10 34.5%Nashville 72 61.4% 405 52.8% 15 60.2% 18 59.6%Tri‐Cities 0 0.3% 2 0.3% 04 0.4% 04 0.3%1Total Industry Output – annual value of production by industry. 2Total Value Added – income to workers paid by employers; self‐employed income; interests, rents, royalties, dividends, and profit payments; and excise and sales taxes paid by individuals to businesses. 3State totals may not add due to rounding. 4Values of 0 are nonzero values that are less than 1.
Chattanooga Regions had the largest total industry output. A more detailed presentation of the
total industry output from processing by sub‐sector is shown in Appendixes D and E.

30
Primary Forest Products: The largest output value for primary forest products was from paper mills, followed by
paperboard mills; sawmills and wood preservation; pulp mills; commercial logging; and
forestry, forest products, and timber tract production (i.e., growing trees for reforestation;
gathering forest products, such as gums, barks, balsam needles, rhizomes, fibers, and ginseng;
and timber tracts for selling timber) (Table 12). The Memphis Region had the largest output
value for paper mills at $2.8 billion or 72.5 percent of the output value for the state. Paper
mills employed the largest number individuals again with the Memphis Region employing the
largest number. The Memphis Region also had the largest output value for paperboard mills
and commercial logging. The Nashville Region had the largest output value for sawmills and
wood preservation and forestry, forest products, and timber track production. For pulp mills,
59.4 percent of the economic activity originates from the Chattanooga Region.
Table 12. Direct Economic Activity in Primary Forest Products
Sector
TIO1
Employment
Labor Income
TVA2
(Million $) % (Number) % (Million $) % (Million $) %
Total Primary Forest Products State3 5,809 11,715 970 1,808
Chattanooga 873 15.0% 1,505 12.8% 113 11.7% 246 13.6%
Knoxville 192 3.3% 562 4.8% 31 3.2% 49 2.7%
Memphis 3,768 64.9% 6,081 51.9% 679 70.0% 1,267 70.1%
Nashville 646 11.1% 2,941 25.1% 95 9.8% 140 7.8%
Tri‐Cities 329 5.7% 626 5.3% 52 5.3% 106 5.9%
Paper Mills: State3 3,876 4,487 671 1,388Chattanooga 528 13.6% 648 14.4% 65 9.7% 168 12.1%Knoxville 49 1.3% 55 1.2% 9 1.4% 18 1.3%Memphis 2,810 72.5% 3,190 71.1% 532 79.3% 1,041 75.1%Nashville 205 5.3% 258 5.8% 21 3.1% 62 4.5%Tri‐Cities 284 7.3% 335 7.5% 44 6.6% 98 7.1%Paperboard Mills: State3 788 968 101 196 Chattanooga 143 18.1% 169 17.4% 23 22.5% 39 20.1%

31
Table 12. Direct Economic Activity in Primary Forest Products (Cont.)
Sector
TIO1
Employment
Labor Income
TVA2
(Million $) % (Number) % (Million $) % (Million $) %
Knoxville 65 8.3% 82 8.4% 7 7.1% 15 7.7%Memphis 581 73.7% 718 74.1% 71 70.4% 141 72.2%Nashville 0 0.0% 0 0.0% 0 0.0% 0 0.0%Tri‐Cities 0 0.0% 0 0.0% 0 0.0% 0 0.0%Sawmills & Wood Preservation: State3 741 3,148 102 117 Chattanooga 51 6.9% 222 7.0% 6 6.2% 7 6.3%Knoxville 67 9.1% 281 8.9% 10 10.1% 12 9.9%Memphis 212 28.6% 898 28.5% 30 29.1% 34 29.0%Nashville 372 50.2% 1,584 50.3% 50 49.4% 58 49.6%Tri‐Cities 38 5.2% 163 5.2% 5 5.2% 6 5.2%Pulp Mills: State3 229 310 34 54 Chattanooga 136 59.4% 194 62.5% 14 41.9% 27 49.5%Knoxville 0 0.0% 0 0.0% 0 0.0% 0 0.0%Memphis 93 40.6% 117 37.5% 20 58.1% 27 50.5%Nashville 0 0.0% 0 0.0% 0 0.0% 0 0.0%Tri‐Cities 0 0.0% 0 0.0% 0 0.0% 0 0.0%Commercial Logging: State3 162 2,745 60 50 Chattanooga 15 9.2% 269 9.8% 5 8.1% 4 7.8%Knoxville 9 5.4% 139 5.1% 4 5.9% 3 6.0%Memphis 68 42.3% 1,141 41.6% 26 43.5% 22 43.9%Nashville 63 39.0% 1,069 38.9% 23 39.0% 20 39.0%Tri‐Cities 7 4.2% 126 4.6% 2 3.5% 2 3.3%Forestry, Forest Products, & Timber Tract Production: State3 13 57 1 3 Chattanooga 1 4.2% 3 4.8% 04 2.5% 04 1.8%Knoxville 2 17.2% 5 8.1% 04 43.7% 1 52.6%Memphis 4 30.2% 19 32.7% 04 22.0% 1 20.2%Nashville 6 45.2% 29 51.8% 04 27.6% 1 19.3%Tri‐Cities 04 3.3% 1 2.5% 04 4.2% 04 6.1%1Total Industry Output – annual value of production by industry. 2Total Value Added – income to workers paid by employers; self‐employed income; interests, rents, royalties, dividends, and profit payments; and excise and sales taxes paid by individuals to businesses. 3State totals may not add due to rounding. 4Values of 0 are nonzero values that are less than 1.
32
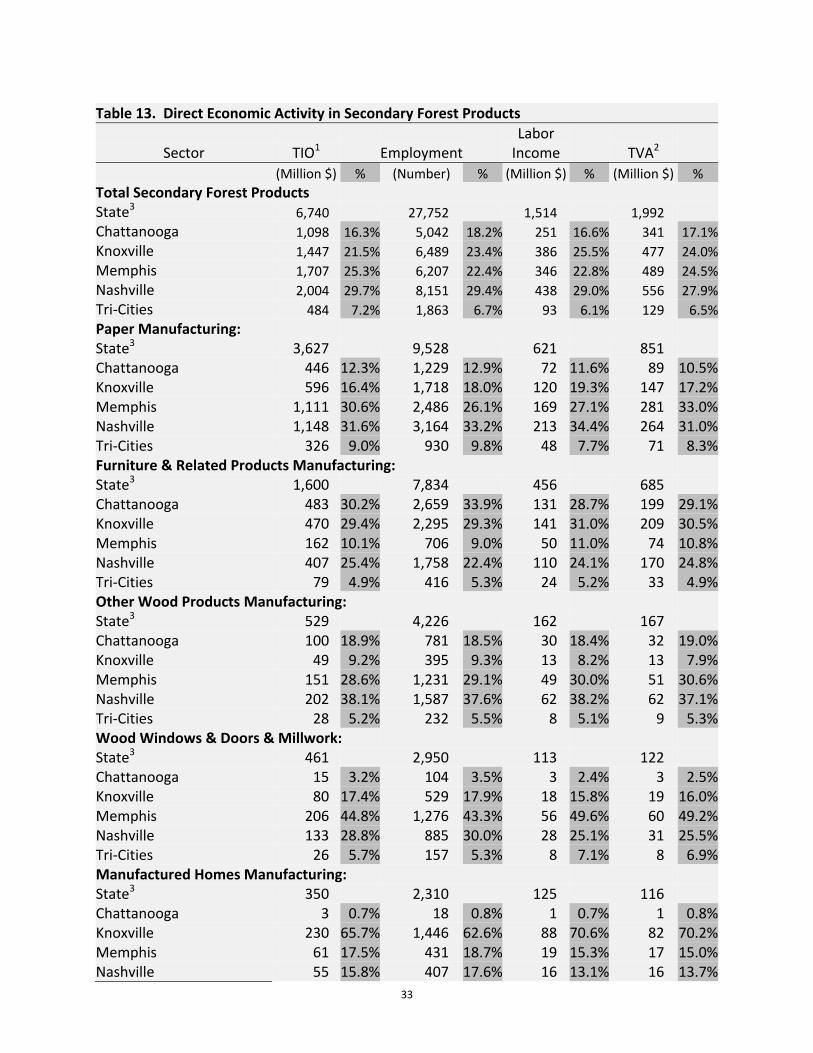
Secondary Forest Products: The largest output value for secondary forest products was produced by the paper
manufacturing sector, followed by furniture and related products manufacturing; wood
windows and doors and millwork; manufactured home manufacturing; other wood products
manufacturing; and veneer, plywood, and engineered wood product manufacturing (Table 13).
The paper manufacturing sector was comprised of paperboard containers, paper bags and
coated and treated paper, stationery products, and other converted paper products. Furniture
and related products manufacturing was comprised of household and institutional, office, and
other (mattress, blind and shades) furniture categories. The other wood products
manufacturing category was comprised of wood containers and pallets, miscellaneous wood
products, and kitchen cabinets. The Nashville Region had the largest values for output,
employment, and labor income for paper manufacturing. In addition the Nashville Region had
the largest output values for other wood products manufacturing and veneer, plywood, and
engineered wood products manufacturing. The Memphis Region had large output values for
paper manufacturing and millwork. The Knoxville Region had the largest output value for
manufactured home manufacturing and was second to the Chattanooga Region in output value
for furniture and related product manufacturing. The Chattanooga Region has the largest
output value for furniture and related product manufacturing and was second to the Nashville
Region for veneer, plywood, and engineered wood product manufacturing. Continuing with the
veneer, plywood, and engineered wood products manufacturing category, the Tri‐Cities Region
had the third largest output value, followed by the Knoxville and Memphis Regions.
33
Table 13. Direct Economic Activity in Secondary Forest Products
Sector
TIO1
Employment
Labor Income
TVA2
(Million $) % (Number) % (Million $) % (Million $) %
Total Secondary Forest Products State3 6,740 27,752 1,514 1,992
Chattanooga 1,098 16.3% 5,042 18.2% 251 16.6% 341 17.1%
Knoxville 1,447 21.5% 6,489 23.4% 386 25.5% 477 24.0%
Memphis 1,707 25.3% 6,207 22.4% 346 22.8% 489 24.5%
Nashville 2,004 29.7% 8,151 29.4% 438 29.0% 556 27.9%
Tri‐Cities 484 7.2% 1,863 6.7% 93 6.1% 129 6.5%
Paper Manufacturing: State3 3,627 9,528 621 851 Chattanooga 446 12.3% 1,229 12.9% 72 11.6% 89 10.5%Knoxville 596 16.4% 1,718 18.0% 120 19.3% 147 17.2%Memphis 1,111 30.6% 2,486 26.1% 169 27.1% 281 33.0%Nashville 1,148 31.6% 3,164 33.2% 213 34.4% 264 31.0%Tri‐Cities 326 9.0% 930 9.8% 48 7.7% 71 8.3%Furniture & Related Products Manufacturing: State3 1,600 7,834 456 685 Chattanooga 483 30.2% 2,659 33.9% 131 28.7% 199 29.1%Knoxville 470 29.4% 2,295 29.3% 141 31.0% 209 30.5%Memphis 162 10.1% 706 9.0% 50 11.0% 74 10.8%Nashville 407 25.4% 1,758 22.4% 110 24.1% 170 24.8%Tri‐Cities 79 4.9% 416 5.3% 24 5.2% 33 4.9%Other Wood Products Manufacturing: State3 529 4,226 162 167 Chattanooga 100 18.9% 781 18.5% 30 18.4% 32 19.0%Knoxville 49 9.2% 395 9.3% 13 8.2% 13 7.9%Memphis 151 28.6% 1,231 29.1% 49 30.0% 51 30.6%Nashville 202 38.1% 1,587 37.6% 62 38.2% 62 37.1%Tri‐Cities 28 5.2% 232 5.5% 8 5.1% 9 5.3%Wood Windows & Doors & Millwork: State3 461 2,950 113 122 Chattanooga 15 3.2% 104 3.5% 3 2.4% 3 2.5%Knoxville 80 17.4% 529 17.9% 18 15.8% 19 16.0%Memphis 206 44.8% 1,276 43.3% 56 49.6% 60 49.2%Nashville 133 28.8% 885 30.0% 28 25.1% 31 25.5%Tri‐Cities 26 5.7% 157 5.3% 8 7.1% 8 6.9%Manufactured Homes Manufacturing: State3 350 2,310 125 116 Chattanooga 3 0.7% 18 0.8% 1 0.7% 1 0.8%Knoxville 230 65.7% 1,446 62.6% 88 70.6% 82 70.2%Memphis 61 17.5% 431 18.7% 19 15.3% 17 15.0%Nashville 55 15.8% 407 17.6% 16 13.1% 16 13.7%

34
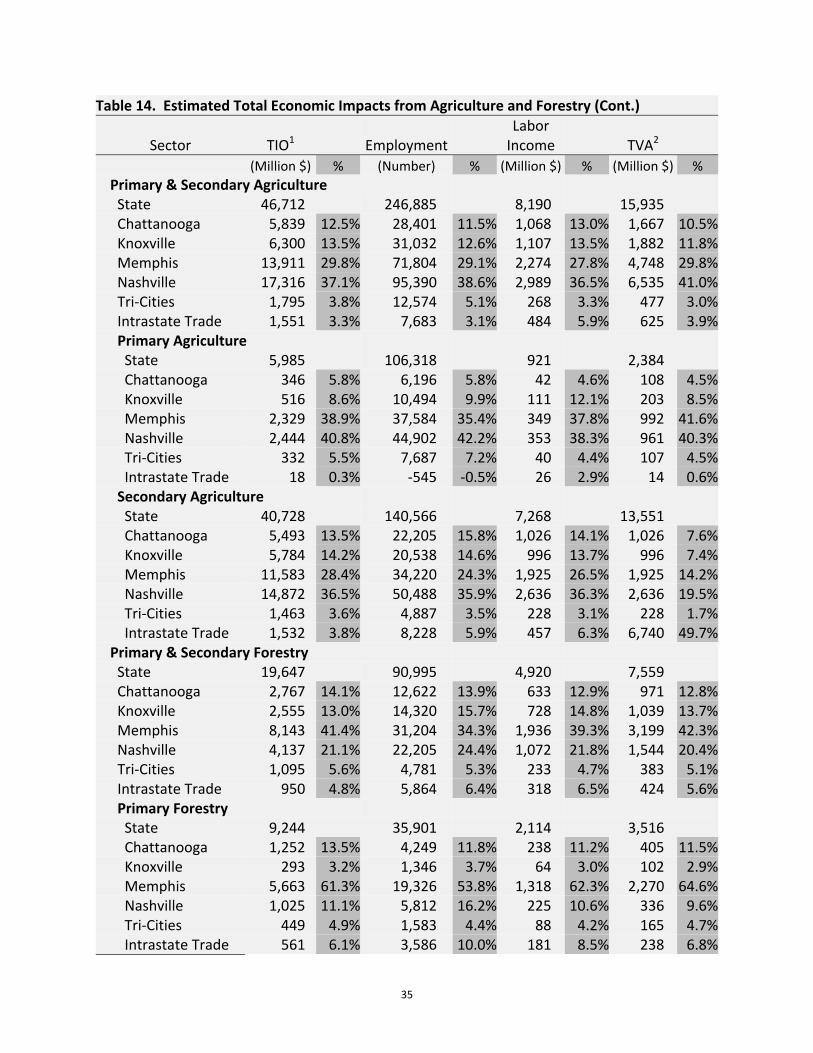
Estimated Total Economic Impacts of Agriculture and Forestry:
The estimated total economic impacts of agriculture and forestry included not only the
direct impacts from the industry, but also the impacts the industry had on input supplying
industries (indirect impacts) and on expenditures by households and other institutions (induced
impacts). The total economic impacts from agriculture and forestry included direct, indirect,
and induced impacts. Values for total industry output, employment, labor income, and value
added resulting from agriculture and forestry, including each of these impacts, are shown in
Table 14. Agriculture and forestry contributed an estimated value of over $66.4 billion to
Table 14. Estimated Total Economic Impacts from Agriculture and Forestry
Sector
TIO1
Employment
Labor Income
TVA2
(Million $) % (Number) % (Million $) % (Million $) %
Agriculture & Forestry: State 66,359 337,880 13,110 23,494 Chattanooga 8,606 13.0% 41,023 12.1% 1,701 13.0% 2,638 11.2% Knoxville 8,855 13.3% 45,352 13.4% 1,835 14.0% 2,921 12.4% Memphis 22,054 33.2% 103,008 30.5% 4,209 32.1% 7,947 33.8% Nashville 21,454 32.3% 117,595 34.8% 4,061 31.0% 8,079 34.4% Tri‐Cities 2,890 4.4% 17,355 5.1% 501 3.8% 860 3.7% Intrastate Trade 2,501 3.8% 13,547 4.0% 802 6.1% 1,050 4.5%
Table 13. Direct Economic Activity in Secondary Forest Products (Cont.)
Sector
TIO1
Employment
Labor Income
TVA2
(Million $) % (Number) % (Million $) % (Million $) %
Tri‐Cities 1 0.3% 7 0.3% 04 0.3% 04 0.3%Veneer, Plywood, & Engineered Wood Products Manufacturing: State3 172 903 37 50 Chattanooga 51 29.8% 250 27.7% 15 41.0% 17 34.1%Knoxville 22 12.7% 106 11.8% 5 14.3% 7 14.9%Memphis 15 8.7% 76 8.4% 3 8.4% 5 9.3%Nashville 60 34.9% 350 38.7% 8 22.2% 13 26.4%Tri‐Cities 24 13.9% 121 13.4% 5 14.0% 8 15.3%1Total Industry Output – annual value of production by industry. 2Total Value Added – income to workers paid by employers; self‐employed income; interests, rents, royalties, dividends, and profit payments; and excise and sales taxes paid by individuals to businesses. 3State totals may not add due to rounding. 4Values of 0 are nonzero values that are less than 1.
35
Table 14. Estimated Total Economic Impacts from Agriculture and Forestry (Cont.)
Sector
TIO1
Employment
Labor Income
TVA2
(Million $) % (Number) % (Million $) % (Million $) %
Primary & Secondary Agriculture State 46,712 246,885 8,190 15,935 Chattanooga 5,839 12.5% 28,401 11.5% 1,068 13.0% 1,667 10.5% Knoxville 6,300 13.5% 31,032 12.6% 1,107 13.5% 1,882 11.8% Memphis 13,911 29.8% 71,804 29.1% 2,274 27.8% 4,748 29.8% Nashville 17,316 37.1% 95,390 38.6% 2,989 36.5% 6,535 41.0% Tri‐Cities 1,795 3.8% 12,574 5.1% 268 3.3% 477 3.0% Intrastate Trade 1,551 3.3% 7,683 3.1% 484 5.9% 625 3.9% Primary Agriculture
State 5,985 106,318 921 2,384 Chattanooga 346 5.8% 6,196 5.8% 42 4.6% 108 4.5% Knoxville 516 8.6% 10,494 9.9% 111 12.1% 203 8.5% Memphis 2,329 38.9% 37,584 35.4% 349 37.8% 992 41.6% Nashville 2,444 40.8% 44,902 42.2% 353 38.3% 961 40.3% Tri‐Cities 332 5.5% 7,687 7.2% 40 4.4% 107 4.5% Intrastate Trade 18 0.3% ‐545 ‐0.5% 26 2.9% 14 0.6% Secondary Agriculture State 40,728 140,566 7,268 13,551 Chattanooga 5,493 13.5% 22,205 15.8% 1,026 14.1% 1,026 7.6% Knoxville 5,784 14.2% 20,538 14.6% 996 13.7% 996 7.4% Memphis 11,583 28.4% 34,220 24.3% 1,925 26.5% 1,925 14.2% Nashville 14,872 36.5% 50,488 35.9% 2,636 36.3% 2,636 19.5% Tri‐Cities 1,463 3.6% 4,887 3.5% 228 3.1% 228 1.7% Intrastate Trade 1,532 3.8% 8,228 5.9% 457 6.3% 6,740 49.7% Primary & Secondary Forestry State 19,647 90,995 4,920 7,559 Chattanooga 2,767 14.1% 12,622 13.9% 633 12.9% 971 12.8% Knoxville 2,555 13.0% 14,320 15.7% 728 14.8% 1,039 13.7% Memphis 8,143 41.4% 31,204 34.3% 1,936 39.3% 3,199 42.3% Nashville 4,137 21.1% 22,205 24.4% 1,072 21.8% 1,544 20.4% Tri‐Cities 1,095 5.6% 4,781 5.3% 233 4.7% 383 5.1% Intrastate Trade 950 4.8% 5,864 6.4% 318 6.5% 424 5.6% Primary Forestry State 9,244 35,901 2,114 3,516 Chattanooga 1,252 13.5% 4,249 11.8% 238 11.2% 405 11.5% Knoxville 293 3.2% 1,346 3.7% 64 3.0% 102 2.9% Memphis 5,663 61.3% 19,326 53.8% 1,318 62.3% 2,270 64.6% Nashville 1,025 11.1% 5,812 16.2% 225 10.6% 336 9.6% Tri‐Cities 449 4.9% 1,583 4.4% 88 4.2% 165 4.7% Intrastate Trade 561 6.1% 3,586 10.0% 181 8.5% 238 6.8%

36
Table 14. Estimated Total Economic Impacts from Agriculture and Forestry (Cont.)
Sector
TIO1
Employment
Labor Income
TVA2
(Million $) % (Number) % (Million $) % (Million $) %
Secondary Forestry State 10,403 55,094 2,807 4,044 Chattanooga 1,514 14.6% 8,373 15.2% 396 14.1% 566 14.0% Knoxville 2,262 21.7% 12,974 23.5% 664 23.6% 937 23.2% Memphis 2,480 23.8% 11,878 21.6% 618 22.0% 929 23.0% Nashville 3,112 29.9% 16,393 29.8% 847 30.2% 1,207 29.9% Tri‐Cities 646 6.2% 3,198 5.8% 144 5.1% 217 5.4% Intrastate Trade 389 3.7% 2,278 4.1% 138 4.9% 187 4.6%1Total Industry Output – annual value of production by industry. 2Total Value Added – income to workers paid by employers; self‐employed income; interests, rents, royalties, dividends, and profit payments; and excise and sales taxes paid by individuals to businesses.
Decrease in Agriculture and Forestry Growth
Growth in total agriculture and forestry, or with the multiplier effects, as a percentage of Tennessee’s total economy decreased for the years 2006, 2009, and 2011. For both agricultre and forestry, the largest growth as a percentage of the state’s total economy occurred in 2003. However, for 2006, 2009, and 2011, growth in the agro‐forestry industry has decreased.
Figure 16. Growth in Total Agriculture and Forestry as a Percentage of
Tennessee’s Total Economy.
37
Tennessee’s close to $500.0 billion economy in 2011. An estimated 70.4 percent of the total
economic impacts came from primary and secondary agriculture, while forest operations and
forest products contributed about 29.7 percent. Employment in both agriculture and forestry
totaled close to 338 thousand workers. Of that value, 73.1 percent were related with primary
and secondary agriculture production, with 26.9 percent from primary and secondary forest
products production. Intrastate trade represented values purchased or imported from outside
the regions but within the state. A more detailed total impact presentation of output,
employment, labor income, and value added by sub‐sector is shown in Appendix E.
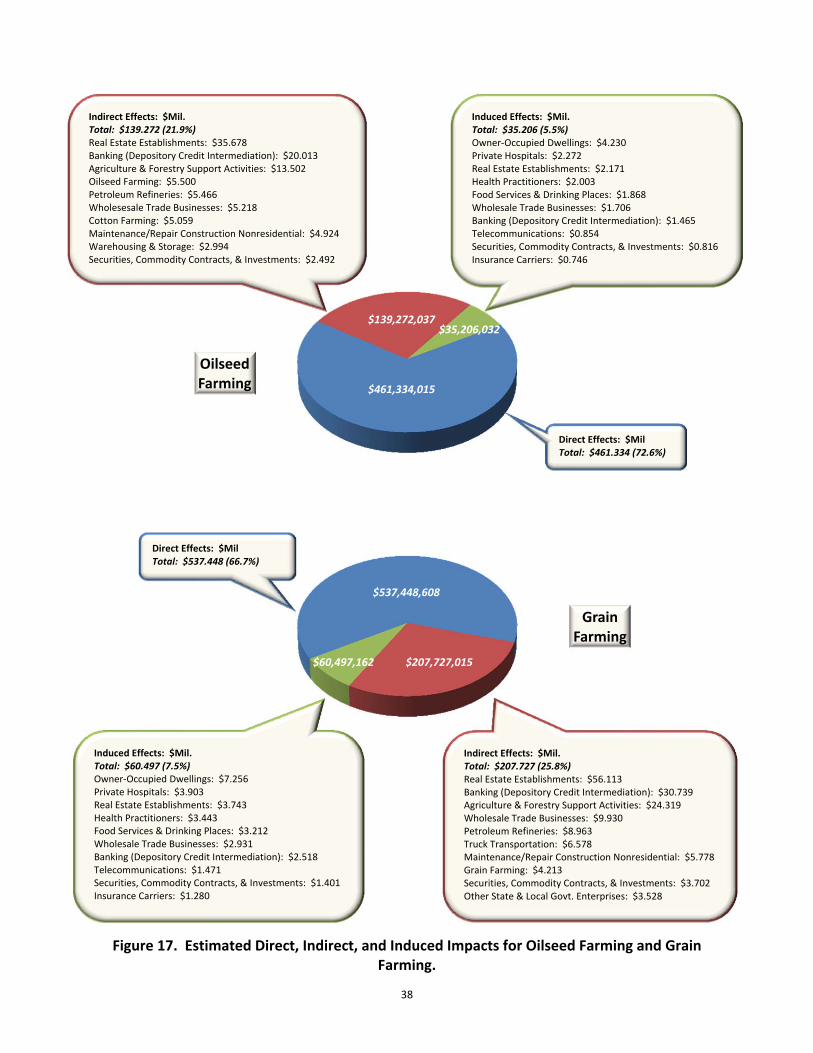
Primary Agriculture Products Total Impacts: Figures 17 through 22 show the estimated direct, indirect, and induced impacts for
oilseed farming; grain farming; vegetables and melon farming; greenhouse, nursery, and
floriculture production; tobacco farming; cotton farming; all other crops farming; cattle
ranching and farming; dairy cattle and milk production; poultry and egg production; and animal
production, except cattle, poultry, and eggs. The top ten indirect and induced sectors based on
output value are also listed. Using oilseed farming as an example, which has direct sales of
$461.3 million, the indirect economic impacts caused by input supplying industries are $139.3
million (21.9 percent) and the induced impacts (expenditures by households are $35.2 million
(5.5 percent). The top ten sectors most impacted from the indirect impact in descending order
included real estate establishments; banking (depository credit intermediation); agriculture and
forestry support activities; oilseed farming; petroleum refineries; wholesale trade businesses;
cotton farming; maintenance/repair construction nonresidential; warehousing and storage; and
securities, commodity contracts, and investments. Likewise, from household expenditures
(induced impacts) the sectors most impacted in descending order based on output value
38
Figure 17. Estimated Direct, Indirect, and Induced Impacts for Oilseed Farming and Grain Farming.
Oilseed Farming
Grain Farming
Direct Effects: $Mil Total: $461.334 (72.6%)
Indirect Effects: $Mil. Total: $139.272 (21.9%) Real Estate Establishments: $35.678 Banking (Depository Credit Intermediation): $20.013 Agriculture & Forestry Support Activities: $13.502 Oilseed Farming: $5.500 Petroleum Refineries: $5.466 Wholesesale Trade Businesses: $5.218 Cotton Farming: $5.059 Maintenance/Repair Construction Nonresidential: $4.924 Warehousing & Storage: $2.994 Securities, Commodity Contracts, & Investments: $2.492
Induced Effects: $Mil.Total: $35.206 (5.5%) Owner‐Occupied Dwellings: $4.230 Private Hospitals: $2.272 Real Estate Establishments: $2.171 Health Practitioners: $2.003 Food Services & Drinking Places: $1.868 Wholesale Trade Businesses: $1.706 Banking (Depository Credit Intermediation): $1.465 Telecommunications: $0.854 Securities, Commodity Contracts, & Investments: $0.816 Insurance Carriers: $0.746
Direct Effects: $Mil Total: $537.448 (66.7%)
Indirect Effects: $Mil.Total: $207.727 (25.8%) Real Estate Establishments: $56.113 Banking (Depository Credit Intermediation): $30.739 Agriculture & Forestry Support Activities: $24.319 Wholesale Trade Businesses: $9.930 Petroleum Refineries: $8.963 Truck Transportation: $6.578 Maintenance/Repair Construction Nonresidential: $5.778 Grain Farming: $4.213 Securities, Commodity Contracts, & Investments: $3.702 Other State & Local Govt. Enterprises: $3.528
Induced Effects: $Mil. Total: $60.497 (7.5%) Owner‐Occupied Dwellings: $7.256 Private Hospitals: $3.903 Real Estate Establishments: $3.743 Health Practitioners: $3.443 Food Services & Drinking Places: $3.212 Wholesale Trade Businesses: $2.931 Banking (Depository Credit Intermediation): $2.518 Telecommunications: $1.471 Securities, Commodity Contracts, & Investments: $1.401 Insurance Carriers: $1.280
$139,272,037
$461,334,015
$35,206,032
$537,448,608
$60,497,162 $207,727,015

39
Figure 18. Estimated Direct, Indirect, and Induced Impacts for Vegetable & Melon Farming and Greenhouse, Nursery, & Floriculture Production.
Vegetable & Melon Farming
Greenhouse, Nursery, & Floriculture Production
Indirect Effects: $Mil. Total: $26.321 (20.5%) Agriculture & Forestry Support Activities: $5.009 Real Estate Establishments: $4.313 Banking (Nondepository Credit Intermediation): $2.487 Wholesale Trade Businesses: $1.328 Petroleum Refineries: $0.948 Maintenance/Repair Construction Nonresidential: $0.873 Truck Transportation: $0.840 Federal Electric Utilities: $0.732 Wood Container & Pallet Manuf: $0.653 Other State & Local Govt. Enterprises: $0.513
Induced Effects: $Mil. Total: $13.002 (10.1%) Owner‐Occupied Dwellings: $1.536 Private Hospitals: $0.836 Real Estate Establishments: $0.826 Health Practitioners: $0.741 Food Services & Drinking Places: $0.692 Wholesale Trade Businesses: $0.630 Banking (Depository Credit Intermediation): $0.541 Telecommunications: $0.320 Securities, Commodity Contracts, & Investments: $0.298 Telecommunications: $0.320
Direct Effects: $Mil Total: $89.258 (69.4%)
Direct Effects: $Mil Total: $316.700 (76.1%)
Indirect Effects: $Mil.Total: $45.500 (10.9%) Greenhouse, Nursery, & Floriculture Production: $6.829 Agriculture & Forestry Support Activities: $6.062 Banking (Depository Credit Intermediation): $4.329 Petroleum Refineries: $3.887 Real Estate Establishments: $3.825 Wholesale Trade Businesses: $3.005 Maintenance/Repair Construction Nonresidential: $1.603 Truck Transportation: $1.278 Accounting, Tax, Bookkeeping, & Payroll Services: $0.862 Federal Electric Utilities: $0.826
Induced Effects: $Mil. Total: $54.003 (13.0%) Owner‐Occupied Dwellings: $6.260 Real Estate Establishments: $3.543 Private Hospitals: $3.462 Health Practitioners: $3.081 Food Services & Drinking Places: $2.888 Wholesale Trade Businesses: $2.619 Banking (Depository Credit Intermediation): $2.253 Telecommunications: $1.352 Securities, Commodity Contracts, & Investments: $1.221 Insurance Carriers: $1.101
$89,258,682
$13,002,452$26,321,780
$316,700,134
$54,003,003 $45,500,255

40
Figure 19. Estimated Direct, Indirect, and Induced Impacts for Tobacco Farming and Cotton Farming.
Tobacco Farming
Cotton Farming
Direct Effects: $Mil Total: $96.874 (62.3%)
Indirect Effects: $Mil. Total: $44.284 (28.5%) Real Estate Establishments: $9.494 Banking (Depository Credit Intermediation): $6.221 Agriculture & Forestry Support Activities: $4.748 Petroleum Refineries: $2.427 Warehousing & Storage: $1.890 Wholesale Trade Businesses: $1.562 Maintenance/Repair Construction Nonresidential: $1.492 Legal Services: $1.027 Securities, Commodity Contracts, & Investments: $1.007 Accounting, Tax, Bookkeeping, & Payroll Services: $0.909
Induced Effects: $Mil. Total: $14.376 (9.2%) Owner‐Occupied Dwellings: $1.721 Private Hospitals: $0.927 Real Estate Establishments: $0.892 Health Practitioners: $0.818 Food Services & Drinking Places: $0.763 Wholesale Trade Businesses: $0.696 Banking (Depository Credit Intermediation): $0.598 Telecommunications: $0.350 Securities, Commodity Contracts, & Investments: $0.332 Insurance Carriers: $0.303
Direct Effects: $Mil Total: $401.123 (63.8%)
Indirect Effects: $Mil. Total: $156.321 (24.8%) Real Estate Establishments: $27.102 Cotton Farming: $20.396 Agriculture & Forestry Support Activities: $19.584 Banking (Depository Credit Intermediation): $16.993 Maintenance/Repair Construction Nonresidential: $8.148 Petroleum Refineries: $6.955 Wholesale Trade Businesses: $5.688 Truck Transportation: $4.483 Other State & Local Govt. Enterprises: $3.199 Federal Electric Utilities: $2.660
k ( d d d ) $
Induced Effects: $Mil. Total: $71.715 (11.4%) Owner‐Occupied Dwellings: $8.537 Private Hospitals: $4.619 Real Estate Establishments: $4.498 Health Practitioners: $4.084 Food Services & Drinking Places: $3.814 Wholesale Trade Businesses: $3.476 Banking (Depository Credit Intermediation): $2.986 Telecommunications: $1.755 Securities, Commodity Contracts, & Investments: $1.652 Insurance Carriers: $1.505
$96,874,908
$44,284,218
$14,376,699
$401,122,955
$71,715,020 $156,321,528

41
Figure 20. Estimated Direct, Indirect, and Induced Impacts for All Other Crops Farming and Cattle Ranching & Farming.
All Other CropsFarming
Cattle Ranching&
Farming
Indirect Effects: $Mil. Total: $145.216 (27.2%) Real Estate Establishments: $23.710 Banking (Depository Credit Intermediation): $21.788 Agriculture & Forestry Support Activities: $20.214 Petroleum Refineries: $8.887 Wholesale Trade Businesses: $6.538 Truck Transportation: $5.956 Federal Electric Utilities: $3.955 Other State & Local Govt. Enterprises: $3.403 Securities, Commodity Contracts, & Investments: $2.939 Maintenance/Repair Construction Nonresidential: $2.814
Induced Effects: $Mil.Total: $51.354 (9.6%) Owner‐Occupied Dwellings: $6.119 Private Hospitals: $3.309 Real Estate Establishments: $3.215 Health Practitioners: $2.924 Food Services & Drinking Places: $2.730 Wholesale Trade Businesses: $2.489 Banking (Depository Credit Intermediation): $2.138 Telecommunications: $1.256 Securities, Commodity Contracts, & Investments: $1.184 Insurance Carriers: $1.079
Direct Effects: $Mil Total: $337.099 (63.2%)
Direct Effects: $Mil Total: $586.322(54.8%)
Indirect Effects: $Mil. Total: $412.690 (38.5%) Cattle Ranching & Farming: $171.440 All Other Crop Farming: $61.834 Banking (Depository Credit Intermediation): $36.603 Real Estate Establishments: $31.572 Truck Transportation: $12.611 Wholesale Trade Businesses: $12.548 Agriculture & Forestry Support Activities: $9.928 Petroleum Refineries: $9.553 Securities, Commodity Contracts, & Investments: $6.657 Other Animal Food Manufacturing: $6.041
Induced Effects: $Mil. Total: $71,714 (6.7%) Owner‐Occupied Dwellings: $8.527 Private Hospitals: $4.620 Real Estate Establishments: $4.507 Health Practitioners: $4.085 Food Services & Drinking Places: $3.814 Wholesale Trade Businesses: $3.476 Banking (Depository Credit Intermediation): $2.987 Telecommunications: $1.757 Securities, Commodity Contracts, & Investments: $1.651 Insurance Carriers: $1.503
$337,099,579
$145,216,767$51,354,753
$586,322,998
$71,714,010$412,690,157
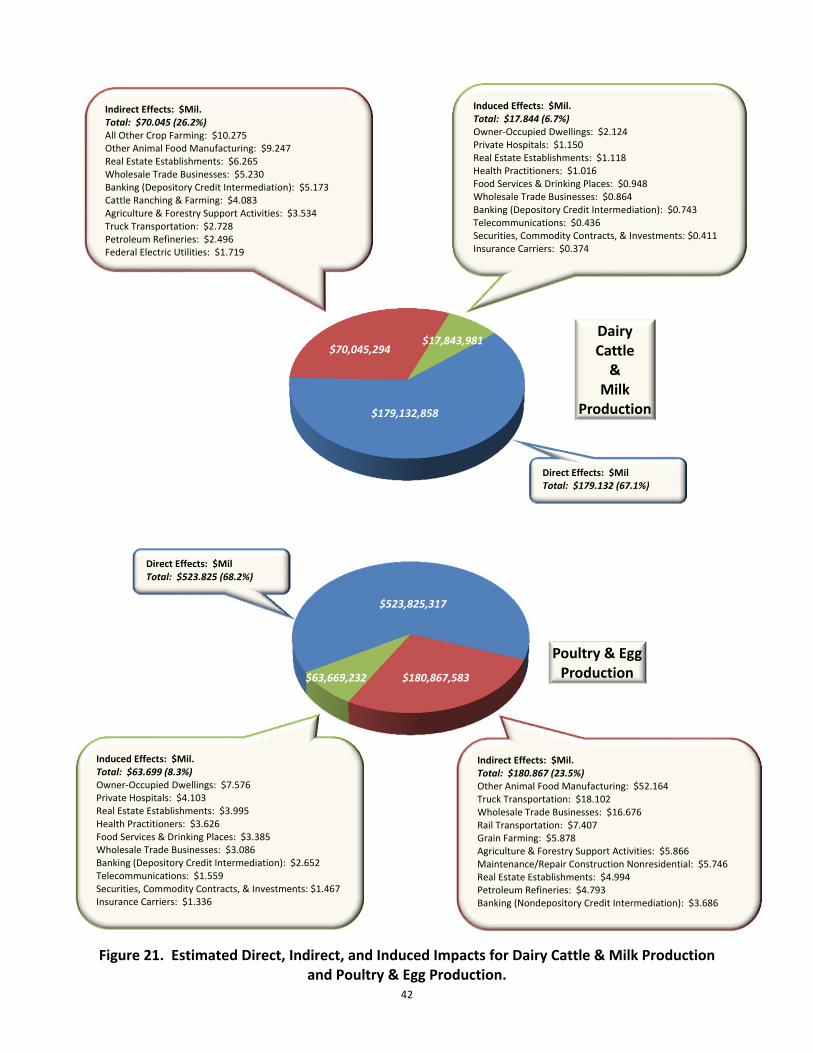
42
Figure 21. Estimated Direct, Indirect, and Induced Impacts for Dairy Cattle & Milk Production
and Poultry & Egg Production.
Dairy Cattle &
Milk Production
Poultry & Egg Production
Direct Effects: $Mil Total: $179.132 (67.1%)
Indirect Effects: $Mil. Total: $70.045 (26.2%) All Other Crop Farming: $10.275 Other Animal Food Manufacturing: $9.247 Real Estate Establishments: $6.265 Wholesale Trade Businesses: $5.230 Banking (Depository Credit Intermediation): $5.173 Cattle Ranching & Farming: $4.083 Agriculture & Forestry Support Activities: $3.534 Truck Transportation: $2.728 Petroleum Refineries: $2.496 Federal Electric Utilities: $1.719
Induced Effects: $Mil. Total: $17.844 (6.7%) Owner‐Occupied Dwellings: $2.124 Private Hospitals: $1.150 Real Estate Establishments: $1.118 Health Practitioners: $1.016 Food Services & Drinking Places: $0.948 Wholesale Trade Businesses: $0.864 Banking (Depository Credit Intermediation): $0.743 Telecommunications: $0.436 Securities, Commodity Contracts, & Investments: $0.411 Insurance Carriers: $0.374
Direct Effects: $Mil Total: $523.825 (68.2%)
Indirect Effects: $Mil. Total: $180.867 (23.5%) Other Animal Food Manufacturing: $52.164 Truck Transportation: $18.102 Wholesale Trade Businesses: $16.676 Rail Transportation: $7.407 Grain Farming: $5.878 Agriculture & Forestry Support Activities: $5.866 Maintenance/Repair Construction Nonresidential: $5.746 Real Estate Establishments: $4.994 Petroleum Refineries: $4.793 Banking (Nondepository Credit Intermediation): $3.686
Induced Effects: $Mil. Total: $63.699 (8.3%) Owner‐Occupied Dwellings: $7.576 Private Hospitals: $4.103 Real Estate Establishments: $3.995 Health Practitioners: $3.626 Food Services & Drinking Places: $3.385 Wholesale Trade Businesses: $3.086 Banking (Depository Credit Intermediation): $2.652 Telecommunications: $1.559 Securities, Commodity Contracts, & Investments: $1.467 Insurance Carriers: $1.336
$179,132,858
$17,843,981$70,045,294
$523,825,317
$63,669,232 $180,867,583
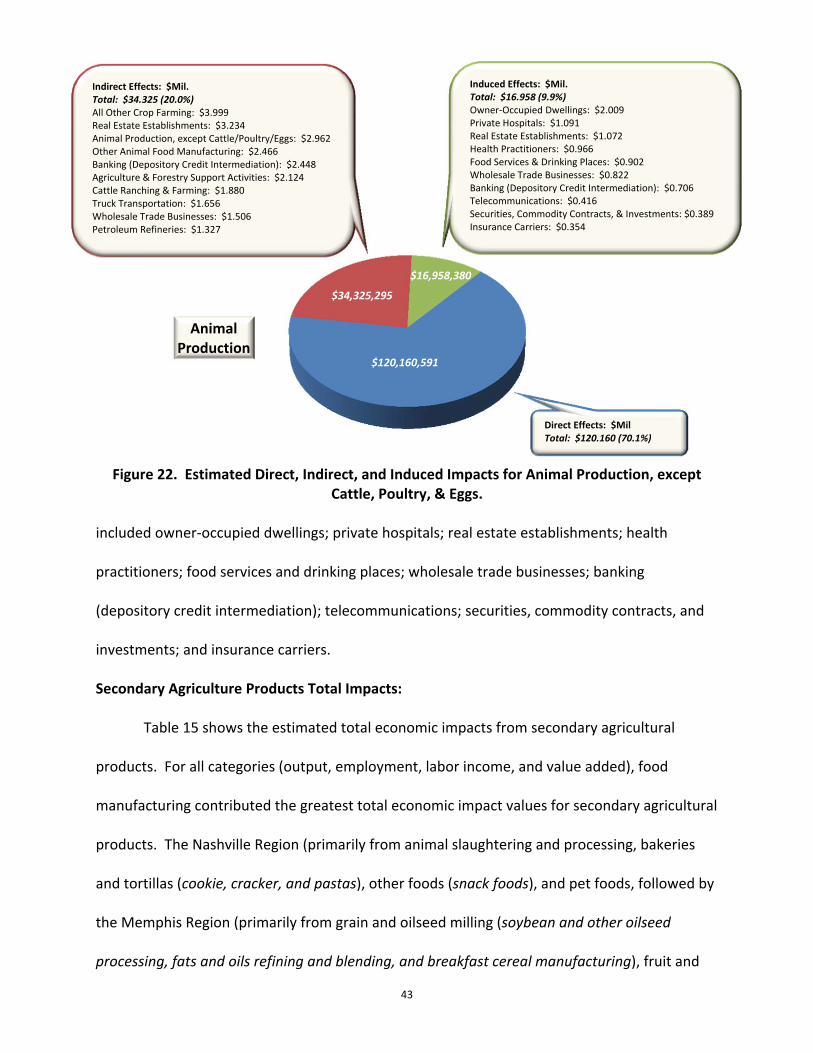
43
Figure 22. Estimated Direct, Indirect, and Induced Impacts for Animal Production, except Cattle, Poultry, & Eggs.
included owner‐occupied dwellings; private hospitals; real estate establishments; health
practitioners; food services and drinking places; wholesale trade businesses; banking
(depository credit intermediation); telecommunications; securities, commodity contracts, and
investments; and insurance carriers.
Secondary Agriculture Products Total Impacts: Table 15 shows the estimated total economic impacts from secondary agricultural
products. For all categories (output, employment, labor income, and value added), food
manufacturing contributed the greatest total economic impact values for secondary agricultural
products. The Nashville Region (primarily from animal slaughtering and processing, bakeries
and tortillas (cookie, cracker, and pastas), other foods (snack foods), and pet foods, followed by
the Memphis Region (primarily from grain and oilseed milling (soybean and other oilseed
processing, fats and oils refining and blending, and breakfast cereal manufacturing), fruit and
Animal Production
Direct Effects: $Mil Total: $120.160 (70.1%)
Indirect Effects: $Mil. Total: $34.325 (20.0%) All Other Crop Farming: $3.999 Real Estate Establishments: $3.234 Animal Production, except Cattle/Poultry/Eggs: $2.962 Other Animal Food Manufacturing: $2.466 Banking (Depository Credit Intermediation): $2.448 Agriculture & Forestry Support Activities: $2.124 Cattle Ranching & Farming: $1.880 Truck Transportation: $1.656 Wholesale Trade Businesses: $1.506 Petroleum Refineries: $1.327
Induced Effects: $Mil.Total: $16.958 (9.9%) Owner‐Occupied Dwellings: $2.009 Private Hospitals: $1.091 Real Estate Establishments: $1.072 Health Practitioners: $0.966 Food Services & Drinking Places: $0.902 Wholesale Trade Businesses: $0.822 Banking (Depository Credit Intermediation): $0.706 Telecommunications: $0.416 Securities, Commodity Contracts, & Investments: $0.389 Insurance Carriers: $0.354
$120,160,591
$34,325,295
$16,958,380
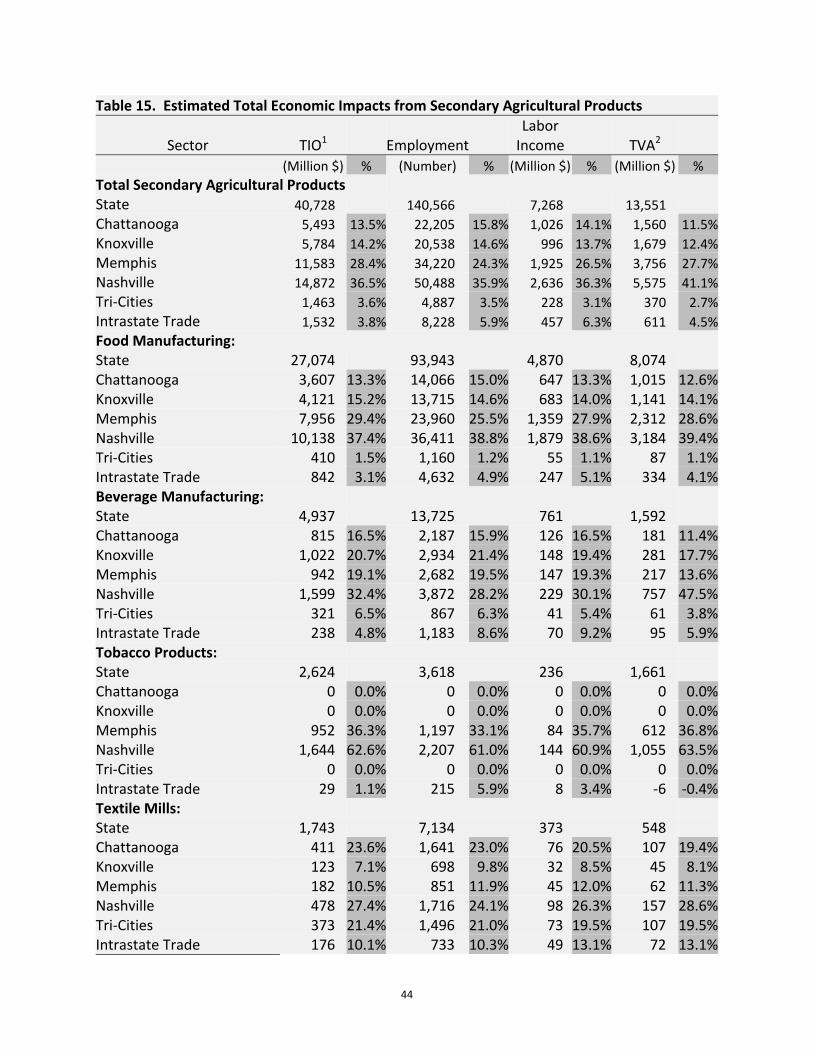
44
Table 15. Estimated Total Economic Impacts from Secondary Agricultural Products
Sector
TIO1
Employment
Labor Income
TVA2
(Million $) % (Number) % (Million $) % (Million $) %
Total Secondary Agricultural Products State 40,728 140,566 7,268 13,551
Chattanooga 5,493 13.5% 22,205 15.8% 1,026 14.1% 1,560 11.5%
Knoxville 5,784 14.2% 20,538 14.6% 996 13.7% 1,679 12.4%
Memphis 11,583 28.4% 34,220 24.3% 1,925 26.5% 3,756 27.7%
Nashville 14,872 36.5% 50,488 35.9% 2,636 36.3% 5,575 41.1%
Tri‐Cities 1,463 3.6% 4,887 3.5% 228 3.1% 370 2.7%
Intrastate Trade 1,532 3.8% 8,228 5.9% 457 6.3% 611 4.5%
Food Manufacturing: State 27,074 93,943 4,870 8,074 Chattanooga 3,607 13.3% 14,066 15.0% 647 13.3% 1,015 12.6%Knoxville 4,121 15.2% 13,715 14.6% 683 14.0% 1,141 14.1%Memphis 7,956 29.4% 23,960 25.5% 1,359 27.9% 2,312 28.6%Nashville 10,138 37.4% 36,411 38.8% 1,879 38.6% 3,184 39.4%Tri‐Cities 410 1.5% 1,160 1.2% 55 1.1% 87 1.1%Intrastate Trade 842 3.1% 4,632 4.9% 247 5.1% 334 4.1%Beverage Manufacturing: State 4,937 13,725 761 1,592 Chattanooga 815 16.5% 2,187 15.9% 126 16.5% 181 11.4%Knoxville 1,022 20.7% 2,934 21.4% 148 19.4% 281 17.7%Memphis 942 19.1% 2,682 19.5% 147 19.3% 217 13.6%Nashville 1,599 32.4% 3,872 28.2% 229 30.1% 757 47.5%Tri‐Cities 321 6.5% 867 6.3% 41 5.4% 61 3.8%Intrastate Trade 238 4.8% 1,183 8.6% 70 9.2% 95 5.9%Tobacco Products: State 2,624 3,618 236 1,661 Chattanooga 0 0.0% 0 0.0% 0 0.0% 0 0.0%Knoxville 0 0.0% 0 0.0% 0 0.0% 0 0.0%Memphis 952 36.3% 1,197 33.1% 84 35.7% 612 36.8%Nashville 1,644 62.6% 2,207 61.0% 144 60.9% 1,055 63.5%Tri‐Cities 0 0.0% 0 0.0% 0 0.0% 0 0.0%Intrastate Trade 29 1.1% 215 5.9% 8 3.4% ‐6 ‐0.4%Textile Mills: State 1,743 7,134 373 548 Chattanooga 411 23.6% 1,641 23.0% 76 20.5% 107 19.4%Knoxville 123 7.1% 698 9.8% 32 8.5% 45 8.1%Memphis 182 10.5% 851 11.9% 45 12.0% 62 11.3%Nashville 478 27.4% 1,716 24.1% 98 26.3% 157 28.6%Tri‐Cities 373 21.4% 1,496 21.0% 73 19.5% 107 19.5%Intrastate Trade 176 10.1% 733 10.3% 49 13.1% 72 13.1%

45
Table 15. Estimated Total Economic Impacts from Secondary Agricultural Products (Cont.)
Sector
TIO1
Employment
Labor Income
TVA2
(Million $) % (Number) % (Million $) % (Million $) %
Agricultural Chemicals: State 1,216 3,340 219 461 Chattanooga 14 1.2% 25 0.7% 1 0.7% 5 1.1%Knoxville 162 13.3% 544 16.3% 29 13.4% 62 13.4%Memphis 776 63.8% 1,723 51.6% 126 57.4% 286 61.9%Nashville 145 11.9% 573 17.2% 36 16.3% 60 13.0%Tri‐Cities 79 6.5% 150 4.5% 9 4.0% 27 6.0%Intrastate Trade 39 3.2% 325 9.7% 18 8.4% 21 4.6%Apparel Manufacturing: State 1,120 8,898 364 517 Chattanooga 433 38.6% 3,260 36.6% 134 36.7% 183 35.5%Knoxville 141 12.6% 1,176 13.2% 47 12.9% 68 13.1%Memphis 106 9.5% 929 10.4% 31 8.5% 46 8.8%Nashville 351 31.3% 2,886 32.4% 120 33.0% 171 33.1%Tri‐Cities 21 1.9% 191 2.1% 6 1.7% 9 1.7%Intrastate Trade 68 6.1% 456 5.1% 26 7.2% 40 7.7%Agricultural Machinery: State 1,118 4,208 214 367 Chattanooga 135 12.0% 435 10.3% 22 10.3% 41 11.2%Knoxville 9 0.8% 33 0.8% 2 0.8% 3 0.8%Memphis 551 49.3% 2,040 48.5% 100 46.9% 175 47.7%Nashville 112 10.0% 407 9.7% 28 13.0% 44 11.9%Tri‐Cities 235 21.0% 858 20.4% 39 18.3% 70 19.1%Intrastate Trade 76 6.8% 434 10.3% 23 10.7% 34 9.3%Textile Product Mills: State 704 4,382 182 260 Chattanooga 73 10.3% 534 12.2% 19 10.2% 26 9.9%Knoxville 201 28.6% 1,394 31.8% 54 29.5% 78 29.9%Memphis 60 8.6% 398 9.1% 18 9.8% 25 9.5%Nashville 288 40.9% 1,673 38.2% 71 39.2% 104 39.8%Tri‐Cities 23 3.3% 162 3.7% 5 3.0% 8 3.0%Intrastate Trade 59 8.4% 221 5.0% 15 8.4% 20 7.8%Leather & Allied Product Manufacturing: State 191 1,317 50 70 Chattanooga 6 2.9% 56 4.3% 1 1.8% 1 2.0%Knoxville 5 2.9% 44 3.3% 2 3.3% 2 3.5%Memphis 57 30.1% 441 33.5% 15 30.8% 22 30.9%Nashville 118 61.6% 742 56.3% 31 61.8% 43 61.8%Tri‐Cities 03 0.2% 3 0.3% 03 0.3% 03 0.2%Intrastate Trade 4 2.3% 31 2.4% 1 2.1% 1 1.7%
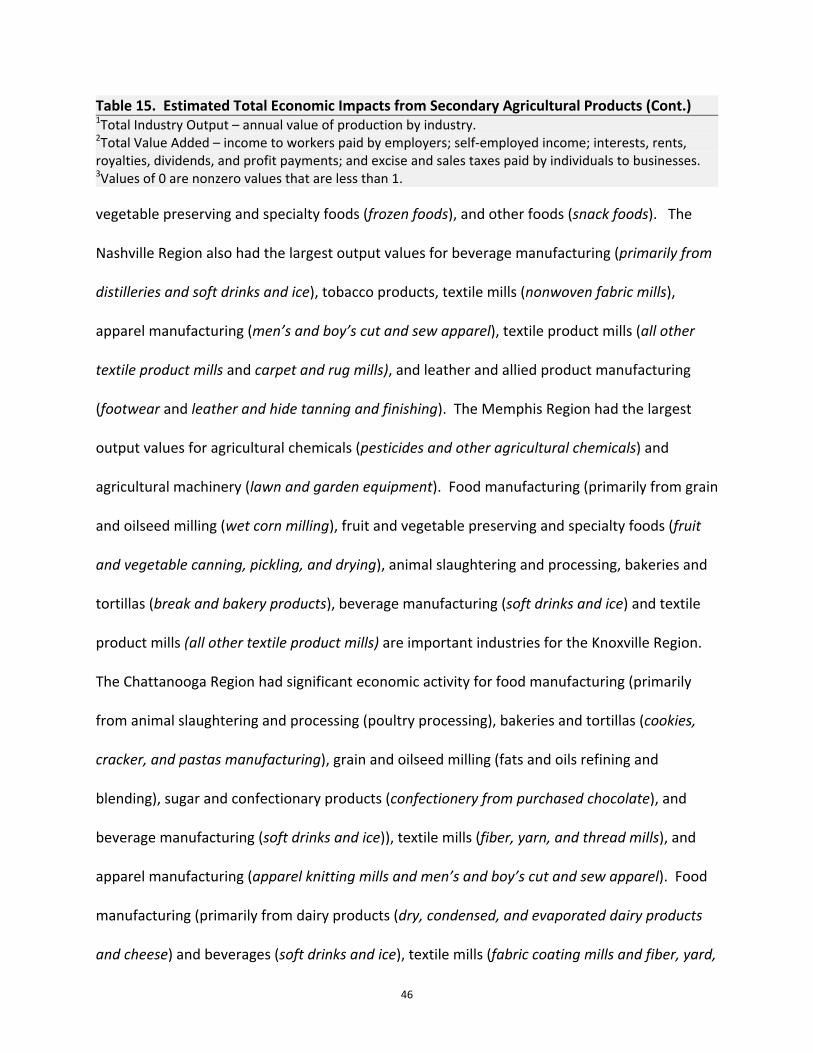
46
Table 15. Estimated Total Economic Impacts from Secondary Agricultural Products (Cont.) 1Total Industry Output – annual value of production by industry. 2Total Value Added – income to workers paid by employers; self‐employed income; interests, rents, royalties, dividends, and profit payments; and excise and sales taxes paid by individuals to businesses. 3Values of 0 are nonzero values that are less than 1. vegetable preserving and specialty foods (frozen foods), and other foods (snack foods). The
Nashville Region also had the largest output values for beverage manufacturing (primarily from
distilleries and soft drinks and ice), tobacco products, textile mills (nonwoven fabric mills),
apparel manufacturing (men’s and boy’s cut and sew apparel), textile product mills (all other
textile product mills and carpet and rug mills), and leather and allied product manufacturing
(footwear and leather and hide tanning and finishing). The Memphis Region had the largest
output values for agricultural chemicals (pesticides and other agricultural chemicals) and
agricultural machinery (lawn and garden equipment). Food manufacturing (primarily from grain
and oilseed milling (wet corn milling), fruit and vegetable preserving and specialty foods (fruit
and vegetable canning, pickling, and drying), animal slaughtering and processing, bakeries and
tortillas (break and bakery products), beverage manufacturing (soft drinks and ice) and textile
product mills (all other textile product mills) are important industries for the Knoxville Region.
The Chattanooga Region had significant economic activity for food manufacturing (primarily
from animal slaughtering and processing (poultry processing), bakeries and tortillas (cookies,
cracker, and pastas manufacturing), grain and oilseed milling (fats and oils refining and
blending), sugar and confectionary products (confectionery from purchased chocolate), and
beverage manufacturing (soft drinks and ice)), textile mills (fiber, yarn, and thread mills), and
apparel manufacturing (apparel knitting mills and men’s and boy’s cut and sew apparel). Food
manufacturing (primarily from dairy products (dry, condensed, and evaporated dairy products
and cheese) and beverages (soft drinks and ice), textile mills (fabric coating mills and fiber, yard,
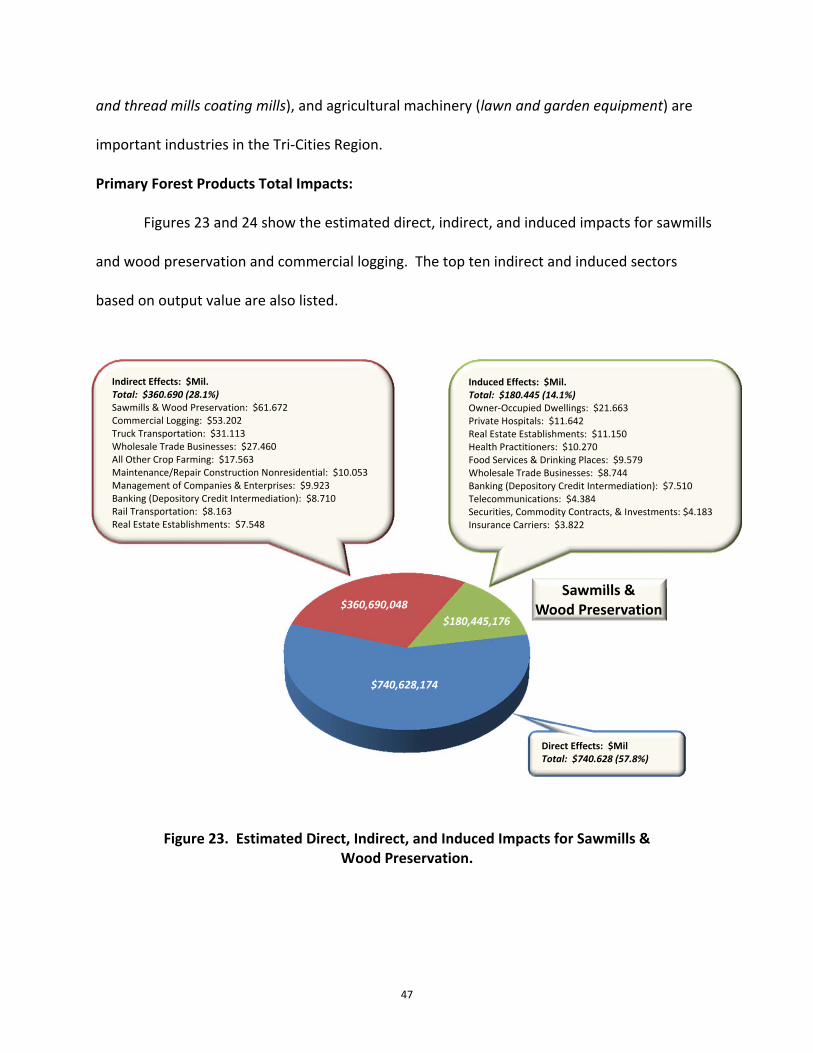
47
and thread mills coating mills), and agricultural machinery (lawn and garden equipment) are
important industries in the Tri‐Cities Region.
Primary Forest Products Total Impacts:
Figures 23 and 24 show the estimated direct, indirect, and induced impacts for sawmills
and wood preservation and commercial logging. The top ten indirect and induced sectors
based on output value are also listed.
Figure 23. Estimated Direct, Indirect, and Induced Impacts for Sawmills & Wood Preservation.
Sawmills &Wood Preservation$360,690,048
$740,628,174
$180,445,176
Direct Effects: $Mil Total: $740.628 (57.8%)
Indirect Effects: $Mil. Total: $360.690 (28.1%) Sawmills & Wood Preservation: $61.672 Commercial Logging: $53.202 Truck Transportation: $31.113 Wholesale Trade Businesses: $27.460 All Other Crop Farming: $17.563 Maintenance/Repair Construction Nonresidential: $10.053 Management of Companies & Enterprises: $9.923 Banking (Depository Credit Intermediation): $8.710 Rail Transportation: $8.163 Real Estate Establishments: $7.548
Induced Effects: $Mil.Total: $180.445 (14.1%) Owner‐Occupied Dwellings: $21.663 Private Hospitals: $11.642 Real Estate Establishments: $11.150 Health Practitioners: $10.270 Food Services & Drinking Places: $9.579 Wholesale Trade Businesses: $8.744 Banking (Depository Credit Intermediation): $7.510 Telecommunications: $4.384 Securities, Commodity Contracts, & Investments: $4.183 Insurance Carriers: $3.822
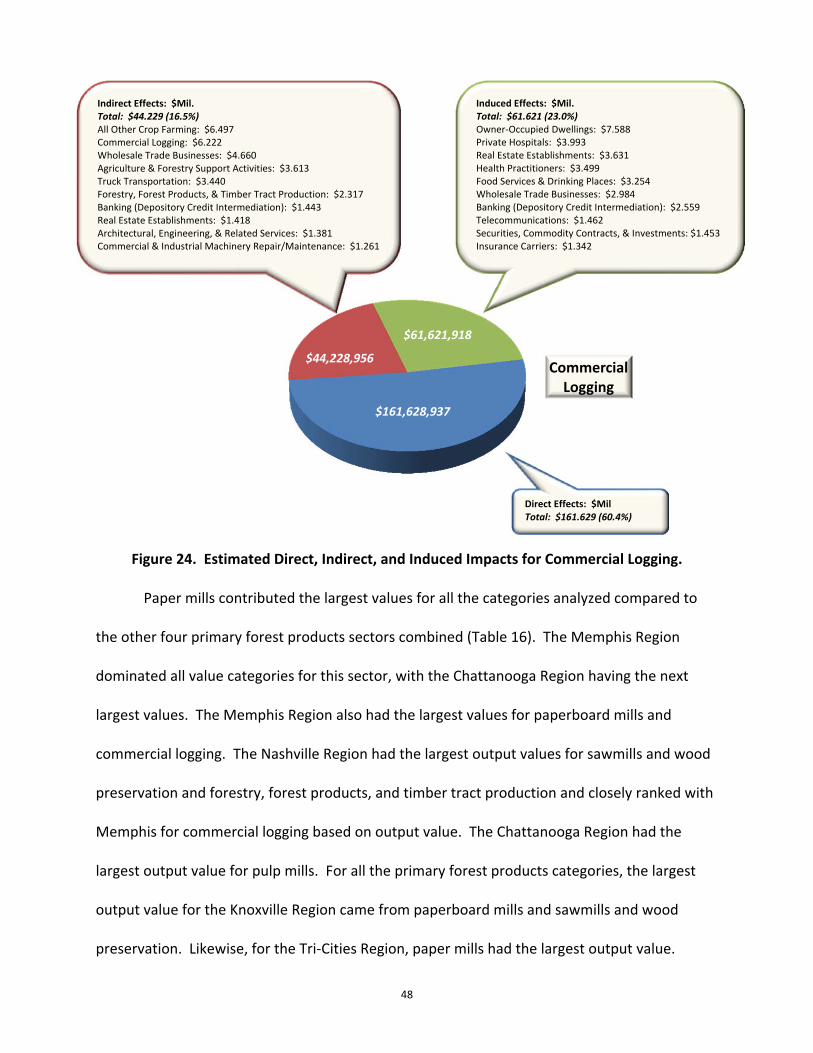
48
Figure 24. Estimated Direct, Indirect, and Induced Impacts for Commercial Logging.
Paper mills contributed the largest values for all the categories analyzed compared to
the other four primary forest products sectors combined (Table 16). The Memphis Region
dominated all value categories for this sector, with the Chattanooga Region having the next
largest values. The Memphis Region also had the largest values for paperboard mills and
commercial logging. The Nashville Region had the largest output values for sawmills and wood
preservation and forestry, forest products, and timber tract production and closely ranked with
Memphis for commercial logging based on output value. The Chattanooga Region had the
largest output value for pulp mills. For all the primary forest products categories, the largest
output value for the Knoxville Region came from paperboard mills and sawmills and wood
preservation. Likewise, for the Tri‐Cities Region, paper mills had the largest output value.
Commercial Logging
$161,628,937
$61,621,918
$44,228,956
Indirect Effects: $Mil. Total: $44.229 (16.5%) All Other Crop Farming: $6.497 Commercial Logging: $6.222 Wholesale Trade Businesses: $4.660 Agriculture & Forestry Support Activities: $3.613 Truck Transportation: $3.440 Forestry, Forest Products, & Timber Tract Production: $2.317 Banking (Depository Credit Intermediation): $1.443 Real Estate Establishments: $1.418 Architectural, Engineering, & Related Services: $1.381 Commercial & Industrial Machinery Repair/Maintenance: $1.261
Induced Effects: $Mil. Total: $61.621 (23.0%) Owner‐Occupied Dwellings: $7.588 Private Hospitals: $3.993 Real Estate Establishments: $3.631 Health Practitioners: $3.499 Food Services & Drinking Places: $3.254 Wholesale Trade Businesses: $2.984 Banking (Depository Credit Intermediation): $2.559 Telecommunications: $1.462 Securities, Commodity Contracts, & Investments: $1.453 Insurance Carriers: $1.342
Direct Effects: $Mil Total: $161.629 (60.4%)

49
Table 16. Estimated Total Economic Impacts from Primary Forest Products
Sector
TIO1
Employment
Labor Income
TVA2
(Million $) % (Number) % (Million $) % (Million $) %
Total Primary Forest Products State 9,244 35,901 2,114 3,516
Chattanooga 1,252 13.5% 4,249 11.8% 238 11.2% 405 11.5%
Knoxville 293 3.2% 1,346 3.7% 64 3.0% 102 2.9%
Memphis 5,663 61.3% 19,326 53.8% 1,318 62.3% 2,270 64.6%
Nashville 1,025 11.1% 5,812 16.2% 225 10.6% 336 9.6%
Tri‐Cities 449 4.9% 1,583 4.4% 88 4.2% 165 4.7%
Intrastate Trade 561 6.1% 3,586 10.0% 181 8.5% 238 6.8%
Paper Mills: State 6,097 19,708 1,411 2,497 Chattanooga 741 12.2% 2,156 10.9% 135 9.6% 257 10.3%Knoxville 73 1.2% 238 1.2% 17 1.2% 31 1.2%Memphis 4,183 68.6% 12,654 64.2% 994 70.5% 1,772 71.0%Nashville 312 5.1% 984 5.0% 58 4.1% 118 4.7%Tri‐Cities 385 6.3% 1,131 5.7% 75 5.3% 148 5.9%Intrastate Trade 402 6.6% 2,545 12.9% 131 9.3% 170 6.8%Paperboard Mills: State 1,300 4,497 270 443 Chattanooga 211 16.3% 668 14.8% 46 16.9% 68 15.3%Knoxville 101 7.8% 351 7.8% 19 7.1% 34 7.6%Memphis 897 69.0% 2,906 64.6% 178 65.6% 305 69.0%Nashville 0 0.0% 0 0.0% 0 0.0% 0 0.0%Tri‐Cities 0 0.0% 0 0.0% 0 0.0% 0 0.0%Intrastate Trade 90 6.9% 572 12.7% 28 10.4% 36 8.2%Sawmills & Wood Preservation State 1,163 6,167 242 326 Chattanooga 72 6.2% 376 6.1% 13 5.4% 17 5.1%Knoxville 101 8.7% 540 8.8% 21 8.8% 29 8.9%Memphis 317 27.3% 1,652 26.8% 65 27.0% 89 27.2%Nashville 596 51.3% 3,153 51.1% 125 51.7% 171 52.4%Tri‐Cities 53 4.6% 280 4.5% 10 4.0% 13 4.1%Intrastate Trade 24 2.0% 166 2.7% 8 3.1% 7 2.3%Pulp Mills: State 391 1,434 87 132 Chattanooga 205 52.4% 683 47.6% 36 41.9% 56 42.1%Knoxville 0 0.0% 0 0.0% 0 0.0% 0 0.0%Memphis 149 38.2% 519 36.2% 39 44.7% 57 42.9%Nashville 0 0.0% 0 0.0% 0 0.0% 0 0.0%Tri‐Cities 0 0.0% 0 0.0% 0 0.0% 0 0.0%Intrastate Trade 36 9.3% 231 16.1% 12 13.4% 20 15.0%
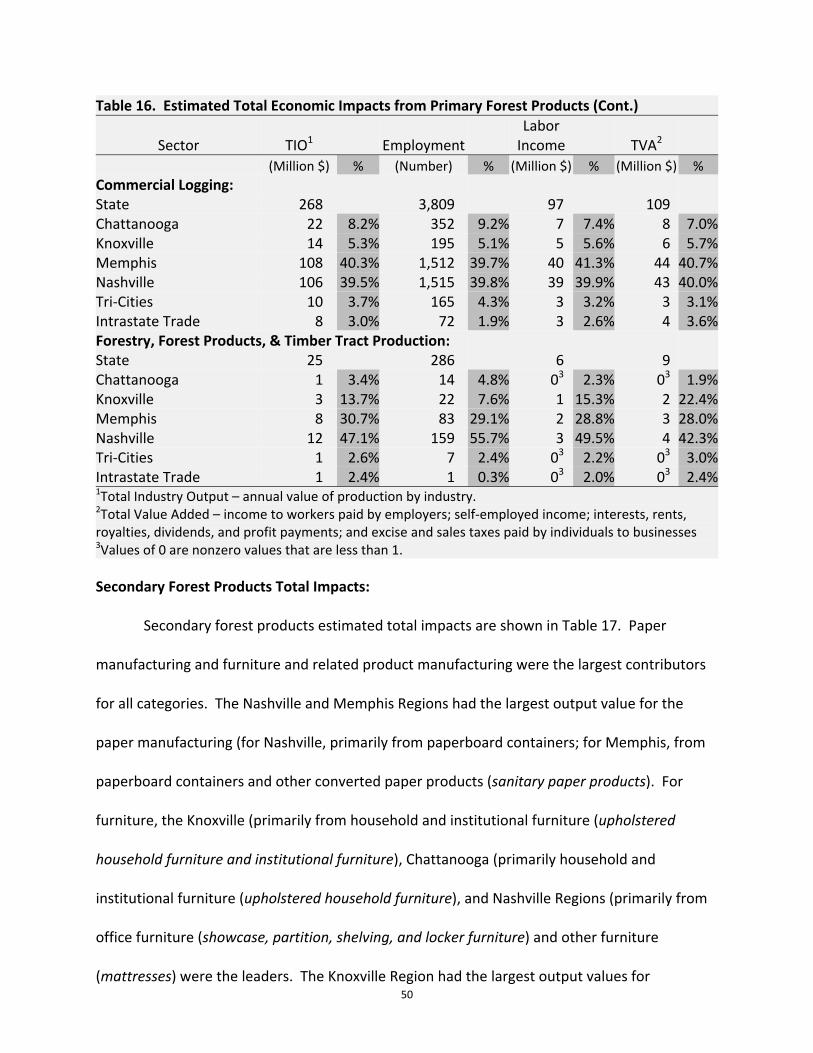
50
Secondary Forest Products Total Impacts:
Secondary forest products estimated total impacts are shown in Table 17. Paper
manufacturing and furniture and related product manufacturing were the largest contributors
for all categories. The Nashville and Memphis Regions had the largest output value for the
paper manufacturing (for Nashville, primarily from paperboard containers; for Memphis, from
paperboard containers and other converted paper products (sanitary paper products). For
furniture, the Knoxville (primarily from household and institutional furniture (upholstered
household furniture and institutional furniture), Chattanooga (primarily household and
institutional furniture (upholstered household furniture), and Nashville Regions (primarily from
office furniture (showcase, partition, shelving, and locker furniture) and other furniture
(mattresses) were the leaders. The Knoxville Region had the largest output values for
Table 16. Estimated Total Economic Impacts from Primary Forest Products (Cont.)
Sector
TIO1
Employment
Labor Income
TVA2
(Million $) % (Number) % (Million $) % (Million $) %
Commercial Logging: State 268 3,809 97 109 Chattanooga 22 8.2% 352 9.2% 7 7.4% 8 7.0%Knoxville 14 5.3% 195 5.1% 5 5.6% 6 5.7%Memphis 108 40.3% 1,512 39.7% 40 41.3% 44 40.7%Nashville 106 39.5% 1,515 39.8% 39 39.9% 43 40.0%Tri‐Cities 10 3.7% 165 4.3% 3 3.2% 3 3.1%Intrastate Trade 8 3.0% 72 1.9% 3 2.6% 4 3.6%Forestry, Forest Products, & Timber Tract Production: State 25 286 6 9 Chattanooga 1 3.4% 14 4.8% 03 2.3% 03 1.9%Knoxville 3 13.7% 22 7.6% 1 15.3% 2 22.4%Memphis 8 30.7% 83 29.1% 2 28.8% 3 28.0%Nashville 12 47.1% 159 55.7% 3 49.5% 4 42.3%Tri‐Cities 1 2.6% 7 2.4% 03 2.2% 03 3.0%Intrastate Trade 1 2.4% 1 0.3% 03 2.0% 03 2.4%1Total Industry Output – annual value of production by industry. 2Total Value Added – income to workers paid by employers; self‐employed income; interests, rents, royalties, dividends, and profit payments; and excise and sales taxes paid by individuals to businesses 3Values of 0 are nonzero values that are less than 1.
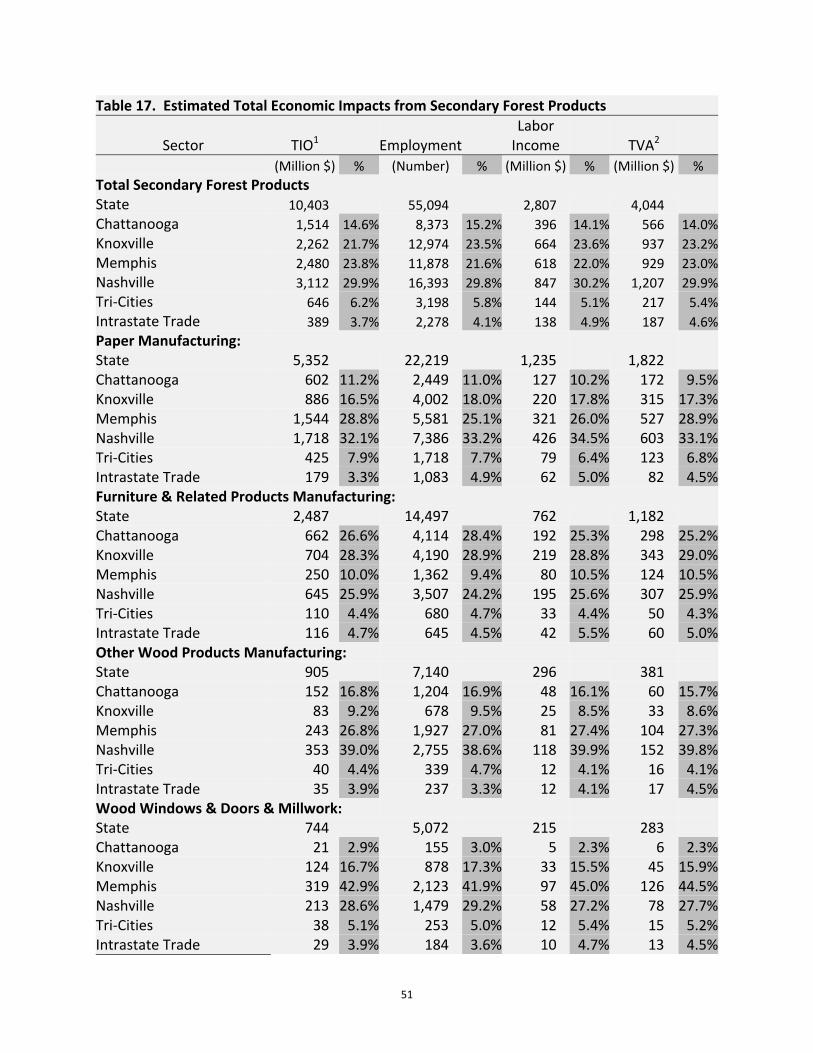
51
Table 17. Estimated Total Economic Impacts from Secondary Forest Products
Sector
TIO1
Employment
Labor Income
TVA2
(Million $) % (Number) % (Million $) % (Million $) %
Total Secondary Forest Products State 10,403 55,094 2,807 4,044
Chattanooga 1,514 14.6% 8,373 15.2% 396 14.1% 566 14.0%
Knoxville 2,262 21.7% 12,974 23.5% 664 23.6% 937 23.2%
Memphis 2,480 23.8% 11,878 21.6% 618 22.0% 929 23.0%
Nashville 3,112 29.9% 16,393 29.8% 847 30.2% 1,207 29.9%
Tri‐Cities 646 6.2% 3,198 5.8% 144 5.1% 217 5.4%
Intrastate Trade 389 3.7% 2,278 4.1% 138 4.9% 187 4.6%
Paper Manufacturing: State 5,352 22,219 1,235 1,822 Chattanooga 602 11.2% 2,449 11.0% 127 10.2% 172 9.5%Knoxville 886 16.5% 4,002 18.0% 220 17.8% 315 17.3%Memphis 1,544 28.8% 5,581 25.1% 321 26.0% 527 28.9%Nashville 1,718 32.1% 7,386 33.2% 426 34.5% 603 33.1%Tri‐Cities 425 7.9% 1,718 7.7% 79 6.4% 123 6.8%Intrastate Trade 179 3.3% 1,083 4.9% 62 5.0% 82 4.5%Furniture & Related Products Manufacturing: State 2,487 14,497 762 1,182 Chattanooga 662 26.6% 4,114 28.4% 192 25.3% 298 25.2%Knoxville 704 28.3% 4,190 28.9% 219 28.8% 343 29.0%Memphis 250 10.0% 1,362 9.4% 80 10.5% 124 10.5%Nashville 645 25.9% 3,507 24.2% 195 25.6% 307 25.9%Tri‐Cities 110 4.4% 680 4.7% 33 4.4% 50 4.3%Intrastate Trade 116 4.7% 645 4.5% 42 5.5% 60 5.0%Other Wood Products Manufacturing: State 905 7,140 296 381 Chattanooga 152 16.8% 1,204 16.9% 48 16.1% 60 15.7%Knoxville 83 9.2% 678 9.5% 25 8.5% 33 8.6%Memphis 243 26.8% 1,927 27.0% 81 27.4% 104 27.3%Nashville 353 39.0% 2,755 38.6% 118 39.9% 152 39.8%Tri‐Cities 40 4.4% 339 4.7% 12 4.1% 16 4.1%Intrastate Trade 35 3.9% 237 3.3% 12 4.1% 17 4.5%Wood Windows & Doors & Millwork: State 744 5,072 215 283 Chattanooga 21 2.9% 155 3.0% 5 2.3% 6 2.3%Knoxville 124 16.7% 878 17.3% 33 15.5% 45 15.9%Memphis 319 42.9% 2,123 41.9% 97 45.0% 126 44.5%Nashville 213 28.6% 1,479 29.2% 58 27.2% 78 27.7%Tri‐Cities 38 5.1% 253 5.0% 12 5.4% 15 5.2%Intrastate Trade 29 3.9% 184 3.6% 10 4.7% 13 4.5%

52
Table 17. Estimated Total Economic Impacts from Secondary Forest Products (Cont.)
Sector
TIO1
Employment
Labor Income
TVA2
(Million $) % (Number) % (Million $) % (Million $) %
Manufactured Homes Manufacturing: State 650 4,568 229 273 Chattanooga 4 0.6% 29 0.6% 1 0.6% 2 0.6%Knoxville 431 66.4% 3,028 66.3% 157 68.5% 187 68.5%Memphis 103 15.8% 754 16.5% 33 14.6% 39 14.4%Nashville 93 14.3% 693 15.2% 30 13.0% 37 13.6%Tri‐Cities 2 0.2% 12 0.3% 1 0.2% 1 0.2%Intrastate Trade 18 2.7% 53 1.2% 7 3.1% 7 2.7%Veneer, Plywood, & Engineered Wood Products Manufacturing: State 265 1,599 70 101 Chattanooga 74 27.8% 424 26.5% 23 32.5% 28 27.3%Knoxville 33 12.4% 198 12.4% 9 13.2% 14 13.8%Memphis 22 8.3% 131 8.2% 6 8.2% 9 8.8%Nashville 90 34.0% 573 35.8% 19 27.7% 30 30.1%Tri‐Cities 33 12.4% 196 12.3% 8 11.5% 13 12.4%Intrastate Trade 14 5.1% 76 4.8% 5 6.8% 8 7.6%1Total Industry Output – annual value of production by industry. 2Total Value Added – income to workers paid by employers; self‐employed income; interests, rents, royalties, dividends, and profit payments; and excise and sales taxes paid by individuals to businesses.
manufactured home manufacturing. For wood windows and doors and millwork, the Memphis
Region had the largest value followed by the Nashville and Knoxville Regions. The Nashville
(primarily from wood kitchen cabinets and countertops and wood containers and pallets) and
Memphis Regions (wood containers and pallets) were the leaders in all categories for other
wood product manufacturing. Veneer, plywood, and engineered wood products manufacturing
economic activity were the largest in the Nashville Region (primarily from engineered wood
members and trusses), followed by the Chattanooga (primarily from reconstituted wood
products), Knoxville (primarily from engineered wood members and trusses), and Tri‐Cities
(primarily from engineered wood members and trusses) Regions.
The output and employment multipliers for 2011 for primary agricultural and forestry
activities ranged from 1.14 to 1.90 for total industrial output and 1.02 to 5.05 for employment

53
(Table 18). For instance, if commercial logging increased total industry output by $1 million, the
state’s economy would increase by an estimated $.66 million overall and for each job created in
this same industry an estimated 0.39 additional jobs would be added. Cattle farmers that
produce $1 million of total industry output generated an additional $.70 million indirectly
through the purchase of inputs and $.83 million in total economic activity (purchased inputs
and household spending) within the state.
Table 18. Output and Employment Multipliers for Selected Agriculture and Forestry Sectors
TIO1 Employment
Indirect & Indirect & IMPLAN Sector Indirect Induced Indirect Induced
Oilseed farming 1.30 1.38 1.13 1.15 Grain farming 1.39 1.50 1.11 1.13 Vegetable & melon farming 1.29 1.44 1.39 1.50 Fruit farming 1.29 1.44 1.40 1.50 Tree nut farming 1.27 1.47 1.19 1.25 Greenhouse, nursery, and floriculture 1.14 1.31 1.12 1.20 Tobacco farming 1.46 1.61 1.17 1.21 Cotton farming 1.39 1.57 1.43 1.57 All other crop farming 1.43 1.58 1.48 1.60 Cattle ranching & farming 1.70 1.83 1.52 1.57 Dairy cattle & milk production 1.39 1.49 1.23 1.28 Poultry & egg production 1.35 1.47 1.60 1.84 Animal production, except cattle/poultry/eggs 1.29 1.43 1.07 1.09 Commercial hunting & trapping 1.51 1.68 1.34 1.45 Agriculture & forestry support activities 1.16 1.90 1.02 1.16 Commercial logging 1.28 1.66 1.20 1.39 Sawmills & wood preservation 1.36 1.57 1.55 1.96 Pulp mills 1.46 1.71 3.12 4.62 Paper mills 1.34 1.57 2.71 4.39 Paperboard mills 1.43 1.65 3.15 4.65 Forestry, forest products, & timber tracts 1.57 1.88 4.45 5.05 1Total Industry Output – annual value of production by industry.
Figures 25 through 30 show the estimated direct and total level of economic activity
derived from agriculture, forestry, and both agriculture and forestry combined by county for
Tennessee. These values were based on total industry output and were compared to the total

54
Figure 25. Percent of Economic Activity from Direct Agriculture, 2011.
Figure 26. Percent of Economic Activity from Total Agriculture, 2011.
Direct Agriculture
< 1%
1% 7%
7% ‐ 14%
14% ‐ 21%
> 21%
Total Agriculture
< 1%
1% ‐ 7%
7% 14%
14% ‐ 21%
21% ‐ 28%
> 28%
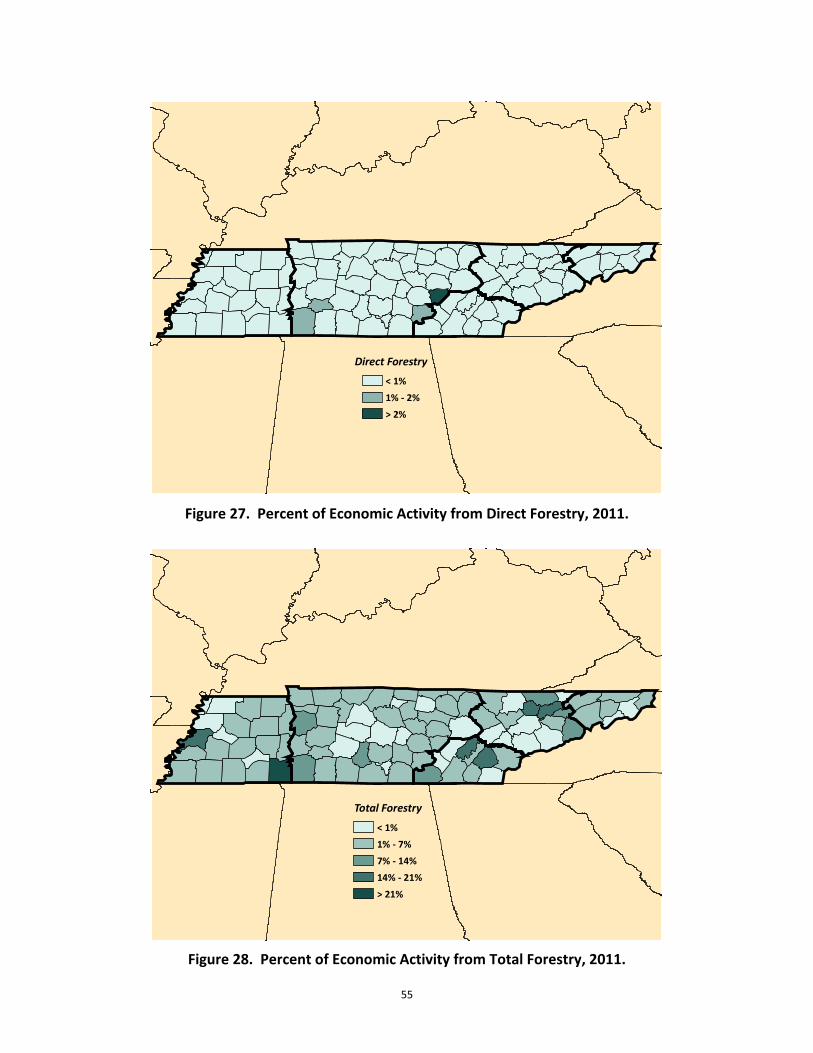
55
Figure 27. Percent of Economic Activity from Direct Forestry, 2011.
Figure 28. Percent of Economic Activity from Total Forestry, 2011.
Direct Forestry
< 1%
1% ‐ 2%
> 2%
Total Forestry
< 1%
1% ‐ 7%
7% ‐ 14%
14% ‐ 21%
> 21%
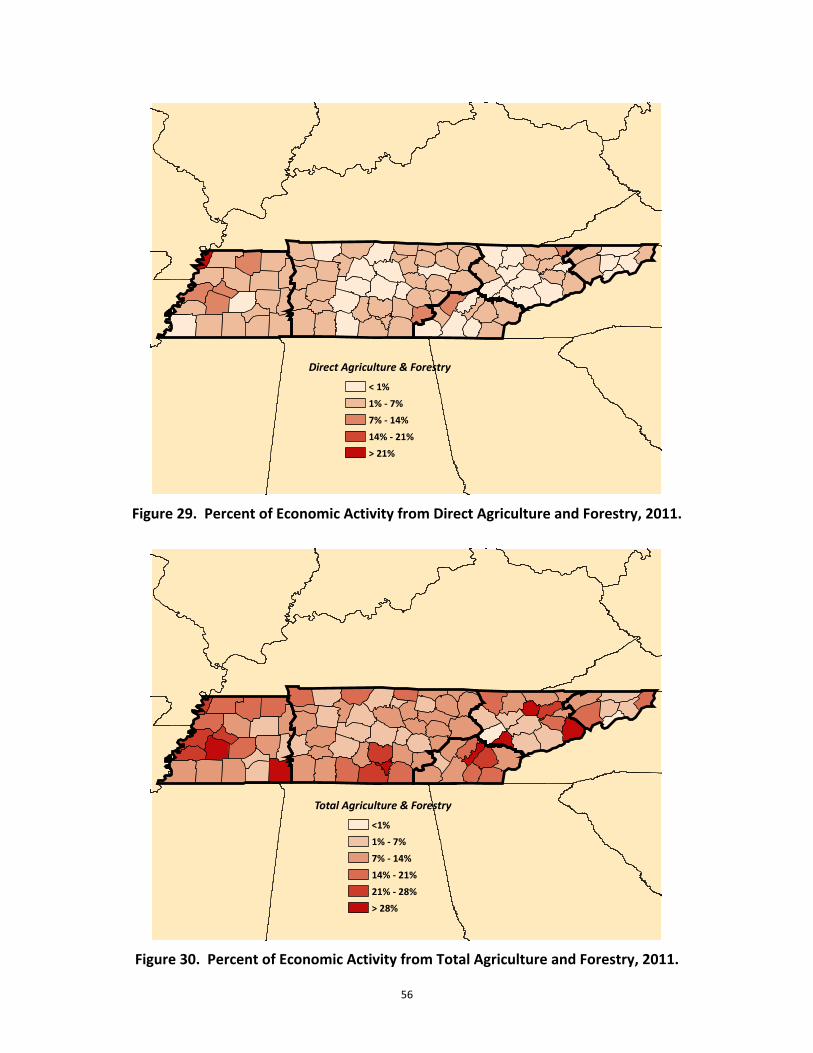
56
Figure 29. Percent of Economic Activity from Direct Agriculture and Forestry, 2011.
Figure 30. Percent of Economic Activity from Total Agriculture and Forestry, 2011.
Direct Agriculture & Forestry
< 1%
1% ‐ 7%
7% ‐ 14%
14% ‐ 21%
> 21%
Total Agriculture & Forestry
<1%
1% ‐ 7%
7% ‐ 14%
14% ‐ 21%
21% ‐ 28%
> 28%

57
level of economic activity for each county. Direct agriculture included crop production and
livestock breeding and feeding, whereas direct forestry included the management and logging
of trees. Total agriculture included direct agriculture, plus the input supplying industries and
secondary agriculture, which included manufacturing. Likewise, total forestry included direct
forestry, plus input supplying industries and secondary forestry. Lake County in the Memphis
Region and Bledsoe County in the Chattanooga Region had the highest level of economic
activity for direct agriculture at 25.0 percent and 9.4 percent, respectively (Table 19); for total
agriculture, Moore County in the Nashville Region and Loudon County in the Knoxville Region
had the highest level at 85.0 percent and 38.1 percent, respectively. For direct forestry, Van
Buren County in the Nashville Region had the highest level of economic activity at 2.5 percent;
for total forestry, Hardin County in the Memphis Region had the highest level at 33.0 percent.
Likewise, for both agriculture and forestry combined, Lake County in the Memphis Region (25.0
percent direct) and Moore County (85.0 percent total) in the Nashville Region had the largest
levels of economic activity.
Table 19. Counties with the Highest Proportion of Economic Activity for Agriculture and Forestry by Analysis Region, 2011 Region and County
Chattanooga %
Knoxville
%
Memphis
%
Nashville
%
Tri‐Cities
%
Agriculture: Direct Bledsoe 9.4 Hancock 7.2 Lake 25.0 Grundy 8.6 Greene 1.5 Total Meigs 32.1 Loudon 38.1 Haywood 31.5 Moore 85.0 Greene 13.0Forestry:
Direct Sequatchie 0.3 Claiborne 0.2 Hardeman 0.9Van Buren 2.5 Hawkins 0.2
Total McMinn 15.2 Grainger 17.8 Hardin 33.0 Wayne 10.0 Greene 5.4Combined: Direct Bledsoe 9.5 Hancock 7.2 Lake 25.0 Grundy 10.4 Hawkins 1.6 Total Meigs 34.8 Loudon 38.3 Hardin 34.8 Moore 85.0 Greene 18.4

58
Tennessee Agriculture and Forestry Tax Impacts
Actual Tennessee revenue for 2010‐2011 was estimated at $10.5 billion in the form of
taxes, and $1.6 billion in the form of fees and fines (TN Department of Finance &
Administration, 2013). Based on the IMPLAN data for Tennessee in 2011, tax impacts at the
state and local level as a result of direct and multiplier effects for agriculture and forestry
(includes the production and processing of agricultural and forest products and the input
suppliers of these products) are estimated at $2.27 billion (Table 20). An additional $2.9 billion
is generated for the federal government. Agriculture tax revenues are estimated at $1.8 billion
for state/local and $1.9 billion for federal; for forestry, $0.5 billion in tax revenues are
generated for state/local and close to $1.0 billion in federal. For state/local tax revenues,
Table 20. Estimated State/Local and Federal Tax Revenues from Tennessee Agriculture and Forestry, 2011
State & Local Revenues Federal Revenues
(Million $) Agriculture1 Indirect Business Taxes2 $1,659.1 $169.5 Corporate Profits Taxes3 $75.0 $415.5 Personal (Household) Taxes4 $48.8 $1,327.2
Total $1,782.9 $1,912.2 Forestry1 Indirect Business Taxes2 $430.2 $43.9 Corporate Profits Taxes3 $27.1 $150.1 Personal (Household) Taxes4 $29.9 $802.3
Total $487.2 $996.3 Agriculture & Forestry Total $2,270.1 $2,908.5
1 Includes the production and processing of agricultural and forest products and the input suppliers of these products. 2 For state, sales taxes, property taxes, motor vehicle licenses taxes, severance taxes, other taxes, and state/local non‐taxes (rents, royalties, special assessments, fines, settlements, and donations); for federal, excise taxes, custom duty taxes, and non‐taxes. 3 Includes dividends and corporate profits tax. 4 For state, income taxes, non‐taxes (fines & fees), motor vehicle license taxes, property taxes, and other taxes (fishing/hunting); for federal, income taxes. Source: Source: Minnesota IMPLAN Group, Inc., 2011a and 2012
59
indirect business taxes for both agriculture and forestry have the largest value; for federal tax
revenues, personal taxes have the largest value.
Summary and Conclusion
Input‐output modeling is useful for evaluating and analyzing information on the
interrelationships of a regional economy and impacts of changes on that economy. The model
is a useful planning tool for policy‐makers in evaluating potential impacts of their decisions
concerning agriculture and forestry industries for the state. For this analysis, a baseline for
2011 was developed using Tennessee Agricultural Statistics Service information, along with the
Minnesota IMPLAN Group’s input‐output model information. The state was divided into five
trade regions. These five regions will be used in future analyses to gauge the performance of
individual sectors and the impacts of new sectors to the state’s agro‐forestry industrial
complex.
Comparing agricultural data for 2009 and 2011 revealed that most of Tennessee’s crops
harvested increased with the exception of soybeans, wheat, tomatoes, and hay. Crop prices
also increased for all the crops examined in this report (Table 6). Livestock and livestock
products increased for eggs and only slightly increased for cattle and calves and broilers during
that timeframe. Livestock prices also increased for livestock and livestock products examined
(Table 5). Below average rainfall occurred in the state for the years 2008 and 2010 followed by
above normal rainfall for the years 2009 and 2011 (Figure 11).
In 2011, agriculture and forestry contributed to 13.3 percent of Tennessee’s total
economy. The agro‐forestry industrial complex included the primary industries typically
associated with agriculture and forest operations such as crop production, livestock breeding

60
and feeding, and the management and logging of trees. Also included in the industrial complex
were the input supplying industries and value‐added subsectors, which included food and
beverage manufacturing, apparel and textiles, and forestry products manufacturing. In 2011,
the agro‐forestry industrial complex contributed $66.4 billion to the Tennessee economy and
employed an estimated 337,880 individuals.
Agriculture, a subset of Tennessee’s agro‐forestry industrial complex, included farming
and related industries, as well as value‐added food and fiber production, processing and
manufacturing. Agriculture accounted for 9.3 percent of the state’s economy and generated
$46.7 billion in output. Close to 247,000 Tennesseans, with over 106,000 in the production
sector (both full‐ and part‐time), were employed in agriculture.
Forestry included the management and logging of trees; sawmills (primary forestry
products), including pulp and paper mills, plus forestry products manufacturing (secondary
forestry products). Forestry accounted for 4.0 percent of the state’s economy, employed close
to 91,000 Tennesseans, and generated close to $20.0 billion in output.
From a regional perspective, the agro‐forestry industrial complex was more important
to the Memphis and Chattanooga Regions relative to other regions in the state followed by the
Nashville, Knoxville, and Tri‐Cities Regions (Table 21). The Memphis Region contributed the
largest amount of economic activity, $22.1 billion, representing 17.2 percent of the total for the
region.
When comparing county level total economic activity (across all industries) with county
level agricultural economic activity, the counties with the highest percentage levels were
Moore (85.0 percent) in the Nashville Region, Loudon (38.1 percent) in the Knoxville Region,
Meigs (32.1 percent) in the Chattanooga Region, Haywood (31.5 percent) in the Memphis
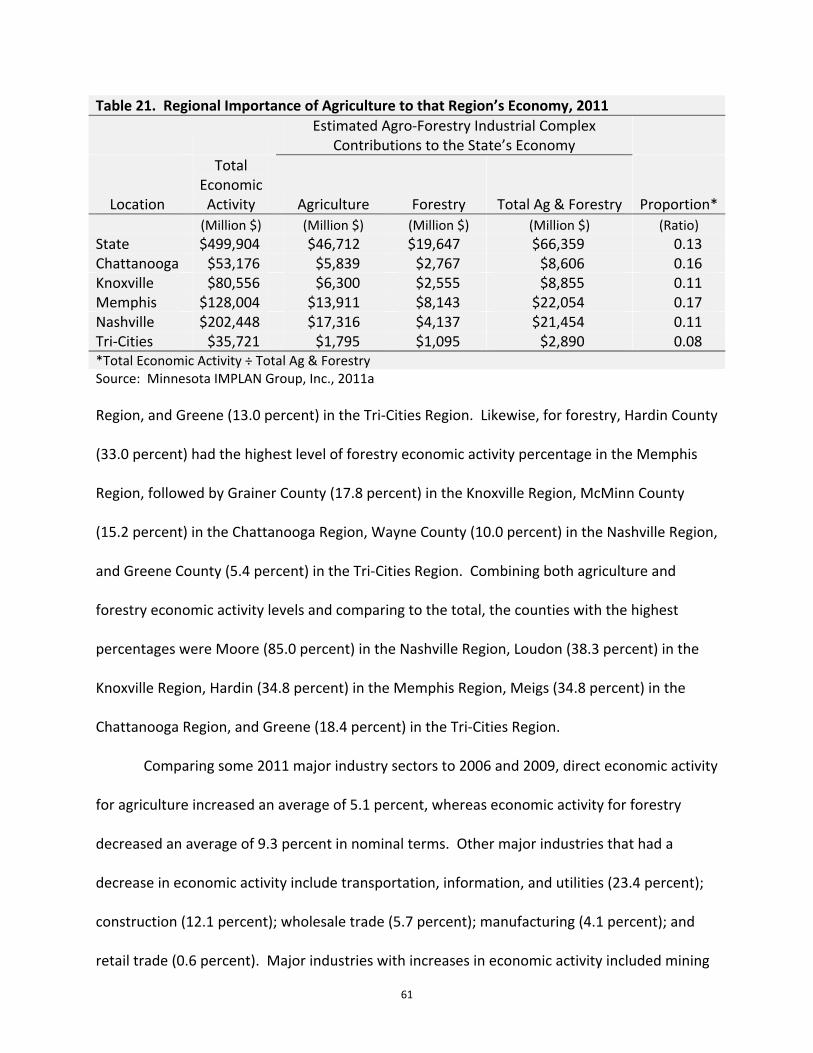
61
Table 21. Regional Importance of Agriculture to that Region’s Economy, 2011
Estimated Agro‐Forestry Industrial Complex
Contributions to the State’s Economy
Location
Total Economic Activity Agriculture Forestry Total Ag & Forestry Proportion*
(Million $) (Million $) (Million $) (Million $) (Ratio)
State $499,904 $46,712 $19,647 $66,359 0.13 Chattanooga $53,176 $5,839 $2,767 $8,606 0.16 Knoxville $80,556 $6,300 $2,555 $8,855 0.11 Memphis $128,004 $13,911 $8,143 $22,054 0.17 Nashville $202,448 $17,316 $4,137 $21,454 0.11 Tri‐Cities $35,721 $1,795 $1,095 $2,890 0.08 *Total Economic Activity ÷ Total Ag & Forestry Source: Minnesota IMPLAN Group, Inc., 2011a
Region, and Greene (13.0 percent) in the Tri‐Cities Region. Likewise, for forestry, Hardin County
(33.0 percent) had the highest level of forestry economic activity percentage in the Memphis
Region, followed by Grainer County (17.8 percent) in the Knoxville Region, McMinn County
(15.2 percent) in the Chattanooga Region, Wayne County (10.0 percent) in the Nashville Region,
and Greene County (5.4 percent) in the Tri‐Cities Region. Combining both agriculture and
forestry economic activity levels and comparing to the total, the counties with the highest
percentages were Moore (85.0 percent) in the Nashville Region, Loudon (38.3 percent) in the
Knoxville Region, Hardin (34.8 percent) in the Memphis Region, Meigs (34.8 percent) in the
Chattanooga Region, and Greene (18.4 percent) in the Tri‐Cities Region.
Comparing some 2011 major industry sectors to 2006 and 2009, direct economic activity
for agriculture increased an average of 5.1 percent, whereas economic activity for forestry
decreased an average of 9.3 percent in nominal terms. Other major industries that had a
decrease in economic activity include transportation, information, and utilities (23.4 percent);
construction (12.1 percent); wholesale trade (5.7 percent); manufacturing (4.1 percent); and
retail trade (0.6 percent). Major industries with increases in economic activity included mining

62
(26.8 percent); services (16.6 percent); government (14.7 percent); and finance, insurance, and
real estate (3.0 percent).
63
Literature Cited
Clatterbuck, Wayne. 2013. “Tennessee Forest Resource Statistics, 2012.” Forestry, Wildlife & Fisheries Update Newsletter. The University of Tennessee Extension. January, 2013.
English, B., K. Jensen, and J. Menard. 2001. “Economic Impacts of Agriculture and Forestry in
Tennessee, 1997.” Research Series 04‐01. Available at http://aimag.ag.utk.edu/ pubimpact.html.
English, B., K. Jensen, and J. Menard. 2003. “Economic Impacts of Agriculture and Forestry in
Tennessee, 2000.” Research Series 02‐03. Available at http://aimag.ag.utk.edu/ pubimpact.html.
Leontief, Wassily. 1936. “Quantitative Input and Output Relations in the Economic System of
the United States.” Review of Economics and Statistics 18(3):105‐125. Lindall, S., D. Olson, and G. Alward. 2006. “Deriving Multi‐Regional Models Using the IMPLAN
National Trade Flows Model”. The Journal of Regional Analysis & Policy 36(1):76‐83. Menard, J., B. English, and K. Jensen. 2006. “Economic Impacts of Agriculture and Forestry in
Tennessee, 2003.” Available at http://aimag.ag.utk.edu/pubimpact.html. Menard, J., B. English, and K. Jensen. 2009. “Economic Impacts of Agriculture and Forestry in
Tennessee, 2006.” Available at http://aimag.ag.utk.edu/pubimpact.html. Menard, J., B. English, and K. Jensen. 2011. “Economic Impacts of Agriculture and Forestry in
Tennessee, 2006.” Available at http://aimag.ag.utk.edu/pubimpact.html. Minnesota IMPLAN Group, Inc. 2011a. “2011 County Level Data.” IMPLAN System (data and
software), 502 2nd Street, Suite 301, Hudson, WI 54016. Available at http://www. implan.com/.
Minnesota IMPLAN Group, Inc. 2011b. “Sectoring Schemes.” IMPLAN System (data and
software), 502 2nd Street, Suite 301, Hudson, WI 54016. Available at http://implan. com/V4/index.php?option=com_content&view=article&id=633%3A633&catid=241%3AKB23&Itemid=1.
Minnesota IMPLAN Group, Inc. 2012. “Tax Impact Report – Generation and Interpretation of
IMPLAN’s Tax Impact Report.” IMPLAN System (data and software), 502 2nd Street, Suite 301, Hudson, WI 54016. Available at http://implan.com/V4/index.php?option= com_docman&task=cat_view&gid=144&Itemid=60.
Olson, D. and S. Lindall. 1999. “IMPLAN Professional Software, Analysis, and Data Guide.”
Minnesota IMPLAN Group, Inc., 502 2nd Street, Suite 301, Hudson, WI 54016. Available at http://www.implan.com/.

64
Pyatt, G., and J. Round. 1985. “Social Accounting Matrices, A Basis for Planning.” The World Bank, Washington, D.C.
Tennessee Department of Agriculture, Division of Forestry. 2011. “Plan 2020: Harvest Plan for
Sustainable State Forests.” Available at http://www.tn.gov/agriculture/forestry/ sf2020plan.shtml.
Tennessee Department of Agriculture. 2010. “Tennessee Agriculture 2010.” Department
Report & Statistical Summary. Available at http://www.tennessee.gov/agriculture/ publications/annualreport/annualreport.pdf.
Tennessee Department of Agriculture. 2012. “Tennessee Agriculture 2012.” Department
Report & Statistical Summary. Available at http://www.tennessee.gov/agriculture/ publications/annualreport/annualreport.pdf.
Tennessee Department of Finance & Administration. 2013. “The Budget, Fiscal Year 2012‐
2013.” Budget Document Archive. Available at http://www.tn.gov/finance/bud/archive .shtml.
U.S. Census Bureau. 2002. North American Industry Classification System (NAICS). Available at
http://www.census.gov/eos/www/naics/. U.S. Census Bureau. 2007. North American Industry Classification System (NAICS). Available at
http://www.census.gov/eos/www/naics/. U.S. Census Bureau. 2010. “2010 County Business Patterns (NAICS).” Censtats Databases.
Available at http://censtats.census.gov/. U.S. Census Bureau. 2011. “Statistics for All Manufacturing by State: 2011 and 2010.” Annual
Survey of Manufacturers, Geographic Area Statistics. Available at http://factfinder2. census.gov/faces/tableservices/jsf/pages/productview.xhtml?pid=ASM_2011_31AS101&prodType=table.
U.S. Census Bureau. 2012. North American Industry Classification System (NAICS). Available at
http://www.census.gov/eos/www/naics/. U.S. Department of Agriculture, Economic Research Service. 2012. “State Export Data.”
Available at http://www.ers.usda.gov/data‐products/state‐export‐data.aspx. U.S. Department of Agriculture, Forest Service. 2013. “Forest Inventory Data Online (FIDO)”
Available at http://apps.fs.fed.us/fido/. U.S. Department of Agriculture, National Agricultural Statistical Service. 2007a. “Tennessee
State and County Data.” 2007 Census of Agriculture Report. Volume 1, Geographic Area Series, Part 42. Available at http://www.agcensus.usda.gov/Publications/2007/ Full_Report/Census_by_State/Tennessee/index.asp.

65
U.S. Department of Agriculture, National Agricultural Statistical Service. 2007b. “U.S. National Level Data.” 2007 Census of Agriculture Report. Volume 1. Available at http://www. agcensus.usda.gov/Publications/2007/Full_Report/Volume_1,_Chapter_1_US/.
U.S. Department of Agriculture, National Agricultural Statistical Service. 2012. “Poultry—
Production and Value, 2011 Summary.” Available at http://usda.mannlib.cornell.edu/ MannUsda/viewDocumentInfo.do?documentID=1130.
U.S. Department of Commerce, Bureau of Economic Analysis. 2011a. “BEA Economic Areas
(EAs).” Regional Economic Accounts, Component Counties. Available at http://www. bea.gov/regional/docs/econlist.cfm.
U.S. Department of Commerce, Bureau of Economic Analysis. 2011b. Industry Economic
Accounts, Benchmark Input‐Output Data, 2002 Data Files. Available at http://www.bea.gov/industry/io_benchmark.htm.
U.S. Department of Commerce, International Trade Administration (ITA). 2011. “TradeStats
ExpressTM Home.” State Export Data, Office of Trade and Industry Information, Manufacturing and Services. Available at http://tse.export.gov/TSE/TSEHome.aspx.
U.S. Department of Commerce. 2011. National Climatic Data Center, NOAA Environmental
Satellite, Data, and Information Service. Available at http://www7.ncdc.noaa.gov/CDO/ CDODivisionalSelect.jsp.

66
Appendix A: IMPLAN Methodology

67
Input‐output model results from previous studies (English, Jensen, and Menard, 2001
and 2003) in this series were based on the Standard Industrial Classification (SIC) system as
defined by the United States Census Bureau. Beginning in 2006 (Menard, English, and Jensen),
results are based on the North American Industrial Classification System (NAICS) (Census NAICS,
2002, 2007, 2012). The reader is cautioned to not compare industry sector level results from
the previous studies using the SIC system with the results from this most recent study using
NAICS. For readers who are interested in time series data, this creates a problem since many
industries are grouped in different or entirely new categories.
Like the previous analysis conducted for 2009, this analysis uses IMPLAN Version 3.0.
IMPLAN’s sectoring scheme relies on the Bureau of Economic (BEA) Analysis’s Benchmark input‐
output study (Minnesota IMPLAN Group, 2011b; USDOC, 2011b). When a new BEA Benchmark
is released, the IMPLAN sectoring scheme requires modification. Previous studies used IMPLAN
Pro 2.0 and had either a 528 or 509 industrial sectoring scheme. With the release of the 2002
Benchmark, which is what IMPLAN Version 3.0 uses and affects the IMPLAN 2007 data release
year, a 440 industrial sectoring scheme is used.
IMPLAN employs a regional social accounting system and can be used to generate a set
of balanced economic/social accounts and multipliers. The social accounting system is an
extension of input‐output analysis.3 Input‐output analysis can provide important and timely
information on the interrelationships in a regional economy and the impacts of changes on that
economy. Input‐output analysis has been expanded beyond market‐based transaction
accounting to include non‐market financial flows by using a social accounting matrix or SAM
3 Input‐output (I‐O) analysis, also known as inter‐industry analysis, is the name given to an analytical work conducted by Wassily Leontief (1936) in the late 1930’s. The fundamental purpose of the I‐O framework is to analyze the interdependence of industries in an economy through market‐based transactions.
68
framework (Pyatt and Round, 1985). The model describes the transfer of money between
industries and institutions and contains both market‐based transactions and non‐market
financial flows, such as inter‐institutional transfers (see Figure A.1). The ‘Make’ and ‘Use’
components of the SAM include the commodities made and used by industries. Factors
represent the value‐added by industries, including wages and compensation to workers,
interest, profits, and indirect business taxes. Capital includes expenditures made by industries
and institutions to obtain equipment and construction. The SAM takes into account corporate
profits as ‘Enterprises’. The SAM also accounts for non‐industrial financial flows, including
factor exports and imports, institution exports, factor distribution, and inter‐institutional
transfers. Factor exports include payments reimbursed from outside the region for exports less
the payments for imports. Institutional exports would include situations such as jobs
commuting outside the region. Factor distributions are payments from the factor sectors to
institutions, such as households or governments. Inter‐institutional transfers include payments
between institutions, such as federal government grants to state governments, welfare, social
security payments, and taxes paid to governments.

69
Total
Total Industry
Income
Total
Commodity
Income
Total Factor
Income
Total
Institutional
Income
Total
Enterprise
Income
Total Capital
Income
Total Trade
Income
Trad
e
Exports
Exports
Exports
Exports
Exports
Total
Trade
Exports
Cap
ital
Consumption
Transfers
Transfers
Total Capital
Outlay
Enterprises
Transfers
Total
Enterprise
Outlay
Institutions
Consumption
Transfers
Imports
Total
Institution
Outlay
Figure A.1. So
cial Accounting Matrix Fram
ework
Source: Olson and Lindall, 1999.
Factors
Transfers
Factor
Trade
Total
Factor
Outlay
Commodity
Make
Sales
Total
Commodity
Outlay
Industry
Use
Value
Added
Imports
Total
Industry
Outlay
Industry
Commodity
Factors
Institutions
Enterprises
Cap
ital
Trad
e
Total

70
Appendix B: IMPLAN Sectors with Descriptions
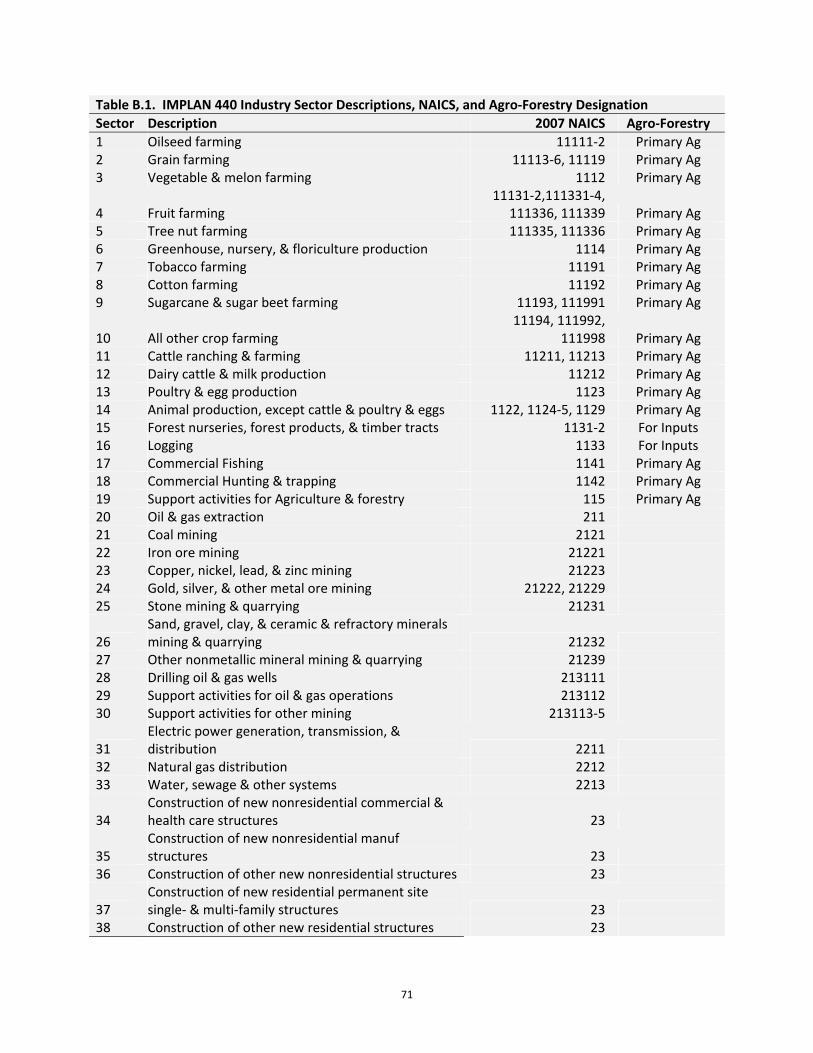
71
Table B.1. IMPLAN 440 Industry Sector Descriptions, NAICS, and Agro‐Forestry Designation
Sector Description 2007 NAICS Agro‐Forestry
1 Oilseed farming 11111‐2 Primary Ag 2 Grain farming 11113‐6, 11119 Primary Ag 3 Vegetable & melon farming 1112 Primary Ag
4 Fruit farming 11131‐2,111331‐4,
111336, 111339 Primary Ag 5 Tree nut farming 111335, 111336 Primary Ag 6 Greenhouse, nursery, & floriculture production 1114 Primary Ag 7 Tobacco farming 11191 Primary Ag 8 Cotton farming 11192 Primary Ag 9 Sugarcane & sugar beet farming 11193, 111991 Primary Ag
10 All other crop farming 11194, 111992,
111998 Primary Ag 11 Cattle ranching & farming 11211, 11213 Primary Ag 12 Dairy cattle & milk production 11212 Primary Ag 13 Poultry & egg production 1123 Primary Ag 14 Animal production, except cattle & poultry & eggs 1122, 1124‐5, 1129 Primary Ag 15 Forest nurseries, forest products, & timber tracts 1131‐2 For Inputs 16 Logging 1133 For Inputs 17 Commercial Fishing 1141 Primary Ag 18 Commercial Hunting & trapping 1142 Primary Ag 19 Support activities for Agriculture & forestry 115 Primary Ag 20 Oil & gas extraction 211 21 Coal mining 2121 22 Iron ore mining 21221 23 Copper, nickel, lead, & zinc mining 21223 24 Gold, silver, & other metal ore mining 21222, 21229 25 Stone mining & quarrying 21231
26 Sand, gravel, clay, & ceramic & refractory minerals mining & quarrying 21232
27 Other nonmetallic mineral mining & quarrying 21239 28 Drilling oil & gas wells 213111 29 Support activities for oil & gas operations 213112 30 Support activities for other mining 213113‐5
31 Electric power generation, transmission, & distribution 2211
32 Natural gas distribution 2212 33 Water, sewage & other systems 2213
34 Construction of new nonresidential commercial & health care structures 23
35 Construction of new nonresidential manuf structures 23
36 Construction of other new nonresidential structures 23
37 Construction of new residential permanent site single‐ & multi‐family structures 23
38 Construction of other new residential structures 23
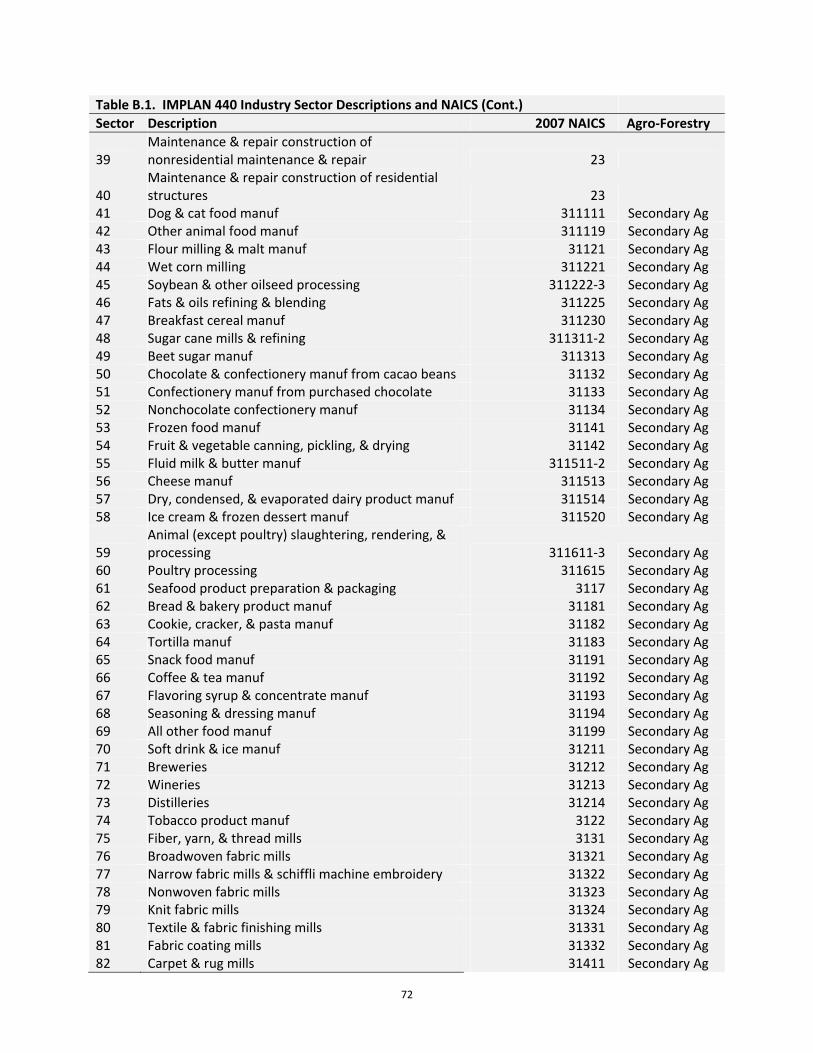
72
Table B.1. IMPLAN 440 Industry Sector Descriptions and NAICS (Cont.)
Sector Description 2007 NAICS Agro‐Forestry
39 Maintenance & repair construction of nonresidential maintenance & repair 23
40 Maintenance & repair construction of residential structures 23
41 Dog & cat food manuf 311111 Secondary Ag 42 Other animal food manuf 311119 Secondary Ag 43 Flour milling & malt manuf 31121 Secondary Ag 44 Wet corn milling 311221 Secondary Ag 45 Soybean & other oilseed processing 311222‐3 Secondary Ag 46 Fats & oils refining & blending 311225 Secondary Ag 47 Breakfast cereal manuf 311230 Secondary Ag 48 Sugar cane mills & refining 311311‐2 Secondary Ag 49 Beet sugar manuf 311313 Secondary Ag 50 Chocolate & confectionery manuf from cacao beans 31132 Secondary Ag 51 Confectionery manuf from purchased chocolate 31133 Secondary Ag 52 Nonchocolate confectionery manuf 31134 Secondary Ag 53 Frozen food manuf 31141 Secondary Ag 54 Fruit & vegetable canning, pickling, & drying 31142 Secondary Ag 55 Fluid milk & butter manuf 311511‐2 Secondary Ag 56 Cheese manuf 311513 Secondary Ag 57 Dry, condensed, & evaporated dairy product manuf 311514 Secondary Ag 58 Ice cream & frozen dessert manuf 311520 Secondary Ag
59 Animal (except poultry) slaughtering, rendering, & processing 311611‐3 Secondary Ag
60 Poultry processing 311615 Secondary Ag 61 Seafood product preparation & packaging 3117 Secondary Ag 62 Bread & bakery product manuf 31181 Secondary Ag 63 Cookie, cracker, & pasta manuf 31182 Secondary Ag 64 Tortilla manuf 31183 Secondary Ag 65 Snack food manuf 31191 Secondary Ag 66 Coffee & tea manuf 31192 Secondary Ag 67 Flavoring syrup & concentrate manuf 31193 Secondary Ag 68 Seasoning & dressing manuf 31194 Secondary Ag 69 All other food manuf 31199 Secondary Ag 70 Soft drink & ice manuf 31211 Secondary Ag 71 Breweries 31212 Secondary Ag 72 Wineries 31213 Secondary Ag 73 Distilleries 31214 Secondary Ag 74 Tobacco product manuf 3122 Secondary Ag 75 Fiber, yarn, & thread mills 3131 Secondary Ag 76 Broadwoven fabric mills 31321 Secondary Ag 77 Narrow fabric mills & schiffli machine embroidery 31322 Secondary Ag 78 Nonwoven fabric mills 31323 Secondary Ag 79 Knit fabric mills 31324 Secondary Ag 80 Textile & fabric finishing mills 31331 Secondary Ag 81 Fabric coating mills 31332 Secondary Ag 82 Carpet & rug mills 31411 Secondary Ag
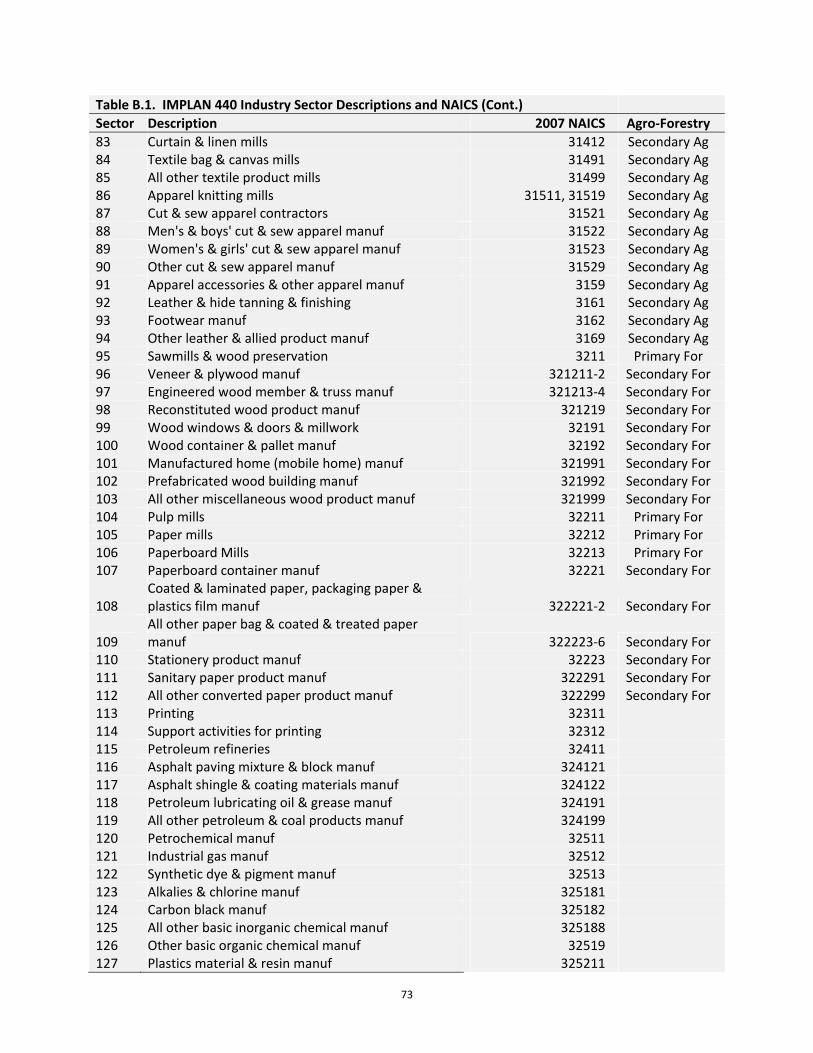
73
Table B.1. IMPLAN 440 Industry Sector Descriptions and NAICS (Cont.)
Sector Description 2007 NAICS Agro‐Forestry
83 Curtain & linen mills 31412 Secondary Ag 84 Textile bag & canvas mills 31491 Secondary Ag 85 All other textile product mills 31499 Secondary Ag 86 Apparel knitting mills 31511, 31519 Secondary Ag 87 Cut & sew apparel contractors 31521 Secondary Ag 88 Men's & boys' cut & sew apparel manuf 31522 Secondary Ag 89 Women's & girls' cut & sew apparel manuf 31523 Secondary Ag 90 Other cut & sew apparel manuf 31529 Secondary Ag 91 Apparel accessories & other apparel manuf 3159 Secondary Ag 92 Leather & hide tanning & finishing 3161 Secondary Ag 93 Footwear manuf 3162 Secondary Ag 94 Other leather & allied product manuf 3169 Secondary Ag 95 Sawmills & wood preservation 3211 Primary For 96 Veneer & plywood manuf 321211‐2 Secondary For 97 Engineered wood member & truss manuf 321213‐4 Secondary For 98 Reconstituted wood product manuf 321219 Secondary For 99 Wood windows & doors & millwork 32191 Secondary For 100 Wood container & pallet manuf 32192 Secondary For 101 Manufactured home (mobile home) manuf 321991 Secondary For 102 Prefabricated wood building manuf 321992 Secondary For 103 All other miscellaneous wood product manuf 321999 Secondary For 104 Pulp mills 32211 Primary For 105 Paper mills 32212 Primary For 106 Paperboard Mills 32213 Primary For 107 Paperboard container manuf 32221 Secondary For
108 Coated & laminated paper, packaging paper & plastics film manuf 322221‐2 Secondary For
109 All other paper bag & coated & treated paper manuf 322223‐6 Secondary For
110 Stationery product manuf 32223 Secondary For 111 Sanitary paper product manuf 322291 Secondary For 112 All other converted paper product manuf 322299 Secondary For 113 Printing 32311 114 Support activities for printing 32312 115 Petroleum refineries 32411 116 Asphalt paving mixture & block manuf 324121 117 Asphalt shingle & coating materials manuf 324122 118 Petroleum lubricating oil & grease manuf 324191 119 All other petroleum & coal products manuf 324199 120 Petrochemical manuf 32511 121 Industrial gas manuf 32512 122 Synthetic dye & pigment manuf 32513 123 Alkalies & chlorine manuf 325181 124 Carbon black manuf 325182 125 All other basic inorganic chemical manuf 325188 126 Other basic organic chemical manuf 32519 127 Plastics material & resin manuf 325211

74
Table B.1. IMPLAN 440 Industry Sector Descriptions and NAICS (Cont.)
Sector Description 2007 NAICS Agro‐Forestry
128 Synthetic rubber manuf 325212 129 Artificial & synthetic fibers & filaments manuf 32522 130 Fertilizer manuf 325311‐4 Ag Inputs 131 Pesticide & other agricultural chemical manuf 325320 Ag Inputs 132 Medicinal & botanical manuf 325411 133 Pharmaceutical preparation manuf 325412 134 In‐vitro diagnostic substance manuf 325413 135 Biological product (except diagnostic) manuf 325414 136 Paint & coating manuf 32551 137 Adhesive manuf 32552 138 Soap & cleaning compound manuf 32561 139 Toilet preparation manuf 32562 140 Printing ink manuf 32591 141 All other chemical product & preparation manuf 32592, 32599
142 Plastics packaging materials & unlaminated film & sheet manuf 32611
143 Unlaminated plastics profile shape manuf 326121 144 Plastics pipe & pipe fitting manuf 326122
145 Laminated plastics plate, sheet (except packaging), & shape manuf 32613
146 Polystyrene foam product manuf 32614
147 Urethane & other foam product (except polystyrene) manuf 32615
148 Plastics bottle manuf 32616 149 Other plastics product manuf 32619 150 Tire manuf 32621 151 Rubber & plastics hoses & belting manuf 32622 152 Other rubber product manuf 32629 153 Pottery, ceramics, & plumbing fixture manuf 32711 154 Brick, tile, & other structural clay product manuf 327121‐3 155 Clay & nonclay refractory manuf 327124‐5 156 Flat glass manuf 327211 157 Other pressed & blown glass & glassware manuf 327212 158 Glass container manuf 327213 159 Glass product manuf made of purchased glass 327215 160 Cement manuf 32731 161 Ready‐mix concrete manuf 32732 162 Concrete pipe, brick, & block manuf 32733 163 Other concrete product manuf 32739 164 Lime & gypsum product manuf 3274 Ag Inputs 165 Abrasive product manuf 32791 166 Cut stone & stone product manuf 327991 167 Ground or treated mineral & earth manuf 327992 168 Mineral wool manuf 327993 169 Miscellaneous nonmetallic mineral products 327999 170 Iron & steel mills & ferroalloy manuf 3311 171 Steel product manuf from purchased steel 33121, 33122

75
Table B.1. IMPLAN 440 Industry Sector Descriptions and NAICS (Cont.)
Sector Description 2007 NAICS Agro‐Forestry
172 Alumina refining & primary aluminum production 331311‐2 173 Secondary smelting & alloying of aluminum 331314
174 Aluminum product manuf from purchased aluminum
331315, 331316, 331319
175 Primary smelting & refining of copper 331411
176 Primary smelting & refining of nonferrous metal (except copper & aluminum) 331419
177 Copper rolling, drawing, extruding & alloying 33142
178 Nonferrous metal (except copper & aluminum) rolling, drawing, extruding & alloying 33149
179 Ferrous metal foundries 33151 180 Nonferrous metal foundries 33152 181 All other forging, stamping, & sintering 332111‐2, 332117 182 Custom roll forming 332114 183 Crown & closure manuf & metal stamping 332115‐6 184 Cutlery, utensil, pot, & pan manuf 332211, 332214 185 Handtool manuf 332212‐3 186 Plate work & fabricated structural product manuf 33231 187 Ornamental & architectural metal products manuf 33232 188 Power boiler & heat exchanger manuf 33241 189 Metal tank (heavy gauge) manuf 33242
190 Metal can, box, & other metal container (light gauge) manuf 33243
191 Ammunition manuf 332992‐3 192 Arms, ordnance, & accessories manuf 332994‐5 193 Hardware manuf 3325 194 Spring & wire product manuf 3326 195 Machine shops 33271 196 Turned product & screw, nut, & bolt manuf 33272 197 Coating, engraving, heat treating & allied activities 3328 198 Valve & fittings other than plumbing 332911‐2, 332919 199 Plumbing fixture fitting & trim manuf 332913 200 Ball & roller bearing manuf 332991 201 Fabricated pipe & pipe fitting manuf 332996 202 Other fabricated metal manuf 332997‐9 203 Farm machinery & equipment manuf 333111 Ag Inputs 204 Lawn & garden equipment manuf 333112 Ag Inputs 205 Construction machinery manuf 33312 206 Mining & oil & gas field machinery manuf 33313
207 Other industrial machinery manuf 33321, 333291‐4,
333298 208 Plastics & rubber industry machinery manuf 33322 209 Semiconductor machinery manuf 333295
210 Vending, commercial, industrial, & office machinery manuf 333311‐3
211 Optical instrument & lens manuf 333314 212 Photographic & photocopying equipment manuf 333315
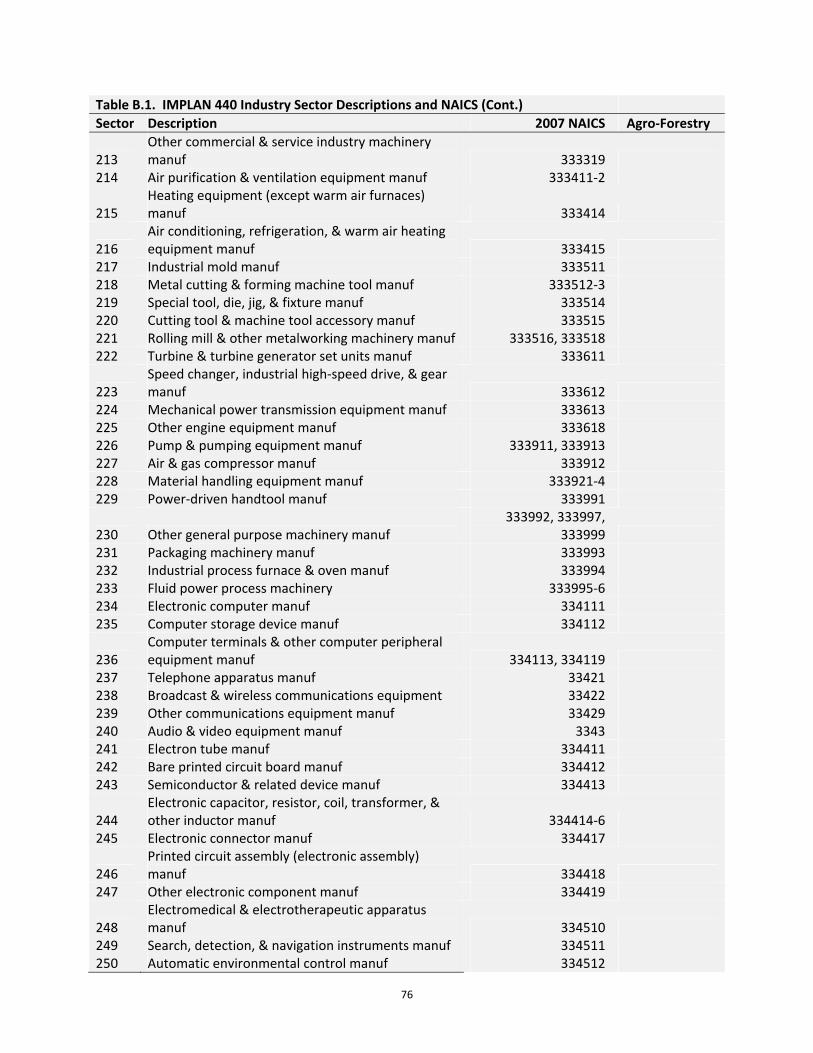
76
Table B.1. IMPLAN 440 Industry Sector Descriptions and NAICS (Cont.)
Sector Description 2007 NAICS Agro‐Forestry
213 Other commercial & service industry machinery manuf 333319
214 Air purification & ventilation equipment manuf 333411‐2
215 Heating equipment (except warm air furnaces) manuf 333414
216 Air conditioning, refrigeration, & warm air heating equipment manuf 333415
217 Industrial mold manuf 333511 218 Metal cutting & forming machine tool manuf 333512‐3 219 Special tool, die, jig, & fixture manuf 333514 220 Cutting tool & machine tool accessory manuf 333515 221 Rolling mill & other metalworking machinery manuf 333516, 333518 222 Turbine & turbine generator set units manuf 333611
223 Speed changer, industrial high‐speed drive, & gear manuf 333612
224 Mechanical power transmission equipment manuf 333613 225 Other engine equipment manuf 333618 226 Pump & pumping equipment manuf 333911, 333913 227 Air & gas compressor manuf 333912 228 Material handling equipment manuf 333921‐4 229 Power‐driven handtool manuf 333991
230 Other general purpose machinery manuf 333992, 333997,
333999 231 Packaging machinery manuf 333993 232 Industrial process furnace & oven manuf 333994 233 Fluid power process machinery 333995‐6 234 Electronic computer manuf 334111 235 Computer storage device manuf 334112
236 Computer terminals & other computer peripheral equipment manuf 334113, 334119
237 Telephone apparatus manuf 33421 238 Broadcast & wireless communications equipment 33422 239 Other communications equipment manuf 33429 240 Audio & video equipment manuf 3343 241 Electron tube manuf 334411 242 Bare printed circuit board manuf 334412 243 Semiconductor & related device manuf 334413
244 Electronic capacitor, resistor, coil, transformer, & other inductor manuf 334414‐6
245 Electronic connector manuf 334417
246 Printed circuit assembly (electronic assembly) manuf 334418
247 Other electronic component manuf 334419
248 Electromedical & electrotherapeutic apparatus manuf 334510
249 Search, detection, & navigation instruments manuf 334511 250 Automatic environmental control manuf 334512

77
Table B.1. IMPLAN 440 Industry Sector Descriptions and NAICS (Cont.)
Sector Description 2007 NAICS Agro‐Forestry
251 Industrial process variable instruments manuf 334513 252 Totalizing fluid meters & counting devices manuf 334514 253 Electricity & signal testing instruments manuf 334515 254 Analytical laboratory instrument manuf 334516 255 Irradiation apparatus manuf 334517
256 Watch, clock, & other measuring & controlling device manuf 334518‐9
257 Software, audio, & video media reproducing 334611‐2 258 Magnetic & optical recording media manuf 334613 259 Electric lamp bulb & part manuf 33511 260 Lighting fixture manuf 33512 261 Small electrical appliance manuf 33521 262 Household cooking appliance manuf 335221 263 Household refrigerator & home freezer manuf 335222 264 Household laundry equipment manuf 335224 265 Other major household appliance manuf 335228 266 Power, distribution, & specialty transformer manuf 335311 267 Motor & generator manuf 335312 268 Switchgear & switchboard apparatus manuf 335313 269 Relay & industrial control manuf 335314 270 Storage battery manuf 335911 271 Primary battery manuf 335912 272 Communication & energy wire & cable manuf 33592 273 Wiring device manuf 33593 274 Carbon & graphite product manuf 335991
275 All other miscellaneous electrical equipment & component manuf 335999
276 Automobile manuf 336111 277 Light truck & utility vehicle manuf 336112 278 Heavy duty truck manuf 336120 279 Motor vehicle body manuf 336211 280 Truck trailer manuf 336212 281 Motor home manuf 336213 282 Travel trailer & camper manuf 336214 283 Motor vehicle parts manuf 3363 284 Aircraft manuf 336411 285 Aircraft engine & engine parts manuf 336412 286 Other aircraft parts & auxiliary equipment manuf 336413 287 Guided missile & space vehicle manuf 336414
288 Propulsion units & parts for space vehicles & guided missiles 336415, 336419
289 Railroad rolling stock manuf 3365 290 Ship building & repairing 336611 291 Boat building 336612 292 Motorcycle, bicycle, & parts manuf 336991
293 Military armored vehicle, tank, & tank component manuf 336992

78
Table B.1. IMPLAN 440 Industry Sector Descriptions and NAICS (Cont.)
Sector Description 2007 NAICS Agro‐Forestry
294 All other transportation equipment manuf 336999 295 Wood kitchen cabinet & countertop manuf 33711 Secondary For 296 Upholstered household furniture manuf 337121 Secondary For 297 Nonupholstered wood household furniture manuf 337122 Secondary For
298 Metal & other household furniture (except wood) manuf 337124‐5
299 Institutional furniture manuf 337127 Secondary For
300 Wood television, radio, & sewing machine cabinet manuf 337129 Secondary For
301 Office furniture & custom architectural woodwork & millwork manuf
337211, 337212, 337214 Secondary For
302 Showcase, partition, shelving, & locker manuf 337215 Secondary For 303 Mattress manuf 33791 Secondary For 304 Blind & shade manuf 33792 Secondary For 305 Surgical & medical instrument manuf 339112 306 Surgical appliance & supplies manuf 339113 307 Dental equipment & supplies manuf 339114 308 Ophthalmic goods manuf 339115 309 Dental laboratories 339116 310 Jewelry & silverware manuf 33991 311 Sporting & athletic goods manuf 33992 312 Doll, toy, & game manuf 33993 313 Office supplies (except paper) manuf 33994 314 Sign manuf 33995 315 Gasket, packing, & sealing device manuf 339991 316 Musical instrument manuf 339992
317 All other miscellaneous manuf 339993, 339995,
339999 318 Broom, brush, & mop manuf 339994 319 Wholesale trade 42 320 Retail ‐ Motor vehicle & parts 441 321 Retail ‐ Furniture & home furnishings 442 322 Retail ‐ Electronics & appliances 443 323 Retail ‐ Building material & garden supply 444 324 Retail ‐ Food & beverage 445 325 Retail ‐ Health & personal care 446 326 Retail ‐ Gasoline stations 447 327 Retail ‐ Clothing & clothing accessories 448 328 Retail ‐ Sporting goods, hobby, book & music 451 329 Retail ‐ General merchandise 452 330 Retail ‐ Miscellaneous 453 331 Retail ‐ Nonstore 454 332 Air transportation 481 333 Rail transportation 482 334 Water transportation 483 324 Retail ‐ Food & beverage 445 325 Retail ‐ Health & personal care 446

79
Table B.1. IMPLAN 440 Industry Sector Descriptions and NAICS (Cont.)
Sector Description 2007 NAICS Agro‐Forestry
326 Retail ‐ Gasoline stations 447 327 Retail ‐ Clothing & clothing accessories 448 328 Retail ‐ Sporting goods, hobby, book & music 451 329 Retail ‐ General merchandise 452 330 Retail ‐ Miscellaneous 453 331 Retail ‐ Nonstore 454 332 Air transportation 481 333 Rail transportation 482 334 Water transportation 483 335 Truck transportation 484 336 Transit & ground passenger transportation 485 337 Pipeline transportation 486
338 Scenic & sightseeing transportation & support activities for transportation 487, 488
339 Couriers & messengers 492 340 Warehousing & storage 493 341 Newspaper publishers 51111 342 Periodical publishers 51112 343 Book publishers 51113 344 Directory, mailing list, & other publishers 51114, 51119 345 Software publishers 51121 346 Motion picture & video industries 5121 347 Sound recording industries 5122 348 Radio & television broadcasting 5151 349 Cable & other subscription programming 5152 350 Internet publishing & broadcasting 51913 351 Telecommunications 517 352 Data processing, hosting, & related services 518 353 Other information services 51911‐2
354 Monetary authorities & depository credit intermediation 521, 5221
355 Nondepository credit intermediation & related activities 5222‐3
356 Securities, commodity contracts, investments, & related activities 523
357 Insurance carriers 5241 358 Insurance agencies, brokerages, & related activities 5242 359 Funds, trusts, & other financial vehicles 525 360 Real estate 531 361 Imputed rental value for owner‐occupied dwellings n.a. 362 Automotive equipment rental & leasing 5321
363 General & consumer goods rental except video tapes & discs 53221‐2, 53229, 5323
364 Video tape & disc rental 53223
365 Commercial & industrial machinery & equipment rental & leasing 5324
366 Lessors of nonfinancial intangible assets 533
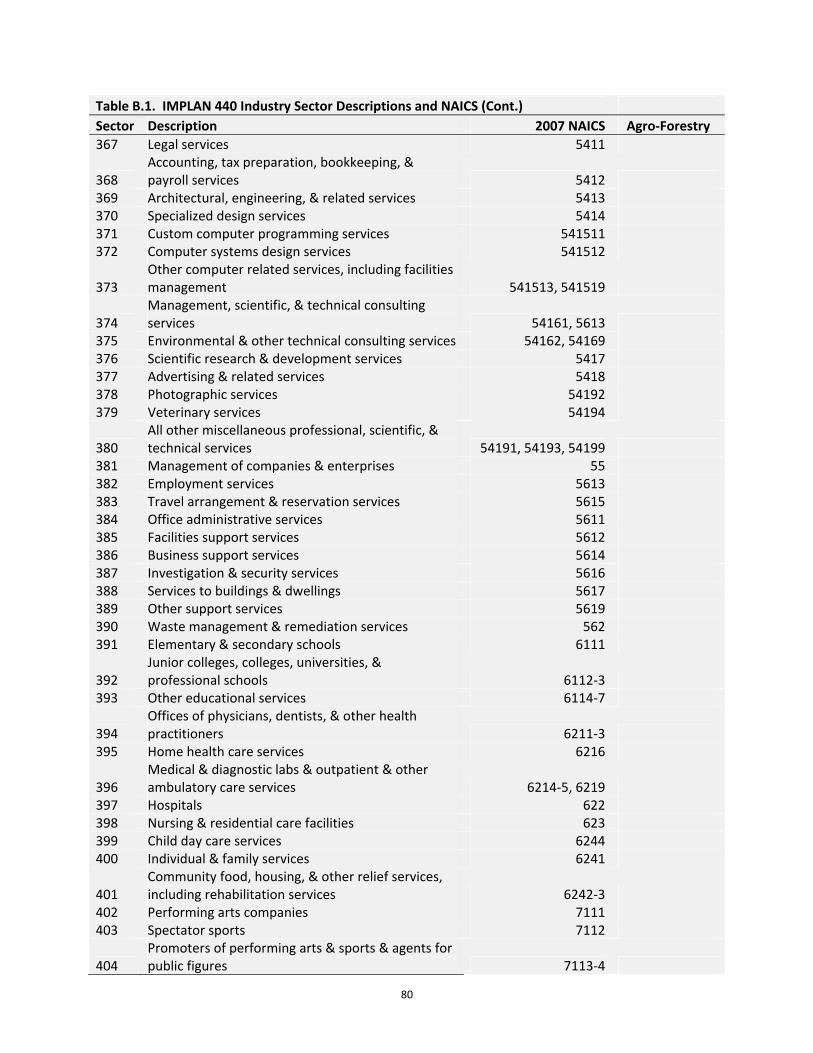
80
Table B.1. IMPLAN 440 Industry Sector Descriptions and NAICS (Cont.)
Sector Description 2007 NAICS Agro‐Forestry
367 Legal services 5411
368 Accounting, tax preparation, bookkeeping, & payroll services 5412
369 Architectural, engineering, & related services 5413 370 Specialized design services 5414 371 Custom computer programming services 541511 372 Computer systems design services 541512
373 Other computer related services, including facilities management 541513, 541519
374 Management, scientific, & technical consulting services 54161, 5613
375 Environmental & other technical consulting services 54162, 54169 376 Scientific research & development services 5417 377 Advertising & related services 5418 378 Photographic services 54192 379 Veterinary services 54194
380 All other miscellaneous professional, scientific, & technical services 54191, 54193, 54199
381 Management of companies & enterprises 55 382 Employment services 5613 383 Travel arrangement & reservation services 5615 384 Office administrative services 5611 385 Facilities support services 5612 386 Business support services 5614 387 Investigation & security services 5616 388 Services to buildings & dwellings 5617 389 Other support services 5619 390 Waste management & remediation services 562 391 Elementary & secondary schools 6111
392 Junior colleges, colleges, universities, & professional schools 6112‐3
393 Other educational services 6114‐7
394 Offices of physicians, dentists, & other health practitioners 6211‐3
395 Home health care services 6216
396 Medical & diagnostic labs & outpatient & other ambulatory care services 6214‐5, 6219
397 Hospitals 622 398 Nursing & residential care facilities 623 399 Child day care services 6244 400 Individual & family services 6241
401 Community food, housing, & other relief services, including rehabilitation services 6242‐3
402 Performing arts companies 7111 403 Spectator sports 7112
404 Promoters of performing arts & sports & agents for public figures 7113‐4
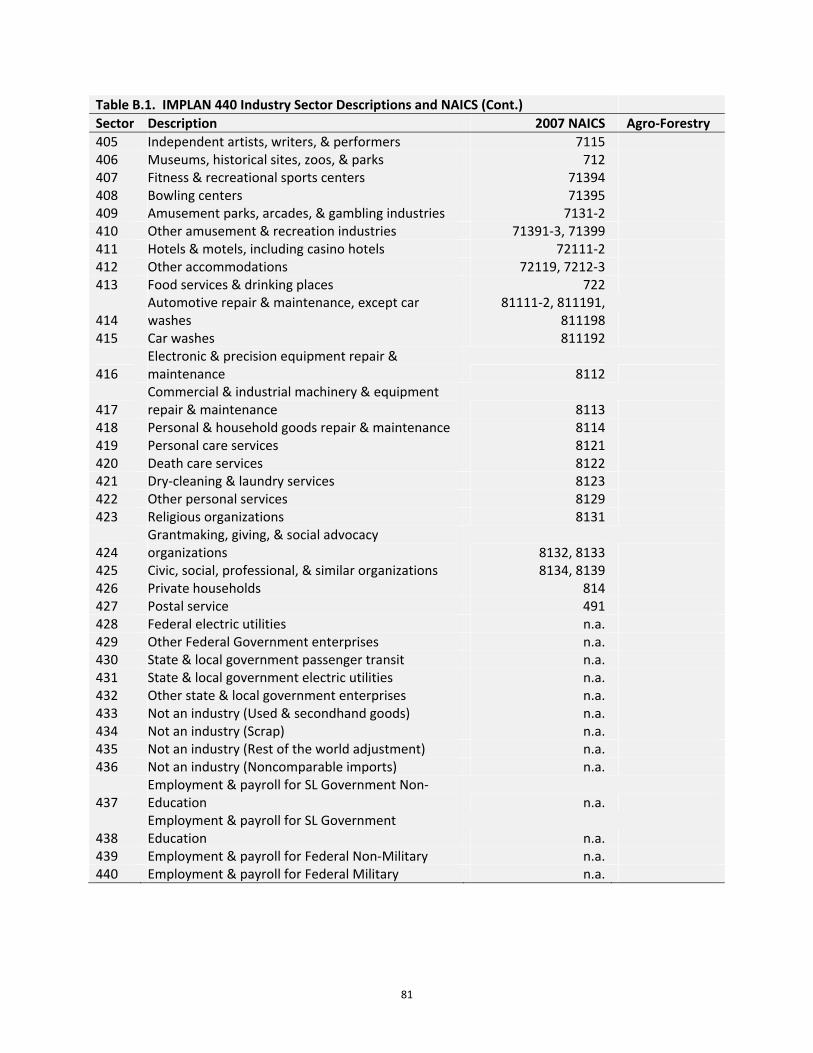
81
Table B.1. IMPLAN 440 Industry Sector Descriptions and NAICS (Cont.)
Sector Description 2007 NAICS Agro‐Forestry
405 Independent artists, writers, & performers 7115 406 Museums, historical sites, zoos, & parks 712 407 Fitness & recreational sports centers 71394 408 Bowling centers 71395 409 Amusement parks, arcades, & gambling industries 7131‐2 410 Other amusement & recreation industries 71391‐3, 71399 411 Hotels & motels, including casino hotels 72111‐2 412 Other accommodations 72119, 7212‐3 413 Food services & drinking places 722
414 Automotive repair & maintenance, except car washes
81111‐2, 811191, 811198
415 Car washes 811192
416 Electronic & precision equipment repair & maintenance 8112
417 Commercial & industrial machinery & equipment repair & maintenance 8113
418 Personal & household goods repair & maintenance 8114 419 Personal care services 8121 420 Death care services 8122 421 Dry‐cleaning & laundry services 8123 422 Other personal services 8129 423 Religious organizations 8131
424 Grantmaking, giving, & social advocacy organizations 8132, 8133
425 Civic, social, professional, & similar organizations 8134, 8139 426 Private households 814 427 Postal service 491 428 Federal electric utilities n.a. 429 Other Federal Government enterprises n.a. 430 State & local government passenger transit n.a. 431 State & local government electric utilities n.a. 432 Other state & local government enterprises n.a. 433 Not an industry (Used & secondhand goods) n.a. 434 Not an industry (Scrap) n.a. 435 Not an industry (Rest of the world adjustment) n.a. 436 Not an industry (Noncomparable imports) n.a.
437 Employment & payroll for SL Government Non‐Education n.a.
438 Employment & payroll for SL Government Education n.a.
439 Employment & payroll for Federal Non‐Military n.a. 440 Employment & payroll for Federal Military n.a.
82
Appendix C: County Region Identification Table
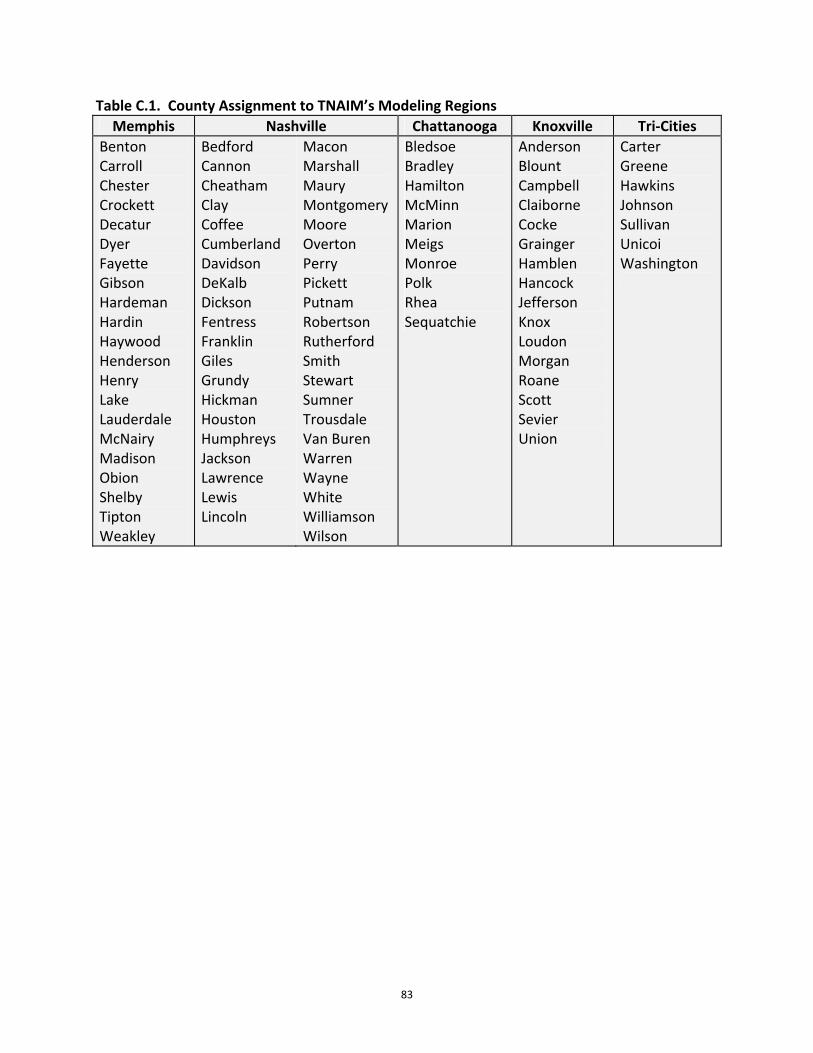
83
Table C.1. County Assignment to TNAIM’s Modeling Regions
Memphis Nashville Chattanooga Knoxville Tri‐Cities
Benton Carroll Chester Crockett Decatur Dyer Fayette Gibson Hardeman Hardin Haywood Henderson Henry Lake Lauderdale McNairy Madison Obion Shelby Tipton Weakley
Bedford Cannon Cheatham Clay Coffee Cumberland Davidson DeKalb Dickson Fentress Franklin Giles Grundy Hickman Houston Humphreys Jackson Lawrence Lewis Lincoln
Macon Marshall Maury Montgomery Moore Overton Perry Pickett Putnam Robertson Rutherford Smith Stewart Sumner Trousdale Van Buren Warren Wayne White Williamson Wilson
Bledsoe Bradley Hamilton McMinn Marion Meigs Monroe Polk Rhea Sequatchie
Anderson Blount Campbell Claiborne Cocke Grainger Hamblen Hancock Jefferson Knox Loudon Morgan Roane Scott Sevier Union
Carter Greene Hawkins Johnson Sullivan Unicoi Washington
84
Appendix D: Total Industry Output, Employment, Labor Income, and Total Value‐Added by Agriculture and Forestry Sectors for Tennessee, 2011

85
Table D.1. Direct Impacts from Agriculture and Forestrya, Tennessee, 2011
Sector TIO Employment Labor Income TVA
(million $) (number) (million $) (million $)
Agricultural Inputs
Agricultural Chemicals
Fertilizer 102 84 4 7
Pesticide & other agricultural chemical 580 329 56 206
Lime & gypsum product 128 276 22 40
Total ‐‐ 809 689 82 253
Agricultural Machinery
Farm machinery & equipment 165 302 18 39
Lawn & garden equipment 591 1,449 79 140
Total ‐‐ 757 1,751 97 179
Agricultural Inputs Total ‐‐ 1,566 2,440 179 432
Primary Agriculture
Oilseed farming 461 13,182 2 205
Grain farming 537 23,391 12 168
Vegetable & melon farming 89 1,010 6 47
Fruit farming 10 126 0b 5
Tree nut farming 1 20 0b 0b
Greenhouse, nursery, & floriculture production 317 5,270 49 208
Tobacco farming 97 3,150 3 19
Cotton farming 401 4,446 38 131
Sugarcane & sugar beet farming 0 0 0 0
All other crop farming 337 3,726 15 89
Cattle ranching & farming 586 10,035 26 98
Dairy cattle & milk production 179 2,854 5 65
Poultry & egg production 524 2,196 30 105
Animal production, except cattle & poultry & eggs 120 6,823 12 60
Commercial fishing 0 0 0 0
Commercial hunting & trapping 53 671 1 6
Support activities for agriculture & forestry 157 7,009 135 109
Primary Agriculture Total ‐‐ 3,870 83,909 333 1,318
Secondary Agriculture
Foods
Dog & cat food 1,337 922 124 440
Other animal food 173 152 13 27
Total ‐‐ 1,510 1,074 137 467
Grain & Oilseed Milling
Flour milling & malt 524 458 34 64
Wet corn milling 1,382 573 66 152
Soybean & other oilseed processing 760 442 37 45
Fats & oils refining & blending 870 213 16 86
Breakfast cereal 370 421 38 139
Total ‐‐ 3,906 2,107 192 485

86
Table D.1. Direct Impacts from Agriculture and Forestrya, Tennessee, 2011 (Cont.)
Sector TIO Employment Labor Income TVA
(million $) (number) (million $) (million $)
Sugar & Confectionary Products
Sugar cane mills & refining 59 69 5 7
Beet sugar 0 0 0 0
Chocolate & confectionery from cacao beans 42 58 2 3
Confectionery from purchased chocolate 489 1,316 69 140
Nonchocolate confectionery 496 1,281 70 117
Total ‐‐ 1,086 2,724 145 266
Fruit & Vegetable Preserving & Specialty Foods
Frozen food 849 2,477 155 212
Fruit & vegetable canning, pickling, & drying 1,011 1,864 144 260
Total ‐‐ 1,860 4,340 299 472
Dairy Products
Fluid milk & butter 1,025 989 61 138
Cheese 164 200 9 12
Dry, condensed, & evaporated dairy product 447 559 41 62
Ice cream & frozen dessert 101 264 14 21
Total ‐‐ 1,737 2,011 125 233
Animal Slaughtering & Processing
Animal (except poultry) slaughtering, rendering, & processing 1,323 4,408 178 129
Poultry processing 2,588 7,031 232 371
Total ‐‐ 3,911 11,440 409 500
Seafood product Preparation & Packaging 0 0 0 0
Bakeries & Tortillas
Bread & bakery product 670 3,866 178 224
Cookie, cracker, & pasta 1,196 2,686 156 296
Tortilla 35 167 7 10
Total ‐‐ 1,900 6,719 341 530
Other Foods
Snack food 1,299 1,765 110 329
Coffee & tea 148 191 12 24
Flavoring syrup & concentrate 28 9 2 15
Seasoning & dressing 240 456 20 27
All other food 104 309 19 28
Total ‐‐ 1,819 2,729 163 423
Beverages
Soft drink & ice 2,467 3,477 231 295
Breweries 25 28 1 5
Wineries 54 170 4 7
Distilleries 833 560 47 512
Total ‐‐ 3,379 4,235 283 819
Tobacco Products 2,100 877 89 1,389

87
Table D.1. Direct Impacts from Agriculture and Forestrya, Tennessee, 2011 (Cont.)
Sector TIO Employment Labor Income TVA
(million $) (number) (million $) (million $)
Textile Mills
Fiber, yarn, & thread mills 461 1,514 70 92
Broadwoven fabric mills 1 6 0b 0b
Narrow fabric mills & schiffli machine embroidery 20 133 8 9
Nonwoven fabric mills 409 809 65 110
Knit fabric mills 34 168 9 9
Textile & fabric finishing mills 138 665 27 33
Fabric coating mills 123 352 19 24
Total ‐‐ 1,187 3,647 199 278
Textile Products Mills
Carpet & rug mills 74 244 10 15
Curtain & linen mills 21 143 4 5
Textile bag & canvas mills 100 786 26 32
All other textile product mills 264 1,542 62 80
Total ‐‐ 460 2,714 103 133
Apparel
Apparel knitting mills 125 865 28 36
Cut & sew apparel contractors 72 1,129 30 35
Men's & boys' cut & sew apparel 377 2,533 117 155
Women's & girls' cut & sew apparel 41 202 4 6
Other cut & sew apparel 24 237 7 7
Apparel accessories & other apparel 12 113 3 3
Total ‐‐ 651 5,080 189 242
Leather & Allied Products
Leather & hide tanning & finishing 28 68 2 3
Footwear 74 569 18 22
Other leather & allied product 15 130 4 5
Total ‐‐ 118 767 24 30
Secondary Agriculture Total ‐‐ 25,625 50,466 2,697 6,267
Agriculture Total ‐‐ 31,061 136,815 3,210 8,017
Forestry Inputs
Forestry, forest products, & timber tract production 13 57 1 3
Commercial logging 162 2,745 60 50
Forestry Inputs Total ‐‐ 175 2,801 61 53
Primary Forestry
Sawmills & wood preservation 741 3,148 102 117
Pulp mills 229 310 34 54
Paper mills 3,876 4,487 671 1,388
Paperboard Mills 788 968 101 196
Primary Forestry Total ‐‐ 5,634 8,914 908 1,755
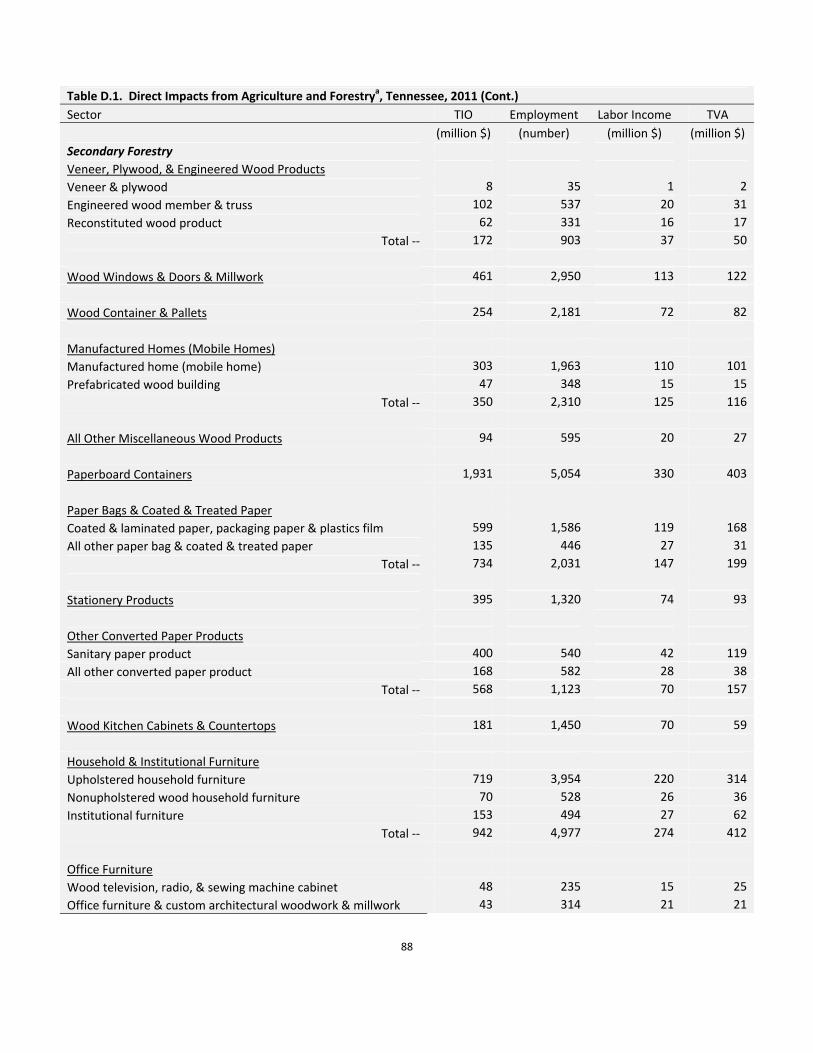
88
Table D.1. Direct Impacts from Agriculture and Forestrya, Tennessee, 2011 (Cont.)
Sector TIO Employment Labor Income TVA
(million $) (number) (million $) (million $)
Secondary Forestry
Veneer, Plywood, & Engineered Wood Products
Veneer & plywood 8 35 1 2
Engineered wood member & truss 102 537 20 31
Reconstituted wood product 62 331 16 17
Total ‐‐ 172 903 37 50
Wood Windows & Doors & Millwork 461 2,950 113 122
Wood Container & Pallets 254 2,181 72 82
Manufactured Homes (Mobile Homes)
Manufactured home (mobile home) 303 1,963 110 101
Prefabricated wood building 47 348 15 15
Total ‐‐ 350 2,310 125 116
All Other Miscellaneous Wood Products 94 595 20 27
Paperboard Containers 1,931 5,054 330 403
Paper Bags & Coated & Treated Paper
Coated & laminated paper, packaging paper & plastics film 599 1,586 119 168
All other paper bag & coated & treated paper 135 446 27 31
Total ‐‐ 734 2,031 147 199
Stationery Products 395 1,320 74 93
Other Converted Paper Products
Sanitary paper product 400 540 42 119
All other converted paper product 168 582 28 38
Total ‐‐ 568 1,123 70 157
Wood Kitchen Cabinets & Countertops 181 1,450 70 59
Household & Institutional Furniture
Upholstered household furniture 719 3,954 220 314
Nonupholstered wood household furniture 70 528 26 36
Institutional furniture 153 494 27 62
Total ‐‐ 942 4,977 274 412
Office Furniture
Wood television, radio, & sewing machine cabinet 48 235 15 25
Office furniture & custom architectural woodwork & millwork 43 314 21 21

89
Table D.1. Direct Impacts from Agriculture and Forestrya, Tennessee, 2011 (Cont.)
Sector TIO Employment Labor Income TVA
(million $) (number) (million $) (million $)
Showcase, partition, shelving, & locker 296 1,329 93 129
Total ‐‐ 387 1,878 130 176
Other Furniture Related Products
Mattress 248 814 45 90
Blind & shade 23 165 8 7
Total ‐‐ 271 980 52 97
Secondary Forestry Total ‐‐ 6,740 27,752 1,514 1,992
Forestry Total ‐‐ 12,548 39,467 2,483 3,800
Agriculture & Forestry Total ‐‐ 43,609 176,282 5,693 11,817
Construction ‐‐ 18,481 175,008 8,442 9,597
Finance, Insurance, & Real Estate ‐‐ 73,372 279,619 11,163 46,139
Government ‐‐ 39,552 511,329 28,989 29,979
Manufacturing ‐‐ 106,651 226,556 14,778 24,052
Mining ‐‐ 2,306 7,712 281 865
Miscellaneous ‐‐ 4,708 76,183 2,546 2,573
Retail Trade ‐‐ 26,842 387,720 12,459 19,161
Services ‐‐ 144,126 1,447,492 69,802 90,961
Transportation, Information, & Utilities ‐‐ 19,140 104,927 6,697 9,183
Wholesale Trade ‐‐ 21,116 125,089 8,679 15,107
Total Economy ‐‐ 499,904 3,517,918 169,529 259,435 aTotals may not add due to rounding. bValues of zero are nonzero values less than 1.
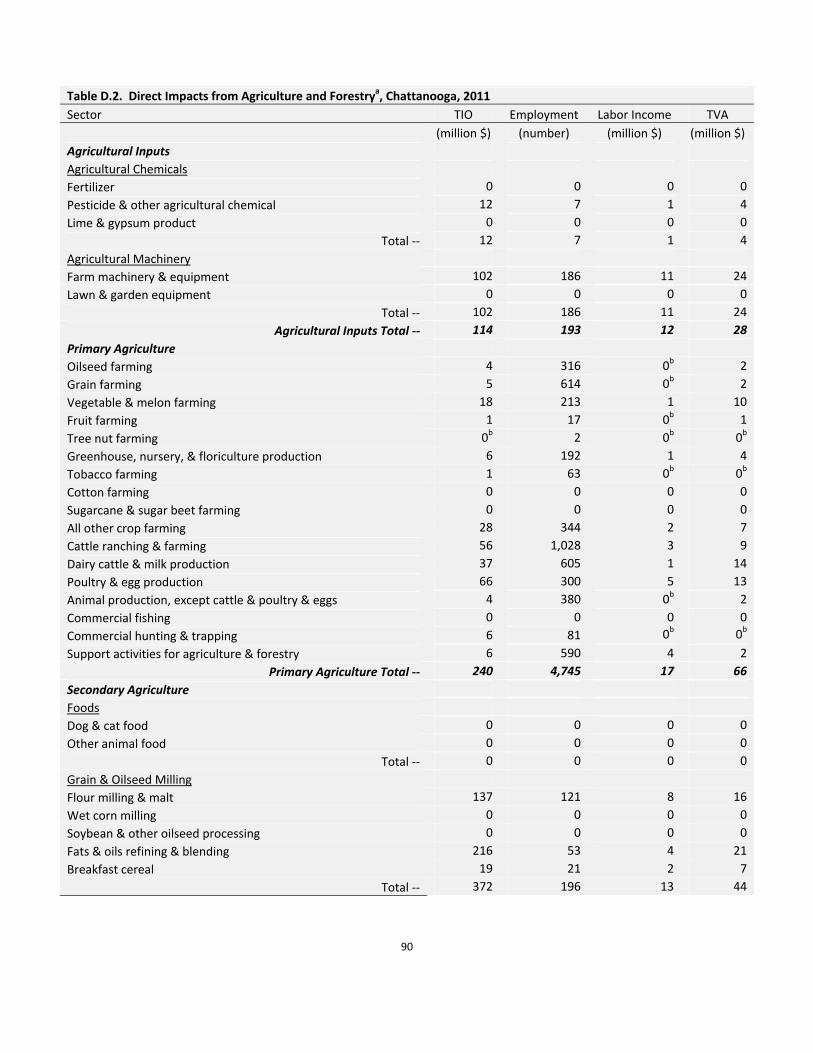
90
Table D.2. Direct Impacts from Agriculture and Forestrya, Chattanooga, 2011
Sector TIO Employment Labor Income TVA
(million $) (number) (million $) (million $)
Agricultural Inputs
Agricultural Chemicals
Fertilizer 0 0 0 0
Pesticide & other agricultural chemical 12 7 1 4
Lime & gypsum product 0 0 0 0
Total ‐‐ 12 7 1 4
Agricultural Machinery
Farm machinery & equipment 102 186 11 24
Lawn & garden equipment 0 0 0 0
Total ‐‐ 102 186 11 24
Agricultural Inputs Total ‐‐ 114 193 12 28
Primary Agriculture
Oilseed farming 4 316 0b 2
Grain farming 5 614 0b 2
Vegetable & melon farming 18 213 1 10
Fruit farming 1 17 0b 1
Tree nut farming 0b 2 0b 0b
Greenhouse, nursery, & floriculture production 6 192 1 4
Tobacco farming 1 63 0b 0b
Cotton farming 0 0 0 0
Sugarcane & sugar beet farming 0 0 0 0
All other crop farming 28 344 2 7
Cattle ranching & farming 56 1,028 3 9
Dairy cattle & milk production 37 605 1 14
Poultry & egg production 66 300 5 13
Animal production, except cattle & poultry & eggs 4 380 0b 2
Commercial fishing 0 0 0 0
Commercial hunting & trapping 6 81 0b 0b
Support activities for agriculture & forestry 6 590 4 2
Primary Agriculture Total ‐‐ 240 4,745 17 66
Secondary Agriculture
Foods
Dog & cat food 0 0 0 0
Other animal food 0 0 0 0
Total ‐‐ 0 0 0 0
Grain & Oilseed Milling
Flour milling & malt 137 121 8 16
Wet corn milling 0 0 0 0
Soybean & other oilseed processing 0 0 0 0
Fats & oils refining & blending 216 53 4 21
Breakfast cereal 19 21 2 7
Total ‐‐ 372 196 13 44
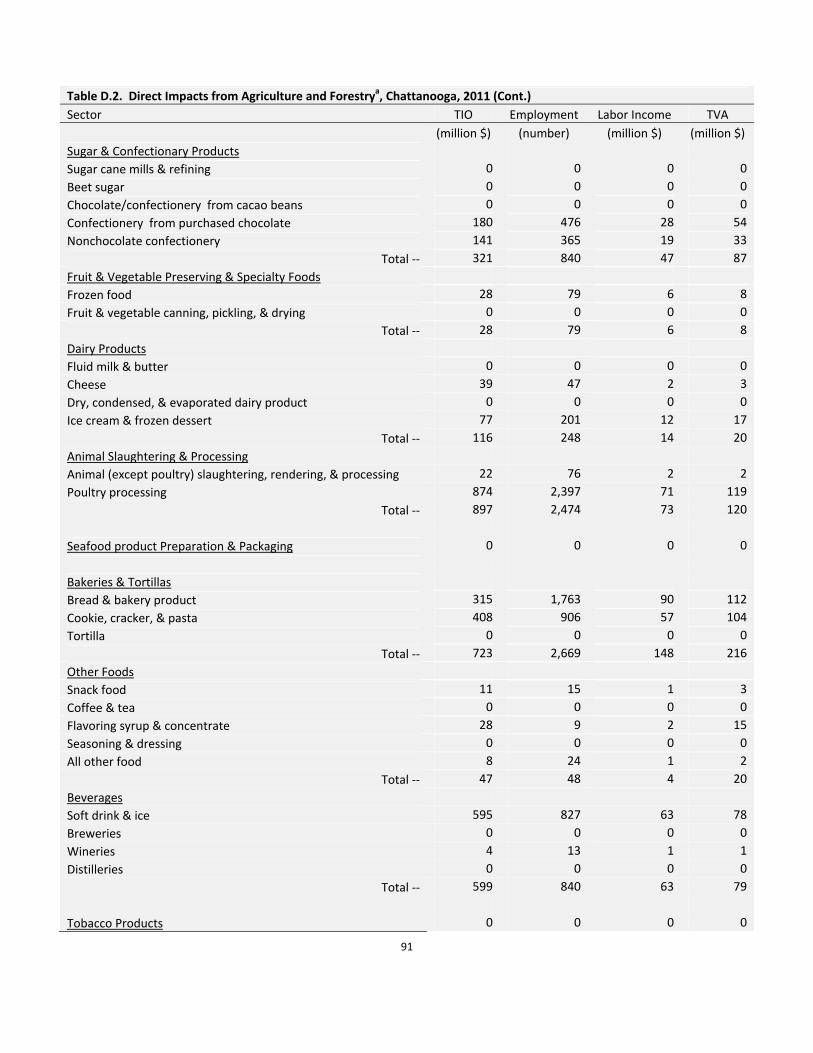
91
Table D.2. Direct Impacts from Agriculture and Forestrya, Chattanooga, 2011 (Cont.)
Sector TIO Employment Labor Income TVA
(million $) (number) (million $) (million $)
Sugar & Confectionary Products
Sugar cane mills & refining 0 0 0 0
Beet sugar 0 0 0 0
Chocolate/confectionery from cacao beans 0 0 0 0
Confectionery from purchased chocolate 180 476 28 54
Nonchocolate confectionery 141 365 19 33
Total ‐‐ 321 840 47 87
Fruit & Vegetable Preserving & Specialty Foods
Frozen food 28 79 6 8
Fruit & vegetable canning, pickling, & drying 0 0 0 0
Total ‐‐ 28 79 6 8
Dairy Products
Fluid milk & butter 0 0 0 0
Cheese 39 47 2 3
Dry, condensed, & evaporated dairy product 0 0 0 0
Ice cream & frozen dessert 77 201 12 17
Total ‐‐ 116 248 14 20
Animal Slaughtering & Processing
Animal (except poultry) slaughtering, rendering, & processing 22 76 2 2
Poultry processing 874 2,397 71 119
Total ‐‐ 897 2,474 73 120
Seafood product Preparation & Packaging 0 0 0 0
Bakeries & Tortillas
Bread & bakery product 315 1,763 90 112
Cookie, cracker, & pasta 408 906 57 104
Tortilla 0 0 0 0
Total ‐‐ 723 2,669 148 216
Other Foods
Snack food 11 15 1 3
Coffee & tea 0 0 0 0
Flavoring syrup & concentrate 28 9 2 15
Seasoning & dressing 0 0 0 0
All other food 8 24 1 2
Total ‐‐ 47 48 4 20
Beverages
Soft drink & ice 595 827 63 78
Breweries 0 0 0 0
Wineries 4 13 1 1
Distilleries 0 0 0 0
Total ‐‐ 599 840 63 79
Tobacco Products 0 0 0 0

92
Table D.2. Direct Impacts from Agriculture and Forestrya, Chattanooga, 2011 (Cont.)
Sector TIO Employment Labor Income TVA
(million $) (number) (million $) (million $)
Textile Mills
Fiber, yarn, & thread mills 227 761 30 41
Broadwoven fabric mills 0 0 0 0
Narrow fabric mills & schiffli machine embroidery 0 0 0 0
Nonwoven fabric mills 71 138 12 20
Knit fabric mills 24 119 6 7
Textile & fabric finishing mills 4 20 1 1
Fabric coating mills 0 0 0 0
Total ‐‐ 326 1,037 49 69
Textile Products Mills
Carpet & rug mills 7 21 1 2
Curtain & linen mills 1 10 0b 0b
Textile bag & canvas mills 36 296 8 11
All other textile product mills 9 54 2 3
Total ‐‐ 54 381 12 15
Apparel
Apparel knitting mills 125 863 28 36
Cut & sew apparel contractors 13 191 6 7
Men's & boys' cut & sew apparel 144 946 47 61
Women's & girls' cut & sew apparel 4 22 0b 1
Other cut & sew apparel 0b 5 0b 0b
Apparel accessories & other apparel 0 0 0 0
Total ‐‐ 287 2,027 82 105
Leather & Allied Products
Leather & hide tanning & finishing 0 0 0 0
Footwear 0 0 0 0
Other leather & allied product 4 43 0b 0b
Total ‐‐ 4 43 0b 0b
Secondary Agriculture Total ‐‐ 3,772 10,881 513 782
Agriculture Total ‐‐ 4,126 15,819 542 876
Forestry Inputs
Forestry, forest products, & timber tract production 1 3 0b 0b
Commercial logging 15 269 5 4
Forestry Inputs Total ‐‐ 15 272 5 4
Primary Forestry
Sawmills & wood preservation 51 222 6 7
Pulp mills 136 194 14 27
Paper mills 528 648 65 168
Paperboard Mills 143 169 23 39
Primary Forestry Total ‐‐ 857 1,233 108 242

93
Table D.2. Direct Impacts from Agriculture and Forestrya, Chattanooga, 2011 (Cont.)
Sector TIO Employment Labor Income TVA
(million $) (number) (million $) (million $)
Secondary Forestry
Veneer, Plywood, & Engineered Wood Products
Veneer & plywood 2 10 0b 1
Engineered wood member & truss 8 45 1 2
Reconstituted wood product 41 194 14 14
Total ‐‐ 51 250 15 17
Wood Windows & Doors & Millwork 15 104 3 3
Wood Container & Pallets 49 412 14 16
Manufactured Homes (Mobile Homes)
Manufactured home (mobile home) 0 0 0 0
Prefabricated wood building 3 18 1 1
Total ‐‐ 3 18 1 1
All Other Miscellaneous Wood Products 24 162 4 6
Paperboard Containers 384 1,019 61 76
Paper Bags & Coated & Treated Paper
Coated & laminated paper, packaging paper & plastics film 7 16 2 3
All other paper bag & coated & treated paper 32 106 6 7
Total ‐‐ 38 121 8 10
Stationery Products 24 90 2 4
Other Converted Paper Products
Sanitary paper product 0 0 0 0
All other converted paper product 0 0 0 0
Total ‐‐ 0 0 0 0
Wood Kitchen Cabinets & Countertops 27 207 11 10
Household & Institutional Furniture
Upholstered household furniture 400 2,286 112 166
Nonupholstered wood household furniture 1 5 0b 0b
Institutional furniture 0 0 0 0
Total ‐‐ 401 2,291 112 166
Office Furniture
Wood television, radio, & sewing machine cabinet 18 96 5 9
Office furniture & custom architectural woodwork & millwork 1 10 1 1

94
Table D.2. Direct Impacts from Agriculture and Forestrya, Chattanooga, 2011 (Cont.)
Sector TIO Employment Labor Income TVA
(million $) (number) (million $) (million $)
Showcase, partition, shelving, & locker 36 172 10 15
Total ‐‐ 55 278 15 24
Other Furniture Related Products
Mattress 26 90 4 9
Blind & shade 0 0 0 0
Total ‐‐ 26 90 4 9
Secondary Forestry Total ‐‐ 1,098 5,042 251 341
Forestry Total ‐‐ 1,971 6,547 364 587
Agriculture & Forestry Total ‐‐ 6,097 22,366 906 1,463
Construction ‐‐ 1,852 18,079 815 935
Finance, Insurance, & Real Estate ‐‐ 8,619 30,005 1,445 5,372
Government ‐‐ 5,540 51,110 3,247 1,504
Manufacturing ‐‐ 11,464 28,411 1,760 2,679
Mining ‐‐ 121 504 12 41
Miscellaneous ‐‐ 476 8,020 247 258
Retail Trade ‐‐ 2,962 42,863 1,366 2,139
Services ‐‐ 11,918 134,169 5,670 7,418
Transportation, Information, & Utilities ‐‐ 2,332 15,111 761 1,051
Wholesale Trade ‐‐ 1,795 10,752 726 1,278
Total Economy ‐‐ 53,176 361,388 16,955 24,137 aTotals may not add due to rounding. bValues of zero are nonzero values less than 1.

95
Table D.3. Direct Impacts from Agriculture and Forestrya, Knoxville, 2011
Sector TIO Employment Labor Income TVA
(million $) (number) (million $) (million $)
Agricultural Inputs
Agricultural Chemicals
Fertilizer 0 0 0 0
Pesticide & other agricultural chemical 54 32 3 18
Lime & gypsum product 50 112 7 15
Total ‐‐ 105 145 10 32
Agricultural Machinery
Farm machinery & equipment 6 12 1 2
Lawn & garden equipment 0 0 0 0
Total ‐‐ 6 12 1 2
Agricultural Inputs Total ‐‐ 111 156 11 34
Primary Agriculture
Oilseed farming 4 455 0 2
Grain farming 6 947 1 2
Vegetable & melon farming 22 320 1 12
Fruit farming 2 36 0b 1
Tree nut farming 0b 4 0b 0b
Greenhouse, nursery, & floriculture production 29 1,059 16 19
Tobacco farming 6 379 0b 1
Cotton farming 0 0 0 0
Sugarcane & sugar beet farming 0 0 0 0
All other crop farming 49 741 6 13
Cattle ranching & farming 87 1,979 9 15
Dairy cattle & milk production 28 593 3 10
Poultry & egg production 66 382 6 13
Animal production, except cattle & poultry & eggs 9 947 1 4
Commercial fishing 0 0 0 0
Commercial hunting & trapping 3 10 0b 2
Support activities for agriculture & forestry 16 530 15 13
Primary Agriculture Total ‐‐ 327 8,381 58 107
Secondary Agriculture
Foods
Dog & cat food 0 0 0 0
Other animal food 40 37 2 5
Total ‐‐ 40 37 2 5
Grain & Oilseed Milling
Flour milling & malt 58 51 4 8
Wet corn milling 1,382 573 66 152
Soybean & other oilseed processing 0 0 0 0
Fats & oils refining & blending 0 0 0 0
Breakfast cereal 0 0 0 0
Total ‐‐ 1,440 624 70 159

96
Table D.3. Direct Impacts from Agriculture and Forestrya, Knoxville, 2011 (Cont.)
Sector TIO Employment Labor Income TVA
(million $) (number) (million $) (million $)
Sugar & Confectionary Products
Sugar cane mills & refining 0 0 0 0
Beet sugar 0 0 0 0
Chocolate & confectionery from cacao beans 0 0 0 0
Confectionery from purchased chocolate 32 94 3 8
Nonchocolate confectionery 10 30 1 2
Total ‐‐ 43 123 3 9
Fruit & Vegetable Preserving & Specialty Foods
Frozen food 46 131 9 12
Fruit & vegetable canning, pickling, & drying 503 949 62 121
Total ‐‐ 549 1,080 71 133
Dairy Products
Fluid milk & butter 29 28 2 4
Cheese 9 10 1 1
Dry, condensed, & evaporated dairy product 0 0 0 0
Ice cream & frozen dessert 0 0 0 0
Total ‐‐ 38 38 3 5
Animal Slaughtering & Processing
Animal (except poultry) slaughtering, rendering, & processing 200 702 17 9
Poultry processing 167 455 15 24
Total ‐‐ 367 1,157 32 33
Seafood product Preparation & Packaging 0 0 0 0
Bakeries & Tortillas
Bread & bakery product 86 514 21 27
Cookie, cracker, & pasta 62 135 10 17
Tortilla 0 0 0 0
Total ‐‐ 148 649 30 44
Other Foods
Snack food 0 0 0 0
Coffee & tea 128 164 11 21
Flavoring syrup & concentrate 0 0 0 0
Seasoning & dressing 0 0 0 0
All other food 12 34 2 3
Total ‐‐ 139 198 13 24
Beverages
Soft drink & ice 585 832 50 66
Breweries 0 0 0 0
Wineries 3 11 0b 0b
Distilleries 98 68 3 59
Total ‐‐ 687 911 53 125
Tobacco Products 0 0 0 0
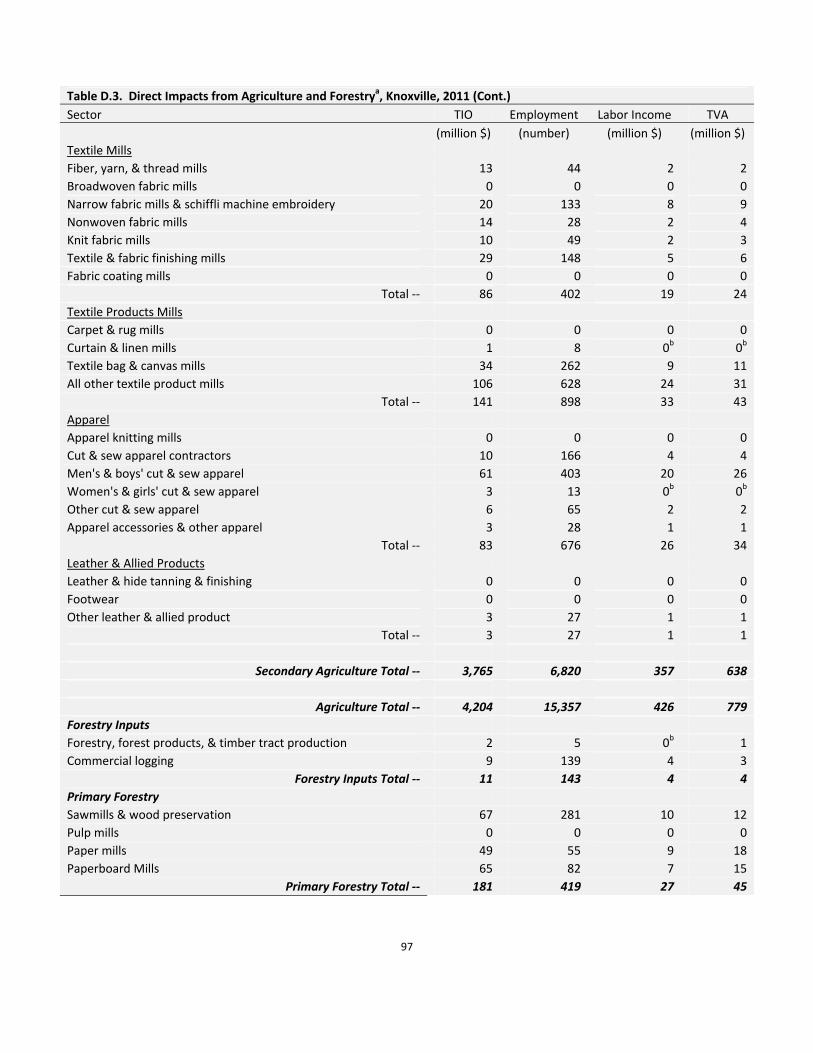
97
Table D.3. Direct Impacts from Agriculture and Forestrya, Knoxville, 2011 (Cont.)
Sector TIO Employment Labor Income TVA
(million $) (number) (million $) (million $)
Textile Mills
Fiber, yarn, & thread mills 13 44 2 2
Broadwoven fabric mills 0 0 0 0
Narrow fabric mills & schiffli machine embroidery 20 133 8 9
Nonwoven fabric mills 14 28 2 4
Knit fabric mills 10 49 2 3
Textile & fabric finishing mills 29 148 5 6
Fabric coating mills 0 0 0 0
Total ‐‐ 86 402 19 24
Textile Products Mills
Carpet & rug mills 0 0 0 0
Curtain & linen mills 1 8 0b 0b
Textile bag & canvas mills 34 262 9 11
All other textile product mills 106 628 24 31
Total ‐‐ 141 898 33 43
Apparel
Apparel knitting mills 0 0 0 0
Cut & sew apparel contractors 10 166 4 4
Men's & boys' cut & sew apparel 61 403 20 26
Women's & girls' cut & sew apparel 3 13 0b 0b
Other cut & sew apparel 6 65 2 2
Apparel accessories & other apparel 3 28 1 1
Total ‐‐ 83 676 26 34
Leather & Allied Products
Leather & hide tanning & finishing 0 0 0 0
Footwear 0 0 0 0
Other leather & allied product 3 27 1 1
Total ‐‐ 3 27 1 1
Secondary Agriculture Total ‐‐ 3,765 6,820 357 638
Agriculture Total ‐‐ 4,204 15,357 426 779
Forestry Inputs
Forestry, forest products, & timber tract production 2 5 0b 1
Commercial logging 9 139 4 3
Forestry Inputs Total ‐‐ 11 143 4 4
Primary Forestry
Sawmills & wood preservation 67 281 10 12
Pulp mills 0 0 0 0
Paper mills 49 55 9 18
Paperboard Mills 65 82 7 15
Primary Forestry Total ‐‐ 181 419 27 45

98
Table D.3. Direct Impacts from Agriculture and Forestrya, Knoxville, 2011 (Cont.)
Sector TIO Employment Labor Income TVA
(million $) (number) (million $) (million $)
Secondary Forestry
Veneer, Plywood, & Engineered Wood Products
Veneer & plywood 1 8 0b 0b
Engineered wood member & truss 20 99 5 7
Reconstituted wood product 0 0 0 0
Total ‐‐ 22 106 5 7
Wood Windows & Doors & Millwork 80 529 18 19
Wood Container & Pallets 13 108 4 5
Manufactured Homes (Mobile Homes)
Manufactured home (mobile home) 224 1,414 85 78
Prefabricated wood building 6 32 3 3
Total ‐‐ 230 1,446 88 82
All Other Miscellaneous Wood Products 14 96 2 3
Paperboard Containers 281 717 54 64
Paper Bags & Coated & Treated Paper
Coated & laminated paper, packaging paper & plastics film 41 105 10 13
All other paper bag & coated & treated paper 6 20 1 1
Total ‐‐ 48 125 11 14
Stationery Products 191 613 41 51
Other Converted Paper Products
Sanitary paper product 0 0 0 0
All other converted paper product 77 263 14 18
Total ‐‐ 77 263 14 18
Wood Kitchen Cabinets & Countertops 22 191 7 6
Household & Institutional Furniture
Upholstered household furniture 270 1,410 92 125
Nonupholstered wood household furniture 26 207 9 12
Institutional furniture 73 226 16 32
Total ‐‐ 369 1,843 116 169
Office Furniture
Wood television, radio, & sewing machine cabinet 1 8 0b 1
Office furniture & custom architectural woodwork & millwork 5 43 2 2
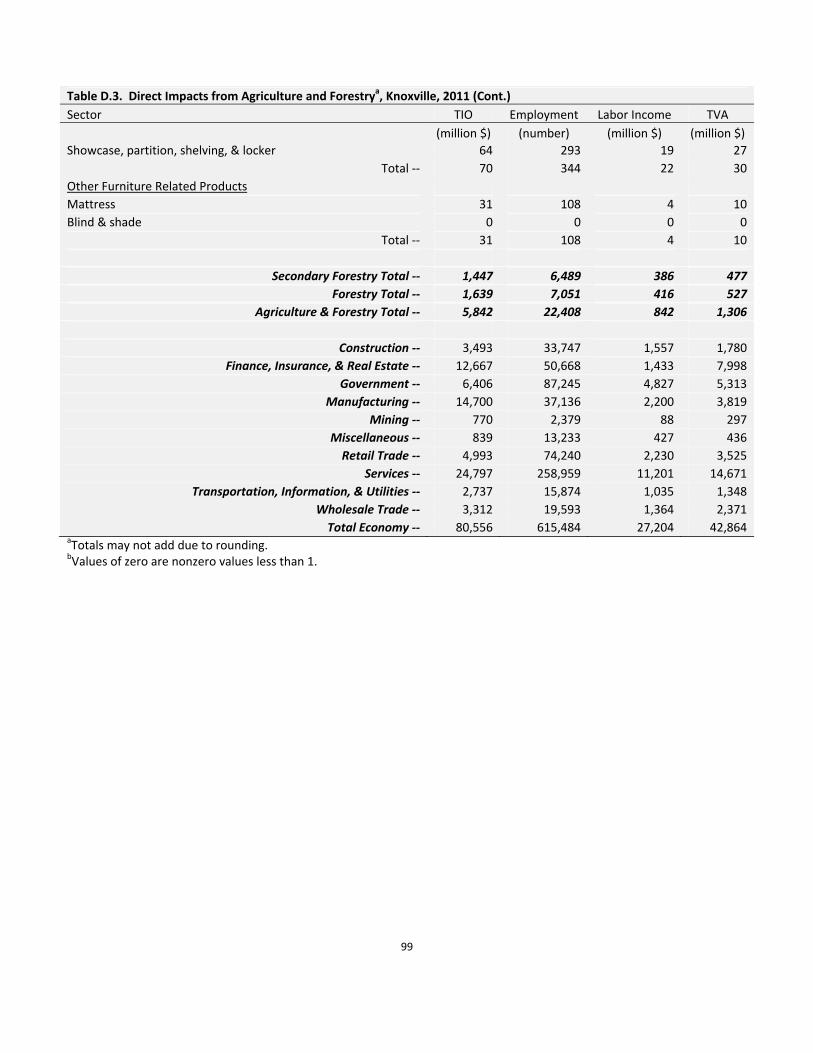
99
Table D.3. Direct Impacts from Agriculture and Forestrya, Knoxville, 2011 (Cont.)
Sector TIO Employment Labor Income TVA
(million $) (number) (million $) (million $)
Showcase, partition, shelving, & locker 64 293 19 27
Total ‐‐ 70 344 22 30
Other Furniture Related Products
Mattress 31 108 4 10
Blind & shade 0 0 0 0
Total ‐‐ 31 108 4 10
Secondary Forestry Total ‐‐ 1,447 6,489 386 477
Forestry Total ‐‐ 1,639 7,051 416 527
Agriculture & Forestry Total ‐‐ 5,842 22,408 842 1,306
Construction ‐‐ 3,493 33,747 1,557 1,780
Finance, Insurance, & Real Estate ‐‐ 12,667 50,668 1,433 7,998
Government ‐‐ 6,406 87,245 4,827 5,313
Manufacturing ‐‐ 14,700 37,136 2,200 3,819
Mining ‐‐ 770 2,379 88 297
Miscellaneous ‐‐ 839 13,233 427 436
Retail Trade ‐‐ 4,993 74,240 2,230 3,525
Services ‐‐ 24,797 258,959 11,201 14,671
Transportation, Information, & Utilities ‐‐ 2,737 15,874 1,035 1,348
Wholesale Trade ‐‐ 3,312 19,593 1,364 2,371
Total Economy ‐‐ 80,556 615,484 27,204 42,864 aTotals may not add due to rounding. bValues of zero are nonzero values less than 1.

100
Table D.4. Direct Impacts from Agriculture and Forestrya, Memphis, 2011
Sector TIO Employment Labor Income TVA
(million $) (number) (million $) (million $)
Agricultural Inputs
Agricultural Chemicals
Fertilizer 97 80 4 7
Pesticide & other agricultural chemical 447 251 48 162
Lime & gypsum product 0 0 0 0
Total ‐‐ 544 330 52 169
Agricultural Machinery
Farm machinery & equipment 21 38 2 5
Lawn & garden equipment 368 917 44 82
Total ‐‐ 389 955 46 88
Agricultural Inputs Total ‐‐ 933 1,285 98 257
Primary Agriculture
Oilseed farming 374 8,059 2 166
Grain farming 408 12,321 8 128
Vegetable & melon farming 16 79 1 8
Fruit farming 1 4 0b 0b
Tree nut farming 0b 2 0b 0b
Greenhouse, nursery, & floriculture production 26 288 4 17
Tobacco farming 4 59 0b 1
Cotton farming 389 4,053 37 127
Sugarcane & sugar beet farming 0 0 0 0
All other crop farming 46 246 1 12
Cattle ranching & farming 72 574 2 12
Dairy cattle & milk production 9 44 0b 3
Poultry & egg production 54 118 2 11
Animal production, except cattle & poultry & eggs 52 1,287 6 26
Commercial fishing 0 0 0 0
Commercial hunting & trapping 19 263 0b 1
Support activities for agriculture & forestry 69 2,729 59 49
Primary Agriculture Total ‐‐ 1,540 30,127 123 562
Secondary Agriculture
Foods
Dog & cat food 494 343 43 161
Other animal food 32 28 3 5
Total ‐‐ 526 371 46 166
Grain & Oilseed Milling
Flour milling & malt 239 209 16 30
Wet corn milling 0 0 0 0
Soybean & other oilseed processing 760 442 37 45
Fats & oils refining & blending 384 94 9 39
Breakfast cereal 327 371 35 123
Total ‐‐ 1,710 1,115 96 237
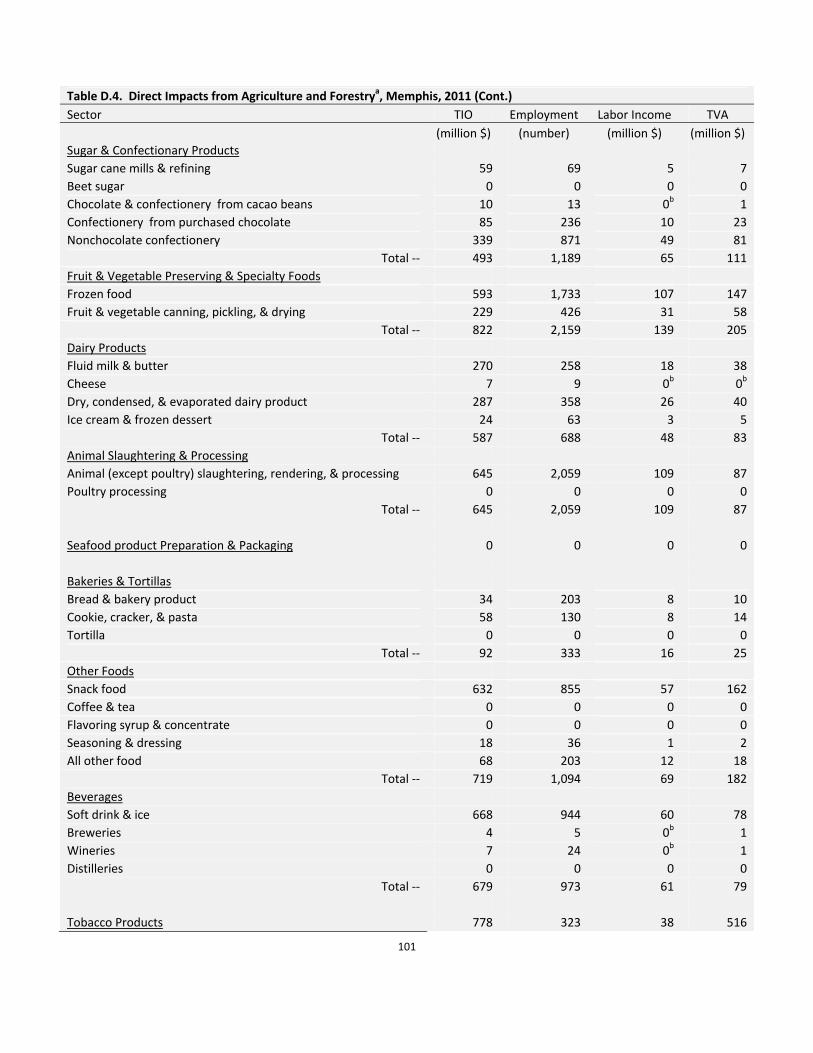
101
Table D.4. Direct Impacts from Agriculture and Forestrya, Memphis, 2011 (Cont.)
Sector TIO Employment Labor Income TVA
(million $) (number) (million $) (million $)
Sugar & Confectionary Products
Sugar cane mills & refining 59 69 5 7
Beet sugar 0 0 0 0
Chocolate & confectionery from cacao beans 10 13 0b 1
Confectionery from purchased chocolate 85 236 10 23
Nonchocolate confectionery 339 871 49 81
Total ‐‐ 493 1,189 65 111
Fruit & Vegetable Preserving & Specialty Foods
Frozen food 593 1,733 107 147
Fruit & vegetable canning, pickling, & drying 229 426 31 58
Total ‐‐ 822 2,159 139 205
Dairy Products
Fluid milk & butter 270 258 18 38
Cheese 7 9 0b 0b
Dry, condensed, & evaporated dairy product 287 358 26 40
Ice cream & frozen dessert 24 63 3 5
Total ‐‐ 587 688 48 83
Animal Slaughtering & Processing
Animal (except poultry) slaughtering, rendering, & processing 645 2,059 109 87
Poultry processing 0 0 0 0
Total ‐‐ 645 2,059 109 87
Seafood product Preparation & Packaging 0 0 0 0
Bakeries & Tortillas
Bread & bakery product 34 203 8 10
Cookie, cracker, & pasta 58 130 8 14
Tortilla 0 0 0 0
Total ‐‐ 92 333 16 25
Other Foods
Snack food 632 855 57 162
Coffee & tea 0 0 0 0
Flavoring syrup & concentrate 0 0 0 0
Seasoning & dressing 18 36 1 2
All other food 68 203 12 18
Total ‐‐ 719 1,094 69 182
Beverages
Soft drink & ice 668 944 60 78
Breweries 4 5 0b 1
Wineries 7 24 0b 1
Distilleries 0 0 0 0
Total ‐‐ 679 973 61 79
Tobacco Products 778 323 38 516

102
Table D.4. Direct Impacts from Agriculture and Forestrya, Memphis, 2011 (Cont.)
Sector TIO Employment Labor Income TVA
(million $) (number) (million $) (million $)
Textile Mills
Fiber, yarn, & thread mills 58 187 10 13
Broadwoven fabric mills 0 0 0 0
Narrow fabric mills & schiffli machine embroidery 0 0 0 0
Nonwoven fabric mills 9 18 1 2
Knit fabric mills 0 0 0 0
Textile & fabric finishing mills 58 259 14 17
Fabric coating mills 8 20 2 2
Total ‐‐ 133 484 27 34
Textile Products Mills
Carpet & rug mills 0 0 0 0
Curtain & linen mills 9 57 2 2
Textile bag & canvas mills 10 70 3 4
All other textile product mills 24 131 6 8
Total ‐‐ 42 259 12 14
Apparel
Apparel knitting mills 0 0 0 0
Cut & sew apparel contractors 15 233 6 8
Men's & boys' cut & sew apparel 29 229 6 9
Women's & girls' cut & sew apparel 16 76 2 2
Other cut & sew apparel 0 0 0 0
Apparel accessories & other apparel 4 43 1 1
Total ‐‐ 64 582 15 20
Leather & Allied Products
Leather & hide tanning & finishing 2 4 0b 0b
Footwear 35 273 8 10
Other leather & allied product 2 14 0b 1
Total ‐‐ 38 290 8 10
Secondary Agriculture Total ‐‐ 7,328 11,919 748 1,769
Agriculture Total ‐‐ 9,800 43,331 968 2,588
Forestry Inputs
Forestry, forest products, & timber tract production 4 19 0b 1
Commercial logging 68 1,141 26 22
Forestry Inputs Total ‐‐ 72 1,160 26 23
Primary Forestry
Sawmills & wood preservation 212 898 30 34
Pulp mills 93 117 20 27
Paper mills 2,810 3,190 532 1,041
Paperboard Mills 581 718 71 141
Primary Forestry Total ‐‐ 3,696 4,921 653 1,244

103
Table D.4. Direct Impacts from Agriculture and Forestrya, Memphis, 2011 (Cont.)
Sector TIO Employment Labor Income TVA
(million $) (number) (million $) (million $)
Secondary Forestry
Veneer, Plywood, & Engineered Wood Products
Veneer & plywood 2 7 0b 0b
Engineered wood member & truss 13 69 3 4
Reconstituted wood product 0 0 0 0
Total ‐‐ 15 76 3 5
Wood Windows & Doors & Millwork 206 1,276 56 60
Wood Container & Pallets 108 907 32 36
Manufactured Homes (Mobile Homes)
Manufactured home (mobile home) 54 379 16 15
Prefabricated wood building 8 53 3 3
Total ‐‐ 61 431 19 17
All Other Miscellaneous Wood Products 6 35 2 2
Paperboard Containers 407 1,079 65 81
Paper Bags & Coated & Treated Paper
Coated & laminated paper, packaging paper & plastics film 213 557 44 61
All other paper bag & coated & treated paper 55 178 12 14
Total ‐‐ 268 735 56 75
Stationery Products 36 132 5 6
Other Converted Paper Products
Sanitary paper product 400 540 42 119
All other converted paper product 0 0 0 0
Total ‐‐ 400 540 42 119
Wood Kitchen Cabinets & Countertops 38 288 15 13
Household & Institutional Furniture
Upholstered household furniture 10 38 5 6
Nonupholstered wood household furniture 13 97 5 6
Institutional furniture 64 213 10 25
Total ‐‐ 87 349 20 37
Office Furniture
Wood television, radio, & sewing machine cabinet 13 45 6 8
Office furniture & custom architectural woodwork & millwork 10 74 5 5

104
Table D.4. Direct Impacts from Agriculture and Forestrya, Memphis, 2011 (Cont.)
Sector TIO Employment Labor Income TVA
(million $) (number) (million $) (million $)
Showcase, partition, shelving, & locker 30 122 12 15
Total ‐‐ 53 240 23 28
Other Furniture Related Products
Mattress 9 29 2 4
Blind & shade 13 89 5 5
Total ‐‐ 23 118 7 9
Secondary Forestry Total ‐‐ 1,707 6,207 346 489
Forestry Total ‐‐ 5,475 12,288 1,025 1,755
Agriculture & Forestry Total ‐‐ 15,275 55,619 1,993 4,343
Construction ‐‐ 3,946 35,427 1,915 2,148
Finance, Insurance, & Real Estate ‐‐ 17,435 64,565 3,147 11,093
Government ‐‐ 10,779 134,891 8,464 9,466
Manufacturing ‐‐ 24,850 49,565 3,802 6,744
Mining ‐‐ 169 759 18 49
Miscellaneous ‐‐ 1,074 16,942 696 652
Retail Trade ‐‐ 6,138 87,815 2,902 4,382
Services ‐‐ 36,543 379,484 17,855 23,835
Transportation, Information, & Utilities ‐‐ 5,326 29,095 1,815 2,472
Wholesale Trade ‐‐ 6,469 38,585 2,632 4,615
Total Economy ‐‐ 128,004 892,748 45,239 69,802 aTotals may not add due to rounding. bValues of zero are nonzero values less than 1.

105
Table D.5. Direct Impacts from Agriculture and Forestrya, Nashville, 2011
Sector TIO Employment Labor Income TVA
(million $) (number) (million $) (million $)
Agricultural Inputs
Agricultural Chemicals
Fertilizer 0 0 0 0
Pesticide & other agricultural chemical 9 5 1 3
Lime & gypsum product 77 164 14 25
Total ‐‐ 86 169 15 28
Agricultural Machinery
Farm machinery & equipment 36 67 4 8
Lawn & garden equipment 39 76 12 15
Total ‐‐ 75 143 15 23
Agricultural Inputs Total ‐‐ 161 312 30 51
Primary Agriculture
Oilseed farming 80 4,351 0b 36
Grain farming 114 8,798 3 36
Vegetable & melon farming 25 264 2 14
Fruit farming 4 48 0b 2
Tree nut farming 0b 10 0b 0b
Greenhouse, nursery, & floriculture production 247 3,363 25 163
Tobacco farming 76 2,000 2 15
Cotton farming 12 393 2 4
Sugarcane & sugar beet farming 0 0 0 0
All other crop farming 175 1,794 5 46
Cattle ranching & farming 305 4,884 10 51
Dairy cattle & milk production 77 1,039 0b 28
Poultry & egg production 306 1,201 14 61
Animal production, except cattle & poultry & eggs 49 3,488 3 24
Commercial fishing 0 0 0 0
Commercial hunting & trapping 22 277 0b 3
Support activities for agriculture & forestry 60 2,854 53 42
Primary Agriculture Total ‐‐ 1,554 34,764 119 525
Secondary Agriculture
Foods
Dog & cat food 843 579 81 280
Other animal food 76 66 6 12
Total ‐‐ 919 645 88 292
Grain & Oilseed Milling
Flour milling & malt 89 78 6 11
Wet corn milling 0 0 0 0
Soybean & other oilseed processing 0 0 0 0
Fats & oils refining & blending 270 67 3 25
Breakfast cereal 24 28 2 9
Total ‐‐ 384 172 11 45
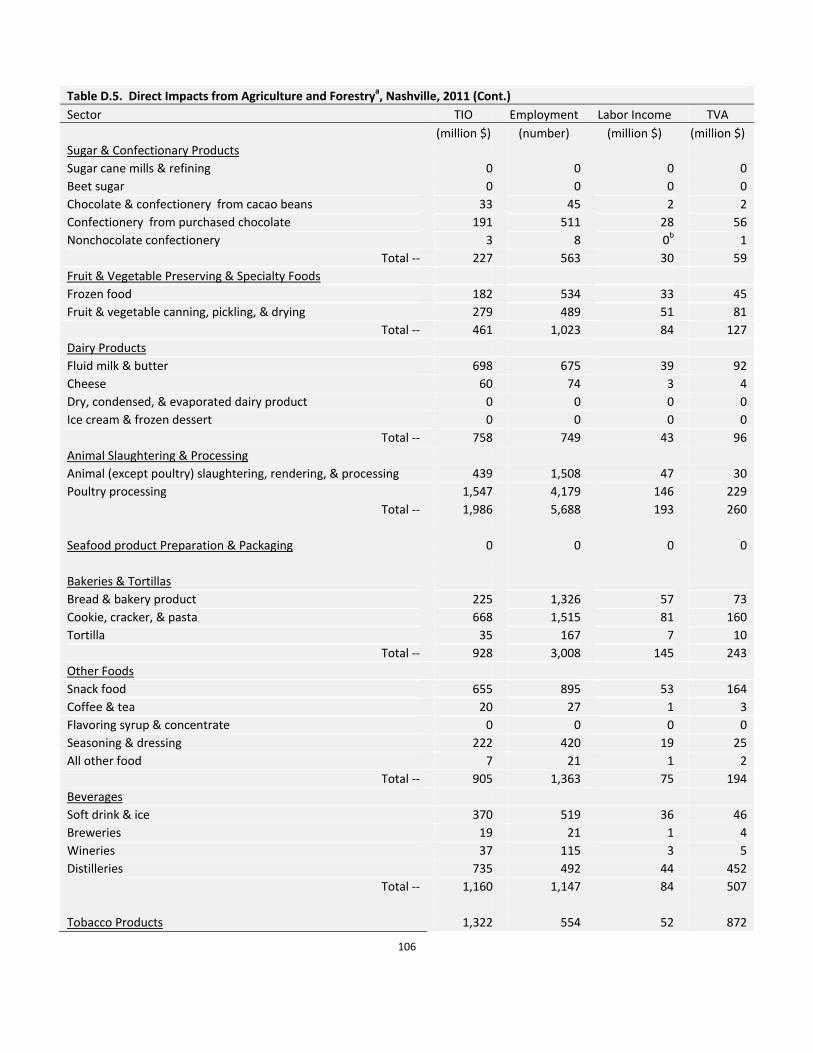
106
Table D.5. Direct Impacts from Agriculture and Forestrya, Nashville, 2011 (Cont.)
Sector TIO Employment Labor Income TVA
(million $) (number) (million $) (million $)
Sugar & Confectionary Products
Sugar cane mills & refining 0 0 0 0
Beet sugar 0 0 0 0
Chocolate & confectionery from cacao beans 33 45 2 2
Confectionery from purchased chocolate 191 511 28 56
Nonchocolate confectionery 3 8 0b 1
Total ‐‐ 227 563 30 59
Fruit & Vegetable Preserving & Specialty Foods
Frozen food 182 534 33 45
Fruit & vegetable canning, pickling, & drying 279 489 51 81
Total ‐‐ 461 1,023 84 127
Dairy Products
Fluid milk & butter 698 675 39 92
Cheese 60 74 3 4
Dry, condensed, & evaporated dairy product 0 0 0 0
Ice cream & frozen dessert 0 0 0 0
Total ‐‐ 758 749 43 96
Animal Slaughtering & Processing
Animal (except poultry) slaughtering, rendering, & processing 439 1,508 47 30
Poultry processing 1,547 4,179 146 229
Total ‐‐ 1,986 5,688 193 260
Seafood product Preparation & Packaging 0 0 0 0
Bakeries & Tortillas
Bread & bakery product 225 1,326 57 73
Cookie, cracker, & pasta 668 1,515 81 160
Tortilla 35 167 7 10
Total ‐‐ 928 3,008 145 243
Other Foods
Snack food 655 895 53 164
Coffee & tea 20 27 1 3
Flavoring syrup & concentrate 0 0 0 0
Seasoning & dressing 222 420 19 25
All other food 7 21 1 2
Total ‐‐ 905 1,363 75 194
Beverages
Soft drink & ice 370 519 36 46
Breweries 19 21 1 4
Wineries 37 115 3 5
Distilleries 735 492 44 452
Total ‐‐ 1,160 1,147 84 507
Tobacco Products 1,322 554 52 872

107
Table D.5. Direct Impacts from Agriculture and Forestrya, Nashville, 2011 (Cont.)
Sector TIO Employment Labor Income TVA
(million $) (number) (million $) (million $)
Textile Mills
Fiber, yarn, & thread mills 72 239 10 14
Broadwoven fabric mills 1 5 0b 0b
Narrow fabric mills & schiffli machine embroidery 0 0 0 0
Nonwoven fabric mills 262 519 42 70
Knit fabric mills 0 0 0 0
Textile & fabric finishing mills 20 98 3 4
Fabric coating mills 3 7 0b 1
Total ‐‐ 358 869 56 89
Textile Products Mills
Carpet & rug mills 68 223 9 14
Curtain & linen mills 9 66 1 2
Textile bag & canvas mills 14 110 3 4
All other textile product mills 115 664 28 36
Total ‐‐ 206 1,063 42 56
Apparel
Apparel knitting mills 0b 2 0b 0b
Cut & sew apparel contractors 33 519 13 16
Men's & boys' cut & sew apparel 134 891 43 56
Women's & girls' cut & sew apparel 18 88 2 2
Other cut & sew apparel 14 137 4 4
Apparel accessories & other apparel 4 31 1 1
Total ‐‐ 202 1,668 62 79
Leather & Allied Products
Leather & hide tanning & finishing 27 64 2 3
Footwear 39 295 10 12
Other leather & allied product 7 46 2 3
Total ‐‐ 72 405 15 18
Secondary Agriculture Total ‐‐ 9,887 18,916 979 2,937
Agriculture Total ‐‐ 11,601 53,992 1,128 3,513
Forestry Inputs
Forestry, forest products, & timber tract production 6 29 0b 1
Commercial logging 63 1,069 23 20
Forestry Inputs Total ‐‐ 69 1,098 24 20
Primary Forestry
Sawmills & wood preservation 372 1,584 50 58
Pulp mills 0 0 0 0
Paper mills 205 258 21 62
Paperboard Mills 0 0 0 0
Primary Forestry Total ‐‐ 577 1,843 71 120
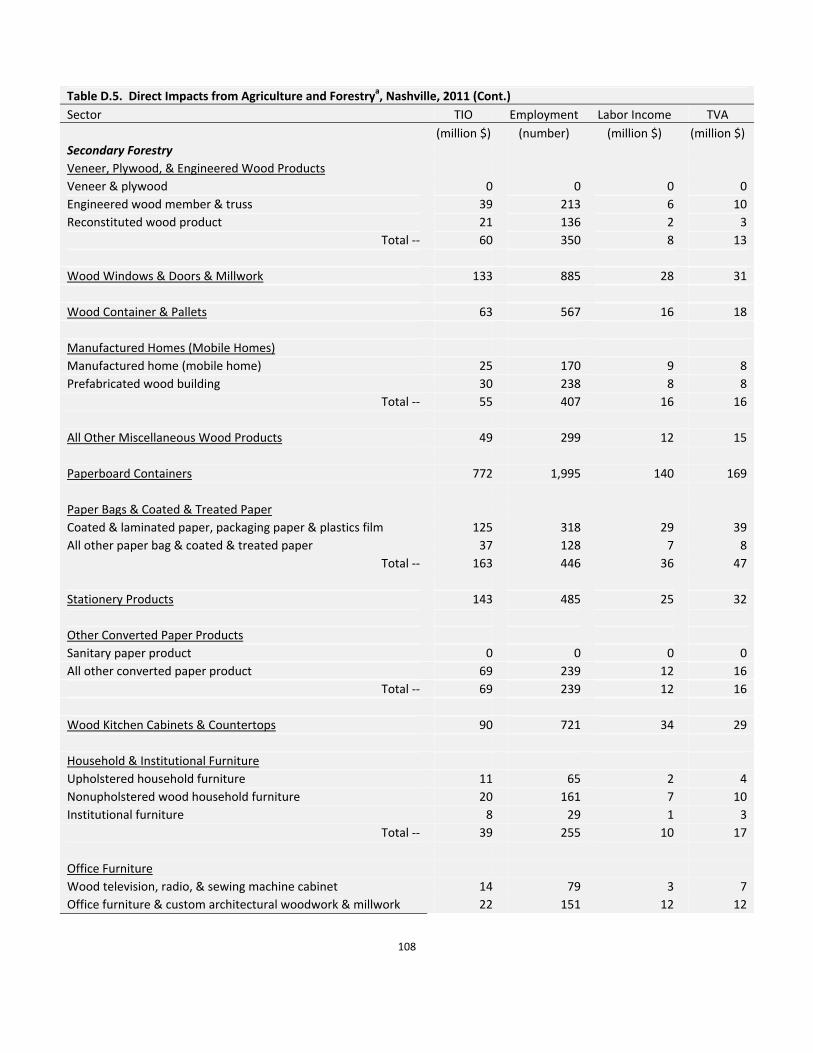
108
Table D.5. Direct Impacts from Agriculture and Forestrya, Nashville, 2011 (Cont.)
Sector TIO Employment Labor Income TVA
(million $) (number) (million $) (million $)
Secondary Forestry
Veneer, Plywood, & Engineered Wood Products
Veneer & plywood 0 0 0 0
Engineered wood member & truss 39 213 6 10
Reconstituted wood product 21 136 2 3
Total ‐‐ 60 350 8 13
Wood Windows & Doors & Millwork 133 885 28 31
Wood Container & Pallets 63 567 16 18
Manufactured Homes (Mobile Homes)
Manufactured home (mobile home) 25 170 9 8
Prefabricated wood building 30 238 8 8
Total ‐‐ 55 407 16 16
All Other Miscellaneous Wood Products 49 299 12 15
Paperboard Containers 772 1,995 140 169
Paper Bags & Coated & Treated Paper
Coated & laminated paper, packaging paper & plastics film 125 318 29 39
All other paper bag & coated & treated paper 37 128 7 8
Total ‐‐ 163 446 36 47
Stationery Products 143 485 25 32
Other Converted Paper Products
Sanitary paper product 0 0 0 0
All other converted paper product 69 239 12 16
Total ‐‐ 69 239 12 16
Wood Kitchen Cabinets & Countertops 90 721 34 29
Household & Institutional Furniture
Upholstered household furniture 11 65 2 4
Nonupholstered wood household furniture 20 161 7 10
Institutional furniture 8 29 1 3
Total ‐‐ 39 255 10 17
Office Furniture
Wood television, radio, & sewing machine cabinet 14 79 3 7
Office furniture & custom architectural woodwork & millwork 22 151 12 12
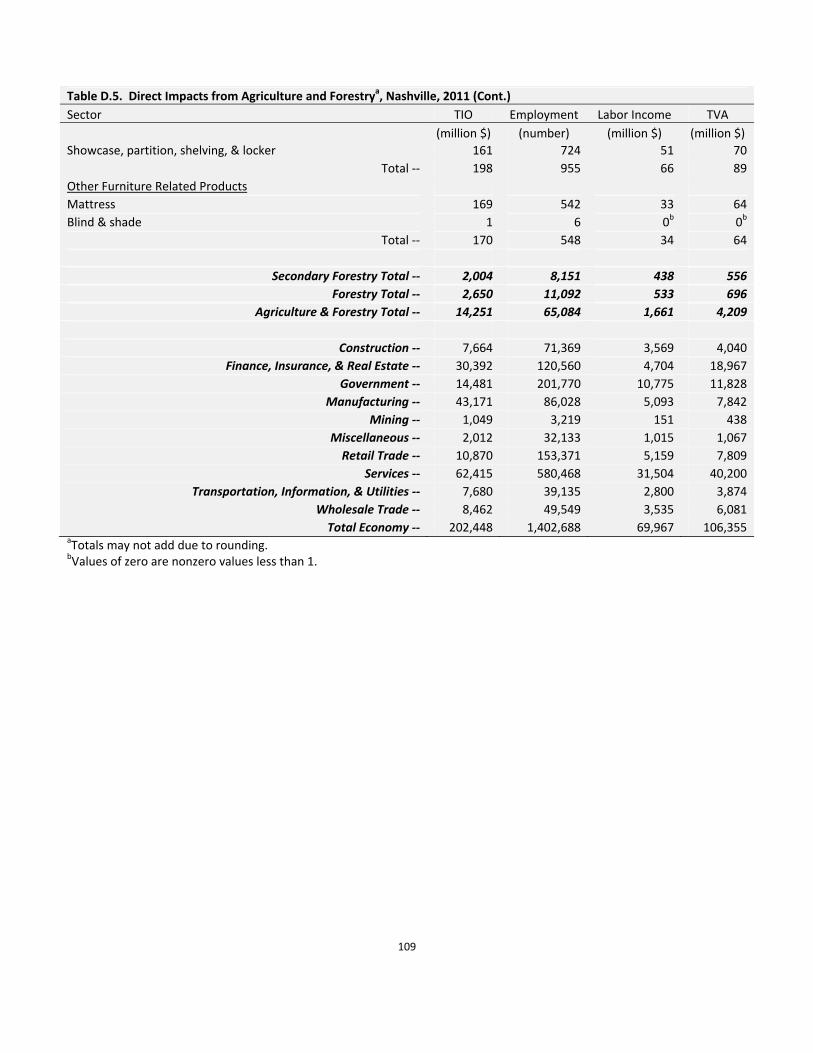
109
Table D.5. Direct Impacts from Agriculture and Forestrya, Nashville, 2011 (Cont.)
Sector TIO Employment Labor Income TVA
(million $) (number) (million $) (million $)
Showcase, partition, shelving, & locker 161 724 51 70
Total ‐‐ 198 955 66 89
Other Furniture Related Products
Mattress 169 542 33 64
Blind & shade 1 6 0b 0b
Total ‐‐ 170 548 34 64
Secondary Forestry Total ‐‐ 2,004 8,151 438 556
Forestry Total ‐‐ 2,650 11,092 533 696
Agriculture & Forestry Total ‐‐ 14,251 65,084 1,661 4,209
Construction ‐‐ 7,664 71,369 3,569 4,040
Finance, Insurance, & Real Estate ‐‐ 30,392 120,560 4,704 18,967
Government ‐‐ 14,481 201,770 10,775 11,828
Manufacturing ‐‐ 43,171 86,028 5,093 7,842
Mining ‐‐ 1,049 3,219 151 438
Miscellaneous ‐‐ 2,012 32,133 1,015 1,067
Retail Trade ‐‐ 10,870 153,371 5,159 7,809
Services ‐‐ 62,415 580,468 31,504 40,200
Transportation, Information, & Utilities ‐‐ 7,680 39,135 2,800 3,874
Wholesale Trade ‐‐ 8,462 49,549 3,535 6,081
Total Economy ‐‐ 202,448 1,402,688 69,967 106,355 aTotals may not add due to rounding. bValues of zero are nonzero values less than 1.
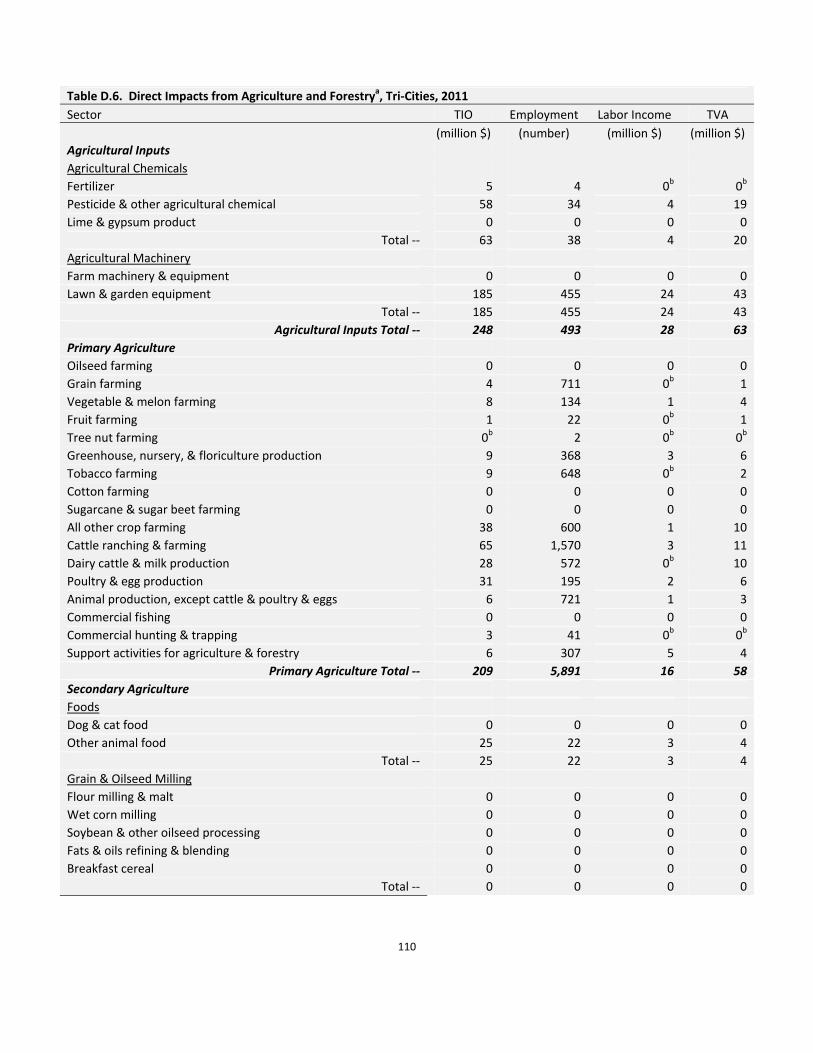
110
Table D.6. Direct Impacts from Agriculture and Forestrya, Tri‐Cities, 2011
Sector TIO Employment Labor Income TVA
(million $) (number) (million $) (million $)
Agricultural Inputs
Agricultural Chemicals
Fertilizer 5 4 0b 0b
Pesticide & other agricultural chemical 58 34 4 19
Lime & gypsum product 0 0 0 0
Total ‐‐ 63 38 4 20
Agricultural Machinery
Farm machinery & equipment 0 0 0 0
Lawn & garden equipment 185 455 24 43
Total ‐‐ 185 455 24 43
Agricultural Inputs Total ‐‐ 248 493 28 63
Primary Agriculture
Oilseed farming 0 0 0 0
Grain farming 4 711 0b 1
Vegetable & melon farming 8 134 1 4
Fruit farming 1 22 0b 1
Tree nut farming 0b 2 0b 0b
Greenhouse, nursery, & floriculture production 9 368 3 6
Tobacco farming 9 648 0b 2
Cotton farming 0 0 0 0
Sugarcane & sugar beet farming 0 0 0 0
All other crop farming 38 600 1 10
Cattle ranching & farming 65 1,570 3 11
Dairy cattle & milk production 28 572 0b 10
Poultry & egg production 31 195 2 6
Animal production, except cattle & poultry & eggs 6 721 1 3
Commercial fishing 0 0 0 0
Commercial hunting & trapping 3 41 0b 0b
Support activities for agriculture & forestry 6 307 5 4
Primary Agriculture Total ‐‐ 209 5,891 16 58
Secondary Agriculture
Foods
Dog & cat food 0 0 0 0
Other animal food 25 22 3 4
Total ‐‐ 25 22 3 4
Grain & Oilseed Milling
Flour milling & malt 0 0 0 0
Wet corn milling 0 0 0 0
Soybean & other oilseed processing 0 0 0 0
Fats & oils refining & blending 0 0 0 0
Breakfast cereal 0 0 0 0
Total ‐‐ 0 0 0 0
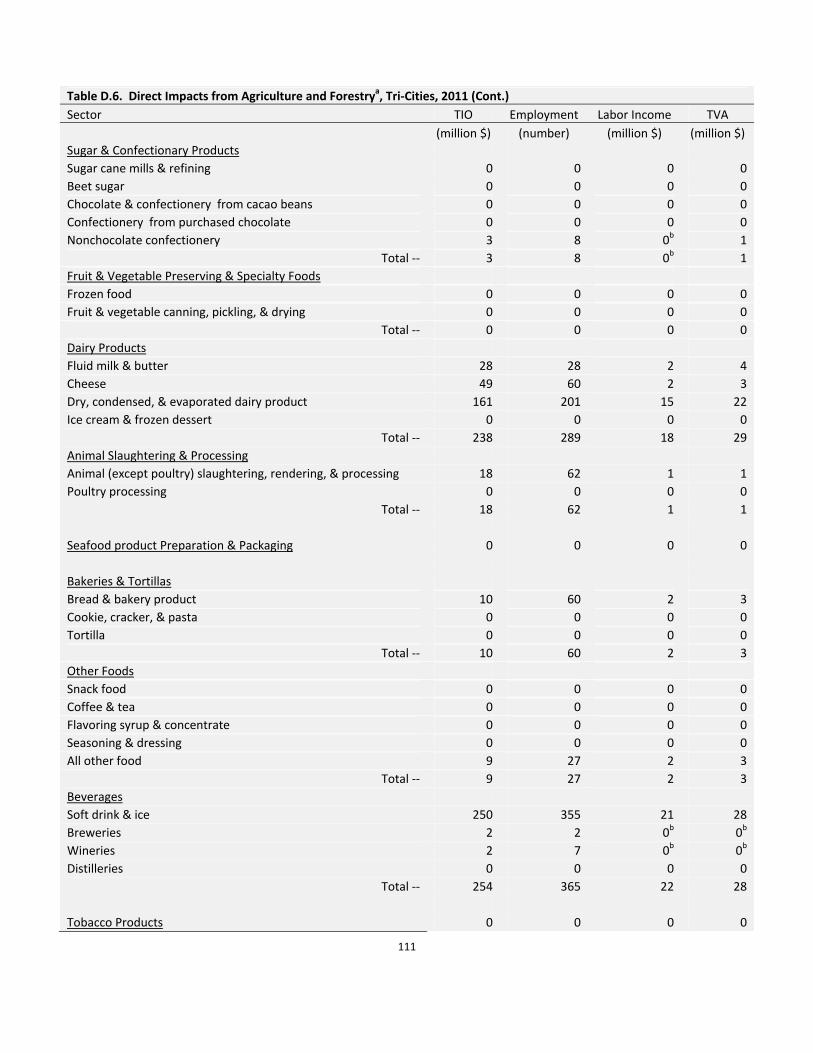
111
Table D.6. Direct Impacts from Agriculture and Forestrya, Tri‐Cities, 2011 (Cont.)
Sector TIO Employment Labor Income TVA
(million $) (number) (million $) (million $)
Sugar & Confectionary Products
Sugar cane mills & refining 0 0 0 0
Beet sugar 0 0 0 0
Chocolate & confectionery from cacao beans 0 0 0 0
Confectionery from purchased chocolate 0 0 0 0
Nonchocolate confectionery 3 8 0b 1
Total ‐‐ 3 8 0b 1
Fruit & Vegetable Preserving & Specialty Foods
Frozen food 0 0 0 0
Fruit & vegetable canning, pickling, & drying 0 0 0 0
Total ‐‐ 0 0 0 0
Dairy Products
Fluid milk & butter 28 28 2 4
Cheese 49 60 2 3
Dry, condensed, & evaporated dairy product 161 201 15 22
Ice cream & frozen dessert 0 0 0 0
Total ‐‐ 238 289 18 29
Animal Slaughtering & Processing
Animal (except poultry) slaughtering, rendering, & processing 18 62 1 1
Poultry processing 0 0 0 0
Total ‐‐ 18 62 1 1
Seafood product Preparation & Packaging 0 0 0 0
Bakeries & Tortillas
Bread & bakery product 10 60 2 3
Cookie, cracker, & pasta 0 0 0 0
Tortilla 0 0 0 0
Total ‐‐ 10 60 2 3
Other Foods
Snack food 0 0 0 0
Coffee & tea 0 0 0 0
Flavoring syrup & concentrate 0 0 0 0
Seasoning & dressing 0 0 0 0
All other food 9 27 2 3
Total ‐‐ 9 27 2 3
Beverages
Soft drink & ice 250 355 21 28
Breweries 2 2 0b 0b
Wineries 2 7 0b 0b
Distilleries 0 0 0 0
Total ‐‐ 254 365 22 28
Tobacco Products 0 0 0 0
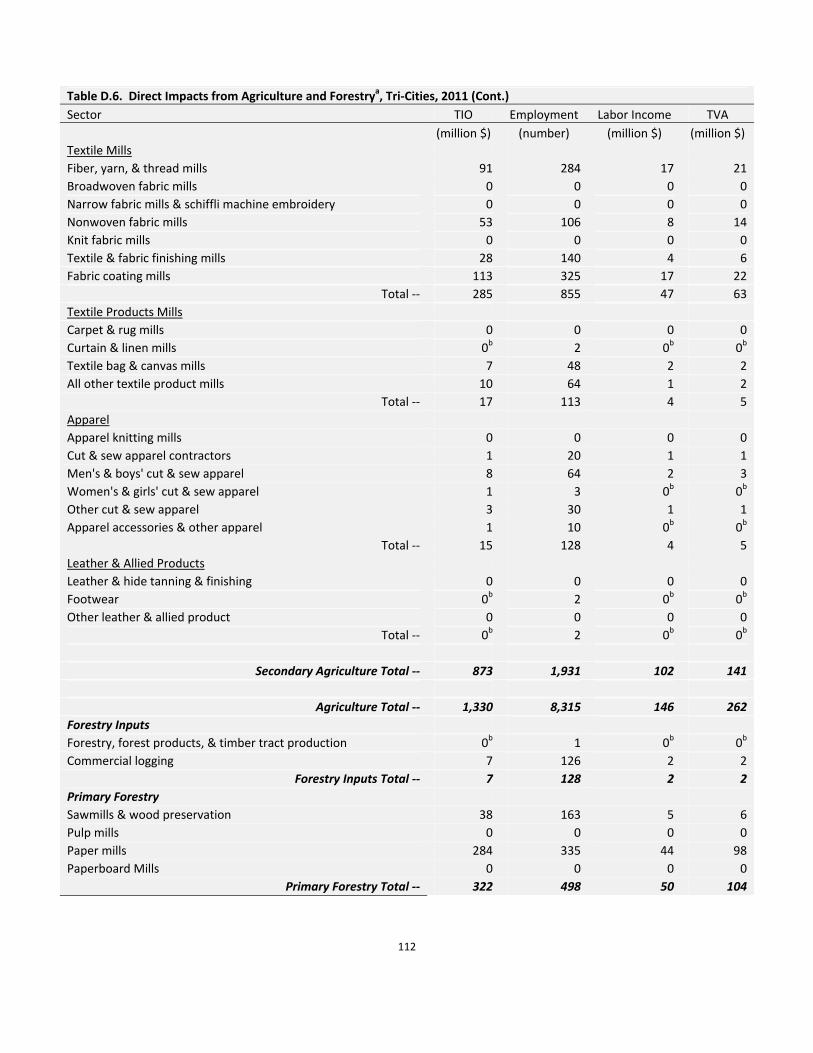
112
Table D.6. Direct Impacts from Agriculture and Forestrya, Tri‐Cities, 2011 (Cont.)
Sector TIO Employment Labor Income TVA
(million $) (number) (million $) (million $)
Textile Mills
Fiber, yarn, & thread mills 91 284 17 21
Broadwoven fabric mills 0 0 0 0
Narrow fabric mills & schiffli machine embroidery 0 0 0 0
Nonwoven fabric mills 53 106 8 14
Knit fabric mills 0 0 0 0
Textile & fabric finishing mills 28 140 4 6
Fabric coating mills 113 325 17 22
Total ‐‐ 285 855 47 63
Textile Products Mills
Carpet & rug mills 0 0 0 0
Curtain & linen mills 0b 2 0b 0b
Textile bag & canvas mills 7 48 2 2
All other textile product mills 10 64 1 2
Total ‐‐ 17 113 4 5
Apparel
Apparel knitting mills 0 0 0 0
Cut & sew apparel contractors 1 20 1 1
Men's & boys' cut & sew apparel 8 64 2 3
Women's & girls' cut & sew apparel 1 3 0b 0b
Other cut & sew apparel 3 30 1 1
Apparel accessories & other apparel 1 10 0b 0b
Total ‐‐ 15 128 4 5
Leather & Allied Products
Leather & hide tanning & finishing 0 0 0 0
Footwear 0b 2 0b 0b
Other leather & allied product 0 0 0 0
Total ‐‐ 0b 2 0b 0b
Secondary Agriculture Total ‐‐ 873 1,931 102 141
Agriculture Total ‐‐ 1,330 8,315 146 262
Forestry Inputs
Forestry, forest products, & timber tract production 0b 1 0b 0b
Commercial logging 7 126 2 2
Forestry Inputs Total ‐‐ 7 128 2 2
Primary Forestry
Sawmills & wood preservation 38 163 5 6
Pulp mills 0 0 0 0
Paper mills 284 335 44 98
Paperboard Mills 0 0 0 0
Primary Forestry Total ‐‐ 322 498 50 104

113
Table D.6. Direct Impacts from Agriculture and Forestrya, Tri‐Cities, 2011 (Cont.)
Sector TIO Employment Labor Income TVA
(million $) (number) (million $) (million $)
Secondary Forestry
Veneer, Plywood, & Engineered Wood Products
Veneer & plywood 2 10 0b 1
Engineered wood member & truss 22 111 5 7
Reconstituted wood product 0 0 0 0
Total ‐‐ 24 121 5 8
Wood Windows & Doors & Millwork 26 157 8 8
Wood Container & Pallets 22 187 6 7
Manufactured Homes (Mobile Homes)
Manufactured home (mobile home) 0 0 0 0
Prefabricated wood building 1 7 0b 0b
Total ‐‐ 1 7 0b 0b
All Other Miscellaneous Wood Products 0b 2 0b 0b
Paperboard Containers 87 246 10 13
Paper Bags & Coated & Treated Paper
Coated & laminated paper, packaging paper & plastics film 213 590 34 52
All other paper bag & coated & treated paper 4 14 1 1
Total ‐‐ 217 604 35 53
Stationery Products 0 0 0 0
Other Converted Paper Products
Sanitary paper product 0 0 0 0
All other converted paper product 22 80 3 4
Total ‐‐ 22 80 3 4
Wood Kitchen Cabinets & Countertops 5 43 2 2
Household & Institutional Furniture
Upholstered household furniture 29 155 9 13
Nonupholstered wood household furniture 11 58 6 7
Institutional furniture 8 26 1 3
Total ‐‐ 47 239 16 23
Office Furniture
Wood television, radio, & sewing machine cabinet 1 7 0b 1
Office furniture & custom architectural woodwork & millwork 4 36 2 2
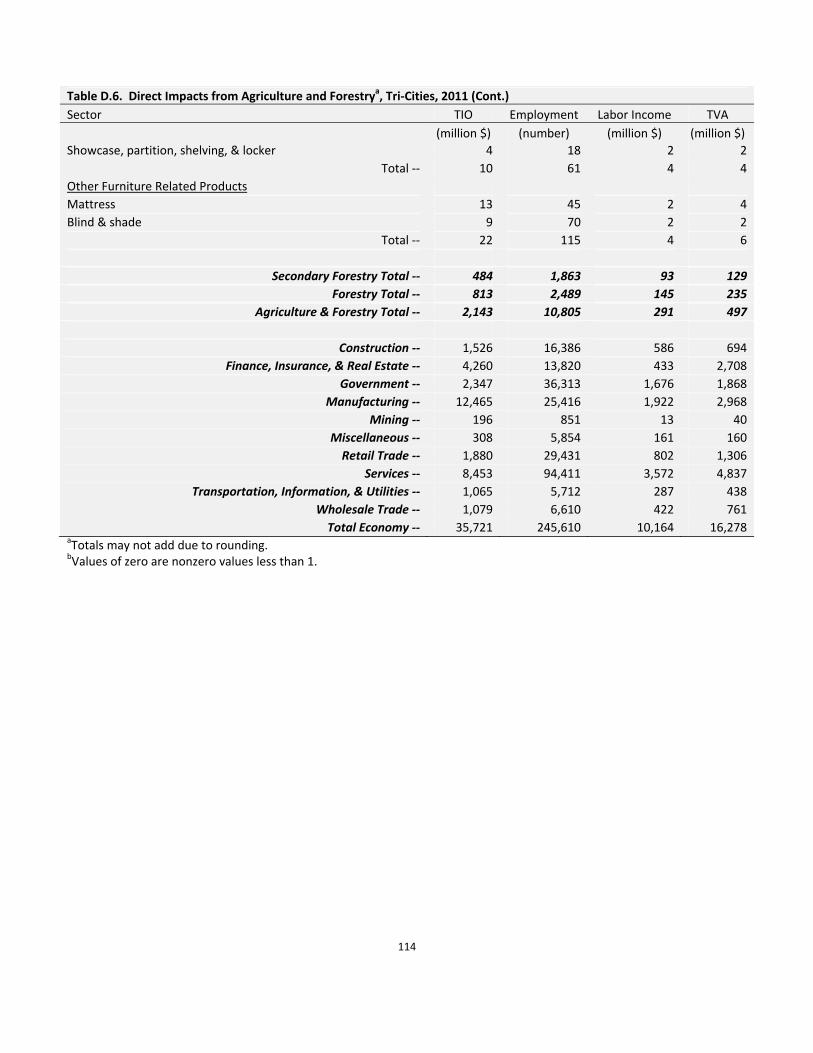
114
Table D.6. Direct Impacts from Agriculture and Forestrya, Tri‐Cities, 2011 (Cont.)
Sector TIO Employment Labor Income TVA
(million $) (number) (million $) (million $)
Showcase, partition, shelving, & locker 4 18 2 2
Total ‐‐ 10 61 4 4
Other Furniture Related Products
Mattress 13 45 2 4
Blind & shade 9 70 2 2
Total ‐‐ 22 115 4 6
Secondary Forestry Total ‐‐ 484 1,863 93 129
Forestry Total ‐‐ 813 2,489 145 235
Agriculture & Forestry Total ‐‐ 2,143 10,805 291 497
Construction ‐‐ 1,526 16,386 586 694
Finance, Insurance, & Real Estate ‐‐ 4,260 13,820 433 2,708
Government ‐‐ 2,347 36,313 1,676 1,868
Manufacturing ‐‐ 12,465 25,416 1,922 2,968
Mining ‐‐ 196 851 13 40
Miscellaneous ‐‐ 308 5,854 161 160
Retail Trade ‐‐ 1,880 29,431 802 1,306
Services ‐‐ 8,453 94,411 3,572 4,837
Transportation, Information, & Utilities ‐‐ 1,065 5,712 287 438
Wholesale Trade ‐‐ 1,079 6,610 422 761
Total Economy ‐‐ 35,721 245,610 10,164 16,278 aTotals may not add due to rounding. bValues of zero are nonzero values less than 1.
115
Appendix E. Total Impacts from the Agriculture and Forestry Sectors, Tennessee, 2011

116
Table E.1. Total Impacts from Agriculture and Forestrya, Tennessee, 2011
TIO Employment Labor Income TVA
Sector Type I Indirect
Type Sam Total
Type I Indirect
Type Sam Total
Type I Indirect
Type Sam Total
Type I Indirect
Type Sam Total
(million $) (number) (million $) (million $)
Agricultural Inputs
Agricultural Chemicals
Fertilizers 1.48 150 1.62 165 4.02 338 5.50 462 4.32 18 5.59 23 3.82 27 5.10 36 Pesticide & other agricultural chemicals 1.26 734 1.42 826 3.61 1,190 5.92 1,949 1.95 110 2.52 142 1.37 282 1.63 337
Lime & gypsum products 1.49 190 1.76 225 2.32 642 3.37 930 1.91 42 2.47 54 1.69 67 2.22 88
Total ‐‐ 1,074 1,216 2,169 3,340 169 219 376 461
Agricultural Machinery
Farm machinery & equipment 1.33 219 1.50 249 2.10 634 2.90 877 1.96 35 2.54 45 1.66 65 2.12 82
Lawn & garden equipment 1.28 760 1.47 869 1.68 2,432 2.30 3,331 1.66 131 2.14 169 1.56 220 2.03 285
Total ‐‐ 979 1,118 3,065 4,208 166 214 284 367
Agricultural Inputs Total ‐‐ 2,053 2,334 5,234 7,548 335 433 660 829
Primary Agriculture
Oilseed farming 1.30 601 1.38 636 1.13 14,835 1.15 15,124 16.81 42 21.74 54 1.39 285 1.49 306
Grain farming 1.39 745 1.50 806 1.11 25,849 1.13 26,347 6.21 72 8.04 93 1.72 290 1.94 326
Vegetable & melon farming 1.29 116 1.44 129 1.39 1,403 1.50 1,510 2.67 15 3.45 20 1.31 62 1.47 70
Fruit farming 1.29 12 1.44 14 1.40 176 1.50 188 3.46 2 4.47 2 1.29 7 1.46 8
Tree nut farming 1.27 1 1.47 1 1.19 23 1.25 24 1.90 0b 2.47 0b 1.25 1 1.46 1 Greenhouse, nursery, & floriculture production 1.14 362 1.31 416 1.12 5,885 1.20 6,330 1.30 63 1.69 82 1.12 233 1.27 266
Tobacco farming 1.46 141 1.61 156 1.17 3,698 1.21 3,817 5.24 17 6.77 22 2.31 45 2.76 53
Cotton farming 1.39 557 1.57 629 1.43 6,378 1.57 6,968 2.23 86 2.89 111 1.63 214 1.96 256
Sugarcane & sugar beet farming 0.00 0 0.00 0 0.00 0 0.00 0 0.00 0 0.00 0 0.00 0 0.00 0
All other crop farming 1.43 482 1.58 534 1.48 5,520 1.60 5,942 4.13 61 5.35 79 1.88 167 2.22 198
Cattle ranching & farming 1.70 999 1.83 1,071 1.52 15,207 1.57 15,797 3.30 85 4.27 110 2.44 240 2.88 283
Dairy cattle & milk production 1.39 249 1.49 267 1.23 3,515 1.28 3,662 4.18 21 5.42 27 1.45 94 1.61 105
Poultry & egg production 1.35 705 1.47 768 1.60 3,519 1.84 4,043 2.55 75 3.31 98 1.65 173 2.01 211 Animal production, except cattle/poultry/eggs 1.29 154 1.43 171 1.07 7,324 1.09 7,464 1.71 20 2.22 26 1.26 75 1.43 85
Commercial fishing 0.00 0 0.00 0 0.00 0 0.00 0 0.00 0 0.00 0 0.00 0 0.00 0

117
Table E.1. Total Impacts from Agriculture and Forestrya, Tennessee, 2011 (Cont.)
TIO Employment Labor Income TVA
Sector Type I Indirect
Type Sam Total Sector
Type I Indirect
Type Sam Total Sector
Type I Indirect
Type Sam Total Sector
Type I
(million $) (number) (million $) (million $)
Commercial hunting & trapping 1.51 80 1.68 88 1.34 899 1.45 970 17.48 10 22.60 13 3.33 20 4.18 26 Support activities for agriculture & forestry 1.16 182 1.90 299 1.02 7,165 1.16 8,132 1.05 142 1.35 183 1.10 120 1.74 190
Primary Agriculture Total ‐‐ 5,387 5,985 101,394 106,318 712 921 2,026 2,384
Secondary Agriculture
Foods
Dog & cat food 1.29 1,728 1.45 1,942 3.26 3,011 5.16 4,763 1.97 244 2.57 319 1.39 612 1.68 740
Other animal foods 1.32 229 1.47 255 2.85 432 4.25 646 2.24 30 2.93 39 1.92 51 2.50 67
Total ‐‐ 1,957 2,197 3,443 5,408 274 358 663 807
Grain & Oilseed Milling
Flour milling & malt 1.46 763 1.65 862 3.99 1,829 5.77 2,643 3.41 117 4.43 152 2.96 191 3.89 250
Wet corn milling 1.39 1,923 1.55 2,141 7.08 4,055 10.20 5,842 3.93 260 5.09 337 2.79 423 3.65 554 Soybean & other oilseed processing 1.12 849 1.19 904 2.16 954 3.19 1,411 1.81 66 2.34 86 1.95 87 2.70 121
Fats & oils refining & blending 1.30 1,127 1.37 1,192 6.13 1,309 8.61 1,837 4.86 77 6.28 100 2.07 178 2.52 216
Breakfast cereal 1.32 490 1.50 554 2.54 1,068 3.79 1,593 1.99 77 2.57 99 1.39 192 1.66 230
Total ‐‐ 5,151 5,653 9,214 13,325 598 773 1,071 1,371
Sugar & Confectionary Products
Sugar cane mills & refining 1.28 76 1.44 85 2.46 170 3.54 246 2.06 11 2.67 14 2.18 15 3.00 20
Beet sugar 0.00 0 0.00 0 0.00 0 0.00 0 0.00 0 0.00 0 0.00 0 0.00 0 Chocolate & confectionery from cacao beans 1.36 57 1.48 63 2.39 139 3.16 183 3.54 6 4.59 8 3.32 10 4.44 13 Confectionery from purchased chocolate 1.34 657 1.55 756 1.65 2,170 2.27 2,984 1.73 119 2.24 154 1.52 213 1.94 273
Nonchocolate confectionery 1.38 687 1.60 795 1.78 2,283 2.47 3,165 1.84 128 2.38 166 1.73 202 2.29 267
Total ‐‐ 1,477 1,698 4,763 6,578 264 342 439 572 Fruit & Vegetable Preserving & Specialty Foods
Frozen foods 1.40 1,190 1.66 1,410 1.76 4,362 2.49 6,170 1.70 264 2.20 342 1.72 365 2.34 497
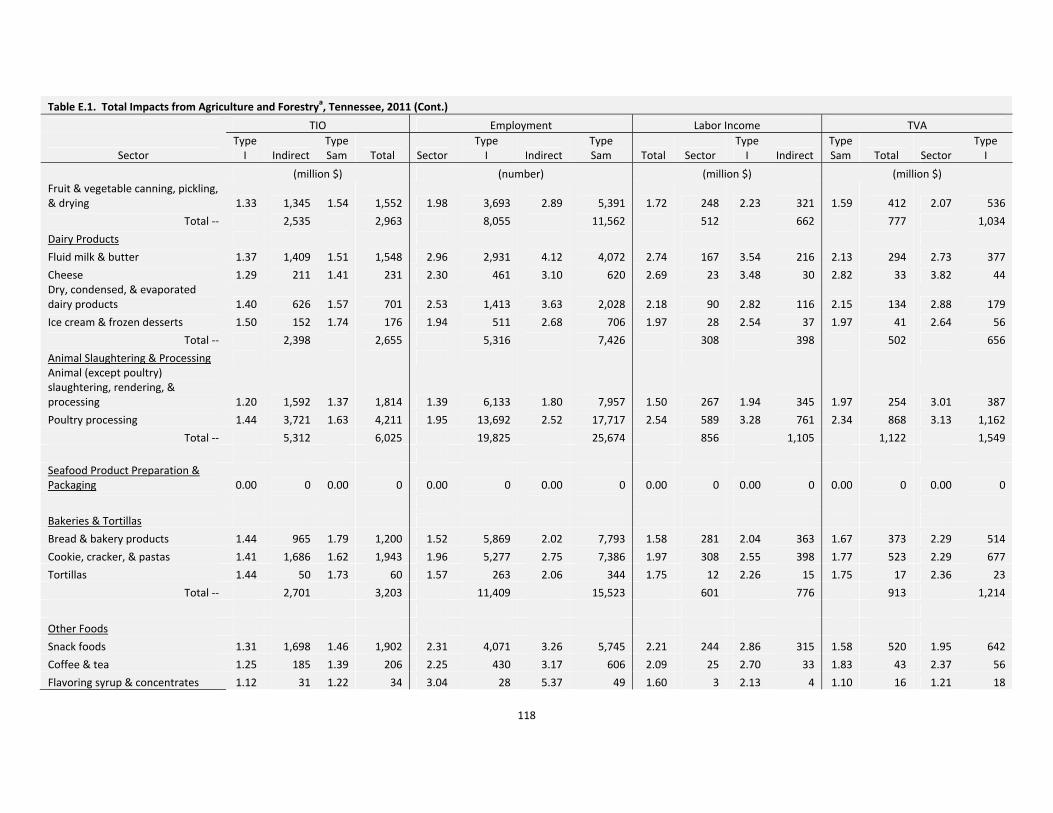
118
Table E.1. Total Impacts from Agriculture and Forestrya, Tennessee, 2011 (Cont.)
TIO Employment Labor Income TVA
Sector Type I Indirect
Type Sam Total Sector
Type I Indirect
Type Sam Total Sector
Type I Indirect
Type Sam Total Sector
Type I
(million $) (number) (million $) (million $) Fruit & vegetable canning, pickling, & drying 1.33 1,345 1.54 1,552 1.98 3,693 2.89 5,391 1.72 248 2.23 321 1.59 412 2.07 536
Total ‐‐ 2,535 2,963 8,055 11,562 512 662 777 1,034
Dairy Products
Fluid milk & butter 1.37 1,409 1.51 1,548 2.96 2,931 4.12 4,072 2.74 167 3.54 216 2.13 294 2.73 377
Cheese 1.29 211 1.41 231 2.30 461 3.10 620 2.69 23 3.48 30 2.82 33 3.82 44 Dry, condensed, & evaporated dairy products 1.40 626 1.57 701 2.53 1,413 3.63 2,028 2.18 90 2.82 116 2.15 134 2.88 179
Ice cream & frozen desserts 1.50 152 1.74 176 1.94 511 2.68 706 1.97 28 2.54 37 1.97 41 2.64 56
Total ‐‐ 2,398 2,655 5,316 7,426 308 398 502 656
Animal Slaughtering & Processing Animal (except poultry) slaughtering, rendering, & processing 1.20 1,592 1.37 1,814 1.39 6,133 1.80 7,957 1.50 267 1.94 345 1.97 254 3.01 387
Poultry processing 1.44 3,721 1.63 4,211 1.95 13,692 2.52 17,717 2.54 589 3.28 761 2.34 868 3.13 1,162
Total ‐‐ 5,312 6,025 19,825 25,674 856 1,105 1,122 1,549
Seafood Product Preparation & Packaging 0.00 0 0.00 0 0.00 0 0.00 0 0.00 0 0.00 0 0.00 0 0.00 0
Bakeries & Tortillas
Bread & bakery products 1.44 965 1.79 1,200 1.52 5,869 2.02 7,793 1.58 281 2.04 363 1.67 373 2.29 514
Cookie, cracker, & pastas 1.41 1,686 1.62 1,943 1.96 5,277 2.75 7,386 1.97 308 2.55 398 1.77 523 2.29 677
Tortillas 1.44 50 1.73 60 1.57 263 2.06 344 1.75 12 2.26 15 1.75 17 2.36 23
Total ‐‐ 2,701 3,203 11,409 15,523 601 776 913 1,214
Other Foods
Snack foods 1.31 1,698 1.46 1,902 2.31 4,071 3.26 5,745 2.21 244 2.86 315 1.58 520 1.95 642
Coffee & tea 1.25 185 1.39 206 2.25 430 3.17 606 2.09 25 2.70 33 1.83 43 2.37 56
Flavoring syrup & concentrates 1.12 31 1.22 34 3.04 28 5.37 49 1.60 3 2.13 4 1.10 16 1.21 18

119
Table E.1. Total Impacts from Agriculture and Forestrya, Tennessee, 2011 (Cont.)
TIO Employment Labor Income TVA
Sector Type I Indirect
Type Sam Total Sector
Type I Indirect
Type Sam Total Sector
Type I Indirect
Type Sam Total Sector
Type I
(million $) (number) (million $) (million $)
Seasoning & dressing 1.38 332 1.55 373 2.15 978 2.88 1,315 2.42 49 3.14 63 2.58 70 3.49 94
All other foods 1.34 139 1.58 165 1.70 524 2.37 731 1.62 30 2.10 39 1.62 46 2.16 61
Total ‐‐ 2,385 2,680 6,032 8,447 351 454 695 872
Beverages
Soft drink & ice 1.35 3,329 1.51 3,726 2.25 7,814 3.18 11,072 2.05 472 2.65 611 2.23 660 3.04 898
Breweries 1.34 33 1.47 36 2.58 73 3.49 98 3.77 4 4.90 5 1.75 9 2.13 11
Wineries 1.28 69 1.44 77 1.56 266 1.97 335 2.31 10 3.02 13 2.19 15 2.92 20
Distilleries 1.21 1,010 1.32 1,097 2.69 1,506 3.96 2,220 2.17 101 2.83 132 1.19 611 1.30 663
Total ‐‐ 4,441 4,937 9,658 13,725 587 761 1,295 1,592
Tobacco Products 1.18 2,471 1.25 2,624 2.69 2,358 4.13 3,618 2.04 182 2.65 236 1.13 1,569 1.20 1,661
Textile Mills
Fiber, yarn, & thread mills 1.26 582 1.45 667 1.31 1,984 1.77 2,675 1.45 101 1.87 130 1.45 133 2.00 184
Broadwoven fabric mills 1.26 2 1.54 2 1.38 8 1.99 11 1.33 0b 1.72 1 1.34 1 1.85 1 Narrow fabric mills & schiffli machine embroidery 1.24 24 1.65 33 1.19 158 1.68 224 1.18 10 1.52 13 1.23 11 1.77 16
Nonwoven fabric mills 1.23 502 1.41 578 1.54 1,246 2.31 1,870 1.39 91 1.80 118 1.33 147 1.75 192
Knit fabric mills 1.35 45 1.67 56 1.42 239 1.94 325 1.43 13 1.85 16 1.56 15 2.23 21
Textile & fabric finishing mills 1.34 185 1.60 221 1.45 962 1.89 1,256 1.59 43 2.05 55 1.69 56 2.34 77
Fabric coating mills 1.30 160 1.51 186 1.59 561 2.20 773 1.60 31 2.08 40 1.71 42 2.34 57
Total ‐‐ 1,502 1,743 5,157 7,134 288 373 404 548
Textile Product Mills
Carpet & rug mills 1.27 94 1.44 107 1.30 318 1.73 423 1.47 15 1.90 20 1.44 22 1.94 30
Curtain & linen mills 1.24 26 1.45 31 1.22 174 1.47 211 1.45 5 1.88 7 1.46 8 1.95 11
Textile bag & canvas mills 1.28 129 1.58 159 1.23 968 1.55 1,215 1.36 36 1.76 47 1.46 47 2.02 65
All other textile product mills 1.28 338 1.55 408 1.27 1,958 1.64 2,534 1.36 84 1.76 109 1.41 113 1.93 155
Total ‐‐ 587 704 3,418 4,382 141 182 190 260

120
Table E.1. Total Impacts from Agriculture and Forestrya, Tennessee, 2011 (Cont.)
TIO Employment Labor Income TVA
Sector Type I Indirect
Type Sam Total Sector
Type I Indirect
Type Sam Total Sector
Type I Indirect
Type Sam Total Sector
Type I
(million $) (number) (million $) (million $)
Apparel
Apparel knitting mills 1.38 173 1.68 211 1.38 1,192 1.73 1,498 1.59 45 2.05 58 1.65 59 2.27 82
Cut & sew apparel contractors 1.38 100 1.85 133 1.18 1,335 1.43 1,610 1.36 40 1.76 52 1.45 51 2.02 71
Mens & boys cut & sew apparel 1.32 499 1.69 639 1.42 3,587 1.87 4,736 1.43 168 1.85 217 1.47 227 2.01 311
Womens & girls cut & sew apparel 1.53 62 1.80 74 1.94 392 2.40 485 3.04 13 3.93 17 3.27 19 4.42 26
Other cut & sew apparel 1.43 34 1.80 43 1.34 317 1.64 390 1.62 11 2.09 14 1.83 13 2.56 19 Apparel accessories & other apparel 1.42 17 1.73 21 1.32 148 1.59 179 1.68 5 2.17 6 2.00 6 2.80 8
Total ‐‐ 885 1,120 6,972 8,898 282 364 376 517
Leather & Allied Products
Leather & hide tanning & finishing 1.47 42 1.66 47 2.31 157 2.97 203 2.96 7 3.82 9 3.00 9 4.08 12
Footwear 1.31 97 1.60 118 1.28 730 1.59 907 1.46 26 1.88 34 1.56 34 2.16 47
Other leather & allied products 1.35 21 1.67 26 1.29 167 1.60 207 1.47 6 1.91 8 1.59 8 2.18 11
Total ‐‐ 159 191 1,054 1,317 39 50 51 70
Secondary Agriculture Total ‐‐ 33,962 38,393 96,674 133,018 5,282 6,835 10,067 12,722
Agriculture Total ‐‐ 41,402 46,712 203,302 246,885 6,329 8,190 12,754 15,935
Forestry Inputs Forestry, forest products, & timber tract production 1.57 21 1.88 25 4.45 252 5.05 286 4.74 5 6.11 6 2.60 7 3.51 9
Commercial logging 1.28 207 1.66 268 1.20 3,301 1.39 3,809 1.25 76 1.61 97 1.43 72 2.16 109
Forestry Inputs Total ‐‐ 227 293 3,553 4,095 80 104 79 118
Sawmills & wood preservation 1.36 1,006 1.57 1,163 1.55 4,875 1.96 6,167 1.84 188 2.37 242 1.98 232 2.78 326
Pulp mills 1.46 334 1.71 391 3.12 967 4.62 1,434 1.96 67 2.54 87 1.82 98 2.44 132
Paper mills 1.34 5,181 1.57 6,097 2.71 12,170 4.39 19,708 1.62 1,090 2.10 1,411 1.40 1,948 1.80 2,497
Paperboard Mills 1.43 1,124 1.65 1,300 3.15 3,052 4.65 4,497 2.07 209 2.68 270 1.72 337 2.26 443
Primary Forestry Total ‐‐ 7,645 8,950 21,063 31,806 1,554 2,010 2,616 3,398

121
Table E.1. Total Impacts from Agriculture and Forestrya, Tennessee, 2011 (Cont.)
TIO Employment Labor Income TVA
Sector Type I Indirect
Type Sam Total Sector
Type I Indirect
Type Sam Total Sector
Type I Indirect
Type Sam Total Sector
Type I
(million $) (number) (million $) (million $)
Secondary Forestry Veneer, Plywood, & Engineered Wood Products
Veneer & plywood 1.23 9 1.43 11 1.34 47 1.70 60 1.53 2 1.98 2 1.46 3 1.96 4
Engineered wood member & truss 1.28 131 1.54 157 1.39 746 1.78 959 1.56 31 2.01 40 1.52 47 2.02 62
Reconstituted wood products 1.27 79 1.56 97 1.31 433 1.75 579 1.34 21 1.73 28 1.40 24 2.02 35
Total ‐‐ 220 265 1,226 1,599 54 70 74 101
Wood Windows & Doors & Millwork 1.31 605 1.62 744 1.33 3,926 1.72 5,072 1.48 167 1.91 215 1.64 200 2.32 283
Wood Containers & Pallets 1.28 326 1.60 408 1.23 2,675 1.53 3,346 1.36 98 1.75 126 1.46 120 2.06 168
Manufactured Homes (Mobile Homes) Manufactured homes (mobile homes) 1.46 441 1.89 571 1.48 2,895 2.02 3,971 1.43 157 1.85 203 1.60 162 2.38 240
Prefabricated wood buildings 1.31 62 1.66 79 1.31 457 1.71 596 1.36 20 1.76 26 1.51 23 2.17 33
Total ‐‐ 503 650 3,352 4,568 177 229 185 273
All Other Miscellaneous Wood Products 1.40 131 1.71 160 1.47 876 1.87 1,114 1.72 35 2.23 45 1.78 48 2.43 65
Paperboard Containers 1.26 2,427 1.48 2,857 1.68 8,481 2.38 12,023 1.56 515 2.01 665 1.68 677 2.32 935 Paper Bags & Coated & Treated Paper Coated & laminated paper, packaging paper & plastics film 1.23 737 1.46 876 1.52 2,410 2.24 3,551 1.39 166 1.80 214 1.40 235 1.90 318 All other paper bag & coated & treated paper 1.23 166 1.47 198 1.45 647 2.04 909 1.40 38 1.81 49 1.51 47 2.11 66
Total ‐‐ 903 1,073 3,057 4,460 204 263 282 384
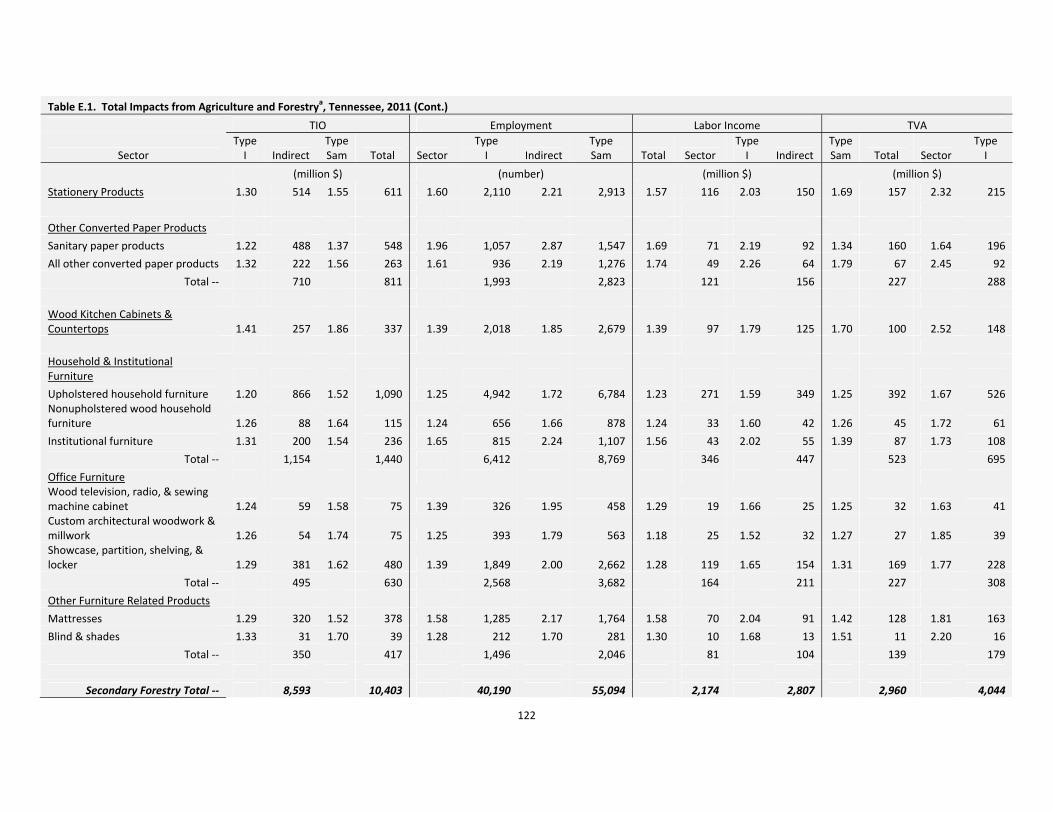
122
Table E.1. Total Impacts from Agriculture and Forestrya, Tennessee, 2011 (Cont.)
TIO Employment Labor Income TVA
Sector Type I Indirect
Type Sam Total Sector
Type I Indirect
Type Sam Total Sector
Type I Indirect
Type Sam Total Sector
Type I
(million $) (number) (million $) (million $)
Stationery Products 1.30 514 1.55 611 1.60 2,110 2.21 2,913 1.57 116 2.03 150 1.69 157 2.32 215
Other Converted Paper Products
Sanitary paper products 1.22 488 1.37 548 1.96 1,057 2.87 1,547 1.69 71 2.19 92 1.34 160 1.64 196
All other converted paper products 1.32 222 1.56 263 1.61 936 2.19 1,276 1.74 49 2.26 64 1.79 67 2.45 92
Total ‐‐ 710 811 1,993 2,823 121 156 227 288
Wood Kitchen Cabinets & Countertops 1.41 257 1.86 337 1.39 2,018 1.85 2,679 1.39 97 1.79 125 1.70 100 2.52 148
Household & Institutional Furniture
Upholstered household furniture 1.20 866 1.52 1,090 1.25 4,942 1.72 6,784 1.23 271 1.59 349 1.25 392 1.67 526 Nonupholstered wood household furniture 1.26 88 1.64 115 1.24 656 1.66 878 1.24 33 1.60 42 1.26 45 1.72 61
Institutional furniture 1.31 200 1.54 236 1.65 815 2.24 1,107 1.56 43 2.02 55 1.39 87 1.73 108
Total ‐‐ 1,154 1,440 6,412 8,769 346 447 523 695
Office Furniture Wood television, radio, & sewing machine cabinet 1.24 59 1.58 75 1.39 326 1.95 458 1.29 19 1.66 25 1.25 32 1.63 41 Custom architectural woodwork & millwork 1.26 54 1.74 75 1.25 393 1.79 563 1.18 25 1.52 32 1.27 27 1.85 39 Showcase, partition, shelving, & locker 1.29 381 1.62 480 1.39 1,849 2.00 2,662 1.28 119 1.65 154 1.31 169 1.77 228
Total ‐‐ 495 630 2,568 3,682 164 211 227 308
Other Furniture Related Products
Mattresses 1.29 320 1.52 378 1.58 1,285 2.17 1,764 1.58 70 2.04 91 1.42 128 1.81 163
Blind & shades 1.33 31 1.70 39 1.28 212 1.70 281 1.30 10 1.68 13 1.51 11 2.20 16
Total ‐‐ 350 417 1,496 2,046 81 104 139 179
Secondary Forestry Total ‐‐ 8,593 10,403 40,190 55,094 2,174 2,807 2,960 4,044

123
Table E.1. Total Impacts from Agriculture and Forestrya, Tennessee, 2011 (Cont.)
TIO Employment Labor Income TVA
Sector Type I Indirect
Type Sam Total Sector
Type I Indirect
Type Sam Total Sector
Type I Indirect
Type Sam Total Sector
Type I
(million $) (number) (million $) (million $)
Forestry Total ‐‐ 16,465 19,647 64,807 90,995 3,808 4,920 5,655 7,559
Agriculture & Forestry Total ‐‐ 57,867 66,359 268,109 337,880 10,137 13,110 18,408 23,494
Construction ‐‐ 24,808 33,658 222,674 295,485 10,725 13,818 12,943 18,241 Finance, Insurance, & Real Estate ‐
‐ 100,382 117,935 429,823 556,866 18,161 23,559 61,677 72,180
Government ‐‐ 46,691 73,158 566,255 784,063 31,561 40,813 33,972 48,534
Manufacturing ‐‐ 138,946 160,331 414,912 590,879 24,932 32,408 38,843 51,636
Mining ‐‐ 3,440 3,998 14,707 19,303 659 854 1,429 1,763
Miscellaneous ‐‐ 6,745 9,463 92,039 114,404 3,238 4,188 3,706 5,332
Retail Trade ‐‐ 34,054 46,538 444,981 547,699 15,005 19,369 23,421 30,892
Services ‐‐ 187,815 259,208 1,805,389 2,392,794 85,804 110,758 116,358 159,088 Transportation, Information, &
Utilities ‐‐ 25,375 33,144 154,237 218,153 9,209 11,925 12,761 17,411
Wholesale Trade ‐‐ 26,136 35,181 165,705 240,128 10,731 13,892 18,163 23,575 aTotals may not add due to rounding. bValues of zero are nonzero values less than 1.
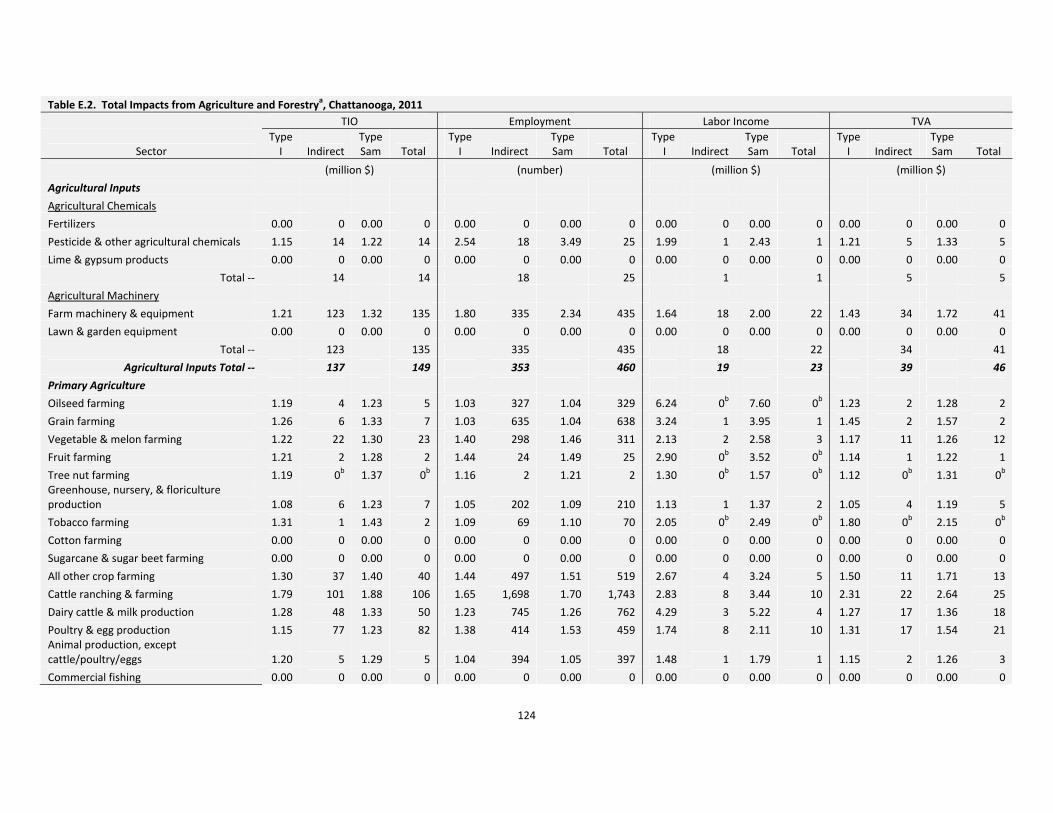
124
Table E.2. Total Impacts from Agriculture and Forestrya, Chattanooga, 2011
TIO Employment Labor Income TVA
Sector Type I Indirect
Type Sam Total
Type I Indirect
Type Sam Total
Type I Indirect
Type Sam Total
Type I Indirect
Type Sam Total
(million $) (number) (million $) (million $)
Agricultural Inputs
Agricultural Chemicals
Fertilizers 0.00 0 0.00 0 0.00 0 0.00 0 0.00 0 0.00 0 0.00 0 0.00 0
Pesticide & other agricultural chemicals 1.15 14 1.22 14 2.54 18 3.49 25 1.99 1 2.43 1 1.21 5 1.33 5
Lime & gypsum products 0.00 0 0.00 0 0.00 0 0.00 0 0.00 0 0.00 0 0.00 0 0.00 0
Total ‐‐ 14 14 18 25 1 1 5 5
Agricultural Machinery
Farm machinery & equipment 1.21 123 1.32 135 1.80 335 2.34 435 1.64 18 2.00 22 1.43 34 1.72 41
Lawn & garden equipment 0.00 0 0.00 0 0.00 0 0.00 0 0.00 0 0.00 0 0.00 0 0.00 0
Total ‐‐ 123 135 335 435 18 22 34 41
Agricultural Inputs Total ‐‐ 137 149 353 460 19 23 39 46
Primary Agriculture
Oilseed farming 1.19 4 1.23 5 1.03 327 1.04 329 6.24 0b 7.60 0b 1.23 2 1.28 2
Grain farming 1.26 6 1.33 7 1.03 635 1.04 638 3.24 1 3.95 1 1.45 2 1.57 2
Vegetable & melon farming 1.22 22 1.30 23 1.40 298 1.46 311 2.13 2 2.58 3 1.17 11 1.26 12
Fruit farming 1.21 2 1.28 2 1.44 24 1.49 25 2.90 0b 3.52 0b 1.14 1 1.22 1
Tree nut farming 1.19 0b 1.37 0b 1.16 2 1.21 2 1.30 0b 1.57 0b 1.12 0b 1.31 0b Greenhouse, nursery, & floriculture production 1.08 6 1.23 7 1.05 202 1.09 210 1.13 1 1.37 2 1.05 4 1.19 5
Tobacco farming 1.31 1 1.43 2 1.09 69 1.10 70 2.05 0b 2.49 0b 1.80 0b 2.15 0b
Cotton farming 0.00 0 0.00 0 0.00 0 0.00 0 0.00 0 0.00 0 0.00 0 0.00 0
Sugarcane & sugar beet farming 0.00 0 0.00 0 0.00 0 0.00 0 0.00 0 0.00 0 0.00 0 0.00 0
All other crop farming 1.30 37 1.40 40 1.44 497 1.51 519 2.67 4 3.24 5 1.50 11 1.71 13
Cattle ranching & farming 1.79 101 1.88 106 1.65 1,698 1.70 1,743 2.83 8 3.44 10 2.31 22 2.64 25
Dairy cattle & milk production 1.28 48 1.33 50 1.23 745 1.26 762 4.29 3 5.22 4 1.27 17 1.36 18
Poultry & egg production 1.15 77 1.23 82 1.38 414 1.53 459 1.74 8 2.11 10 1.31 17 1.54 21 Animal production, except cattle/poultry/eggs 1.20 5 1.29 5 1.04 394 1.05 397 1.48 1 1.79 1 1.15 2 1.26 3
Commercial fishing 0.00 0 0.00 0 0.00 0 0.00 0 0.00 0 0.00 0 0.00 0 0.00 0

125
Table E.2. Total Impacts from Agriculture and Forestrya, Chattanooga, 2011 (Cont.)
TIO Employment Labor Income TVA
Sector Type I Indirect
Type Sam Total Sector
Type I Indirect
Type Sam Total Sector
Type I Indirect
Type Sam Total Sector
Type I
(million $) (number) (million $) (million $)
Commercial hunting & trapping 1.37 8 1.47 9 1.28 104 1.34 109 10.71 1 13.05 1 4.46 2 5.45 2 Support activities for agriculture & forestry 1.19 7 1.63 10 1.01 598 1.05 621 1.09 4 1.32 5 1.32 2 2.23 4
Primary Agriculture Total ‐‐ 325 346 6,008 6,196 35 42 95 108
Secondary Agriculture
Foods
Dog & cat food 0.00 0 0.00 0 0.00 0 0.00 0 0.00 0 0.00 0 0.00 0 0.00 0
Other animal foods 0.00 0 0.00 0 0.00 0 0.00 0 0.00 0 0.00 0 0.00 0 0.00 0
Total ‐‐ 0 0 0 0 0 0 0 0
Grain & Oilseed Milling
Flour milling & malt 1.37 188 1.48 204 3.43 416 4.57 554 3.22 25 3.93 30 2.47 39 3.07 48
Wet corn milling 0.00 0 0.00 0 0.00 0 0.00 0 0.00 0 0.00 0 0.00 0 0.00 0
Soybean & other oilseed processing 0.00 0 0.00 0 0.00 0 0.00 0 0.00 0 0.00 0 0.00 0 0.00 0
Fats & oils refining & blending 1.19 256 1.23 266 4.91 260 6.44 341 3.70 15 4.50 18 1.70 36 1.96 42
Breakfast cereal 1.24 23 1.34 25 2.19 47 2.97 64 1.82 3 2.21 4 1.26 9 1.42 10
Total ‐‐ 467 494 723 959 43 52 84 100
Sugar & Confectionary Products
Sugar cane mills & refining 0.00 0 0.00 0 0.00 0 0.00 0 0.00 0 0.00 0 0.00 0 0.00 0
Beet sugar 0.00 0 0.00 0 0.00 0 0.00 0 0.00 0 0.00 0 0.00 0 0.00 0 Chocolate & confectionery from cacao beans 0.00 0 0.00 0 0.00 0 0.00 0 0.00 0 0.00 0 0.00 0 0.00 0
Confectionery from purchased chocolate 1.19 215 1.33 240 1.44 686 1.89 900 1.40 39 1.71 48 1.27 69 1.54 83
Nonchocolate confectionery 1.23 173 1.37 192 1.55 565 2.00 730 1.55 30 1.88 36 1.44 47 1.78 58
Total ‐‐ 388 432 1,251 1,630 69 84 116 141 Fruit & Vegetable Preserving & Specialty Foods
Frozen foods 1.29 36 1.49 42 1.60 126 2.20 173 1.41 9 1.72 10 1.41 11 1.81 14
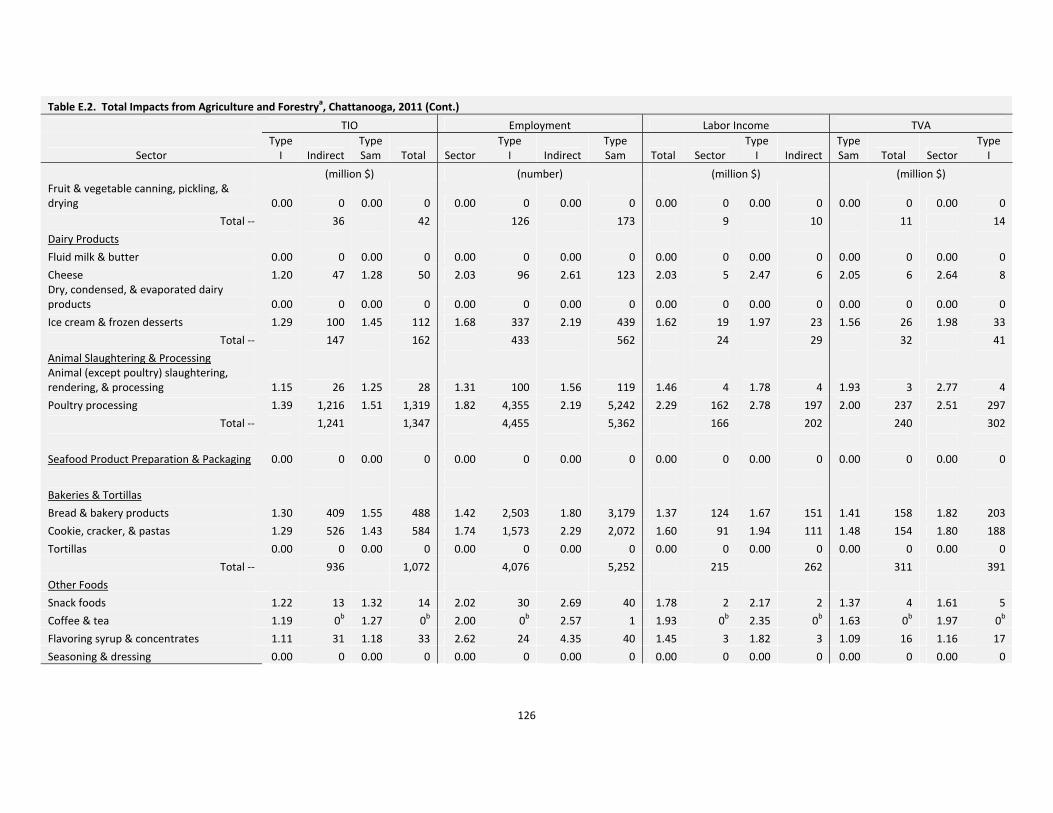
126
Table E.2. Total Impacts from Agriculture and Forestrya, Chattanooga, 2011 (Cont.)
TIO Employment Labor Income TVA
Sector Type I Indirect
Type Sam Total Sector
Type I Indirect
Type Sam Total Sector
Type I Indirect
Type Sam Total Sector
Type I
(million $) (number) (million $) (million $) Fruit & vegetable canning, pickling, & drying 0.00 0 0.00 0 0.00 0 0.00 0 0.00 0 0.00 0 0.00 0 0.00 0
Total ‐‐ 36 42 126 173 9 10 11 14
Dairy Products
Fluid milk & butter 0.00 0 0.00 0 0.00 0 0.00 0 0.00 0 0.00 0 0.00 0 0.00 0
Cheese 1.20 47 1.28 50 2.03 96 2.61 123 2.03 5 2.47 6 2.05 6 2.64 8 Dry, condensed, & evaporated dairy products 0.00 0 0.00 0 0.00 0 0.00 0 0.00 0 0.00 0 0.00 0 0.00 0
Ice cream & frozen desserts 1.29 100 1.45 112 1.68 337 2.19 439 1.62 19 1.97 23 1.56 26 1.98 33
Total ‐‐ 147 162 433 562 24 29 32 41
Animal Slaughtering & Processing Animal (except poultry) slaughtering, rendering, & processing 1.15 26 1.25 28 1.31 100 1.56 119 1.46 4 1.78 4 1.93 3 2.77 4
Poultry processing 1.39 1,216 1.51 1,319 1.82 4,355 2.19 5,242 2.29 162 2.78 197 2.00 237 2.51 297
Total ‐‐ 1,241 1,347 4,455 5,362 166 202 240 302
Seafood Product Preparation & Packaging 0.00 0 0.00 0 0.00 0 0.00 0 0.00 0 0.00 0 0.00 0 0.00 0
Bakeries & Tortillas
Bread & bakery products 1.30 409 1.55 488 1.42 2,503 1.80 3,179 1.37 124 1.67 151 1.41 158 1.82 203
Cookie, cracker, & pastas 1.29 526 1.43 584 1.74 1,573 2.29 2,072 1.60 91 1.94 111 1.48 154 1.80 188
Tortillas 0.00 0 0.00 0 0.00 0 0.00 0 0.00 0 0.00 0 0.00 0 0.00 0
Total ‐‐ 936 1,072 4,076 5,252 215 262 311 391
Other Foods
Snack foods 1.22 13 1.32 14 2.02 30 2.69 40 1.78 2 2.17 2 1.37 4 1.61 5
Coffee & tea 1.19 0b 1.27 0b 2.00 0b 2.57 1 1.93 0b 2.35 0b 1.63 0b 1.97 0b
Flavoring syrup & concentrates 1.11 31 1.18 33 2.62 24 4.35 40 1.45 3 1.82 3 1.09 16 1.16 17
Seasoning & dressing 0.00 0 0.00 0 0.00 0 0.00 0 0.00 0 0.00 0 0.00 0 0.00 0
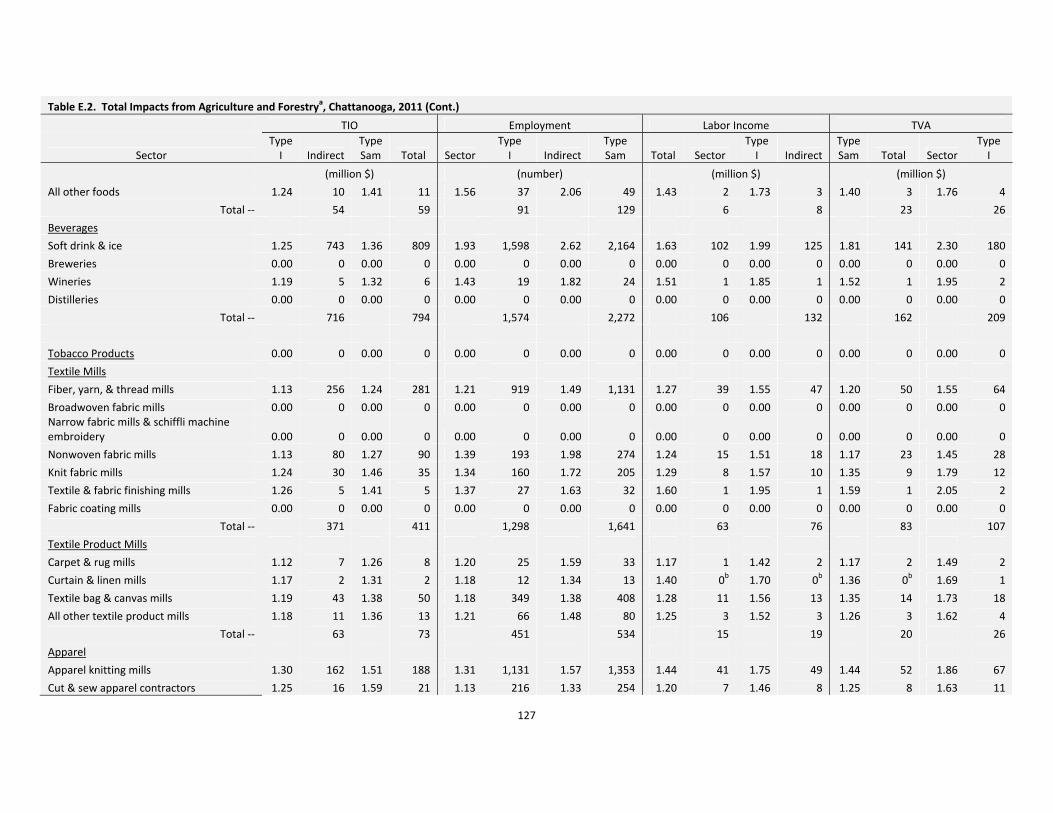
127
Table E.2. Total Impacts from Agriculture and Forestrya, Chattanooga, 2011 (Cont.)
TIO Employment Labor Income TVA
Sector Type I Indirect
Type Sam Total Sector
Type I Indirect
Type Sam Total Sector
Type I Indirect
Type Sam Total Sector
Type I
(million $) (number) (million $) (million $)
All other foods 1.24 10 1.41 11 1.56 37 2.06 49 1.43 2 1.73 3 1.40 3 1.76 4
Total ‐‐ 54 59 91 129 6 8 23 26
Beverages
Soft drink & ice 1.25 743 1.36 809 1.93 1,598 2.62 2,164 1.63 102 1.99 125 1.81 141 2.30 180
Breweries 0.00 0 0.00 0 0.00 0 0.00 0 0.00 0 0.00 0 0.00 0 0.00 0
Wineries 1.19 5 1.32 6 1.43 19 1.82 24 1.51 1 1.85 1 1.52 1 1.95 2
Distilleries 0.00 0 0.00 0 0.00 0 0.00 0 0.00 0 0.00 0 0.00 0 0.00 0
Total ‐‐ 716 794 1,574 2,272 106 132 162 209
Tobacco Products 0.00 0 0.00 0 0.00 0 0.00 0 0.00 0 0.00 0 0.00 0 0.00 0
Textile Mills
Fiber, yarn, & thread mills 1.13 256 1.24 281 1.21 919 1.49 1,131 1.27 39 1.55 47 1.20 50 1.55 64
Broadwoven fabric mills 0.00 0 0.00 0 0.00 0 0.00 0 0.00 0 0.00 0 0.00 0 0.00 0 Narrow fabric mills & schiffli machine embroidery 0.00 0 0.00 0 0.00 0 0.00 0 0.00 0 0.00 0 0.00 0 0.00 0
Nonwoven fabric mills 1.13 80 1.27 90 1.39 193 1.98 274 1.24 15 1.51 18 1.17 23 1.45 28
Knit fabric mills 1.24 30 1.46 35 1.34 160 1.72 205 1.29 8 1.57 10 1.35 9 1.79 12
Textile & fabric finishing mills 1.26 5 1.41 5 1.37 27 1.63 32 1.60 1 1.95 1 1.59 1 2.05 2
Fabric coating mills 0.00 0 0.00 0 0.00 0 0.00 0 0.00 0 0.00 0 0.00 0 0.00 0
Total ‐‐ 371 411 1,298 1,641 63 76 83 107
Textile Product Mills
Carpet & rug mills 1.12 7 1.26 8 1.20 25 1.59 33 1.17 1 1.42 2 1.17 2 1.49 2
Curtain & linen mills 1.17 2 1.31 2 1.18 12 1.34 13 1.40 0b 1.70 0b 1.36 0b 1.69 1
Textile bag & canvas mills 1.19 43 1.38 50 1.18 349 1.38 408 1.28 11 1.56 13 1.35 14 1.73 18
All other textile product mills 1.18 11 1.36 13 1.21 66 1.48 80 1.25 3 1.52 3 1.26 3 1.62 4
Total ‐‐ 63 73 451 534 15 19 20 26
Apparel
Apparel knitting mills 1.30 162 1.51 188 1.31 1,131 1.57 1,353 1.44 41 1.75 49 1.44 52 1.86 67
Cut & sew apparel contractors 1.25 16 1.59 21 1.13 216 1.33 254 1.20 7 1.46 8 1.25 8 1.63 11

128
Table E.2. Total Impacts from Agriculture and Forestrya, Chattanooga, 2011 (Cont.)
TIO Employment Labor Income TVA
Sector Type I Indirect
Type Sam Total Sector
Type I Indirect
Type Sam Total Sector
Type I Indirect
Type Sam Total Sector
Type I
(million $) (number) (million $) (million $)
Mens & boys cut & sew apparel 1.23 177 1.50 216 1.34 1,266 1.69 1,599 1.29 61 1.57 74 1.31 80 1.68 103
Womens & girls cut & sew apparel 1.41 6 1.58 7 1.81 40 2.12 47 2.58 1 3.14 2 2.73 2 3.46 2
Other cut & sew apparel 1.34 1 1.58 1 1.28 6 1.49 7 1.50 0b 1.82 0b 1.65 0b 2.15 0b
Apparel accessories & other apparel 0.00 0 0.00 0 0.00 0 0.00 0 0.00 0 0.00 0 0.00 0 0.00 0
Total ‐‐ 363 433 2,660 3,260 110 134 143 183
Leather & Allied Products
Leather & hide tanning & finishing 0.00 0 0.00 0 0.00 0 0.00 0 0.00 0 0.00 0 0.00 0 0.00 0
Footwear 0.00 0 0.00 0 0.00 0 0.00 0 0.00 0 0.00 0 0.00 0 0.00 0
Other leather & allied products 1.30 5 1.42 6 1.22 52 1.31 56 2.31 1 2.81 1 2.40 1 3.00 1
Total ‐‐ 5 6 52 56 1 1 1 1
Secondary Agriculture Total ‐‐ 4,820 5,344 17,234 21,745 824 1,002 1,207 1,513
Agriculture Total ‐‐ 5,281 5,839 23,595 28,401 878 1,068 1,341 1,667
Forestry Inputs Forestry, forest products, & timber tract production 1.38 1 1.52 1 4.85 13 5.09 14 4.60 0b 5.60 0b 2.78 0b 3.72 0b
Commercial logging 1.22 18 1.47 22 1.18 319 1.31 352 1.21 6 1.48 7 1.36 5 1.94 8
Forestry Inputs Total ‐‐ 19 23 332 365 6 7 5 8
Primary Forestry
Sawmills & wood preservation 1.27 65 1.40 72 1.43 317 1.69 376 1.71 11 2.08 13 1.71 13 2.26 17
Pulp mills 1.37 185 1.51 205 2.66 516 3.52 683 2.08 30 2.54 36 1.65 44 2.08 56
Paper mills 1.27 670 1.40 741 2.38 1,544 3.33 2,156 1.71 111 2.09 135 1.28 215 1.53 257
Paperboard Mills 1.31 187 1.48 211 2.73 460 3.96 668 1.65 37 2.01 46 1.36 54 1.72 68
Primary Forestry Total ‐‐ 1,108 1,230 2,837 3,883 189 230 326 397

129
Table E.2. Total Impacts from Agriculture and Forestrya, Chattanooga, 2011 (Cont.)
TIO Employment Labor Income TVA
Sector Type I Indirect
Type Sam Total Sector
Type I Indirect
Type Sam Total Sector
Type I Indirect
Type Sam Total Sector
Type I
(million $) (number) (million $) (million $)
Secondary Forestry Veneer, Plywood, & Engineered Wood Products
Veneer & plywood 1.20 3 1.34 3 1.30 14 1.55 16 1.48 0b 1.80 1 1.32 1 1.67 1
Engineered wood member & truss 1.23 10 1.39 11 1.32 59 1.55 70 1.56 2 1.90 2 1.45 3 1.78 4
Reconstituted wood products 1.20 49 1.45 59 1.28 249 1.74 338 1.20 16 1.45 20 1.16 17 1.58 23
Total ‐‐ 62 74 322 424 19 23 21 28
Wood Windows & Doors & Millwork 1.26 19 1.43 21 1.27 132 1.48 155 1.51 4 1.84 5 1.63 5 2.14 6
Wood Containers & Pallets 1.20 59 1.43 70 1.18 487 1.42 584 1.25 18 1.52 22 1.31 21 1.72 28
Manufactured Homes (Mobile Homes)
Manufactured homes (mobile homes) 0.00 0 0.00 0 0.00 0 0.00 0 0.00 0 0.00 0 0.00 0 0.00 0
Prefabricated wood buildings 1.21 3 1.48 4 1.25 23 1.58 29 1.23 1 1.49 1 1.32 1 1.76 2
Total ‐‐ 3 4 23 29 1 1 1 2
All Other Miscellaneous Wood Products 1.33 33 1.52 37 1.41 228 1.65 268 1.69 7 2.05 9 1.66 10 2.10 13
Paperboard Containers 1.20 460 1.35 517 1.55 1,580 2.03 2,069 1.45 89 1.77 108 1.51 114 1.94 148
Paper Bags & Coated & Treated Paper Coated & laminated paper, packaging paper & plastics film 1.14 8 1.36 9 1.40 22 2.24 35 1.16 2 1.40 3 1.17 3 1.51 4 All other paper bag & coated & treated paper 1.17 37 1.33 42 1.36 144 1.77 187 1.31 8 1.60 10 1.36 10 1.79 13
Total ‐‐ 45 51 165 222 10 13 13 16
Stationery Products 1.26 30 1.38 33 1.48 133 1.76 158 1.86 5 2.27 6 1.80 7 2.25 9
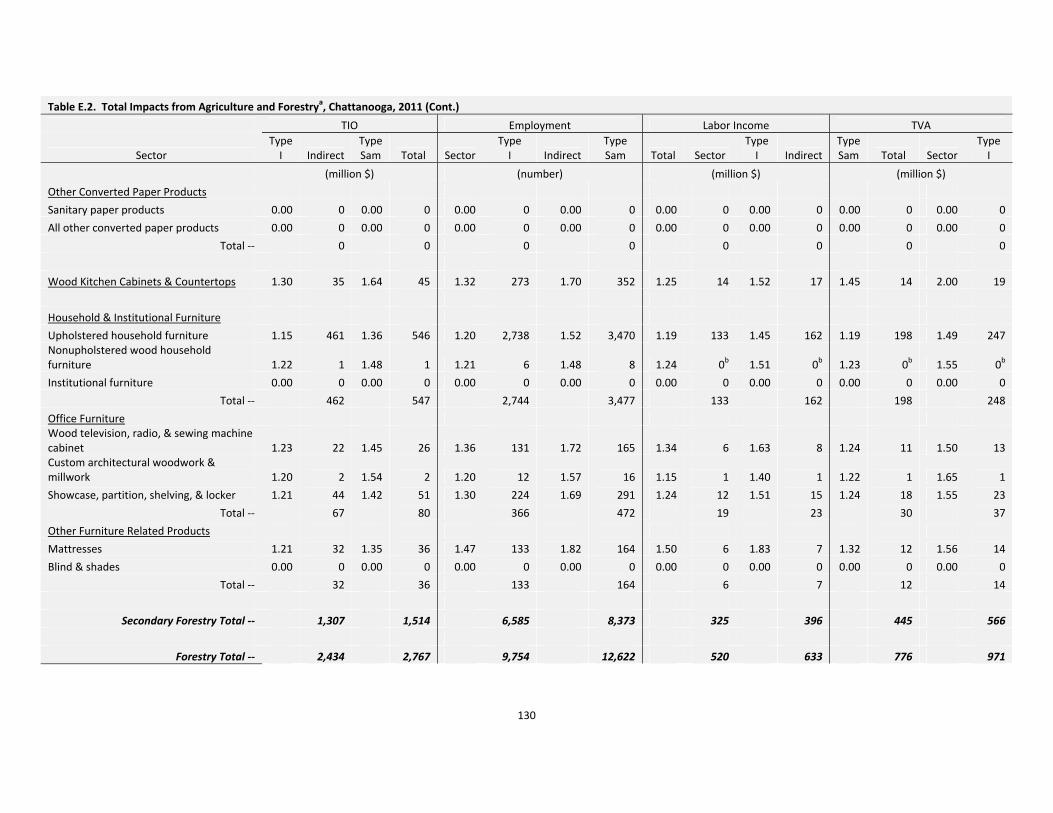
130
Table E.2. Total Impacts from Agriculture and Forestrya, Chattanooga, 2011 (Cont.)
TIO Employment Labor Income TVA
Sector Type I Indirect
Type Sam Total Sector
Type I Indirect
Type Sam Total Sector
Type I Indirect
Type Sam Total Sector
Type I
(million $) (number) (million $) (million $)
Other Converted Paper Products
Sanitary paper products 0.00 0 0.00 0 0.00 0 0.00 0 0.00 0 0.00 0 0.00 0 0.00 0
All other converted paper products 0.00 0 0.00 0 0.00 0 0.00 0 0.00 0 0.00 0 0.00 0 0.00 0
Total ‐‐ 0 0 0 0 0 0 0 0
Wood Kitchen Cabinets & Countertops 1.30 35 1.64 45 1.32 273 1.70 352 1.25 14 1.52 17 1.45 14 2.00 19
Household & Institutional Furniture
Upholstered household furniture 1.15 461 1.36 546 1.20 2,738 1.52 3,470 1.19 133 1.45 162 1.19 198 1.49 247 Nonupholstered wood household furniture 1.22 1 1.48 1 1.21 6 1.48 8 1.24 0b 1.51 0b 1.23 0b 1.55 0b
Institutional furniture 0.00 0 0.00 0 0.00 0 0.00 0 0.00 0 0.00 0 0.00 0 0.00 0
Total ‐‐ 462 547 2,744 3,477 133 162 198 248
Office Furniture Wood television, radio, & sewing machine cabinet 1.23 22 1.45 26 1.36 131 1.72 165 1.34 6 1.63 8 1.24 11 1.50 13 Custom architectural woodwork & millwork 1.20 2 1.54 2 1.20 12 1.57 16 1.15 1 1.40 1 1.22 1 1.65 1
Showcase, partition, shelving, & locker 1.21 44 1.42 51 1.30 224 1.69 291 1.24 12 1.51 15 1.24 18 1.55 23
Total ‐‐ 67 80 366 472 19 23 30 37
Other Furniture Related Products
Mattresses 1.21 32 1.35 36 1.47 133 1.82 164 1.50 6 1.83 7 1.32 12 1.56 14
Blind & shades 0.00 0 0.00 0 0.00 0 0.00 0 0.00 0 0.00 0 0.00 0 0.00 0
Total ‐‐ 32 36 133 164 6 7 12 14
Secondary Forestry Total ‐‐ 1,307 1,514 6,585 8,373 325 396 445 566
Forestry Total ‐‐ 2,434 2,767 9,754 12,622 520 633 776 971

131
Table E.2. Total Impacts from Agriculture and Forestrya, Chattanooga, 2011 (Cont.)
TIO Employment Labor Income TVA
Sector Type I Indirect
Type Sam Total Sector
Type I Indirect
Type Sam Total Sector
Type I Indirect
Type Sam Total Sector
Type I
(million $) (number) (million $) (million $)
Agriculture & Forestry Total ‐‐ 7,715 8,606 33,349 41,023 1,398 1,701 2,117 2,638
Construction ‐‐ 2,305 2,940 21,918 27,390 989 1,205 1,182 1,553
Finance, Insurance, & Real Estate ‐‐ 10,547 11,912 40,192 50,794 1,897 2,316 6,461 7,260
Government ‐‐ 7,212 9,648 65,525 86,529 3,847 4,676 3,157 4,162
Manufacturing ‐‐ 13,892 15,552 44,923 59,230 2,579 3,144 3,708 4,678
Mining ‐‐ 168 185 804 951 26 32 60 70
Miscellaneous ‐‐ 620 806 9,175 10,778 293 356 335 444
Retail Trade ‐‐ 3,599 4,616 48,274 57,038 1,588 1,934 2,482 3,077
Services ‐‐ 14,778 19,080 159,446 196,529 6,710 8,172 9,002 11,520
Transportation, Information, & Utilities ‐‐ 3,000 3,663 21,510 27,222 1,035 1,261 1,447 1,835
Wholesale Trade ‐‐ 2,141 2,697 13,864 18,659 863 1,052 1,481 1,806 aTotals may not add due to rounding. bValues of zero are nonzero values less than 1.
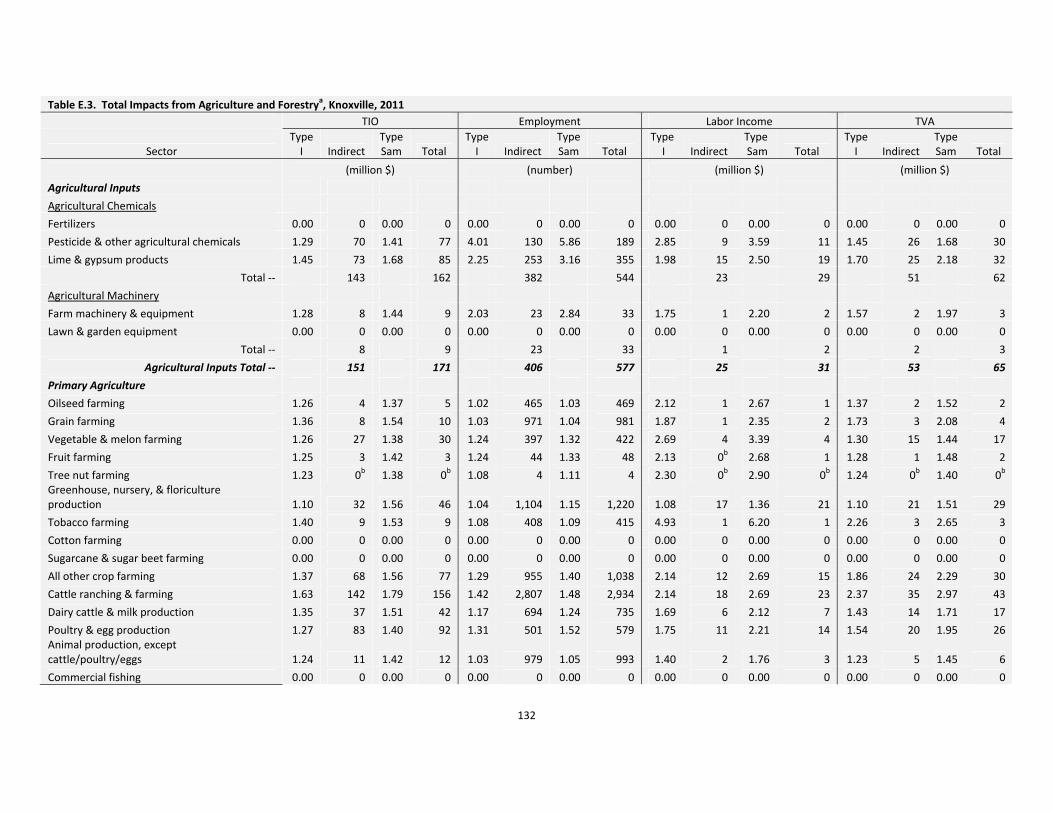
132
Table E.3. Total Impacts from Agriculture and Forestrya, Knoxville, 2011
TIO Employment Labor Income TVA
Sector Type I Indirect
Type Sam Total
Type I Indirect
Type Sam Total
Type I Indirect
Type Sam Total
Type I Indirect
Type Sam Total
(million $) (number) (million $) (million $)
Agricultural Inputs
Agricultural Chemicals
Fertilizers 0.00 0 0.00 0 0.00 0 0.00 0 0.00 0 0.00 0 0.00 0 0.00 0
Pesticide & other agricultural chemicals 1.29 70 1.41 77 4.01 130 5.86 189 2.85 9 3.59 11 1.45 26 1.68 30
Lime & gypsum products 1.45 73 1.68 85 2.25 253 3.16 355 1.98 15 2.50 19 1.70 25 2.18 32
Total ‐‐ 143 162 382 544 23 29 51 62
Agricultural Machinery
Farm machinery & equipment 1.28 8 1.44 9 2.03 23 2.84 33 1.75 1 2.20 2 1.57 2 1.97 3
Lawn & garden equipment 0.00 0 0.00 0 0.00 0 0.00 0 0.00 0 0.00 0 0.00 0 0.00 0
Total ‐‐ 8 9 23 33 1 2 2 3
Agricultural Inputs Total ‐‐ 151 171 406 577 25 31 53 65
Primary Agriculture
Oilseed farming 1.26 4 1.37 5 1.02 465 1.03 469 2.12 1 2.67 1 1.37 2 1.52 2
Grain farming 1.36 8 1.54 10 1.03 971 1.04 981 1.87 1 2.35 2 1.73 3 2.08 4
Vegetable & melon farming 1.26 27 1.38 30 1.24 397 1.32 422 2.69 4 3.39 4 1.30 15 1.44 17
Fruit farming 1.25 3 1.42 3 1.24 44 1.33 48 2.13 0b 2.68 1 1.28 1 1.48 2
Tree nut farming 1.23 0b 1.38 0b 1.08 4 1.11 4 2.30 0b 2.90 0b 1.24 0b 1.40 0b Greenhouse, nursery, & floriculture production 1.10 32 1.56 46 1.04 1,104 1.15 1,220 1.08 17 1.36 21 1.10 21 1.51 29
Tobacco farming 1.40 9 1.53 9 1.08 408 1.09 415 4.93 1 6.20 1 2.26 3 2.65 3
Cotton farming 0.00 0 0.00 0 0.00 0 0.00 0 0.00 0 0.00 0 0.00 0 0.00 0
Sugarcane & sugar beet farming 0.00 0 0.00 0 0.00 0 0.00 0 0.00 0 0.00 0 0.00 0 0.00 0
All other crop farming 1.37 68 1.56 77 1.29 955 1.40 1,038 2.14 12 2.69 15 1.86 24 2.29 30
Cattle ranching & farming 1.63 142 1.79 156 1.42 2,807 1.48 2,934 2.14 18 2.69 23 2.37 35 2.97 43
Dairy cattle & milk production 1.35 37 1.51 42 1.17 694 1.24 735 1.69 6 2.12 7 1.43 14 1.71 17
Poultry & egg production 1.27 83 1.40 92 1.31 501 1.52 579 1.75 11 2.21 14 1.54 20 1.95 26 Animal production, except cattle/poultry/eggs 1.24 11 1.42 12 1.03 979 1.05 993 1.40 2 1.76 3 1.23 5 1.45 6
Commercial fishing 0.00 0 0.00 0 0.00 0 0.00 0 0.00 0 0.00 0 0.00 0 0.00 0
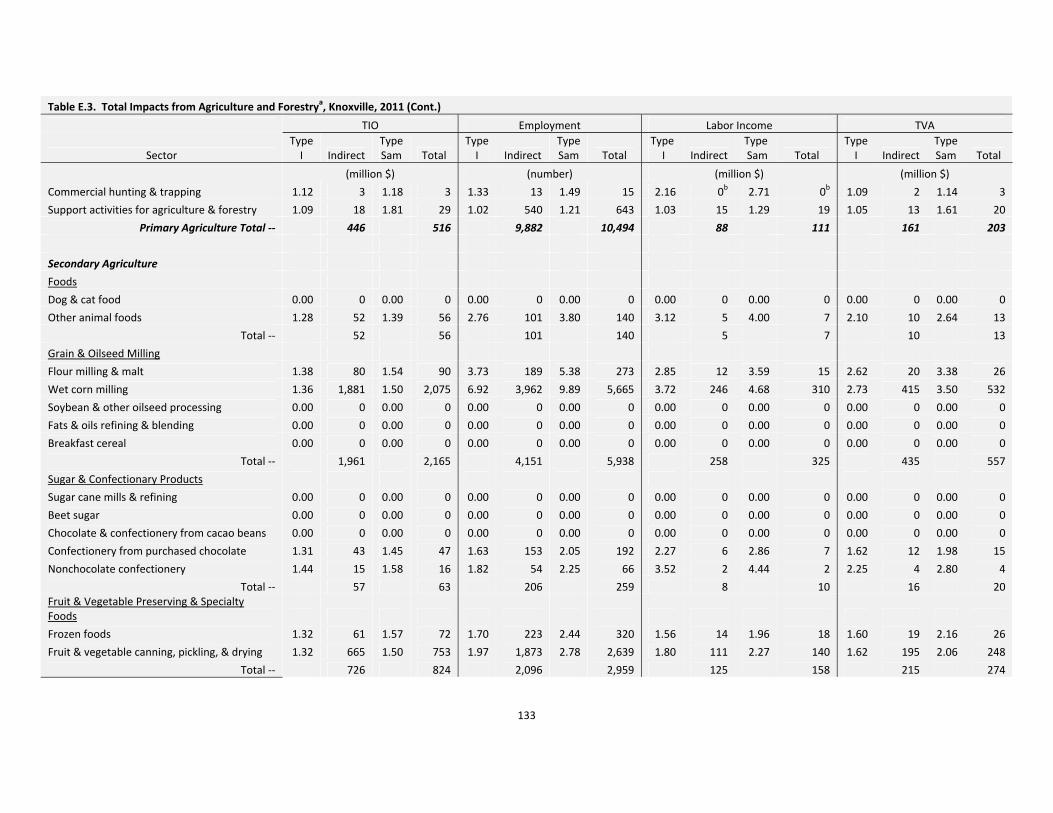
133
Table E.3. Total Impacts from Agriculture and Forestrya, Knoxville, 2011 (Cont.)
TIO Employment Labor Income TVA
Sector Type I Indirect
Type Sam Total
Type I Indirect
Type Sam Total
Type I Indirect
Type Sam Total
Type I Indirect
Type Sam Total
(million $) (number) (million $) (million $)
Commercial hunting & trapping 1.12 3 1.18 3 1.33 13 1.49 15 2.16 0b 2.71 0b 1.09 2 1.14 3
Support activities for agriculture & forestry 1.09 18 1.81 29 1.02 540 1.21 643 1.03 15 1.29 19 1.05 13 1.61 20
Primary Agriculture Total ‐‐ 446 516 9,882 10,494 88 111 161 203
Secondary Agriculture
Foods
Dog & cat food 0.00 0 0.00 0 0.00 0 0.00 0 0.00 0 0.00 0 0.00 0 0.00 0
Other animal foods 1.28 52 1.39 56 2.76 101 3.80 140 3.12 5 4.00 7 2.10 10 2.64 13
Total ‐‐ 52 56 101 140 5 7 10 13
Grain & Oilseed Milling
Flour milling & malt 1.38 80 1.54 90 3.73 189 5.38 273 2.85 12 3.59 15 2.62 20 3.38 26
Wet corn milling 1.36 1,881 1.50 2,075 6.92 3,962 9.89 5,665 3.72 246 4.68 310 2.73 415 3.50 532
Soybean & other oilseed processing 0.00 0 0.00 0 0.00 0 0.00 0 0.00 0 0.00 0 0.00 0 0.00 0
Fats & oils refining & blending 0.00 0 0.00 0 0.00 0 0.00 0 0.00 0 0.00 0 0.00 0 0.00 0
Breakfast cereal 0.00 0 0.00 0 0.00 0 0.00 0 0.00 0 0.00 0 0.00 0 0.00 0
Total ‐‐ 1,961 2,165 4,151 5,938 258 325 435 557
Sugar & Confectionary Products
Sugar cane mills & refining 0.00 0 0.00 0 0.00 0 0.00 0 0.00 0 0.00 0 0.00 0 0.00 0
Beet sugar 0.00 0 0.00 0 0.00 0 0.00 0 0.00 0 0.00 0 0.00 0 0.00 0
Chocolate & confectionery from cacao beans 0.00 0 0.00 0 0.00 0 0.00 0 0.00 0 0.00 0 0.00 0 0.00 0
Confectionery from purchased chocolate 1.31 43 1.45 47 1.63 153 2.05 192 2.27 6 2.86 7 1.62 12 1.98 15
Nonchocolate confectionery 1.44 15 1.58 16 1.82 54 2.25 66 3.52 2 4.44 2 2.25 4 2.80 4
Total ‐‐ 57 63 206 259 8 10 16 20 Fruit & Vegetable Preserving & Specialty Foods
Frozen foods 1.32 61 1.57 72 1.70 223 2.44 320 1.56 14 1.96 18 1.60 19 2.16 26
Fruit & vegetable canning, pickling, & drying 1.32 665 1.50 753 1.97 1,873 2.78 2,639 1.80 111 2.27 140 1.62 195 2.06 248
Total ‐‐ 726 824 2,096 2,959 125 158 215 274
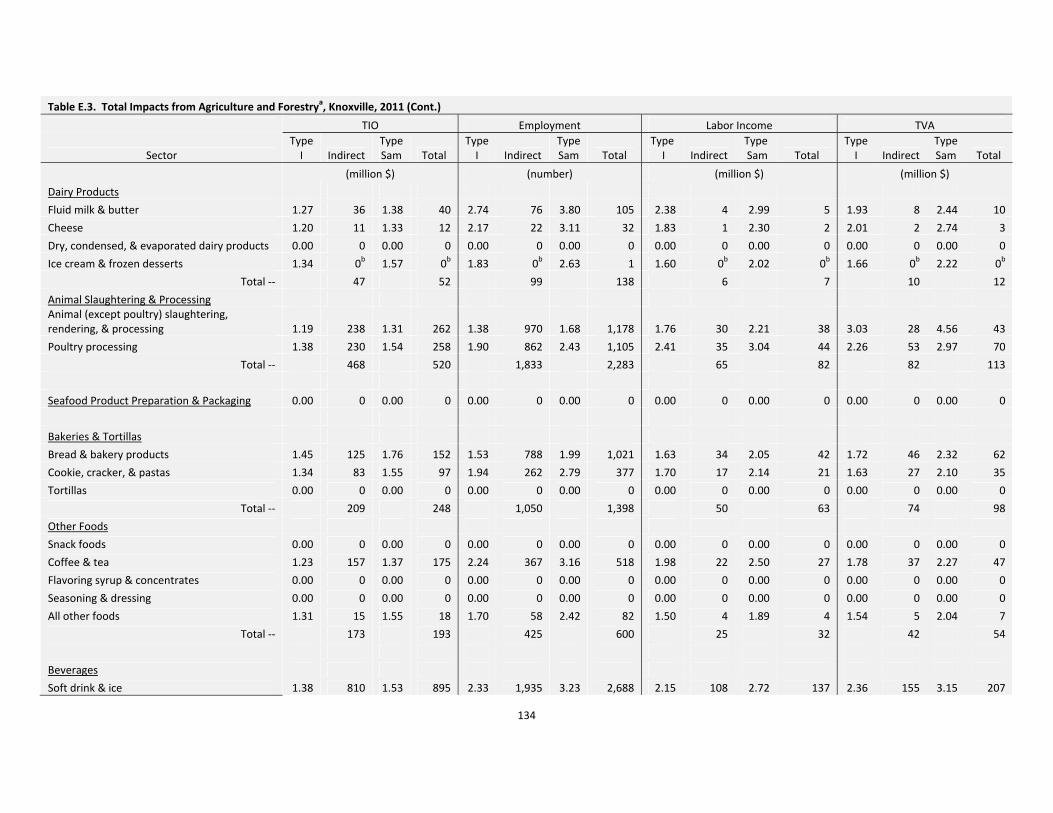
134
Table E.3. Total Impacts from Agriculture and Forestrya, Knoxville, 2011 (Cont.)
TIO Employment Labor Income TVA
Sector Type I Indirect
Type Sam Total
Type I Indirect
Type Sam Total
Type I Indirect
Type Sam Total
Type I Indirect
Type Sam Total
(million $) (number) (million $) (million $)
Dairy Products
Fluid milk & butter 1.27 36 1.38 40 2.74 76 3.80 105 2.38 4 2.99 5 1.93 8 2.44 10
Cheese 1.20 11 1.33 12 2.17 22 3.11 32 1.83 1 2.30 2 2.01 2 2.74 3
Dry, condensed, & evaporated dairy products 0.00 0 0.00 0 0.00 0 0.00 0 0.00 0 0.00 0 0.00 0 0.00 0
Ice cream & frozen desserts 1.34 0b 1.57 0b 1.83 0b 2.63 1 1.60 0b 2.02 0b 1.66 0b 2.22 0b
Total ‐‐ 47 52 99 138 6 7 10 12
Animal Slaughtering & Processing Animal (except poultry) slaughtering, rendering, & processing 1.19 238 1.31 262 1.38 970 1.68 1,178 1.76 30 2.21 38 3.03 28 4.56 43
Poultry processing 1.38 230 1.54 258 1.90 862 2.43 1,105 2.41 35 3.04 44 2.26 53 2.97 70
Total ‐‐ 468 520 1,833 2,283 65 82 82 113
Seafood Product Preparation & Packaging 0.00 0 0.00 0 0.00 0 0.00 0 0.00 0 0.00 0 0.00 0 0.00 0
Bakeries & Tortillas
Bread & bakery products 1.45 125 1.76 152 1.53 788 1.99 1,021 1.63 34 2.05 42 1.72 46 2.32 62
Cookie, cracker, & pastas 1.34 83 1.55 97 1.94 262 2.79 377 1.70 17 2.14 21 1.63 27 2.10 35
Tortillas 0.00 0 0.00 0 0.00 0 0.00 0 0.00 0 0.00 0 0.00 0 0.00 0
Total ‐‐ 209 248 1,050 1,398 50 63 74 98
Other Foods
Snack foods 0.00 0 0.00 0 0.00 0 0.00 0 0.00 0 0.00 0 0.00 0 0.00 0
Coffee & tea 1.23 157 1.37 175 2.24 367 3.16 518 1.98 22 2.50 27 1.78 37 2.27 47
Flavoring syrup & concentrates 0.00 0 0.00 0 0.00 0 0.00 0 0.00 0 0.00 0 0.00 0 0.00 0
Seasoning & dressing 0.00 0 0.00 0 0.00 0 0.00 0 0.00 0 0.00 0 0.00 0 0.00 0
All other foods 1.31 15 1.55 18 1.70 58 2.42 82 1.50 4 1.89 4 1.54 5 2.04 7
Total ‐‐ 173 193 425 600 25 32 42 54
Beverages
Soft drink & ice 1.38 810 1.53 895 2.33 1,935 3.23 2,688 2.15 108 2.72 137 2.36 155 3.15 207

135
Table E.3. Total Impacts from Agriculture and Forestrya, Knoxville, 2011 (Cont.)
TIO Employment Labor Income TVA
Sector Type I Indirect
Type Sam Total
Type I Indirect
Type Sam Total
Type I Indirect
Type Sam Total
Type I Indirect
Type Sam Total
(million $) (number) (million $) (million $)
Breweries 0.00 0 0.00 0 0.00 0 0.00 0 0.00 0 0.00 0 0.00 0 0.00 0
Wineries 1.28 4 1.38 4 1.56 17 1.81 19 15.46 0b 19.82 0b 3.55 1 4.46 1
Distilleries 1.18 115 1.24 122 2.46 168 3.33 227 3.19 8 4.05 11 1.17 69 1.24 73
Total ‐‐ 929 1,022 2,119 2,934 117 148 225 281
Tobacco Products 0.00 0 0.00 0 0.00 0 0.00 0 0.00 0 0.00 0 0.00 0 0.00 0
Textile Mills
Fiber, yarn, & thread mills 1.09 14 1.23 16 1.20 52 1.55 68 1.25 2 1.58 3 1.27 3 1.70 4
Broadwoven fabric mills 0.00 0 0.00 0 0.00 0 0.00 0 0.00 0 0.00 0 0.00 0 0.00 0 Narrow fabric mills & schiffli machine embroidery 1.14 23 1.51 30 1.16 154 1.64 218 1.13 9 1.42 12 1.17 10 1.67 15
Nonwoven fabric mills 1.16 17 1.33 19 1.48 42 2.20 63 1.31 3 1.65 4 1.28 5 1.65 6
Knit fabric mills 1.23 12 1.50 14 1.37 67 1.82 89 1.36 3 1.71 4 1.49 4 2.09 5
Textile & fabric finishing mills 1.29 38 1.49 44 1.41 208 1.76 260 1.66 8 2.09 10 1.76 10 2.37 14
Fabric coating mills 0.00 0 0.00 0 0.00 0 0.00 0 0.00 0 0.00 0 0.00 0 0.00 0
Total ‐‐ 103 123 524 698 25 32 33 45
Textile Product Mills
Carpet & rug mills 1.08 0 1.22 0 1.17 0 1.53 0 1.22 0 1.53 0 1.22 0 1.61 0
Curtain & linen mills 1.18 1 1.39 2 1.20 9 1.48 11 1.31 0b 1.65 0b 1.35 0b 1.79 1
Textile bag & canvas mills 1.22 41 1.49 50 1.21 317 1.52 398 1.29 12 1.63 15 1.39 15 1.90 21
All other textile product mills 1.18 125 1.41 149 1.23 773 1.57 984 1.28 31 1.61 38 1.33 42 1.79 56
Total ‐‐ 168 201 1,099 1,394 43 54 58 78
Apparel
Apparel knitting mills 0.00 0 0.00 0 0.00 0 0.00 0 0.00 0 0.00 0 0.00 0 0.00 0
Cut & sew apparel contractors 1.41 14 1.82 18 1.19 198 1.40 233 1.41 5 1.77 6 1.52 7 2.06 9
Mens & boys cut & sew apparel 1.30 80 1.65 102 1.41 570 1.89 760 1.37 28 1.72 35 1.42 37 1.92 50
Womens & girls cut & sew apparel 1.51 4 1.76 5 1.95 25 2.39 31 2.95 1 3.71 1 3.22 1 4.28 2
Other cut & sew apparel 1.43 9 1.76 11 1.34 88 1.63 106 1.64 3 2.06 3 1.89 4 2.58 5

136
Table E.3. Total Impacts from Agriculture and Forestrya, Knoxville, 2011 (Cont.)
TIO Employment Labor Income TVA
Sector Type I Indirect
Type Sam Total
Type I Indirect
Type Sam Total
Type I Indirect
Type Sam Total
Type I Indirect
Type Sam Total
(million $) (number) (million $) (million $)
Apparel accessories & other apparel 1.39 4 1.69 5 1.32 38 1.60 46 1.59 1 2.00 1 1.91 1 2.63 2
Total ‐‐ 111 141 918 1,176 37 47 50 68
Leather & Allied Products
Leather & hide tanning & finishing 0.00 0 0.00 0 0.00 0 0.00 0 0.00 0 0.00 0 0.00 0 0.00 0
Footwear 0.00 0 0.00 0 0.00 0 0.00 0 0.00 0 0.00 0 0.00 0 0.00 0
Other leather & allied products 1.33 4 1.63 5 1.29 35 1.63 44 1.41 1 1.77 2 1.51 2 2.03 2
Total ‐‐ 4 5 35 44 1 2 2 2
Secondary Agriculture Total ‐‐ 5,009 5,614 14,658 19,961 766 965 1,250 1,614
Agriculture Total ‐‐ 5,606 6,300 24,946 31,032 879 1,107 1,464 1,882
Forestry Inputs Forestry, forest products, & timber tract production 1.22 3 1.49 3 3.58 16 4.74 22 1.70 1 2.13 1 1.24 2 1.49 2
Commercial logging 1.26 11 1.65 14 1.19 165 1.40 195 1.22 4 1.53 5 1.38 4 2.05 6
Forestry Inputs Total ‐‐ 14 18 181 216 5 6 6 8
Primary Forestry
Sawmills & wood preservation 1.30 87 1.50 101 1.50 422 1.92 540 1.65 17 2.08 21 1.81 21 2.50 29
Pulp mills 0.00 0 0.00 0 0.00 0 0.00 0 0.00 0 0.00 0 0.00 0 0.00 0
Paper mills 1.28 62 1.50 73 2.59 144 4.29 238 1.49 14 1.88 17 1.35 24 1.71 31
Paperboard Mills 1.37 89 1.56 101 3.01 246 4.30 351 2.13 15 2.68 19 1.74 26 2.21 34
Primary Forestry Total ‐‐ 239 275 812 1,130 46 58 72 94
Secondary Forestry Veneer, Plywood, & Engineered Wood Products
Veneer & plywood 1.23 2 1.35 2 1.32 10 1.53 12 2.30 0b 2.90 0b 1.75 0b 2.20 1
Engineered wood member & truss 1.25 25 1.53 31 1.39 137 1.89 186 1.37 7 1.72 9 1.39 10 1.86 13

137
Table E.3. Total Impacts from Agriculture and Forestrya, Knoxville, 2011 (Cont.)
TIO Employment Labor Income TVA
Sector Type I Indirect
Type Sam Total
Type I Indirect
Type Sam Total
Type I Indirect
Type Sam Total
Type I Indirect
Type Sam Total
(million $) (number) (million $) (million $)
Reconstituted wood products 0.00 0 0.00 0 0.00 0 0.00 0 0.00 0 0.00 0 0.00 0 0.00 0
Total ‐‐ 27 33 147 198 7 9 11 14
Wood Windows & Doors & Millwork 1.29 103 1.55 124 1.31 695 1.66 878 1.48 26 1.87 33 1.66 32 2.31 45
Wood Containers & Pallets 1.24 16 1.56 20 1.22 132 1.55 168 1.28 5 1.62 7 1.39 6 1.93 9
Manufactured Homes (Mobile Homes)
Manufactured homes (mobile homes) 1.46 326 1.88 421 1.50 2,126 2.09 2,961 1.43 121 1.79 152 1.59 124 2.32 182
Prefabricated wood buildings 1.20 7 1.66 10 1.30 42 2.09 67 1.14 4 1.44 5 1.21 4 1.74 6
Total ‐‐ 334 431 2,168 3,028 125 157 128 187
All Other Miscellaneous Wood Products 1.42 20 1.66 23 1.48 142 1.79 172 2.07 4 2.61 5 2.05 6 2.70 8
Paperboard Containers 1.24 347 1.46 409 1.68 1,203 2.44 1,747 1.46 78 1.83 99 1.59 102 2.17 139
Paper Bags & Coated & Treated Paper Coated & laminated paper, packaging paper & plastics film 1.20 50 1.44 59 1.51 158 2.33 244 1.29 12 1.63 16 1.33 17 1.79 23
All other paper bag & coated & treated paper 1.21 7 1.43 9 1.45 29 2.04 41 1.36 2 1.71 2 1.47 2 2.03 3
Total ‐‐ 57 68 188 286 14 18 19 26
Stationery Products 1.27 243 1.52 290 1.59 977 2.27 1,391 1.44 60 1.81 75 1.57 79 2.13 108
Other Converted Paper Products
Sanitary paper products 0.00 0 0.00 0 0.00 0 0.00 0 0.00 0 0.00 0 0.00 0 0.00 0
All other converted paper products 1.30 100 1.53 118 1.60 422 2.20 579 1.67 23 2.10 28 1.74 31 2.35 42
Total ‐‐ 100 118 422 579 23 28 31 42

138
Table E.3. Total Impacts from Agriculture and Forestrya, Knoxville, 2011 (Cont.)
TIO Employment Labor Income TVA
Sector Type I Indirect
Type Sam Total
Type I Indirect
Type Sam Total
Type I Indirect
Type Sam Total
Type I Indirect
Type Sam Total
(million $) (number) (million $) (million $)
Wood Kitchen Cabinets & Countertops 1.43 31 1.81 39 1.39 266 1.77 339 1.47 10 1.85 13 1.94 11 2.83 16
Household & Institutional Furniture
Upholstered household furniture 1.17 315 1.48 399 1.23 1,737 1.76 2,475 1.17 108 1.47 135 1.20 150 1.60 201
Nonupholstered wood household furniture 1.24 32 1.58 40 1.23 254 1.59 329 1.25 11 1.58 14 1.28 16 1.70 21
Institutional furniture 1.27 93 1.51 110 1.63 369 2.30 520 1.40 22 1.76 27 1.33 42 1.66 52
Total ‐‐ 440 550 2,361 3,323 140 176 208 274
Office Furniture Wood television, radio, & sewing machine cabinet 1.24 2 1.48 2 1.37 11 1.75 14 1.41 0b 1.77 1 1.30 1 1.61 1
Custom architectural woodwork & millwork 1.27 6 1.66 8 1.24 53 1.64 71 1.22 2 1.54 3 1.36 3 1.94 4
Showcase, partition, shelving, & locker 1.27 81 1.57 100 1.38 403 1.95 571 1.26 24 1.59 31 1.30 35 1.72 47
Total ‐‐ 89 111 467 655 27 34 39 52
Other Furniture Related Products
Mattresses 1.27 39 1.44 44 1.52 165 1.95 211 1.81 7 2.28 9 1.47 14 1.79 18
Blind & shades 0.00 0 0.00 0 0.00 0 0.00 0 0.00 0 0.00 0 0.00 0 0.00 0
Total ‐‐ 39 44 165 211 7 9 14 18
Secondary Forestry Total ‐‐ 1,847 2,262 9,332 12,974 528 664 688 937
Forestry Total ‐‐ 2,100 2,555 10,325 14,320 579 728 765 1,039
Agriculture & Forestry Total ‐‐ 7,707 8,855 35,271 45,352 1,458 1,835 2,229 2,921
Construction ‐‐ 4,566 6,102 42,829 56,334 1,964 2,469 2,378 3,303
Finance, Insurance, & Real Estate ‐‐ 17,263 19,578 77,260 94,690 2,473 3,125 10,619 12,013
Government ‐‐ 7,239 11,270 94,025 129,475 5,123 6,448 5,777 8,100
Manufacturing ‐‐ 18,905 21,771 65,209 90,416 3,585 4,527 5,911 7,636
Mining ‐‐ 1,155 1,326 4,826 6,333 214 271 493 596

139
Table E.3. Total Impacts from Agriculture and Forestrya, Knoxville, 2011 (Cont.)
TIO Employment Labor Income TVA
Sector Type I Indirect
Type Sam Total
Type I Indirect
Type Sam Total
Type I Indirect
Type Sam Total
Type I Indirect
Type Sam Total
(million $) (number) (million $) (million $)
Miscellaneous ‐‐ 1,196 1,620 16,267 19,995 537 677 632 887
Retail Trade ‐‐ 6,321 8,413 85,122 103,515 2,665 3,352 4,315 5,574
Services ‐‐ 32,820 43,861 327,631 424,698 14,018 17,647 19,327 25,975
Transportation, Information, & Utilities ‐‐ 3,558 4,636 23,074 32,557 1,367 1,722 1,827 2,476
Wholesale Trade ‐‐ 4,065 5,379 25,977 37,529 1,655 2,087 2,824 3,615 aTotals may not add due to rounding. bValues of zero are nonzero values less than 1.
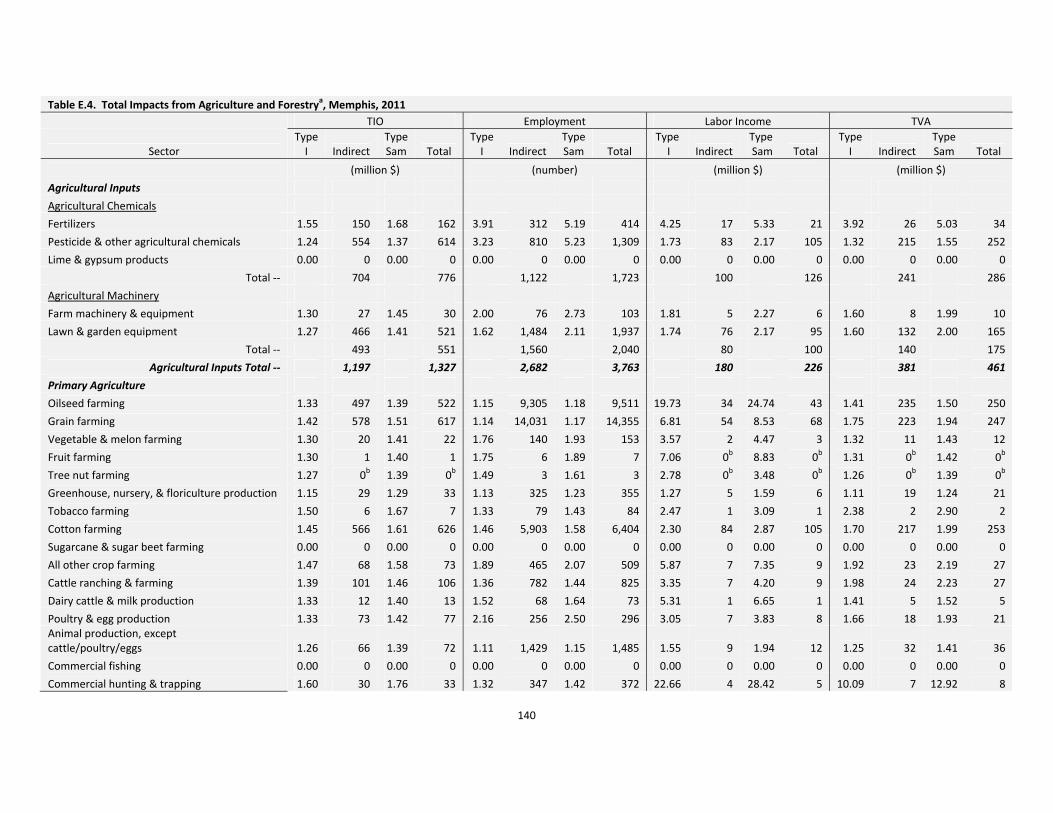
140
Table E.4. Total Impacts from Agriculture and Forestrya, Memphis, 2011
TIO Employment Labor Income TVA
Sector Type I Indirect
Type Sam Total
Type I Indirect
Type Sam Total
Type I Indirect
Type Sam Total
Type I Indirect
Type Sam Total
(million $) (number) (million $) (million $)
Agricultural Inputs
Agricultural Chemicals
Fertilizers 1.55 150 1.68 162 3.91 312 5.19 414 4.25 17 5.33 21 3.92 26 5.03 34
Pesticide & other agricultural chemicals 1.24 554 1.37 614 3.23 810 5.23 1,309 1.73 83 2.17 105 1.32 215 1.55 252
Lime & gypsum products 0.00 0 0.00 0 0.00 0 0.00 0 0.00 0 0.00 0 0.00 0 0.00 0
Total ‐‐ 704 776 1,122 1,723 100 126 241 286
Agricultural Machinery
Farm machinery & equipment 1.30 27 1.45 30 2.00 76 2.73 103 1.81 5 2.27 6 1.60 8 1.99 10
Lawn & garden equipment 1.27 466 1.41 521 1.62 1,484 2.11 1,937 1.74 76 2.17 95 1.60 132 2.00 165
Total ‐‐ 493 551 1,560 2,040 80 100 140 175
Agricultural Inputs Total ‐‐ 1,197 1,327 2,682 3,763 180 226 381 461
Primary Agriculture
Oilseed farming 1.33 497 1.39 522 1.15 9,305 1.18 9,511 19.73 34 24.74 43 1.41 235 1.50 250
Grain farming 1.42 578 1.51 617 1.14 14,031 1.17 14,355 6.81 54 8.53 68 1.75 223 1.94 247
Vegetable & melon farming 1.30 20 1.41 22 1.76 140 1.93 153 3.57 2 4.47 3 1.32 11 1.43 12
Fruit farming 1.30 1 1.40 1 1.75 6 1.89 7 7.06 0b 8.83 0b 1.31 0b 1.42 0b
Tree nut farming 1.27 0b 1.39 0b 1.49 3 1.61 3 2.78 0b 3.48 0b 1.26 0b 1.39 0b
Greenhouse, nursery, & floriculture production 1.15 29 1.29 33 1.13 325 1.23 355 1.27 5 1.59 6 1.11 19 1.24 21
Tobacco farming 1.50 6 1.67 7 1.33 79 1.43 84 2.47 1 3.09 1 2.38 2 2.90 2
Cotton farming 1.45 566 1.61 626 1.46 5,903 1.58 6,404 2.30 84 2.87 105 1.70 217 1.99 253
Sugarcane & sugar beet farming 0.00 0 0.00 0 0.00 0 0.00 0 0.00 0 0.00 0 0.00 0 0.00 0
All other crop farming 1.47 68 1.58 73 1.89 465 2.07 509 5.87 7 7.35 9 1.92 23 2.19 27
Cattle ranching & farming 1.39 101 1.46 106 1.36 782 1.44 825 3.35 7 4.20 9 1.98 24 2.23 27
Dairy cattle & milk production 1.33 12 1.40 13 1.52 68 1.64 73 5.31 1 6.65 1 1.41 5 1.52 5
Poultry & egg production 1.33 73 1.42 77 2.16 256 2.50 296 3.05 7 3.83 8 1.66 18 1.93 21 Animal production, except cattle/poultry/eggs 1.26 66 1.39 72 1.11 1,429 1.15 1,485 1.55 9 1.94 12 1.25 32 1.41 36
Commercial fishing 0.00 0 0.00 0 0.00 0 0.00 0 0.00 0 0.00 0 0.00 0 0.00 0
Commercial hunting & trapping 1.60 30 1.76 33 1.32 347 1.42 372 22.66 4 28.42 5 10.09 7 12.92 8
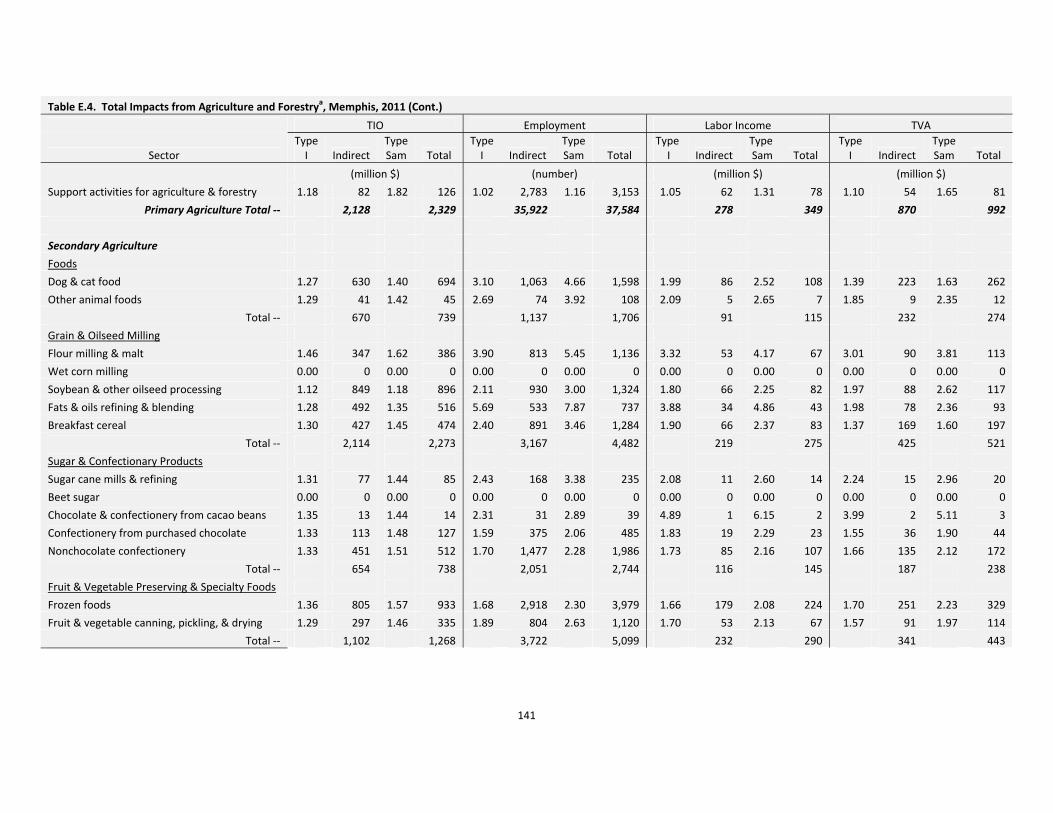
141
Table E.4. Total Impacts from Agriculture and Forestrya, Memphis, 2011 (Cont.)
TIO Employment Labor Income TVA
Sector Type I Indirect
Type Sam Total
Type I Indirect
Type Sam Total
Type I Indirect
Type Sam Total
Type I Indirect
Type Sam Total
(million $) (number) (million $) (million $)
Support activities for agriculture & forestry 1.18 82 1.82 126 1.02 2,783 1.16 3,153 1.05 62 1.31 78 1.10 54 1.65 81
Primary Agriculture Total ‐‐ 2,128 2,329 35,922 37,584 278 349 870 992
Secondary Agriculture
Foods
Dog & cat food 1.27 630 1.40 694 3.10 1,063 4.66 1,598 1.99 86 2.52 108 1.39 223 1.63 262
Other animal foods 1.29 41 1.42 45 2.69 74 3.92 108 2.09 5 2.65 7 1.85 9 2.35 12
Total ‐‐ 670 739 1,137 1,706 91 115 232 274
Grain & Oilseed Milling
Flour milling & malt 1.46 347 1.62 386 3.90 813 5.45 1,136 3.32 53 4.17 67 3.01 90 3.81 113
Wet corn milling 0.00 0 0.00 0 0.00 0 0.00 0 0.00 0 0.00 0 0.00 0 0.00 0
Soybean & other oilseed processing 1.12 849 1.18 896 2.11 930 3.00 1,324 1.80 66 2.25 82 1.97 88 2.62 117
Fats & oils refining & blending 1.28 492 1.35 516 5.69 533 7.87 737 3.88 34 4.86 43 1.98 78 2.36 93
Breakfast cereal 1.30 427 1.45 474 2.40 891 3.46 1,284 1.90 66 2.37 83 1.37 169 1.60 197
Total ‐‐ 2,114 2,273 3,167 4,482 219 275 425 521
Sugar & Confectionary Products
Sugar cane mills & refining 1.31 77 1.44 85 2.43 168 3.38 235 2.08 11 2.60 14 2.24 15 2.96 20
Beet sugar 0.00 0 0.00 0 0.00 0 0.00 0 0.00 0 0.00 0 0.00 0 0.00 0
Chocolate & confectionery from cacao beans 1.35 13 1.44 14 2.31 31 2.89 39 4.89 1 6.15 2 3.99 2 5.11 3
Confectionery from purchased chocolate 1.33 113 1.48 127 1.59 375 2.06 485 1.83 19 2.29 23 1.55 36 1.90 44
Nonchocolate confectionery 1.33 451 1.51 512 1.70 1,477 2.28 1,986 1.73 85 2.16 107 1.66 135 2.12 172
Total ‐‐ 654 738 2,051 2,744 116 145 187 238
Fruit & Vegetable Preserving & Specialty Foods
Frozen foods 1.36 805 1.57 933 1.68 2,918 2.30 3,979 1.66 179 2.08 224 1.70 251 2.23 329
Fruit & vegetable canning, pickling, & drying 1.29 297 1.46 335 1.89 804 2.63 1,120 1.70 53 2.13 67 1.57 91 1.97 114
Total ‐‐ 1,102 1,268 3,722 5,099 232 290 341 443
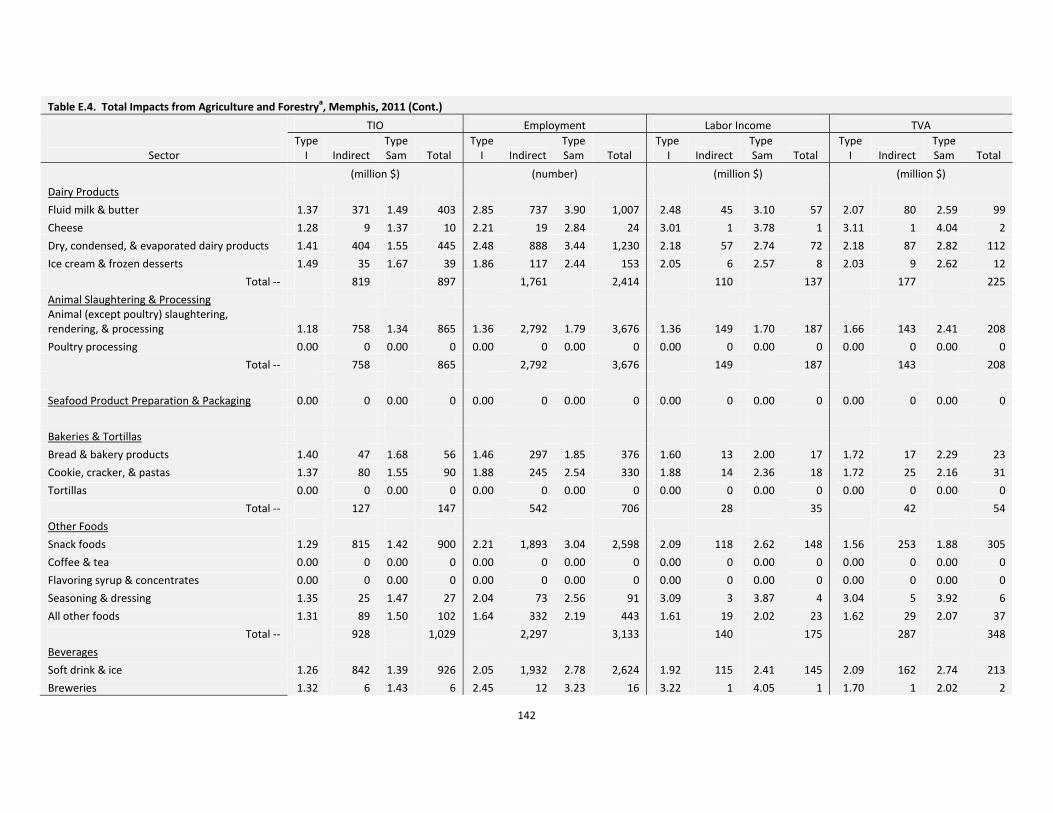
142
Table E.4. Total Impacts from Agriculture and Forestrya, Memphis, 2011 (Cont.)
TIO Employment Labor Income TVA
Sector Type I Indirect
Type Sam Total
Type I Indirect
Type Sam Total
Type I Indirect
Type Sam Total
Type I Indirect
Type Sam Total
(million $) (number) (million $) (million $)
Dairy Products
Fluid milk & butter 1.37 371 1.49 403 2.85 737 3.90 1,007 2.48 45 3.10 57 2.07 80 2.59 99
Cheese 1.28 9 1.37 10 2.21 19 2.84 24 3.01 1 3.78 1 3.11 1 4.04 2
Dry, condensed, & evaporated dairy products 1.41 404 1.55 445 2.48 888 3.44 1,230 2.18 57 2.74 72 2.18 87 2.82 112
Ice cream & frozen desserts 1.49 35 1.67 39 1.86 117 2.44 153 2.05 6 2.57 8 2.03 9 2.62 12
Total ‐‐ 819 897 1,761 2,414 110 137 177 225
Animal Slaughtering & Processing Animal (except poultry) slaughtering, rendering, & processing 1.18 758 1.34 865 1.36 2,792 1.79 3,676 1.36 149 1.70 187 1.66 143 2.41 208
Poultry processing 0.00 0 0.00 0 0.00 0 0.00 0 0.00 0 0.00 0 0.00 0 0.00 0
Total ‐‐ 758 865 2,792 3,676 149 187 143 208
Seafood Product Preparation & Packaging 0.00 0 0.00 0 0.00 0 0.00 0 0.00 0 0.00 0 0.00 0 0.00 0
Bakeries & Tortillas
Bread & bakery products 1.40 47 1.68 56 1.46 297 1.85 376 1.60 13 2.00 17 1.72 17 2.29 23
Cookie, cracker, & pastas 1.37 80 1.55 90 1.88 245 2.54 330 1.88 14 2.36 18 1.72 25 2.16 31
Tortillas 0.00 0 0.00 0 0.00 0 0.00 0 0.00 0 0.00 0 0.00 0 0.00 0
Total ‐‐ 127 147 542 706 28 35 42 54
Other Foods
Snack foods 1.29 815 1.42 900 2.21 1,893 3.04 2,598 2.09 118 2.62 148 1.56 253 1.88 305
Coffee & tea 0.00 0 0.00 0 0.00 0 0.00 0 0.00 0 0.00 0 0.00 0 0.00 0
Flavoring syrup & concentrates 0.00 0 0.00 0 0.00 0 0.00 0 0.00 0 0.00 0 0.00 0 0.00 0
Seasoning & dressing 1.35 25 1.47 27 2.04 73 2.56 91 3.09 3 3.87 4 3.04 5 3.92 6
All other foods 1.31 89 1.50 102 1.64 332 2.19 443 1.61 19 2.02 23 1.62 29 2.07 37
Total ‐‐ 928 1,029 2,297 3,133 140 175 287 348
Beverages
Soft drink & ice 1.26 842 1.39 926 2.05 1,932 2.78 2,624 1.92 115 2.41 145 2.09 162 2.74 213
Breweries 1.32 6 1.43 6 2.45 12 3.23 16 3.22 1 4.05 1 1.70 1 2.02 2
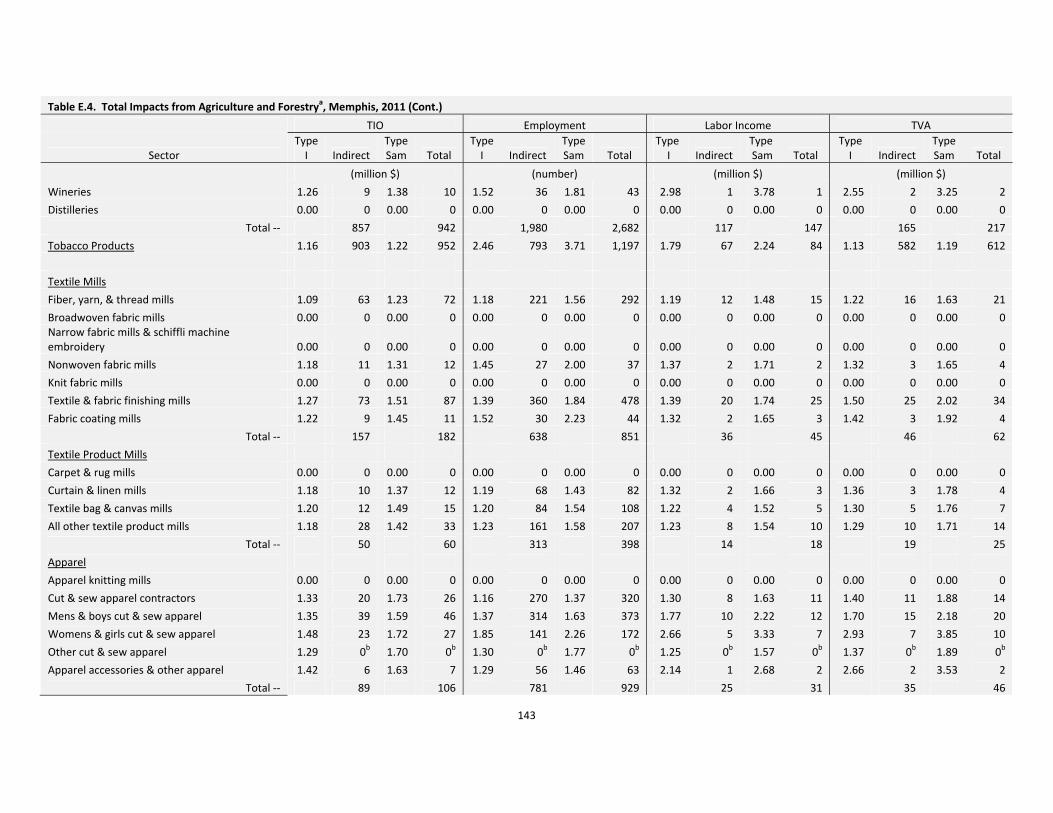
143
Table E.4. Total Impacts from Agriculture and Forestrya, Memphis, 2011 (Cont.)
TIO Employment Labor Income TVA
Sector Type I Indirect
Type Sam Total
Type I Indirect
Type Sam Total
Type I Indirect
Type Sam Total
Type I Indirect
Type Sam Total
(million $) (number) (million $) (million $)
Wineries 1.26 9 1.38 10 1.52 36 1.81 43 2.98 1 3.78 1 2.55 2 3.25 2
Distilleries 0.00 0 0.00 0 0.00 0 0.00 0 0.00 0 0.00 0 0.00 0 0.00 0
Total ‐‐ 857 942 1,980 2,682 117 147 165 217
Tobacco Products 1.16 903 1.22 952 2.46 793 3.71 1,197 1.79 67 2.24 84 1.13 582 1.19 612
Textile Mills
Fiber, yarn, & thread mills 1.09 63 1.23 72 1.18 221 1.56 292 1.19 12 1.48 15 1.22 16 1.63 21
Broadwoven fabric mills 0.00 0 0.00 0 0.00 0 0.00 0 0.00 0 0.00 0 0.00 0 0.00 0 Narrow fabric mills & schiffli machine embroidery 0.00 0 0.00 0 0.00 0 0.00 0 0.00 0 0.00 0 0.00 0 0.00 0
Nonwoven fabric mills 1.18 11 1.31 12 1.45 27 2.00 37 1.37 2 1.71 2 1.32 3 1.65 4
Knit fabric mills 0.00 0 0.00 0 0.00 0 0.00 0 0.00 0 0.00 0 0.00 0 0.00 0
Textile & fabric finishing mills 1.27 73 1.51 87 1.39 360 1.84 478 1.39 20 1.74 25 1.50 25 2.02 34
Fabric coating mills 1.22 9 1.45 11 1.52 30 2.23 44 1.32 2 1.65 3 1.42 3 1.92 4
Total ‐‐ 157 182 638 851 36 45 46 62
Textile Product Mills
Carpet & rug mills 0.00 0 0.00 0 0.00 0 0.00 0 0.00 0 0.00 0 0.00 0 0.00 0
Curtain & linen mills 1.18 10 1.37 12 1.19 68 1.43 82 1.32 2 1.66 3 1.36 3 1.78 4
Textile bag & canvas mills 1.20 12 1.49 15 1.20 84 1.54 108 1.22 4 1.52 5 1.30 5 1.76 7
All other textile product mills 1.18 28 1.42 33 1.23 161 1.58 207 1.23 8 1.54 10 1.29 10 1.71 14
Total ‐‐ 50 60 313 398 14 18 19 25
Apparel
Apparel knitting mills 0.00 0 0.00 0 0.00 0 0.00 0 0.00 0 0.00 0 0.00 0 0.00 0
Cut & sew apparel contractors 1.33 20 1.73 26 1.16 270 1.37 320 1.30 8 1.63 11 1.40 11 1.88 14
Mens & boys cut & sew apparel 1.35 39 1.59 46 1.37 314 1.63 373 1.77 10 2.22 12 1.70 15 2.18 20
Womens & girls cut & sew apparel 1.48 23 1.72 27 1.85 141 2.26 172 2.66 5 3.33 7 2.93 7 3.85 10
Other cut & sew apparel 1.29 0b 1.70 0b 1.30 0b 1.77 0b 1.25 0b 1.57 0b 1.37 0b 1.89 0b
Apparel accessories & other apparel 1.42 6 1.63 7 1.29 56 1.46 63 2.14 1 2.68 2 2.66 2 3.53 2
Total ‐‐ 89 106 781 929 25 31 35 46

144
Table E.4. Total Impacts from Agriculture and Forestrya, Memphis, 2011 (Cont.)
TIO Employment Labor Income TVA
Sector Type I Indirect
Type Sam Total
Type I Indirect
Type Sam Total
Type I Indirect
Type Sam Total
Type I Indirect
Type Sam Total
(million $) (number) (million $) (million $)
Leather & Allied Products
Leather & hide tanning & finishing 1.45 2 1.63 3 2.25 9 2.89 11 2.52 0b 3.16 1 2.67 1 3.53 1
Footwear 1.28 44 1.51 52 1.25 342 1.50 409 1.46 11 1.83 14 1.57 15 2.09 20
Other leather & allied products 1.32 2 1.57 3 1.26 17 1.50 21 1.50 1 1.87 1 1.58 1 2.05 1
Total ‐‐ 49 57 368 441 12 15 16 22
Secondary Agriculture Total ‐‐ 9,277 10,255 22,343 30,457 1,355 1,699 2,699 3,296
Agriculture Total ‐‐ 12,602 13,911 60,947 71,804 1,814 2,274 3,951 4,748
Forestry Inputs Forestry, forest products, & timber tract production 1.65 7 1.91 8 4.02 74 4.49 83 6.38 1 7.99 2 3.68 2 4.86 3
Commercial logging 1.24 85 1.58 108 1.16 1,321 1.32 1,512 1.22 32 1.53 40 1.37 30 2.01 44
Forestry Inputs Total ‐‐ 92 116 1,395 1,595 33 42 32 47
Primary Forestry
Sawmills & wood preservation 1.32 280 1.50 317 1.49 1,340 1.84 1,652 1.76 52 2.20 65 1.93 66 2.60 89
Pulp mills 1.37 127 1.61 149 2.86 333 4.46 519 1.56 31 1.96 39 1.58 43 2.08 57
Paper mills 1.28 3,611 1.49 4,183 2.48 7,906 3.97 12,654 1.49 793 1.87 994 1.37 1,424 1.70 1,772
Paperboard Mills 1.37 795 1.55 897 2.87 2,058 4.05 2,906 2.00 142 2.50 178 1.72 243 2.16 305
Primary Forestry Total ‐‐ 4,813 5,547 11,637 17,731 1,018 1,276 1,776 2,223
Secondary Forestry
Veneer, Plywood, & Engineered Wood Products
Veneer & plywood 1.19 2 1.39 2 1.30 9 1.68 12 1.35 0b 1.68 1 1.36 1 1.78 1
Engineered wood member & truss 1.27 17 1.49 20 1.37 94 1.72 119 1.50 4 1.87 5 1.49 6 1.92 8
Reconstituted wood products 0.00 0 0.00 0 0.00 0 0.00 0 0.00 0 0.00 0 0.00 0 0.00 0
Total ‐‐ 19 22 104 131 5 6 7 9
Wood Windows & Doors & Millwork 1.28 264 1.55 319 1.30 1,662 1.66 2,123 1.38 78 1.73 97 1.54 92 2.10 126

145
Table E.4. Total Impacts from Agriculture and Forestrya, Memphis, 2011 (Cont.)
TIO Employment Labor Income TVA
Sector Type I Indirect
Type Sam Total
Type I Indirect
Type Sam Total
Type I Indirect
Type Sam Total
Type I Indirect
Type Sam Total
(million $) (number) (million $) (million $)
Wood Containers & Pallets 1.27 137 1.55 167 1.21 1,099 1.48 1,347 1.32 42 1.65 52 1.44 51 1.95 70
Manufactured Homes (Mobile Homes)
Manufactured homes (mobile homes) 1.38 74 1.69 90 1.39 527 1.76 665 1.42 23 1.77 29 1.63 24 2.32 34
Prefabricated wood buildings 1.26 10 1.59 12 1.29 68 1.69 89 1.28 4 1.60 4 1.39 4 1.93 6
Total ‐‐ 84 103 595 754 27 33 28 39
All Other Miscellaneous Wood Products 1.32 8 1.62 10 1.42 50 1.85 65 1.43 3 1.78 3 1.52 3 2.03 4
Paperboard Containers 1.25 510 1.44 584 1.64 1,773 2.21 2,387 1.58 103 1.98 129 1.73 139 2.29 184
Paper Bags & Coated & Treated Paper Coated & laminated paper, packaging paper & plastics film 1.21 256 1.41 299 1.47 820 2.10 1,172 1.34 59 1.68 74 1.37 84 1.79 110
All other paper bag & coated & treated paper 1.21 67 1.42 79 1.42 253 1.97 351 1.33 16 1.67 21 1.44 20 1.96 27
Total ‐‐ 323 377 1,073 1,523 76 95 104 137
Stationery Products 1.30 48 1.48 54 1.56 206 1.96 259 1.81 9 2.26 11 2.00 12 2.63 16
Other Converted Paper Products
Sanitary paper products 1.20 479 1.32 529 1.85 1,001 2.61 1,412 1.63 69 2.04 86 1.33 159 1.58 189
All other converted paper products 0.00 0 0.00 0 0.00 0 0.00 0 0.00 0 0.00 0 0.00 0 0.00 0
Total ‐‐ 479 529 1,001 1,412 69 86 159 189
Wood Kitchen Cabinets & Countertops 1.37 52 1.76 66 1.36 393 1.79 514 1.34 20 1.68 26 1.60 21 2.28 30
Household & Institutional Furniture
Upholstered household furniture 1.13 11 1.53 16 1.23 47 2.12 81 1.09 6 1.36 7 1.12 7 1.52 9
Nonupholstered wood household furniture 1.24 15 1.56 20 1.22 119 1.56 152 1.24 6 1.56 7 1.27 8 1.66 10

146
Table E.4. Total Impacts from Agriculture and Forestrya, Memphis, 2011 (Cont.)
TIO Employment Labor Income TVA
Sector Type I Indirect
Type Sam Total
Type I Indirect
Type Sam Total
Type I Indirect
Type Sam Total
Type I Indirect
Type Sam Total
(million $) (number) (million $) (million $)
Institutional furniture 1.30 83 1.49 95 1.61 341 2.06 439 1.66 16 2.08 20 1.41 35 1.70 42
Total ‐‐ 110 130 507 672 28 35 50 62
Office Furniture Wood television, radio, & sewing machine cabinet 1.15 15 1.56 20 1.35 60 2.31 103 1.12 7 1.40 9 1.14 10 1.51 13
Custom architectural woodwork & millwork 1.24 13 1.67 17 1.24 91 1.72 127 1.17 6 1.46 8 1.26 7 1.77 9
Showcase, partition, shelving, & locker 1.26 38 1.59 48 1.37 167 2.06 250 1.20 14 1.51 17 1.25 19 1.66 25
Total ‐‐ 65 85 318 480 27 34 35 47
Other Furniture Related Products
Mattresses 1.24 11 1.45 13 1.51 43 2.08 59 1.40 3 1.76 3 1.33 5 1.67 6
Blind & shades 1.25 17 1.60 22 1.24 111 1.68 150 1.22 7 1.52 8 1.36 7 1.93 10
Total ‐‐ 28 35 154 209 9 12 12 16
Secondary Forestry Total ‐‐ 2,126 2,480 8,935 11,878 494 618 713 929
Forestry Total ‐‐ 7,030 8,143 21,967 31,204 1,546 1,936 2,521 3,199
Agriculture & Forestry Total ‐‐ 19,632 22,054 82,914 103,008 3,359 4,209 6,472 7,947
Construction ‐‐ 5,207 6,889 44,301 58,263 2,343 2,933 2,801 3,826
Finance, Insurance, & Real Estate ‐‐ 23,997 28,105 100,302 130,714 5,004 6,290 14,974 17,476
Government ‐‐ 11,737 18,027 141,633 193,836 8,787 10,992 9,995 13,761
Manufacturing ‐‐ 31,208 35,401 84,907 119,704 5,734 7,202 9,751 12,304
Mining ‐‐ 256 290 1,299 1,577 46 58 95 115
Miscellaneous ‐‐ 1,480 2,088 20,011 25,054 846 1,059 889 1,259
Retail Trade ‐‐ 7,656 10,131 99,849 120,390 3,450 4,318 5,320 6,826
Services ‐‐ 46,296 61,689 460,476 588,232 21,394 26,792 29,560 38,933

147
Table E.4. Total Impacts from Agriculture and Forestrya, Memphis, 2011 (Cont.)
TIO Employment Labor Income TVA
Sector Type I Indirect
Type Sam Total
Type I Indirect
Type Sam Total
Type I Indirect
Type Sam Total
Type I Indirect
Type Sam Total
(million $) (number) (million $) (million $)
Transportation, Information, & Utilities ‐‐ 7,229 9,058 41,633 56,817 2,467 3,109 3,449 4,563
Wholesale Trade ‐‐ 7,942 10,285 50,272 69,721 3,235 4,057 5,525 6,952 aTotals may not add due to rounding. bZero values are nonzero values less than one.

148
Table E.5. Total Impacts from Agriculture and Forestrya, Nashville, 2011
TIO Employment Labor Income TVA
Sector Type I Indirect
Type Sam Total
Type I Indirect
Type Sam Total
Type I Indirect
Type Sam Total
Type I Indirect
Type Sam Total
(million $) (number) (million $) (million $)
Agricultural Inputs
Agricultural Chemicals
Fertilizers 0.00 0 0.00 0 0.00 0 0.00 0 0.00 0 0.00 0 0.00 0 0.00 0
Pesticide & other agricultural chemicals 1.23 11 1.37 12 3.42 18 5.43 28 2.14 2 2.78 2 1.37 4 1.63 5
Lime & gypsum products 1.44 111 1.72 133 2.28 373 3.33 545 1.79 26 2.33 34 1.66 42 2.19 55
Total ‐‐ 122 145 391 573 27 36 46 60
Agricultural Machinery
Farm machinery & equipment 1.31 48 1.48 54 2.08 139 2.81 188 2.08 7 2.70 10 1.71 14 2.16 18
Lawn & garden equipment 1.22 47 1.51 58 1.67 128 2.86 219 1.24 14 1.59 18 1.29 19 1.76 26
Total ‐‐ 95 112 267 407 22 28 33 44
Agricultural Inputs Total ‐‐ 217 257 658 981 49 64 79 104
Primary Agriculture
Oilseed farming 1.28 103 1.36 109 1.07 4,651 1.08 4,700 15.64 7 20.33 10 1.39 49 1.50 53
Grain farming 1.39 158 1.50 172 1.07 9,378 1.08 9,486 6.18 16 8.03 21 1.76 63 1.99 71
Vegetable & melon farming 1.29 33 1.44 37 1.46 387 1.58 418 2.56 5 3.34 6 1.32 18 1.49 20
Fruit farming 1.28 6 1.41 6 1.53 73 1.63 77 6.08 1 7.93 1 1.30 3 1.45 3
Tree nut farming 1.26 0b 1.48 0b 1.18 12 1.25 12 1.79 0b 2.33 0b 1.26 0b 1.50 0b
Greenhouse, nursery, & floriculture production 1.15 283 1.27 315 1.16 3,904 1.24 4,157 1.49 37 1.96 48 1.13 184 1.25 204
Tobacco farming 1.45 110 1.59 122 1.24 2,480 1.29 2,571 6.00 14 7.80 18 2.37 36 2.83 43
Cotton farming 1.33 16 1.54 18 1.15 450 1.20 470 1.82 3 2.37 4 1.59 6 1.99 8
Sugarcane & sugar beet farming 0.00 0 0.00 0 0.00 0 0.00 0 0.00 0 0.00 0 0.00 0 0.00 0
All other crop farming 1.41 247 1.55 272 1.57 2,815 1.68 3,012 6.01 30 7.82 39 1.91 89 2.24 104
Cattle ranching & farming 1.93 588 2.05 625 1.75 8,531 1.81 8,832 4.70 45 6.12 58 2.83 145 3.28 168
Dairy cattle & milk production 1.40 107 1.48 114 1.31 1,357 1.35 1,407 19.08 7 24.87 10 1.48 41 1.62 45
Poultry & egg production 1.32 405 1.44 439 1.69 2,025 1.92 2,303 2.87 41 3.74 54 1.66 102 2.01 123 Animal production, except cattle/poultry/eggs 1.30 64 1.41 69 1.07 3,738 1.08 3,784 2.08 7 2.71 9 1.28 31 1.42 35
Commercial fishing 0.00 0 0.00 0 0.00 0 0.00 0 0.00 0 0.00 0 0.00 0 0.00 0
Commercial hunting & trapping 1.49 33 1.65 37 1.35 374 1.45 403 22.29 4 28.95 6 3.12 9 3.90 11
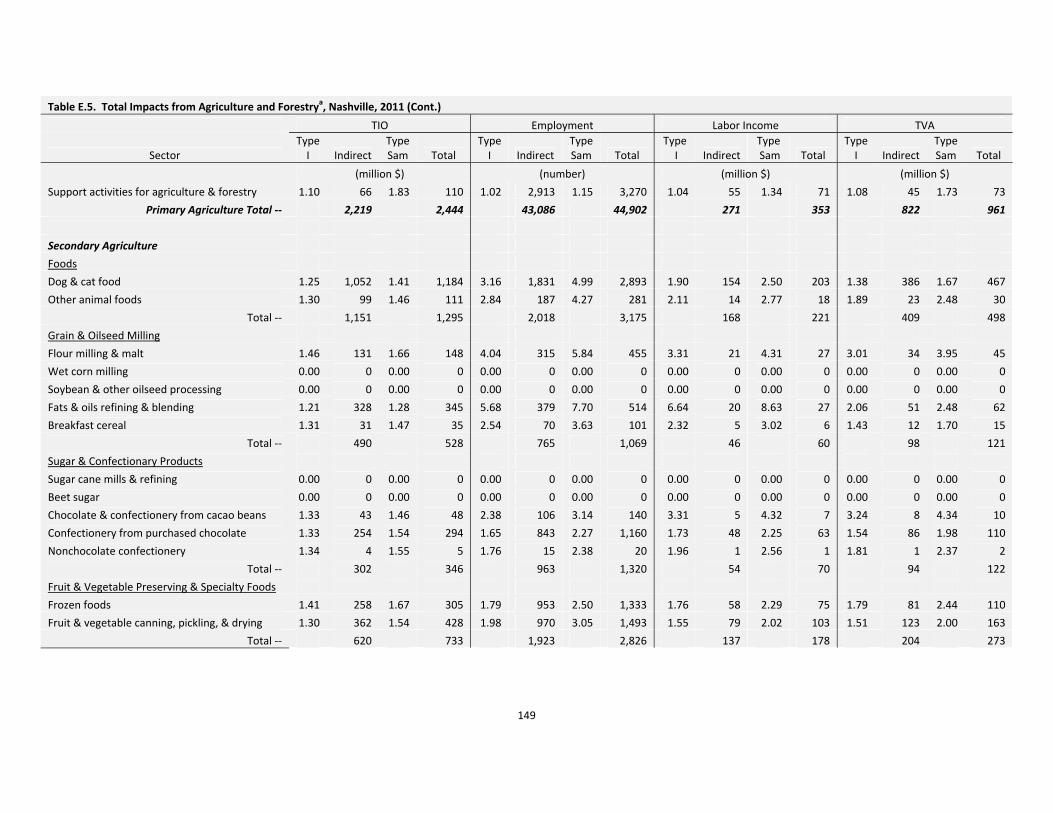
149
Table E.5. Total Impacts from Agriculture and Forestrya, Nashville, 2011 (Cont.)
TIO Employment Labor Income TVA
Sector Type I Indirect
Type Sam Total
Type I Indirect
Type Sam Total
Type I Indirect
Type Sam Total
Type I Indirect
Type Sam Total
(million $) (number) (million $) (million $)
Support activities for agriculture & forestry 1.10 66 1.83 110 1.02 2,913 1.15 3,270 1.04 55 1.34 71 1.08 45 1.73 73
Primary Agriculture Total ‐‐ 2,219 2,444 43,086 44,902 271 353 822 961
Secondary Agriculture
Foods
Dog & cat food 1.25 1,052 1.41 1,184 3.16 1,831 4.99 2,893 1.90 154 2.50 203 1.38 386 1.67 467
Other animal foods 1.30 99 1.46 111 2.84 187 4.27 281 2.11 14 2.77 18 1.89 23 2.48 30
Total ‐‐ 1,151 1,295 2,018 3,175 168 221 409 498
Grain & Oilseed Milling
Flour milling & malt 1.46 131 1.66 148 4.04 315 5.84 455 3.31 21 4.31 27 3.01 34 3.95 45
Wet corn milling 0.00 0 0.00 0 0.00 0 0.00 0 0.00 0 0.00 0 0.00 0 0.00 0
Soybean & other oilseed processing 0.00 0 0.00 0 0.00 0 0.00 0 0.00 0 0.00 0 0.00 0 0.00 0
Fats & oils refining & blending 1.21 328 1.28 345 5.68 379 7.70 514 6.64 20 8.63 27 2.06 51 2.48 62
Breakfast cereal 1.31 31 1.47 35 2.54 70 3.63 101 2.32 5 3.02 6 1.43 12 1.70 15
Total ‐‐ 490 528 765 1,069 46 60 98 121
Sugar & Confectionary Products
Sugar cane mills & refining 0.00 0 0.00 0 0.00 0 0.00 0 0.00 0 0.00 0 0.00 0 0.00 0
Beet sugar 0.00 0 0.00 0 0.00 0 0.00 0 0.00 0 0.00 0 0.00 0 0.00 0
Chocolate & confectionery from cacao beans 1.33 43 1.46 48 2.38 106 3.14 140 3.31 5 4.32 7 3.24 8 4.34 10
Confectionery from purchased chocolate 1.33 254 1.54 294 1.65 843 2.27 1,160 1.73 48 2.25 63 1.54 86 1.98 110
Nonchocolate confectionery 1.34 4 1.55 5 1.76 15 2.38 20 1.96 1 2.56 1 1.81 1 2.37 2
Total ‐‐ 302 346 963 1,320 54 70 94 122
Fruit & Vegetable Preserving & Specialty Foods
Frozen foods 1.41 258 1.67 305 1.79 953 2.50 1,333 1.76 58 2.29 75 1.79 81 2.44 110
Fruit & vegetable canning, pickling, & drying 1.30 362 1.54 428 1.98 970 3.05 1,493 1.55 79 2.02 103 1.51 123 2.00 163
Total ‐‐ 620 733 1,923 2,826 137 178 204 273
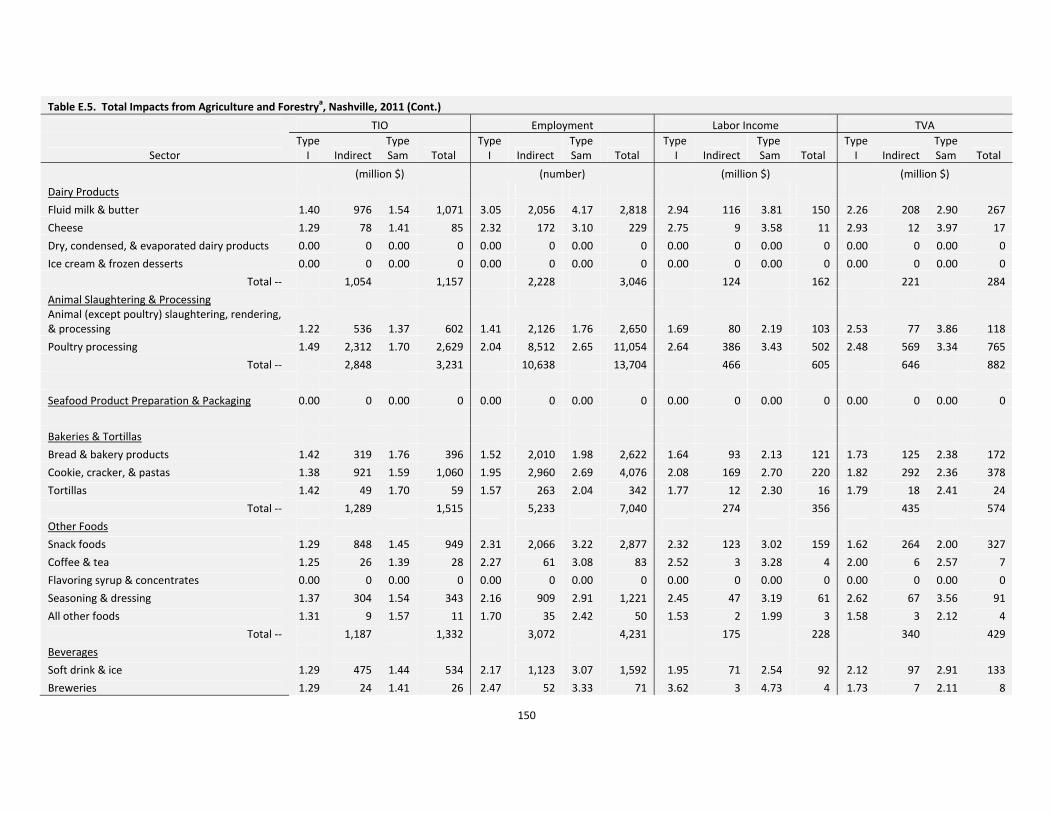
150
Table E.5. Total Impacts from Agriculture and Forestrya, Nashville, 2011 (Cont.)
TIO Employment Labor Income TVA
Sector Type I Indirect
Type Sam Total
Type I Indirect
Type Sam Total
Type I Indirect
Type Sam Total
Type I Indirect
Type Sam Total
(million $) (number) (million $) (million $)
Dairy Products
Fluid milk & butter 1.40 976 1.54 1,071 3.05 2,056 4.17 2,818 2.94 116 3.81 150 2.26 208 2.90 267
Cheese 1.29 78 1.41 85 2.32 172 3.10 229 2.75 9 3.58 11 2.93 12 3.97 17
Dry, condensed, & evaporated dairy products 0.00 0 0.00 0 0.00 0 0.00 0 0.00 0 0.00 0 0.00 0 0.00 0
Ice cream & frozen desserts 0.00 0 0.00 0 0.00 0 0.00 0 0.00 0 0.00 0 0.00 0 0.00 0
Total ‐‐ 1,054 1,157 2,228 3,046 124 162 221 284
Animal Slaughtering & Processing Animal (except poultry) slaughtering, rendering, & processing 1.22 536 1.37 602 1.41 2,126 1.76 2,650 1.69 80 2.19 103 2.53 77 3.86 118
Poultry processing 1.49 2,312 1.70 2,629 2.04 8,512 2.65 11,054 2.64 386 3.43 502 2.48 569 3.34 765
Total ‐‐ 2,848 3,231 10,638 13,704 466 605 646 882
Seafood Product Preparation & Packaging 0.00 0 0.00 0 0.00 0 0.00 0 0.00 0 0.00 0 0.00 0 0.00 0
Bakeries & Tortillas
Bread & bakery products 1.42 319 1.76 396 1.52 2,010 1.98 2,622 1.64 93 2.13 121 1.73 125 2.38 172
Cookie, cracker, & pastas 1.38 921 1.59 1,060 1.95 2,960 2.69 4,076 2.08 169 2.70 220 1.82 292 2.36 378
Tortillas 1.42 49 1.70 59 1.57 263 2.04 342 1.77 12 2.30 16 1.79 18 2.41 24
Total ‐‐ 1,289 1,515 5,233 7,040 274 356 435 574
Other Foods
Snack foods 1.29 848 1.45 949 2.31 2,066 3.22 2,877 2.32 123 3.02 159 1.62 264 2.00 327
Coffee & tea 1.25 26 1.39 28 2.27 61 3.08 83 2.52 3 3.28 4 2.00 6 2.57 7
Flavoring syrup & concentrates 0.00 0 0.00 0 0.00 0 0.00 0 0.00 0 0.00 0 0.00 0 0.00 0
Seasoning & dressing 1.37 304 1.54 343 2.16 909 2.91 1,221 2.45 47 3.19 61 2.62 67 3.56 91
All other foods 1.31 9 1.57 11 1.70 35 2.42 50 1.53 2 1.99 3 1.58 3 2.12 4
Total ‐‐ 1,187 1,332 3,072 4,231 175 228 340 429
Beverages
Soft drink & ice 1.29 475 1.44 534 2.17 1,123 3.07 1,592 1.95 71 2.54 92 2.12 97 2.91 133
Breweries 1.29 24 1.41 26 2.47 52 3.33 71 3.62 3 4.73 4 1.73 7 2.11 8
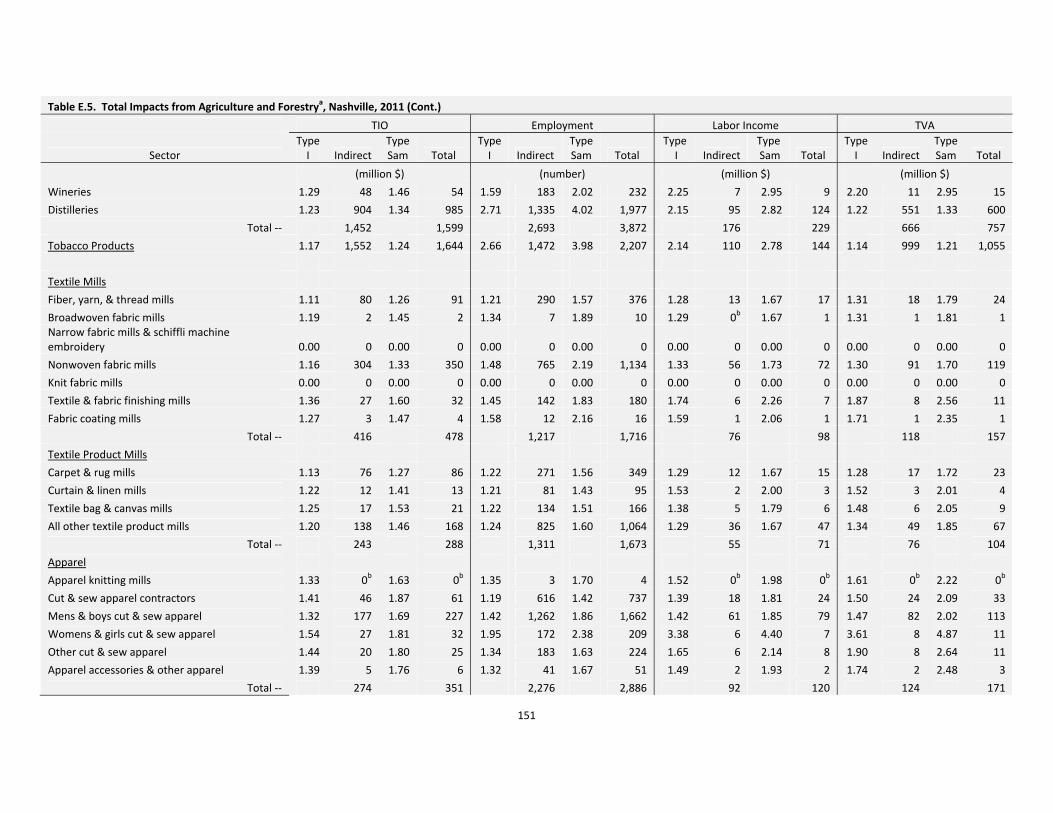
151
Table E.5. Total Impacts from Agriculture and Forestrya, Nashville, 2011 (Cont.)
TIO Employment Labor Income TVA
Sector Type I Indirect
Type Sam Total
Type I Indirect
Type Sam Total
Type I Indirect
Type Sam Total
Type I Indirect
Type Sam Total
(million $) (number) (million $) (million $)
Wineries 1.29 48 1.46 54 1.59 183 2.02 232 2.25 7 2.95 9 2.20 11 2.95 15
Distilleries 1.23 904 1.34 985 2.71 1,335 4.02 1,977 2.15 95 2.82 124 1.22 551 1.33 600
Total ‐‐ 1,452 1,599 2,693 3,872 176 229 666 757
Tobacco Products 1.17 1,552 1.24 1,644 2.66 1,472 3.98 2,207 2.14 110 2.78 144 1.14 999 1.21 1,055
Textile Mills
Fiber, yarn, & thread mills 1.11 80 1.26 91 1.21 290 1.57 376 1.28 13 1.67 17 1.31 18 1.79 24
Broadwoven fabric mills 1.19 2 1.45 2 1.34 7 1.89 10 1.29 0b 1.67 1 1.31 1 1.81 1 Narrow fabric mills & schiffli machine embroidery 0.00 0 0.00 0 0.00 0 0.00 0 0.00 0 0.00 0 0.00 0 0.00 0
Nonwoven fabric mills 1.16 304 1.33 350 1.48 765 2.19 1,134 1.33 56 1.73 72 1.30 91 1.70 119
Knit fabric mills 0.00 0 0.00 0 0.00 0 0.00 0 0.00 0 0.00 0 0.00 0 0.00 0
Textile & fabric finishing mills 1.36 27 1.60 32 1.45 142 1.83 180 1.74 6 2.26 7 1.87 8 2.56 11
Fabric coating mills 1.27 3 1.47 4 1.58 12 2.16 16 1.59 1 2.06 1 1.71 1 2.35 1
Total ‐‐ 416 478 1,217 1,716 76 98 118 157
Textile Product Mills
Carpet & rug mills 1.13 76 1.27 86 1.22 271 1.56 349 1.29 12 1.67 15 1.28 17 1.72 23
Curtain & linen mills 1.22 12 1.41 13 1.21 81 1.43 95 1.53 2 2.00 3 1.52 3 2.01 4
Textile bag & canvas mills 1.25 17 1.53 21 1.22 134 1.51 166 1.38 5 1.79 6 1.48 6 2.05 9
All other textile product mills 1.20 138 1.46 168 1.24 825 1.60 1,064 1.29 36 1.67 47 1.34 49 1.85 67
Total ‐‐ 243 288 1,311 1,673 55 71 76 104
Apparel
Apparel knitting mills 1.33 0b 1.63 0b 1.35 3 1.70 4 1.52 0b 1.98 0b 1.61 0b 2.22 0b
Cut & sew apparel contractors 1.41 46 1.87 61 1.19 616 1.42 737 1.39 18 1.81 24 1.50 24 2.09 33
Mens & boys cut & sew apparel 1.32 177 1.69 227 1.42 1,262 1.86 1,662 1.42 61 1.85 79 1.47 82 2.02 113
Womens & girls cut & sew apparel 1.54 27 1.81 32 1.95 172 2.38 209 3.38 6 4.40 7 3.61 8 4.87 11
Other cut & sew apparel 1.44 20 1.80 25 1.34 183 1.63 224 1.65 6 2.14 8 1.90 8 2.64 11
Apparel accessories & other apparel 1.39 5 1.76 6 1.32 41 1.67 51 1.49 2 1.93 2 1.74 2 2.48 3
Total ‐‐ 274 351 2,276 2,886 92 120 124 171

152
Table E.5. Total Impacts from Agriculture and Forestrya, Nashville, 2011 (Cont.)
TIO Employment Labor Income TVA
Sector Type I Indirect
Type Sam Total
Type I Indirect
Type Sam Total
Type I Indirect
Type Sam Total
Type I Indirect
Type Sam Total
(million $) (number) (million $) (million $)
Leather & Allied Products
Leather & hide tanning & finishing 1.47 39 1.66 44 2.33 149 2.96 190 2.99 6 3.89 8 3.08 9 4.18 12
Footwear 1.30 51 1.60 63 1.28 377 1.60 472 1.43 14 1.86 19 1.55 19 2.16 26
Other leather & allied products 1.29 8 1.68 11 1.29 59 1.73 80 1.30 3 1.69 4 1.39 4 1.95 6
Total ‐‐ 98 118 586 742 24 31 31 43
Secondary Agriculture Total ‐‐ 12,976 14,615 36,392 49,507 1,976 2,572 4,461 5,471
Agriculture Total ‐‐ 15,412 17,316 80,136 95,390 2,296 2,989 5,362 6,535
Forestry Inputs Forestry, forest products, & timber tract production 1.63 10 1.96 12 4.89 143 5.43 159 8.46 2 10.94 3 5.33 3 7.68 4
Commercial logging 1.30 82 1.68 106 1.24 1,321 1.42 1,515 1.28 30 1.65 39 1.46 29 2.22 43
Forestry Inputs Total ‐‐ 92 118 1,464 1,674 32 42 31 47
Primary Forestry
Sawmills & wood preservation 1.39 516 1.60 596 1.59 2,513 1.99 3,153 1.91 96 2.48 125 2.09 122 2.94 171
Pulp mills 0.00 0 0.00 0 0.00 0 0.00 0 0.00 0 0.00 0 0.00 0 0.00 0
Paper mills 1.34 275 1.52 312 2.65 686 3.81 984 2.15 44 2.80 58 1.54 95 1.91 118
Paperboard Mills 0.00 0 0.00 0 0.00 0 0.00 0 0.00 0 0.00 0 0.00 0 0.00 0
Primary Forestry Total ‐‐ 791 908 3,199 4,138 141 183 217 289
Secondary Forestry
Veneer, Plywood, & Engineered Wood Products
Veneer & plywood 0.00 0 0.00 0 0.00 0 0.00 0 0.00 0 0.00 0 0.00 0 0.00 0
Engineered wood member & truss 1.30 50 1.52 59 1.39 297 1.72 367 1.77 10 2.30 14 1.65 17 2.16 22
Reconstituted wood products 1.28 28 1.45 31 1.30 177 1.51 206 1.91 4 2.48 6 2.03 6 2.81 8
Total ‐‐ 78 90 474 573 15 19 23 30
Wood Windows & Doors & Millwork 1.33 176 1.61 213 1.33 1,181 1.67 1,479 1.59 45 2.06 58 1.79 56 2.53 78

153
Table E.5. Total Impacts from Agriculture and Forestrya, Nashville, 2011 (Cont.)
TIO Employment Labor Income TVA
Sector Type I Indirect
Type Sam Total
Type I Indirect
Type Sam Total
Type I Indirect
Type Sam Total
Type I Indirect
Type Sam Total
(million $) (number) (million $) (million $)
Wood Containers & Pallets 1.28 81 1.58 100 1.22 694 1.49 844 1.43 23 1.86 29 1.55 28 2.18 40
Manufactured Homes (Mobile Homes)
Manufactured homes (mobile homes) 1.33 34 1.71 43 1.34 227 1.79 304 1.33 12 1.72 15 1.51 12 2.25 18
Prefabricated wood buildings 1.34 40 1.65 49 1.32 313 1.64 389 1.50 11 1.95 15 1.70 14 2.43 19
Total ‐‐ 74 93 541 693 23 30 26 37
All Other Miscellaneous Wood Products 1.40 69 1.74 85 1.49 446 1.93 578 1.68 20 2.18 26 1.76 27 2.42 37
Paperboard Containers 1.26 970 1.49 1,149 1.69 3,372 2.41 4,812 1.54 217 2.01 282 1.68 284 2.33 394
Paper Bags & Coated & Treated Paper Coated & laminated paper, packaging paper & plastics film 1.21 152 1.46 183 1.51 481 2.32 736 1.32 39 1.72 50 1.36 53 1.86 72
All other paper bag & coated & treated paper 1.23 46 1.45 54 1.45 186 1.96 251 1.49 10 1.94 13 1.62 12 2.26 17
Total ‐‐ 198 237 667 987 48 63 65 90
Stationery Products 1.31 188 1.55 222 1.61 779 2.18 1,056 1.64 41 2.14 54 1.78 57 2.43 78
Other Converted Paper Products
Sanitary paper products 0.00 0 0.00 0 0.00 0 0.00 0 0.00 0 0.00 0 0.00 0 0.00 0
All other converted paper products 1.32 92 1.58 110 1.63 388 2.22 530 1.77 21 2.31 28 1.84 29 2.52 40
Total ‐‐ 92 110 388 530 21 28 29 40
Wood Kitchen Cabinets & Countertops 1.43 128 1.87 168 1.41 1,014 1.85 1,333 1.41 49 1.83 63 1.77 50 2.62 75
Household & Institutional Furniture
Upholstered household furniture 1.23 13 1.48 16 1.25 82 1.60 104 1.35 3 1.76 4 1.33 5 1.76 7
Nonupholstered wood household furniture 1.28 26 1.64 33 1.25 201 1.61 259 1.29 9 1.68 11 1.32 13 1.78 17
Institutional furniture 1.33 11 1.53 13 1.67 48 2.14 62 1.83 2 2.37 3 1.48 5 1.80 6
Total ‐‐ 50 62 331 425 14 18 23 30
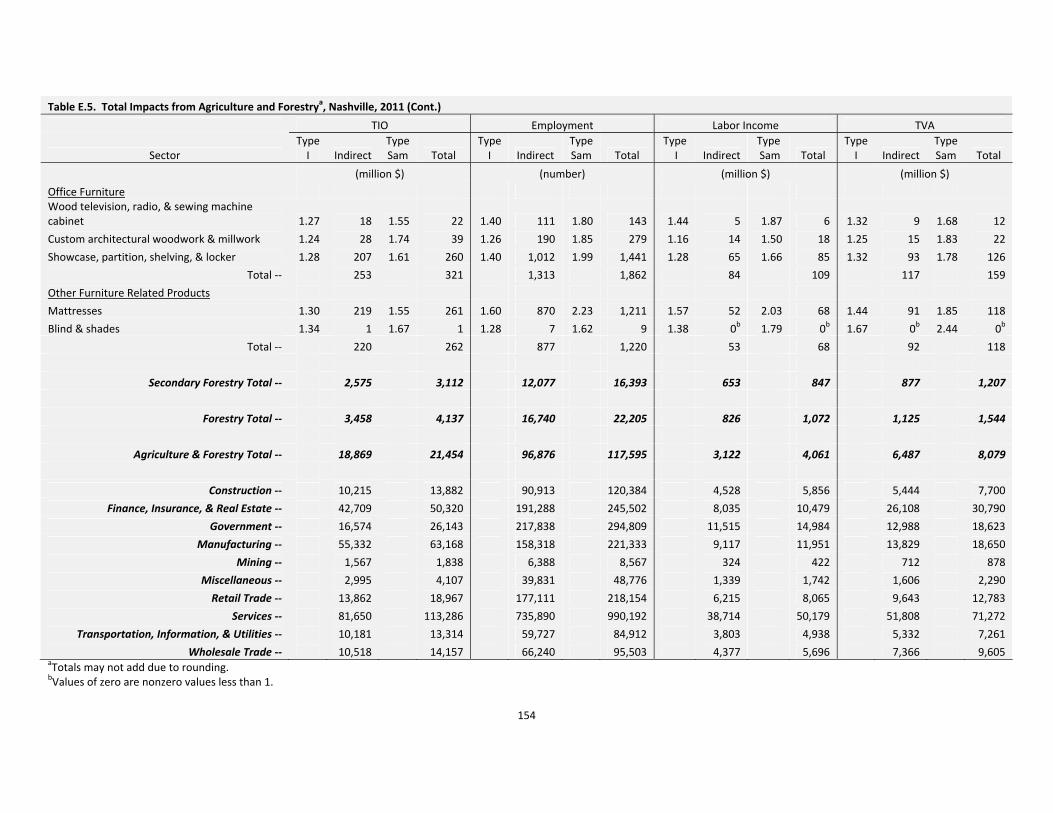
154
Table E.5. Total Impacts from Agriculture and Forestrya, Nashville, 2011 (Cont.)
TIO Employment Labor Income TVA
Sector Type I Indirect
Type Sam Total
Type I Indirect
Type Sam Total
Type I Indirect
Type Sam Total
Type I Indirect
Type Sam Total
(million $) (number) (million $) (million $)
Office Furniture Wood television, radio, & sewing machine cabinet 1.27 18 1.55 22 1.40 111 1.80 143 1.44 5 1.87 6 1.32 9 1.68 12
Custom architectural woodwork & millwork 1.24 28 1.74 39 1.26 190 1.85 279 1.16 14 1.50 18 1.25 15 1.83 22
Showcase, partition, shelving, & locker 1.28 207 1.61 260 1.40 1,012 1.99 1,441 1.28 65 1.66 85 1.32 93 1.78 126
Total ‐‐ 253 321 1,313 1,862 84 109 117 159
Other Furniture Related Products
Mattresses 1.30 219 1.55 261 1.60 870 2.23 1,211 1.57 52 2.03 68 1.44 91 1.85 118
Blind & shades 1.34 1 1.67 1 1.28 7 1.62 9 1.38 0b 1.79 0b 1.67 0b 2.44 0b
Total ‐‐ 220 262 877 1,220 53 68 92 118
Secondary Forestry Total ‐‐ 2,575 3,112 12,077 16,393 653 847 877 1,207
Forestry Total ‐‐ 3,458 4,137 16,740 22,205 826 1,072 1,125 1,544
Agriculture & Forestry Total ‐‐ 18,869 21,454 96,876 117,595 3,122 4,061 6,487 8,079
Construction ‐‐ 10,215 13,882 90,913 120,384 4,528 5,856 5,444 7,700
Finance, Insurance, & Real Estate ‐‐ 42,709 50,320 191,288 245,502 8,035 10,479 26,108 30,790
Government ‐‐ 16,574 26,143 217,838 294,809 11,515 14,984 12,988 18,623
Manufacturing ‐‐ 55,332 63,168 158,318 221,333 9,117 11,951 13,829 18,650
Mining ‐‐ 1,567 1,838 6,388 8,567 324 422 712 878
Miscellaneous ‐‐ 2,995 4,107 39,831 48,776 1,339 1,742 1,606 2,290
Retail Trade ‐‐ 13,862 18,967 177,111 218,154 6,215 8,065 9,643 12,783
Services ‐‐ 81,650 113,286 735,890 990,192 38,714 50,179 51,808 71,272
Transportation, Information, & Utilities ‐‐ 10,181 13,314 59,727 84,912 3,803 4,938 5,332 7,261
Wholesale Trade ‐‐ 10,518 14,157 66,240 95,503 4,377 5,696 7,366 9,605 aTotals may not add due to rounding. bValues of zero are nonzero values less than 1.

155
Table E.6. Total Impacts from Agriculture and Forestrya, Tri‐Cities, 2011
TIO Employment Labor Income TVA
Sector Type I Indirect
Type Sam Total
Type I Indirect
Type Sam Total
Type I Indirect
Type Sam Total
Type I Indirect
Type Sam Total
(million $) (number) (million $) (million $)
Agricultural Inputs
Agricultural Chemicals
Fertilizers 1.39 7 1.47 7 3.51 15 4.44 19 3.74 1 4.51 1 3.28 1 4.07 1
Pesticide & other agricultural chemicals 1.16 67 1.24 72 2.68 91 3.85 131 1.73 7 2.09 8 1.22 24 1.36 26
Lime & gypsum products 0.00 0 0.00 0 0.00 0 0.00 0 0.00 0 0.00 0 0.00 0 0.00 0
Total ‐‐ 74 79 106 150 7 9 25 27
Agricultural Machinery
Farm machinery & equipment 0.00 0 0.00 0 0.00 0 0.00 0 0.00 0 0.00 0 0.00 0 0.00 0
Lawn & garden equipment 1.16 214 1.27 235 1.46 662 1.89 858 1.36 33 1.65 39 1.33 58 1.63 70
Total ‐‐ 214 235 662 858 33 39 58 70
Agricultural Inputs Total ‐‐ 288 314 768 1,008 40 48 82 98
Primary Agriculture
Oilseed farming 0.00 0 0.00 0 0.00 0 0.00 0 0.00 0 0.00 0 0.00 0 0.00 0
Grain farming 1.27 5 1.34 5 1.02 727 1.03 730 3.62 0b 4.37 1 1.50 2 1.63 2
Vegetable & melon farming 1.21 10 1.33 11 1.25 166 1.32 176 1.68 2 2.02 2 1.21 5 1.35 6
Fruit farming 1.22 1 1.32 2 1.28 28 1.33 29 2.24 0b 2.70 0b 1.22 1 1.33 1
Tree nut farming 1.20 0b 1.41 0b 1.10 3 1.14 3 1.33 0b 1.61 0b 1.19 0b 1.40 0b
Greenhouse, nursery, & floriculture production 1.08 9 1.34 12 1.03 380 1.09 401 1.08 3 1.30 4 1.07 6 1.30 7
Tobacco farming 1.31 12 1.40 13 1.08 699 1.09 706 3.76 1 4.54 1 1.90 4 2.15 4
Cotton farming 0.00 0 0.00 0 0.00 0 0.00 0 0.00 0 0.00 0 0.00 0 0.00 0
Sugarcane & sugar beet farming 0.00 0 0.00 0 0.00 0 0.00 0 0.00 0 0.00 0 0.00 0 0.00 0
All other crop farming 1.30 49 1.38 52 1.30 777 1.35 808 3.36 5 4.06 6 1.62 16 1.81 18
Cattle ranching & farming 1.88 123 1.96 128 1.67 2,625 1.71 2,677 3.23 9 3.90 10 2.53 28 2.83 31
Dairy cattle & milk production 1.38 39 1.43 40 1.21 693 1.24 707 7.15 2 8.65 3 1.38 14 1.47 15
Poultry & egg production 1.35 42 1.43 45 1.34 262 1.47 286 2.40 4 2.91 5 1.57 10 1.82 11 Animal production, except cattle/poultry/eggs 1.26 8 1.36 8 1.05 758 1.06 763 1.55 1 1.86 1 1.21 4 1.33 4
Commercial fishing 0.00 0 0.00 0 0.00 0 0.00 0 0.00 0 0.00 0 0.00 0 0.00 0
Commercial hunting & trapping 1.40 4 1.49 4 1.29 53 1.35 55 17.03 0b 20.58 0b 7.35 1 9.00 1

156
Table E.6. Total Impacts from Agriculture and Forestrya, Tri‐Cities, 2011 (Cont.)
TIO Employment Labor Income TVA
Sector Type I Indirect
Type Sam Total
Type I Indirect
Type Sam Total
Type I Indirect
Type Sam Total
Type I Indirect
Type Sam Total
(million $) (number) (million $) (million $)
Support activities for agriculture & forestry 1.16 7 1.74 10 1.02 314 1.13 346 1.03 5 1.25 6 1.09 4 1.60 6
Primary Agriculture Total ‐‐ 310 332 7,486 7,687 33 40 94 107
Secondary Agriculture
Foods
Dog & cat food 0.00 0 0.00 0 0.00 0 0.00 0 0.00 0 0.00 0 0.00 0 0.00 0
Other animal foods 1.26 32 1.37 35 2.47 53 3.68 80 1.66 4 2.02 5 1.59 7 1.98 9
Total ‐‐ 32 35 53 80 4 5 7 9
Grain & Oilseed Milling
Flour milling & malt 0.00 0 0.00 0 0.00 0 0.00 0 0.00 0 0.00 0 0.00 0 0.00 0
Wet corn milling 0.00 0 0.00 0 0.00 0 0.00 0 0.00 0 0.00 0 0.00 0 0.00 0
Soybean & other oilseed processing 0.00 0 0.00 0 0.00 0 0.00 0 0.00 0 0.00 0 0.00 0 0.00 0
Fats & oils refining & blending 0.00 0 0.00 0 0.00 0 0.00 0 0.00 0 0.00 0 0.00 0 0.00 0
Breakfast cereal 0.00 0 0.00 0 0.00 0 0.00 0 0.00 0 0.00 0 0.00 0 0.00 0
Total ‐‐ 0 0 0 0 0 0 0 0
Sugar & Confectionary Products
Sugar cane mills & refining 0.00 0 0.00 0 0.00 0 0.00 0 0.00 0 0.00 0 0.00 0 0.00 0
Beet sugar 0.00 0 0.00 0 0.00 0 0.00 0 0.00 0 0.00 0 0.00 0 0.00 0
Chocolate & confectionery from cacao beans 0.00 0 0.00 0 0.00 0 0.00 0 0.00 0 0.00 0 0.00 0 0.00 0
Confectionery from purchased chocolate 0.00 0 0.00 0 0.00 0 0.00 0 0.00 0 0.00 0 0.00 0 0.00 0
Nonchocolate confectionery 1.21 3 1.32 4 1.52 12 1.88 15 1.65 0 2.00 1 1.51 1 1.83 1
Total ‐‐ 3 4 12 15 0 1 1 1
Fruit & Vegetable Preserving & Specialty Foods
Frozen foods 0.00 0 0.00 0 0.00 0 0.00 0 0.00 0 0.00 0 0.00 0 0.00 0
Fruit & vegetable canning, pickling, & drying 0.00 0 0.00 0 0.00 0 0.00 0 0.00 0 0.00 0 0.00 0 0.00 0
Total ‐‐ 0 0 0 0 0 0 0 0

157
Table E.6. Total Impacts from Agriculture and Forestrya, Tri‐Cities, 2011 (Cont.)
TIO Employment Labor Income TVA
Sector Type I Indirect
Type Sam Total
Type I Indirect
Type Sam Total
Type I Indirect
Type Sam Total
Type I Indirect
Type Sam Total
(million $) (number) (million $) (million $)
Dairy Products
Fluid milk & butter 1.24 35 1.32 38 2.44 67 3.15 87 2.12 3 2.56 4 1.73 6 2.08 8
Cheese 1.23 60 1.29 63 2.02 122 2.49 150 2.44 5 2.95 6 2.50 7 3.15 9
Dry, condensed, & evaporated dairy products 1.29 207 1.39 224 2.14 430 2.90 583 1.73 26 2.08 31 1.75 39 2.19 49
Ice cream & frozen desserts 0.00 0 0.00 0 0.00 0 0.00 0 0.00 0 0.00 0 0.00 0 0.00 0
Total ‐‐ 302 324 618 820 34 41 53 66
Animal Slaughtering & Processing Animal (except poultry) slaughtering, rendering, & processing 1.12 20 1.20 21 1.27 79 1.48 92 1.47 2 1.78 3 2.38 2 3.46 3
Poultry processing 0.00 0 0.00 0 0.00 0 0.00 0 0.00 0 0.00 0 0.00 0 0.00 0
Total ‐‐ 20 21 79 92 2 3 2 3
Seafood Product Preparation & Packaging 0.00 0 0.00 0 0.00 0 0.00 0 0.00 0 0.00 0 0.00 0 0.00 0
Bakeries & Tortillas
Bread & bakery products 1.25 12 1.45 14 1.37 83 1.65 100 1.43 3 1.72 3 1.49 4 1.90 5
Cookie, cracker, & pastas 0.00 0 0.00 0 0.00 0 0.00 0 0.00 0 0.00 0 0.00 0 0.00 0
Tortillas 0.00 0 0.00 0 0.00 0 0.00 0 0.00 0 0.00 0 0.00 0 0.00 0
Total ‐‐ 12 14 83 100 3 3 4 5
Other Foods
Snack foods 0.00 0 0.00 0 0.00 0 0.00 0 0.00 0 0.00 0 0.00 0 0.00 0
Coffee & tea 0.00 0 0.00 0 0.00 0 0.00 0 0.00 0 0.00 0 0.00 0 0.00 0
Flavoring syrup & concentrates 0.00 0 0.00 0 0.00 0 0.00 0 0.00 0 0.00 0 0.00 0 0.00 0
Seasoning & dressing 0.00 0 0.00 0 0.00 0 0.00 0 0.00 0 0.00 0 0.00 0 0.00 0
All other foods 1.19 11 1.35 13 1.49 41 1.97 54 1.33 2 1.61 3 1.36 3 1.70 4
Total ‐‐ 11 13 41 54 2 3 3 4
Beverages
Soft drink & ice 1.18 294 1.27 317 1.82 646 2.39 851 1.58 34 1.91 41 1.68 47 2.15 60
Breweries 1.16 2 1.20 2 1.96 4 2.31 5 5.48 0b 6.69 0b 1.43 0b 1.58 0b

158
Table E.6. Total Impacts from Agriculture and Forestrya, Tri‐Cities, 2011 (Cont.)
TIO Employment Labor Income TVA
Sector Type I Indirect
Type Sam Total
Type I Indirect
Type Sam Total
Type I Indirect
Type Sam Total
Type I Indirect
Type Sam Total
(million $) (number) (million $) (million $)
Wineries 1.19 3 1.24 3 1.40 10 1.54 12 8.99 0b 11.09 0b 2.75 0b 3.30 0b
Distilleries 0.00 0 0.00 0 0.00 0 0.00 0 0.00 0 0.00 0 0.00 0 0.00 0
Total ‐‐ 299 321 660 867 34 41 48 61
Tobacco Products 0.00 0 0.00 0 0.00 0 0.00 0 0.00 0 0.00 0 0.00 0 0.00 0
Textile Mills
Fiber, yarn, & thread mills 1.17 106 1.32 119 1.21 345 1.65 470 1.21 21 1.46 25 1.24 27 1.61 35
Broadwoven fabric mills 1.13 0b 1.41 0b 1.26 0b 2.11 0b 1.10 0b 1.33 0b 1.12 0b 1.48 0b
Narrow fabric mills & schiffli machine embroidery 0.00 0 0.00 0 0.00 0 0.00 0 0.00 0 0.00 0 0.00 0 0.00 0
Nonwoven fabric mills 1.14 60 1.26 67 1.37 145 1.94 205 1.24 10 1.50 12 1.21 17 1.49 21
Knit fabric mills 0.00 0 0.00 0 0.00 0 0.00 0 0.00 0 0.00 0 0.00 0 0.00 0
Textile & fabric finishing mills 1.19 33 1.34 37 1.31 182 1.56 218 1.42 6 1.71 7 1.50 8 1.93 11
Fabric coating mills 1.19 134 1.32 149 1.42 463 1.85 602 1.36 23 1.64 28 1.45 32 1.86 41
Total ‐‐ 333 373 1,135 1,496 60 73 83 107
Textile Product Mills
Carpet & rug mills 0.00 0 0.00 0 0.00 0 0.00 0 0.00 0 0.00 0 0.00 0 0.00 0
Curtain & linen mills 1.16 0b 1.32 0b 1.16 2 1.38 2 1.24 0b 1.49 0b 1.27 0b 1.61 0b
Textile bag & canvas mills 1.21 8 1.45 10 1.19 57 1.49 71 1.18 2 1.43 3 1.26 3 1.65 4
All other textile product mills 1.21 12 1.34 13 1.20 77 1.39 89 1.41 2 1.70 2 1.42 3 1.77 4
Total ‐‐ 20 23 136 162 4 5 6 8
Apparel
Apparel knitting mills 0.00 0 0.00 0 0.00 0 0.00 0 0.00 0 0.00 0 0.00 0 0.00 0
Cut & sew apparel contractors 1.22 2 1.55 2 1.12 23 1.32 27 1.17 1 1.41 1 1.24 1 1.62 1
Mens & boys cut & sew apparel 1.22 10 1.41 12 1.29 83 1.52 98 1.41 2 1.71 3 1.40 4 1.75 5
Womens & girls cut & sew apparel 1.34 1 1.48 1 1.70 5 1.93 6 2.78 0b 3.36 0b 2.85 0b 3.57 0b
Other cut & sew apparel 1.24 4 1.52 5 1.24 37 1.52 45 1.25 1 1.51 2 1.38 2 1.82 2
Apparel accessories & other apparel 1.25 1 1.48 2 1.23 13 1.47 15 1.30 0b 1.57 0b 1.48 0b 1.97 1
Total ‐‐ 18 21 161 191 5 6 7 9
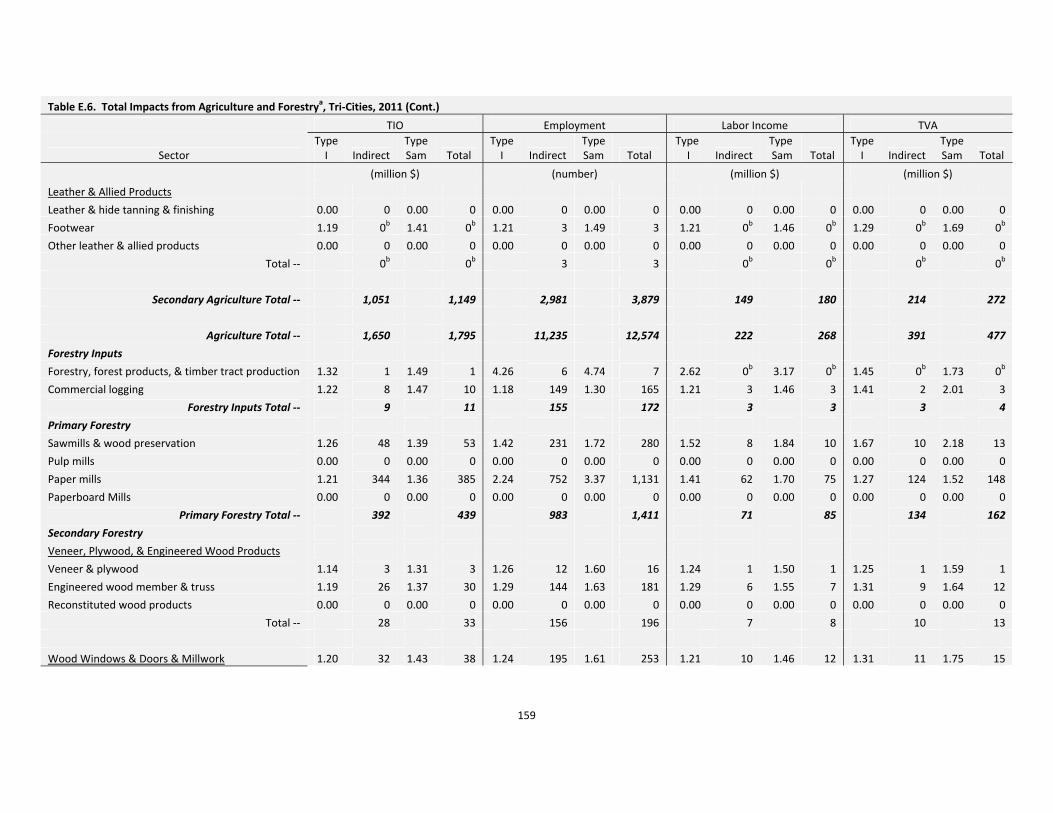
159
Table E.6. Total Impacts from Agriculture and Forestrya, Tri‐Cities, 2011 (Cont.)
TIO Employment Labor Income TVA
Sector Type I Indirect
Type Sam Total
Type I Indirect
Type Sam Total
Type I Indirect
Type Sam Total
Type I Indirect
Type Sam Total
(million $) (number) (million $) (million $)
Leather & Allied Products
Leather & hide tanning & finishing 0.00 0 0.00 0 0.00 0 0.00 0 0.00 0 0.00 0 0.00 0 0.00 0
Footwear 1.19 0b 1.41 0b 1.21 3 1.49 3 1.21 0b 1.46 0b 1.29 0b 1.69 0b
Other leather & allied products 0.00 0 0.00 0 0.00 0 0.00 0 0.00 0 0.00 0 0.00 0 0.00 0
Total ‐‐ 0b 0b 3 3 0b 0b 0b 0b
Secondary Agriculture Total ‐‐ 1,051 1,149 2,981 3,879 149 180 214 272
Agriculture Total ‐‐ 1,650 1,795 11,235 12,574 222 268 391 477
Forestry Inputs
Forestry, forest products, & timber tract production 1.32 1 1.49 1 4.26 6 4.74 7 2.62 0b 3.17 0b 1.45 0b 1.73 0b
Commercial logging 1.22 8 1.47 10 1.18 149 1.30 165 1.21 3 1.46 3 1.41 2 2.01 3
Forestry Inputs Total ‐‐ 9 11 155 172 3 3 3 4
Primary Forestry
Sawmills & wood preservation 1.26 48 1.39 53 1.42 231 1.72 280 1.52 8 1.84 10 1.67 10 2.18 13
Pulp mills 0.00 0 0.00 0 0.00 0 0.00 0 0.00 0 0.00 0 0.00 0 0.00 0
Paper mills 1.21 344 1.36 385 2.24 752 3.37 1,131 1.41 62 1.70 75 1.27 124 1.52 148
Paperboard Mills 0.00 0 0.00 0 0.00 0 0.00 0 0.00 0 0.00 0 0.00 0 0.00 0
Primary Forestry Total ‐‐ 392 439 983 1,411 71 85 134 162
Secondary Forestry
Veneer, Plywood, & Engineered Wood Products
Veneer & plywood 1.14 3 1.31 3 1.26 12 1.60 16 1.24 1 1.50 1 1.25 1 1.59 1
Engineered wood member & truss 1.19 26 1.37 30 1.29 144 1.63 181 1.29 6 1.55 7 1.31 9 1.64 12
Reconstituted wood products 0.00 0 0.00 0 0.00 0 0.00 0 0.00 0 0.00 0 0.00 0 0.00 0
Total ‐‐ 28 33 156 196 7 8 10 13
Wood Windows & Doors & Millwork 1.20 32 1.43 38 1.24 195 1.61 253 1.21 10 1.46 12 1.31 11 1.75 15
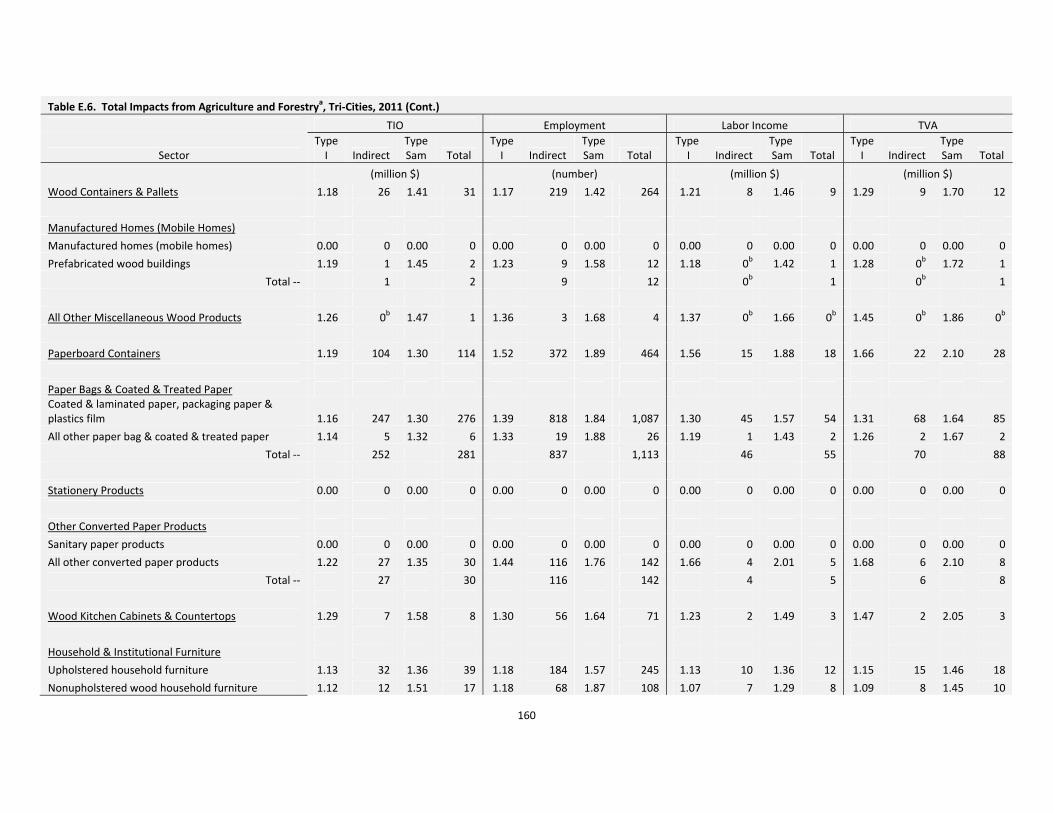
160
Table E.6. Total Impacts from Agriculture and Forestrya, Tri‐Cities, 2011 (Cont.)
TIO Employment Labor Income TVA
Sector Type I Indirect
Type Sam Total
Type I Indirect
Type Sam Total
Type I Indirect
Type Sam Total
Type I Indirect
Type Sam Total
(million $) (number) (million $) (million $)
Wood Containers & Pallets 1.18 26 1.41 31 1.17 219 1.42 264 1.21 8 1.46 9 1.29 9 1.70 12
Manufactured Homes (Mobile Homes)
Manufactured homes (mobile homes) 0.00 0 0.00 0 0.00 0 0.00 0 0.00 0 0.00 0 0.00 0 0.00 0
Prefabricated wood buildings 1.19 1 1.45 2 1.23 9 1.58 12 1.18 0b 1.42 1 1.28 0b 1.72 1
Total ‐‐ 1 2 9 12 0b 1 0b 1
All Other Miscellaneous Wood Products 1.26 0b 1.47 1 1.36 3 1.68 4 1.37 0b 1.66 0b 1.45 0b 1.86 0b
Paperboard Containers 1.19 104 1.30 114 1.52 372 1.89 464 1.56 15 1.88 18 1.66 22 2.10 28
Paper Bags & Coated & Treated Paper Coated & laminated paper, packaging paper & plastics film 1.16 247 1.30 276 1.39 818 1.84 1,087 1.30 45 1.57 54 1.31 68 1.64 85
All other paper bag & coated & treated paper 1.14 5 1.32 6 1.33 19 1.88 26 1.19 1 1.43 2 1.26 2 1.67 2
Total ‐‐ 252 281 837 1,113 46 55 70 88
Stationery Products 0.00 0 0.00 0 0.00 0 0.00 0 0.00 0 0.00 0 0.00 0 0.00 0
Other Converted Paper Products
Sanitary paper products 0.00 0 0.00 0 0.00 0 0.00 0 0.00 0 0.00 0 0.00 0 0.00 0
All other converted paper products 1.22 27 1.35 30 1.44 116 1.76 142 1.66 4 2.01 5 1.68 6 2.10 8
Total ‐‐ 27 30 116 142 4 5 6 8
Wood Kitchen Cabinets & Countertops 1.29 7 1.58 8 1.30 56 1.64 71 1.23 2 1.49 3 1.47 2 2.05 3
Household & Institutional Furniture
Upholstered household furniture 1.13 32 1.36 39 1.18 184 1.57 245 1.13 10 1.36 12 1.15 15 1.46 18
Nonupholstered wood household furniture 1.12 12 1.51 17 1.18 68 1.87 108 1.07 7 1.29 8 1.09 8 1.45 10
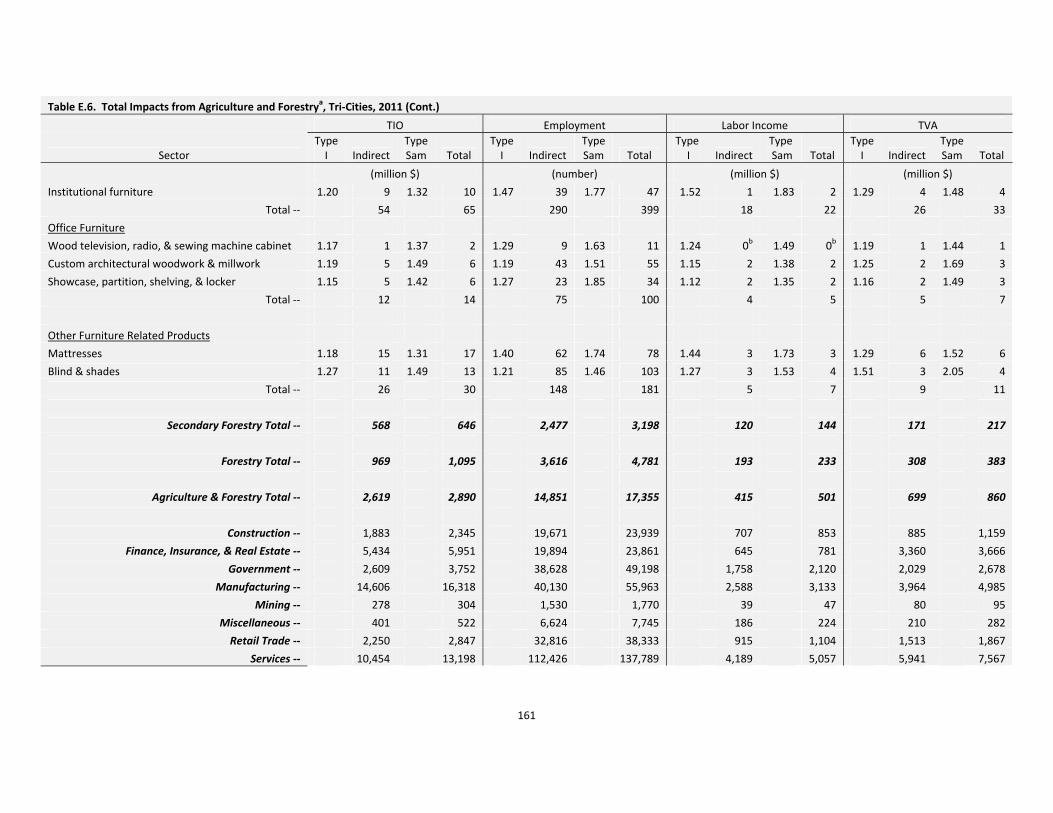
161
Table E.6. Total Impacts from Agriculture and Forestrya, Tri‐Cities, 2011 (Cont.)
TIO Employment Labor Income TVA
Sector Type I Indirect
Type Sam Total
Type I Indirect
Type Sam Total
Type I Indirect
Type Sam Total
Type I Indirect
Type Sam Total
(million $) (number) (million $) (million $)
Institutional furniture 1.20 9 1.32 10 1.47 39 1.77 47 1.52 1 1.83 2 1.29 4 1.48 4
Total ‐‐ 54 65 290 399 18 22 26 33
Office Furniture
Wood television, radio, & sewing machine cabinet 1.17 1 1.37 2 1.29 9 1.63 11 1.24 0b 1.49 0b 1.19 1 1.44 1
Custom architectural woodwork & millwork 1.19 5 1.49 6 1.19 43 1.51 55 1.15 2 1.38 2 1.25 2 1.69 3
Showcase, partition, shelving, & locker 1.15 5 1.42 6 1.27 23 1.85 34 1.12 2 1.35 2 1.16 2 1.49 3
Total ‐‐ 12 14 75 100 4 5 5 7
Other Furniture Related Products
Mattresses 1.18 15 1.31 17 1.40 62 1.74 78 1.44 3 1.73 3 1.29 6 1.52 6
Blind & shades 1.27 11 1.49 13 1.21 85 1.46 103 1.27 3 1.53 4 1.51 3 2.05 4
Total ‐‐ 26 30 148 181 5 7 9 11
Secondary Forestry Total ‐‐ 568 646 2,477 3,198 120 144 171 217
Forestry Total ‐‐ 969 1,095 3,616 4,781 193 233 308 383
Agriculture & Forestry Total ‐‐ 2,619 2,890 14,851 17,355 415 501 699 860
Construction ‐‐ 1,883 2,345 19,671 23,939 707 853 885 1,159
Finance, Insurance, & Real Estate ‐‐ 5,434 5,951 19,894 23,861 645 781 3,360 3,666
Government ‐‐ 2,609 3,752 38,628 49,198 1,758 2,120 2,029 2,678
Manufacturing ‐‐ 14,606 16,318 40,130 55,963 2,588 3,133 3,964 4,985
Mining ‐‐ 278 304 1,530 1,770 39 47 80 95
Miscellaneous ‐‐ 401 522 6,624 7,745 186 224 210 282
Retail Trade ‐‐ 2,250 2,847 32,816 38,333 915 1,104 1,513 1,867
Services ‐‐ 10,454 13,198 112,426 137,789 4,189 5,057 5,941 7,567

162
Table E.6. Total Impacts from Agriculture and Forestrya, Tri‐Cities, 2011 (Cont.)
TIO Employment Labor Income TVA
Sector Type I Indirect
Type Sam Total
Type I Indirect
Type Sam Total
Type I Indirect
Type Sam Total
Type I Indirect
Type Sam Total
(million $) (number) (million $) (million $)
Transportation, Information, & Utilities ‐‐ 1,336 1,592 8,280 10,647 381 462 585 736
Wholesale Trade ‐‐ 1,259 1,577 8,342 11,283 483 583 864 1,053 aTotals may not add due to rounding. bValues of zero are nonzero values less than 1.4