economic impacts of connecticut’s agricultural industry · agricultural processing that does not...
TRANSCRIPT

Economic Impacts of Connecticut’s Agricultural IndustryA Report byThe Department of Agricultural and Resource Economics
September 2010
In Cooperation withThe Connecticut Center for Economic Analysis

2
Acknowledgements
Special thanks go to Dean Gregory Weidemann of the College of Agriculture and Natural Resources at the University of Connecticut and Executive Director Steven K. Reviczky of the Connecticut Farm Bureau Association for their encouragement and support from the start of the project. The authors are also grateful to various participating organizations and stakeholders that commented on earlier versions of this report, particularly to: Jiff Martin, Connecticut State Director of the American Farmland Trust; Commissioner F. Philip Prelli, Jane Slupecki, and Joseph Dippel of the Connecticut Department of Agriculture; Bonnie Burr of the University of Connecticut Cooperative Extension System; Executive Director Bob Heffernan of the Green Industries Council; President Mark Harran of the Connecticut Maple Syrup Producers Association; and Peter Orr of the Connecticut Farm Bureau Dairy Committee.
Financial Sponsors
• The College of Agriculture and Natural Resources at the University of Connecticut
• The Connecticut Department of Agriculture
• The Connecticut Food Policy Council
• Farm Credit East
• The Connecticut Farm Bureau Association
• The Connecticut Farm Bureau Dairy Committee
• The Connecticut Apple Marketing Board
• The Connecticut Greenhouse Growers Association
• The Food Policy Marketing Center
• Kofkoff Egg Farms, LLC
Other Supporting Donors:
The Connecticut Horse Show Association, American Farmland Trust, Working Lands Alliance, Connecticut Agricultural Education Foundation, Connecticut Chapter of the Northeast Organic Farming Association, Central Connecticut Co-op, Connecticut Maple Syrup Producers Association, Connecticut Christmas Tree Growers Association, Nationwide® Agribusiness, Connecticut Vineyard and Winery Association, and Connecticut Poultry Association
The College of Agriculture and Natural Resources strives for excellence in teaching, research, and outreach education
serving the people of Connecticut, the nation and the world as a premier land-grant institution. Signature programs focus on educating a diverse body of students; advancing
and disseminating knowledge of the physical and social sciences of natural resource utilization, agriculture, food processing and distribution, nutrition, and human health
and development; and addressing needs of citizens, communities and governmental agencies.

Design by: Dean BattesonPhotos by: Thomas E. Kazsuba, www.tomkaszuba.com; front cover, p. 5, 6 Leslie Sweetnam, p. 3, 18, 20, 21, 22
About the authors
For the Department of Agricultural and Resource Economics:
Rigoberto A. Lopez (Team Leader) is Professor and the Head of the Department of Agricultural and Resource Economics and a principal investigator of the Food Marketing Policy Center at the University of Connecticut. He earned a Ph.D. in Food and Resource Economics from the University of Florida in 1979. His areas of expertise include agricultural and food policy, agribusiness marketing, and economic development. He led the research team on the economic impact of the Connecticut dairy industry in fall 2008.
Deepak Joglekar is Assistant Professor-in-Residence in the Department of Agricultural and Resource Economics at the University of Connecticut, where he earned his Ph.D. in 2009.
Chen Zhu is a Ph.D. student in the Department of Agricultural and Resource Economics at the University of Connecticut. She holds a Bachelors degree in biology from Nanjing University in China.
For the Connecticut Center for Economic Analysis:
Peter Gunther is Senior Research Fellow at the Connecticut Center for Economic Analysis responsible for its Quarterly Outlook reports. He has extensive experience in REMI applications in areas including Connecticut development initiatives, R&D tax credits to accelerate economic recovery, and adoption of plug-in vehicles fueled by green electricity.
Fred Carstensen is Director of the Connecticut Center for Economic Analysis and Professor in the Department of Economics at the University of Connecticut. He received his Ph.D. in Economic History from Yale University in 1976 and has participated in development of numerous economic impact reports.
For more information about the results reported here, visit: www.are.uconn.edu
3
4
Scope and Methodology
The purpose of this study is to ascertain and document the importance of agriculture and related industries to Connecticut’s economy.
The agricultural industry is defined as encompassing crop and livestock production, forest products, and the processing of the state’s agricultural production. The study excludes secondary sectors, such as landscaping and groundskeeping, and agricultural processing that does not use Connecticut agricultural inputs, such as bakeries and distilling, which are economically important but, if included, would overstate the projected output and job impacts attributable directly to the state’s agriculture.
Because the agricultural industry purchases goods and services from other industries and hires local labor, its economic impact cascades throughout the state’s economy. Agriculture support services include feed suppliers, veterinary services, equipment manufacturers and repair, and financial services. Farm businesses also support short-term contractual jobs such as in engineering, construction, plumbing, electrical work, and inspection.
In addition, this study does not include the value of ecosystem services, scenic views, and social benefits derived from the agricultural industry’s 405,616 acres of land in farms. These non-market benefits are significant and are in addition to the measured economic benefits of the industry.
Using direct sales of the agricultural industry for 2007, this study estimates the total economic impact of agriculture through the use of three economic models of the Connecticut economy. Two are input-output models that translate direct sales into statewide output and jobs to account for agriculture’s purchase of goods and services from other industries. The third is a statistical model of the entire state economy that measures agriculture’s importance by estimating the loss of output and jobs if the sector were removed from the state’s economy.
STUDY HIGHLIGHTS

5
Results of the Analysis
In 2007 this analysis reveals that the total impact of Connecticut’s agricultural industry on the state economy ($212 billion Gross State Product) was up to $3.5 billion, measuring the value of agricultural output as statewide sales generated directly from the industry and through spillover effects on other industries impacted. In addition, the industry contributes about $1.7 billion in value added, which is the difference between the value of output and the cost of raw materials, i.e., the money left in the hands of residents and business taxes, both of which stay in Connecticut.
• The estimated output impact translates into approximately $1,000 per Connecticut resident.
• Every dollar in sales in this industry generates up to an additional dollar in the state economy.
The Connecticut agricultural industry generates approximately 20,000 jobs statewide.
• Every million dollars of the agricultural production sector’s direct sales generates 13 to 19 jobs.
• Agricultural production is more labor intensive than agricultural processing, generating two-thirds of the industry’s jobs.
In sum, the agricultural industry has a critical, significant impact on the economy of Connecticut in output, jobs, and the quality of life: $3.5 billion in output, 20,000 jobs, and significant social benefits and ecosystem services.
6
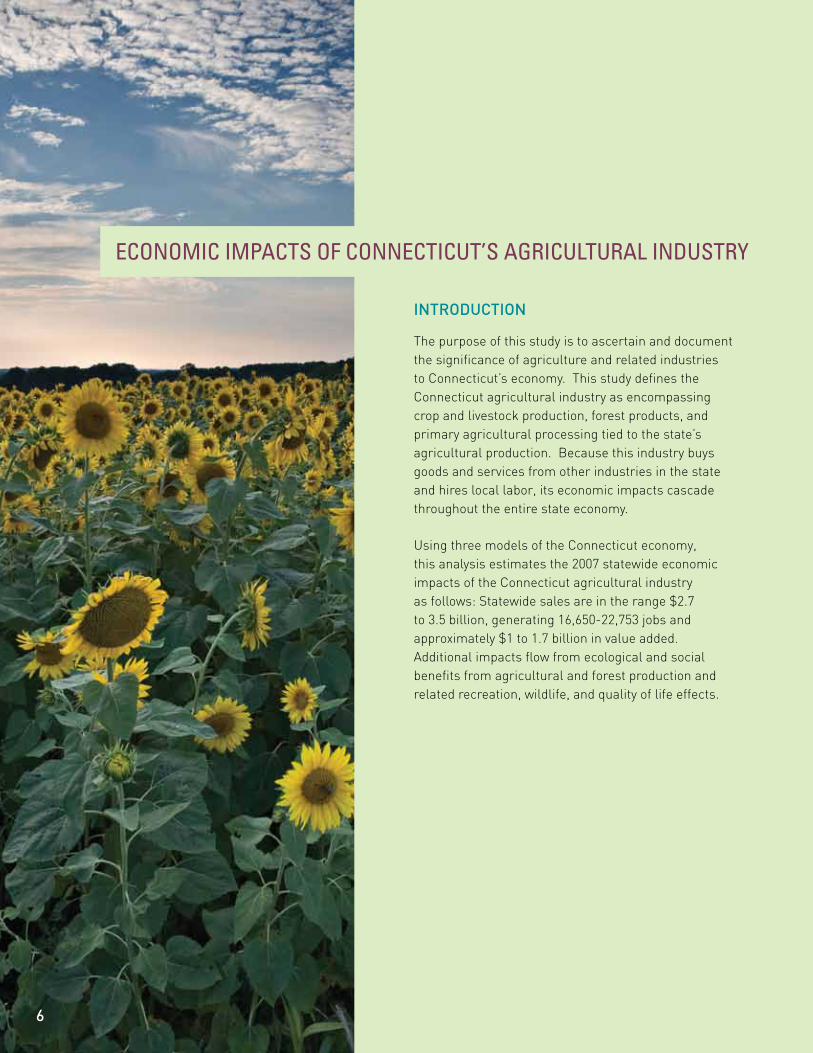
INTRODUCTION
The purpose of this study is to ascertain and document the significance of agriculture and related industries to Connecticut’s economy. This study defines the Connecticut agricultural industry as encompassing crop and livestock production, forest products, and primary agricultural processing tied to the state’s agricultural production. Because this industry buys goods and services from other industries in the state and hires local labor, its economic impacts cascade throughout the entire state economy.
Using three models of the Connecticut economy, this analysis estimates the 2007 statewide economic impacts of the Connecticut agricultural industry as follows: Statewide sales are in the range $2.7 to 3.5 billion, generating 16,650-22,753 jobs and approximately $1 to 1.7 billion in value added. Additional impacts flow from ecological and social benefits from agricultural and forest production and related recreation, wildlife, and quality of life effects.
EconomIc ImpacTS of connEcTIcUT’S aGrIcULTUraL InDUSTrY

Nursery, greenhouse, floriculture and sod 49%
Vegetables 6%
Tobacco 10%
Fruits 8%
Milk and dairyproducts 13%
Poultry and eggs 8%
Aquaculture 3%
Cattle and otherlivestock 3%
Total sales = $551.6 million
Figure 2 2007 Sales of Agricultural Products by Commodity Groups
Source: USDA (2007), page 9, table 2
Deciduous forest 47%
Coniferous forest 9%
Wetland, water, and other 9%
Developed 19%
Turf and other grasses 9%
Agricultural field 7%
Total area = 3.18 million acres
Figure 1
Total Land Cover in Connecticut (2006)
Source: Center for Land Use Education and Research (2006)
Economic Impacts of Connecticut’s Agricultural Industry 7
Connecticut’s Agricultural Industry
Agriculture has been a critical component of the Connecticut economy since Colonial times,
when its economy was comprised mainly of agriculture, fishing, lumber, and ship building. Today the importance of agriculture in the state economy is highly visible through not only farms, but also associated forests and primary agricultural processing.
Connecticut’s geographical area is approximately 3.18 million acres, making it the third smallest
state in the U.S. (ahead of Delaware and Rhode Island). In spite of the state’s relatively small size,
its agriculture continues to thrive, and the amount of farmland currently accounts for 405,616 acres, slightly over 13% of total area (USDA, 2007, page 16, table 8). Forests cover more than half of Connecticut’s area (Figure 1).
Moreover, despite its small size, Connecticut agriculture ranks third in New England in terms of agricultural sales at $551 million in 2007 (USDA, 2007, page 7, table 1). Notably, the value of agricultural products sold has increased in real dollars since 1992. However, state
agriculture not only is economically important but is also quite diverse, as illustrated in Figure 2.
In sharp contrast to agriculture nationwide, field crops comprise a minor share of agricultural sales, while the largest agricultural sectors are “green” industries (nursery, greenhouse, floriculture, and sod production), dairy farming, and tobacco. The average farm size
is approximately 82 acres, largely small and medium size family farm operations (Lopez and
Jeffords, 2010).

Sawmills and wood preservation 38%
Hunting and trapping 2%
Forest nurseries andforest products 16%
Logging 44%
Total sales = $131.5 million
Figure 3 2007 Sales of Forest Products and Related Sectors
Source: Federal government data as reported in IMPLAN (2007)
8
Sales of forest products account for approximately $131.5 million in 2007 (Figure 3), equivalent to
half of the greenhouse and nursery industry (the largest agricultural production sector) or 25% of the state value of crops and livestock products. Thus, forestry-related output and employment are also an important component of the economy. By far, however, the main benefits
from forests come from providing open space to state residents, given that they cover more than
half of the state’s geographical area.
Ice cream andfrozen desert 15%
Animal slaughteringand processing 21%
Seafood productpreperation 2%
Wineries 4%
Fruit and vegetablecanning 21%
Fluid milkand butter 13%
Cheese 24%
Total sales = $955 million
Figure 4 2007 Sales of Primary Agricultural Processing Sectors
Source: Federal government data as reported in IMPLAN (2007)
Dairy processing leads primary agricultural processing, accounting for more than half of
agricultural processing, followed by animal slaughtering and fruit and vegetable canning with nearly identical shares at 21% each (Figure 4). Wineries, with sales of $38 million in 2007, are enjoying rapid growth and popularity in response to increased demand for local wines, which in turn has increased
derived demand for local grapes.

Economic Impacts of Connecticut’s Agricultural Industry 9
Economic Models Used
This study uses three standard models of the Connecticut economy to capture the scope of the agricultural industry, its linkages to the rest of the state economy, and to assess its contribution to statewide output and jobs. The three models are:
1. IMPLAN (IMpact analysis for PLANning: Minnesota IMPLAN Group, Inc.)
2. RIMS II (Regional Input-Output Modeling System: U. S. Department of Commerce)
3. REMI (Regional Economic Modeling, Inc.)
IMPLAN and RIMS II look at incremental impacts as the sector increases or decreases in activity via built-in multipliers based on input-output tables of the economy. They both use multipliers that express the change in the level of state output and jobs associated with a unit change in direct sales from a specific sector or industry of the economy. An important feature of the IMPLAN and RIMS models is that they focus on “supply” to an industry, treating the sector of interest as the point of final “demand.” For example, using these models, the impact of the dairy cattle and milk production sector on the fluid milk manufacturing sector would be minimal (except through indirect and induced impacts as defined below), but the impact of the latter on dairy cattle and milk production would be fully accounted for as it is treated as a supplier.
In addition to the above supply chain impacts, REMI is an econometric model of the state economy. REMI estimates economic impacts by assessing the loss of output and employment (including its impact on migration) when a sector is removed from the economy. Thus, rather than focusing on the impact on suppliers, it is concerned with overall statewide impacts. REMI treats employment impacts in a more flexible fashion as it allows migration and job relocation across sectors within the state. Thus, a worker who loses his or her job in the greenhouse industry may end up working at a grocery store, for example, and will not be accounted for in the economy-wide job impacts as the model treats this as a transfer rather than a loss.
mETHoDoLoGY
10
Sectors Included
Following standard practice, this study relies on the U.S. Department of Commerce (USDC) classification of sectors of the economy. This classification divides the economy into 440 sectors. This analysis takes all sectors classified as agricultural and forestry production and primary agricultural processing to define the scope of the state’s agricultural industry. This process results in 24 sectors, described in Table A2 of the Appendix. Note that the IMPLAN and RIMS models are based precisely on the USDC classification. Thus, their multipliers (shown in Table A1 of the Appendix) were readily available. REMI collapses the 440 sectors into 53; a subset of them was closely matched to the 24 USDC descriptions. Examples include grain farming, greenhouse, nursery, and floriculture production, dairy cattle and milk production, cheese manufacturing, and wineries.
The decision to select sectors for inclusion in the scope of this study was based on the USDC classification for agriculture and forestry and, for agricultural processing, the extent of its linkages to state farming. For example, landscaping and
grounds–keeping services, an economically important sector classified as agriculturally-related by the Connecticut Department of Labor, was not included because the U.S. Department of Commerce does not include it as such and to preserve a consistent definition of the scope of agriculture. The Connecticut Department of Labor (2006) projected that this sector would account for more than 14,000 jobs in 2006. Some economically important Connecticut food and beverage processing sectors are also excluded from this study because they do not use agricultural commodities produced in the state in any significant way; examples of such “secondary processing” are chocolate, confectionary, and bakery product manufacturing and distilleries. In 2007, the total sales of excluded food and beverage industries was about $ 4.7 billion and they employed 6,749 people (IMPLAN, 2007). Including secondary food and beverage processing that do not use state agricultural production would overstate the contribution of agriculture to the state economy.
The models use as input the direct sales from a sector or the agricultural industry and calculate economy-wide impacts through multipliers (RIMS, IMPLAN) or simulation (REMI), (see Table A1 of the appendix). Note that to the extent that some cash and bartering transactions and self consumption are not reported, particularly by small farmers, direct sales of the agricultural production sector might under-represent the total value of production and therefore the corresponding impacts. Although all three models offer insights into the economic importance of a particular sector of the economy, they differ in some underlying assumptions and in the level of sophistication of the analysis. For completeness, the study reports the outcomes of analyses using all three models.

11
Measures of Impacts
Using the above models, the study develops three indicators of the economic importance of the agricultural sector:
• Total impact on state output, the value of which is measured by statewide sales;
• Total impact on state employment, which includes full-time and part-time jobs generated; and
• Total impact on value added, which measures the value added to raw materials either at the agricultural or forest production stage or in primary agricultural processing.
Although the primary focus is on the total impacts at the state level, this report also discusses impacts at the county and subsector levels.
For example, the economic importance of the greenhouse, nursery, floriculture and sod production industry (greenhouse and nursery for short) in Connecticut is not limited to the $269 million worth of goods and services sold by that sector (the direct impact). That sector’s effect extends to other sectors of the economy (e.g., the transportation and utility sector) because greenhouse and nursery businesses buy goods and services from those other sectors (the indirect impact). Also, employees of the greenhouse and nursery establishments likely spend a major portion of their earnings buying goods and services from firms within the state (the induced impact). The total sales impact of the greenhouse and nursery industry is the sum of the direct, indirect, and induced impacts. The same reasoning applies to employment and value added impacts of the industry. In the data appendix (Table A1), the RIMS and IMPLAN multipliers are applied to direct sales in the greenhouse and nursery subsector to obtain the total impact on state output, employment and value added.
The REMI model uses direct sales of the entire agricultural industry to assess the impact on statewide output and employment when the agricultural sector is removed. Sector by sector REMI’s impacts were not computed due to time and budget constraints, as this would require detailed analysis of each sector. For comparison to RIMS and IMPLAN multipliers, the REMI multipliers are imputed based on the ratio of statewide impacts to direct sales.
Finally, it should be noted that the estimated impacts are limited to Connecticut’s economy. For example, if an apple orchard in Connecticut purchases pesticides from a firm in Massachusetts, the indirect impact of this transaction will not be felt in the Connecticut economy.

rESULTS
12
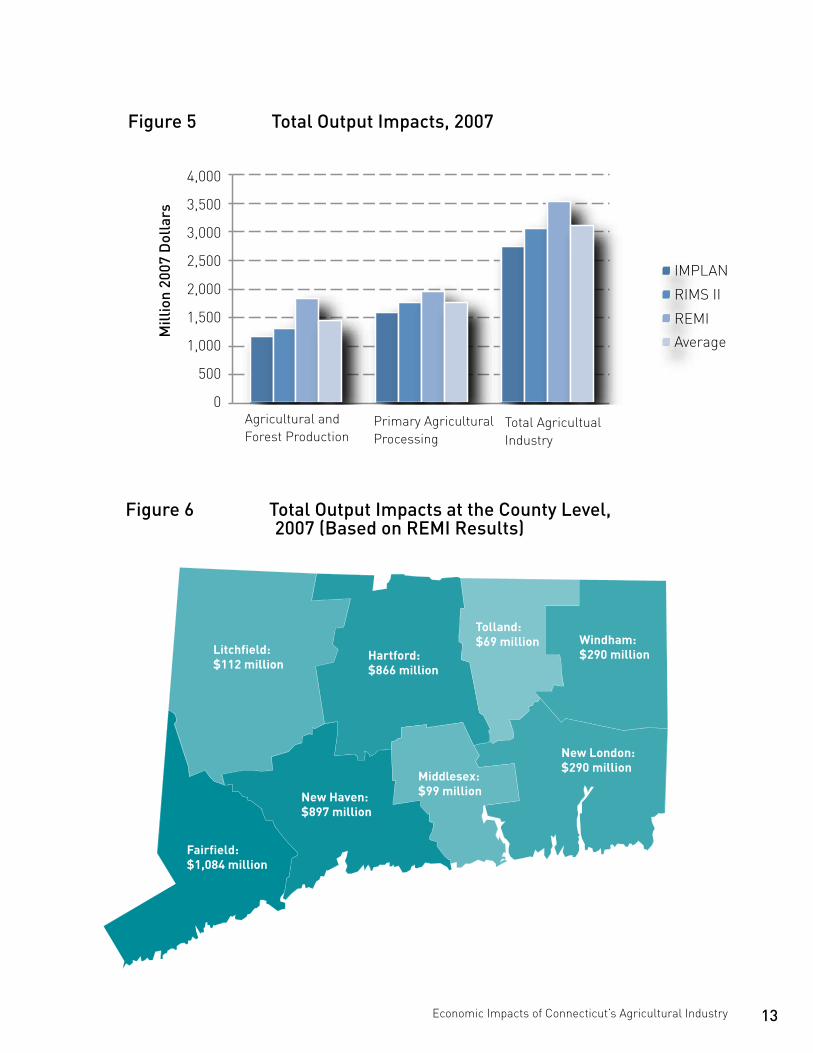
Total Output Impacts
As shown in the third column of Figure 5, the total output impact (i.e., sales) of the agricultural industry is estimated by
the three models to be between $2.72 and $3.51 billion in 2007, with an average of $3.09 billion, in an economy of $212 billion in Gross State Product in that year, roughly the size of the economy of Ireland or Israel. These estimated output impacts are significantly higher than the $2
billion figure used in political circles in the legislature. On a per capita basis, the agricultural industry generates approximately $1,000 in sales per Connecticut resident.
Breaking the total agricultural industry down, the impact of the agricultural and forest production sector (column 1) on
the state’s economy is between $1.15 and $1.82 billion, or $1.42 billion on average. The RIMS II estimate for crops and livestock sales is in line with the RIMS estimate provided by Lee and Leonard (2004) for the year 2000. The models project
the impact of the primary agricultural processing sector (column 2) between $1.57 and $1.93 billion, with an average of $1.75 billion, more than half coming from dairy processing (see Figure 4).
Using REMI, the study also estimates the total output impacts of the agricultural industry for each county in Connecticut, as shown in Figure 6. Most of the output impacts are concentrated in the high manufacturing Fairfield, New Haven, and Hartford counties, together accounting for more than 80% of total output impacts.
Hartford: $866 million
Litchfield: $112 million
Tolland: $69 million Windham:
$290 million
New London: $290 million
Middlesex: $99 millionNew Haven:
$897 million
Fairfield: $1,084 million
Figure 5 Total Output Impacts, 2007
Figure 6 Total Output Impacts at the County Level, 2007 (Based on REMI Results)
Economic Impacts of Connecticut’s Agricultural Industry 13
4,000
3,500
3,000
2,500
2,000
1,500
1,000
500
0
Mill
ion
2007
Dol
lars
IMPLAN
RIMS II
REMIAverage
Agricultural and Forest Production
Primary AgriculturalProcessing
Total Agricultual Industry
14
Table 1 Statewide Output Impact of Sectors in the Agricultural Industry
2007 million dollarsSector RIMS II IMPLAN REMI
Grain farming 2.6 2.1 – Vegetable and melon farming 37.8 31.0 –Fruit farming 56.9 46.6 –Greenhouse, nursery, floriculture, and sod 461.3 373.2 –Tobacco farming 106.0 85.3 –All other crop farming 59.0 48.5 –Cattle ranching and farming 16.1 15.2 –Dairy cattle and milk production 114.1 97.3 –Poultry and egg production 111.2 121.6 –Animal production (except cattle, poultry, and eggs) 58.8 60.0 –Forest nurseries, forest products, and timber tracts 30.0 25.3 –Commercial logging 83.0 75.8 –Sawmills and wood preservation 72.1 77.4 –Commercial fishing 58.9 42.6 –Hunting and trapping 5.5 4.9 –Support activities for agriculture and forestry 45.5 41.9 –Total for agricultural and forest production 1,290 1,150 1,820 Fruit and vegetable canning, pickling, and drying 371.0 327.4 –Fluid milk and butter manufacturing 220.0 206.9 –Cheese manufacturing 387.2 406.2 –Ice cream and frozen dessert manufacturing 274.4 240.3 –Animal (except poultry) slaughtering and processing 271.4 261.1 –Poultry processing 28.1 27.1 –Seafood product preparation and packaging 39.4 36.1 –Wineries 69.9 63.2 –Total for primary agricultural processing 1,750 1,570 1,930 Total for the agricultural industry 3,040 2,720 3,510
Cut Christmas trees 6.6 5.3 –Maple syrup production 1.4 1.1 –Horses and other equine production 6.8 6.9 –Aquaculture 21.3 21.7 –
Agr
icul
tura
l and
fo
rest
pro
duct
ion
Pri
mar
y
agri
cult
ural
pro
cess
ing
Som
e sp
ecia
l su
b-se
ctor
s
Note: Sector by sector output impacts were not estimated for the REMI methodology due to time and budget constraints since this task would require a detailed analysis of each sector.

Economic Impacts of Connecticut’s Agricultural Industry 15
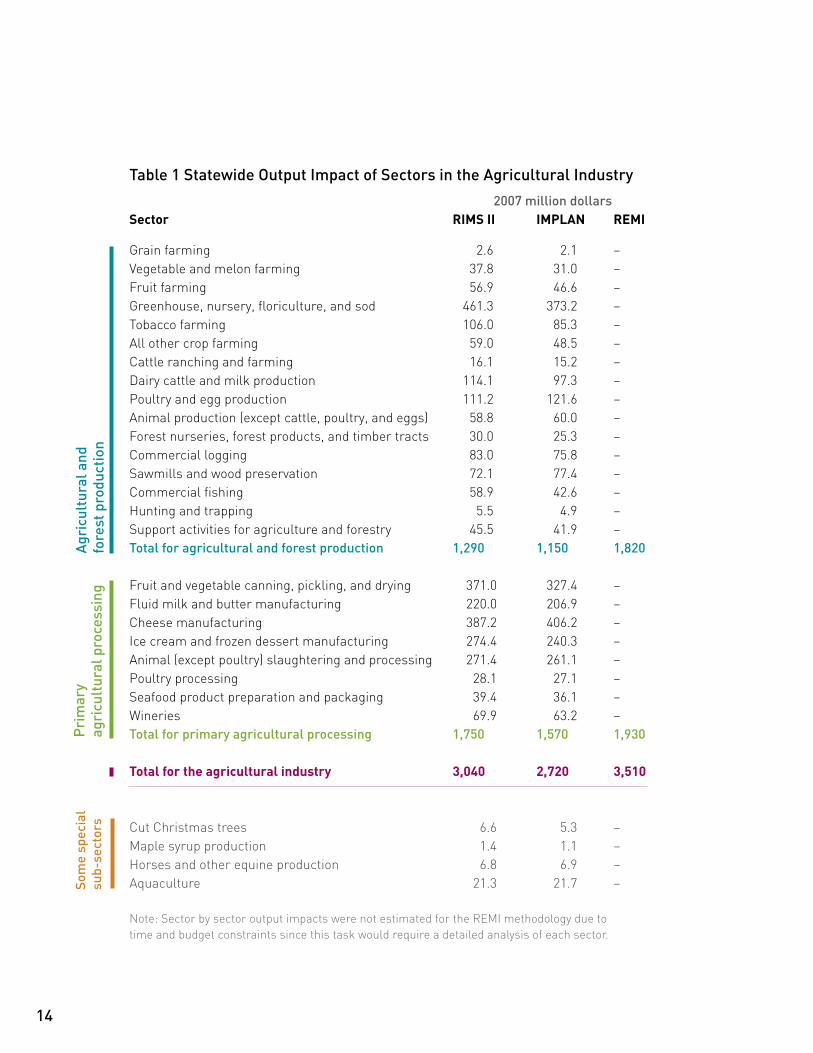
Table 1 presents more detailed IMPLAN and RIMS II estimates of statewide sales impacts from individual sectors of the agricultural industry (as noted above, REMI results are not available at the sector level). Table 1 shows that the greenhouse, nursery, floriculture and sod production; fruit and vegetable canning, pickling, and drying; cheese manufacturing; ice cream and frozen desserts manufacturing; animal slaughtering; and fluid milk manufacturing sectors generated the highest sales statewide. The estimates for the dairy industry as a whole (farming and processing) coincide with the estimates developed previously in the study by the Department of Economic and Community Development and the University of Connecticut (2009).1
Table A1 of the appendix shows the RIMS and IMPLAN output and employment multipliers used in the analysis and notes the imputed REMI multipliers. The latter indicate that for every dollar of sales in the agricultural industry, the economy generates an additional dollar statewide. The corresponding IMPLAN and RIMS multipliers indicate a $1.54 and $1.72 return per dollar. These lower figures are not surprising because these input-output models focus narrowly on supply to the industry, defining final demand (output) at the state agricultural industry level rather than for the entire state economy.
1Both Perry and Stack (2009) and Hall et al. (2005) present much larger estimates for the impact of the greenhouse industry due to the inclusion of landscaping and retail and distribution of ornaments, garden supplies and equipment, which are outside the scope of the present study. Reagan and Prisloe (2003) present larger estimates for the egg industry in 2003, starting from a larger direct sales figure than the federally reported one used in this study for 2007.

16
IMPLANRIMS II
REMIAverage
Agricultural and Forest Production
Primary Agricultural Processing
Total Agricultural Industry
Agricultural and Forest Production
Primary AgriculturalProcessing
Total Agricultual Industry
25,000
20,000
15,000
10,000
5,000
0
Num
ber
of J
obs
Figure 7 Total Employment Impacts, 2007
Total Employment Impacts
Figure 7 shows that the estimated impact of the total agricultural industry on state employment is between 16,650 and 22,753 jobs. The lower estimate by REMI is due to this model’s allowance for migration and more flexible adjustment across sectors; that is, this model allows for the possibility of workers leaving the state or readily transferring to other industries should an industry vanish. Nonetheless, the number of jobs all three models estimate seems to be on the low side when compared to the jobs directly provided by the sectors included in the study, as reported by the USDA’s Economic Research Service (2005) for 2002, the last year these statistics were reported. Thus, the jobs estimates should be considered conservative.
This study shows that Connecticut’s agricultural industry is an important contributor to employment in the state. Agricultural and forest production activities generate two- thirds of the agricultural jobs, projected as ranging from 10,660 to 15,429 jobs, with an average across models of 13,258. Primary agricultural processing activities add another 5,637 to 7,324 jobs.
When comparing sectors, the highest job generator is greenhouse, nursery, floriculture and sod production (4,186 to 6,833 jobs), followed by cheese manufacturing; animal slaughtering and processing; fruit and vegetable canning, pickling and drying; tobacco farming; support activities for agriculture and forestry; fruit farming; and fluid milk manufacturing.
The multipliers presented in Table A1 of the Appendix reveal interesting information. Although it is not surprising that agricultural production is more labor intensive than primary agricultural processing, the agricultural production sector generates between 13 and 19 jobs per million dollars in sales, more than twice the jobs generated by agricultural processing (estimated to be between 6 and 7 jobs). Across sectors, the highest job creators per million dollars in sales are support activities for agriculture and forestry (31 to 59 jobs), greenhouse, nursery, floriculture and sod (15 to 28 jobs), tobacco farming (15 to 28 jobs), animal production (10 to 36 jobs), and commercial fishing (22 to 27 jobs).

Economic Impacts of Connecticut’s Agricultural Industry 17
Agr
icul
tura
l and
fo
rest
pro
duct
ion
Pri
mar
y
agri
cult
ural
pro
cess
ing
Som
e sp
ecia
l su
b-se
ctor
s
Table 2 – Statewide Employment Impact of Sectors in the Agricultural Industry
2007 million dollars
Sector RIMS II IMPLAN REMI
Grain farming 13 42 –Vegetable and melon farming 445 261 –Fruit farming 782 609 –Greenhouse, nursery, floriculture, and sod 6,833 4,186 –Tobacco farming 823 1,604 –All other crop farming 577 372 –Cattle ranching and farming 97 163 –Dairy cattle and milk production 1,060 1,000 –Poultry and egg production 647 596 –Animal production (except cattle, poultry, & eggs) 404 1,529 –Forest nurseries, forest products, and timber tracts 179 108 –Logging 658 578 –Sawmills and wood preservation 381 385 –Fishing 851 708 –Hunting and trapping 40 50 –Support activities for agriculture and forestry 789 1,495 –Total for agricultural and forest production 15,429 13,686 10,660 Fruit and vegetable canning, pickling, and drying 1,452 890 –Fluid milk and butter manufacturing 829 797 –Cheese manufacturing 1,612 1,442 –Ice cream and frozen dessert manufacturing 1,032 790 –Animal (except poultry) slaughtering & processing 1,146 1,163 –Poultry processing 136 134 –Seafood product preparation and packaging 177 172 –Wineries 319 248 –Total for primary agricultural processing 7,324 5,637 7,062 Total for the agricultural industry 22,753 19,322 16,650
Cut Christmas trees 97 60 –Maple syrup production 13 9 –Horses and other equine production 47 178 –Aquaculture 146 553 –
Note: Sector by sector employment impacts were not estimated for the REMI methodology due to time and budget constraints since this task would require a detailed analysis of each sector.
18
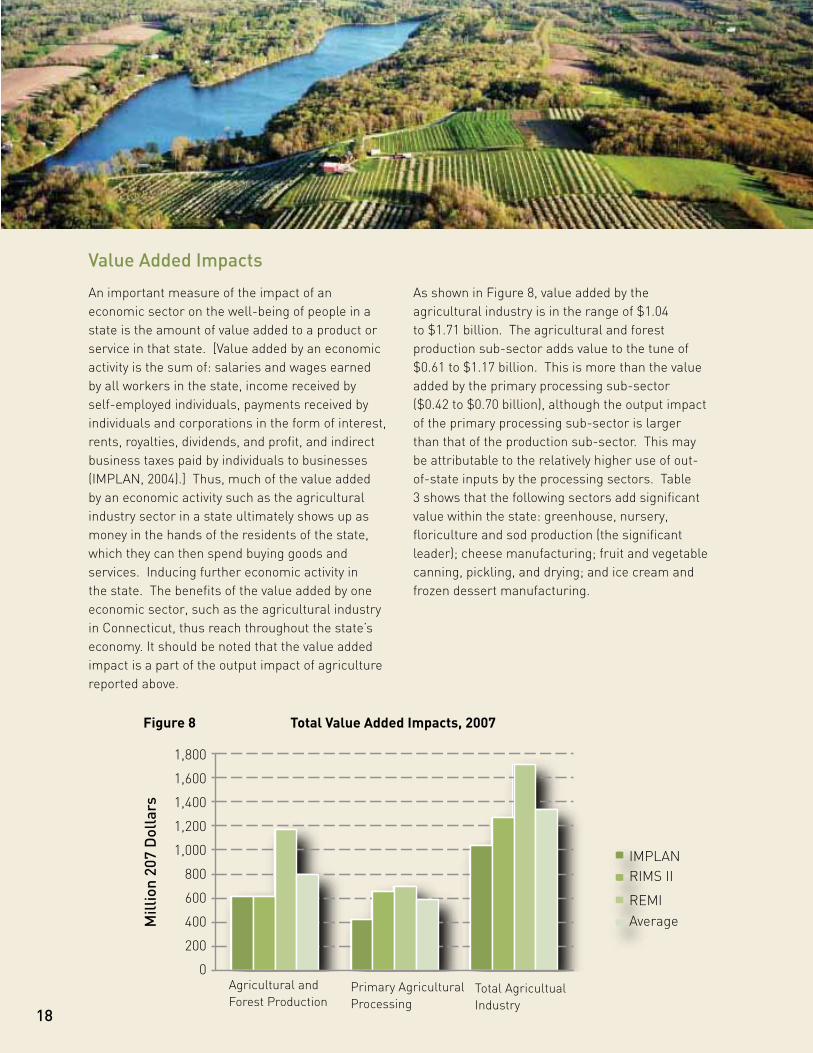
Value Added Impacts
An important measure of the impact of an economic sector on the well-being of people in a state is the amount of value added to a product or service in that state. [Value added by an economic activity is the sum of: salaries and wages earned by all workers in the state, income received by self-employed individuals, payments received by individuals and corporations in the form of interest, rents, royalties, dividends, and profit, and indirect business taxes paid by individuals to businesses (IMPLAN, 2004).] Thus, much of the value added by an economic activity such as the agricultural industry sector in a state ultimately shows up as money in the hands of the residents of the state, which they can then spend buying goods and services. Inducing further economic activity in the state. The benefits of the value added by one economic sector, such as the agricultural industry in Connecticut, thus reach throughout the state’s economy. It should be noted that the value added impact is a part of the output impact of agriculture reported above.
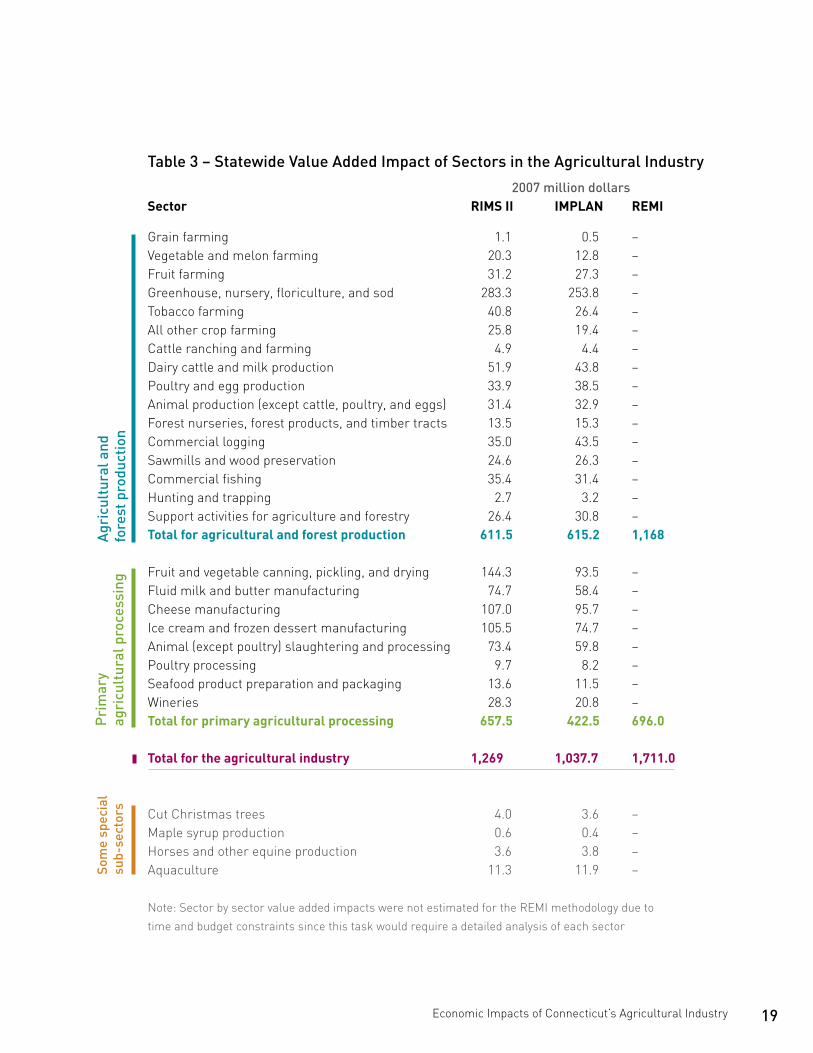
As shown in Figure 8, value added by the agricultural industry is in the range of $1.04 to $1.71 billion. The agricultural and forest production sub-sector adds value to the tune of $0.61 to $1.17 billion. This is more than the value added by the primary processing sub-sector ($0.42 to $0.70 billion), although the output impact of the primary processing sub-sector is larger than that of the production sub-sector. This may be attributable to the relatively higher use of out-of-state inputs by the processing sectors. Table 3 shows that the following sectors add significant value within the state: greenhouse, nursery, floriculture and sod production (the significant leader); cheese manufacturing; fruit and vegetable canning, pickling, and drying; and ice cream and frozen dessert manufacturing.
Agricultural and Forest Production
Primary Agricultural Processing
Total Agricultural Industry
Agricultural and Forest Production
Primary AgriculturalProcessing
Total Agricultual Industry
1,800
1,600
1,400
1,200
1,000
800
600
400
200
0
Mill
ion
207
Dol
lars
IMPLANRIMS II
REMIAverage
Figure 8 Total Value Added Impacts, 2007
Economic Impacts of Connecticut’s Agricultural Industry 19
Agr
icul
tura
l and
fo
rest
pro
duct
ion
Pri
mar
y
agri
cult
ural
pro
cess
ing
Som
e sp
ecia
l su
b-se
ctor
s
Table 3 – Statewide Value Added Impact of Sectors in the Agricultural Industry
2007 million dollarsSector RIMS II IMPLAN REMI
Grain farming 1.1 0.5 –Vegetable and melon farming 20.3 12.8 –Fruit farming 31.2 27.3 –Greenhouse, nursery, floriculture, and sod 283.3 253.8 –Tobacco farming 40.8 26.4 –All other crop farming 25.8 19.4 –Cattle ranching and farming 4.9 4.4 –Dairy cattle and milk production 51.9 43.8 –Poultry and egg production 33.9 38.5 –Animal production (except cattle, poultry, and eggs) 31.4 32.9 –Forest nurseries, forest products, and timber tracts 13.5 15.3 –Commercial logging 35.0 43.5 –Sawmills and wood preservation 24.6 26.3 –Commercial fishing 35.4 31.4 –Hunting and trapping 2.7 3.2 –Support activities for agriculture and forestry 26.4 30.8 –Total for agricultural and forest production 611.5 615.2 1,168 Fruit and vegetable canning, pickling, and drying 144.3 93.5 –Fluid milk and butter manufacturing 74.7 58.4 –Cheese manufacturing 107.0 95.7 –Ice cream and frozen dessert manufacturing 105.5 74.7 –Animal (except poultry) slaughtering and processing 73.4 59.8 –Poultry processing 9.7 8.2 –Seafood product preparation and packaging 13.6 11.5 –Wineries 28.3 20.8 –Total for primary agricultural processing 657.5 422.5 696.0 Total for the agricultural industry 1,269 1,037.7 1,711.0
Cut Christmas trees 4.0 3.6 –Maple syrup production 0.6 0.4 –Horses and other equine production 3.6 3.8 –Aquaculture 11.3 11.9 –
Note: Sector by sector value added impacts were not estimated for the REMI methodology due to time and budget constraints since this task would require a detailed analysis of each sector

Non-traditional Impacts The results presented above are confined to traditional economic impacts. In addition to the output (sales), employment, and value added impacts, the agricultural industry provides significant non-market social benefits and ecosystem services through its 405,616 acres of land in farms.
Social Benefits
By maintaining the rural and historical New England landscape that visitors to Connecticut find so attractive, working farms are integral to the state’s tourism industry, which is major employer. Working farms define the scenery that people enjoy on country drives in the state. Local farms and farmland are valued for their tranquility and natural beauty, and this connection to nature via farmland scenery encourages well-being and social health. In addition, destinations such as wineries, pick-your-own orchards, pumpkin patches, and corn mazes help attract tourists. Finally, farmers’ markets, farm stands, and farm-to-table events can boost sales for area businesses.
Ecosystem Services
Farmers and the land they steward provide a variety of ecosystem services and environmental benefits. Many agricultural products depend on good soils, favorable climate conditions, and clean water. A typical Connecticut farm’s cropland, pasture, wetlands, and woodlands act as a natural filter for surface and subsurface water, and provide not only aquifer recharge areas but habitats for many land and aquatic species, pollination zones, feeding and breeding areas for local bird populations, and stopovers for migrating birds. Farmland helps to regulate soil nutrients and minimize flooding, and acts as a “sink” to sequester carbon and help curtail global warming.
20
21
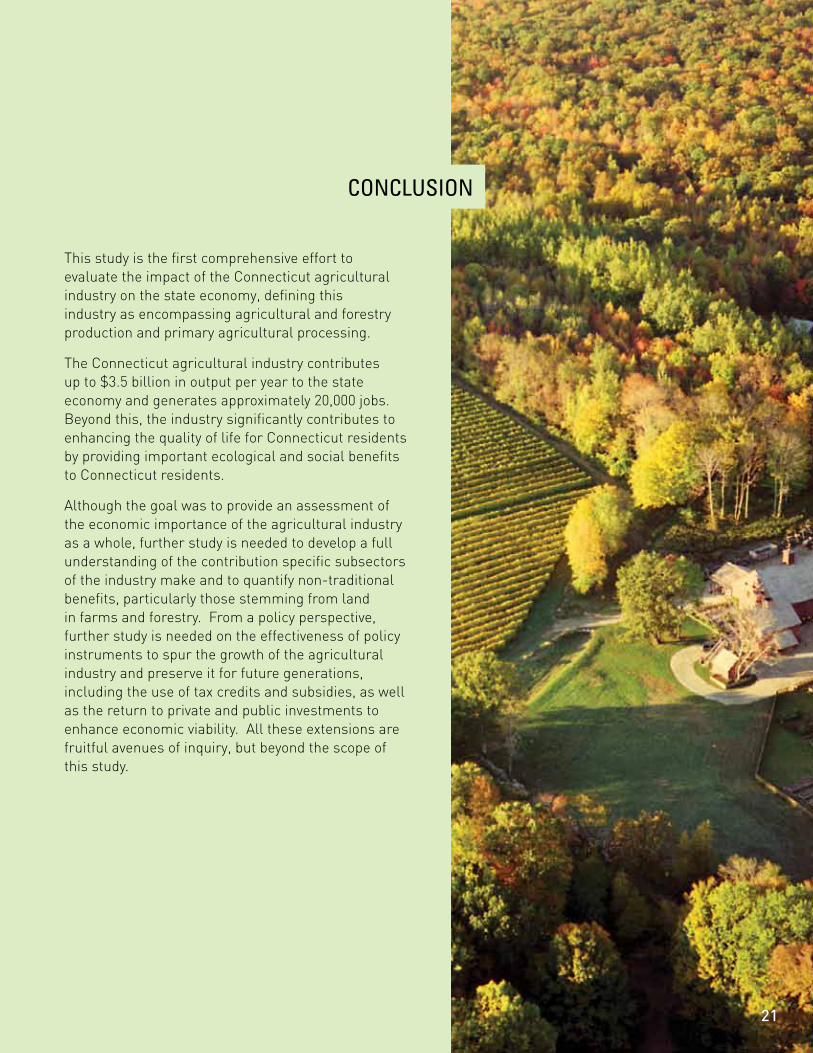
This study is the first comprehensive effort to evaluate the impact of the Connecticut agricultural industry on the state economy, defining this industry as encompassing agricultural and forestry production and primary agricultural processing.
The Connecticut agricultural industry contributes up to $3.5 billion in output per year to the state economy and generates approximately 20,000 jobs. Beyond this, the industry significantly contributes to enhancing the quality of life for Connecticut residents by providing important ecological and social benefits to Connecticut residents.
Although the goal was to provide an assessment of the economic importance of the agricultural industry as a whole, further study is needed to develop a full understanding of the contribution specific subsectors of the industry make and to quantify non-traditional benefits, particularly those stemming from land in farms and forestry. From a policy perspective, further study is needed on the effectiveness of policy instruments to spur the growth of the agricultural industry and preserve it for future generations, including the use of tax credits and subsidies, as well as the return to private and public investments to enhance economic viability. All these extensions are fruitful avenues of inquiry, but beyond the scope of this study.
concLUSIon

22
Bureau of Economic Analysis, US Department of Commerce. (2007). Regional Input-Output Modeling System (RIMS II). Bureau of Economic Analysis, US Department of Commerce http://www.bea.gov/regional/about.cfm
Center for Land Use Education and Research. (2006). 2006 Statewide Land Cover. Center for Land Use Education and Research, University of Connecticut, Storrs, CT. Retrieved July 21, 2010, from http://clear.uconn.edu/projects/landscape/statewide.htm
Connecticut Department of Labor. (2006). State of Connecticut Occupational Forecast: 2006-2016 Projections. Office of Research, State of Connecticut Department of Labor.
Department of Economic and Community Development and Department of Agriculture and Resource Economics, University of Connecticut (DECD and UConn). (2009). The Economic and Fiscal Impacts of Connecticut’s Dairy Industry.
Economic Research Service, US Department of Agriculture. (2005). Connecticut Farm and Farm-Related Employment, 2002. Economic Research Service, US Department of Agriculture. Retrieved July 19, 2010, from www.ers.usda.gov/Data/FarmandRelatedEmployment/ViewData.asp?GeoAreaPick=STACT_Connecticut&YearPick=2002
Hall, C. R., Hodges, A. W., and Haydu, J. J. (2005). Economic impacts of the green industry in the United States. Final report to the ‘National urban and community forestry advisory committee’ of the US Forest Service, US Department of Agriculture.
IMPLAN. (2004). User’s, analysis, and data guides. IMPLAN Professional Version 2.0. Minnesota IMPLAN Group, Inc.
REFERENCES

Economic Impacts of Connecticut’s Agricultural Industry 23
IMPLAN. (2007). Output, value added, and employment. IMPLAN Professional Version 2.0. Minnesota IMPLAN Group, Inc. The IMPLAN data files are compiles from a variety of sources including the US Bureau of Economic Analysis, The US Bureau of Labor, and the US Census.
Lee, T. C., and Leonard, R. L. (2004). “The Contribution of Agriculture to Connecticut Economy.” In Connecticut Agriculture and Resources: 21st Century Issues and Challenges. Department of Agricultural and Resource Economics, College of Agriculture and Natural Resources, University of Connecticut.
Lopez, R., and Jeffords, C. (2010). 2007-08 Report, Connecticut Agriculture – Volume 1, Number 1. Department of Agricultural and Resource Economics, University of Connecticut, April 2010.
Minnesota IMPLAN Group, Inc. (2010). IMPLAN Professional Version 2.0 http://implan.com/V3/Index.php
Perry, L., and Stack, L., B. (2009). New England Environmental Horticulture: Economic Impact Survey – 2009. University of Vermont and University of Maine. Retrieved May 31, 2010, from http://pss.uvm.edu/ppp/nesurvey/index.htm
Regan, W. M., and Prisloe, M. R. (2003). The Economic Impact of Avian Influenza on Connecticut’s Egg Industry. Department of Economic and Community Development, State of Connecticut, July 2003.
Regional Economic Models, Inc. (2010). The REMI Model of Economies of the States within the US http://www.remi.com/
US Department of Agriculture. (2007). “Connecticut State and County Data - Volume 1, Geographic Area Series – Part 7”. Census of Agriculture. US Department of Agriculture.

24
Agr
icul
tura
l and
fo
rest
pro
duct
ion
Pri
mar
y
agri
cult
ural
pro
cess
ing
Som
e sp
ecia
l su
b-se
ctor
s
Sector
Direct Sales ($2007 million)
Direct Employment (Number of jobs)
IMPLAN Multipliers RIMS II Multipliers
Output Multiplier
Employment Multiplier (Jobs per million dollars) Output Multiplier
Employment Multiplier (Jobs per million dollars)
Grain farming 1.547 38 1.3512 27.2195 1.6783 8.4067
Vegetable and melon farming 23.532 200 1.3182 11.0773 1.6058 18.9137
Fruit farming 35.081 507 1.3283 17.3562 1.6226 22.2838
Greenhouse, nursery, floriculture, and sod 269.351 3,354 1.3854 15.5416 1.7126 25.3696
Tobacco farming 56.696 587 1.5038 28.2957 1.8691 14.5180
All other crop farming 34.749 269 1.3969 10.7127 1.6980 16.5996
Cattle ranching and farming 11.068 133 1.3728 14.7188 1.4540 8.7853
Dairy cattle and milk production 75.577 843 1.2878 13.2283 1.5101 14.0217
Poultry and egg production 74.452 213 1.6330 8.0080 1.4930 8.6910
Animal production (except cattle, poultry, & eggs) 41.882 1,354 1.4322 36.5061 1.4037 9.6439
Forest nurseries, forest products, and timber tracts 20.511 49 1.2327 5.2488 1.4605 8.7427
Commercial logging 58.505 449 1.2962 9.8715 1.4193 11.2393
Sawmills and wood preservation 49.388 194 1.5677 7.8031 1.4590 7.7149
Commercial fishing 31.353 620 1.3601 22.5649 1.8777 27.1393
Hunting and trapping 3.268 35 1.5086 15.3307 1.6694 12.2839
Support activities for agriculture and forestry 25.086 1,374 1.6708 59.6088 1.8134 31.4404
Total for agricultural and forest production 812.046 10,219 1.4162 16.8537 1.5886 19.0002
Fruit and vegetable canning, pickling, and drying 198.677 308 1.6482 4.4801 1.8676 7.3075
Fluid milk and butter manufacturing 125.911 201 1.6429 6.3328 1.7470 6.5840
Cheese manufacturing 229.411 306 1.7707 6.2865 1.6878 7.0277
Ice cream and frozen dessert manufacturing 141.259 278 1.7014 5.5930 1.9427 7.3042
Animal (except poultry) slaughtering and proc. 182.439 422 1.4312 6.3749 1.4876 6.2811
Poultry processing 16.226 73 1.6726 8.2714 1.7331 8.3602
Seafood product preparation and packaging 23.071 71 1.5647 7.4345 1.7071 7.6819
Wineries 37.877 106 1.6686 6.5478 1.8463 8.4299
Total for primary agricultural processing 954.871 1,765 1.6442 5.9034 1.8327 7.6701
Total for the agricultural industry 1,766.917 11,984.000 1.5394 10.9354 1.7205 12.8772
Cut Christmas trees 3.840 48 1.3854 15.5416 1.7126 25.3696
Maple syrup production 0.801 6 1.3969 10.7127 1.6980 16.5996
Horses and other equine production 4.868 157 1.4322 36.5061 1.4037 9.6439
Aquaculture 15.142 490 1.4322 36.5061 1.4037 9.6439
Notes: For REMI, the imputed output multipliers (ratio of statewide output impact to the direct sales of agriculture) for agricultural and forest production, primary agricultural processing, and the entire
Table A1: 2007 Data and Multipliers for the Connecticut Agricultural Industry
appEnDIx

IMPLAN Multipliers RIMS II Multipliers
Output Multiplier
Employment Multiplier (Jobs per million dollars) Output Multiplier
Employment Multiplier (Jobs per million dollars)
1.3512 27.2195 1.6783 8.4067
1.3182 11.0773 1.6058 18.9137
1.3283 17.3562 1.6226 22.2838
1.3854 15.5416 1.7126 25.3696
1.5038 28.2957 1.8691 14.5180
1.3969 10.7127 1.6980 16.5996
1.3728 14.7188 1.4540 8.7853
1.2878 13.2283 1.5101 14.0217
1.6330 8.0080 1.4930 8.6910
1.4322 36.5061 1.4037 9.6439
1.2327 5.2488 1.4605 8.7427
1.2962 9.8715 1.4193 11.2393
1.5677 7.8031 1.4590 7.7149
1.3601 22.5649 1.8777 27.1393
1.5086 15.3307 1.6694 12.2839
1.6708 59.6088 1.8134 31.4404
1.4162 16.8537 1.5886 19.0002
1.6482 4.4801 1.8676 7.3075
1.6429 6.3328 1.7470 6.5840
1.7707 6.2865 1.6878 7.0277
1.7014 5.5930 1.9427 7.3042
1.4312 6.3749 1.4876 6.2811
1.6726 8.2714 1.7331 8.3602
1.5647 7.4345 1.7071 7.6819
1.6686 6.5478 1.8463 8.4299
1.6442 5.9034 1.8327 7.6701
1.5394 10.9354 1.7205 12.8772
1.3854 15.5416 1.7126 25.3696
1.3969 10.7127 1.6980 16.5996
1.4322 36.5061 1.4037 9.6439
1.4322 36.5061 1.4037 9.6439
Economic Impacts of Connecticut’s Agricultural Industry 25
agricultural industry are 2.24, 2.02, and 1.99, respectively. The imputed employment multipliers (ratio of statewide employment impact to the direct sales of agriculture) are 13.13, 7.39, and 9.42, respectively. Note that direct employment data were not used in the calculations.
Table A1: 2007 Data and Multipliers for the Connecticut Agricultural Industry
26
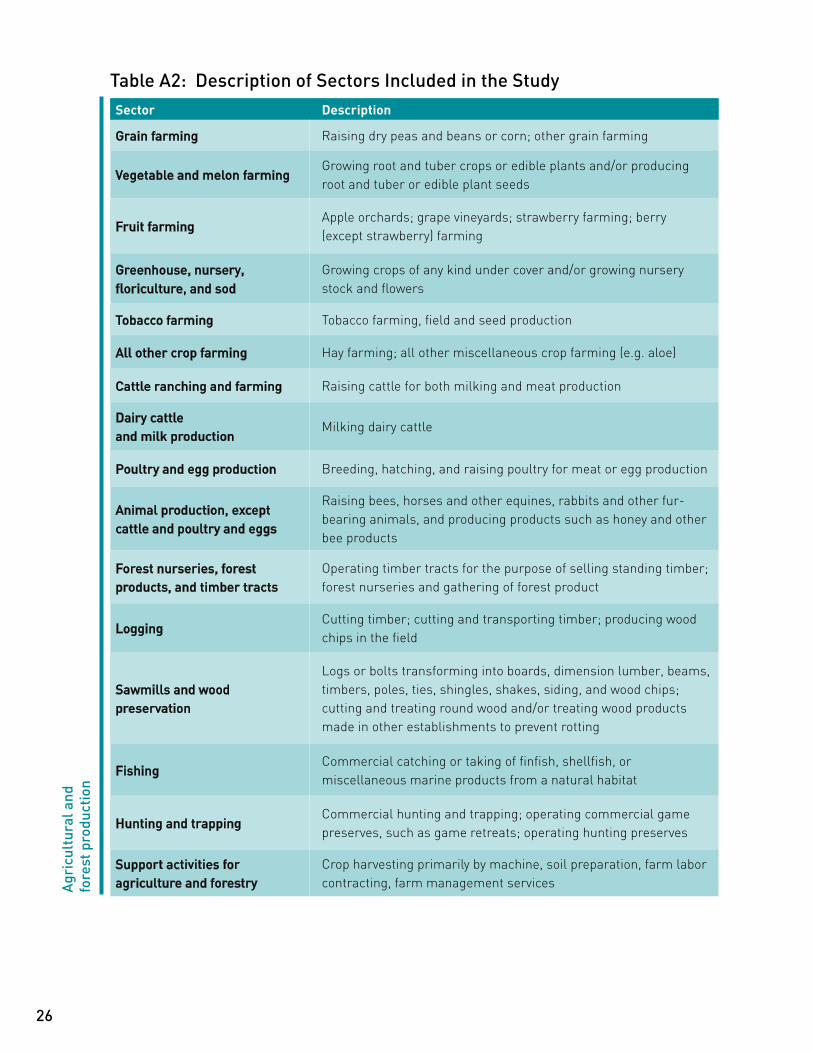
Table A2: Description of Sectors Included in the StudySector Description
Grain farming Raising dry peas and beans or corn; other grain farming
Vegetable and melon farmingGrowing root and tuber crops or edible plants and/or producing root and tuber or edible plant seeds
Fruit farmingApple orchards; grape vineyards; strawberry farming; berry (except strawberry) farming
Greenhouse, nursery, floriculture, and sod
Growing crops of any kind under cover and/or growing nursery stock and flowers
Tobacco farming Tobacco farming, field and seed production
All other crop farming Hay farming; all other miscellaneous crop farming (e.g. aloe)
Cattle ranching and farming Raising cattle for both milking and meat production
Dairy cattle and milk production
Milking dairy cattle
Poultry and egg production Breeding, hatching, and raising poultry for meat or egg production
Animal production, except cattle and poultry and eggs
Raising bees, horses and other equines, rabbits and other fur-bearing animals, and producing products such as honey and other bee products
Forest nurseries, forest products, and timber tracts
Operating timber tracts for the purpose of selling standing timber; forest nurseries and gathering of forest product
LoggingCutting timber; cutting and transporting timber; producing wood chips in the field
Sawmills and wood preservation
Logs or bolts transforming into boards, dimension lumber, beams, timbers, poles, ties, shingles, shakes, siding, and wood chips; cutting and treating round wood and/or treating wood products made in other establishments to prevent rotting
FishingCommercial catching or taking of finfish, shellfish, or miscellaneous marine products from a natural habitat
Hunting and trappingCommercial hunting and trapping; operating commercial game preserves, such as game retreats; operating hunting preserves
Support activities for agriculture and forestry
Crop harvesting primarily by machine, soil preparation, farm labor contracting, farm management servicesA
gric
ultu
ral a
nd
fore
st p
rodu
ctio
n
Economic Impacts of Connecticut’s Agricultural Industry 27
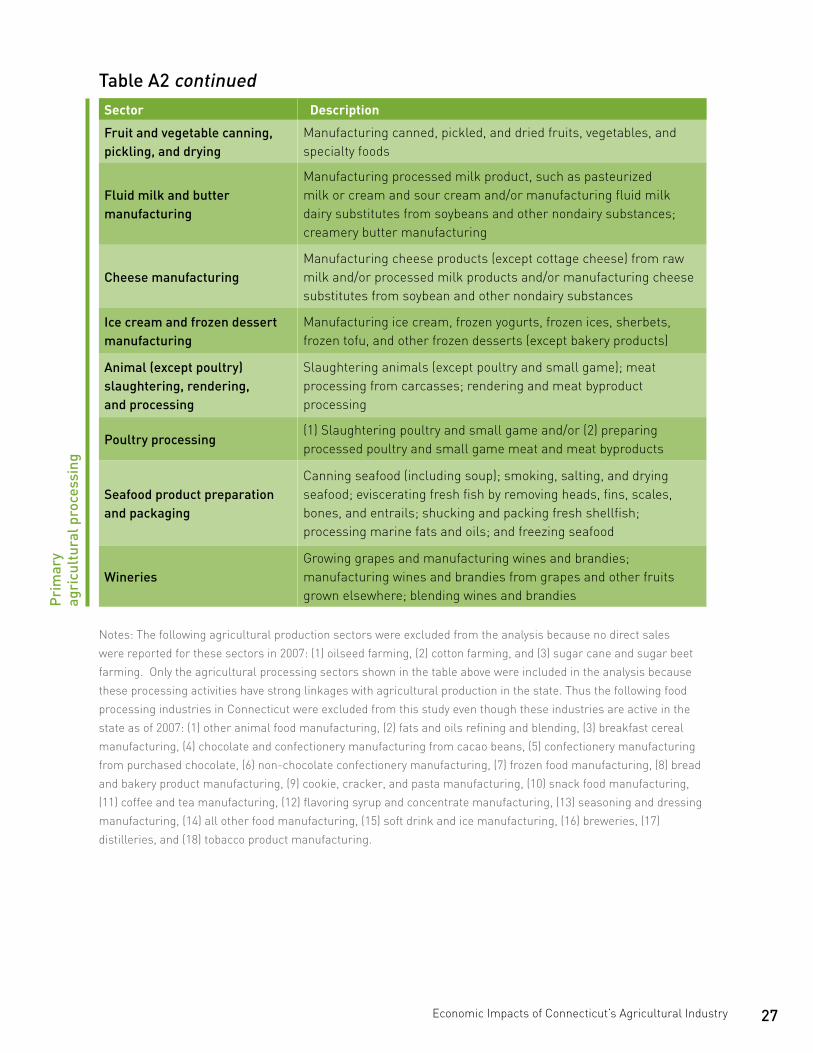
Table A2 continuedSector Description
Fruit and vegetable canning, pickling, and drying
Manufacturing canned, pickled, and dried fruits, vegetables, and specialty foods
Fluid milk and butter manufacturing
Manufacturing processed milk product, such as pasteurized milk or cream and sour cream and/or manufacturing fluid milk dairy substitutes from soybeans and other nondairy substances; creamery butter manufacturing
Cheese manufacturingManufacturing cheese products (except cottage cheese) from raw milk and/or processed milk products and/or manufacturing cheese substitutes from soybean and other nondairy substances
Ice cream and frozen dessert manufacturing
Manufacturing ice cream, frozen yogurts, frozen ices, sherbets, frozen tofu, and other frozen desserts (except bakery products)
Animal (except poultry) slaughtering, rendering, and processing
Slaughtering animals (except poultry and small game); meat processing from carcasses; rendering and meat byproduct processing
Poultry processing(1) Slaughtering poultry and small game and/or (2) preparing processed poultry and small game meat and meat byproducts
Seafood product preparation and packaging
Canning seafood (including soup); smoking, salting, and drying seafood; eviscerating fresh fish by removing heads, fins, scales, bones, and entrails; shucking and packing fresh shellfish; processing marine fats and oils; and freezing seafood
WineriesGrowing grapes and manufacturing wines and brandies; manufacturing wines and brandies from grapes and other fruits grown elsewhere; blending wines and brandies
Notes: The following agricultural production sectors were excluded from the analysis because no direct sales were reported for these sectors in 2007: (1) oilseed farming, (2) cotton farming, and (3) sugar cane and sugar beet farming. Only the agricultural processing sectors shown in the table above were included in the analysis because these processing activities have strong linkages with agricultural production in the state. Thus the following food processing industries in Connecticut were excluded from this study even though these industries are active in the state as of 2007: (1) other animal food manufacturing, (2) fats and oils refining and blending, (3) breakfast cereal manufacturing, (4) chocolate and confectionery manufacturing from cacao beans, (5) confectionery manufacturing from purchased chocolate, (6) non-chocolate confectionery manufacturing, (7) frozen food manufacturing, (8) bread and bakery product manufacturing, (9) cookie, cracker, and pasta manufacturing, (10) snack food manufacturing, (11) coffee and tea manufacturing, (12) flavoring syrup and concentrate manufacturing, (13) seasoning and dressing manufacturing, (14) all other food manufacturing, (15) soft drink and ice manufacturing, (16) breweries, (17) distilleries, and (18) tobacco product manufacturing.
Pri
mar
y
agri
cult
ural
pro
cess
ing

Equal Opportunity Employer and Program Provider