economic impacts of hurricane katrina - inforum · economic impacts of hurricane katrina ... andrew...
TRANSCRIPT
Economic Impacts of Hurricane Katrina
Jeff WerlingINFORUM
University of MarylandSeptember 22, 2005

OverviewFirst natural disaster to have significant negative macroeconomic impact
Size of regional economy disruptedKnock-on effects of energy and transportation industry problems
Redistribution of income/wealthFrom energy consumers to energy stockholders and OPECFrom (future) taxpayers, property insurance purchasers, and charitable givers to compensate hurricane’s victims
Rita regional effect could be similar, but could compound energy problems and macro effects

Katrina: Human and Material Losses
1000+ deaths500K to 1 million homeless200K homes ruined in Louisiana/Mississippi300K+ jobs disrupted$100-$150 billion property loss
Compare to Andrew (1992)43 deaths300K homeless100,000 homes damaged

Three broad types of economic impactsLoss of property or wealth (productive capital stock). These do not show up as reductions in “gross” domestic product, but in “net” national income as “capital consumption” (depreciation) increases.
Disruption of production, employment and income flows will reduce GDP temporarily.
Paradox: Income and production (GDP) are down initially from disruption. Production accelerates over medium term as wealth is “re-accumulated.”
Cost-Push Inflation: energy, construction materials, and downstream price pressures.

Katrina is largest catastrophe in history
Sources: Economy.com, Swiss Re, RMS, Insurance Information Institute, Inforum estimates
Figures in billions of 2005$
Event Region DateWealth
DestructionProduction Disruption Total Loss
Priv Aid & Insurance Govt Aid
Katrina GOM Sep-05 $80-150 $25-50 $100-200 $40-60 $100-200Ivan GOM Sep-04 7.2 6.5 13.7 7.3 6.39/11 Nat'l Sep-01 25.7 61.8 87.5 20.2 67.3Northridge EQ LA Jan-94 23.6 12.5 36.1 16.1 15.5Midwest Floods MN to MO Sum 93 6.1 9.4 15.5 1.3 7Andrew So. FL. Aug-92 36.7 11.6 48.3 21.3 10.8Loma Prieta EQ Bay Area Oct-89 10.6 5.4 16 1.6 7.6Hugo SC Sep-89 14.5 4.7 19.2 6.6 3.1
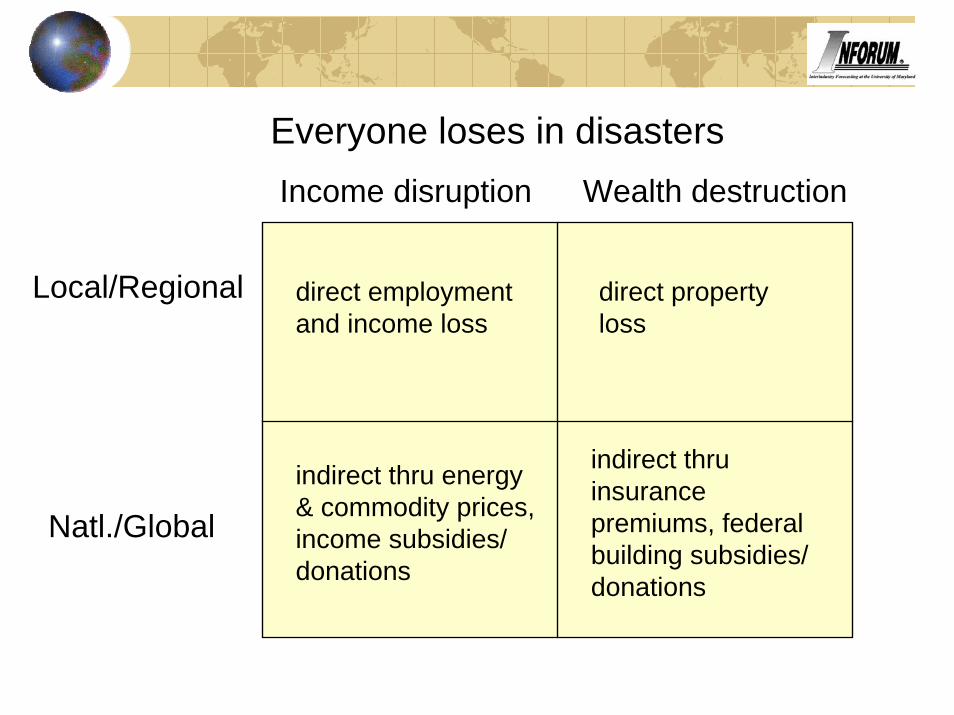
Wealth destructionIncome disruption
Local/Regional
Natl./Global
direct employment and income loss
indirect thru insurance premiums, federal building subsidies/ donations
direct property loss
indirect thru energy & commodity prices, income subsidies/ donations
Everyone loses in disasters
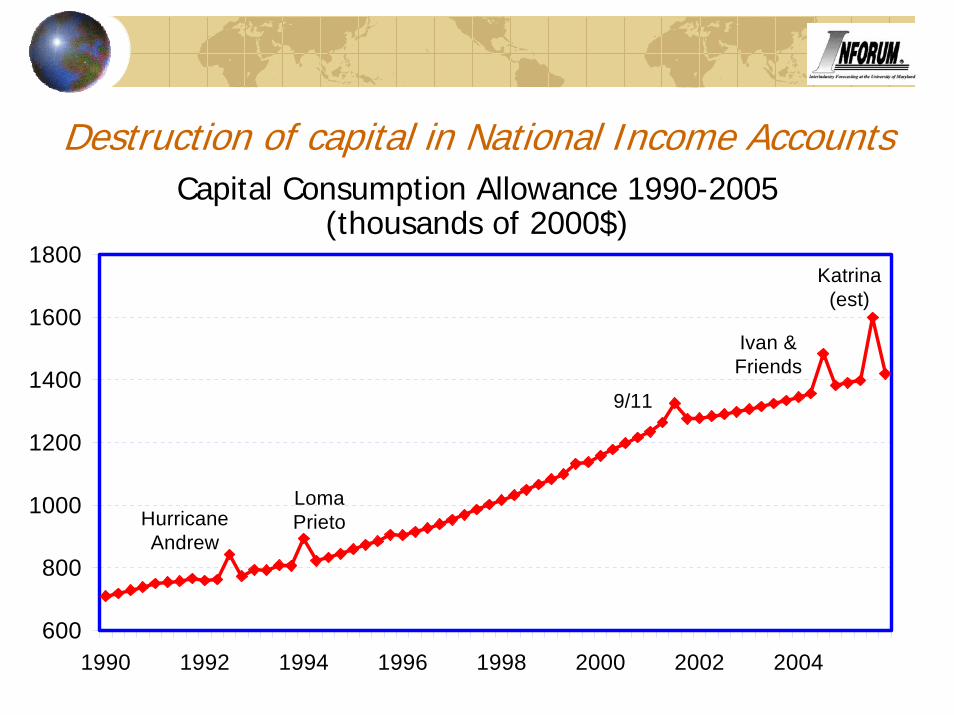
Destruction of capital in National Income AccountsCapital Consumption Allowance 1990-2005
(thousands of 2000$)
600
800
1000
1200
1400
1600
1800
1990 1992 1994 1996 1998 2000 2002 2004
Hurricane Andrew
Katrina (est)
Loma Prieto
9/11
Ivan & Friends

Affected Region is Sizable
Economic AreaPopulation
(thous)%
U.S.Income (thous)
% U.S.
Employment (thous)
% U.S.
Severe DisruptionNew Orleans, LA 1733 0.60 49161 0.54 971 0.58Gulfport -Biloxi-Pasc 404 0.14 10226 0.11 223 0.13
Moderate DisruptionBaton Rouge, LA 755 0.26 20196 0.22 432 0.26Mobile-Daphne-Fair 708 0.24 16748 0.18 356 0.21
Houston 5966 2.05 196048 2.14 3385.637 2.03
Source: Bureau of Economic Analysis
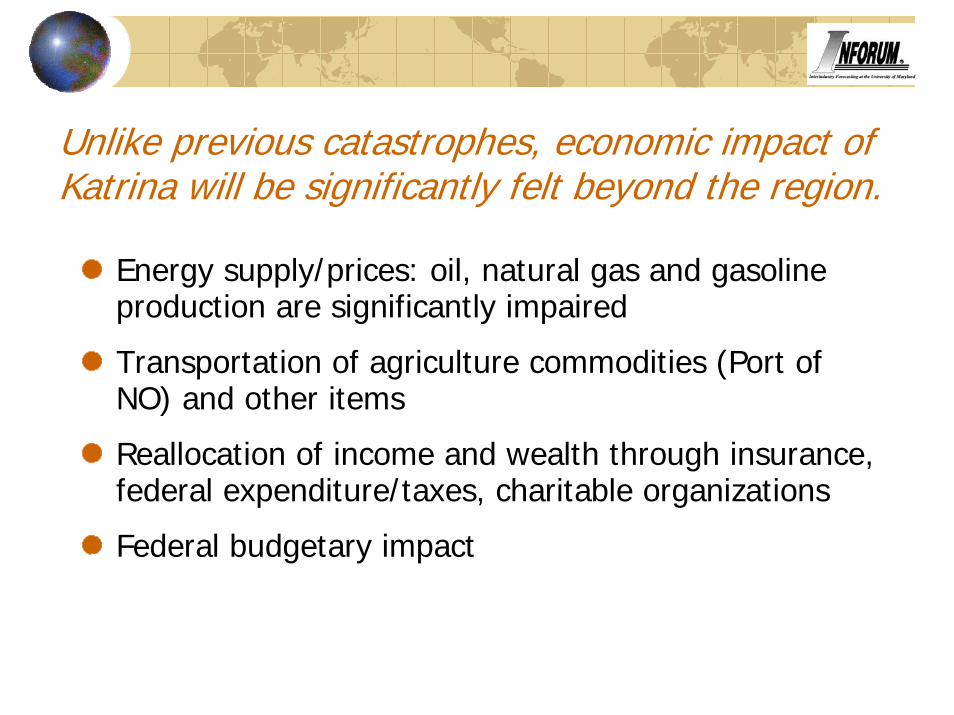
Unlike previous catastrophes, economic impact of Katrina will be significantly felt beyond the region.
Energy supply/prices: oil, natural gas and gasoline production are significantly impaired
Transportation of agriculture commodities (Port of NO) and other items
Reallocation of income and wealth through insurance, federal expenditure/taxes, charitable organizations
Federal budgetary impact

Gulf of Mexico is center of oil and gas industry(Rita presents even greater threat)
Gulf of Mexico Oil & Natural Gas FactsEnergy Information AdministrationData as of June 2005 unless otherwise noted.
% fromGulf of Mexico
Total U.S.
Gulf of Mexico
Oil (million barrels per day) Federal Offshore Crude Oil Production (4/05) 1.56 5.49 29%
Total Gulf Coast Refinery Capacity (1/05) 8.07 17.01 47%
Total Gulf Coast Region Crude Oil Imports 6.49 10.75 60% - of which into ports in LA, MS and AL 2.52 10.75 24% - of which into LOOP 0.91 10.75 9%
Natural Gas (billion cubic feet per day) Federal Offshore Marketed Production (3/05) 10.40 54.10 19%
Source: Energy Information Agency, DOE

“Shut-In” of Petroleum & NG production
Source: Energy Information Agency, DOE

Refinery activity substantially impacted
Source: Energy Information Agency, DOE
Source: Energy Information Agency, DOE

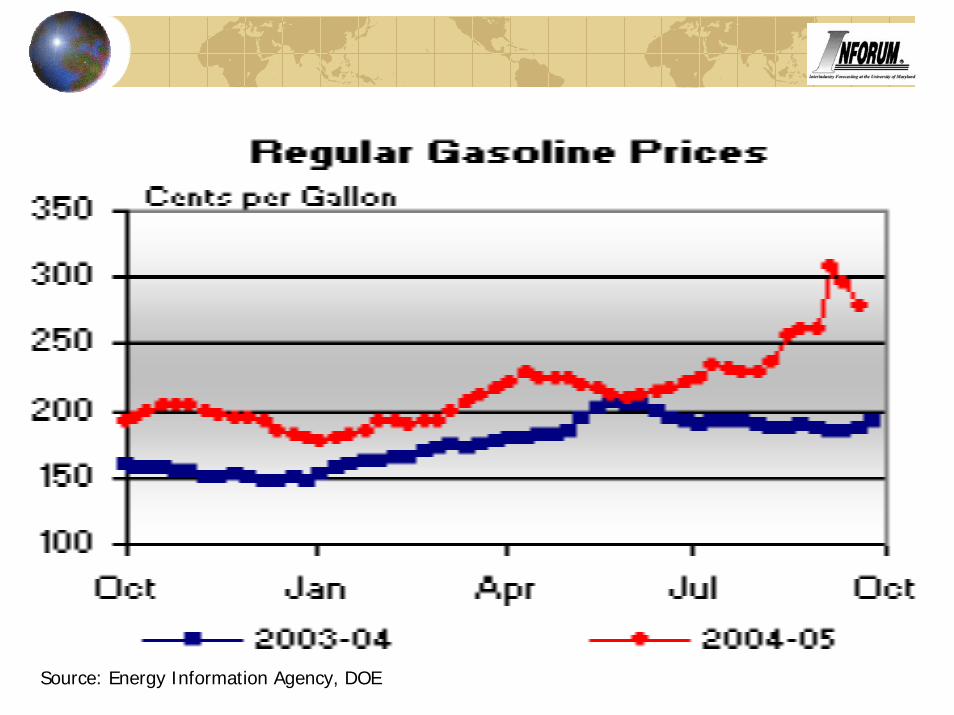
Higher prices affect demand?!
Source: Energy Information Agency, DOE

Interesting Economics Lesson: Should gasoline prices be regulated?
More Than 20 Georgia Gas Retailers Could Face Fines Over Prices
Associated PressWednesday, September 21, 2005
“As many as 26 area gasoline retailers may be fined for not reducing their prices after Governor Perdue declared a temporary moratorium on the state's gas tax. “
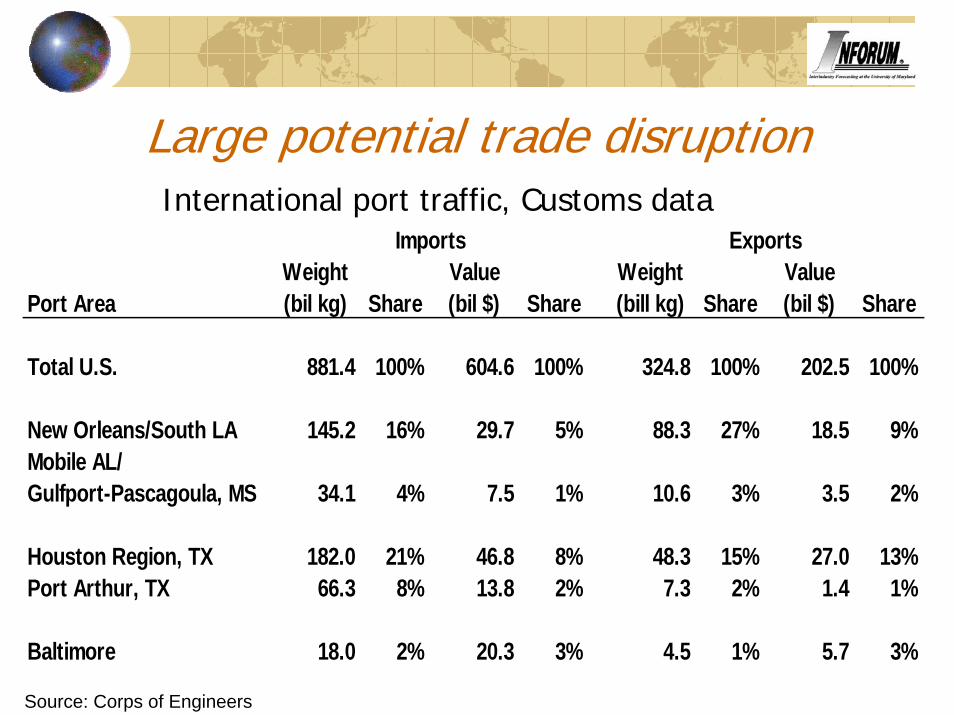
Large potential trade disruptionInternational port traffic, Customs data
Imports ExportsWeight Value Weight Value
Port Area (bil kg) Share (bil $) Share (bill kg) Share (bil $) Share
Total U.S. 881.4 100% 604.6 100% 324.8 100% 202.5 100%
New Orleans/South LA 145.2 16% 29.7 5% 88.3 27% 18.5 9%Mobile AL/Gulfport-Pascagoula, MS 34.1 4% 7.5 1% 10.6 3% 3.5 2%
Houston Region, TX 182.0 21% 46.8 8% 48.3 15% 27.0 13%Port Arthur, TX 66.3 8% 13.8 2% 7.3 2% 1.4 1%
Baltimore 18.0 2% 20.3 3% 4.5 1% 5.7 3%
Source: Corps of Engineers
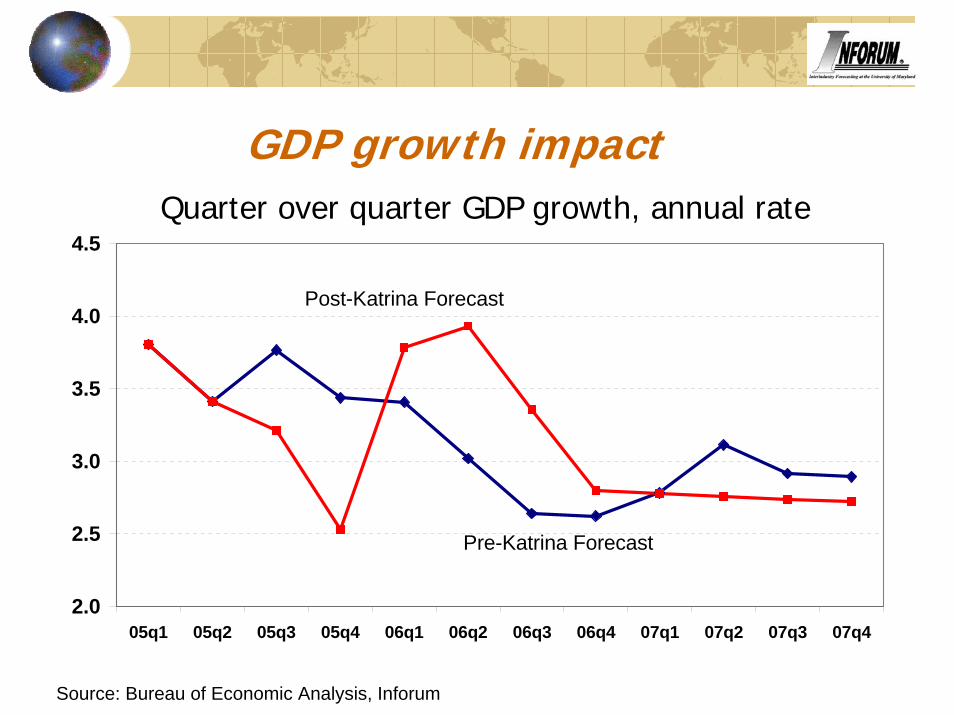
GDP growth impactQuarter over quarter GDP growth, annual rate
2.0
2.5
3.0
3.5
4.0
4.5
05q1 05q2 05q3 05q4 06q1 06q2 06q3 06q4 07q1 07q2 07q3 07q4
Post-Katrina Forecast
Pre-Katrina Forecast
Source: Bureau of Economic Analysis, Inforum

Inflation impactPersonal consumption deflator, qoq change %
0.00.51.01.52.02.53.03.54.04.55.0
05q1 05q2 05q3 05q4 06q1 06q2 06q3 06q4 07q1 07q2 07q3 07q4

Budgetary Impact“It’s going to cost whatever it costs.” (President Bush)
Current estimates of Federal share up to $200 billion in recovery and reconstruction. Spread over three-four years. Plus interest.
Iraq is due for another $80+ billion installment early next year.
Medicare drug coverage starts in 2006 ($40-60 bill).
Long-term borrowing scenario already ugly.
Promises of other cuts don’t seem credible.
No change in tax policy?

Katrina’s Federal Budget ImpactShort run federal budget impact of 200 bill $
-140
-120
-100
-80
-60
-40
-20
0
20
40
60
2001 2002 2003 2004 2005 2006 2007 2008
Pre-Katrina
Post-Katrina
Source: Bureau of Economic Analysis, Inforum

Ultimate Katrina/Rita impact may be on bond market reaction to increasing government deficits
10 yr Federal Bond Yield
0.0
2.0
4.0
6.0
8.0
10.0
95 96 97 98 99 00 01 02 03 04 05
Hurricane Katrina: Conclusions
Regional disruption is unprecedented in size.
Macroeconomic consequences (output and inflation) significant but not disastrous.
Rita has potential to double the impacts.