economic impacts of the southern southeast regional
TRANSCRIPT

Economic Impacts of the
Southern Southeast Regional Aquaculture Association
PREPARED FOR
PREPARED BY
August 2018

Economic Impacts of the Southern Southeast Regional Aquaculture
Association (SSRAA)
Prepared for:
SSRAA
Prepared by:
August 2018
McDowell Group Anchorage Office
1400 W. Benson Blvd., Suite 510
Anchorage, Alaska 99503
McDowell Group Juneau Office
9360 Glacier Highway, Suite 201
Juneau, Alaska 99801
Website: www.mcdowellgroup.net

Table of Contents
Executive Summary ............................................................................................................................. 1
Purpose and Methodology ................................................................................................................. 1
Purpose and Scope ..................................................................................................................................................... 4 Methodology ................................................................................................................................................................. 4
Introduction ......................................................................................................................................... 6
Facilities and Production ........................................................................................................................................... 6
SSRAA Salmon in Commercial Fisheries ........................................................................................... 9
SSRAA Salmon and the Processing Sector ..................................................................................... 12
SSRAA Salmon in Sport Fisheries .................................................................................................... 14
Economic Impacts of SSRAA Production and Operations ............................................................ 16
Tax Revenue Associated with SSRAA Fish ...................................................................................... 19
Salmon Market Overview: Production & Price Trends .................................................................. 22

Economic Impacts of the Southern Southeast Regional Aquaculture Association McDowell Group Page 1
Executive Summary
The Southern Southeast Regional Aquaculture Association (SSRAA) is a non-profit corporation headquartered
in Ketchikan, Alaska working to enhance the salmon stocks in Southern Southeast Alaska (SSE). This study
estimates and describes SSRAA’s economic impacts on SSE’s commercial fishing, seafood processing, and
sportfishing industries. Unless stated otherwise, numbers presented reflect 2013 to 2017 averages.
SSRAA operates seven hatcheries and seven additional release sites throughout SSE, producing and releasing
around 170 million salmon smolts annually. SSRAA’s operations are primarily funded through cost recovery
harvests and a three percent ex-vessel tax on landed salmon in SSE. Between sport harvests, commercial
fisheries, and cost recovery activities, about 3.2 million SSRAA salmon are harvested annually.
Commercial Harvest
During the study period, annual harvests of SSRAA salmon in common property fisheries averaged 22 million
pounds with an average ex-vessel value of $16.8 million. Chum salmon accounted for 89 percent of the volume
and 75 percent of the value of SSRAA’s contribution to commercial fisheries during this period. Coho and
Chinook production are also important to the region’s troll, seine, and gillnet fleets.
SSRAA Salmon Harvest Value, Common Property Fisheries ($000s), 2008-2017
2013 2014 2015 2016 2017 2013-2017 Average
2013-2017
Percent of Total
Chum $8,971 8,917 15,940 13,010 15,887 $12,545 75
Coho 3,025 4,714 1,135 3,360 1,547 2,756 16
Chinook 1,792 1,808 1,567 1,202 1,202 1,514 9
Total $13,805 15,441 18,641 17,572 18,636 $16,819
As a portion of the overall catch in SSE commercial salmon fisheries, SSRAA is responsible for over half of chum
harvests (57 percent from 2008 through 2017), 39 percent of Chinook harvests, and 31 percent of coho harvests.
$9,892 $9,280
$15,535
$20,499
$36,236
$13,805 $15,441 $18,641 $17,572 $18,636
2008 2009 2010 2011 2012 2013 2014 2015 2016 2017

Economic Impacts of the Southern Southeast Regional Aquaculture Association McDowell Group Page 2
Seafood Processing
From 2013 to 2017, the cumulative wholesale value of SSRAA salmon was $239 million, including $49 million
derived from sales of cost recovery salmon and $190 million from common property salmon. Annually, first
wholesale value averaged $48 million during the study period.
By species, chum accounted for more than three-fourths (79 percent) of the wholesale value of SSRAA fish,
followed by Chinook (14 percent) and coho (7 percent).
Chum roe is a major driver of the value of SSRAA production, typically representing just under half of SSRAA-
generated wholesale value (see chart below).
First Wholesale Value of SSRAA Salmon, Chum Roe versus all other Products, 2013-2017
Sportfishing
Based on data provided by SSRAA, sport fishermen in SSE harvested 3,150 Chinook and 28,150 coho salmon,
on average, in recent years. While chum are harvested by area sport fishermen, SSRAA’s contributions to sport
chum harvests are not tracked or estimated.
Southern Southeast Sport Harvest of SSRAA Salmon (number of fish), 2013-2017
2013 2014 2015 2016 2017 2013-2017 Average
Chinook 2,080 1,750 4,612 2,732 4,691 3,150
Coho 19,970 50,567 38,798 9,742 21,607 28,150
SSRAA’s contribution to the overall SSE sport harvest averaged 11 percent of Chinook and 20 percent of coho
harvests from 2013-2016. In 2014 (the most recent year for which data is available), more than half (58 percent)
of the region’s Chinook and coho sport harvest was caught by guided anglers.
SSRAA’s role in the sport sector is especially prominent in the Ketchikan area. ADF&G creel survey data indicates
that roughly a third of the Chinook salmon caught in the Ketchikan area are typically SSRAA-produced fish,
along with about 13 percent of the sport coho harvest. In May and June, Ketchikan’s full-day and half-day
charter fleet (primarily serving cruise visitors) is largely dependent on SSRAA Chinook returning to nearby
release sites including Whitman Lake and Neets Bay.
$-
$10,000,000
$20,000,000
$30,000,000
$40,000,000
$50,000,000
$60,000,000
$70,000,000
2013 2014 2015 2016 2017
All Other Salmon Products Chum Roe

Economic Impacts of the Southern Southeast Regional Aquaculture Association McDowell Group Page 3
SSRAA Operations
In 2017, SSRAA employed an average of 60 workers who earned a total of $3.3 million in wages. Additionally,
the organization purchased supplies and services for its operations in Ketchikan (and at its various hatcheries
and release sites) which contributed to the local economy. In state expenditures totaled $3.6 million for 2017.
Multiplier effects result from subsequent spending by SSRAA’s employees and operational spending with
vendors in the region. Including these multiplier effects, economic impacts resulting from SSRAA’s operations
totaled 80 jobs and $4.1 million in labor income in 2017.
Combined Economic Impact of SSRAA Production and Operations
SSRAA’s total economic impact in 2017 is estimated at 680 jobs and $32 million in labor income, including
impacts related to commercial fishing, seafood processing, nonresident sportfishing, and from SSRAA’s own
spending and employment.
Output is a measure of total economic activity, including all labor income, spending on supplies and services,
and all related multiplier effects. Economic output associated with SSRAA and the salmon it produces totaled
approximately $70 million in 2017.
Economic Impact of SSRAA Production and Operations, 2017
Direct
Impacts Indirect &
Induced Impacts Total Economic
Impacts
Commercial Fishing
Employment 140 90 230
Labor Income $10.1 million $3.6 million $13.7 million
Seafood Processing
Employment 200 110 310
Labor Income $7.4 million $4.2 million $11.6 million
Non-resident Sportfishing
Employment 45 15 60
Labor Income $1.6 million $0.6 million $2.2 million
SSRAA Operations
Employment 60 20 80
Labor Income $3.3 million $0.8 million $4.1 million
Total Economic Impact
Employment 445 235 680
Labor Income ($millions) $22.4 million $9.2 million $32 million
Economic Output (labor income, spending, and multiplier effects) $70 million
Note: Totals may not sum due to rounding. Source: McDowell Group estimates using IMPLAN, ADF&G, DOLWD, and SSRAA data.

Economic Impacts of the Southern Southeast Regional Aquaculture Association McDowell Group Page 4
Purpose and Methodology
Purpose and Scope
This study estimates and describes the economic impacts of the Southern Southeast Regional Aquaculture
Association (SSRAA), with a focus on the five-year period from 2013 to 2017. This is an update of earlier
economic impact reports produced by McDowell Group in 2001 and 2008. The report concentrates on five
primary subjects:
1. Commercial Harvest – The overall economic benefits of commercially caught (common property)
SSRAA salmon are presented using ex-vessel income – the gross value paid to fishermen for their catch.
The geographic distribution of earnings from SSRAA salmon commercial harvest is also reported.
2. Seafood Processing – The overall economic impact resulting from processing SSRAA salmon (including
common property and cost recovery harvests) is estimated using first wholesale value data from
ADF&G. First wholesale value represents the first sale of fish by a processor to a buyer outside their
affiliate network.
3. Sport Harvest – Contributions of SSRAA fish to the regional sport harvest are addressed, including
impacts resulting from guided and unguided non-resident harvests.
4. Economic Impacts – This section summarizes the total economic impacts of SSRAA fish on the various
sectors described above, along with the economic impacts resulting from SSRAA operations.
5. Tax Revenue –SSRAA fish support a variety of economic activities that are taxed, providing revenue to
local governments throughout the SSE region.
For purposes of this report, Southern Southeast Alaska (SSE) is defined as the Ketchikan Gateway Borough,
Prince of Wales (POW) Island-Hyder Census Area, City and Borough of Wrangell, and the Petersburg Borough.
In terms of commercial fishing districts, SSE is defined as districts 1 through 8.
Methodology
The data used in this report comes from a variety of sources, including SSRAA, Alaska Commercial Fisheries
Entry Commission (CFEC), Alaska Department of Fish and Game (ADF&G), Alaska Department of Labor and
Workforce Development (DOLWD), and Alaska Department of Revenue (DOR). In addition, interviews were
conducted with SSRAA staff, ADF&G employees, and other experts.
Estimates provided in this report are based on the best available data. SSRAA provided estimates of their
contributions to common property, sport, and cost recovery fisheries in terms of number of fish. Average
weights per fish and prices per pound were applied (based on ADF&G data for Southeast Alaska) to estimate
the volume and value of SSRAA returns.
Economic Impacts of the Southern Southeast Regional Aquaculture Association McDowell Group Page 5
Several reports and other sources provided important sources of sportfishing data and related information,
including the following:
• McDowell Group, 2010. Impacts of Nonresident Sportfishing on the Ketchikan Economy. Prepared for
the Ketchikan Visitors Bureau.
• McDowell Group, 2008. Economic Impacts of the Southern Southeast Regional Aquaculture Association.
Prepared for SSRAA.
• ADF&G, 2016. Participation, Effort, and Harvest in the Sport Fish Business/Guide Licensing and Logbook
Programs, 2014. Fishery Data Series No. 16-02.
• Alaska Sport Fishing Survey database. 1996–2017. ADF&G, Division of Sport Fish (accessed May 2018):
http://www.adfg.alaska.gov/sf/sportfishingsurvey/
• ADF&G, 2009. An Evaluation of Estimates of Sport Fish Harvest from the Alaska Statewide Harvest
Survey, 1996-2006. Special Publication No. 09-12.
Economic Impact Modeling
McDowell Group developed an economic model to estimate the economic impacts related to SSRAA production
and operations. The model linked ex-vessel volume and value data, DOWLD employment and payroll data, first
wholesale value data, and other information to generate estimates of annual employment, income, and total
economic output related to SSRAA salmon. Multipliers were drawn from IMPLAN, a widely used input-output
model useful in measuring the direct, indirect, and induced economic impact of industry and infrastructure
development. Along with experience from previous analyses, the study team used the model to estimate the
economic impacts related to harvesting, processing, sportfishing, and to SSRAA operations in SSE.
In most cases, economic impact numbers presented in this report reflect 2013-2017 averages to smooth out
year-to-year variations in salmon returns. The exception is impacts related to SSRAA’s operations, which are
based on 2017 data alone. For simplicity, total economic impacts are reported as representing 2017.

Economic Impacts of the Southern Southeast Regional Aquaculture Association McDowell Group Page 6
Introduction
The Southern Southeast Regional Aquaculture Association (SSRAA) is a non-profit corporation headquartered
in Ketchikan, Alaska. Incorporated in 1976, the organization works to enhance the salmon stocks in Southern
Southeast Alaska (SSE) from Dixon Entrance to Frederick Sound. SSRAA is guided by a 21-member Board of
Directors representing a diverse group from the commercial, subsistence, sport, and fish processing sectors, as
well as representatives from Native corporations, municipalities, the business community, and the general
public. SSRAA employed an annual average of 61 staff in 2017 and a peak of 68 workers during the summer
months.
SSRAA is primarily funded through a combination of revenues from a 3 percent ex-vessel tax on landed salmon
within its operating area, and cost recovery of adult salmon returns. After nearly two decades running its own
cost recovery program, SSRAA transitioned to a more typical royalty model starting in 2014. Among other
smaller revenue sources, SSRAA also receives funding from ADF&G’s Division of Sport Fish to provide releases
of Chinook salmon for Ketchikan, Wrangell, and Petersburg area fisheries.
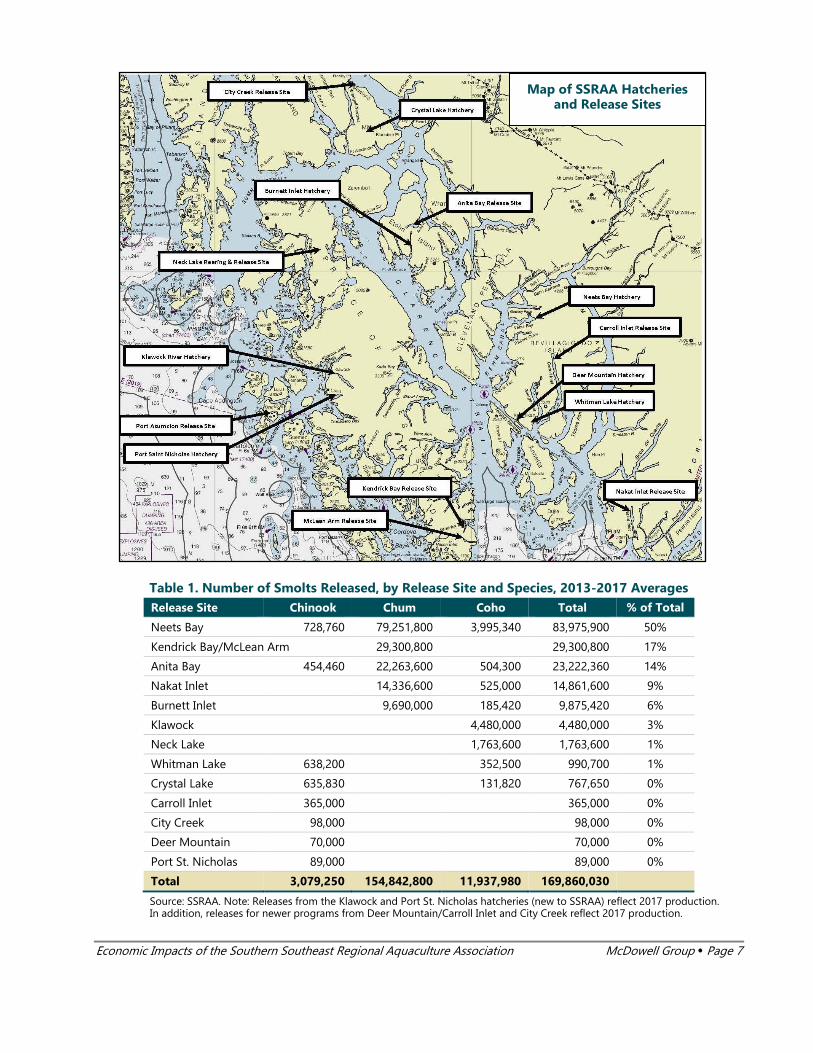
Facilities and Production
SSRAA operates seven hatcheries and seven additional remote release sites throughout SSE (see map on
following page). SSRAA’s longest-running hatcheries are located at Whitman Lake in Ketchikan; in Neets Bay,
roughly 40 miles north of Ketchikan; Burnett Inlet, 25 miles south of Wrangell; and Crystal Lake, 20 miles south
of Petersburg. These facilities raise Chinook, coho, and chum salmon for on-site releases, as well as for transfer
to remote release sites in Kendrick Bay/McLean Arm, Nakat Inlet, Anita Bay, City Creek, and Neck Lake.
SSRRA has absorbed additional hatcheries and release sites run by other organizations in recent years. In 2014,
SSRAA took over the Deer Mountain Hatchery in Ketchikan formerly run by the Ketchikan Tribal Hatchery
Corporation. Chinook salmon reared at Deer Mountain are released at a remote Carroll Inlet release site and in
Ketchikan Creek near downtown Ketchikan. In 2016, SSRAA took over operations of the Klawock River and Port
Saint Nicholas hatcheries previously run by the Prince of Wales Hatchery Association (POWHA). POWHA’s
system included a release site at Port Asumcion that SSRAA now operates and is targeting for additional
releases.
As shown in Table 1 below, Neets Bay accounts for 50 percent of all SSRAA releases, and the largest releases of
chum, Chinook, and coho. After Neets Bay, the most important release sites are Kendrick Bay/McLean Arm,
Anita Bay, Nakat Inlet, and Burnett Inlet. Other release sites account for less than 5 percent of total releases.
Economic Impacts of the Southern Southeast Regional Aquaculture Association McDowell Group Page 7
Table 1. Number of Smolts Released, by Release Site and Species, 2013-2017 Averages
Release Site Chinook Chum Coho Total % of Total
Neets Bay 728,760 79,251,800 3,995,340 83,975,900 50%
Kendrick Bay/McLean Arm 29,300,800 29,300,800 17%
Anita Bay 454,460 22,263,600 504,300 23,222,360 14%
Nakat Inlet 14,336,600 525,000 14,861,600 9%
Burnett Inlet 9,690,000 185,420 9,875,420 6%
Klawock 4,480,000 4,480,000 3%
Neck Lake 1,763,600 1,763,600 1%
Whitman Lake 638,200 352,500 990,700 1%
Crystal Lake 635,830 131,820 767,650 0%
Carroll Inlet 365,000 365,000 0%
City Creek 98,000 98,000 0%
Deer Mountain 70,000 70,000 0%
Port St. Nicholas 89,000 89,000 0%
Total 3,079,250 154,842,800 11,937,980 169,860,030
Source: SSRAA. Note: Releases from the Klawock and Port St. Nicholas hatcheries (new to SSRAA) reflect 2017 production. In addition, releases for newer programs from Deer Mountain/Carroll Inlet and City Creek reflect 2017 production.
Map of SSRAA Hatcheries and Release Sites

Economic Impacts of the Southern Southeast Regional Aquaculture Association McDowell Group Page 8
Species Produced
Chum salmon constitute SSRAA’s largest production effort and expected return. Chum fry are produced at the
Whitman Lake, Burnett Inlet, and Neets Bay facilities. Chum are released on-site at the Neets Bay and Burnett
Inlet hatcheries and at remote sites in Kendrick Bay/McLean Arm, Nakat Inlet, Anita Bay, and Port Asumcion
(first release in 2018). Chum are primarily targeted by drift gillnet and purse seine fisheries in Clarence and
Sumner Straits. A total of 169 million chum smolts were released by SSRRA in 2017.
Since 2013, SSRAA contributions to common property commercial chum harvests have ranged from 1.4 million
fish in 2014 to 3.3 million fish in 2015, with a 2013-2017 average harvest of 2.1 million fish.
Coho salmon are produced primarily at the Whitman Lake hatchery, as well as at the Neets Bay and Klawock
River hatcheries. In addition to hatchery releases, coho are released remotely from Anita Bay, Nakat Inlet, a large
enhancement project at Neck Lake, and other sites. Coho are primarily targeted by trollers region-wide, and by
drift gillnetters and sport fishermen in Sumner and Clarence Straits and the Ketchikan area. A total of 12.4 million
coho smolts were released by SSRAA in 2017.
Recent commercial harvest of SSRAA coho has ranged from 190,000 fish in 2017 to 477,000 fish in 2014, with a
2013-2017 annual average of 304,600 fish.
Chinook salmon are mainly produced at SSRAA’s Crystal Lake hatchery under contract with the ADF&G Sport
Fish Division, as well as at the Whitman Lake, Neets Bay, and Port Saint Nicholas facilities. The fish are released
on-site at the three facilities, from Neets Bay, and remotely from various sites. SSRAA Chinook are primarily
targeted by troll and sport fleets near Ketchikan. A total of 2.9 million Chinook smolts were released in 2017.
Since 2013, SSRAA contributions to Chinook commercial harvests ranged from 22,700 fish in 2017 to 48,000 fish
in 2015, with a 2013-2017 average harvest of 35,400.
SSRAA’s sockeye salmon programs (primarily in support of restoration projects) have been phased out and the
last SSRAA sockeye returns were seen in 2013 and 2014.

Economic Impacts of the Southern Southeast Regional Aquaculture Association McDowell Group Page 9
SSRAA Salmon in Commercial Fisheries
This section includes an overview of SSRAA’s contributions to commercial salmon harvests in SSE, including
harvest volume and harvest value. SSRAA-produced salmon that are caught outside of districts 1 through 8 are
not included in these estimates. SSRAA fish are harvested outside of the SSRAA region, including other parts of
Alaska and in British Columbia waters to the south, but not in sufficient numbers to warrant the additional
sampling efforts that would be required to estimate SSRAA’s contributions to harvests in these areas. The
estimates presented below should be considered conservative.
Commercial Harvest of SSRAA Salmon
SSRAA-produced salmon contribute significantly to the commercial harvest of salmon in SSE. Since 2008, SSRAA
contributed over 210 million pounds of salmon worth an ex-vessel value of $175 million to common property
fisheries. During the record year of 2012, SSRAA contributed nearly 40 million pounds in ex-vessel volume.
Figure 1. SSRAA Salmon Harvest Volume and Value, Common Property Fisheries, 2008-2017
Source: McDowell Group estimates. Data from ADF&G and SSRAA.
Between 2013 and 2017, SSRAA contributed an average of 22 million pounds annually and a total of 110 million
pounds of salmon to common property fisheries. On average, chum made up 89 percent of the volume during
this five-year period, averaging 19.5 million pounds per year.
Table 2. SSRAA Salmon Common Property Harvest Volume (000s of pounds), 2013-2017
Species 2013 2014 2015 2016 2017 2013-2017
Average
2013-2017
Percent of Total
Chum 14,695 13,627 28,833 20,728 19,826 19,542 89%
Coho 2,044 3,530 1,379 2,343 993 2,058 9%
Chinook 527 550 567 330 280 451 2%
Total 17,266 17,708 30,779 23,400 21,098 22,050
Source: McDowell Group estimates based on data from SSRAA and ADF&G.
$-
$5,000,000
$10,000,000
$15,000,000
$20,000,000
$25,000,000
$30,000,000
$35,000,000
$40,000,000
$45,000,000
-
5,000,000
10,000,000
15,000,000
20,000,000
25,000,000
30,000,000
35,000,000
40,000,000
45,000,000
2008 2009 2010 2011 2012 2013 2014 2015 2016 2017
Volume (pounds) Value ($)

Economic Impacts of the Southern Southeast Regional Aquaculture Association McDowell Group Page 10
The value of SSRAA salmon to the region’s commercial fisheries has trended up over the last decade, due to
higher prices – particularly for chum roe – and increased production and returns. Between 2013 and 2017,
earnings of commercial fishermen attributable to SSRAA fish totaled $84 million for an annual average of $16.8
million. The high during this period was $18.6 million in 2015 and 2017 and the low was $13.8 million in 2013.
As mentioned previously, chum is the leading SSRAA-produced salmon. In 2017, chum salmon accounted for
$15.9 million in ex-vessel value, followed by coho ($1.5 million), and Chinook ($1.2 million).
By gear type, SSRAA salmon harvest value is typically dominated by the seine fleet. During the 2013-2017 period,
an estimated 46 percent of the value of commercially-harvested SSRAA fish went to seiners, 32 percent to
gillnetters, and 21 percent to trollers.
Table 3. Commercial Ex-Vessel Value of SSRAA Salmon ($000s), 2013-2017
2013 2014 2015 2016 2017 2013-2017 Average
2013-2017
Percent of Total
By Species
Chum 8,971 8,917 15,940 13,010 15,887 12,545 75
Coho 3,025 4,714 1,135 3,360 1,547 2,756 16
Chinook 1,792 1,808 1,567 1,202 1,202 1,514 9
By Gear Type
Purse Seine 5,498 5,859 10,206 8,567 8,886 7,803 46
Gillnet 4,703 5,367 6,176 5,089 5,882 5,443 32
Troll 3,604 4,215 2,260 3,917 3,868 3,573 21
Total 13,805 15,441 18,641 17,572 18,636 16,819
Source: McDowell Group estimates based on data from SSRAA and ADF&G. Note: 2013 and 2014 totals include a small amount of sockeye returns that are not specifically broken out. In addition, totals may not sum due to rounding.
SSRAA Harvest Value in Relation to Overall Southern Southeast Harvests
Over the last 10 years, SSRAA has contributed 19 percent of the volume and 28 percent of the value of SSE
common property salmon harvests. SSRAA’s relatively strong value role is attributed to the production focus on
relatively low-volume, mid-value chum salmon, and on high-value Chinook and coho.
SSRAA’s relative contribution is influenced by year to year variations in wild pink salmon abundance. Peak
contributions – over 40 percent of the harvest value in 2017, for instance – occur in years with low pink salmon
abundance. In years with near record pink salmon abundance, such as 2013, SSRAA contributed 13 percent of
regional salmon harvest value.
By gear group, SSRRA’s relative contribution is greatest for the SSE gillnet and troll fleets (43 percent of harvest
value from 2008 through 2017), followed by the seine fleet (20 percent). By species, SSRAA is responsible for
over half of chum harvests (57 percent from 2008 through 2017), 39 percent of Chinook harvests, and 31 percent
of coho harvests.

Economic Impacts of the Southern Southeast Regional Aquaculture Association McDowell Group Page 11
Geographic Distribution of Commercial Harvest Value
Among commercial fishermen, Alaska residents are the primary beneficiaries of SSRAA-produced salmon,
earning three-fifths ($9.9 million) of the average annual ex-vessel value from 2013 through 2017.
Among Alaskans, ex-vessel benefits of SSRAA salmon are concentrated in SSE. Permit holders residing in the
Petersburg-Wrangell area earned $3.7 million in ex-vessel value from SSRAA fish, accounting for 37 percentage
of ex-vessel value to Alaska residents. They were followed by Ketchikan Gateway Borough residents, with 29
percent ($2.9 million); Prince of Wales residents at 25 percent ($2.5 million); Sitka area residents at 4 percent;
and other Alaska residents, with approximately 4 percent of the total resident harvest value.
Figure 2. Geographic Distribution of SSRAA Ex-Vessel Value to Alaska Residents, 2013-2017 Average
Source: McDowell Group calculations based on data from CFEC and SSRAA. Note: Chart only shows income to Alaska residents.
37%, $3,682,300
29%, $2,842,400
25%, $2,482,200
4%, $369,500
2%, $243,700
2%, $240,100
P E T E R S B U R G A N D W R A N G E L L
K E T C H I K A N
P R I N C E O F W A L E S
S I T K A
J U N E A U
O T H E R A L A S K A

Economic Impacts of the Southern Southeast Regional Aquaculture Association McDowell Group Page 12
SSRAA Salmon and the Processing Sector
The commercial harvest of SSRAA salmon generates significant benefits for Southeast Alaska’s seafood
processing industry, as indicated by its first wholesale value. First wholesale value is the most complete measure
of economic activity associated with the salmon industry in Southeast Alaska. It is defined as the price received
at sale of product by a processor to a buyer outside their affiliate network.
First wholesale value includes payments to commercial fishermen (ex-vessel value) and reflects the full spectrum
of processor expenditures on goods and services associated with converting whole fish to a salable food
product. This includes processing labor, local utilities, packaging and warehousing, and an array of support-
sector activity associated with processing, such as tender vessel operations, expediting, maintenance and
mechanical services, and processors' profit.
Estimates of the first wholesale value derived from SSRAA salmon in 2017 are based on preliminary data.
Role of SSRAA Fish in Seafood Processing Sector
A key benefit of SSRAA fish is providing stable chum returns to processors to balance out volatility in other
species, especially pink salmon. Together, chum and pink salmon account for over half of the first wholesale
value of all seafood species caught and processed in Southeast Alaska (which species is most important varies
from year to year). While wild-stock pink salmon returns fluctuate significantly from year to year, hatchery-bred
chum salmon provide a stable source of income for processors and harvesters.
From 2013 to 2017, the cumulative wholesale value of SSRAA salmon was $239 million, including $49 million
derived from sales of cost recovery salmon and $190 million from common property salmon. Annually, first
wholesale value averaged $48 million during the study period. By species, chum accounted for more than three-
fourths (79 percent) of the wholesale value of SSRAA fish, followed by Chinook (14 percent), and coho (7
percent).
Less the cost of fish, processors earned an estimated gross margin of $134 million on SSRAA fish during the
five-year study period. This amount reflects the total value added to SSRAA salmon by regional seafood
processors.

Economic Impacts of the Southern Southeast Regional Aquaculture Association McDowell Group Page 13
Figure 3. First Wholesale Value of SSRAA Salmon, Chum Roe versus all other Products, 2013-2017
Source: McDowell Group estimates based on data from SSRAA, ADF&G, and DOR.
As evidenced by the data in Figure 3, chum roe is a major driver of the value of SSRAA production. Chum roe
products represented close to half (45 percent) of the SSRAA-generated wholesale value between 2013 and
2017. More information on market trends for chum roe and other key products is provided in the last section
of this report.
$-
$10,000,000
$20,000,000
$30,000,000
$40,000,000
$50,000,000
$60,000,000
$70,000,000
2013 2014 2015 2016 2017
All Other Salmon Products Chum Roe

Economic Impacts of the Southern Southeast Regional Aquaculture Association McDowell Group Page 14
SSRAA Salmon in Sport Fisheries
In addition to SSRAA’s importance to SSE commercial fisheries, sport harvest of SSRAA salmon has a significant
impact on the region’s economy. Resident anglers who target SSRAA fish spend money on boats, fishing gear,
fuel, and supplies, while non-resident anglers often hire local charter fishing companies that source many
supplies locally and provide jobs to local residents.
Based on data provided by SSRAA, sport fishermen harvested an estimated 15,865 Chinook and 140,684 coho
salmon produced by the aquaculture association between 2013 and 2017. The average annual Chinook and
coho harvest was approximately 3,150 and 28,150 fish, respectively, during this time period.
Table 4. Southern Southeast Sport Harvest of SSRAA Salmon (number of fish), by Species, 2013-2017
2013 2014 2015 2016 2017 2013-2017 Average
Chinook 2,080 1,750 4,612 2,732 4,691 3,150
Coho 19,970 50,567 38,798 9,742 21,607 28,150
Source: SSRAA estimates. Note: Averages rounded to the nearest 50.
Data from ADF&G’s annual Statewide Harvest Survey for areas A (Ketchikan), B (POW), and C (Petersburg/
Wrangell/Kake) indicate overall catches in the region averaged 28,300 Chinook and 144,200 coho annually from
2013-2016. Data for 2017 was not available at the time of this report.
Table 5. Total Chinook and Coho Salmon Sportfish Harvest by Statewide Harvest Survey Area, 2013-2016 Averages
Area Chinook Coho
Ketchikan (A) 10,200 50,850
Prince of Wales Island (B) 12,900 80,100
Petersburg, Wrangell & Kake (C) 5,200 13,250
Southern Southeast (A, B & C) 28,300 144,200
Source: ADF&G 2014 Statewide Harvest Survey.
SSRAA’s contribution to the overall SSE sport harvest averaged 11 percent of Chinook and 20 percent of coho
harvests, based on 2013-2016 data. As shown in Table 6, there is substantial variation year to year.
Table 6. SSRAA Salmon, as a Percent of Total Southern Southeast Sport Harvest, 2013-2016
2013 2014 2015 2016 2013-2016 Average
Chinook 9 5 15 10 11
Coho 12 33 25 10 20
Source: ADF&G and SSRAA.

Economic Impacts of the Southern Southeast Regional Aquaculture Association McDowell Group Page 15
SSRAA’s role in the sportfishing sector is especially prominent in the Ketchikan area. ADF&G’s creel survey data
indicates that roughly a third of the Chinook salmon caught in the Ketchikan area are typically SSRAA-produced
fish, along with about 13 percent of the sport coho harvest.1
Similar data for the Petersburg/Wrangell/Kake area indicate roughly a quarter and a tenth of the sport harvest
of Chinook and coho, respectively, near those communities was SSRAA fish. For the west coast of Prince of
Wales Island (POW), creel data indicates roughly 2 to 5 percent of Chinook and coho harvests were SSRAA fish.
These numbers were provided by ADF&G staff but are not regularly published and are presented as reference
points to understand the relative importance of SSRAA fish in sport harvests throughout the region.2
Charter Fleet Harvest of SSRAA Salmon
ADF&G charter vessel logbook data indicates that approximately 324 charter vessels offloaded in SSE ports in
2014 (the most recent data available). Of these, 146 offloaded in the Ketchikan area, 145 in POW ports, 26 in
Petersburg, and 7 in Wrangell.3 Vessels may operate out of multiple ports, and totals reflect an unknown, but
likely minor, amount of double counting.
Table 7. Southern Southeast Charter Vessels, by Port of Offloading, 2014
SWHS Area Port of Offloading # of Vessels
A Ketchikan 146
B Prince of Wales Island 145
C Petersburg 26
C Wrangell 7
Total SSE 324
Source: ADF&G Saltwater Log Books, 2014 Note: Total may include some double counting.
Combined, charter vessels in SSE completed a total of 14,994 trips and supported 59,680 angler-days in 2014.
Over 96 percent of angler days reflect non-residents. These fishermen harvested over 18,000 Chinook and
88,000 coho in 2014, representing 57 and 58 percent respectively, of the overall SSE sport harvest of these
species that year.
The primary impact of SSRAA salmon for the Ketchikan charter industry occurs in the early Chinook season (May
and June) and during the late coho run (late August through September). In May and June, the full-day and
half-day charter fleet (primarily serving cruise visitors) is largely dependent on SSRAA Chinook returning to
nearby release sites including Whitman Lake and Neets Bay. This is especially true in Summer 2018 due to low
wild Chinook returns.
1 The ADFG creel survey is based on a stratified random sampling at fishery landing locations. Not all times of day and landing locations are sampled each day. Surveys end in mid-September. 2 Personal communication with Mike Jaenicke, ADF&G. 3 ADF&G, 2016. Participation, Effort, and Harvest in the Sport Fish Business/Guide Licensing and Logbook Programs, 2014. Fishery Data Series No. 16-02.

Economic Impacts of the Southern Southeast Regional Aquaculture Association McDowell Group Page 16
Economic Impacts of SSRAA Production and Operations
SSRAA has a wide array of economic impacts in Southeast Alaska through its contributions to commercial
fishing, seafood processing, sportfishing, and its own operations. Commercial fishermen earn income from the
harvest of SSRAA-produced fish and purchase fuel, food, gear, and many other supplies in support of their
fishing efforts. Seafood processing companies employ hundreds of workers and purchase goods and services
as they add value to SSRAA salmon. SSRAA operations directly generate additional economic impacts through
wages for its own employees and through purchases of goods and services in Ketchikan and other SSE
communities. This spending cycles through the regional and local economies, creating indirect and induced
economic “multiplier” effects.
As described in more detail below, SSRAA’s 2017 production and operations spurred economic output in
Southeast Alaska totaling $65 million, an economic footprint that included 640 jobs and $30 million in labor
income, including all multiplier effects. Specific contributions from commercial fishing, seafood processing,
sportfishing, and SSRAA operations are outlined in this chapter.
Commercial Fishing Economic Impacts
Over the 2013 to 2017 period, commercial fishermen harvested SSRAA salmon with an annual average ex-vessel
value of $16.8 million. A portion of this total ex-vessel value becomes pay for permit holders and crew, with the
rest spent on the goods and services necessary to conduct commercial fishing operations. Both of these
components of ex-vessel value fuel economic activity in the region’s support sector.
Commercial fishing-related labor income: Based on McDowell Group estimates, about 50 to 60 percent
(depending on gear type) of commercial salmon fishing ex-vessel value becomes labor income or net pay for
permit holders and crew. Based on these and other estimates, SSRAA-related labor income earned by skippers
and crew averaged $10.1 million over the 2013 to 2017 period.
As commercial fishermen spend their income in support of their households, “induced” employment and wages
are generated.
Additional employment and labor income is created in the region as fishermen make purchases in support of
their fishing business. An estimated $3.8 million in in-region purchases are made annually in support of
commercial fishing targeting SSRAA salmon, assuming roughly 60 percent of spending is in-region. Jobs and
wages created by this spending are termed “indirect” economic impacts. This estimate factors in non-resident
participation in the commercial harvest of SSRAA salmon.
McDowell Group modeling of indirect and induced effects indicates that commercial fishing for SSRAA salmon
produced $13.7 million in labor income, including direct, indirect, and induced impacts. This includes
commercial fishing income earned in Southeast Alaska, and related multiplier effects in the regional economy.

Economic Impacts of the Southern Southeast Regional Aquaculture Association McDowell Group Page 17
Commercial fishing related employment: Measuring commercial salmon fishing employment in terms of full-
time equivalents or monthly averages is difficult due to the highly seasonal nature of the fishery. However, it is
useful to do so to provide a measure of relative importance. While several hundred skippers and crew harvest
SSRAA-produced salmon, a measure of annual average equivalency places employment at 140 jobs. As
described above, spending by fishermen in support of their fishing activity and households has multiplier effects,
creating additional jobs and income. Including those multiplier effects, commercial harvest of SSRAA salmon
accounted for an average of 230 jobs (including 140 direct jobs and 90 support sector jobs).
Table 8. Economic Impact of Commercial Harvest of SSRAA-Produced Salmon
Direct Indirect/Induced Total
Employment 140 90 230
Labor Income $10.1 million $3.6 million $13.7 million
Source: McDowell Group estimates
Seafood Processing Economic Impacts
Over the 2013 to 2017 period, the total first wholesale value of all SSRAA salmon averaged $47.9 million,
including the value of cost recovery production. Components of that total value include $24.6 million in
payments to fishermen for their catch and payments to SSRAA for cost recovery fish, an estimated $7.4 million
in wages paid to processing employees, and $5.6 million in local purchases of goods and services in support of
processing operations.
Direct employment related to processing of SSRAA salmon is estimated at 200 jobs in the SSE region. This is an
annualized figure. The number of individual workers who earn some income from processing SSRAA salmon is
much higher. Processing employment data for Ketchikan illustrates the relationship between annualized
employment and peak employment. In 2016, for example, seafood processing accounted for 341 jobs in
Ketchikan, averaged over all 12 months of the year. Peak employment (in August) totaled 968 jobs.
Similar to commercial fishing, there are indirect and induced (multiplier) effects associated with processor
spending and employee spending in the local economy. The analysis of multiplier effects requires adjustments
for non-resident participation in the seafood processing workforce. Non-resident workers spend less in the
local economy than their resident co-workers and therefore have a lower multiplier impact. In the SSE region,
non-residents account for about 70 percent of the jobs and 65 percent of the wages in seafood processing.
Based on McDowell Group modeling, a total of 310 jobs and $11.6 million in annual labor income are linked to
processing of SSRAA salmon, including all direct, indirect, and induced effects.
Table 9. Economic Impact of Processing of SSRAA-Produced Salmon
Direct Indirect/Induced Total
Employment 200 110 310
Labor Income $7.4 million $4.2 million $11.6 million
Source: McDowell Group estimates

Economic Impacts of the Southern Southeast Regional Aquaculture Association McDowell Group Page 18
Sportfishing Economic Impacts
Sport fish harvests of SSRAA Chinook and coho salmon also contribute significantly to the SSE economy. Direct
economic impacts from the SSRAA sport fishery include non-resident spending in the region on guided fishing
tours, boat rentals, fishing gear, bait, food, lodging, and transportation. Economic impacts resulting from
resident sportfishing is not quantified for this report, as discussed in more detail below.
Based on the findings of previous McDowell Group studies and data from ADF&G and SSRAA, the study team
estimated annual non-resident spending on sportfishing in the SSE region. SSRAA’s percentage of the sport
harvest, along with other data, was used to translate overall spending to spending attributable to SSRAA-
produced salmon – estimated at $3.3 million in 2014. That figure, adjusted for inflation, is assumed to be a
reasonable estimate for 2017.
In 2017, the regional economic impact of non-resident sport harvest of SSRAA salmon included 60 annual
equivalent jobs and $2.2 million in labor income, including all direct and multiplier effects.
Resident sportfishing has a significant impact on the region’s economy. Millions of dollars are spent each year
on boats, fishing gear, fuel, bait, tackle, repairs and maintenance services, and harbor and ramp fees.
Unfortunately, no reliable data is available on resident spending on sportfishing and an analysis of impacts
resulting from resident sportfishing is outside the scope of this project.
Economic Impacts of SSRAA Operations
In 2017, SSRAA employed an average of 60 workers who earned a total of $3.3 million in wages. Additionally,
the organization purchased supplies and services for its operations in Ketchikan (and its various hatcheries and
release sites) which contributed to the regional economy. In state expenditures totaled $3.6 million for 2017.
The indirect and induced economic impact of employee spending and SSRAA spending on supplies and services
is estimated at 20 jobs and $800,000 in labor income. Based on those estimates, SSRAA operations impact
totaled 81 jobs and $4.1 million in labor income, including direct, indirect, and induced impacts.
Table 10. Economic Impact of SSRAA Operations
Direct Indirect/Induced Total
Employment 60 20 80
Labor Income $3.3 million $0.8 million $4.1 million
Source: McDowell Group estimates

Economic Impacts of the Southern Southeast Regional Aquaculture Association McDowell Group Page 19
Summary of Economic Impacts
The total economic impact of SSRAA, including jobs and income related to commercial fishing, seafood
processing, non-resident sportfishing, and from SSRAA’s own spending and employment, is estimated at 680
jobs and $32 million in labor income.
Table 11. Economic Impact of SSRAA, Including Direct, Indirect, and Induced Impacts, 2017
Commercial Fishing
Seafood Processing
Nonresident Sportfishing
SSRAA Operations
Total Impacts
Employment 230 310 60 80 680
Labor Income $13.7 million $11.6 million $2.2 million $4.1 million $32 million
Source: McDowell Group estimates
Output is a measure of total economic activity, including all labor income, spending on supplies and services,
and all related multiplier effects. Economic output associated with SSRAA and the salmon it produces totaled
approximately $70 million in 2017.
Realized and Expected Production Increases
The economic impact analysis presented in this report is based on average SSRAA salmon returns (and resulting
harvest volumes and values) over the 2013 to 2017 period. These returns are the result of releases three to six
years earlier, depending on the species.
SSRAA has seen increased releases in the last few years due to increased chum production and the incorporation
of the Klawock River Hatchery previously operated by the Prince of Wales Hatchery Association. These recent
additional releases have not yet translated into increased harvests and are not reflected in the ex-vessel value
and first wholesale value numbers presented in this report. (On the other hand, the operating expenses
associated with running these additional programs are included in the economic impact calculations in this
report, as the SSRAA operations analysis is based on 2017 financial statements and vendor data.)
In addition to recent increases, additional production has been planned and permitted and can be expected to
be realized by 2020. Compared to the production years that resulted in the 2017 harvests, the following
increases are expected by 2020:4
• 30 percent increase in summer chum production
• 16 percent increase in fall chum production
• 45 percent increase in fall coho production
• 12 percent increase in Chinook production.
4 Based on data provided by SSRAA.

Economic Impacts of the Southern Southeast Regional Aquaculture Association McDowell Group Page 20
To put these increases in perspective, summer chum is anticipated to constitute 79 percent of total releases in
2020, followed by fall chum (14 percent), fall coho (4 percent), summer coho (1 percent), and Chinook (1
percent).
Translating increased production into increased economic impacts is challenging due a variety of factors. A
point of reference can be calculated based on assuming a conservative 25 percent increase in overall releases
and a similar increase in average ex-vessel volumes and values by 2025. A roughly 25 percent increase over
2013-2017 averages would result in ex-vessel values to commercial fishermen of $21 million by 2025 (an
additional $4.2 million). The economic output resulting from these additional increases would likely not increase
at the same rate, but an increase of 20 percent would bring the total economic output associated with SSRAA
to $84 million.

Economic Impacts of the Southern Southeast Regional Aquaculture Association McDowell Group Page 21
Tax Revenue Associated with SSRAA Salmon
Fisheries Business Tax
All salmon commercially harvested and processed in Southeast Alaska, including SSRAA-produced common
property and cost recovery fish, are subject to a 3 percent Fisheries Business Tax paid by commercial seafood
processors. Revenue from the Fisheries Business Tax is shared equally between the State of Alaska and the city
or borough where the fish were landed.
From 2013 through 2017, the estimated Fisheries Business tax receipts derived from SSRAA salmon totaled $3
million, with an annual average of $507,000. Half of these receipts are shared with local governments where the
fish was landed. In SSE, most of the local government revenue impacts of the Fisheries Business Tax will be felt
in Ketchikan, Wrangell, and Petersburg due to the location of major salmon processing plants.
Local Taxes
Regional spending resulting from SSRAA production and operations also leads to substantial tax revenue to
local governments, including sales, property, and bed tax revenue. These revenues occur as a result of spending
in all sectors directly and indirectly impacted by SSRAA. Estimating these local tax impacts is beyond the scope
of this study.

Economic Impacts of the Southern Southeast Regional Aquaculture Association McDowell Group Page 22
Market Trends
Chum Market Trends
Market trends have significant implications for SSRAA and the commercial fleet harvesting SSRAA-sourced fish.
Changes to the value of chum are particularly relevant as the species is the primary focus of the hatchery
association and the species usually accounts for about 80 percent of the average first wholesale value of
products made with SSRAA salmon.
Southeast Alaska chum salmon prices to fishermen averaged $0.74 per pound from 2008 through 2017 – more
than double the average over the preceding decade. Prices peaked at close to a dollar per pound in 2011, after
which they dropped to $0.59 a pound in 2015 and then rebounded to $0.86 by 2017. Preliminary 2018 prices
appear to be comparable or higher than 2017.
Roe value is a key driver of chum prices, generally contributing close to 50 percent or more of the total wholesale
value of the species to processors. Prices reported to DOR and published in the department’s Alaska Salmon
Price Reports include all types of chum roe combined. Based on this dataset, chum roe prices in Southeast
Alaska peaked at over $20 a pound in Fall 2012. More recently, chum roe has been selling at wholesale prices
in the $15 to $17 range.
Prices paid to Southeast Alaska processors for frozen headed and gutted (H&G) chum have also risen steadily
– from around $0.59 in 2004 to $1.69 in 2017. Similar to chum roe, frozen H&G prices peaked in 2012 at $2.01
a pound.
After frozen H&G and roe products – which each provide comparable total revenues to Southeast processors –
the next most import product form is frozen fillets. In 2015 (the year with the most complete data), frozen fillets
made up 7 percent of total chum product sales reported by Southeast processors. Prices reported for frozen
fillets followed similar trends to other chum products, with a 2017 price of $3.55.
Prices in 2018 are expected to be favorable due to lower than average production in Japan (a leading chum
producer), relatively high farmed salmon prices, and lower run forecasts for 2018.
Coho Market Trends
Average Southeast Alaska coho salmon prices to fishermen rose above $1 a pound starting in 2006, only
dropping below that milestone in one subsequent year (2015 saw an average price of $0.91 a pound). Over the
last ten years, the ex-vessel price averaged $1.34 a pound and has been as high as $1.64 (2008). In 2017,
Southeast Alaska fishermen received an average price of $1.55 a pound, the second highest on record.
First wholesale prices also hit near record highs in 2017, continuing a steady trend of increasing prices. Frozen
H&G coho prices hit $3.45 a pound in 2017, the second highest on record (2013 saw prices of $3.60 a pound).

Economic Impacts of the Southern Southeast Regional Aquaculture Association McDowell Group Page 23
Frozen Southeast Alaska coho fillets went for as much as $6.39 a pound last year, also the second highest on
record and up from $3.58 in 2004.
Based on production data reported to the Alaska Department of Revenue (Alaska Salmon Price Reports), frozen
H&G products made up 44 percent of revenue from coho salmon, followed by frozen fillets (27 percent), and
fresh H&G (24 percent). Roe made up only 4 percent.
Chinook Market Trends
Chinook salmon ex-vessel prices to Southeast Alaska fishermen have climbed steadily over the last decade.
Previously averaging around $2 a pound (from 1984 through 2007), the last decade saw average ex-vessel prices
of $4.82. In 2017 – a year with low harvest volumes – fishermen received an all-time high of $7.44 a pound. Due
to strong demand and limited supply, preliminary 2018 ex-vessel prices are even higher than 2017.
Wholesale prices also hit peaks in 2017. Frozen filet prices averaged $14.94 a pound in 2017, up from $11.73
the previous year and $8.45 in 2015. Fresh H&G Chinook prices averaged $9.70 a pound in 2017, up 50 percent
over 2016 prices and 25 percent over 2008. Roughly half of Chinook wholesale value derives from sales of frozen
fillets (49 percent in 2017), followed by fresh H&G (28 percent), and frozen H&G (22 percent).