economic impacts of xylella fastidiosa on the australian...
TRANSCRIPT
Economic impacts of Xylella fastidiosa on the Australian wine grape and wine-making industries Ahmed Hafi, Lucy Randall, Tony Arthur, Donkor Addai, Philip Tennant and Jay Gomboso
Research by the Australian Bureau of Agricultural and Resource Economics and Sciences
Research Report 17.13 November 2017
© Commonwealth of Australia 2017
Ownership of intellectual property rights Unless otherwise noted, copyright (and any other intellectual property rights, if any) in this publication is owned by the Commonwealth of Australia (referred to as the Commonwealth).
Creative Commons licence All material in this publication is licensed under a Creative Commons Attribution 4.0 International Licence except content supplied by third parties, logos and the Commonwealth Coat of Arms.
Inquiries about the licence and any use of this document should be emailed to [email protected].
Cataloguing data Hafi, A, Randall, L, Arthur, T, Addai, D, Tennant, P & Gomboso, J 2017, Economic impacts of Xylella fastidiosa on the Australian wine grape and wine-making industries, ABARES report to client prepared for the Plant Biosecurity Division of the Department of Agriculture and Water Resources, Canberra, November. CC BY 4.0.
ISBN 978-1-74323-365-8 ISSN 1447-8358
ABARES project 43609 Internet This publication is available at agriculture.gov.au/abares/publications.
Australian Bureau of Agricultural and Resource Economics and Sciences (ABARES) Postal address GPO Box 858 Canberra ACT 2601 Switchboard +61 2 6272 3933 Email [email protected] Web agriculture.gov.au/abares
Disclaimer The Australian Government acting through the Department of Agriculture and Water Resources, represented by the Australian Bureau of Agricultural and Resource Economics and Sciences, has exercised due care and skill in preparing and compiling the information and data in this publication. Notwithstanding, the Department of Agriculture and Water Resources, ABARES, its employees and advisers disclaim all liability, including for negligence and for any loss, damage, injury, expense or cost incurred by any person as a result of accessing, using or relying on information or data in this publication to the maximum extent permitted by law.
Acknowledgements The authors would like to thank staff in the Plant Health Policy branch and the Office of the Chief Plant Protection Officer (OCPPO) in the Department of Agriculture and Water Resources for their comments and advice, in particular Cheryl Grgurinovic, Sally Troy and Sarah Hilton. The authors would also like to acknowledge contributions from Alistair Davidson and Susan Whitbread of ABARES.
Economic impacts of Xylella fastidiosa on Australian wine grape and wine-making industries
iii
Contents Summary 1
1 Introduction 4
The impacts of X. fastidiosa—previous studies 4
A case study on wine grape and wine-making industries 5
2 The Australian wine grape and wine-making industries 7
3 Estimating maximum extent of infestation 8
Climatic suitability for the X. fastidiosa pathogen 9
Presence of riparian vegetation for native vectors 11
Maximum-extent scenarios 12
Spread trajectory for vineyards with different suitability 15
4 Economic impacts at the regional level 18
Impact on the wine grape growers 18
Impact on the wine grape region 21
5 Economic impacts at the industry level 31
Economic impacts on the wine grape industry 31
Economic impacts on the wine-making industry 33
6 Benefits of containment - case study 37
Losses if the spread is contained to the incursion region 38
Avoided losses (gross benefits) from containment 39
Net benefit from containment 40
7 Conclusions 42
Appendix A: Algebraic representation of the method used to estimate the economic impacts of X. fastidiosa 43
Modelling the impacts on the wine grape industry 43
Modelling the impacts on the wine-making industry 45
Appendix B: Wine grape Industry impacts with 2014–15 wine grape prices when all vineyards are highly suitable 47
Glossary and acronyms 48
References 49
Economic impacts of Xylella fastidiosa on Australian wine grape and wine-making industries
iv
Tables Table 1 Vineyard replanting response and financial impact based on profitability
status 21
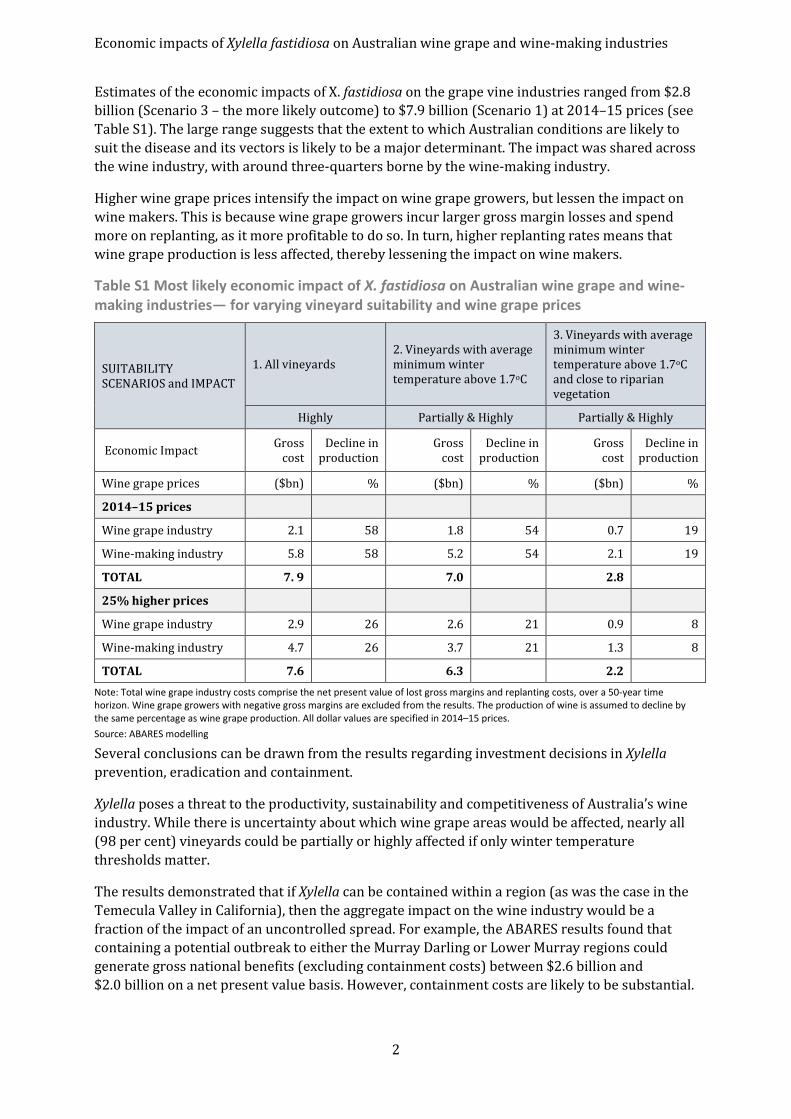
Table 2 Most likely economic impact of X. fastidiosa on Australian wine grape and wine-making industries— for varying vineyard suitability and wine grape prices 36
Table 3 Most likely economic impact of X. fastidiosa on the Murray Darling and Lower Murray wine grape regions— for varying vineyard suitability and wine grape prices 38
Figures Figure 1 Locations of vineyards in Australia 8
Figure 2 Spatial datasets identifying potential suitability of vineyards to X. fastidiosa infestation 9
Figure 3 Proportion of Australian vineyards assumed potentially suitable to X. fastidiosa infestation, by area, by scenario 13
Figure 4 Proportion of area operated in each vineyard region and corresponding degree of suitability to X. fastidiosa—Scenario 2 14
Figure 5 Proportion of area operated in each vineyard region and corresponding degree of suitability to X. fastidiosa—Scenario 3 15
Figure 6 Key elements of the impact assessment approach 18
Figure 7 Dispersion of wine grape prices in 2014–15 20
Figure 8 Breakeven wine grape prices for positive gross margins and replanting to be profitable—relative to the average price in 2014–15 22
Figure 9 Estimated production shares by vineyard profitability group for selected regions, at 2014–15 prices 24
Figure 10 Estimated production shares, by profitability group and region, at 2014–15 prices 24
Figure 11 Linking of vineyard profitability groups through suitability groups defined for different maximum-extent scenarios 25
Figure 12 Stylised impact of X. fastidiosa on vineyard gross margins 27
Figure 13 Adjustment cost path of a typical one hectare vineyard as dying vines are replaced over time 28
Figure 14 Comparison of production shares for different profitability groups of vineyards 30
Economic impacts of Xylella fastidiosa on Australian wine grape and wine-making industries
v
Figure 15 Wine grape industry impacts with 2014–15 wine grape prices, by region— Scenarios 2 and 3 32
Figure 16 Aggregate economic impacts on the wine grape industry 33
Figure 17 Economic impacts on the wine-making industry and total impact including the wine grape industry 35
Figure 18 Economic impacts on the wine grape and wine-making industries if Xylella is contained to either Murray Darling or Lower Murray region 39
Figure 19 Avoided national losses from containment of potential incursion to either the Murray Darling or Lower Murray regions 40
Figure 20 Wine grape industry impacts with 2014-15 wine grape prices when all vineyards are highly suitable, by region 47
Boxes Box 1 Definition of CLIMEX and CLIMATCH models 10
Box 2 Features of the spatial datasets used in identifying suitable vineyards 11
Box 3 Landscape scale spread rate for the X. fastidiosa strain causing citrus variegated chlorosis 17
Box 4 Rationale for choosing a 7 per cent discount rate 23
Box 5 Model indexes, parameters and variables 43
Economic impacts of Xylella fastidiosa on Australian wine grape and wine-making industries
1
Summary This study estimated the economic impacts of a hypothetical outbreak of Xylella fastidiosa on Australia’s wine grape growing and wine-making sectors.
Xylella is a bacterium that affects many plant species, including commercial crops. There is no cure for the disease, which disrupts water flow in plant xylem. Different strains cause different diseases, such as Pierce’s disease, which kills grapevines in one to five years. Sap-sucking insects transmit Xylella, in particular, the glassy-winged sharpshooter. Although the glassy-winged sharpshooter is not present in Australia, native insects could serve as vectors.
Xylella fastidiosa is not present in Australia, but is a major concern. Were it to arrive, it would be practically impossible to eradicate. Recent outbreaks in Europe prompted Australia’s biosecurity authorities to introduce emergency measures in late 2015 to reduce the risk of an incursion.
Plant Biosecurity Division of the Department of Agriculture and Water Resources requested ABARES to analyse the economic impacts of a Xylella outbreak as part of its heightened preparedness. The results will enable the Department to compare the benefits of keeping Australia Xylella-free with the costs of preventative measures and, were these unsuccessful, the costs of eradication or containment.
ABARES approached the analysis by mapping the maximum extent of an incursion. Uncertainty about habitat suitability warranted three scenarios of progressively smaller areas: all existing wine grape growing regions (Scenario 1); Scenario 1 areas with an average minimum winter temperature above 1.7°C (Scenario 2); and Scenario 2 areas that were in close proximity to riparian vegetation (Scenario 3).
Two spread rates between vineyards were adopted based on habitat suitability: 10 per cent a year (highly suitable) and 4 per cent a year (partially suitable). Vineyard suitability depended on whether minimum winter temperature was: above 4.5°C (highly suitable); between 1.7°C and 4.5°C (partially suitable); or below 1.7°C (unsuitable). In scenario 1, all vineyards were deemed highly suitable, while Scenarios 2 and 3 assumed a mix of highly and partially suitable vineyards.
The potential economic impacts for affected vineyards were assumed to comprise adjustment costs and foregone gross margins. Adjustment costs, largely replanting costs, in turn depended on expected gross margins and future wine grape prices. Three vineyard profitability groups were defined to reflect replanting decisions, those with: (i) negative gross margins; (ii) positive gross margins, but replanting is not profitable; and (iii) positive gross margins and replanting is profitable. Growers are likely to replant if they expect it to be profitable in the long run. Thus, only group (iii) makes this decision while others exit the wine grape growing industry.
The analysis also considered a scenario in which government intervenes to restrict movement of the disease between regions. Rather than assuming Xylella appears in all regions (as in the three maximum extent scenarios mentioned above), this alternative scenario reflects Xylella appearing in a region and being contained. The benefits of containment (that is, the costs avoided) were estimated for two major wine grape growing regions, Murray Darling and Lower Murray. Both offer high habitat suitability.
Given the sensitivity of replanting decisions to expected prices, two wine grape prices were used: the low prices that prevailed in 2014–15 and prices that were 25 per cent higher. Cost estimates for all scenarios were expressed in present values terms using a real discount rate of 7 per cent, with impacts developing over 50 years.
Economic impacts of Xylella fastidiosa on Australian wine grape and wine-making industries
2
Estimates of the economic impacts of X. fastidiosa on the grape vine industries ranged from $2.8 billion (Scenario 3 – the more likely outcome) to $7.9 billion (Scenario 1) at 2014–15 prices (see Table S1). The large range suggests that the extent to which Australian conditions are likely to suit the disease and its vectors is likely to be a major determinant. The impact was shared across the wine industry, with around three-quarters borne by the wine-making industry.
Higher wine grape prices intensify the impact on wine grape growers, but lessen the impact on wine makers. This is because wine grape growers incur larger gross margin losses and spend more on replanting, as it more profitable to do so. In turn, higher replanting rates means that wine grape production is less affected, thereby lessening the impact on wine makers.
Table S1 Most likely economic impact of X. fastidiosa on Australian wine grape and wine-making industries— for varying vineyard suitability and wine grape prices
SUITABILITY SCENARIOS and IMPACT
1. All vineyards 2. Vineyards with average minimum winter temperature above 1.7oC
3. Vineyards with average minimum winter temperature above 1.7oC and close to riparian vegetation
Highly Partially & Highly Partially & Highly
Economic Impact Gross cost
Decline in production
Gross cost
Decline in production
Gross cost
Decline in production
Wine grape prices ($bn) % ($bn) % ($bn) %
2014–15 prices
Wine grape industry 2.1 58 1.8 54 0.7 19
Wine-making industry 5.8 58 5.2 54 2.1 19
TOTAL 7. 9 7.0 2.8
25% higher prices
Wine grape industry 2.9 26 2.6 21 0.9 8
Wine-making industry 4.7 26 3.7 21 1.3 8
TOTAL 7.6 6.3 2.2 Note: Total wine grape industry costs comprise the net present value of lost gross margins and replanting costs, over a 50-year time horizon. Wine grape growers with negative gross margins are excluded from the results. The production of wine is assumed to decline by the same percentage as wine grape production. All dollar values are specified in 2014–15 prices. Source: ABARES modelling
Several conclusions can be drawn from the results regarding investment decisions in Xylella prevention, eradication and containment.
Xylella poses a threat to the productivity, sustainability and competitiveness of Australia’s wine industry. While there is uncertainty about which wine grape areas would be affected, nearly all (98 per cent) vineyards could be partially or highly affected if only winter temperature thresholds matter.
The results demonstrated that if Xylella can be contained within a region (as was the case in the Temecula Valley in California), then the aggregate impact on the wine industry would be a fraction of the impact of an uncontrolled spread. For example, the ABARES results found that containing a potential outbreak to either the Murray Darling or Lower Murray regions could generate gross national benefits (excluding containment costs) between $2.6 billion and $2.0 billion on a net present value basis. However, containment costs are likely to be substantial.
Economic impacts of Xylella fastidiosa on Australian wine grape and wine-making industries
3
In the United States, for example, these were around $US50 million a year in 2013 (Alston et al. 2013), implying a $0.7 billion cost over 50 years on a net present value basis.
However, ongoing measures to reduce the risk of Xylella entering Australia are likely to be more cost-effective than implementing eradication or containment programs were it to enter. International experience suggests that successful eradication is unlikely. Nonetheless, were it to enter, enhancing early detection capacity for cost-beneficial eradication would be prudent.
Prevention activities are likely to cost less than the costs and losses associated with an eradication campaign in the event of an incursion. While not estimated in this study, the losses associated with an eradication campaign would be much less than the corresponding losses of a containment program—estimated to be around $0.3 billion for the most likely scenario.
Although this study focused on the Australian wine industry, the modelling framework could be adapted to other perennial crops potentially susceptible to Xylella, including: horticultural crops (such as cherries, citrus, nuts, olives and summer fruit), amenity trees, native trees and grasses. The framework would also be suitable for analysing other diseases of perennial crops.
Economic impacts of Xylella fastidiosa on Australian wine grape and wine-making industries
4
1 Introduction Xylella fastidiosa is a plant bacterial pathogen affecting many commercial and native plant species. Different strains cause different diseases—including Pierce’s disease in grapes, phony disease in peach, leaf scorch in almond and variegated chlorosis in citrus. X. fastidiosa is found in the foregut of different types of xylem sap-feeding leafhopper insect vectors, and in water-conducting xylem vessels of host plants, where it forms biofilm believed to be responsible for disrupting the passage of water and nutrients (De La Fuente et al. 2013).
Should strains establish in Australia, X. fastidiosa could severely affect a wide variety of horticultural industries, including: cherries, citrus, nuts (almonds, macadamias and walnut), production nurseries, summer fruit and grapes (dried, table and wine). X. fastidiosa has a very broad host range, with effects in different host–pathogen strain combinations ranging from asymptomatic to lethal.
The bacterium thrives in the water-conducting system of affected plants. It is transmitted by sap-sucking vectors such as the glassy-winged sharpshooter (Homalodisca vitripennis, formerly known as H. coagulata), which feed on the xylem sap of plants, and by grafting infected propagation material onto healthy rootstocks (NSW-DPI 2016). Currently, there is no cure for the disease in any host.
The pathogen and its known vectors are not currently found in Australia despite widespread habitat suitability.
The impacts of X. fastidiosa—previous studies In a previous study by Tumber et al. (2014), Pierce’s disease was estimated to have cost the Californian grape and wine industries more than US $104 million a year in lost production and infestation management. This cost is likely to increase significantly should the glassy-winged sharpshooter, which is known to be the most efficient vector transmitting the pathogen, extend its range (Alston et al. 2013).
The presence of the glassy-winged sharpshooter significantly increases the impact of X. fastidiosa. Pierce’s disease was present in California for nearly a century before it started to cause serious economic damage to the grape and wine industries. Earlier impacts were confined to local areas in the landscape (close to riparian vegetation), limited by the ecology of native vectors, until the glassy-winged sharpshooter became established in the Temecula Valley in the late 1990s. The glassy-winged sharpshooter has been described as the most voracious feeder amongst the vectors. It can fly farther and feed on a greater variety of plants, giving it a much greater capacity to spread the disease (Alston et al. 2013). On the east coast of the United States, where the glassy-winged sharpshooter is endemic, grapes and other susceptible crops are now largely absent.
The viticultural regions in Australia are suitable for the spread of the Xylella pathogen and vectors (Hoddle 2004, Luck et al. 2001) and large impacts have been predicted, based on the similarity between many of these regions and California’s Temecula Valley (Merriman 2001). Although Australia is currently free of the glassy-winged sharpshooter, the potential exists for its native sap sucking insects such as spittlebugs to spread the pathogen.
The environment and conditions of the Temecula Valley are similar to those in the Sunraysia region in Victoria and regions near the Murray and Murrumbidgee rivers. The regions around
Economic impacts of Xylella fastidiosa on Australian wine grape and wine-making industries
5
the Murray and Murrumbidgee rivers, identified as Big Rivers and Lower Murray, produce over 56 per cent of Australia’s wine grapes (ABS 2015).
An earlier study by Monash University estimated that Pierce’s disease could cost the Australian economy around $4.2 billion over 20 years (Wittwer et al. 2006). This estimate represents a worst-case scenario, in which the disease wipes out 80 per cent of Barossa vineyards and spread to the rest of South Australia over a 20-year period.
A case study on wine grape and wine-making industries The Department of Agriculture and Water Resources (the Department) introduced emergency quarantine measures in November 2015 to reduce the likelihood of entry of X. fastidiosa and to prepare Australia in the event the pathogen and its vectors entered the country (Department of Agriculture and Water Resources 2015a, 2015b, 2016). Emergency measures targeting host species identified from X. fastidiosa-established countries were largely in response to the pathogen appearing in Europe and a short-lived detection of the glassy-winged sharpshooter in New Zealand, combined with potentially large impacts of the bacteria on key horticultural industries and the environment.
As part of the heightened preparedness, the Department’s Plant Biosecurity Division requested the Australian Bureau of Agricultural and Resource Economics and Sciences (ABARES) to provide an assessment of the economic impacts of a potential X. fastidiosa outbreak on the wine grapes and wine making industries in Australia. ABARES assessed a range of scenarios and the expected benefits to the Australian wine industry of keeping Australia free of X. fastidiosa and its vectors. Using the ABARES results, the Department will be able to compare the estimated economic benefits with the costs of preventative measures, and the costs of eradicating or containing the disease, should it establish in Australian vineyards.
In this study, an assessment is made of the likely economic impact of X. fastidiosa outbreak on the wine grape and wine-making industries, based on the establishment of the bacterium and its spread via a native insect vector.
The modelling framework used in this assessment is also one that can be adapted for Xylella and similar pathogens capable of causing tree deaths in other key perennial horticulture crops (for example, citrus greening).
Ecological and economic models are used to estimate the following components:
• the maximum areal extent of impact, based on habitat suitability and the distribution of vineyards in Australia
• the rate at which the disease would spread following its introduction—and hence how quickly the impacts would arise
• impact on individual vineyards once the disease arrives
• overall economic impacts on the wine grape industry and
• impact on the Australian wine-making industry.
Economic impacts of Xylella fastidiosa on Australian wine grape and wine-making industries
6
The analysis presented in this report considers the suitability of different wine grape growing regions for the establishment of X. fastidiosa and its vectors based on two ecological factors: average minimum winter temperature and vineyard proximity to rivers. Three maximum-extent scenarios for infestation are considered, based on variations in vineyard suitability:
• all wine grape growing areas are suitable
• suitable areas are limited by an average minimum winter temperature threshold
• suitable areas are limited by an average minimum winter temperature threshold combined with close proximity to rivers.
The subsequent economic analysis shows how the current financial position of a vineyard may influence its response to a X. fastidiosa outbreak (in terms of whether it would undergo replanting or exit the industry) and why a different response may result if wine grape prices are higher. The analysis considers different vineyard-level responses to X. fastidiosa in estimating the economic cost and the decline in wine grape production for different maximum-extent scenarios and regions. The analysis also considers the impacts on the wine-making industry by linking the reduction in wine grape production to a potential reduction in wine production, further reducing demand for non-wine grape inputs that are used in wine production.
The economic impacts estimated for the maximum extent scenarios and the case study areas of the Murray and Lower Murray regions are used to estimate the economic benefits of continued prevention, and containing the spread of Xylella and the native vectors carrying it, within the boundary of these regions, if prevention fails.
However, this study does not assess the costs of existing or other additional prevention efforts or strategies to contain Xylella to the Murray Darling and Lower Murray regions as discussed in Chapter 6.
Economic impacts of Xylella fastidiosa on Australian wine grape and wine-making industries
7
2 The Australian wine grape and wine-making industries
The wine grape industry is an important sector of the Australian economy, with an estimated gross value of production of $780 million in 2015–16 (ABARES 2016). Since 2013–14, there has been a steady increase in the gross value and area planted to wine grapes in Australia.
The wine-making industry, which uses wine grapes as the key input, sold $5 billion worth of wine in 2015–16, including export sales of $2.1 billion (Wine Australia 2017). Australian grapevine industries—which comprise grape growing, wine making and wine marketing—also generate tourism income and employment, particularly in regional communities. Wine related tourism expenditure in 2014–15 has been estimated at $9.2 billion (AgEconPlus 2015).
The Australian wine grape industry went through a boom and bust cycle over the last two and a half decades. The period between 1991 and 2007 saw growing demand for Australian wine in export markets, higher wine grape prices and increased planting (Ashton & Oliver 2015, Poddar 2015). The low Australian dollar during the 1992–94 period also contributed to the steady increase in exports and higher wine grape prices (Anderson & Aryal 2015). Further, government interventions such as the imposition in 1984 of a tax on wine sold in the domestic market provided incentives to increase exports, and financial incentives to replace old vines in the middle of 1980s contributed to increased production in the following years. The boom ended in 2007, when the growth in demand for Australian wine began to slow and the industry entered a prolonged downturn. Demand for Australian wine slowed because of the higher value of the Australian dollar and increased competition in export markets (Caboche et al. 2013; Gunning-Trant and Shafron 2012). The average wine grape price declined by 64 per cent in real terms from the record high level achieved in 2000–01 (AGWA 2016). The sharp fall in prices reduced the profitability in wine grape production, and presented a significant challenge in maintaining the financial viability of the industry (Caboche et al. 2013). The global oversupply of wine in 2014–15 also exacerbated the already depressed wine prices in the export markets and negated the positive effects of any demand side drivers (such as new demand from emerging markets) on the recovery of domestic wine grape prices.
Despite low wine grape prices since 2007, aggregate production has remained relatively unchanged over the past decade, due mainly to the fixity of investment in vines and associated infrastructure. Low prices have resulted in some vineyards selling wine grapes below variable cost of production (Berry 2015). An ABARES survey of viticulture in 2011–12 found that about 60 per cent of vineyards partly or fully relied on off-farm income (Caboche et al. 2013). The rebate on the Wine Equalization Tax has also helped small wineries to stay in business by partly offsetting the losses made in wine grape production (Anderson & Aryal 2015). The financial state of wine grape farms in Australia is likely to worsen if there is an outbreak of X. fastidiosa. The profits of all affected farms could decline further and those marginally profitable vineyards among them could find investments in replanting for dead vines unprofitable. Marginally profitable vineyards and loss-making vineyards are both expected to exit the industry.
Vineyard profitability is expected to increase in the future, if new demand for wine being created in emerging Asian markets like China and traditional markets such as the United States results in increased export demand for Australian wine and consequent higher wine grape prices. If this occurs, the economic impact on the wine grape and wine-making industries is likely to be greater. The economic impacts under this and the 2014–15 wine grape price scenario is modelled in Chapters 4 and 5.
Economic impacts of Xylella fastidiosa on Australian wine grape and wine-making industries
8
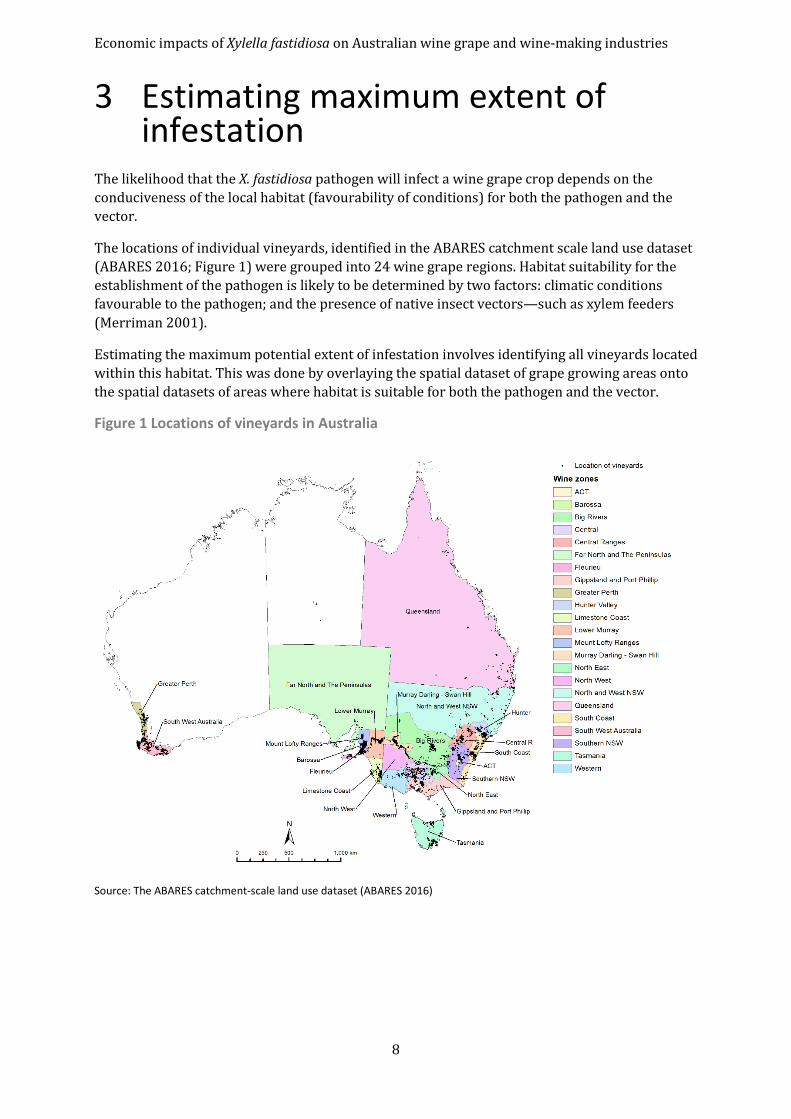
3 Estimating maximum extent of infestation
The likelihood that the X. fastidiosa pathogen will infect a wine grape crop depends on the conduciveness of the local habitat (favourability of conditions) for both the pathogen and the vector.
The locations of individual vineyards, identified in the ABARES catchment scale land use dataset (ABARES 2016; Figure 1) were grouped into 24 wine grape regions. Habitat suitability for the establishment of the pathogen is likely to be determined by two factors: climatic conditions favourable to the pathogen; and the presence of native insect vectors—such as xylem feeders (Merriman 2001).
Estimating the maximum potential extent of infestation involves identifying all vineyards located within this habitat. This was done by overlaying the spatial dataset of grape growing areas onto the spatial datasets of areas where habitat is suitable for both the pathogen and the vector.
Figure 1 Locations of vineyards in Australia
Source: The ABARES catchment-scale land use dataset (ABARES 2016)
Economic impacts of Xylella fastidiosa on Australian wine grape and wine-making industries
9
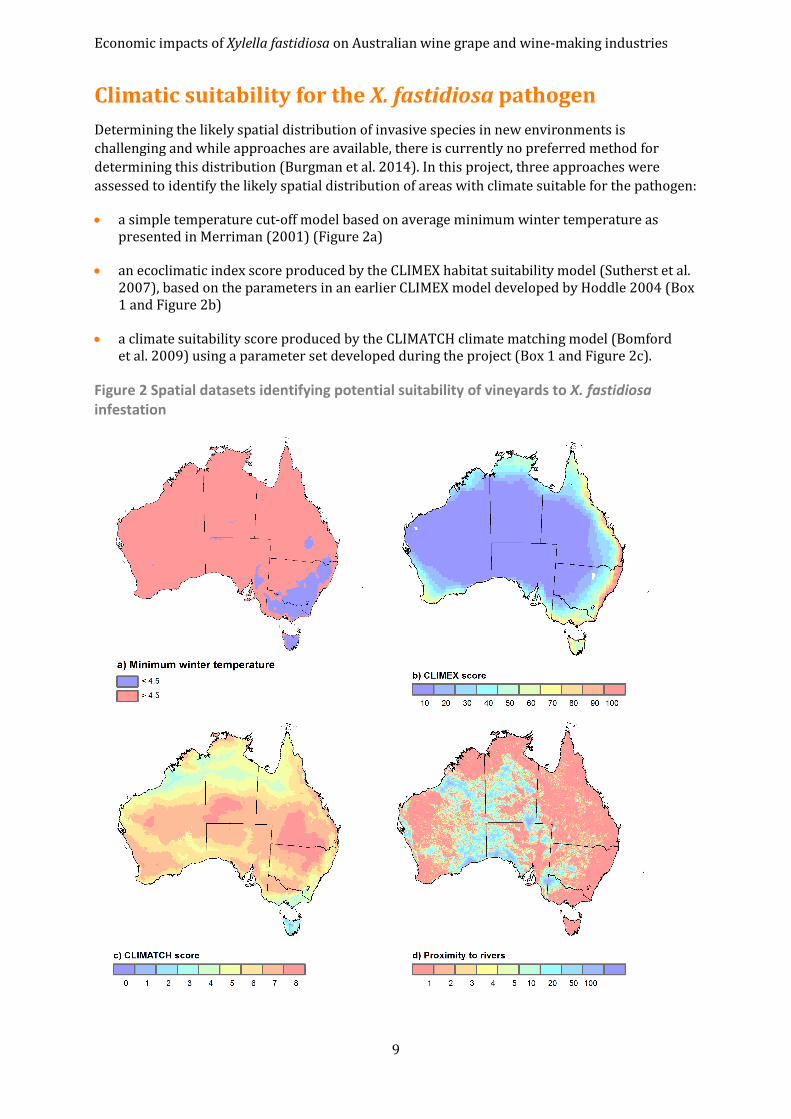
Climatic suitability for the X. fastidiosa pathogen Determining the likely spatial distribution of invasive species in new environments is challenging and while approaches are available, there is currently no preferred method for determining this distribution (Burgman et al. 2014). In this project, three approaches were assessed to identify the likely spatial distribution of areas with climate suitable for the pathogen:
• a simple temperature cut-off model based on average minimum winter temperature as presented in Merriman (2001) (Figure 2a)
• an ecoclimatic index score produced by the CLIMEX habitat suitability model (Sutherst et al. 2007), based on the parameters in an earlier CLIMEX model developed by Hoddle 2004 (Box 1 and Figure 2b)
• a climate suitability score produced by the CLIMATCH climate matching model (Bomford et al. 2009) using a parameter set developed during the project (Box 1 and Figure 2c).
Figure 2 Spatial datasets identifying potential suitability of vineyards to X. fastidiosa infestation
Economic impacts of Xylella fastidiosa on Australian wine grape and wine-making industries
10
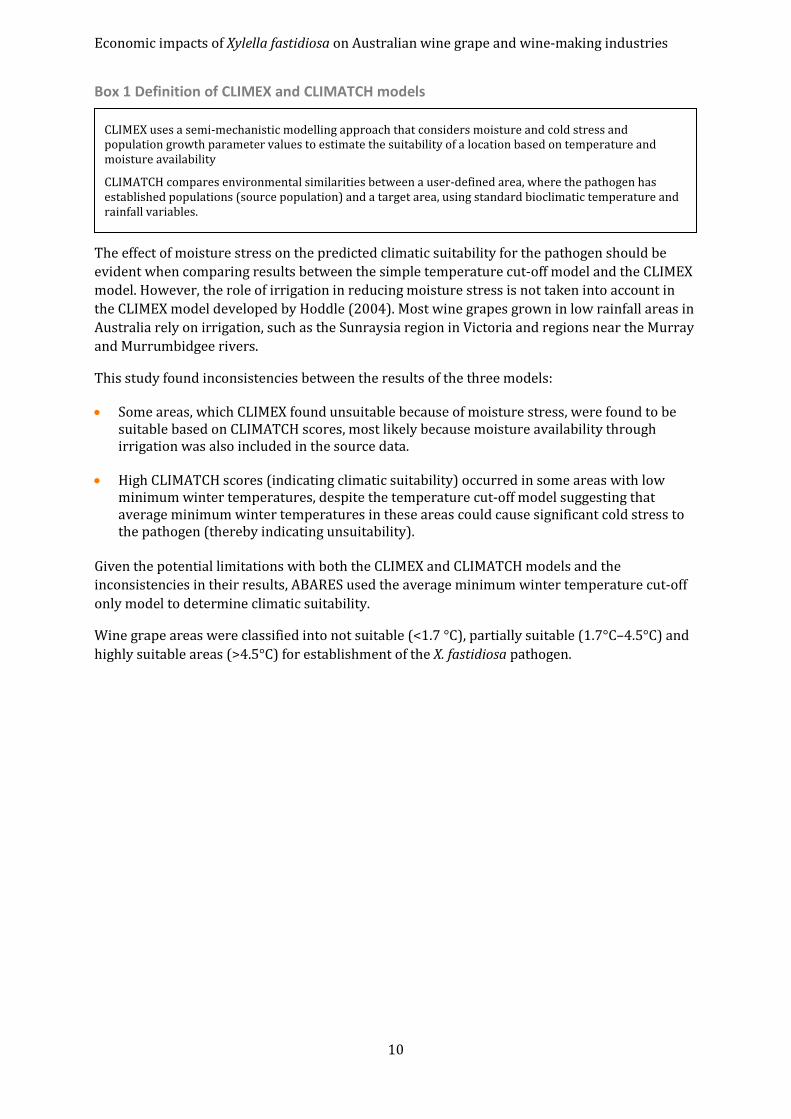
Box 1 Definition of CLIMEX and CLIMATCH models
The effect of moisture stress on the predicted climatic suitability for the pathogen should be evident when comparing results between the simple temperature cut-off model and the CLIMEX model. However, the role of irrigation in reducing moisture stress is not taken into account in the CLIMEX model developed by Hoddle (2004). Most wine grapes grown in low rainfall areas in Australia rely on irrigation, such as the Sunraysia region in Victoria and regions near the Murray and Murrumbidgee rivers.
This study found inconsistencies between the results of the three models:
• Some areas, which CLIMEX found unsuitable because of moisture stress, were found to be suitable based on CLIMATCH scores, most likely because moisture availability through irrigation was also included in the source data.
• High CLIMATCH scores (indicating climatic suitability) occurred in some areas with low minimum winter temperatures, despite the temperature cut-off model suggesting that average minimum winter temperatures in these areas could cause significant cold stress to the pathogen (thereby indicating unsuitability).
Given the potential limitations with both the CLIMEX and CLIMATCH models and the inconsistencies in their results, ABARES used the average minimum winter temperature cut-off only model to determine climatic suitability.
Wine grape areas were classified into not suitable (<1.7 °C), partially suitable (1.7°C–4.5°C) and highly suitable areas (>4.5°C) for establishment of the X. fastidiosa pathogen.
CLIMEX uses a semi-mechanistic modelling approach that considers moisture and cold stress and population growth parameter values to estimate the suitability of a location based on temperature and moisture availability
CLIMATCH compares environmental similarities between a user-defined area, where the pathogen has established populations (source population) and a target area, using standard bioclimatic temperature and rainfall variables.
Economic impacts of Xylella fastidiosa on Australian wine grape and wine-making industries
11
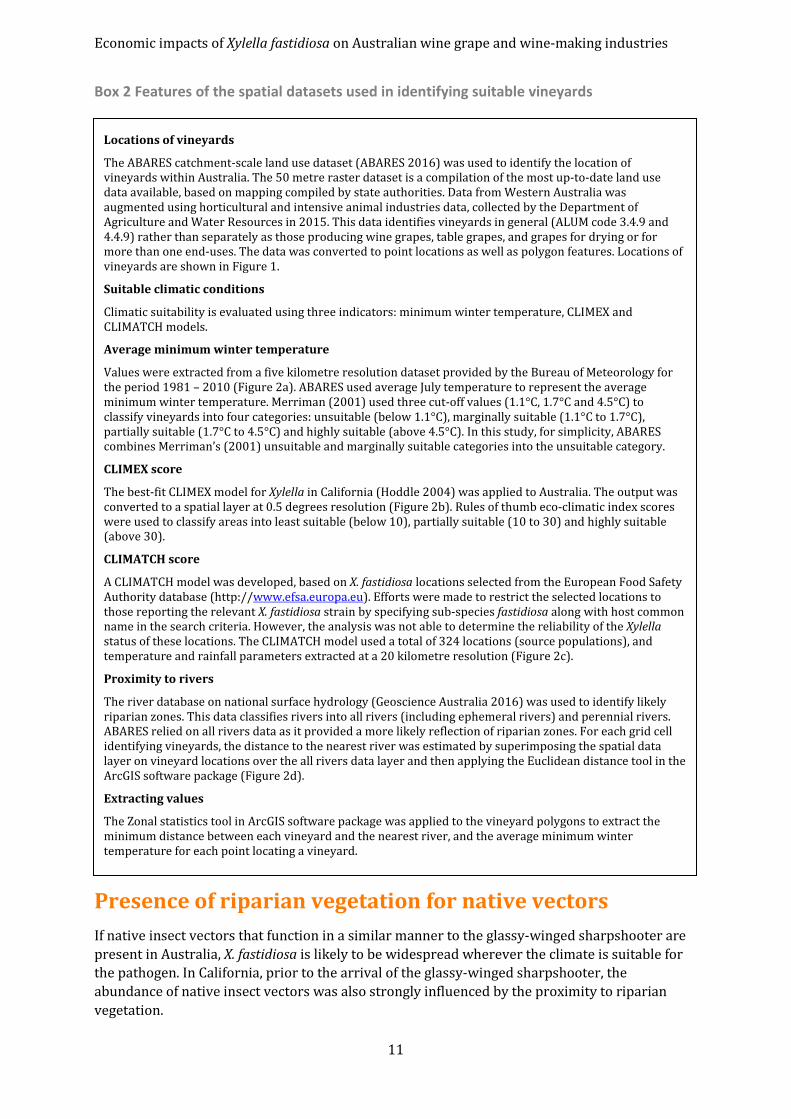
Box 2 Features of the spatial datasets used in identifying suitable vineyards
Presence of riparian vegetation for native vectors If native insect vectors that function in a similar manner to the glassy-winged sharpshooter are present in Australia, X. fastidiosa is likely to be widespread wherever the climate is suitable for the pathogen. In California, prior to the arrival of the glassy-winged sharpshooter, the abundance of native insect vectors was also strongly influenced by the proximity to riparian vegetation.
Locations of vineyards
The ABARES catchment-scale land use dataset (ABARES 2016) was used to identify the location of vineyards within Australia. The 50 metre raster dataset is a compilation of the most up-to-date land use data available, based on mapping compiled by state authorities. Data from Western Australia was augmented using horticultural and intensive animal industries data, collected by the Department of Agriculture and Water Resources in 2015. This data identifies vineyards in general (ALUM code 3.4.9 and 4.4.9) rather than separately as those producing wine grapes, table grapes, and grapes for drying or for more than one end-uses. The data was converted to point locations as well as polygon features. Locations of vineyards are shown in Figure 1.
Suitable climatic conditions
Climatic suitability is evaluated using three indicators: minimum winter temperature, CLIMEX and CLIMATCH models.
Average minimum winter temperature
Values were extracted from a five kilometre resolution dataset provided by the Bureau of Meteorology for the period 1981 – 2010 (Figure 2a). ABARES used average July temperature to represent the average minimum winter temperature. Merriman (2001) used three cut-off values (1.1°C, 1.7°C and 4.5°C) to classify vineyards into four categories: unsuitable (below 1.1°C), marginally suitable (1.1°C to 1.7°C), partially suitable (1.7°C to 4.5°C) and highly suitable (above 4.5°C). In this study, for simplicity, ABARES combines Merriman’s (2001) unsuitable and marginally suitable categories into the unsuitable category.
CLIMEX score
The best-fit CLIMEX model for Xylella in California (Hoddle 2004) was applied to Australia. The output was converted to a spatial layer at 0.5 degrees resolution (Figure 2b). Rules of thumb eco-climatic index scores were used to classify areas into least suitable (below 10), partially suitable (10 to 30) and highly suitable (above 30).
CLIMATCH score
A CLIMATCH model was developed, based on X. fastidiosa locations selected from the European Food Safety Authority database (http://www.efsa.europa.eu). Efforts were made to restrict the selected locations to those reporting the relevant X. fastidiosa strain by specifying sub-species fastidiosa along with host common name in the search criteria. However, the analysis was not able to determine the reliability of the Xylella status of these locations. The CLIMATCH model used a total of 324 locations (source populations), and temperature and rainfall parameters extracted at a 20 kilometre resolution (Figure 2c).
Proximity to rivers
The river database on national surface hydrology (Geoscience Australia 2016) was used to identify likely riparian zones. This data classifies rivers into all rivers (including ephemeral rivers) and perennial rivers. ABARES relied on all rivers data as it provided a more likely reflection of riparian zones. For each grid cell identifying vineyards, the distance to the nearest river was estimated by superimposing the spatial data layer on vineyard locations over the all rivers data layer and then applying the Euclidean distance tool in the ArcGIS software package (Figure 2d).
Extracting values
The Zonal statistics tool in ArcGIS software package was applied to the vineyard polygons to extract the minimum distance between each vineyard and the nearest river, and the average minimum winter temperature for each point locating a vineyard.
Economic impacts of Xylella fastidiosa on Australian wine grape and wine-making industries
12
While little is known about how efficient or widespread native vectors would be in Australia, in Scenario 3 (defined below), it is assumed that the pathogen establishes in areas where vineyards are in close proximity to a riverine environment and the climate is suitable for the pathogen. To model this, area suitability was restricted by considering the proximity of each vineyard to the nearest river as well as the suitability of the climate based on average minimum winter temperature cut-off.
A vineyard is treated as potentially suitable if it is located within 200 metres of a river—this rule is applied in the spatial dataset representing the proximity to riparian vegetation. The 200 metre cut-off was based on Perring et al. 2001, who found that prior to the introduction of the glassy-winged sharpshooter to California, the spread of Pierce’s disease by native vectors was not severe enough to cause damage if the vineyards were located more than 120–180 metres away from riparian vegetation. Whilst data on riparian vegetation is not readily available nationally, data on proximity to rivers (including ephemeral rivers) (Figure 2d) was considered a reasonable surrogate in this study.
The methods used to derive the spatial datasets on vineyard locations and areas suitable for infestation—based on minimum winter temperature cut-off, CLIMEX score, CLIMATCH score, and proximity to rivers—are discussed in Box 2.
Of the three approaches considered to model climatic suitability for the pathogen, the average minimum winter temperature model produced the most reliable estimate. However, as mentioned previously, the areal extent of suitable vineyards is further reduced when the presence of native vectors is also considered. This source of uncertainty around Australia’s potential maximum suitable extent has been incorporated into the model.
Maximum-extent scenarios There is uncertainty around the maximum suitable extent of vineyards that would be under threat in Australia as little is known about how the pathogen and native vectors are likely to behave under Australian conditions. It is possible that other factors (not experienced internationally) may determine the suitability of vineyards and the potential spatial distribution of the pathogen in Australia, were it allowed to spread uncontrolled. For example, the presence of riparian vegetation may be more important for some native vectors than for others. Similarly, the estimated reduction in the extent of suitable area, when the abundance of riparian vegetation dependent vectors only was considered, may not be as large as the corresponding estimate obtained when native vectors were considered in general.
To take into account these uncertainties, three maximum-extent scenarios were modelled:
• Scenario 1: All vineyards in Australia (Figure 1) are highly suitable to infestation—proximity to riparian vegetation and temperature thresholds are not considered.
• Scenario 2: Only vineyards experiencing average winter temperatures above the minimum threshold are suitable to infestation. These vineyards are further classified into partially suitable and highly suitable, depending on the temperature threshold ranges defined above. Vineyards that do not meet minimum temperature requirements are classified as unsuitable.
• Scenario 3: Both the temperature threshold (identified in Scenario 2) and proximity to riparian vegetation are considered. In line with Scenario 2, these are classified into unsuitable, partially suitable and highly suitable vineyards.
Economic impacts of Xylella fastidiosa on Australian wine grape and wine-making industries
13
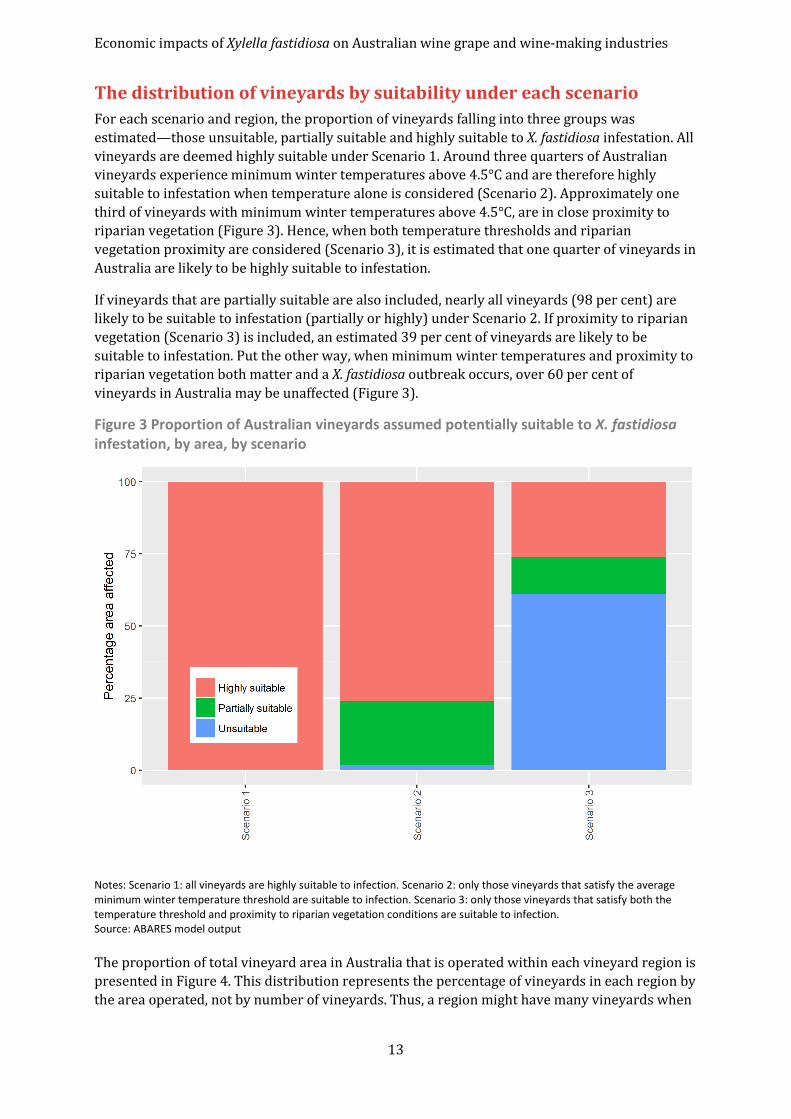
The distribution of vineyards by suitability under each scenario For each scenario and region, the proportion of vineyards falling into three groups was estimated—those unsuitable, partially suitable and highly suitable to X. fastidiosa infestation. All vineyards are deemed highly suitable under Scenario 1. Around three quarters of Australian vineyards experience minimum winter temperatures above 4.5°C and are therefore highly suitable to infestation when temperature alone is considered (Scenario 2). Approximately one third of vineyards with minimum winter temperatures above 4.5°C, are in close proximity to riparian vegetation (Figure 3). Hence, when both temperature thresholds and riparian vegetation proximity are considered (Scenario 3), it is estimated that one quarter of vineyards in Australia are likely to be highly suitable to infestation.
If vineyards that are partially suitable are also included, nearly all vineyards (98 per cent) are likely to be suitable to infestation (partially or highly) under Scenario 2. If proximity to riparian vegetation (Scenario 3) is included, an estimated 39 per cent of vineyards are likely to be suitable to infestation. Put the other way, when minimum winter temperatures and proximity to riparian vegetation both matter and a X. fastidiosa outbreak occurs, over 60 per cent of vineyards in Australia may be unaffected (Figure 3).
Figure 3 Proportion of Australian vineyards assumed potentially suitable to X. fastidiosa infestation, by area, by scenario
Notes: Scenario 1: all vineyards are highly suitable to infection. Scenario 2: only those vineyards that satisfy the average minimum winter temperature threshold are suitable to infection. Scenario 3: only those vineyards that satisfy both the temperature threshold and proximity to riparian vegetation conditions are suitable to infection. Source: ABARES model output
The proportion of total vineyard area in Australia that is operated within each vineyard region is presented in Figure 4. This distribution represents the percentage of vineyards in each region by the area operated, not by number of vineyards. Thus, a region might have many vineyards when
Economic impacts of Xylella fastidiosa on Australian wine grape and wine-making industries
14
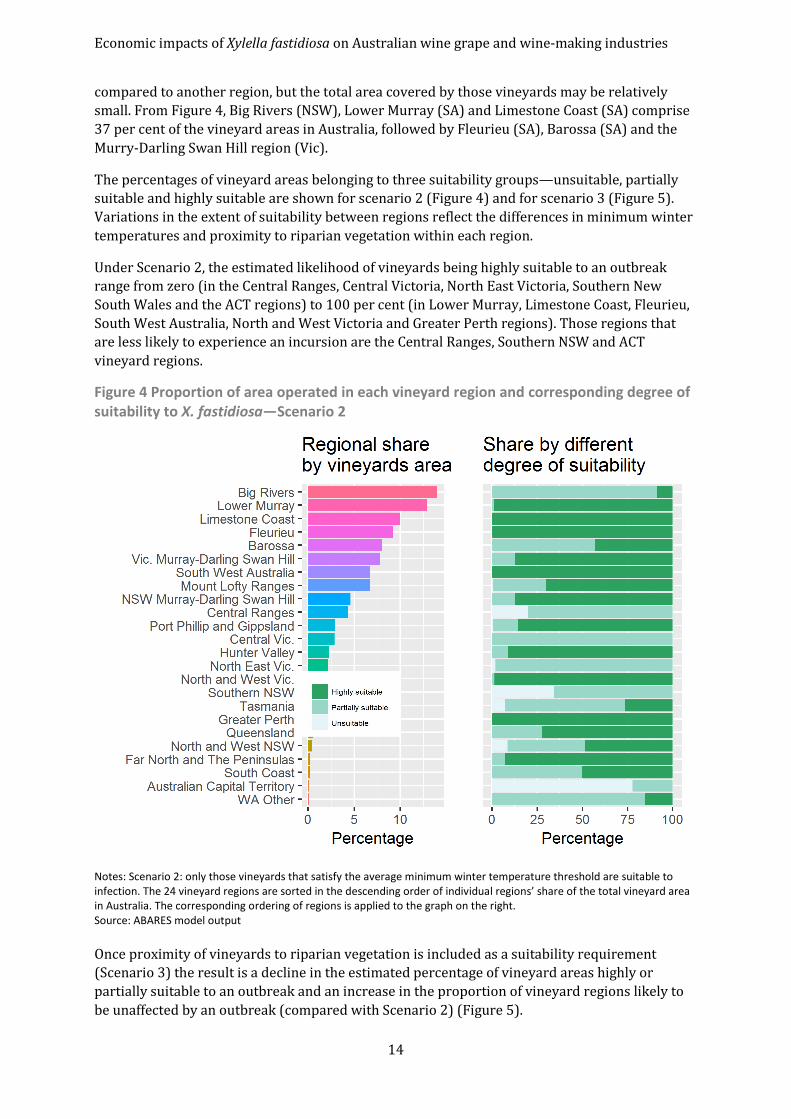
compared to another region, but the total area covered by those vineyards may be relatively small. From Figure 4, Big Rivers (NSW), Lower Murray (SA) and Limestone Coast (SA) comprise 37 per cent of the vineyard areas in Australia, followed by Fleurieu (SA), Barossa (SA) and the Murry-Darling Swan Hill region (Vic).
The percentages of vineyard areas belonging to three suitability groups—unsuitable, partially suitable and highly suitable are shown for scenario 2 (Figure 4) and for scenario 3 (Figure 5). Variations in the extent of suitability between regions reflect the differences in minimum winter temperatures and proximity to riparian vegetation within each region.
Under Scenario 2, the estimated likelihood of vineyards being highly suitable to an outbreak range from zero (in the Central Ranges, Central Victoria, North East Victoria, Southern New South Wales and the ACT regions) to 100 per cent (in Lower Murray, Limestone Coast, Fleurieu, South West Australia, North and West Victoria and Greater Perth regions). Those regions that are less likely to experience an incursion are the Central Ranges, Southern NSW and ACT vineyard regions.
Figure 4 Proportion of area operated in each vineyard region and corresponding degree of suitability to X. fastidiosa—Scenario 2
Notes: Scenario 2: only those vineyards that satisfy the average minimum winter temperature threshold are suitable to infection. The 24 vineyard regions are sorted in the descending order of individual regions’ share of the total vineyard area in Australia. The corresponding ordering of regions is applied to the graph on the right. Source: ABARES model output
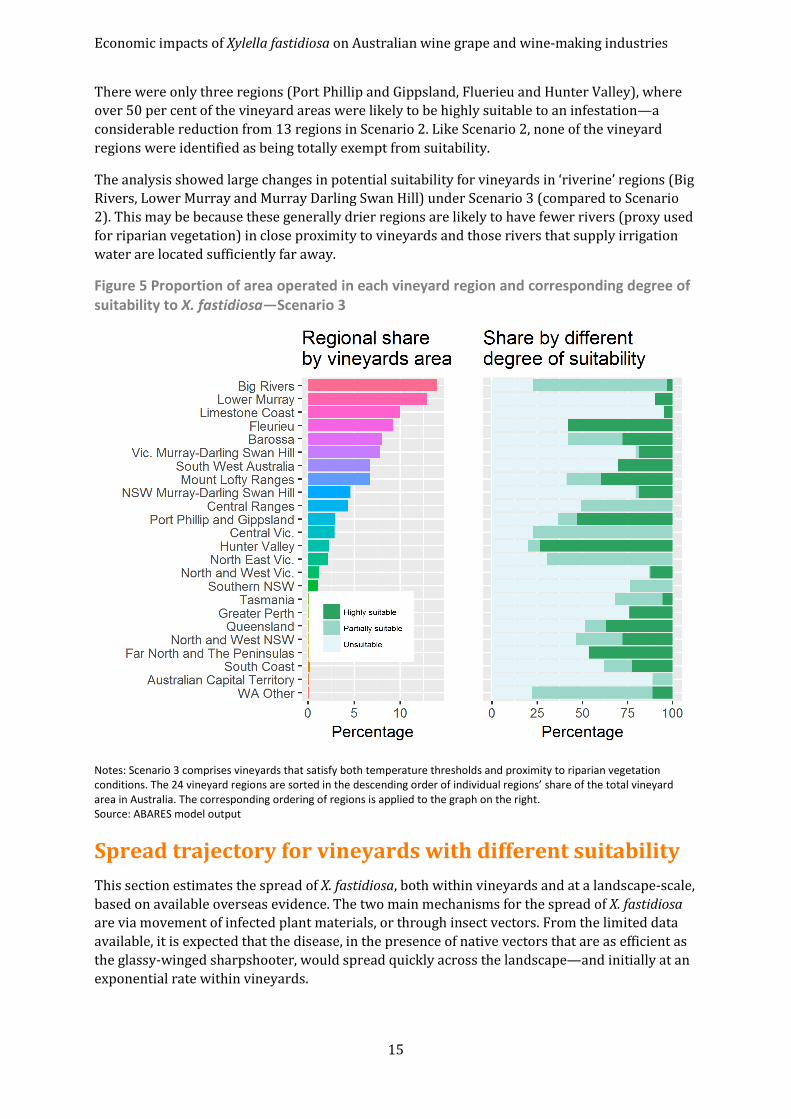
Once proximity of vineyards to riparian vegetation is included as a suitability requirement (Scenario 3) the result is a decline in the estimated percentage of vineyard areas highly or partially suitable to an outbreak and an increase in the proportion of vineyard regions likely to be unaffected by an outbreak (compared with Scenario 2) (Figure 5).
Economic impacts of Xylella fastidiosa on Australian wine grape and wine-making industries
15
There were only three regions (Port Phillip and Gippsland, Fluerieu and Hunter Valley), where over 50 per cent of the vineyard areas were likely to be highly suitable to an infestation—a considerable reduction from 13 regions in Scenario 2. Like Scenario 2, none of the vineyard regions were identified as being totally exempt from suitability.
The analysis showed large changes in potential suitability for vineyards in ‘riverine’ regions (Big Rivers, Lower Murray and Murray Darling Swan Hill) under Scenario 3 (compared to Scenario 2). This may be because these generally drier regions are likely to have fewer rivers (proxy used for riparian vegetation) in close proximity to vineyards and those rivers that supply irrigation water are located sufficiently far away.
Figure 5 Proportion of area operated in each vineyard region and corresponding degree of suitability to X. fastidiosa—Scenario 3
Notes: Scenario 3 comprises vineyards that satisfy both temperature thresholds and proximity to riparian vegetation conditions. The 24 vineyard regions are sorted in the descending order of individual regions’ share of the total vineyard area in Australia. The corresponding ordering of regions is applied to the graph on the right. Source: ABARES model output
Spread trajectory for vineyards with different suitability This section estimates the spread of X. fastidiosa, both within vineyards and at a landscape-scale, based on available overseas evidence. The two main mechanisms for the spread of X. fastidiosa are via movement of infected plant materials, or through insect vectors. From the limited data available, it is expected that the disease, in the presence of native vectors that are as efficient as the glassy-winged sharpshooter, would spread quickly across the landscape—and initially at an exponential rate within vineyards.
Economic impacts of Xylella fastidiosa on Australian wine grape and wine-making industries
16
In this study, the worst case scenario represents one in which X. fastidiosa spreads across the Australian landscape in several years. However, the full economic impacts of the X. fastidiosa spread are assumed to continue over a 50 year period.
Spread rate within vineyards Anecdotal evidence suggests that the spread of X. fastidiosa within a vineyard can be rapid. Merriman (2001), for example, reported one Californian grower’s experience of pulling 50, 500 and 10,000 vines in three consecutive years commencing 1997, following the arrival of the glassy-winged sharpshooter. Using an expert elicitation process, Alston et al. (2013) determined that if the existing policies and programs to control Pierce’s disease in California (including control of the glassy-winged sharpshooter) ceased, the within-vineyard disease incidence rate (percentage of vines lost per year) would grow exponentially to a plateau rate over a 10 year period. More specifically, they estimated that the removal of existing controls in the high impact Napa-Sonoma region, would increase the within-vineyard incidence rate by around 1–10 per cent a year over 10–20 years. The corresponding rates for the medium impact Southern San Joaquin Valley region and low impact regions such as Coastal and Northern San Joaquin Valley were around 1–4 per cent and 0.0–0.5 per cent, respectively.
Based on the above evidence from California, this study assumes that without control measures in place, the within-vineyard disease incidence rate will increase exponentially reaching its maximum in 10 years. The annual disease incidence rate is assumed to reach a maximum of 10 per cent for highly suitable vineyards and 4 per cent for partially suitable vineyards—which correspond to the upper limits of the ranges reported by Alston et al (2013) for the high impact (Napa-Sonoma) and medium impact (Southern San Joaquin Valley) regions, respectively.
Spread rate across the landscape To estimate the rate of spread across the Australian landscape, ABARES looked at between-farm spread rates for the strain of X. fastidiosa that causes citrus variegated chlorosis (CVC) in Brazil. Grapes and citrus are mostly grown in the same region-types in Australia as in California’s Temecula Valley, and therefore in the absence of the landscape-scale spread data for wine grapes, the rate of CVC is used as an indicator of how quickly X. fastidiosa would spread between vineyards in Australia.
Based on this assumption, ABARES modelling showed that it would take just over six years for 70 per cent of citrus orchards to have the disease. This was found to be close to the observation Laranjeira et al. (2008) made that the disease had already spread to 54 per cent of citrus orchards in Litoral Norte within the state of Bahia in Brazil seven years after its detection in 1997. The details of ABARES modelling of the spread rate for CVC is presented in Box 3. Although these analyses can only provide a guide, they all suggest a rapid spatial spread of the disease within regions once it arrives. To simplify the overall task of spread modelling for vineyards, ABARES assumed that X. fastidiosa would spread across the Australian landscape in several years. The spread and the impacts were estimated over a 50 year planning horizon.
Spread between regions Unlike within vineyard and across the landscape spread, there is less certainty about how quickly the disease can spread between regions. The three maximum extent scenarios assume that the disease enters Australia and is immediately present in all regions, with impacts then developing over several years to cover the three spatial extents defined above. While it may be unlikely that the disease would be immediately present in all regions, this scenario cannot be ruled out, particularly if restrictions to reduce movement of the disease are not put in place. This
Economic impacts of Xylella fastidiosa on Australian wine grape and wine-making industries
17
scenario provides some guide to the value of the industries at risk under the three maximum spatial extents.
Box 3 Landscape scale spread rate for the X. fastidiosa strain causing citrus variegated chlorosis
To estimate the rate of spread of the disease at the landscape scale, ABARES looked at data from South America, where a different strain of X. fastidiosa causes citrus variegated chlorosis (CVC). The European and Mediterranean Plant Protection Organization (EPPO) website reports that in Brazil, the number of sites with CVC-infected trees increased from 13 to 72 (out of 920 test sites) within a 12-month period ending 1991. The state of Bahia in Brazil has 11 species of vectors of X. fastidiosa belonging to a larger pool of 10 different insect genera that have been confirmed as vectors. Laranjeira et al 2008, found that 54 per cent of citrus orchards (groves) in Litoral Norte region in Bahia had detectable levels of CVC, seven years after its arrival in 1997. Meanwhile, by 2004, CVC was still not found in Recôncavo Baiano, an adjacent citrus growing region separated from Litoral Norte by a 100 km strip with no commercial orange orchards.
While many factors may influence the spread of the disease between vineyards or citrus orchards, ABARES used the data on CVC in Brazil from Laranjeira et al. (2008) and from the EPPO website to estimate the yearly rate of increase in the proportion of citrus orchards with the disease. The EPPO website data suggests that the percentage of citrus groves with the disease increased from 1.4 to 7.8 per cent (more than five-fold) within 12 months. Laranjeira et al. (2008) report much slower increases (around two fold but starting from higher bases) between two consecutive years in two municipalities—from 48 to 91 per cent in Itapicura and from 30 to 77 per cent in Rio Real
ABARES constructed a Bayesian Markov Chain Monte Carlo (MCMC) model for Australia assuming a common rate of increase in all citrus-growing regions and incorporating measurement errors for the proportion of orchards detected with the disease. The yearly rate of increase in the proportion of citrus orchards with the disease (the parameter r specified in the MCMC model) is estimated to be 1.09 (with a standard deviation of 0.17). With this rate of increase, assuming a region with 1,000 orchards and with one orchard initially infested while no control is undertaken, it would take just over six years for 70 per cent of groves to have the disease. This is close to the observation by Laranjeira et al. (2008) where 54 per cent of groves in Litoral Norte had detectable disease in 2004, following the initial detection in 1997. Although this analysis can only provide a guide, the estimate suggests rapid landscape-scale spread of the disease within regions is likely to occur once it arrives.
Laranjeira et al. (2008) provide some evidence to suggest that disease spread between regions could be slower. The authors provide a number of possible reasons for the absence of the disease in Recôncavo Baiano, the region adjacent to Litoral Norte, including: the 100 km ‘buffer’ preventing spread by insect vectors, provision of healthy bud wood to orchards by authorities and/or the practice of Recôncavo Baiano growers to produce their own nursery stock.
Economic impacts of Xylella fastidiosa on Australian wine grape and wine-making industries
18
4 Economic impacts at the regional level
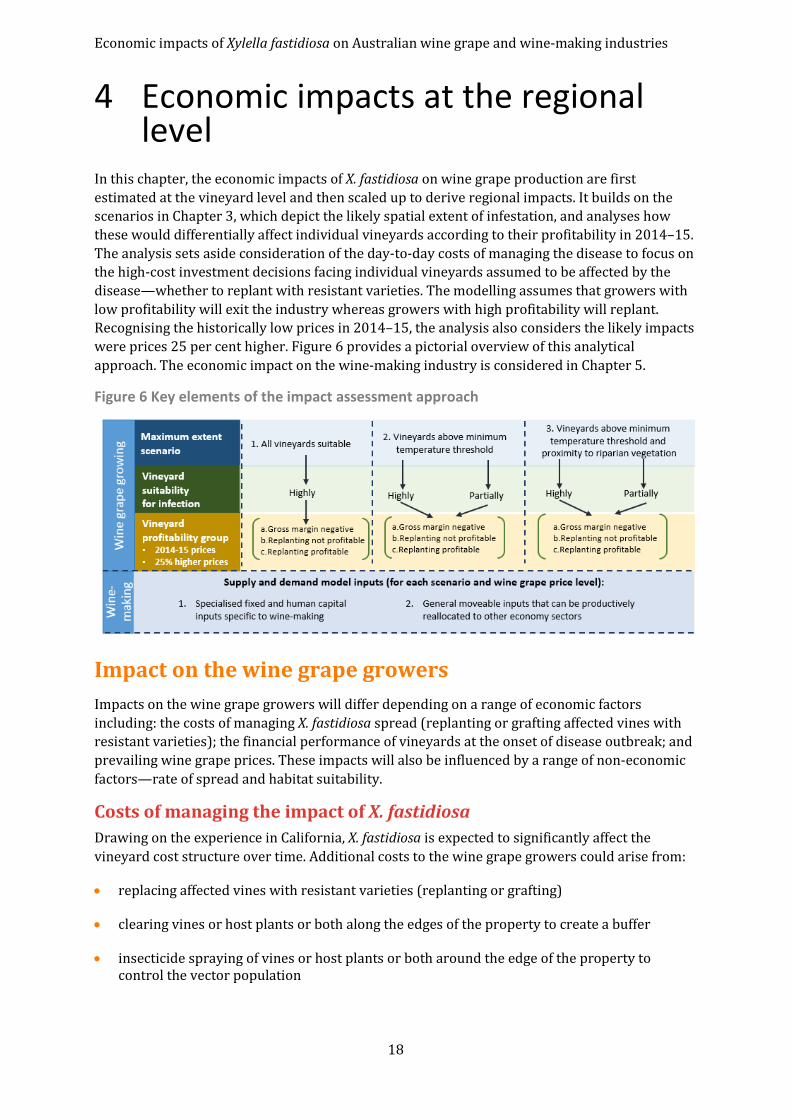
In this chapter, the economic impacts of X. fastidiosa on wine grape production are first estimated at the vineyard level and then scaled up to derive regional impacts. It builds on the scenarios in Chapter 3, which depict the likely spatial extent of infestation, and analyses how these would differentially affect individual vineyards according to their profitability in 2014–15. The analysis sets aside consideration of the day-to-day costs of managing the disease to focus on the high-cost investment decisions facing individual vineyards assumed to be affected by the disease—whether to replant with resistant varieties. The modelling assumes that growers with low profitability will exit the industry whereas growers with high profitability will replant. Recognising the historically low prices in 2014–15, the analysis also considers the likely impacts were prices 25 per cent higher. Figure 6 provides a pictorial overview of this analytical approach. The economic impact on the wine-making industry is considered in Chapter 5.
Figure 6 Key elements of the impact assessment approach
Impact on the wine grape growers Impacts on the wine grape growers will differ depending on a range of economic factors including: the costs of managing X. fastidiosa spread (replanting or grafting affected vines with resistant varieties); the financial performance of vineyards at the onset of disease outbreak; and prevailing wine grape prices. These impacts will also be influenced by a range of non-economic factors—rate of spread and habitat suitability.
Costs of managing the impact of X. fastidiosa Drawing on the experience in California, X. fastidiosa is expected to significantly affect the vineyard cost structure over time. Additional costs to the wine grape growers could arise from:
• replacing affected vines with resistant varieties (replanting or grafting)
• clearing vines or host plants or both along the edges of the property to create a buffer
• insecticide spraying of vines or host plants or both around the edge of the property to control the vector population
Economic impacts of Xylella fastidiosa on Australian wine grape and wine-making industries
19
• clearing riparian vegetation where the vineyard is adjacent to a river (there may be legislative impediments as well as associated environmental costs)
• more intensive weed control to eliminate potential host plants of the vector (with associated costs due to erosion).
Due to limited data availability, the ABARES study considers only the first of these five costs—the costs of replacing affected vines with resistant varieties (replanting or grafting).
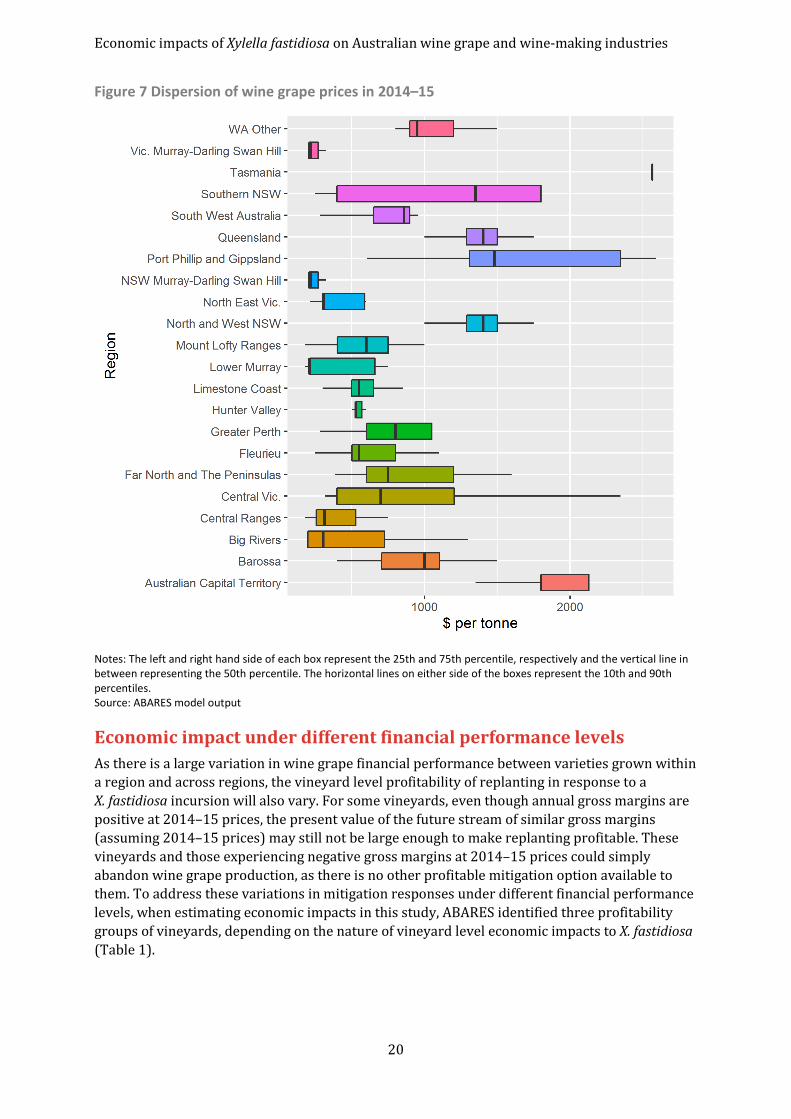
How wine grape prices affect a grower’s replanting and grafting decisions While replanting and other practices listed above may help mitigate the impact of X. fastidiosa, growers are expected to undertake them only if they are expected to be profitable in the long run, as replanting and other practices involve substantial investment. This is particularly important, because many vineyards are not doing well financially, given the low prices for wine grapes that prevailed prior to 2014–15. Falling wine grape prices, particularly over the 10 years to 2014–15 have resulted in significant decline in vineyard gross revenues affecting the profitability and return to investment in wine grape growing. While 2014–15 price levels were, on average, low compared to previous years, regional prices showed a large dispersion due to the wide range of wine grape varieties produced and variation in quality (Figure 7). The prices received by wine grape growers were not always high enough to cover variable cost of production (gross margins were negative). For example, bulk of Chardonnay and Muscat Gordo Blanco grapes produced in South Australian Riverland were sold below their variable cost of production in 2014 and 2015, respectively (Berry, 2015). Projections made by Berry (2015) for the same region for 2016, based on average yields over five years to 2015 and 2015 prices, showed that 92 per cent of Cabernet and 88 per cent of Shiraz produced were not expected to cover variable cost of production.
However, there appears to be some early signs of a reversal of the declining price trend, with the average price paid for wine grapes increasing by 14 per cent across Australia in 2015–16 to the highest level recorded since 2009 (Wine Australia 2016). To take into account the possibility of the continuation of the recent price trend, ABARES modelling also considers the economic cost with a hypothetical 25 per cent increase in wine grape prices over the 2014–15 levels. However, the higher prices assumed, estimated to average $595 a tonne, is still far below the record high average price of $946 a tonne received in 2000–01.
Economic impacts of Xylella fastidiosa on Australian wine grape and wine-making industries
20
Figure 7 Dispersion of wine grape prices in 2014–15
Notes: The left and right hand side of each box represent the 25th and 75th percentile, respectively and the vertical line in between representing the 50th percentile. The horizontal lines on either side of the boxes represent the 10th and 90th percentiles. Source: ABARES model output
Economic impact under different financial performance levels As there is a large variation in wine grape financial performance between varieties grown within a region and across regions, the vineyard level profitability of replanting in response to a X. fastidiosa incursion will also vary. For some vineyards, even though annual gross margins are positive at 2014–15 prices, the present value of the future stream of similar gross margins (assuming 2014–15 prices) may still not be large enough to make replanting profitable. These vineyards and those experiencing negative gross margins at 2014–15 prices could simply abandon wine grape production, as there is no other profitable mitigation option available to them. To address these variations in mitigation responses under different financial performance levels, when estimating economic impacts in this study, ABARES identified three profitability groups of vineyards, depending on the nature of vineyard level economic impacts to X. fastidiosa (Table 1).
Economic impacts of Xylella fastidiosa on Australian wine grape and wine-making industries
21
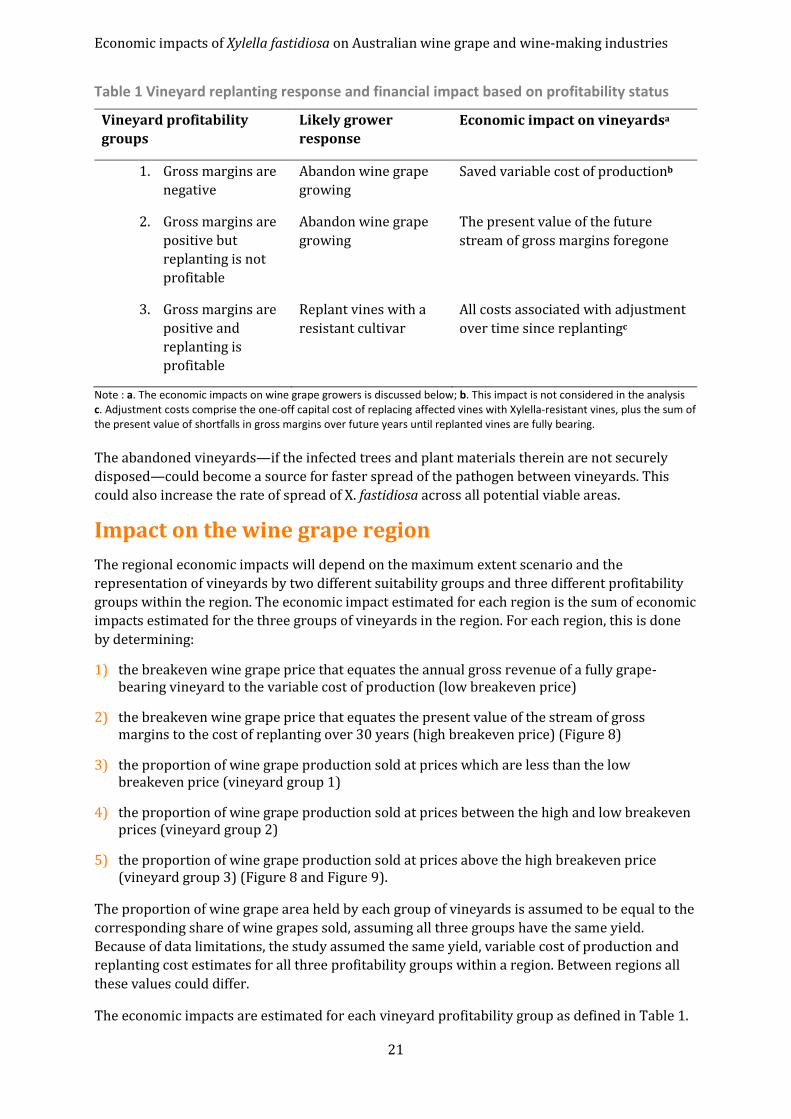
Table 1 Vineyard replanting response and financial impact based on profitability status
Vineyard profitability groups
Likely grower response
Economic impact on vineyardsa
1. Gross margins are negative
Abandon wine grape growing
Saved variable cost of productionb
2. Gross margins are positive but replanting is not profitable
Abandon wine grape growing
The present value of the future stream of gross margins foregone
3. Gross margins are positive and replanting is profitable
Replant vines with a resistant cultivar
All costs associated with adjustment over time since replantingc
Note : a. The economic impacts on wine grape growers is discussed below; b. This impact is not considered in the analysis c. Adjustment costs comprise the one-off capital cost of replacing affected vines with Xylella-resistant vines, plus the sum of the present value of shortfalls in gross margins over future years until replanted vines are fully bearing.
The abandoned vineyards—if the infected trees and plant materials therein are not securely disposed—could become a source for faster spread of the pathogen between vineyards. This could also increase the rate of spread of X. fastidiosa across all potential viable areas.
Impact on the wine grape region The regional economic impacts will depend on the maximum extent scenario and the representation of vineyards by two different suitability groups and three different profitability groups within the region. The economic impact estimated for each region is the sum of economic impacts estimated for the three groups of vineyards in the region. For each region, this is done by determining:
1) the breakeven wine grape price that equates the annual gross revenue of a fully grape-bearing vineyard to the variable cost of production (low breakeven price)
2) the breakeven wine grape price that equates the present value of the stream of gross margins to the cost of replanting over 30 years (high breakeven price) (Figure 8)
3) the proportion of wine grape production sold at prices which are less than the low breakeven price (vineyard group 1)
4) the proportion of wine grape production sold at prices between the high and low breakeven prices (vineyard group 2)
5) the proportion of wine grape production sold at prices above the high breakeven price (vineyard group 3) (Figure 8 and Figure 9).
The proportion of wine grape area held by each group of vineyards is assumed to be equal to the corresponding share of wine grapes sold, assuming all three groups have the same yield. Because of data limitations, the study assumed the same yield, variable cost of production and replanting cost estimates for all three profitability groups within a region. Between regions all these values could differ.
The economic impacts are estimated for each vineyard profitability group as defined in Table 1.
Economic impacts of Xylella fastidiosa on Australian wine grape and wine-making industries
22
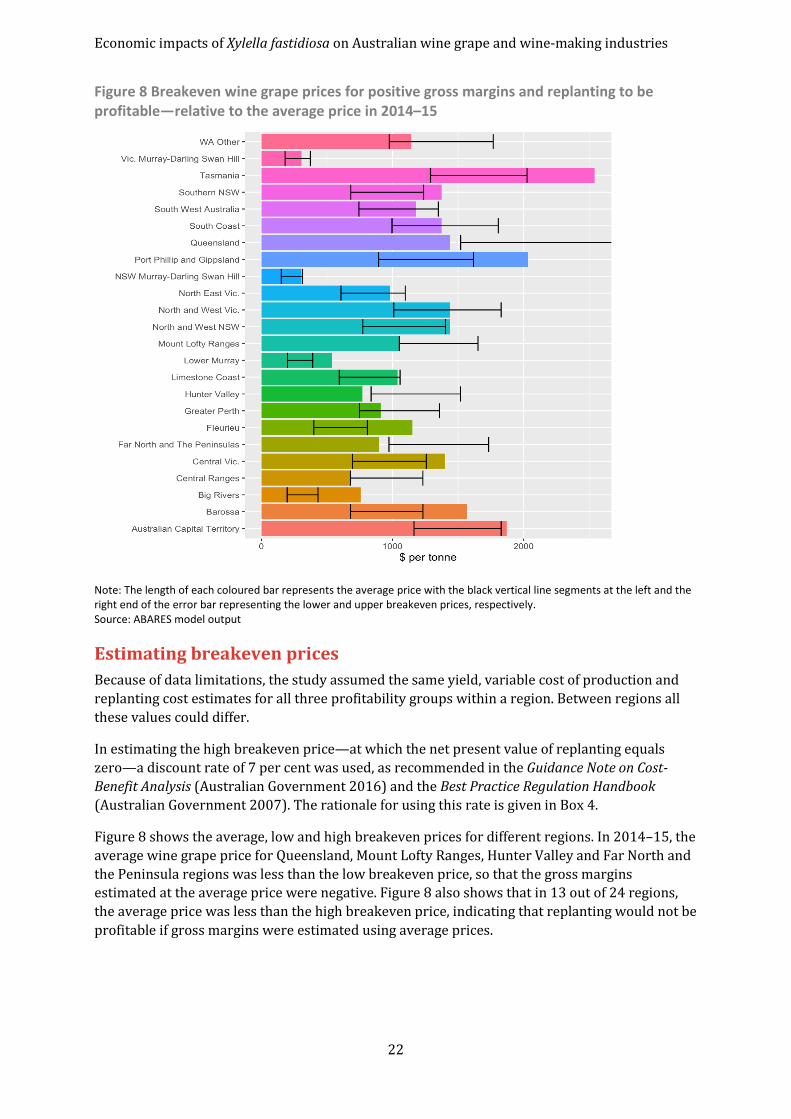
Figure 8 Breakeven wine grape prices for positive gross margins and replanting to be profitable—relative to the average price in 2014–15
Note: The length of each coloured bar represents the average price with the black vertical line segments at the left and the right end of the error bar representing the lower and upper breakeven prices, respectively. Source: ABARES model output
Estimating breakeven prices Because of data limitations, the study assumed the same yield, variable cost of production and replanting cost estimates for all three profitability groups within a region. Between regions all these values could differ.
In estimating the high breakeven price—at which the net present value of replanting equals zero—a discount rate of 7 per cent was used, as recommended in the Guidance Note on Cost-Benefit Analysis (Australian Government 2016) and the Best Practice Regulation Handbook (Australian Government 2007). The rationale for using this rate is given in Box 4.
Figure 8 shows the average, low and high breakeven prices for different regions. In 2014–15, the average wine grape price for Queensland, Mount Lofty Ranges, Hunter Valley and Far North and the Peninsula regions was less than the low breakeven price, so that the gross margins estimated at the average price were negative. Figure 8 also shows that in 13 out of 24 regions, the average price was less than the high breakeven price, indicating that replanting would not be profitable if gross margins were estimated using average prices.
Economic impacts of Xylella fastidiosa on Australian wine grape and wine-making industries
23
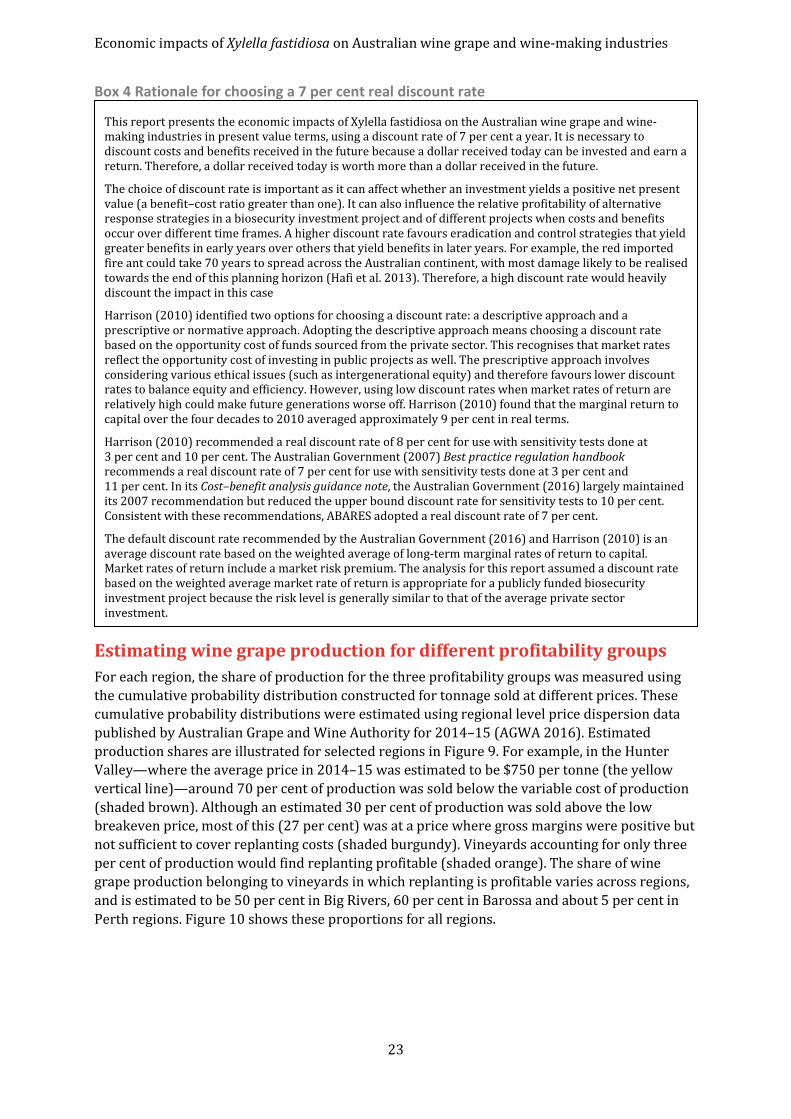
Box 4 Rationale for choosing a 7 per cent real discount rate
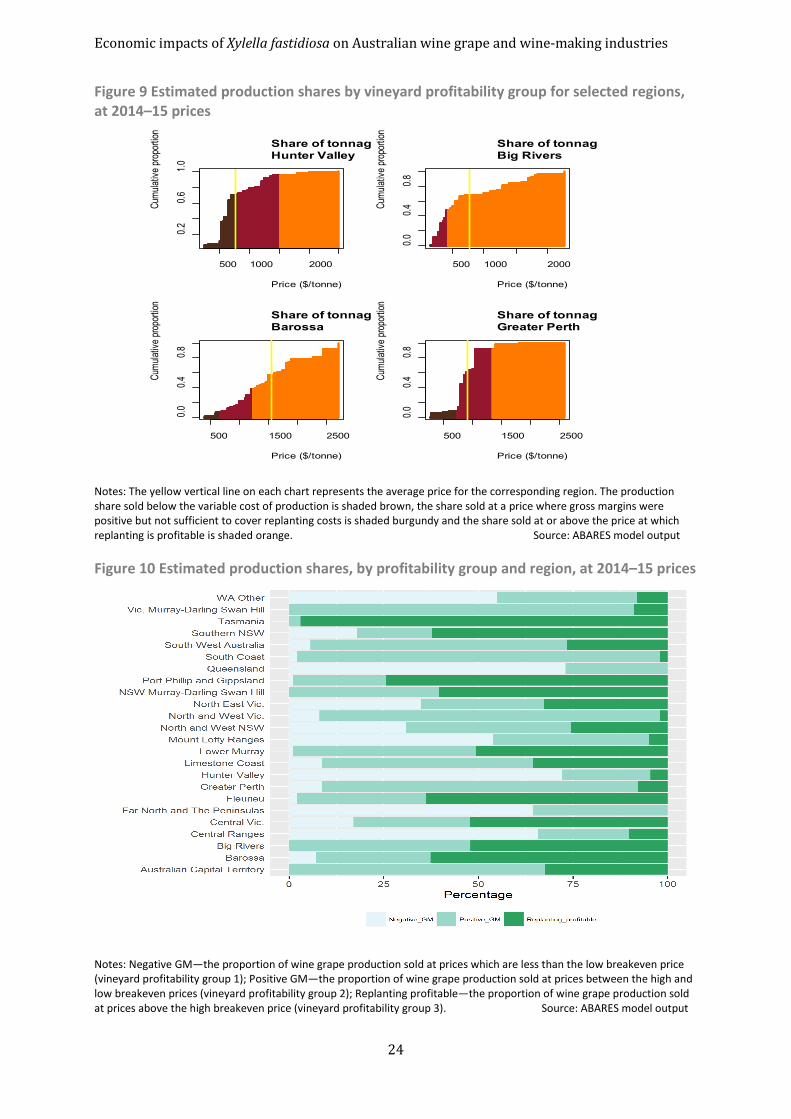
Estimating wine grape production for different profitability groups For each region, the share of production for the three profitability groups was measured using the cumulative probability distribution constructed for tonnage sold at different prices. These cumulative probability distributions were estimated using regional level price dispersion data published by Australian Grape and Wine Authority for 2014–15 (AGWA 2016). Estimated production shares are illustrated for selected regions in Figure 9. For example, in the Hunter Valley—where the average price in 2014–15 was estimated to be $750 per tonne (the yellow vertical line)—around 70 per cent of production was sold below the variable cost of production (shaded brown). Although an estimated 30 per cent of production was sold above the low breakeven price, most of this (27 per cent) was at a price where gross margins were positive but not sufficient to cover replanting costs (shaded burgundy). Vineyards accounting for only three per cent of production would find replanting profitable (shaded orange). The share of wine grape production belonging to vineyards in which replanting is profitable varies across regions, and is estimated to be 50 per cent in Big Rivers, 60 per cent in Barossa and about 5 per cent in Perth regions. Figure 10 shows these proportions for all regions.
This report presents the economic impacts of Xylella fastidiosa on the Australian wine grape and wine-making industries in present value terms, using a discount rate of 7 per cent a year. It is necessary to discount costs and benefits received in the future because a dollar received today can be invested and earn a return. Therefore, a dollar received today is worth more than a dollar received in the future.
The choice of discount rate is important as it can affect whether an investment yields a positive net present value (a benefit–cost ratio greater than one). It can also influence the relative profitability of alternative response strategies in a biosecurity investment project and of different projects when costs and benefits occur over different time frames. A higher discount rate favours eradication and control strategies that yield greater benefits in early years over others that yield benefits in later years. For example, the red imported fire ant could take 70 years to spread across the Australian continent, with most damage likely to be realised towards the end of this planning horizon (Hafi et al. 2013). Therefore, a high discount rate would heavily discount the impact in this case
Harrison (2010) identified two options for choosing a discount rate: a descriptive approach and a prescriptive or normative approach. Adopting the descriptive approach means choosing a discount rate based on the opportunity cost of funds sourced from the private sector. This recognises that market rates reflect the opportunity cost of investing in public projects as well. The prescriptive approach involves considering various ethical issues (such as intergenerational equity) and therefore favours lower discount rates to balance equity and efficiency. However, using low discount rates when market rates of return are relatively high could make future generations worse off. Harrison (2010) found that the marginal return to capital over the four decades to 2010 averaged approximately 9 per cent in real terms.
Harrison (2010) recommended a real discount rate of 8 per cent for use with sensitivity tests done at 3 per cent and 10 per cent. The Australian Government (2007) Best practice regulation handbook recommends a real discount rate of 7 per cent for use with sensitivity tests done at 3 per cent and 11 per cent. In its Cost–benefit analysis guidance note, the Australian Government (2016) largely maintained its 2007 recommendation but reduced the upper bound discount rate for sensitivity tests to 10 per cent. Consistent with these recommendations, ABARES adopted a real discount rate of 7 per cent.
The default discount rate recommended by the Australian Government (2016) and Harrison (2010) is an average discount rate based on the weighted average of long-term marginal rates of return to capital. Market rates of return include a market risk premium. The analysis for this report assumed a discount rate based on the weighted average market rate of return is appropriate for a publicly funded biosecurity investment project because the risk level is generally similar to that of the average private sector investment.
Economic impacts of Xylella fastidiosa on Australian wine grape and wine-making industries
24
Figure 9 Estimated production shares by vineyard profitability group for selected regions, at 2014–15 prices
Notes: The yellow vertical line on each chart represents the average price for the corresponding region. The production share sold below the variable cost of production is shaded brown, the share sold at a price where gross margins were positive but not sufficient to cover replanting costs is shaded burgundy and the share sold at or above the price at which replanting is profitable is shaded orange. Source: ABARES model output
Figure 10 Estimated production shares, by profitability group and region, at 2014–15 prices
Notes: Negative GM—the proportion of wine grape production sold at prices which are less than the low breakeven price (vineyard profitability group 1); Positive GM—the proportion of wine grape production sold at prices between the high and low breakeven prices (vineyard profitability group 2); Replanting profitable—the proportion of wine grape production sold at prices above the high breakeven price (vineyard profitability group 3). Source: ABARES model output
500 1000 2000
0.20.6
1.0
Share of tonnag Hunter Valley
Price ($/tonne)
Cumu
lative
prop
ortion
500 1000 2000
0.00.4
0.8
Share of tonnag Big Rivers
Price ($/tonne)
Cumu
lative
prop
ortion
500 1500 2500
0.00.4
0.8
Share of tonnage Barossa
Price ($/tonne)
Cumu
lative
prop
ortion
500 1500 2500
0.00.4
0.8
Share of tonnag Greater Perth
Price ($/tonne)
Cumu
lative
prop
ortion
Economic impacts of Xylella fastidiosa on Australian wine grape and wine-making industries
25
Estimating the economic impacts with 2014–15 wine grape prices There is a considerable degree of uncertainty about how X. fastidiosa would spread in Australia because current research is based on an insect vector which is not found in Australia. And understanding which wine grape areas would be at risk, the rate at which the bacteria would spread across the wine regions, the extent and duration of the impacts, and the economic consequences of those impacts is complex. As all these components are inherently uncertain, ABARES derived a range of scenarios to cover a range of possibilities.
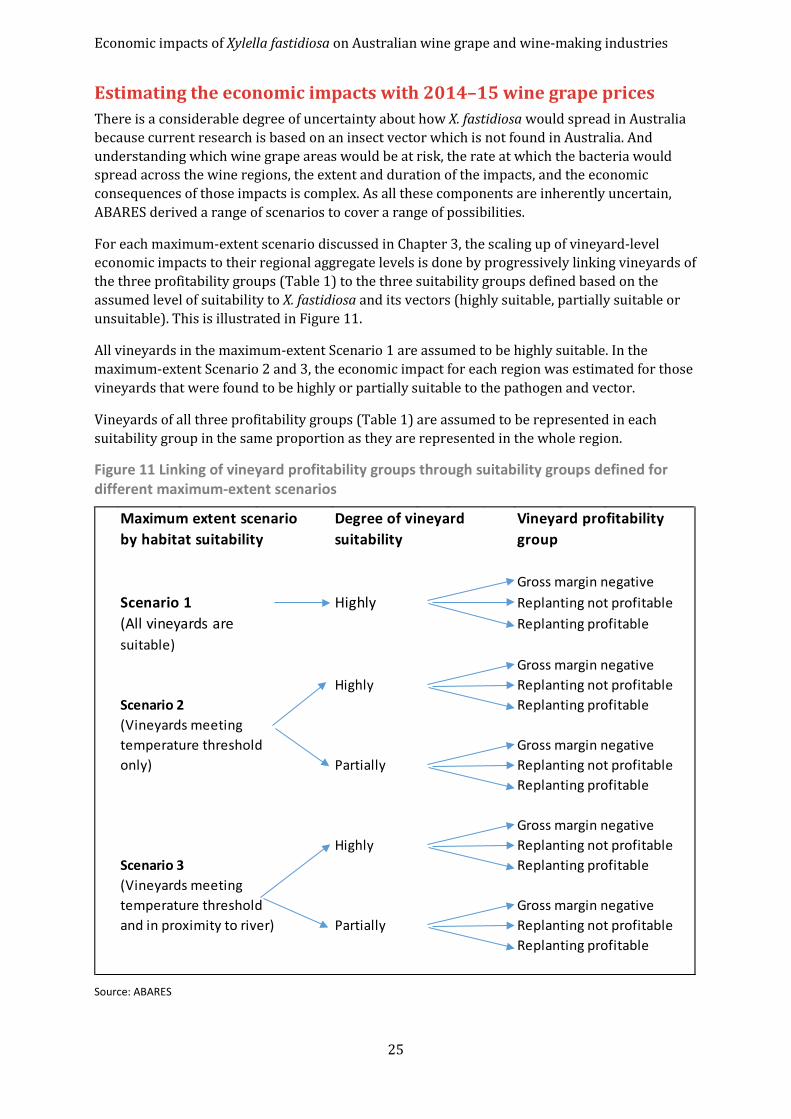
For each maximum-extent scenario discussed in Chapter 3, the scaling up of vineyard-level economic impacts to their regional aggregate levels is done by progressively linking vineyards of the three profitability groups (Table 1) to the three suitability groups defined based on the assumed level of suitability to X. fastidiosa and its vectors (highly suitable, partially suitable or unsuitable). This is illustrated in Figure 11.
All vineyards in the maximum-extent Scenario 1 are assumed to be highly suitable. In the maximum-extent Scenario 2 and 3, the economic impact for each region was estimated for those vineyards that were found to be highly or partially suitable to the pathogen and vector.
Vineyards of all three profitability groups (Table 1) are assumed to be represented in each suitability group in the same proportion as they are represented in the whole region.
Figure 11 Linking of vineyard profitability groups through suitability groups defined for different maximum-extent scenarios
Source: ABARES
Maximum extent scenario Degree of vineyard Vineyard profitabilityby habitat suitability suitability group
Gross margin negativeScenario 1 Highly Replanting not profitable(All vineyards are Replanting profitablesuitable)
Gross margin negativeHighly Replanting not profitable
Scenario 2 Replanting profitable(Vineyards meetingtemperature threshold Gross margin negativeonly) Partially Replanting not profitable
Replanting profitable
Gross margin negativeHighly Replanting not profitable
Scenario 3 Replanting profitable(Vineyards meetingtemperature threshold Gross margin negativeand in proximity to river) Partially Replanting not profitable
Replanting profitable
Economic impacts of Xylella fastidiosa on Australian wine grape and wine-making industries
26
The economic impact for each scenario is the sum of economic impacts estimated for the two different suitability groups of vineyards shown in Figure 11. And, the economic impact for each suitability group is the sum of economic impacts estimated for the three different sub groups of vineyards based on profitability levels, also shown in Figure 11.
Since the first profitability group of vineyards is selling wine grapes at a price less than the variable cost of production, this group could be saving the cost of variable inputs used over and above the price received, if the vineyards are abandoned. However, this apparent benefit is ignored in the analysis and profitability group 1 did not contribute to the overall estimate of vineyard level impact. The economic impact for the second profitability group of vineyards is estimated as the present value of the future stream of gross margins that will be lost, if the vineyards are abandoned.
The economic losses to the third profitability group of vineyards comprise all adjustment costs associated with the series of rolling replanting investments made over the planning horizon. As X. fastidiosa spreads over time, affected vines are replaced on an on-going basis with each year’s replanting decision resulting in a one-off capital cost and lost net incomes over a number of years until new vines come to the full–bearing age. A partial or rolling replanting method results in reduced long term adjustment costs compared to the costs if all vines—not just the affected ones—were replaced in the first year of within-vineyard spread. The economic impacts for this profitability group is estimated, in present value terms, as the sum of all financial costs resulting from the removal and replanting activities undertaken in all years over the planning horizon.
Annual vineyard replanting costs and foregone revenues ABARES estimated the changes to annual vineyard costs and revenues arising from replanting vines in a given year. Wine grape growers are likely to replant the affected vines with planting materials propagated from a resistant cultivar, if it is profitable in the long run. It is assumed that replanting is done one year after vines are affected on an on-going basis as X. fastidiosa spreads over time. The financial implications of the decision to replace vines affected in a given year are two-fold:
1) a one-off capital investment in year 1 to replace dead vines with resistant vines
2) a period of shortfall in gross margins until newly established vines reach full-bearing age.
For simplicity, it is assumed that a Xylella-resistant vine will produce the same yield, quality and cost profile as the original non- Xylella resistant vine.
The on-going shortfall in gross margins in the years immediately after replacing affected vines is equal to the difference between the foregone gross margins from the affected full-bearing age vines and the gross margin received from the new vines. The gross margins from the new vines are negative in the early years, due to the costs of caring and nurturing young vines until they grow to full-bearing age and the low yield. Even when gross margins from the replanted vines become positive, they are still less than the gross margins obtained from full-bearing vines.
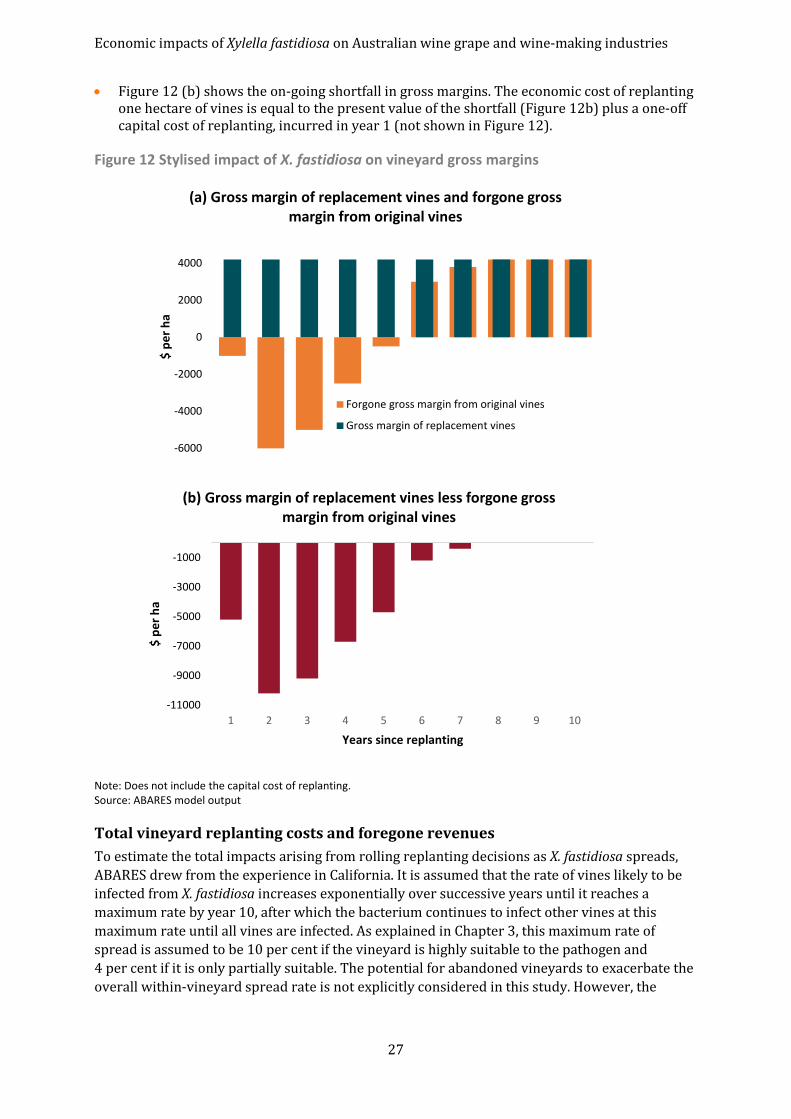
The annual economic impact from replanting vines are illustrated in Figure 12 for a typical hectare of vines.
• Figure 12 (a) shows the foregone on-going stream of gross margins from original vines and the gross margins from the new vines that replaced them
Economic impacts of Xylella fastidiosa on Australian wine grape and wine-making industries
27
• Figure 12 (b) shows the on-going shortfall in gross margins. The economic cost of replanting one hectare of vines is equal to the present value of the shortfall (Figure 12b) plus a one-off capital cost of replanting, incurred in year 1 (not shown in Figure 12).
Figure 12 Stylised impact of X. fastidiosa on vineyard gross margins
Note: Does not include the capital cost of replanting. Source: ABARES model output
Total vineyard replanting costs and foregone revenues To estimate the total impacts arising from rolling replanting decisions as X. fastidiosa spreads, ABARES drew from the experience in California. It is assumed that the rate of vines likely to be infected from X. fastidiosa increases exponentially over successive years until it reaches a maximum rate by year 10, after which the bacterium continues to infect other vines at this maximum rate until all vines are infected. As explained in Chapter 3, this maximum rate of spread is assumed to be 10 per cent if the vineyard is highly suitable to the pathogen and 4 per cent if it is only partially suitable. The potential for abandoned vineyards to exacerbate the overall within-vineyard spread rate is not explicitly considered in this study. However, the
-6000
-4000
-2000
0
2000
4000
$ pe
r ha
(a) Gross margin of replacement vines and forgone gross margin from original vines
Forgone gross margin from original vines
Gross margin of replacement vines
-11000
-9000
-7000
-5000
-3000
-1000
1 2 3 4 5 6 7 8 9 10
$ pe
r ha
Years since replanting
(b) Gross margin of replacement vines less forgone gross margin from original vines
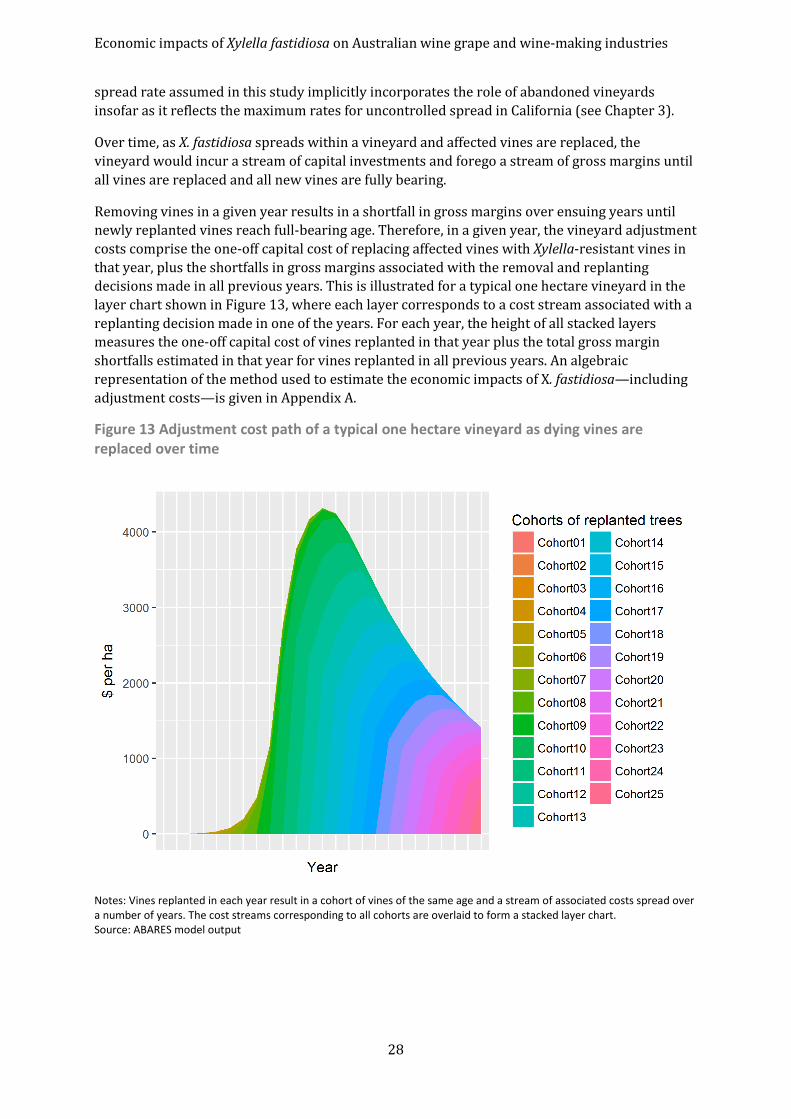
Economic impacts of Xylella fastidiosa on Australian wine grape and wine-making industries
28
spread rate assumed in this study implicitly incorporates the role of abandoned vineyards insofar as it reflects the maximum rates for uncontrolled spread in California (see Chapter 3).
Over time, as X. fastidiosa spreads within a vineyard and affected vines are replaced, the vineyard would incur a stream of capital investments and forego a stream of gross margins until all vines are replaced and all new vines are fully bearing.
Removing vines in a given year results in a shortfall in gross margins over ensuing years until newly replanted vines reach full-bearing age. Therefore, in a given year, the vineyard adjustment costs comprise the one-off capital cost of replacing affected vines with Xylella-resistant vines in that year, plus the shortfalls in gross margins associated with the removal and replanting decisions made in all previous years. This is illustrated for a typical one hectare vineyard in the layer chart shown in Figure 13, where each layer corresponds to a cost stream associated with a replanting decision made in one of the years. For each year, the height of all stacked layers measures the one-off capital cost of vines replanted in that year plus the total gross margin shortfalls estimated in that year for vines replanted in all previous years. An algebraic representation of the method used to estimate the economic impacts of X. fastidiosa—including adjustment costs—is given in Appendix A.
Figure 13 Adjustment cost path of a typical one hectare vineyard as dying vines are replaced over time
Notes: Vines replanted in each year result in a cohort of vines of the same age and a stream of associated costs spread over a number of years. The cost streams corresponding to all cohorts are overlaid to form a stacked layer chart. Source: ABARES model output
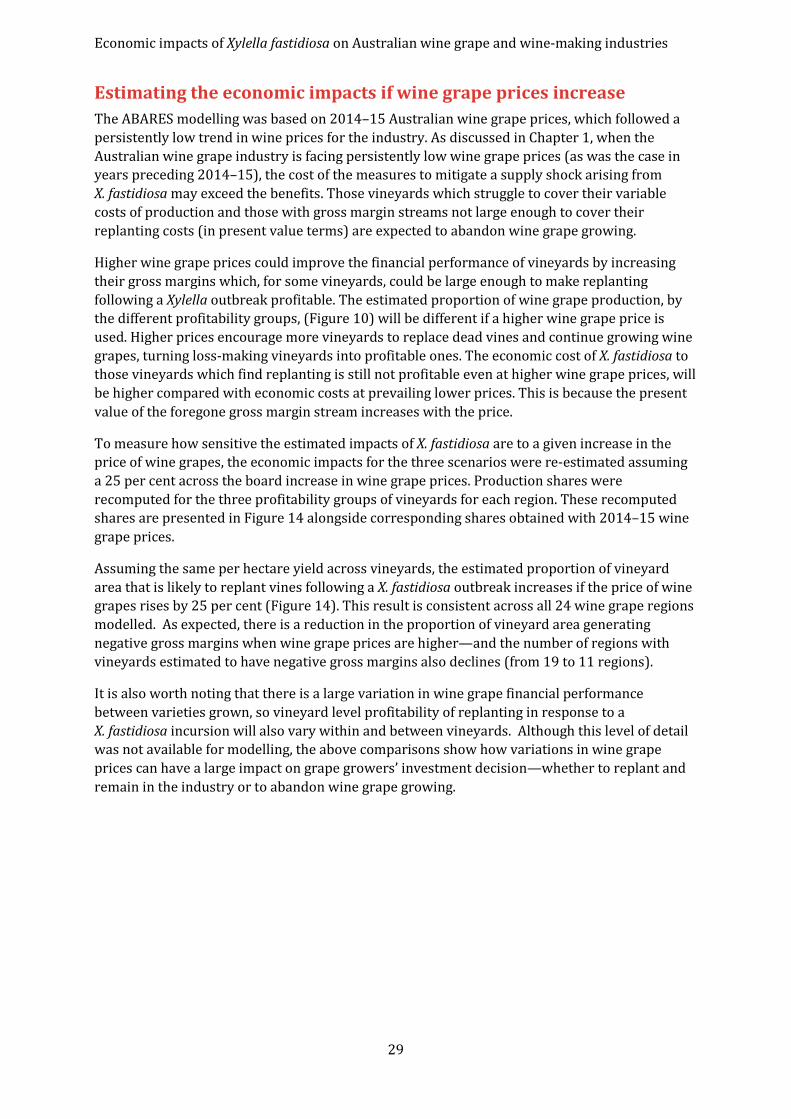
Economic impacts of Xylella fastidiosa on Australian wine grape and wine-making industries
29
Estimating the economic impacts if wine grape prices increase The ABARES modelling was based on 2014–15 Australian wine grape prices, which followed a persistently low trend in wine prices for the industry. As discussed in Chapter 1, when the Australian wine grape industry is facing persistently low wine grape prices (as was the case in years preceding 2014–15), the cost of the measures to mitigate a supply shock arising from X. fastidiosa may exceed the benefits. Those vineyards which struggle to cover their variable costs of production and those with gross margin streams not large enough to cover their replanting costs (in present value terms) are expected to abandon wine grape growing.
Higher wine grape prices could improve the financial performance of vineyards by increasing their gross margins which, for some vineyards, could be large enough to make replanting following a Xylella outbreak profitable. The estimated proportion of wine grape production, by the different profitability groups, (Figure 10) will be different if a higher wine grape price is used. Higher prices encourage more vineyards to replace dead vines and continue growing wine grapes, turning loss-making vineyards into profitable ones. The economic cost of X. fastidiosa to those vineyards which find replanting is still not profitable even at higher wine grape prices, will be higher compared with economic costs at prevailing lower prices. This is because the present value of the foregone gross margin stream increases with the price.
To measure how sensitive the estimated impacts of X. fastidiosa are to a given increase in the price of wine grapes, the economic impacts for the three scenarios were re-estimated assuming a 25 per cent across the board increase in wine grape prices. Production shares were recomputed for the three profitability groups of vineyards for each region. These recomputed shares are presented in Figure 14 alongside corresponding shares obtained with 2014–15 wine grape prices.
Assuming the same per hectare yield across vineyards, the estimated proportion of vineyard area that is likely to replant vines following a X. fastidiosa outbreak increases if the price of wine grapes rises by 25 per cent (Figure 14). This result is consistent across all 24 wine grape regions modelled. As expected, there is a reduction in the proportion of vineyard area generating negative gross margins when wine grape prices are higher—and the number of regions with vineyards estimated to have negative gross margins also declines (from 19 to 11 regions).
It is also worth noting that there is a large variation in wine grape financial performance between varieties grown, so vineyard level profitability of replanting in response to a X. fastidiosa incursion will also vary within and between vineyards. Although this level of detail was not available for modelling, the above comparisons show how variations in wine grape prices can have a large impact on grape growers’ investment decision—whether to replant and remain in the industry or to abandon wine grape growing.
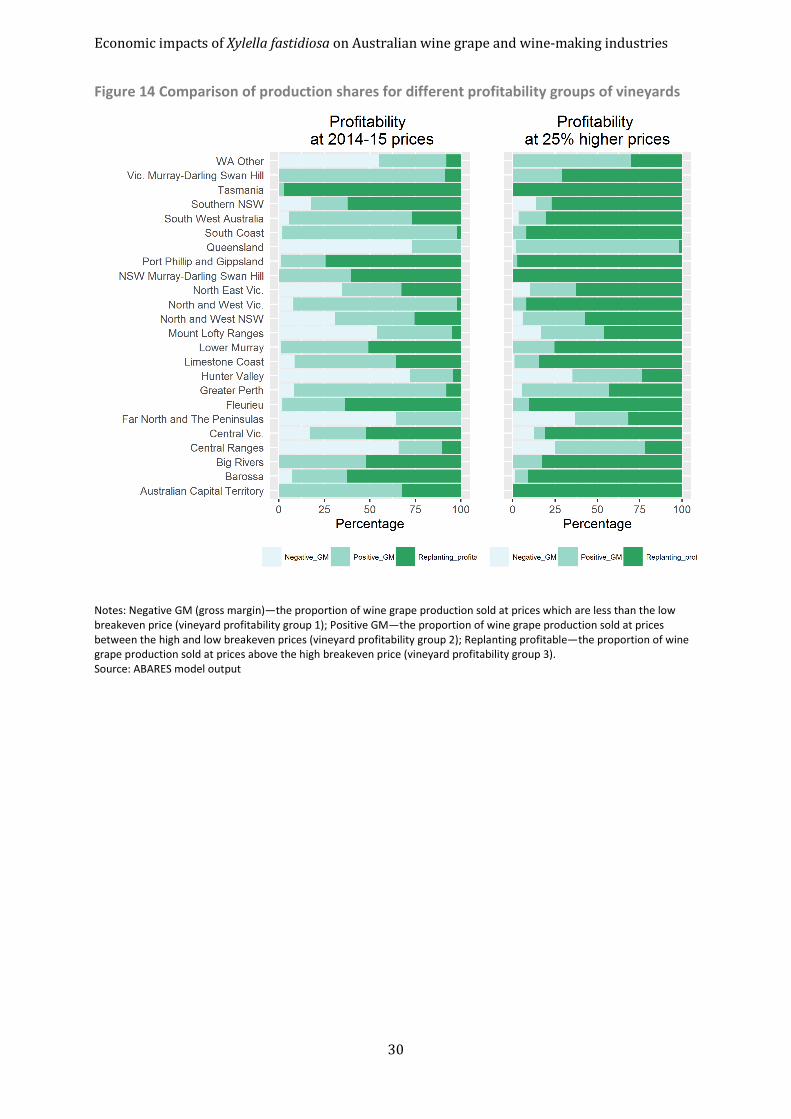
Economic impacts of Xylella fastidiosa on Australian wine grape and wine-making industries
30
Figure 14 Comparison of production shares for different profitability groups of vineyards
Notes: Negative GM (gross margin)—the proportion of wine grape production sold at prices which are less than the low breakeven price (vineyard profitability group 1); Positive GM—the proportion of wine grape production sold at prices between the high and low breakeven prices (vineyard profitability group 2); Replanting profitable—the proportion of wine grape production sold at prices above the high breakeven price (vineyard profitability group 3). Source: ABARES model output
Economic impacts of Xylella fastidiosa on Australian wine grape and wine-making industries
31
5 Economic impacts at the industry level
The Australian wine industry includes grape growing, wine making, wine marketing and wine-related tourism. This industry provides a direct economic contribution to gross domestic product (GDP) and employment. These four components of the Australian wine sector also generate flow-on (or indirect) economic contributions to the Australian economy via linkages to other sectors of the economy—in particular industries that supply goods and services required for grape growing, wine making, wine marketing and wine tourism—as well as via linkages to sectors that supply the goods and services demanded by wine sector employees (AgEconPlus 2015).
In this Chapter, ABARES focussed on the economic impact of an X. fastidiosa outbreak on two major components of the Australian wine industry: the wine grape industry and wine making industry.
Economic impacts on the wine grape industry The economic impact of X. fastidiosa on the wine grape industry will depend on three previously identified determinants of habitat suitability, where: all vineyards are suitable (Scenario 1); vineyard suitability is limited to those which meet the temperature threshold (Scenario 2); or vineyards meet both the temperature threshold and are in close proximity to riparian vegetation (Scenario 3). Industry losses will also depend on the mix of vineyards belonging to three profitability groups and on prevailing wine grape prices.
Regional impacts Vineyard level impacts estimated in the previous Chapter—illustrated in Figure 12 and Figure 13—were aggregated to estimate regional impacts. Figure 15 compares the regional level impacts on the wine grape industry between Scenario 2 and Scenario 3—the two habitat suitability scenarios. Figure 20 in Appendix B presents the same information for Scenario 1—but disregards differences in habitat suitability and deems all vineyards to be highly suitable. Based on 2014–15 wine grape prices, around 72 to 75 per cent of the costs to the wine grape growing industry resulting from a X. fastidiosa outbreak are attributed to the cost of replanting and associated short term gross margin losses—as shown in Figure 15 and Figure 20 (Appendix B). The remainder—around 25 to 28 per cent of the total cost—is the foregone gross margins from vineyards that abandoned wine grape growing because replanting was not profitable.
The costs estimated for individual regions varied depending on total wine grape area, the area exposed to factors conducive to X. fastidiosa (temperature threshold or both temperature threshold and proximity to riparian vegetation) and the variability in vineyard financial performance (loss making, replanting not profitable, and replanting profitable). Big Rivers, Fleurieu, Barossa and Lower Murray, are among the top six regions likely to be most affected, regardless of which factor determines the suitability of vineyards. The Lower Murray region is estimated to account for the largest share of the total wine grape industry losses (22 per cent or $396 million out of $1.7 billion total losses) if minimum winter temperature alone determines the suitability (Scenario 2), but represents the fifth largest share of the total industry losses, if proximity to riparian vegetation also matters (Scenario 3). When both factors jointly determine suitability, the Big Rivers region is estimated to account for the largest share of total wine grape industry losses (26 per cent or $182 million out of $0.7 billion total losses). In both scenarios,
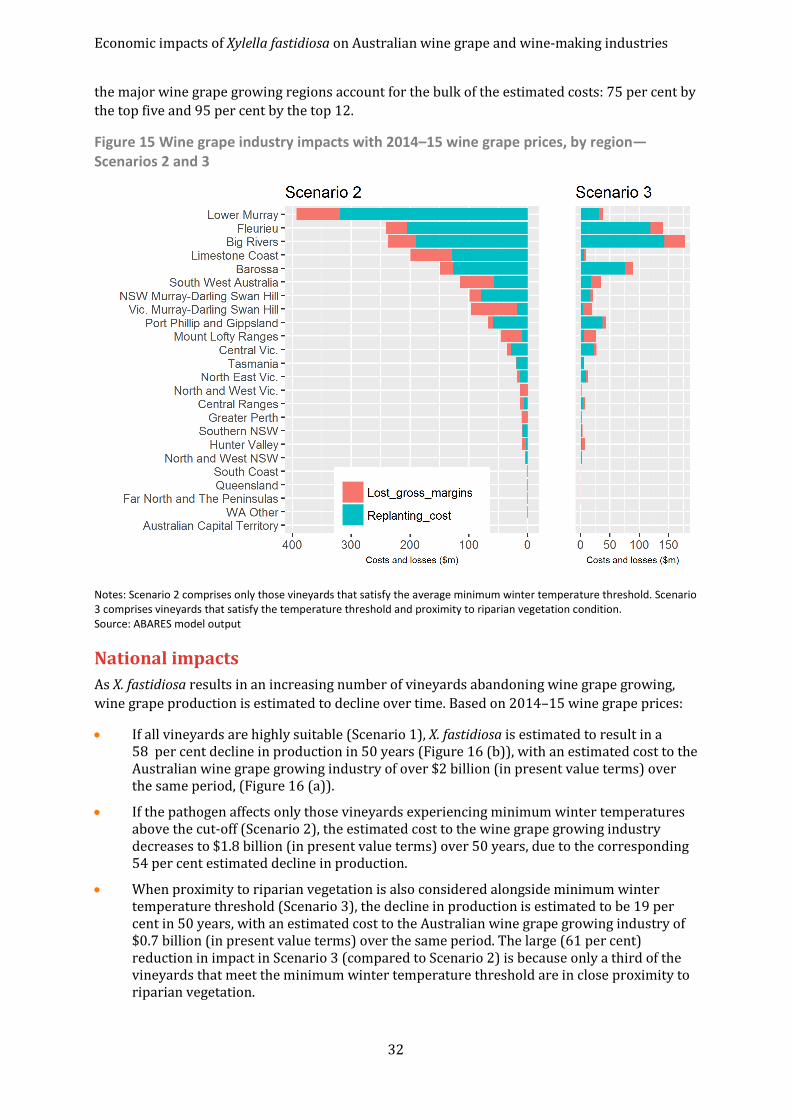
Economic impacts of Xylella fastidiosa on Australian wine grape and wine-making industries
32
the major wine grape growing regions account for the bulk of the estimated costs: 75 per cent by the top five and 95 per cent by the top 12.
Figure 15 Wine grape industry impacts with 2014–15 wine grape prices, by region— Scenarios 2 and 3
Notes: Scenario 2 comprises only those vineyards that satisfy the average minimum winter temperature threshold. Scenario 3 comprises vineyards that satisfy the temperature threshold and proximity to riparian vegetation condition. Source: ABARES model output
National impacts As X. fastidiosa results in an increasing number of vineyards abandoning wine grape growing, wine grape production is estimated to decline over time. Based on 2014–15 wine grape prices:
• If all vineyards are highly suitable (Scenario 1), X. fastidiosa is estimated to result in a 58 per cent decline in production in 50 years (Figure 16 (b)), with an estimated cost to the Australian wine grape growing industry of over $2 billion (in present value terms) over the same period, (Figure 16 (a)).
• If the pathogen affects only those vineyards experiencing minimum winter temperatures above the cut-off (Scenario 2), the estimated cost to the wine grape growing industry decreases to $1.8 billion (in present value terms) over 50 years, due to the corresponding 54 per cent estimated decline in production.
• When proximity to riparian vegetation is also considered alongside minimum winter temperature threshold (Scenario 3), the decline in production is estimated to be 19 per cent in 50 years, with an estimated cost to the Australian wine grape growing industry of $0.7 billion (in present value terms) over the same period. The large (61 per cent) reduction in impact in Scenario 3 (compared to Scenario 2) is because only a third of the vineyards that meet the minimum winter temperature threshold are in close proximity to riparian vegetation.
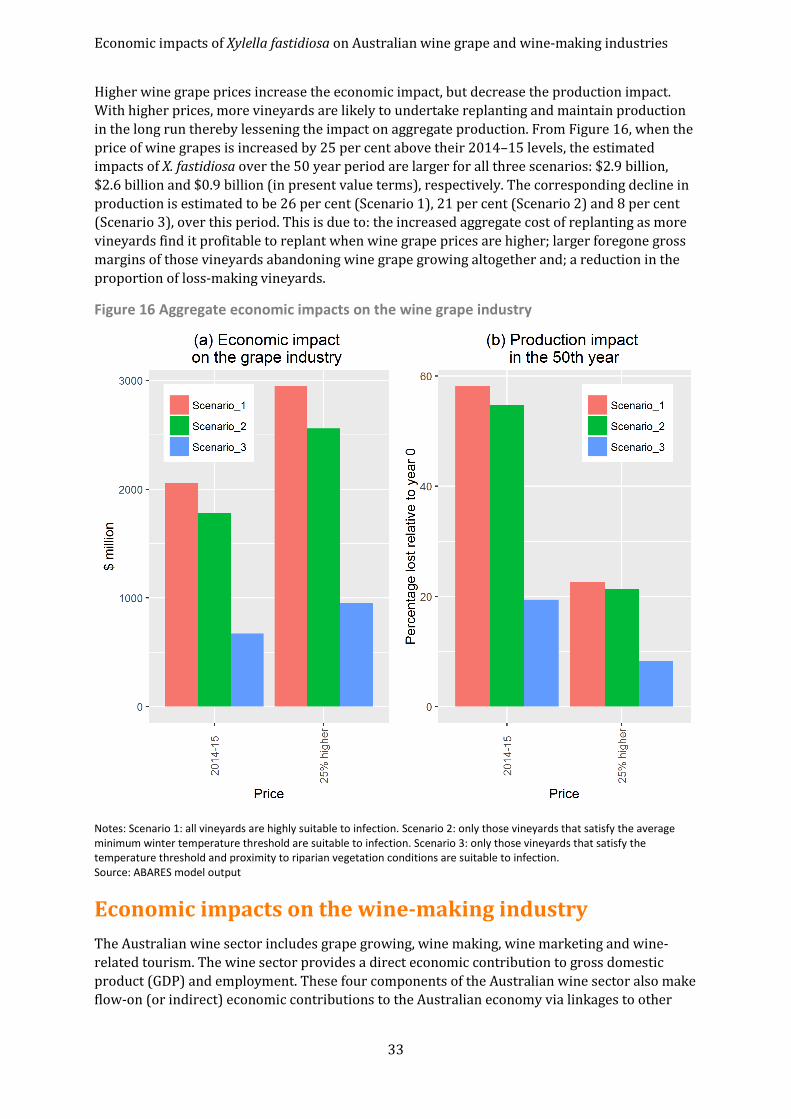
Economic impacts of Xylella fastidiosa on Australian wine grape and wine-making industries
33
Higher wine grape prices increase the economic impact, but decrease the production impact. With higher prices, more vineyards are likely to undertake replanting and maintain production in the long run thereby lessening the impact on aggregate production. From Figure 16, when the price of wine grapes is increased by 25 per cent above their 2014–15 levels, the estimated impacts of X. fastidiosa over the 50 year period are larger for all three scenarios: $2.9 billion, $2.6 billion and $0.9 billion (in present value terms), respectively. The corresponding decline in production is estimated to be 26 per cent (Scenario 1), 21 per cent (Scenario 2) and 8 per cent (Scenario 3), over this period. This is due to: the increased aggregate cost of replanting as more vineyards find it profitable to replant when wine grape prices are higher; larger foregone gross margins of those vineyards abandoning wine grape growing altogether and; a reduction in the proportion of loss-making vineyards.
Figure 16 Aggregate economic impacts on the wine grape industry
Notes: Scenario 1: all vineyards are highly suitable to infection. Scenario 2: only those vineyards that satisfy the average minimum winter temperature threshold are suitable to infection. Scenario 3: only those vineyards that satisfy the temperature threshold and proximity to riparian vegetation conditions are suitable to infection. Source: ABARES model output
Economic impacts on the wine-making industry The Australian wine sector includes grape growing, wine making, wine marketing and wine-related tourism. The wine sector provides a direct economic contribution to gross domestic product (GDP) and employment. These four components of the Australian wine sector also make flow-on (or indirect) economic contributions to the Australian economy via linkages to other
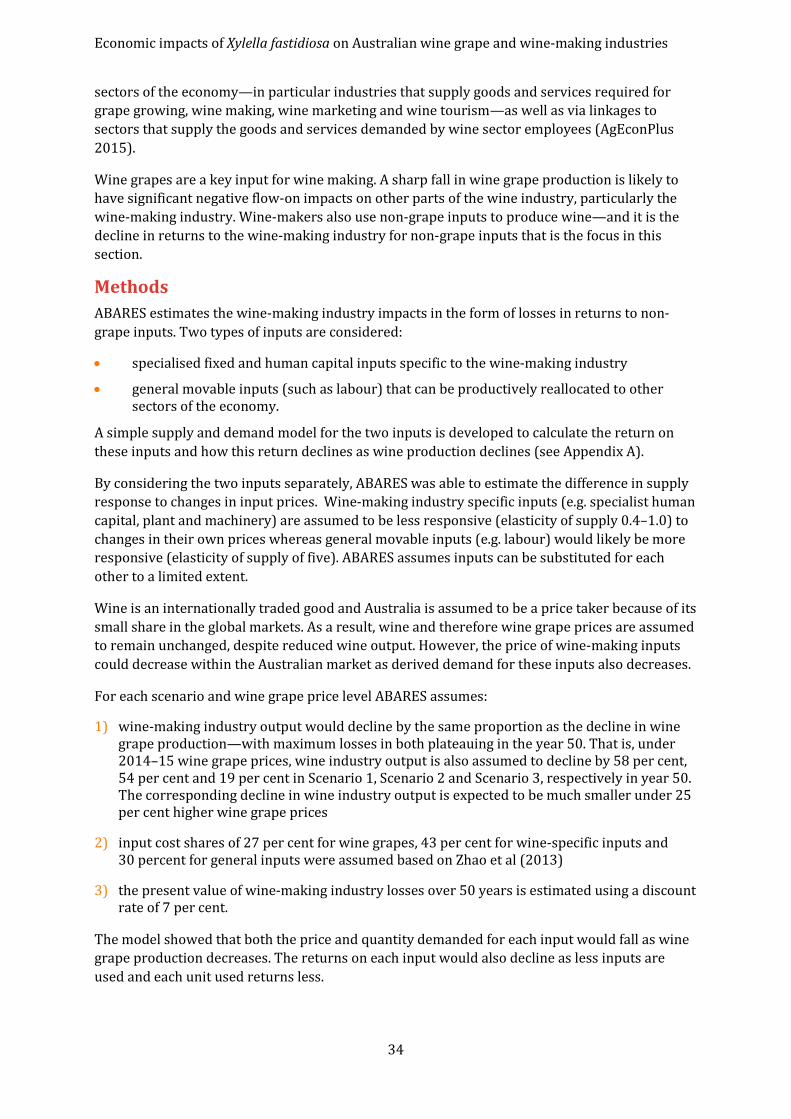
Economic impacts of Xylella fastidiosa on Australian wine grape and wine-making industries
34
sectors of the economy—in particular industries that supply goods and services required for grape growing, wine making, wine marketing and wine tourism—as well as via linkages to sectors that supply the goods and services demanded by wine sector employees (AgEconPlus 2015).
Wine grapes are a key input for wine making. A sharp fall in wine grape production is likely to have significant negative flow-on impacts on other parts of the wine industry, particularly the wine-making industry. Wine-makers also use non-grape inputs to produce wine—and it is the decline in returns to the wine-making industry for non-grape inputs that is the focus in this section.
Methods ABARES estimates the wine-making industry impacts in the form of losses in returns to non-grape inputs. Two types of inputs are considered:
• specialised fixed and human capital inputs specific to the wine-making industry
• general movable inputs (such as labour) that can be productively reallocated to other sectors of the economy.
A simple supply and demand model for the two inputs is developed to calculate the return on these inputs and how this return declines as wine production declines (see Appendix A).
By considering the two inputs separately, ABARES was able to estimate the difference in supply response to changes in input prices. Wine-making industry specific inputs (e.g. specialist human capital, plant and machinery) are assumed to be less responsive (elasticity of supply 0.4–1.0) to changes in their own prices whereas general movable inputs (e.g. labour) would likely be more responsive (elasticity of supply of five). ABARES assumes inputs can be substituted for each other to a limited extent.
Wine is an internationally traded good and Australia is assumed to be a price taker because of its small share in the global markets. As a result, wine and therefore wine grape prices are assumed to remain unchanged, despite reduced wine output. However, the price of wine-making inputs could decrease within the Australian market as derived demand for these inputs also decreases.
For each scenario and wine grape price level ABARES assumes:
1) wine-making industry output would decline by the same proportion as the decline in wine grape production—with maximum losses in both plateauing in the year 50. That is, under 2014–15 wine grape prices, wine industry output is also assumed to decline by 58 per cent, 54 per cent and 19 per cent in Scenario 1, Scenario 2 and Scenario 3, respectively in year 50. The corresponding decline in wine industry output is expected to be much smaller under 25 per cent higher wine grape prices
2) input cost shares of 27 per cent for wine grapes, 43 per cent for wine-specific inputs and 30 percent for general inputs were assumed based on Zhao et al (2013)
3) the present value of wine-making industry losses over 50 years is estimated using a discount rate of 7 per cent.
The model showed that both the price and quantity demanded for each input would fall as wine grape production decreases. The returns on each input would also decline as less inputs are used and each unit used returns less.
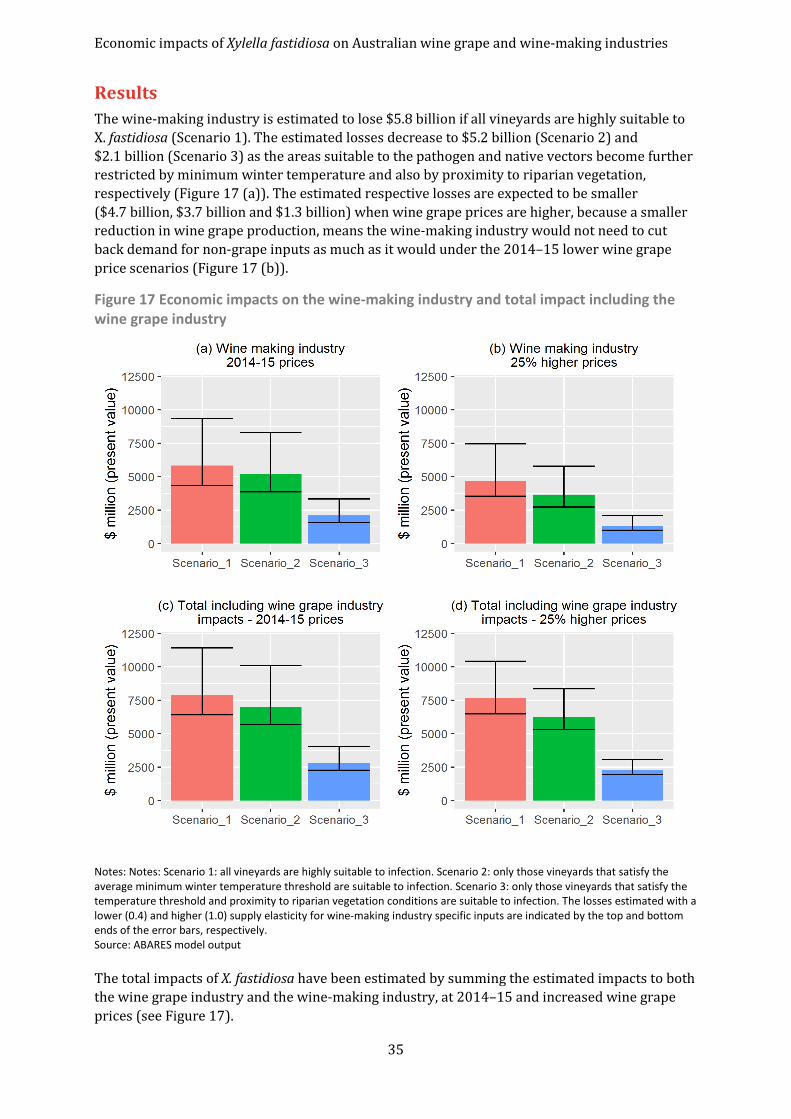
Economic impacts of Xylella fastidiosa on Australian wine grape and wine-making industries
35
Results The wine-making industry is estimated to lose $5.8 billion if all vineyards are highly suitable to X. fastidiosa (Scenario 1). The estimated losses decrease to $5.2 billion (Scenario 2) and $2.1 billion (Scenario 3) as the areas suitable to the pathogen and native vectors become further restricted by minimum winter temperature and also by proximity to riparian vegetation, respectively (Figure 17 (a)). The estimated respective losses are expected to be smaller ($4.7 billion, $3.7 billion and $1.3 billion) when wine grape prices are higher, because a smaller reduction in wine grape production, means the wine-making industry would not need to cut back demand for non-grape inputs as much as it would under the 2014–15 lower wine grape price scenarios (Figure 17 (b)).
Figure 17 Economic impacts on the wine-making industry and total impact including the wine grape industry
Notes: Notes: Scenario 1: all vineyards are highly suitable to infection. Scenario 2: only those vineyards that satisfy the average minimum winter temperature threshold are suitable to infection. Scenario 3: only those vineyards that satisfy the temperature threshold and proximity to riparian vegetation conditions are suitable to infection. The losses estimated with a lower (0.4) and higher (1.0) supply elasticity for wine-making industry specific inputs are indicated by the top and bottom ends of the error bars, respectively. Source: ABARES model output
The total impacts of X. fastidiosa have been estimated by summing the estimated impacts to both the wine grape industry and the wine-making industry, at 2014–15 and increased wine grape prices (see Figure 17).
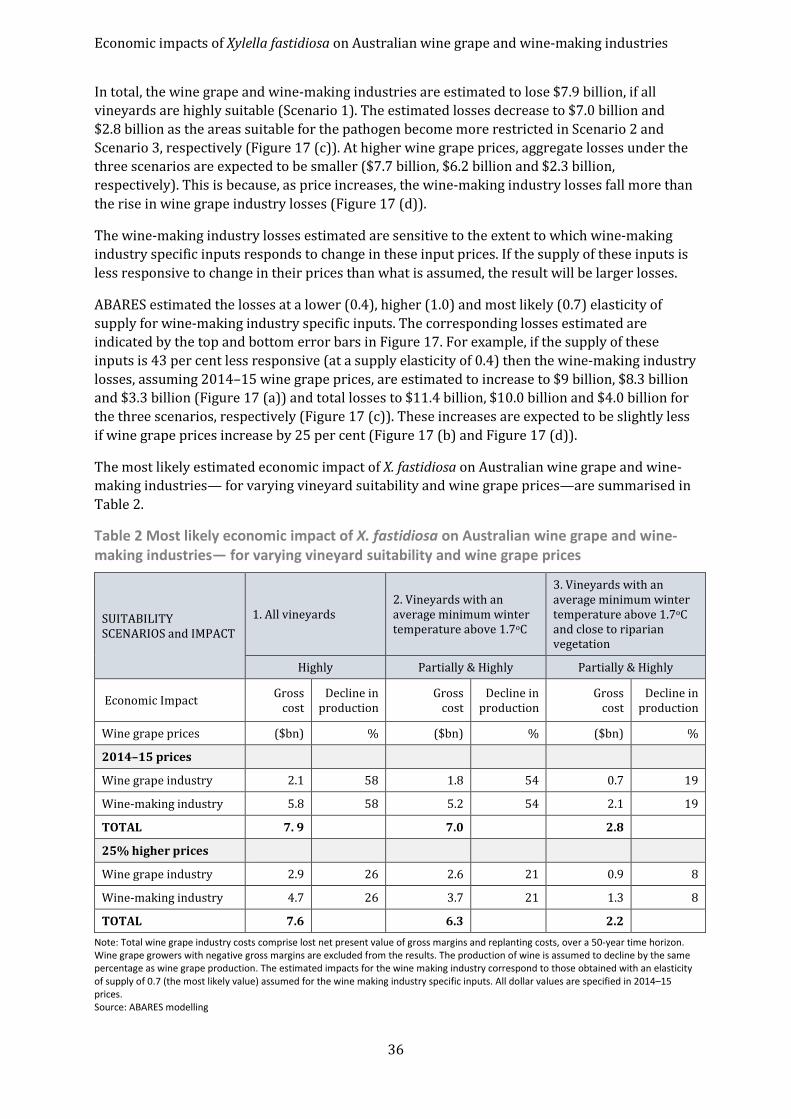
Economic impacts of Xylella fastidiosa on Australian wine grape and wine-making industries
36
In total, the wine grape and wine-making industries are estimated to lose $7.9 billion, if all vineyards are highly suitable (Scenario 1). The estimated losses decrease to $7.0 billion and $2.8 billion as the areas suitable for the pathogen become more restricted in Scenario 2 and Scenario 3, respectively (Figure 17 (c)). At higher wine grape prices, aggregate losses under the three scenarios are expected to be smaller ($7.7 billion, $6.2 billion and $2.3 billion, respectively). This is because, as price increases, the wine-making industry losses fall more than the rise in wine grape industry losses (Figure 17 (d)).
The wine-making industry losses estimated are sensitive to the extent to which wine-making industry specific inputs responds to change in these input prices. If the supply of these inputs is less responsive to change in their prices than what is assumed, the result will be larger losses.
ABARES estimated the losses at a lower (0.4), higher (1.0) and most likely (0.7) elasticity of supply for wine-making industry specific inputs. The corresponding losses estimated are indicated by the top and bottom error bars in Figure 17. For example, if the supply of these inputs is 43 per cent less responsive (at a supply elasticity of 0.4) then the wine-making industry losses, assuming 2014–15 wine grape prices, are estimated to increase to $9 billion, $8.3 billion and $3.3 billion (Figure 17 (a)) and total losses to $11.4 billion, $10.0 billion and $4.0 billion for the three scenarios, respectively (Figure 17 (c)). These increases are expected to be slightly less if wine grape prices increase by 25 per cent (Figure 17 (b) and Figure 17 (d)).
The most likely estimated economic impact of X. fastidiosa on Australian wine grape and wine-making industries— for varying vineyard suitability and wine grape prices—are summarised in Table 2.
Table 2 Most likely economic impact of X. fastidiosa on Australian wine grape and wine-making industries— for varying vineyard suitability and wine grape prices
SUITABILITY SCENARIOS and IMPACT
1. All vineyards 2. Vineyards with an average minimum winter temperature above 1.7oC
3. Vineyards with an average minimum winter temperature above 1.7oC and close to riparian vegetation
Highly Partially & Highly Partially & Highly
Economic Impact Gross cost
Decline in production
Gross cost
Decline in production
Gross cost
Decline in production
Wine grape prices ($bn) % ($bn) % ($bn) %
2014–15 prices Wine grape industry 2.1 58 1.8 54 0.7 19
Wine-making industry 5.8 58 5.2 54 2.1 19
TOTAL 7. 9 7.0 2.8
25% higher prices
Wine grape industry 2.9 26 2.6 21 0.9 8
Wine-making industry 4.7 26 3.7 21 1.3 8
TOTAL 7.6 6.3 2.2
Note: Total wine grape industry costs comprise lost net present value of gross margins and replanting costs, over a 50-year time horizon. Wine grape growers with negative gross margins are excluded from the results. The production of wine is assumed to decline by the same percentage as wine grape production. The estimated impacts for the wine making industry correspond to those obtained with an elasticity of supply of 0.7 (the most likely value) assumed for the wine making industry specific inputs. All dollar values are specified in 2014–15 prices. Source: ABARES modelling
Economic impacts of Xylella fastidiosa on Australian wine grape and wine-making industries
37
6 Benefits of containment - case study The spread and economic modelling in previous chapters represent a set of scenarios in which X. fastidiosa is widespread and uncontrolled across the Australian landscape. While neither X. fastidiosa nor the glassy-winged sharpshooter have been detected in Australia, the study provides the Department and wine industry decision-makers with information on the economic benefits of keeping Australia X. fastidiosa -free, which could be used to compare with the costs of preventative measures, and with the costs of eradicating or containing the disease, should the pathogen establish.
The Department introduced emergency quarantine measures in November 2015 to reduce the likelihood of entry of X. fastidiosa and started work on a range of additional activities to prepare Australia in the event the pathogen and its vectors entered the country. Key additional activities included developing a surveillance strategy, building diagnostic capabilities, developing generic contingency plans for eradication, slowing the spread and management, and developing plans to support industry continuity in the event eradication fails.
The additional activities the department is undertaking to better prepare Australia can be seen as planning for appropriate response measures that could be undertaken at different stages of the biosecurity continuum (pre border, at the border and post border). However, the earlier the Xylella can be stopped along the biosecurity continuum, the more cost effective the control measure. That is, prevention is likely to cost less than eradication, and eradication is likely to cost less than containment.
This chapter presents estimates of aggregate losses to the wine grape and wine-making industries if X. fastidiosa is contained within the incursion region by preventing the outward movement of native vectors carrying the bacterium. These estimates are subsequently used in the estimation of losses avoided by containment.
The analysis presents an illustrative case, in which X. fastidiosa is detected in either the Murray Darling or Lower Murray region. It is assumed that the pathogen was not detected early enough to mount a successful eradication campaign, leaving containment of the spread within the incursion region as the management option that is more likely to succeed. The containment example considered in this study mirrors the containment program currently underway in California. The spread of Xyllela in California is contained to the Temecula Valley by preventing the spread of the glassy-winged sharpshooter further afield so that the wine grape industries in the nearby Napa and Sonoma Valleys could be protected. According to Alston et al. (2013), these containment measures were estimated to avoid a loss of over $US185 million a year.
The selection of the Murray Darling and Lower Murray regions for the case study is based on the habitat suitability assessment presented in Chapter 3, in which more than 85 per cent of the wine grape areas in these regions were found to be highly suitable if temperature threshold only determines the suitability (Figure 4), and their collective share of over 40 per cent of Australia’s wine grape production (ABS 2015). Additionally, the risk assessment done by Merriman (2001) found that the climatic and riparian conditions in the Sunraysia region in Victoria and other regions near the Murray and Murrumbidgee rivers are similar to the conditions in the Temecula Valley in California—where X. fastidiosa is causing significant industry losses since its introduction 100 years ago, and particularly after the introduction of the glassy-winged sharpshooter in 1997. These are also key horticultural regions in Australia and home to abundant native vectors. The pathogen is most likely to be transported there via imported nursery stock and plant material coming from countries where Xylella occurs—after breaching
Economic impacts of Xylella fastidiosa on Australian wine grape and wine-making industries
38
quarantine barriers designed to prevent its entry. The following section discusses the losses to each case study area, if Xylella is contained within the region boundaries, following its introduction.
Losses if the spread is contained to the incursion region Murray Darling In total, assuming the most likely value of the elasticity of supply for wine making specific inputs, the wine grape and wine-making industries were estimated to lose $2.0 billion over 50 years if all vineyards are highly suitable (Scenario 1) (Table 3). The losses decreased to $1.9 billion (Scenario 2) and $0.4 billion (Scenario 3) as the area suitable for the pathogen was restricted (Figure 18a). The losses decreased only marginally in Scenario 2 because almost all vineyards experienced minimum winter temperatures above the threshold. At higher wine grape prices, the losses over 50 years were estimated to be significantly less: $1.2 billion (Scenario 1), $1.1 billion (Scenario 2) and $0.2 billion (Scenario 3) (Figure 18b).
Table 3 Most likely economic impact of X. fastidiosa on the Murray Darling and Lower Murray wine grape regions— for varying vineyard suitability and wine grape prices
SUITABILITY SCENARIOS and REGIONAL IMPACT
1. All vineyards (Highly Susceptible)
2. Vineyards with average minimum
winter temperature above 1.7oC
(Partially & Highly)
3. Vineyards with average minimum
winter temperature above 1.7oC and close to riparian vegetation
(Partially & Highly)
($bn) ($bn) ($bn)
2014–15 prices:
Murray Darling 2.0 1.9 0.4
Lower Murray 1.2 1.1 0.2
25% higher prices:
Murray Darling 1.9 1.9 0.2
Lower Murray 1.5 1.5 0.2 Note: Total costs comprise lost gross margins and replanting costs for affected vineyards, and lost returns to non-grape inputs used in wine making, over a 50-year time horizon. Wine grape growers with negative gross margins are excluded from the results. The estimated impacts for the wine making industry correspond to those obtained with an elasticity of supply of 0.7 (the most likely value) assumed for the wine making industry specific inputs. All dollar values are specified in 2014–15 prices. Source: ABARES results
As in the case of losses from an uncontrolled spread (Chapter 5), the estimated wine-making industry losses were sensitive to the extent to which the supply of wine-making industry specific inputs responds to change in their prices. To estimate this a sensitivity analysis was undertaken by varying the supply responsiveness of the wine-making industry inputs (supply elasticity). The upper and lower bounds for each of the above estimates resulting from the sensitivity analysis are indicated by the top and bottom error bars appearing in Figure 18a and Figure 18b.
Lower Murray In total, assuming the most likely value of the elasticity of supply for wine making specific inputs, the wine grape and wine-making industries were estimated to lose $1.9 billion over 50 years in both Scenarios 1 and 2 (Table 3). The losses for Scenario 2 were not significantly lower than for Scenario 1 because almost all vineyards experience minimum winter temperatures above the threshold (Figure 18c and Table 3). The estimated losses fell to $0.4 billion in Scenario 3 as the
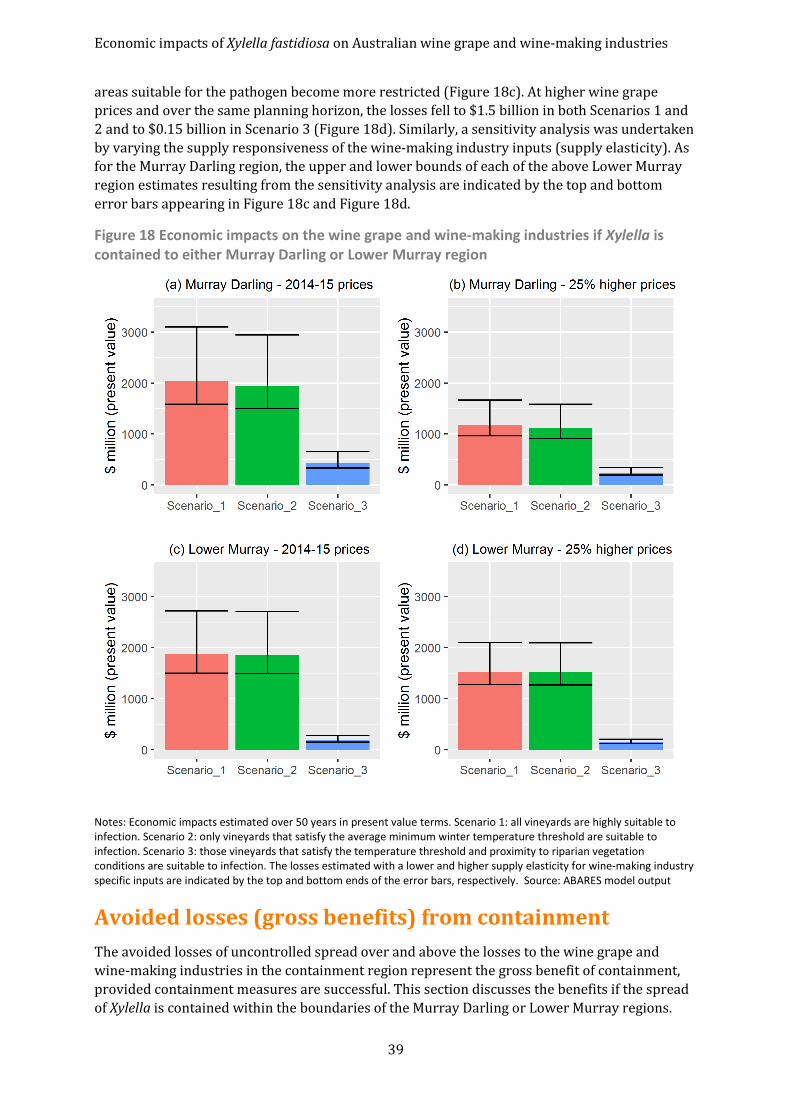
Economic impacts of Xylella fastidiosa on Australian wine grape and wine-making industries
39
areas suitable for the pathogen become more restricted (Figure 18c). At higher wine grape prices and over the same planning horizon, the losses fell to $1.5 billion in both Scenarios 1 and 2 and to $0.15 billion in Scenario 3 (Figure 18d). Similarly, a sensitivity analysis was undertaken by varying the supply responsiveness of the wine-making industry inputs (supply elasticity). As for the Murray Darling region, the upper and lower bounds of each of the above Lower Murray region estimates resulting from the sensitivity analysis are indicated by the top and bottom error bars appearing in Figure 18c and Figure 18d.
Figure 18 Economic impacts on the wine grape and wine-making industries if Xylella is contained to either Murray Darling or Lower Murray region
Notes: Economic impacts estimated over 50 years in present value terms. Scenario 1: all vineyards are highly suitable to infection. Scenario 2: only vineyards that satisfy the average minimum winter temperature threshold are suitable to infection. Scenario 3: those vineyards that satisfy the temperature threshold and proximity to riparian vegetation conditions are suitable to infection. The losses estimated with a lower and higher supply elasticity for wine-making industry specific inputs are indicated by the top and bottom ends of the error bars, respectively. Source: ABARES model output
Avoided losses (gross benefits) from containment The avoided losses of uncontrolled spread over and above the losses to the wine grape and wine-making industries in the containment region represent the gross benefit of containment, provided containment measures are successful. This section discusses the benefits if the spread of Xylella is contained within the boundaries of the Murray Darling or Lower Murray regions.
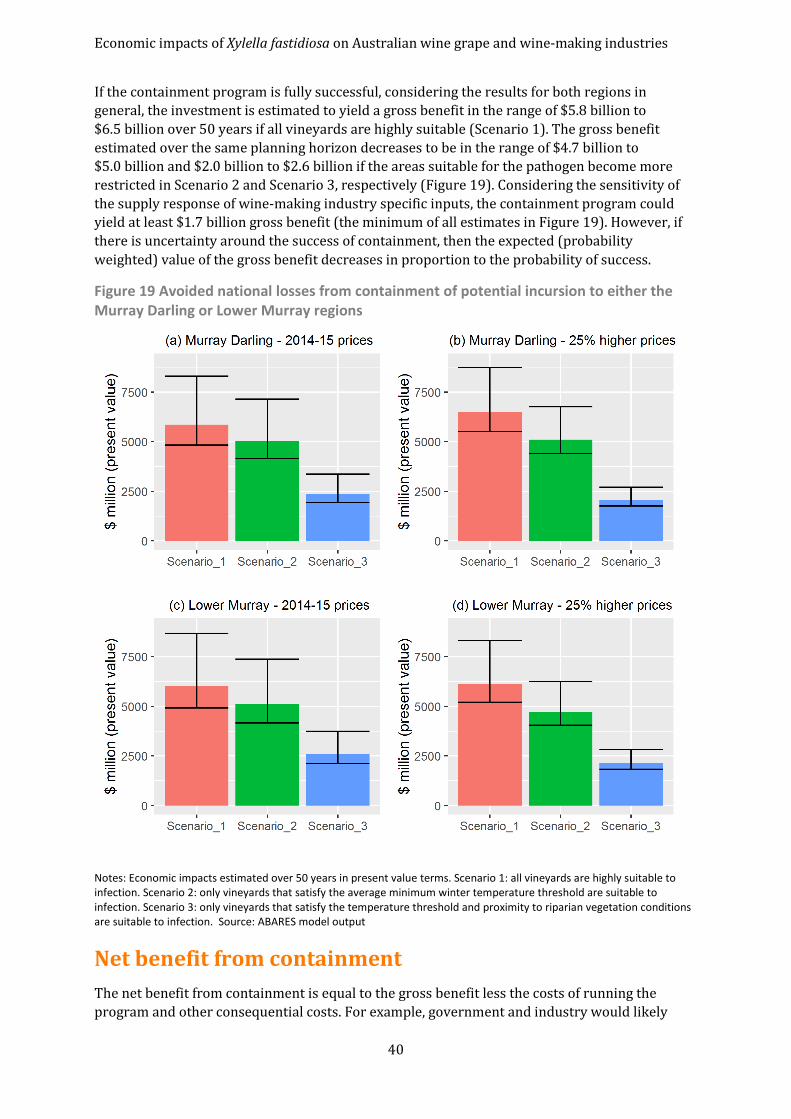
Economic impacts of Xylella fastidiosa on Australian wine grape and wine-making industries
40
If the containment program is fully successful, considering the results for both regions in general, the investment is estimated to yield a gross benefit in the range of $5.8 billion to $6.5 billion over 50 years if all vineyards are highly suitable (Scenario 1). The gross benefit estimated over the same planning horizon decreases to be in the range of $4.7 billion to $5.0 billion and $2.0 billion to $2.6 billion if the areas suitable for the pathogen become more restricted in Scenario 2 and Scenario 3, respectively (Figure 19). Considering the sensitivity of the supply response of wine-making industry specific inputs, the containment program could yield at least $1.7 billion gross benefit (the minimum of all estimates in Figure 19). However, if there is uncertainty around the success of containment, then the expected (probability weighted) value of the gross benefit decreases in proportion to the probability of success.
Figure 19 Avoided national losses from containment of potential incursion to either the Murray Darling or Lower Murray regions
Notes: Economic impacts estimated over 50 years in present value terms. Scenario 1: all vineyards are highly suitable to infection. Scenario 2: only vineyards that satisfy the average minimum winter temperature threshold are suitable to infection. Scenario 3: only vineyards that satisfy the temperature threshold and proximity to riparian vegetation conditions are suitable to infection. Source: ABARES model output
Net benefit from containment The net benefit from containment is equal to the gross benefit less the costs of running the program and other consequential costs. For example, government and industry would likely
Economic impacts of Xylella fastidiosa on Australian wine grape and wine-making industries
41
increase investment in surveillance and monitoring. In addition, there are costs associated with movement restrictions imposed to prevent the pathogen and its vectors spreading. The movement restrictions on fruits, nursery stocks and other plant material of all Xylella host plants (not just the horticultural crops) originating from the affected region could prevent the outward movement of the pathogen. A buffer of sufficient width around the containment region devoid of all Xylella host plants and vegetation that the native vectors feed on could be created to prevent the outward movement of both. This could impose significant costs as it would involve:
• clearing riparian vegetation with associated environmental costs and transaction costs in overcoming any legislative impediments
• clearing other vegetation that the native vectors feed on, more intensive weed control to eliminate seasonal host plants and insecticide spraying to control the vector population, if necessary
• clearing grape vines and other Xylella host plants, especially citrus trees in orchards adjacent to vineyards, which are frequently found in the two regions.
The total cost of containment in Australia could be high for several reasons.
• There are likely to be high costs to governments and industry of implementing movement restrictions on fruits, nursery stocks and other plant material originating from a wide range of susceptible host plant species. As part of ongoing Xylella prevention activities, the Department is currently regulating more than 350 Xylella host plant species belonging to 77 plant families, according to the list of Xylella-related regulated plant species published in November 2015 (Department of Agriculture and Water Resources, 2017). Industry would likely seek to pass on costs to consumers, for example, affected nursery industries in the containment zone.
• Creating a buffer around the containment zone would involve clearing thousands of hectares of productive land and natural vegetation with significant economic costs and environmental consequences. The Murray Darling and Lower Murray regions are home to a large number of citrus and other horticultural farms and the removal of productive trees to create the buffer could be problematic and would involve large compensation payments.
It is beyond the scope of this study to estimate the cost of the containment program. However, it could be done once specific details are known. The Department is currently developing generic contingency plans for eradication, slowing the spread and management to complement the emergency measures it recently introduced. In the event of a X. fastidiosa incursion, an eradication response plan could be developed for each host industry, including the wine grape industry, based on the generic contingency plan. Plant Health Australia has already developed contingency plans for the nursery and gardening industries to provide guidelines in developing eradication response plans for potential incursions of X. fastidiosa (PHA 2011) and the glassy-winged sharpshooter (PHA 2009).
Given the wide range of host plants in Australia, the cost of a containment program for the wine grapes industry may be higher here than that incurred in other countries. An indicative estimate could be derived from information available for the United States. The management measures designed to prevent X. fastidiosa and the glassy-winged sharpshooter from spreading beyond the Temecula Valley in California cost around $US50 million annually (Alston et al. 2013). This is equivalent to a long term cost of around $AU730 million, in present value terms—assuming a 7 per cent discount rate and adjusting for differences in the exchange rate and inflation since 2013.
Economic impacts of Xylella fastidiosa on Australian wine grape and wine-making industries
42
7 Conclusions There is considerable uncertainty around the maximum extent of the Australian wine grape area that would be affected by X. fastidiosa. If it is only those vineyards experiencing minimum winter temperatures above 1.7°C that are suitable, then nearly all vineyards in Australia (98 per cent) could be partially or highly affected. This percentage decreases to 39 when the proximity to riparian vegetation is also a determinant of suitability.
Overseas evidence under conditions similar to Australia and the likely presence of native vectors as efficient as the grassy-winged sharpshooter in Australia suggest that the pathogen could spread across the landscape in several years, killing vines in affected vineyards at an exponential rate until none are left. In the absence of effective on-farm controls, the replacement of dying vines with another crop is the most likely option to mitigate the negative impacts. If replacing them with Xylella-resistant vines of the same variety is considered, then only some vineyard areas would find replanting profitable under 2014–15 wine grape prices with the remainder expected to abandon wine grape growing. The vineyards abandoning wine grape growing are of two types: those having negative gross margins and the rest with gross margins not sufficient to make replanting profitable. The impact of Xylella comprises the aggregate cost of all replanting plus the foregone aggregate gross margins of the second type. The impact on the wine grape industry would be greater at higher prices as more vineyards are expected to invest in replanting and there will be more losses in gross margins.
The abandonment of vineyards could lead to around halving of wine grape production in the long run if vineyard suitability is not further restricted by the proximity to riparian vegetation. However, this restriction has the potential to reduce the production impact to a fifth. The production impact would be less if wine grape prices were to increase as fewer vineyards would be abandoned.
Considering three different vineyard suitability scenarios at two different wine grape prices, Xylella is expected to cost the Australian wine grape and wine-making industries significantly ($2.3 billion to $7.9 billion over 50 years). However, if the spread of Xylella can be contained within the incursion region (as in the Temecula Valley in California), then the impact would only be a fraction of the impact of an uncontrolled spread ($0.15 billion to $2.0 billion over 50 years, if it could be contained to the Murray or Lower Murray region, for example), suggesting containment could provide substantial net economic benefits if an outbreak occurs.
Given the wide range of Xylella host plants in Australia, a containment program for the wine grape industry may cost more than the cost incurred in the United States. However, the program would be worthwhile as long as the cost does not exceed the benefits.
It would be prudent to invest in improving early detection capacity to increase the likelihood of the cost-beneficial eradication of the pathogen, given the significant cost and losses associated with a containment program, and the uncertainty around its success. The uncertainty around the success of eradication and containment (if eradication fails), and the significant costs of a containment program and extensive losses of an uncontrolled spread (if containment fails) collectively imply there is significant pay off for investment in measures to reduce the likelihood of entry. The information presented in this report could help in the cost-benefit analysis of these measures once the associated costs and likelihoods of success are known.
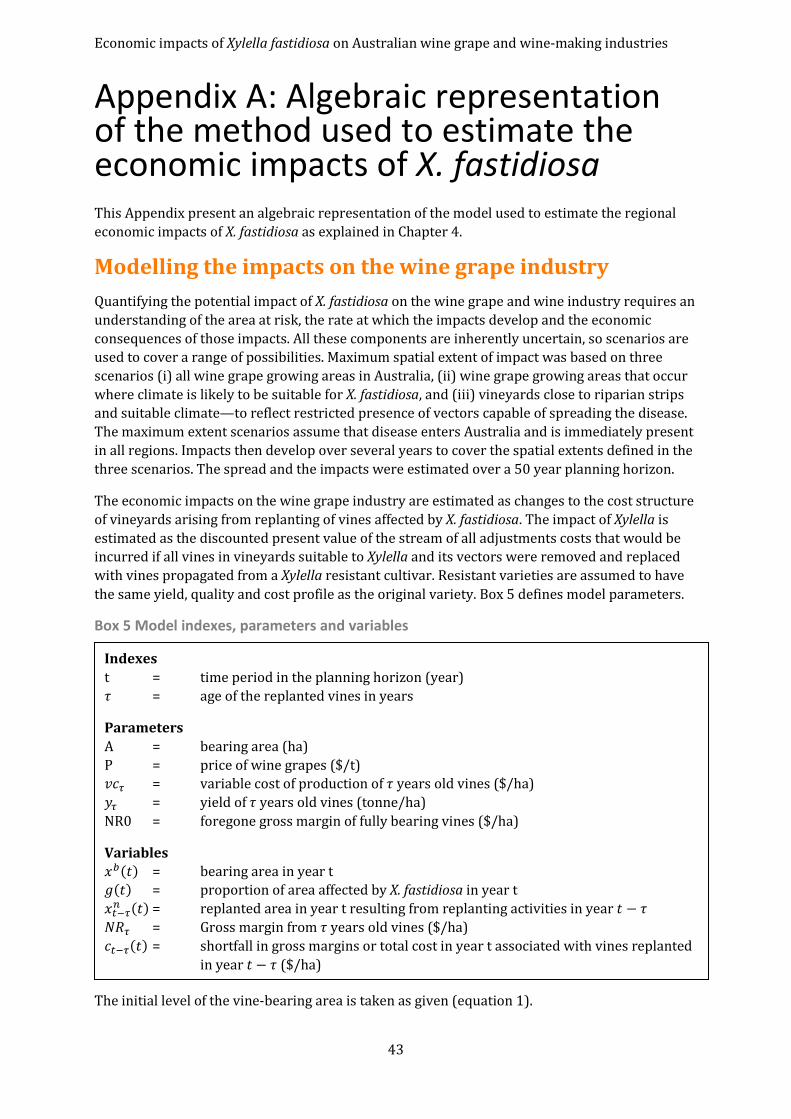
Economic impacts of Xylella fastidiosa on Australian wine grape and wine-making industries
43
Appendix A: Algebraic representation of the method used to estimate the economic impacts of X. fastidiosa This Appendix present an algebraic representation of the model used to estimate the regional economic impacts of X. fastidiosa as explained in Chapter 4.
Modelling the impacts on the wine grape industry Quantifying the potential impact of X. fastidiosa on the wine grape and wine industry requires an understanding of the area at risk, the rate at which the impacts develop and the economic consequences of those impacts. All these components are inherently uncertain, so scenarios are used to cover a range of possibilities. Maximum spatial extent of impact was based on three scenarios (i) all wine grape growing areas in Australia, (ii) wine grape growing areas that occur where climate is likely to be suitable for X. fastidiosa, and (iii) vineyards close to riparian strips and suitable climate—to reflect restricted presence of vectors capable of spreading the disease. The maximum extent scenarios assume that disease enters Australia and is immediately present in all regions. Impacts then develop over several years to cover the spatial extents defined in the three scenarios. The spread and the impacts were estimated over a 50 year planning horizon.
The economic impacts on the wine grape industry are estimated as changes to the cost structure of vineyards arising from replanting of vines affected by X. fastidiosa. The impact of Xylella is estimated as the discounted present value of the stream of all adjustments costs that would be incurred if all vines in vineyards suitable to Xylella and its vectors were removed and replaced with vines propagated from a Xylella resistant cultivar. Resistant varieties are assumed to have the same yield, quality and cost profile as the original variety. Box 5 defines model parameters.
Box 5 Model indexes, parameters and variables
The initial level of the vine-bearing area is taken as given (equation 1).
Indexes t = time period in the planning horizon (year) 𝜏𝜏 = age of the replanted vines in years
Parameters A = bearing area (ha) P = price of wine grapes ($/t) 𝑣𝑣𝑣𝑣𝜏𝜏 = variable cost of production of 𝜏𝜏 years old vines ($/ha) 𝑦𝑦𝜏𝜏 = yield of 𝜏𝜏 years old vines (tonne/ha) NR0 = foregone gross margin of fully bearing vines ($/ha)
Variables 𝑥𝑥𝑏𝑏(𝑡𝑡) = bearing area in year t 𝑔𝑔(𝑡𝑡) = proportion of area affected by X. fastidiosa in year t 𝑥𝑥𝑡𝑡−𝜏𝜏𝑛𝑛 (𝑡𝑡) = replanted area in year t resulting from replanting activities in year 𝑡𝑡 − 𝜏𝜏 𝑁𝑁𝑁𝑁𝜏𝜏 = Gross margin from 𝜏𝜏 years old vines ($/ha) 𝑣𝑣𝑡𝑡−𝜏𝜏(𝑡𝑡) = shortfall in gross margins or total cost in year t associated with vines replanted in year 𝑡𝑡 − 𝜏𝜏 ($/ha)
Economic impacts of Xylella fastidiosa on Australian wine grape and wine-making industries
44
𝑥𝑥𝑏𝑏(1) = 𝐴𝐴 (1)
Starting from the first year, X. fastidiosa is assumed to affect a proportion of vines 𝑔𝑔(𝑡𝑡), with 𝑔𝑔(𝑡𝑡) growing exponentially until it reaches a maximum rate by the 10th year and continues to affect vines at that rate (equation 2).
𝑥𝑥𝑏𝑏(𝑡𝑡 + 1) = 𝑚𝑚𝑚𝑚𝑥𝑥{𝑥𝑥𝑏𝑏(𝑡𝑡)[1 − 𝑔𝑔(𝑡𝑡)], 0} (2)
The vines affected in year t (RHS of equation 3) would be removed in that year and replaced with resistant vines in the following year (LHS of equation 3).
Vines replaced in each year t grow to bearing age in subsequent years and in a given year t, there would be new vines that have been replanted in all previous 𝑡𝑡 − 𝜏𝜏 years.
The new vines planted in different 𝑡𝑡 − 𝜏𝜏 years (cohort) are tracked over time t in equation 4.
Replanting done in all years cannot exceed the pre-X. fastidiosa bearing area (equation 5).
𝑥𝑥𝑡𝑡−0𝑛𝑛 (𝑡𝑡 + 1) = 𝑥𝑥𝑏𝑏(𝑡𝑡)𝑔𝑔(𝑡𝑡) (3)
𝑥𝑥𝑡𝑡−𝜏𝜏𝑛𝑛 (𝑡𝑡) = 𝑥𝑥(𝑡𝑡−1)−(𝜏𝜏−1)𝑛𝑛 (𝑡𝑡 − 1) (4)
∑ 𝑥𝑥𝑡𝑡−0𝑛𝑛 (𝑡𝑡)𝑇𝑇𝑡𝑡=2 ≤ 𝐴𝐴 (5)
The cost and gross margin impacts of rolling replanting decisions are captured in equations (6) to (9). Equation (6) estimate the per hectare gross margin of 𝜏𝜏 year old new resistant vines as the gross revenue less the variable cost.
𝑁𝑁𝑁𝑁𝜏𝜏 = 𝑦𝑦𝜏𝜏𝑃𝑃 − 𝑣𝑣𝑣𝑣𝜏𝜏 (6)
Establishment cost per hectare, k, the series of annual gross margin of new vines per hectare, 𝑁𝑁𝑁𝑁𝜏𝜏 and the foregone annual gross margin of vines per hectare, 𝑁𝑁𝑁𝑁𝑜𝑜 are combined in equation (7) to estimate the total per hectare costs (shortfall in gross margins) of replanting. In the year of establishment (𝜏𝜏 = 0), per hectare costs will include the cost of establishment plus the foregone gross margins from vines.
In the next five years of the 0 < 𝜏𝜏 < 8 period, gross margin per hectare from the new vines will be negative as the variable costs in the early years following replanting more than offset revenues from any yield in those years. Over the next three years, gross margins would become positive as the revenue increases to maximum in the 9th year, more than offsetting the variable costs.
The total cost of replanting, estimated as the shortfall in gross margins—or the difference between foregone gross margin and the gross margin of the new vines—declines overtime as new vines reach full bearing age and the per hectare yield increases to a maximum in eight years since replanting.
𝑣𝑣𝑡𝑡−𝜏𝜏(𝑡𝑡) = 𝑘𝑘 +𝑁𝑁𝑁𝑁𝑜𝑜 , if 𝜏𝜏 = 0𝑣𝑣𝑡𝑡−𝜏𝜏(𝑡𝑡) = 𝑁𝑁𝑁𝑁𝑜𝑜 − 𝑁𝑁𝑁𝑁𝜏𝜏 , if 0 < 𝜏𝜏 < 8𝑣𝑣𝑡𝑡−𝜏𝜏(𝑡𝑡) = 𝑁𝑁𝑁𝑁𝑜𝑜 − 𝑁𝑁𝑁𝑁𝜏𝜏 = 0 , if 𝜏𝜏 = 8
� (7)
For each year t in the planning horizon, the RHS of equation (8) first estimates the shortfall in gross margins in that year for vines replanted in each of the previous 𝑡𝑡 − 𝜏𝜏 years by multiplying the area replanted in 𝑡𝑡 − 𝜏𝜏 year (𝑥𝑥𝑡𝑡−𝜏𝜏𝑛𝑛 ) by the corresponding per-hectare shortfall in gross margins (𝑣𝑣𝑡𝑡−𝜏𝜏(𝑡𝑡)). Equation (8) then adds the total shortfalls in gross margins estimated in that
Economic impacts of Xylella fastidiosa on Australian wine grape and wine-making industries
45
year for vines replanted in all previous 𝑡𝑡 − 𝜏𝜏 years, while equation (9) estimates the present value of this stream of costs incurred over the planning horizon.
𝐶𝐶(𝑡𝑡) = ∑ 𝑥𝑥𝑡𝑡−𝜏𝜏𝑛𝑛 (𝑡𝑡)𝑣𝑣𝑡𝑡−𝜏𝜏(𝑡𝑡)𝑡𝑡𝑡𝑡−𝜏𝜏 (8)
𝑃𝑃𝑃𝑃𝐶𝐶 = ∑ 𝐶𝐶(𝑡𝑡) (1 + 𝑟𝑟)−𝑡𝑡𝑡𝑡 (9)
Modelling the impacts on the wine-making industry This study estimates the wine-making industry impacts in the form of producer surplus losses to non-grape inputs. Two types of inputs are considered: specialised fixed and human capital inputs specific to the wine-making industry and other more mobile inputs—as their supplies responds differently to change in own prices.
A simple supply and demand model for the markets for the two inputs was developed. The three inputs (including wine grapes) are assumed to be able to be substituted for each other to a limited extent. Bottled wine, and table and dried grapes are internationally traded goods and Australia is assumed to be a price taker as it has small share in the global markets. Consequently, wine grape prices are assumed to remain unchanged, even if the price of wine-making inputs changes within the Australian market.
Wine-making industry specific inputs are assumed to be less responsive (elasticity of supply ranging from 0.4–1.0) and mobile inputs more responsive (elasticity of supply of 5) to change in their own prices. For simplicity, it is assumed that the wine-making industry output contracts by the same percentage as wine grape produced.
An algebraic representation of the model is given below:
𝑞𝑞𝑖𝑖𝑠𝑠 = 𝜀𝜀𝑖𝑖𝑝𝑝𝑖𝑖 (10)
𝑞𝑞𝑖𝑖𝑑𝑑 = −∑ 𝜂𝜂𝑖𝑖𝑖𝑖𝑝𝑝𝑖𝑖𝑖𝑖 −∝𝑖𝑖 (11)
𝑞𝑞𝑖𝑖𝑠𝑠 = 𝑞𝑞𝑖𝑖𝑑𝑑 (12)
The model is presented in the elasticity form, where lower case q and p denote proportional change in quantity q = dQ/Q and price p = dP/P, respectively. Upper case Q and P denote quantity and price, respectively. Indexes used are subscript i and j to denote inputs, and superscripts s and d denote supply and output constrained demand, respectively. Supply and the absolute value of demand elasticities are denoted by 𝜀𝜀𝑖𝑖 and 𝜂𝜂𝑖𝑖𝑖𝑖 and the proportionate reduction in wine-making industry output by ∝𝑖𝑖.
Demand elasticities are derived from the expressions 𝜂𝜂𝑖𝑖𝑖𝑖 = 𝜅𝜅𝑖𝑖𝜎𝜎𝑖𝑖𝑖𝑖 for 𝑖𝑖 ≠ 𝑗𝑗 and
𝜂𝜂𝑖𝑖𝑖𝑖 = ∑ 𝜅𝜅𝑖𝑖𝜎𝜎𝑖𝑖𝑖𝑖𝑖𝑖 for 𝑖𝑖 = 𝑗𝑗 where 𝜅𝜅𝑖𝑖 denotes cost shares and 𝜎𝜎𝑖𝑖𝑖𝑖 denotes Allen’s elasticity of substitution between inputs. The cost share of wine grapes and its Allen’s elasticity of substitution for non-grape inputs are also considered when estimating the own price elasticity of demand 𝜂𝜂𝑖𝑖𝑖𝑖 . Note that equation (11) does not include a response term for the proportionate change in the price of wine grapes, as the wine grape price is assumed to remain unaffected (proportionate change equal to zero) as Australia is assumed to be a price taker.
The system of simultaneous equations in (10)—(12) is solved and the values for 𝑝𝑝𝑖𝑖 and 𝑞𝑞𝑖𝑖𝑠𝑠 = 𝑞𝑞𝑖𝑖𝑑𝑑 estimated. The change in producer surplus for each input is estimated as:
∆𝑃𝑃𝑃𝑃𝑖𝑖 = 𝑄𝑄𝑖𝑖𝑃𝑃𝑖𝑖𝑝𝑝𝑖𝑖(1 + 0.5𝑞𝑞𝑖𝑖) (13)
Economic impacts of Xylella fastidiosa on Australian wine grape and wine-making industries
46
where the product of quantity of input used (𝑄𝑄𝑖𝑖) and the price of input (𝑃𝑃𝑖𝑖) represent the gross value of the input.
The values of wine-specific and other wine-making inputs are derived by using the latest estimate of the gross value of wine produced and the cost shares of each input, 𝜅𝜅𝑖𝑖. The parameters used in the model are taken from Zhao et al (2013): cost share estimates of 0.27, 0.43 and 0.30 for wine grapes, wine-specific inputs, and other inputs, respectively; supply elasticity for wine-making industry specific input (0.4–1.0); supply elasticity of five for mobile inputs; and input substitution elasticity of 0.1 for all input pairings.
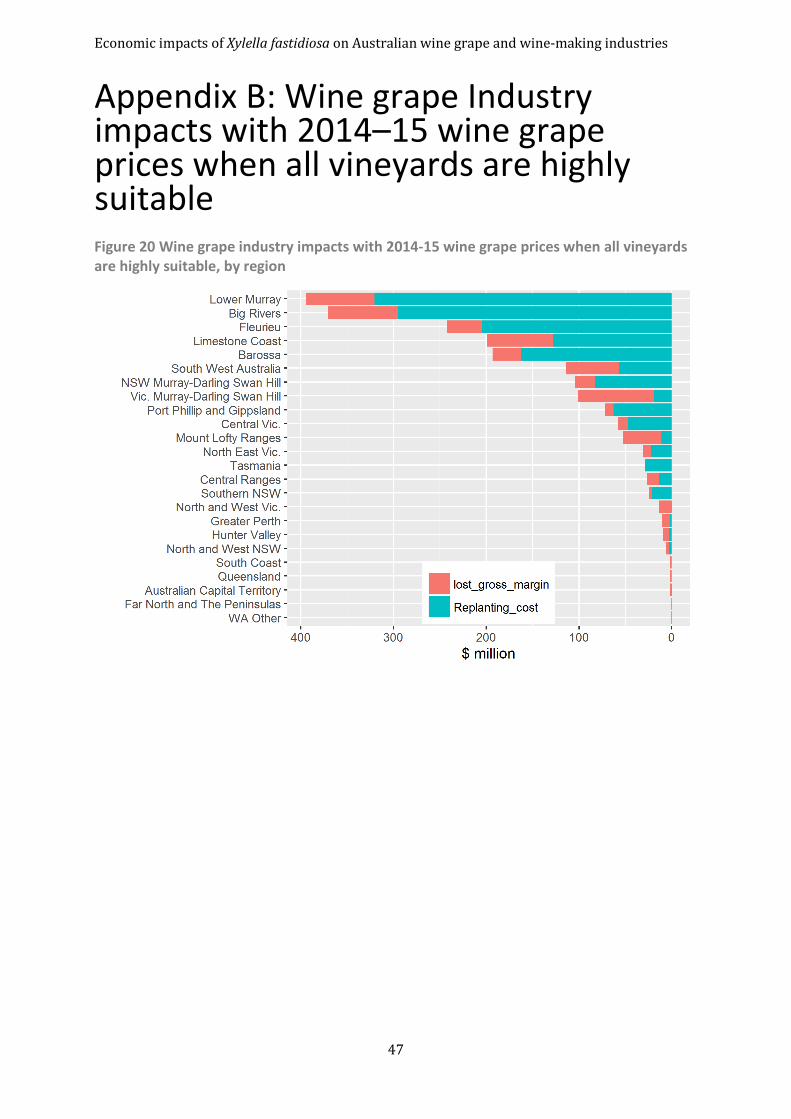
Economic impacts of Xylella fastidiosa on Australian wine grape and wine-making industries
47
Appendix B: Wine grape Industry impacts with 2014–15 wine grape prices when all vineyards are highly suitable Figure 20 Wine grape industry impacts with 2014-15 wine grape prices when all vineyards are highly suitable, by region
Economic impacts of Xylella fastidiosa on Australian wine grape and wine-making industries
48
Glossary and acronyms ABARES Australian Bureau of Agricultural and Resource Economics and Sciences
ABS Australian Bureau of Statistics
AGWA Australian Grape and Wine Authority
ArcGIS Proprietary data viewer for maps and geographical information systems (GIS) developed by Esri
Bayesian Method of statistical inference based on Bayes’ theorem
CLIMATCH Software to predict species range
CLIMEX Software to predict the effects of climate on species
CVC Citrus variegated chlorosis caused by Xylella fastidiosa
Discount rate Interest rate used to discount the value of future costs and benefits to values in the present
Eco-climatic index A measure of the potential ability of the species to survive and develop high population sizes at a location
FAO Food and Agriculture Organization of the United Nations
GDP Gross Domestic Product
NPV Net Present Value
Pearce’s disease A deadly disease of grapevines caused by Xylella fastidiosa
Economic impacts of Xylella fastidiosa on Australian wine grape and wine-making industries
49
References ABARES 2016, Agricultural commodity statistics, Australian Bureau of Agricultural and Resource Economics and Sciences, Canberra.
ABS 2015, Vineyards, Australia, 2014-15, cat. no. 1329.0.55.002, Australia Bureau of Statistics, Canberra.
AgEconPlus 2015, Economic contribution of the Australian wine sector (pdf 1.97 mb), A report prepared by Gillespie Economics and AgEconPlus Pty Ltd for the Australian Grape and Wine Authority.
AGWA 2016, Winegrape Purchase Price Dispersion Chart Pack (pdf 3.41 mb), Australian Grape and Wine Authority.
Alston, JM, Fuller, KB, Kaplan, JD & Tumber, KP 2013, Economic consequences of Pierce’s disease and related policy in the California winegrape industry, Journal of Agricultural and Resource Economics, vol. 38, no. 2, pp. 269–297.
Anderson, K & Aryal, NR 2015, Growth and cycles in Australia’s wine industry (pdf 13.2 mb), A statistical compendium, 1843 to 2013, Wine Economics Research Centre, University of Adelaide Press.
Ashton, D & Oliver, M 2015, Wine grape farms in the Murray-Darling Basin, ABARES research report 15.11, Australian Bureau of Agricultural and Resource Economics and Sciences, Canberra.
Australian Government 2016, Guidance Note, Cost-Benefit Analysis, Office of Best Practice Regulation, Department of Prime Minster and Cabinet, Canberra.
—— 2007, Best Practice Regulation Handbook, Office of Best Practice Regulation, Canberra.
Berry, S 2015, The state of the Australian industry - Economics and business profitability in SA wine grape regions (pdf 3.81mb), Australian Society of Viticulture and Oenology, accessed 18 September 2017.
Bomford, M, Kraus, F, Barry, SC & Lawrence, E 2009, Predicting establishment success for alien reptiles and amphibians: a role for climate matching, Biological Invasions, vol. 11, pp. 713–724.
Burgman, M, Arthur, T, Hollings, T, Elith, J, Barry, B, Kriticos, D, Kearney, M, Yemshanov, D, Brown, P, ten Have, J, Summerson, R, Starkey, C & Hennecke, B 2014, Evaluating spatial analysis tools for surveillance and monitoring in marine and terrestrial environments, Centre of Excellence for Biosecurity Risk Analysis, Melbourne, project No.1302A.
Caboche, T, Shafron, W, Gunning-Trant, C, Lubulwa, M & Martin, P 2013, Australian wine grapes: financial and business performance of wine grape growers 2011-12, research report 13.14, Australian Bureau of Agricultural and Resource Economics and Sciences, Canberra.
De La Fuente, L, Parker, JK, Oliver, JE, Granger, S, Brannen, PM & van Santen, E 2013, The Bacterial Pathogen Xylella fastidiosa Affects the Leaf Ionome of Plant Hosts during Infection, PLoS ONE, vol. 8, issue 5.
Department of Agriculture and Water Resources 2017, Xylella (Xylella fastidiosa), Department of Agriculture and Water Resources, Australian Government, accessed 04 October 2017.
Economic impacts of Xylella fastidiosa on Australian wine grape and wine-making industries
50
—— 2016, Changes to import requirements to protect against Xylella, Department of Agriculture and Water Resources, Australian Government, accessed on 04 October 2017.
—— 2015a, Notification of emergency quarantine measures for plant pathogen Xylella fastidiosa (pdf 241.5 kb), Import Industry Advice Notice, Australian Government, accessed on 04 October 2017.
—— 2015b, 88-2015 - Notification of planned emergency quarantine measures for plant pathogen Xylella fastidiosa, Department of Agriculture and Water Resources, Australian Government accessed on 04 October 2017.
Geoscience Australia 2016, Surface hydrology lines dataset, Canberra, accessed 21 January 2016.
Gunning-Trant, C & Shafron, W 2012, Australian wine grape production projections to 2013–14, ABARES research report 12.3, Australian Bureau of Agricultural and Resource Economics, Canberra.
Hafi, A, Spring, D, Croft, L, Kompas, T & Morey, K 2013, Cost-effectiveness of biosecurity response options to red imported fire ants in South East Queensland, Australian Bureau of Agricultural and Resource Economics report to client prepared for the National Biosecurity Committee, Canberra.
Harrison, M 2010, Valuing the Future: the social discount rate in cost-benefit analysis, Visiting Researcher Paper, Productivity Commission, Canberra.
Hoddle, MS 2004, The potential adventive geographic range of glassy-winged sharpshooter, Homalodisca coagulata and the grape pathogen Xylella fastidiosa: implications for California and other grape growing regions of the world, Crop Protection, vol. 23, pp. 691–699.
Laranjeira, FF, Silva, LG, Fonseca, EL, Silva, SXB, Rocha, JB, Santos-Filho, HP, Ledo, CAS & Hau, B 2008, Prevalence, incidence and distribution of citrus variegated chlorosis in Bahia, Brazil, Tropical Plant Pathology, vol. 33, pp. 339–347.
Luck, J, Doughty, S, Birtchnell, M & Constable, F 2001, Consultancy report on the incidence of Xylella fastidiosa on host plants in Australia, Bioscience Research Division, Department of Primary Industries, Victoria.
Merriman, P 2001, The potential for the establishment of Pierce’s Disease in Australian grapevines, Final report to Grape and Wine Research and Development Corporation, Department of Natural Resources & Environment, Melbourne, Victoria.
NSW-DPI 2016, Exotic pest alert: bacterial leaf scorch of tree nuts, First edition, Plant Biosecurity & Product Integrity, New South Wales Department of Primary Industries, Orange.
Perring, TM, Farrar, CA & Blua, MJ 2001, Proximity to citrus influences Pierce’s disease in Temecula Valley vineyards, California Agriculture, vol. 55, no. 4, pp. 13–18.
PHA 2011, Threat Specific Contingency Plan: Pierce’s disease (Xylella fastidiosa) (pdf 1.08 mb), prepared for the Nursery and Garden Industry of Australia, Plant Health Australia.
—— 2009, Threat Specific Contingency Plan for Glassy Winged Sharpshooter (Homalodisca vitripennis) (pdf 539.12 kb), prepared for the Nursery and Garden Industry of Australia, Plant Health Australia.
Economic impacts of Xylella fastidiosa on Australian wine grape and wine-making industries
51
Poddar, A 2015, Submission no. 26, submission to the Senate Standing Committee on Rural and Regional Affairs and Transport, Inquiry into the Australian Grape and Wine Industry, Accolade Wines.
Sutherst, RW, Maywald, GF & Kriticos, DJ 2007, CLIMEX Version 3, User’s Guide, Hearne Scientific Software Pty Ltd.
Tumber, KP, Alston, JM, & Fuller, KB 2014, Pierce’s disease costs California $104 million per year, California Agriculture, vol. 68, issue 1-2, pp. 20–29.
Wittwer, G, McKirdy, S & Wilson, R 2006, Analysing a hypothetical Pierce’s disease outbreak in South Australia using a dynamic CGE approach, General Working Paper No. G-162, The Centre of Policy Studies, Monash University, Melbourne.
Wine Australia 2017, Australian wine export report, Australian Grape and Wine Authority, Adelaide.
—— 2016, Wine Australia Vintage Report, Australian Grape and Wine Authority, Adelaide.
Zhao, X, Anderson, K & Wittwer, G 2003, Who gains from Australian generic wine promotion and R&D?, The Australian Journal of Agricultural and Resource Economics, vol. 47, no. 2, pp. 181–209.