economic importance of the belgian maritime and inland
TRANSCRIPT

Economic importance of theBelgian maritime and inland portsReport 2018Working paper by Ilse Rubbrecht and Koen Burggraeve
Presented by Director Steven Vanackere
Questions can be asked using the chatbox

Main messages
• Direct and indirect value added contracted by -3.9% to € 32 billion in 2018, representing 7% of Belgian GDP
• Investment level went up to almost € 6 billion in 2018 due to merger operation in shipping companies branch.
• Upward trend in Belgian maritime cargo traffic is reflected in a growing employmentlevel (direct + indirect) at Belgian ports by 0.8% to 249 612 FTE in 2018, representing5.9% of Belgian domestic employment
• Although the outlook for 2020 is rather gloomy, Belgian ports are showing resilienceduring corona crisis.
2

Competitive position and economic importance of Belgian ports
3
Sources: UNCTAD, Port authorities. Sources: Port authorities, NBB.
Maritime cargo traffic at ports Cargo traffic, direct value added, direct employment2013=100 and direct investment at Belgian ports:
2013=100
95
105
115
125
135
145
155
165
175
2013 2014 2015 2016 2017 2018
Hamburg Le Havre range Duisburg & Paris
Belgian Seaports Belgian inland ports
95
105
115
125
135
145
155
165
175
2013 2014 2015 2016 2017 2018
Cargo traffic Direct value added
Direct employment Direct investments

Direct value added at Belgian ports
4Source: NBB Source: NBB
Largest maritime sectors (2013=100) Largest non-maritime sectors (2013=100)
Direct value added at Belgian ports: evolution over 2013-2018
80
90
100
110
120
130
140
150
160
2013 2014 2015 2016 2017 2018
Cargo handling Shipping agents and forwarders
Port construction and dredging Public sector
Port authority Total
80
90
100
110
120
130
140
150
160
2013 2014 2015 2016 2017 2018
Chemicals industry Trade
Metalworking industry Other logistic services
Fuel production Total

Direct value added at Belgian ports
5Source: NBB
Decomposition of growth 2017-2018 by sector
Direct value added at Belgian ports
Negative growth in direct value added of -2.9% in 2018 compared to 2017 due to
• Energy sector
• Reduced capacity at nuclear power plants
• Fuel production• Reduced refinery margins
-2,9
-4,0
-3,5
-3,0
-2,5
-2,0
-1,5
-1,0
-0,5
0,0
0,5
1,0
Belgian ports Other
Energy
Fuel production
2017-2018growth

Direct value added at Belgian ports
6Source: NBB Source: NBB
Largest maritime sectors (2013=100) Largest non-maritime sectors (2013=100)
Direct investment at Belgian ports: evolution over 2013-2018
50
100
150
200
250
2013 2014 2015 2016 2017 2018
Cargo handling Public sector
Shipping agents and forwarders Port authority
Total Total excl merger
50
100
150
200
250
2013 2014 2015 2016 2017 2018
Chemical industry Energy
Other logistic services Fuel production
Total Total excl merger
Direct value added at Belgian ports
7Source: NBB
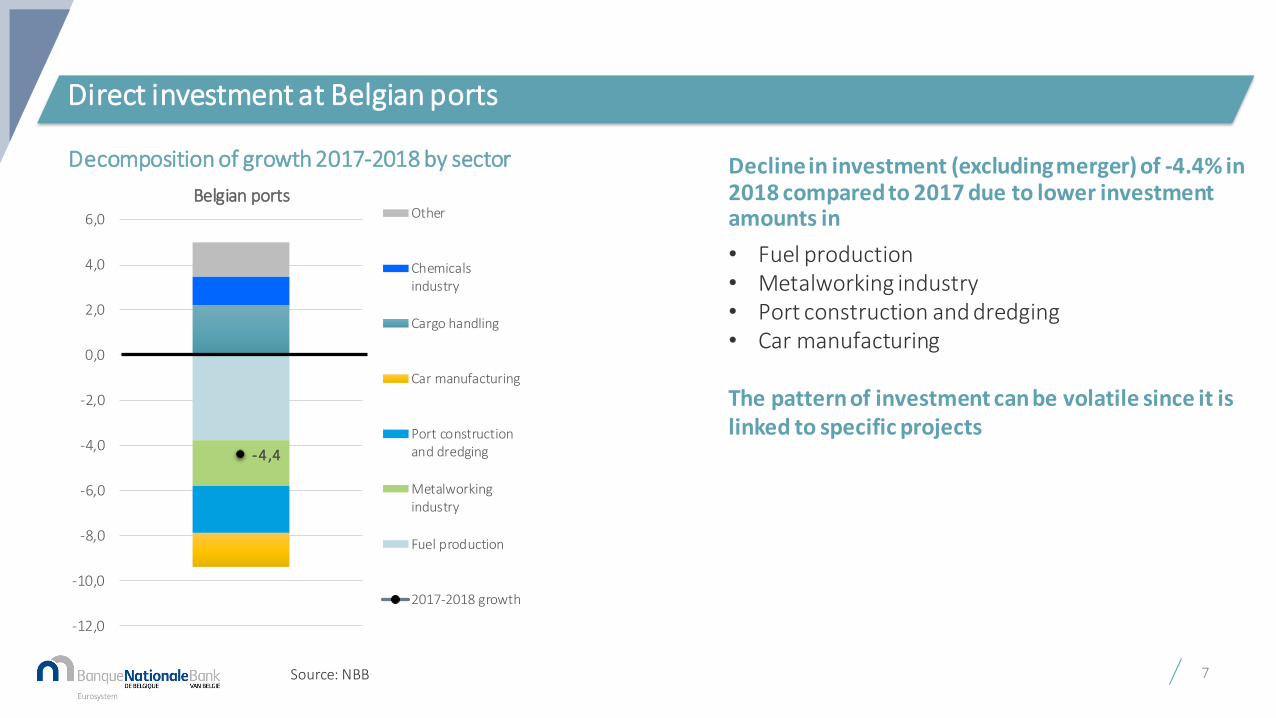
Decomposition of growth 2017-2018 by sector
Direct investment at Belgian ports
Decline in investment (excluding merger) of -4.4% in 2018 compared to 2017 due to lower investment amounts in
• Fuel production• Metalworking industry• Port construction and dredging• Car manufacturing
The pattern of investment can be volatile since it is linked to specific projects
-4,4
-12,0
-10,0
-8,0
-6,0
-4,0
-2,0
0,0
2,0
4,0
6,0
Belgian portsOther
Chemicalsindustry
Cargo handling
Car manufacturing
Port constructionand dredging
Metalworkingindustry
Fuel production
2017-2018 growth

Direct value added at Belgian ports
8Source: NBB Source: NBB
Largest maritime sectors (2013=100) Largest non-maritime sectors (2013=100)
Direct employment at Belgian ports: evolution over 2013-2018
85
90
95
100
105
110
115
120
125
130
2013 2014 2015 2016 2017 2018
Cargo handling Shipping agents and forwarders
Port construction and dredging Port authority
Public sector Total
85
90
95
100
105
110
115
120
125
130
2013 2014 2015 2016 2017 2018
Chemicals industry Metalworking industry
Car manufacturing Other logistic services
Trade Total

Direct value added at Belgian ports
9Source: NBB
Decomposition of growth 2017-2018 by sector
Direct employment at Belgian ports
Direct employment grew by 1% in 2018 compared to 2017 due to extra job creation in
• Cargo handling• Construction• Chemicals industry• Other logistic services
1,0
-1,0
-0,5
0,0
0,5
1,0
1,5
2,0
Belgian portsOther
Metalworkingindustry
Other logisticservices
Chemicalsindustry
Construction
Cargo handling
2017-2018 growth

Direct value added at Belgian ports
10
Source: NBB
Direct value added (2013=100) Direct investment (2013=100) Direct employment (2013=100) exclusiding merger
Evolution over 2013-2018
75
100
125
150
175
2013 2014 2015 2016 2017 2018
Antwerp Ghent Zeebrugge
Ostend Liège Brussels
Total
75
100
125
150
175
2013 2014 2015 2016 2017 2018
Antwerp Ghent ZeebruggeOstend Liège BrusselsTotal
85
90
95
100
105
2013 2014 2015 2016 2017 2018
Antwerp Ghent Zeebrugge
Ostend Liège Brussels
Total

IMPACT OF COVID-19 - on ports worldwide
Ports worldwide are impacted in 3 ways:
• Internal operational disruptions
• External operational disruptions
• Demand disruptions
Ports worldwide are not affected equally
Place a footer: Insert > Header & Footer 11

IMPACT OF COVID-19 - on Belgian ports
12
Severe financial crises lead to long-lasting economic recession or stagnation
• Value added:
• First signs of recovery in 2010
• Growth dynamic slowed down afterwards
• Employment:
• Negative growth rates until 2016 (except in 2012)
Source: CEPA
Severe and long-lasting effect of financial crisis at Belgian ports
110.000
112.000
114.000
116.000
118.000
120.000
122.000
124.000
126.000
10.000
11.000
12.000
13.000
14.000
15.000
16.000
17.000
18.000
19.000
20.000
Direct value added (€ million) Direct employment (FTE, right-hand scale)

IMPACT OF COVID-19 - on Belgian ports
13
COVID-19 crisis: much more profound
• Shock of unprecedented magnitude
• Slow recovery, quite certainly incomplete
• Relative optimism that normal growth rates could resume in course of 2022
• Health crisis with economic impact due to lockdowns of companies and shops
• Phased exit strategies make a relaunch of economic activity possible
• Historical relationship between fall in world GDP and fall in trade flows: will overstate the current impact of world GDP on trade flows
Rebound of Belgian economy will be gradual and incomplete
Source: NAI, NBB

IMPACT OF COVID-19 - on port of Antwerp - Performed shifts by dockworkers
14
In 1st semester 2020: cargo traffic declined by 4.9% YTD
Number of shifts done by dockworkers has dropped
• Since mid-2019;
• Since March 2020: level continued to drop, slightly reinforced by corona-outbreak;
• Up until end of May 2020: level not as bad as during financial crisis in 2008-2009.
To date, port of Antwerp keeps well standing due to
• Geographical diversification;• Buffering role of storage
• Chemical cluster
100.000
110.000
120.000
130.000
140.000
150.000
160.000
170.000
Number of performed shifts (moving average over 6 months) Number of performed shifts
MARCH 2020
Source: CEPA

IMPACT OF COVID-19 - on port of Antwerp for maritime companies
15
Survey among maritime companies
• Cargo-handlers
• Shipping companies
• Shipping agents and forwarders.
In 2020, turnover of average maritime company will drop 21%, with no pick-up to pre-coronavirus levels before 2021
One in two firms makes use of temporary lay-off scheme
• Maritime firms, recording a bigger decline in their sales, are making more extensive use of the temporary lay-off scheme
• A higher percentage of them report that it is likely that they will transform some of the temporary lay-offs into permanent redundancies when the scheme expires
Time needed to recover sales to pre-crisis level
Source: based on results of survey by Alfaport Voka
q3 2020 (3%) q4 2020
(21%)
q1 2021 (18%)
q2 2021 or later (58%)

IMPACT OF COVID-19 - on port of Antwerp for maritime companies
16
Slack demand as main concern Many investment plans have been postponed
Source: based on results of survey by Alfaport Voka
85%
44%
18% 15% 0%
Slack demand Liquidity problems Social distancing Supply problems Staff shortages
Did not have any investment plan (15%)
Postponing, new date unknown (26%)
Postponing to later in 2020 (6%)
Postponing to later in 2021 (24%)
No postponing (29%)
Source: based on results of survey by Alfaport Voka

CONCLUSIONS
• Direct value added:
• Upward trend in 2013-2018 is mainly driven by the chemicals industry, trade and cargo handling
• Decline in 2018 (-2.9%) due to energy and fuel production
• Direct investment:
• Upward trend in 2013-2018 is mainly driven by the volatile evolution of investment generated by shipping companies. Making abstraction of this branch, investment is mostly affected by chemicals industry, cargo handling, energy and fuelproduction
• After correctionfor merger: Investment declined by 4.4% in 2018 since investment volumes returned to earlier levels
• Direct employment:
• Quite stable in 2013-2018, since financial crisis 2008-2009: negativegrowth until 2015, since 2016 small growth
• Increase in 2018 (+1%) due to extra jobs in cargo handling, chemicals industry and other logistic services
17

CONCLUSIONS
• COVID-19 crisis is more profound than financial crisis in 2008-2009:
• Negative impact on the number of shifts performed by dockworkers, but not as bad as during financial crisis
• Maritime companies:
• Expected drop in turnover in 2020 of -21% compared to 2019
• 76% expect no recovery to pre-crisis level before 2021
• One in two firms makes use of temporary lay-off scheme
• Lack of demand as main concern
• Many investment plans have been postponed or cancelled
• Belgian ports are showing resilience, but uncertainty about the pace of the recovery
18


IMPACT OF BREXIT - on Belgian economy
Medium-term impact: two scenarios
• If ambitious FTA is reached:
• Damage for Belgian economy: moderate
• If no deal is reached ➔ hard Brexit:
• Damage for Belgian economy will be more substantial