economic investment opportunity portfolio in the … · 2020-04-02 · 21 | p a g e contributes...
TRANSCRIPT

Catalytic Infrastructure & Economic Development Initiative
ECONOMIC INVESTMENT
OPPORTUNITY PORTFOLIO
IN THE SARAH BAARTMAN DISTRICT
2020/21 – 2022/23
WORKING DOCUMENT

20 | P a g e
1. ECONOMIC PROFILE OF THE SBDM
1.1 Economy1
The economic state of Sarah Baartman District Municipality is put in perspective by comparing it on a
spatial level with its neighbouring district municipalities, Eastern Cape Province and South Africa. The
section will also allude to the economic composition and contribution of the regions within Sarah
Baartman District Municipality.
The Sarah Baartman District Municipality does not function in isolation from Eastern Cape, South
Africa and the world and now, more than ever, it is crucial to have reliable information on its economy
for effective planning. Information is needed that will empower the municipality to plan and
implement policies that will encourage the social development and economic growth of the people
and industries in the municipality respectively.
1.1.1 Gross Domestic Product by Region (GDP-R)
The Gross Domestic Product (GDP), an important indicator of economic performance, is used to
compare economies and economic states.
Gross Domestic Product by Region (GDP-R) represents the value of all goods and services produced
within a region, over a period of one year, plus taxes and minus subsidies.
GDP-R can be measured using either current or constant prices, where the current prices measures
the economy in actual Rand, and constant prices measures the economy by removing the effect of
inflation, and therefore captures the real growth in volumes, as if prices were fixed in a given base
year.
TABLE 1. GROSS DOMESTIC PRODUCT (GDP) - SARAH BAARTMAN, EASTERN CAPE AND NATIONAL
TOTAL, 2008-2018 [R BILLIONS, CURRENT PRICES]
Sarah Baartman Eastern Cape National Total Sarah Baartman as % of province
Sarah Baartman as % of national
2008 16.4 174.1 2,369.1 9.4% 0.69% 2009 18.3 191.2 2,507.7 9.6% 0.73% 2010 20.3 211.6 2,748.0 9.6% 0.74% 2011 22.0 226.1 3,023.7 9.7% 0.73% 2012 25.0 252.2 3,253.9 9.9% 0.77% 2013 27.4 273.3 3,540.0 10.0% 0.77% 2014 29.6 293.6 3,805.3 10.1% 0.78% 2015 31.9 316.3 4,049.9 10.1% 0.79% 2016 33.9 334.5 4,359.1 10.1% 0.78% 2017 36.8 358.6 4,653.6 10.2% 0.79% 2018 38.3 376.8 4,873.9 10.2% 0.78%
Source: IHS Markit Regional eXplorer version 1803
With a GDP of R 38.3 billion in 2018 (up from R 16.4 billion in 2008), the Sarah Baartman District Municipality contributed 10.15% to the Eastern Cape Province GDP of R 377 billion in 2018 increasing in the share of the Eastern Cape from 9.40% in 2008. The Sarah Baartman District Municipality
1 IHS Information and Insight (Pty) Ltd, STATISTICAL OVERVIEW - Sarah Baartman district municipality, 2019

21 | P a g e
contributes 0.78% to the GDP of South Africa which had a total GDP of R 4.87 trillion in 2018 (as measured in nominal or current prices).It's contribution to the national economy stayed similar in importance from 2008 when it contributed 0.69% to South Africa, but it is lower than the peak of 0.79% in 2017.
In 2018, the Sarah Baartman District Municipality achieved an annual growth rate of 0.44% which is a
slightly lower GDP growth than the Eastern Cape Province's 0.78%, and is lower than that of South
Africa, where the 2018 GDP growth rate was 0.79%. Contrary to the short-term growth rate of 2018,
the longer-term average growth rate for Sarah Baartman (2.11%) is significantly higher than that of
South Africa (1.50%). The economic growth in Sarah Baartman peaked in 2008 at 6.49%.
The Sarah Baartman District Municipality had a total GDP of R 38.3 billion and in terms of total
contribution towards Eastern Cape Province the Sarah Baartman District Municipality ranked fourth
relative to all the regional economies to total Eastern Cape Province GDP. This ranking in terms of size
compared to other regions of Sarah Baartman remained the same since 2008. In terms of its share, it
was in 2018 (10.2%) slightly larger compared to what it was in 2008 (9.4%). For the period 2008 to
2018, the average annual growth rate of 2.1% of Sarah Baartman was the highest relative to its peers
in terms of growth in constant 2010 prices.
TABLE 2. GROSS DOMESTIC PRODUCT (GDP) - LOCAL MUNICIPALITIES OF SARAH BAARTMAN DISTRICT
MUNICIPALITY, 2008 TO 2018, SHARE AND GROWTH
2018 (Current prices)
Share of district municipality
2008 (Constant prices)
2018 (Constant prices)
Average Annual growth
Dr Beyers Naude 4.98 13.01% 2.58 3.28 2.45% Blue Crane Route 2.27 5.93% 1.21 1.42 1.62% Makana 6.37 16.64% 3.67 4.02 0.93% Ndlambe 6.24 16.31% 3.04 3.91 2.56% Sundays River Valley
2.90 7.58% 1.24 1.77 3.61%
Kouga 12.65 33.06% 6.37 7.98 2.28% Kou-Kamma 2.86 7.48% 1.49 1.75 1.64% Sarah Baartman 38.26 19.59 24.14
Source: IHS Markit Regional eXplorer version 1803
Sundays River Valley had the highest average annual economic growth, averaging 3.61% between
2008 and 2018, when compared to the rest of the regions within the Sarah Baartman District
Municipality. The Ndlambe Local Municipality had the second highest average annual growth rate of
2.56%. Makana Local Municipality had the lowest average annual growth rate of 0.93% between 2008
and 2018.
1.1.2 Gross Value Added by Region (GVA-R)
The Sarah Baartman District Municipality's economy is made up of various industries. The GVA-R
variable provides a sector breakdown, where each sector is measured in terms of its value added
produced in the local economy.
Gross Value Added (GVA) is a measure of output (total production) of a region in terms of the value
that was created within that region. GVA can be broken down into various production
sectors.

22 | P a g e
The summary table below puts the Gross Value Added (GVA) of all the regions in perspective to that of
the Sarah Baartman District Municipality.
TABLE 3. GROSS VALUE ADDED (GVA) BY BROAD ECONOMIC SECTOR - SARAH BAARTMAN DISTRICT
MUNICIPALITY, 2018 [R BILLIONS, CURRENT PRICES]
Sarah Baartman Eastern Cape National Total Sarah Baartman as % of province
Sarah Baartman as % of national
Agriculture 2.9 6.7 106.1 42.5% 2.7% Mining 0.1 0.4 350.9 33.6% 0.0% Manufacturing 3.1 43.6 572.9 7.1% 0.5% Electricity 0.5 9.0 166.0 5.3% 0.3% Construction 2.6 13.3 170.3 19.7% 1.5% Trade 7.7 67.9 652.7 11.4% 1.2% Transport 2.6 30.3 426.7 8.4% 0.6% Finance 5.0 61.4 854.4 8.2% 0.6% Community services 10.4 102.7 1,041.3 10.1% 1.0%
Total Industries 34.9 335.3 4,341.3 10.4% 0.8%
Source: IHS Markit Regional eXplorer version 1803
In 2018, the community services sector is the largest within Sarah Baartman District Municipality
accounting for R 10.4 billion or 29.7% of the total GVA in the district municipality's economy. The
sector that contributes the second most to the GVA of the Sarah Baartman District Municipality is the
trade sector at 22.2%, followed by the finance sector with 14.4%. The sector that contributes the least
to the economy of Sarah Baartman District Municipality is the mining sector with a contribution of
R 150 million or 0.43% of the total GVA.
CHART 1. GROSS VALUE ADDED (GVA) BY BROAD ECONOMIC SECTOR - SARAH BAARTMAN DISTRICT
MUNICIPALITY, 2018 [PERCENTAGE COMPOSITION]
Agriculture
Mining
Manufacturing
Electricity
Construction
Trade
Transport
Finance
Community
services
Gross Value Added (GVA) by broad economic sector Sarah Baartman District Municipality, 2018
Source: IHS Markit Regional eXplorer version 1803

23 | P a g e
The community sector, which includes the government services, is generally a large contributor
towards GVA in smaller and more rural local municipalities. When looking at the regions within the
district municipality, the Kouga Local Municipality made the largest contribution to the community
services sector at 26.48% of the district municipality. As a whole, the Kouga Local Municipality
contributed R 11.7 billion or 33.52% to the GVA of the Sarah Baartman District Municipality, making it
the largest contributor to the overall GVA of the Sarah Baartman District Municipality.
CHART 2. GROSS VALUE ADDED (GVA) BY BROAD ECONOMIC SECTOR - LOCAL MUNICIPALITIES OF
SARAH BAARTMAN DISTRICT MUNICIPALITY, 2018 [PERCENTAGE COMPOSITION]
1.2 Labour
The labour force of a country consists of everyone of working age (above a certain age and below
retirement) that are participating as workers, i.e. people who are actively employed or seeking
employment. This is also called the economically active population (EAP). People not included are
students, retired people, stay-at-home parents, people in prisons or similar institutions, people
employed in jobs or professions with unreported income, as well as discouraged workers who cannot
find work.
0%
10%
20%
30%
40%
50%
60%
70%
80%
90%
100%
Gross Value Added (GVA) by broad economic sector Sarah Baartman District Municipality, 2018
Community
services
Finance
Transport
Trade
Construction
Electricity
Manufacturing
Mining
Agriculture
Source: IHS Markit Regional eXplorer version 1803

24 | P a g e
TABLE 4. WORKING AGE POPULATION IN SARAH BAARTMAN, EASTERN CAPE AND NATIONAL TOTAL,
2008 AND 2018 [NUMBER]
Sarah Baartman Eastern Cape National Total
2008 2018 2008 2018 2008 2018
15-19 37,900 31,200 727,000 573,000 5,300,000 4,570,000 20-24 40,900 41,500 633,000 590,000 5,230,000 4,960,000 25-29 39,100 52,500 500,000 679,000 4,390,000 5,530,000 30-34 36,200 46,900 436,000 601,000 3,690,000 5,420,000 35-39 34,900 40,500 415,000 470,000 3,230,000 4,360,000 40-44 30,700 36,700 369,000 398,000 2,790,000 3,480,000 45-49 25,800 32,100 317,000 367,000 2,440,000 2,950,000 50-54 20,000 25,900 258,000 317,000 2,040,000 2,530,000 55-59 16,200 21,400 201,000 277,000 1,660,000 2,180,000 60-64 13,800 16,900 175,000 229,000 1,310,000 1,790,000
Total 295,509 345,493 4,030,080 4,500,170 32,070,524 37,757,662
Source: IHS Markit Regional eXplorer version 1803
The working age population in Sarah Baartman in 2018 was 346 000, increasing at an average annual
rate of 1.58% since 2008. For the same period the working age population for Eastern Cape Province
increased at 1.11% annually, while that of South Africa increased at 1.65% annually.
The graph below combines all the facets of the labour force in the Sarah Baartman District
Municipality into one compact view. The chart is divided into "place of residence" on the left, which is
measured from the population side, and "place of work" on the right, which is measured from the
business side.
CHART 3. LABOUR GLIMPSE - SARAH BAARTMAN DISTRICT MUNICIPALITY, 2018
Youth135
Working age345
Elderly
EconomicallyActive
Population(EAP)195
Non-EAP149
Unemployed53
Employed142
Commuters (net)
Work in region141
Agriculture25
Informal35
Formal(non-Agriculture)
67
Domesticworkers
Mining
Secondaryindustries
17
Tertiaryindustries
50
Population Labour force EAP Employed By sector Formal
Participation, 57%
Unemployment, 28%
0
20
40
60
80
100
0%
20%
40%
60%
80%
100%Sh
ares
, lab
els
in T
ho
usa
nd
s
Labour Glimpse Sarah Baartman District Municipality, 2018
Place of Residence Place of Work
Source: IHS Markit Regional eXplorer version 1803

25 | P a g e
Reading the chart from the left-most bar, breaking down the total population of the Sarah Baartman
District Municipality (520 000) into working age and non-working age, the number of people that are
of working age is about 346 000. As per definition, those that are of age 0 - 19 (youth) or age 65 and
up (pensioners) are part of the non-working age population. Out of the working age group, 56.7% are
participating in the labour force, meaning 196 000 residents of the district municipality forms currently
part of the economically active population (EAP). Comparing this with the non-economically active
population (NEAP) of the district municipality: fulltime students at tertiary institutions, disabled
people, and those choosing not to work, sum to 150 000 people. Out of the economically active
population, there are 53 900 that are unemployed, or when expressed as a percentage, an
unemployment rate of 27.5%. Up to here all the statistics are measured at the place of residence.
On the far right we have the formal non-Agriculture jobs in Sarah Baartman, broken down by the
primary (mining), secondary and tertiary industries. The majority of the formal employment lies in the
Tertiary industry, with 50 000 jobs. When including the informal, agricultural and domestic workers,
we have a total number of 141 000 jobs in the area. Formal jobs make up 48.2% of all jobs in the
Sarah Baartman District Municipality. The difference between the employment measured at the place
of work, and the people employed living in the area can be explained by the net commuters that work
outside of the district municipality.
1.3 Total Employment
Employment data is a key element in the estimation of unemployment. In addition, trends in
employment within different sectors and industries normally indicate significant structural changes in
the economy. Employment data is also used in the calculation of productivity, earnings per worker,
and other economic indicators.
Total employment consists of two parts: employment in the formal sector, and employment in the
informal sector
TABLE 6. TOTAL EMPLOYMENT - SARAH BAARTMAN, EASTERN CAPE AND NATIONAL TOTAL, 2008-2018
[NUMBERS]
Sarah Baartman Eastern Cape National Total
2008 112,000 1,380,000 14,100,000 2009 112,000 1,350,000 14,000,000 2010 111,000 1,300,000 13,700,000 2011 114,000 1,300,000 13,900,000 2012 114,000 1,290,000 14,200,000 2013 119,000 1,320,000 14,600,000 2014 128,000 1,390,000 15,200,000 2015 134,000 1,440,000 15,700,000 2016 139,000 1,470,000 15,900,000 2017 141,000 1,480,000 16,100,000 2018 141,000 1,470,000 16,300,000 Average Annual growth 2008-2018 2.31% 0.61% 1.46%
Source: IHS Markit Regional eXplorer version 1803

26 | P a g e
In 2018, Sarah Baartman employed 141 000 people which is 9.59% of the total employment in Eastern
Cape Province (1.47 million), 0.87% of total employment in South Africa (16.3 million). Employment
within Sarah Baartman increased annually at an average rate of 2.31% from 2008 to 2018.
TABLE 5. TOTAL EMPLOYMENT PER BROAD ECONOMIC SECTOR - SARAH BAARTMAN AND THE REST OF
EASTERN CAPE, 2018 [NUMBERS]
Sarah Baartman
Nelson Mandela
Bay
Buffalo City
Amatole Chris Hani
Joe Gqabi
O.R.Tambo Alfred Nzo
Total Eastern
Cape
Agriculture 25,100 7,680 19,600 10,100 13,000 9,760 7,130 4,970 97,363 Mining 32 198 188 104 168 122 332 126 1,271 Manufacturing 14,200 59,300 21,200 8,210 7,810 4,620 7,600 4,290 127,200 Electricity 126 246 2,230 211 246 130 316 145 3,649 Construction 13,800 25,000 22,300 15,700 20,100 12,400 24,700 17,800 151,747 Trade 31,000 76,400 60,000 38,000 35,200 19,800 54,600 24,700 339,711 Transport 6,470 21,700 10,800 6,680 5,880 3,580 10,500 4,860 70,442 Finance 12,900 48,200 31,300 16,800 16,200 7,740 27,300 10,700 171,213 Community services
24,600 70,900 64,600 47,200 52,300 25,000 74,100 31,900 390,540
Households 12,900 24,500 21,500 12,300 13,700 8,880 15,700 7,710 117,119
Total 141,000 334,000 254,000 155,000 165,000 92,000 222,000 107,000 1,470,256
Source: IHS Markit Regional eXplorer version 1803
Sarah Baartman District Municipality employs a total number of 141 000 people within its district
municipality. The district municipality that employs the highest number of people relative to the other
regions within Eastern Cape Province is Nelson Mandela Bay district municipality with a total number
of 334 000. The district municipality that employs the lowest number of people relative to the other
regions within Eastern Cape Province is Joe Gqabi district municipality with a total number of 92 000
employed people.
In Sarah Baartman District Municipality the economic sectors that recorded the largest number of
employment in 2018 were the trade sector with a total of 31 000 employed people or 22.0% of total
employment in the district municipality. The agriculture sector with a total of 25 100 (17.8%) employs
the second highest number of people relative to the rest of the sectors. The mining sector with 32.5
(0.0%) is the sector that employs the least number of people in Sarah Baartman District Municipality,
followed by the electricity sector with 126 (0.1%) people employed.

27 | P a g e
CHART 4. TOTAL EMPLOYMENT PER BROAD ECONOMIC SECTOR - SARAH BAARTMAN DISTRICT
MUNICIPALITY, 2018 [PERCENTAGE]
1.3.1 Formal and Informal employment
Total employment can be broken down into formal and informal sector employment. Formal sector
employment is measured from the formal business side, and the informal employment is measured
from the household side where formal businesses have not been established.
Formal employment is much more stable than informal employment. Informal employment is much
harder to measure and manage, simply because it cannot be tracked through the formal business side
of the economy. Informal employment is however a reality in South Africa and cannot be ignored.
The number of formally employed people in Sarah Baartman District Municipality counted 106 000 in
2018, which is about 75.10% of total employment, while the number of people employed in the
informal sector counted 35 100 or 24.90% of the total employment. Informal employment in Sarah
Baartman increased from 29 800 in 2008 to an estimated 35 100 in 2018.
1 Agriculture
2 Mining
3 Manufacturing
4 Electricity
5 Construction
6 Trade
7 Transport
8 Finance
9 Community
services
Households
Total Employment Composition Sarah Baartman, 2018
Source: IHS Markit Regional eXplorer version 1803

28 | P a g e
CHART 5. FORMAL AND INFORMAL EMPLOYMENT BY BROAD ECONOMIC SECTOR - SARAH BAARTMAN
DISTRICT MUNICIPALITY, 2018 [NUMBERS]
TABLE 7. FORMAL AND INFORMAL EMPLOYMENT BY BROAD ECONOMIC SECTOR - SARAH BAARTMAN
DISTRICT MUNICIPALITY, 2018 [NUMBERS]
Formal employment Informal employment
Agriculture 25,100 N/A Mining 32 N/A Manufacturing 11,000 3,160 Electricity 126 N/A Construction 6,790 7,050 Trade 17,200 13,800 Transport 2,340 4,130 Finance 10,600 2,260 Community services 19,800 4,720 Households 12,900 N/A
Source: IHS Markit Regional eXplorer version 1803
1.3.2 Unemployment
In 2018, there were a total number of 53 900 people unemployed in Sarah Baartman, which is an
increase of 21 700 from 32 200 in 2008. The total number of unemployed people within Sarah
Baartman constitutes 6.86% of the total number of unemployed people in Eastern Cape Province. The
Sarah Baartman District Municipality experienced an average annual increase of 5.29% in the number
of unemployed people, which is worse than that of the Eastern Cape Province which had an average
annual increase in unemployment of 4.66%.
0
5 000
10 000
15 000
20 000
25 000
30 000
Formal and informal employment by sector Sarah Baartman, 2018
Formal employment Informal employment
Source: IHS Markit Regional eXplorer version 1803

29 | P a g e
In 2018, the unemployment rate in Sarah Baartman District Municipality (based on the official
definition of unemployment) was 27.50%, which is an increase of 4.94 percentage points. The
unemployment rate in Sarah Baartman District Municipality is lower than that of Eastern Cape. The
unemployment rate for South Africa was 27.31% in 2018, which is a increase of -3.72 percentage
points from 23.59% in 2008.
CHART 6. UNEMPLOYMENT AND UNEMPLOYMENT RATE (OFFICIAL DEFINITION) - SARAH BAARTMAN
DISTRICT MUNICIPALITY, 2008-2018 [NUMBER PERCENTAGE]
When comparing unemployment rates among regions within Sarah Baartman District Municipality,
Makana Local Municipality has indicated the highest unemployment rate of 32.5%, which has
increased from 27.3% in 2008. It can be seen that the Sundays River Valley Local Municipality had the
lowest unemployment rate of 16.4% in 2018, which increased from 15.6% in 2008.
0%
5%
10%
15%
20%
25%
30%
0
10 000
20 000
30 000
40 000
50 000
60 000
2008 2009 2010 2011 2012 2013 2014 2015 2016 2017 2018
Number of unemployed & Unemployment rate Sarah Baartman, 2008-2018
Number of unemployed people Unemployment rate
Source: IHS Markit Regional eXplorer version 1803

30 | P a g e
CHART 7. UNEMPLOYMENT RATE - LOCAL MUNICIPALITIES AND THE REST OF SARAH BAARTMAN
DISTRICT MUNICIPALITY, 2008, 2013 AND 2018 [PERCENTAGE]
0%
5%
10%
15%
20%
25%
30%
35%
Unemployment rate Sarah Baartman, 2008, 2013 and 2018
2008 2013 2018
Source: IHS Markit Regional eXplorer version 1803

31 | P a g e
2. CACADU DEVELOPMENT AGENCY
2.1 Brief Overview of the CDA
The CDA is an entity of the Sarah Baartman District Municipality established by the Council to be one
of its tools for socio-economic development in the offensive to fight underdevelopment, poverty by
unlocking the District economic development potential that will transform the fortunes of the
population of the district as envisaged by the SA Constitution.
Since its establishing, the Agency has evolved into an entity capable of smartly executing its mandate
to facilitate catalytic economic and infrastructure projects. In the implementation of its mandate, the
CDA is directed by overarching frameworks of the National Development Plan, National Government
Industrial Sector Development Strategies (IPAP; APAP; Green Economy, etc), Eastern Cape Provincial
Industrial Development Strategy, SBDM IDP.
The Cacadu Development Agency operations are distinct from similar Urban Development Agencies
entities in the country and globally as the other Agency’s unlike CDA receive their budget as a direct
line item of a department or directorate which covers for both operational and capital budgets for
both human resources and implementation of economic projects identified by the shareholder. The
Agency only receives seed capital from primary shareholder to initiate catalytic economic
development project implementation, such as undertaking project scoping and feasibility study. This
state of affairs requires that the Agency to be innovative in raising necessary capital for its project
portfolio that will be convincing to the investors to invest their hard earned funding towards their
execution. Thus the Agency is more than a project funding mobilisation agency as it is seized with the
task of developing localised and integrated area based development for the SBDM small towns to
attract favourable investments.
In the course of the development of local area and an integrated economic development packages for
various funding entities, it is expected that the Agency should be proactive to play a development
facilitation functions in the pre-development of economic development projects and to some extent
joint implementation of projects with the investors.
2.2 CDA Governance and Operational Framework
2.2.1 CDA Governance Framework
The Chart below provides typical Governance framework that the CDA management and Board need
to comply with in order to account to the primary shareholder, the SBDM Council.

32 | P a g e
CHART 8. CDA GOVERNANCE FRAMEWORK
2.2.2 CDA Operational Framework
The chart below is the CDA operational framework that guides the entity’s strategic focus on how
to deliver on its mandate as expressed in the Service Level Agreement enter into between SBDM
and CDA as expressed in clause 5 entitled “Main Developmental Objectives”.

33 | P a g e
CHART 9. CDA OPERATIONAL FRAMEWORK
These main developmental objectives include:
• CDA will be responsible for the co-ordination of economic and infrastructure development at regional scale. It will also have an implementation role particularly in regard to regional project management. In defining its role in practice, it will seek to ensure that it does not duplicate the activities of the district and local municipalities but rather complements and enhances their activity. CDA will build on the groundwork done through REDI programme.
• CDA will prioritise and facilitate strategic catalytic development initiatives that ensure that investment is attracted to the Municipal Area and that job creation and economic opportunity is optimised. Areas of focus will include:
• Improving the economic and investment climate in the region;
• Developing regional economic nodes and regenerating small towns;
• Investment promotion and resource mobilization, including ;
• Skills development;
• Co-ordinating work of different municipalities and government agencies at regional level;
• Agriculture and agro-processing;

34 | P a g e
• Developing catalytic infrastructure such as roads, electricity, water, etc.
• In undertaking its work, CDA will place strong emphasis on inter-governmental and inter-sectoral integration, strong stakeholder management and communication.
• CDA will operate within the IDP and spatial frameworks established by CDM and will also make inputs into the revisions of these documents.
2.2.2 Inter-Governmental Relations key in delivering on the CDA Mandate
The CDA’s primary focus is the mobilisation and facilitation of investments from both the public and
private sector partners, local and abroad, for the development of infrastructure and industrial sectors
of the District.
Since all infrastructure and economic development activities take place at a local municipal level, it
becomes of strategic importance that the CDA established strong partnerships with the District’s local
municipalities. This will ensure that all infrastructure and economic development programs pursued by
the CDA are aligned with the local municipality’s integrated development plans.
Furthermore, the success of the CDA is intertwined in the understanding of both the National and
Provincial Governments industrial sector funded mandates as expressed in the different Government
Departments strategy documents on economic development. For instance, the Industry Policy Action
Plan (IPAP) 2018/19 – 2020/21, spearheaded by the Department of Trade & Industry (the dti) to fast
track the development of those industrial sectors seen as critical in jump starting SAs economic
development.
The figure 2.1 below depicts the flow process that defines how the CDA derives its mandate and role
by fostering collaboration with all the State’s sector entities (Departments, Municipalities, SOEs,
Research Entities, etc.,) with funded programs aligned to the District’s Local Municipalities
infrastructure and economic development potential.
CHART 9. FLOW PROCESS

35 | P a g e
2.2.3 Matching of CDA Activities to SBDM Priority Program
The table below
TABLE 8. SBDM DEVELOPMENT PRIORITY 3: LOCAL ECONOMIC DEVELOPMENT VS CDA PROGRAM
KEY SBDM PRIORITY
PROGRAMS
KEY SBDM IDP PROGRAMMES
MATCHING CDA PROGRAMMES
CDA ACTIVITIES
1. Promote economic & infrastructure development as well as attract investment towards achieving job creation and inclusive economy on all CDA identified industrial sectors
a. Increase agricultural income to achieve a year-on-year growth in the agriculture and agro-processing sectors. ✓ Development of New
& Expansion of Primary Agricultural Industry Development
✓ Agro-processing Industry Development
✓ Light Manufacturing
Industrial Park Development.
✓ Green Economy / Renewable Energy Industry Development
✓ Oceans Economy Development.
✓ Tourism Industry
Development
✓ Infrastructure (Roads, Water, Energy, ICT) Development
✓ Exploring New
Economic Sector Development2
A. Facilitation & Development
of partnerships and conceptual
plans for investment (local &
foreign) in New or Expansion of
existing agriculture & agro-
processing; Industrial Product
Manufacturing; Tourism New
Offering and other
infrastructure & economic
development initiatives in the
district in the context of SA
inclusive growth strategy;
B. Partner with leading
renewable energy companies
involved in energy generation to
unlock direct benefits to local
municipalities in the District.
C. Identification and packaging
of new tourism related industry
offerings in the District with
potential to attract new
investment (Public & Private)
and grow the sector.
b. Facilitate Investment in natural capital to contribute towards government's target of creating "green" and “blue” jobs by 2020
c. Broaden economic participation and inclusion by increasing the number and support to small enterprises
d. Developing skills and education base by increasing the number of semi-skilled and skilled
e. Building local and regional networks and collaboration through the creation of partnerships with (a) government, (b) the private sector and (c) education / research
f. To grow tourism sector's absolute contribution to the District Economy
2 Arising from new innovation breakthroughs
36 | P a g e
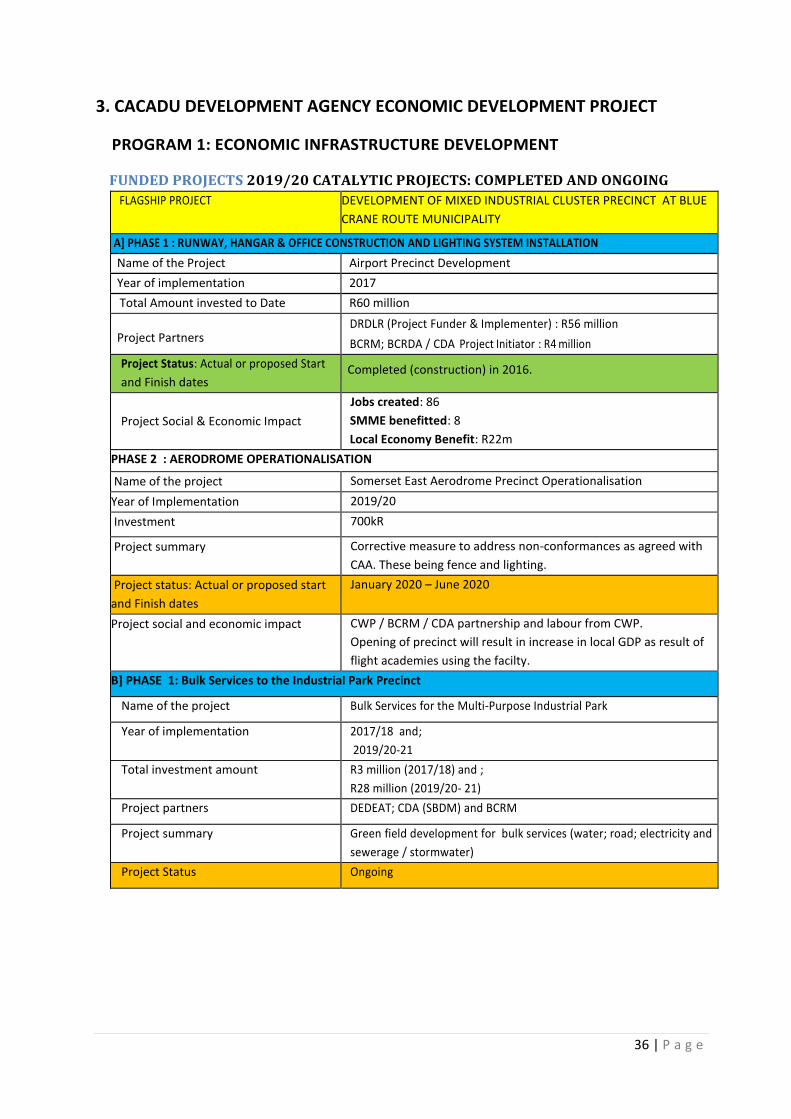
3. CACADU DEVELOPMENT AGENCY ECONOMIC DEVELOPMENT PROJECT
PROGRAM 1: ECONOMIC INFRASTRUCTURE DEVELOPMENT
FUNDED PROJECTS 2019/20 CATALYTIC PROJECTS: COMPLETED AND ONGOING
FLAGSHIP PROJECT DEVELOPMENT OF MIXED INDUSTRIAL CLUSTER PRECINCT AT BLUE
CRANE ROUTE MUNICIPALITY
A] PHASE 1 : RUNWAY, HANGAR & OFFICE CONSTRUCTION AND LIGHTING SYSTEM INSTALLATION
Name of the Project Airport Precinct Development
Year of implementation 2017
Total Amount invested to Date R60 million
Project Partners DRDLR (Project Funder & Implementer) : R56 million
BCRM; BCRDA / CDA Project Initiator : R4 million
Project Status: Actual or proposed Start
and Finish dates Completed (construction) in 2016.
Project Social & Economic Impact
Jobs created: 86
SMME benefitted: 8
Local Economy Benefit: R22m
PHASE 2 : AERODROME OPERATIONALISATION
Name of the project Somerset East Aerodrome Precinct Operationalisation
Year of Implementation 2019/20
Investment 700kR
Project summary Corrective measure to address non-conformances as agreed with
CAA. These being fence and lighting.
Project status: Actual or proposed start
and Finish dates
January 2020 – June 2020
Project social and economic impact CWP / BCRM / CDA partnership and labour from CWP.
Opening of precinct will result in increase in local GDP as result of
flight academies using the facilty.
B] PHASE 1: Bulk Services to the Industrial Park Precinct
Name of the project Bulk Services for the Multi-Purpose Industrial Park
Year of implementation 2017/18 and;
2019/20-21
Total investment amount R3 million (2017/18) and ;
R28 million (2019/20- 21)
Project partners DEDEAT; CDA (SBDM) and BCRM
Project summary Green field development for bulk services (water; road; electricity and
sewerage / stormwater)
Project Status Ongoing

37 | P a g e
Areas of investment (Education; Health;
Manufacturing; Tourism; Renewable;
ICT; Skills Development; etc.)
Manufacturing : Objective is to establish mixed industrial Cluster precinct to focus on animal fibre beneficiation; renewable energy; aviation industrial activities; agribusiness development; etc. Tourism: SANPark strategy is on expansion of Addo Elephant Park in the Northerly direction. The airport precinct is providing access for those local and international operators to use the facility for aircraft landing for game hunters; fly fishing; access to Kuzuko Game Reserve and others; etc. Skills Development: Air flight academies using the facility as licence training facility.
FLAGSHIP PROJECT CONSTRUCTION OF ZUURBERG HERITAGE MEMORIAL SITE
Name of the project Zuurberg Heritage Memorial Site Construction
Area of Operation (local Municipality) Sundays River Valley municipality
Year of Implementation 2018 - 20
Total Amount invested to date R 54, 1 million
Project Partners DRDLR — Lead Funder : R54.1 million CDA — Project Initiator : R2 million Local Municipalities: BCRM; SRVM and SBDM
Project Status Ongoing
Areas of investment (Education; Health;
Manufacturing; Tourism; Renewable; ICT;
Skills Development; etc.)
Tourism: The Zuurberg Heritage Memorial Site construction project is the District strategic intent to boldly reclaim and highlight the historic significance of the District in being the site of heroic wars fought by the indigenous people in protecting their land from foreign invaders. These wars are commonly known as Wars of Resistance. The Zuurberg Heritage Memorial is one of the localities where Chief Ndlambe and Stuurman forged alliance to fight and protect the land against Stockenstroom, a Dutch Settler. Skills Development: Local contractors
Project Social & Economic Impact
Jobs created : 84 SMME benefitted: 8 (SRVM) Local Economy Benefit: R7.6m
FLAGSHIP PROJECT R335 ROAD CONSTRUCTION CONNECTING BCRM TO SRVM
Name of the project R335 Road Construction
Area of Operation (Local Municipality) Blue Crane Route Municipality & Sundays River Valley Municipality
Total Amount invested to date R 117, 9MILLION
Project Partners
DRDLR — Lead Funder : R117,9 million CDA — Project Initiator : R2 million Local Municipalities: BCRM; SRVM and SBDM
Project Status: Actual or proposed Start
and Finish dates
Only phase 1 of 21.5km road construction has been Completed. Total road construction is for 112 km.
Areas of investment (Education; Health;
Manufacturing; Tourism; Renewable; ICT;
Skills Development; etc.)
Tourism: SANPark strategy is on expansion of Addo Elephant Park in the Northerly direction. The R335 road infrastructure development linking BCRM and SRVM is aimed at catalyzing tourism sector through accessing of game farms, Addo Elephant Park, extreme sports activities, cultural tourism (Zuurberg Heritage Memorial) and movement of farming goods to proposed Somerset East Industrial Cluster Precinct. Skills Development: Local contractors

38 | P a g e
Project Social & Economic Impact
Jobs created: 141 SMME benefitted: 31(SRVM and BCRM) Local Economy Benefit: R 56.7m
FLAGSHIP PROJECT WIND TOWER MANUFACTURING
Name of the project Wind tower Manufacturing
Area of Operation (Local Municipality) Blue Crane Route Municipality
Total Amount invested to date R22 m
Project Partners Steffanuti Stocks (Private Partner): R22m
Areas of investment (Education; Health;
Manufacturing; Tourism; Renewable; ICT;
Skills Development; etc.)
Steffanuti Stocks (SS) and CDA collaborated in setting up of concrete wind tower manufacturing operations at the Somerset East Industrial Cluster Precinct. Steffanuti Stocks agreed to develop 4 ervens as their contribution totaling R4m. Skills Development: Local contractors
Project Status: Actual or proposed Start
and Finish dates
The project is completed in February 2020.
Project Social & Economic Impact
Jobs created: 180 SMME benefitted: 5 Local Economy Benefit: R 8 379 709,78
FLAGSHIP PROJECT DEVELOPMENT OF SCIENCE AND TECHNOLOGY BUSINESS
INDUSTRIAL PARK DEVELOPMENT PARK AT MAKANA LOCAL
MUNICIPALITY
PHASE 1
Name of the Project Airport Precinct Development and Science & Technology Business
Industrial Park Development
Year of implementation 2019/20 – 2021/22
Total Amount invested to Date R1.5 million
Project Partners MAKANA LM; CDA AND RHODES UNIVERSITY
Project Status: Actual or proposed Start
and Finish dates 2019/20 Feasibility Study Phase
2020/21 Master Plan & Business Plan Development and Investment
Project Social & Economic Impact tbd
Estimated investment required R200 million
PROGRAM 2: AGRICULTURE AND AGRO-PROCESSING
FLAGSHIP PROJECT SBDM BEEF EXPORT INITIATIVE
PHASE 1
Name of the Project Airport Precinct Development and Science & Technology Business
Industrial Park Development
Year of implementation 2019/20 – 2021/22
Total Amount invested to Date R3 million
Project Partners SBDM; CDA; Ndlambe LM; Private Sector
Project Rationale
BEIP flows from the partnership agreement entered between the Sarah
Baartman District Municipality and Municipality in China, that catalyzed
the signing of the Letter of Procurement Intent for 6000 Ton of Frozen
Beef for China by one of China leading export and import entity, SIIC.

39 | P a g e
Objectives
✓ The successful implementation of the BEIP in its entirety has the potential of unleashing the expansion of existing enterprise and the creating new ones across the cattle farming (upstream) and beef export (downstream) value chains, that would result in the development of a new business model to enable the economic transformation of the red meat industry and associated in by-product value add into a bigger and duplicable way.
✓ The BEIP has a strong economic developmental opportunity that would afford the CDA with an opportunity to partner with subsistence and commonage livestock owners in a structured program dedicated in improving the quality of their livestocks.
Project Phases
✓ Phase 1 Export value chain establishment
✓ Phase 2 New model development and incubation
✓ Phase 3 New model duplication in the community
Project Status: Actual or proposed Start
and Finish dates 2019/20 -2020/21: Phase 0 : Kick-start of the value chain : designed
to establish a minimum capacity in the Eastern Cape to enable the
Beef Export business rolling out.
Project Social & Economic Impact tbd
Estimated investment required R3 million

40 | P a g e
CACADU DEVELOPMENT AGENCY UNFUNDED PROJECTS 2020/21
The CDA classification of “unfunded projects” means all the projects that the CDA deemed
very important to the District Economy for which the CDA has not secured any grant funding
for their implementation.
The CDA Board approved the “CDA deviation rule” which seeks to regulate processes of
responding to funding OR investment opportunities that are not budgeted in the CDA annual
budget allocation from its primary shareholder, the SBDM.
The CDA deviation rule seeks to acknowledge that the SBDM budget allocation to the CDA is
Inadequate to implement catalytic economic development projects and is a mere seed fund
towards unlocking big ticket investment for the District.
FLAGSHIP PROJECT WATER SECURITY FOR SBDM
PHASE 1
Name of the Project Laying the basis for economic growth and municipal sustainability
by finding a permanent water and energy solution for the Sarah
Baartman District
Overall objective To develop a permanent water solution for the Sarah Baartman
District that will comprise a massive seawater desalination plant
(flash distillation) connected to an extensive pipeline bringing
already desalinated and demineralized water to the municipalities
in the Sarah Baartman Districts.
Project Overview
(a) The desalination plant will be modular in design, and so too the pipeline system to allow water to flow as individual units are completed, instead of waiting for the entire infrastructure to be in place before the first water flows.
(b) As the water will be already desalinated and demineralized at the central plants, municipal infrastructure will be redirected to become return effluent plants of grey water for industrial use, including water requirements that may arise from possible shale gas production. The desalination plant water will be reserved for agricultural and household use.
(c) The pipeline to be built on existing railway networks (including side-lines) or road networks to make use of existing servitudes. This to be done to limit the time required to get the required servitudes in place. At the same time, as the pipeline will be built, the workers will also service the railway lines and sidings which have fallen into disrepair.
(d) To secure along with the water infrastructure a third party concession to vest in the Cacadu Development Agency (fix, build, own and operate) the rail infrastructure outside of the main PLZ-JHB line, with access to this main line. This will vest the water servitudes in the CDA, together with the railway lines which the Agency can then concession to private railway line operators who will operate a railway service (low speed, possibly steam locomotives) for freight and passengers. This opens up markets for rural producers (agri commodities) and tourism.
(e) To tie the water project to a green energy project which will require every RDP house to have solar panels as a roof (funded by the project) with private dwellings and businesses being subsidized to convert their roof to solar. In addition, municipalities to tender for the establishment of solar farms. The rationale: energy security in the face on continuing difficulties at

41 | P a g e
Eskom, and the problems of financial sustainability facing municipalities who do not have adequate rates bases, but are expected to supply utilities to poor households of a free and subsidized basis. Combined with smart grids, and smart water and electricity meters, municipalities can then cap the amount of free energy and water supplied to households, and harvest the energy, which can be sold to the desalination plant (very power intensive) and in return receive units of water. This allows the municipalities to continue providing services, but also a means independent of the fiscus after the initial capital injection to fund it.
(f) In addition, tied to the water and energy project, a key aspect of the feasibility study is to develop an integrated LED strategy (including agri, transport and tourism as key pillars) that will be executed by the integrated PMO (please refer points below) on the District Development Model. This includes the survey of state-held and municipal properties, consolidating the asset base, and their release for economic development activities on concessionary and other bases. The revenue derived from these properties in the form of rates and other licensing / concessionary conditions to accrue to the relevant local municipality account.
(g) The desalination and water facility, as well as the integrated solar grid to become a district level resource managed by the CDA, and funded by salt sales (fertilizer), sales of water and electricity, and concessions derived from the railway network. The local municipalities to benefit from a broadening of the rates base as economic activity improves, higher property values (rates and taxes) and business taxes (on production coming out of the area) which can take the form of either a flat tax or a levy. Profits obtained to return to the District Development Fund.
Year of implementation 2019/20 - onwards
Total Amount invested to Date R0
Project Partners Coega SEZ; Trans-Caledon Tunnel Authority; Amatola Water; Water
Specialist; DBSA; SBDM; LMs; CDA
Project Status: Actual or proposed Start
and Finish dates 2019/20 Techno-Economic Feasibility Study Phase
Project Social & Economic Impact tbd
Estimated investment required R60-80 million (cost R160m for PetroSA to develop the feasibility
for Mthombo R1.5bn pipeline and the refinery)

42 | P a g e
FLAGSHIP PROJECT ENERGY SECURITY FOR SBDM
Name of the Project To explore opportunities for localised energy generation by the
SBDM Local Municipalities.
Key issues 1. South Africa’s Energy challenges:
• Eskom is a South African electricity public utility involved in generation, transmission and distribution of electricity to South Africans (business and households).
• Owing to Eskoms’ neglect in servicing its power plants, South Africans has been experiencing load shedding as a result of the interruption of an electricity supply to avoid excessive load on the generating plant.
• Frequent load-shedding in the last few months has had a debilitating effect on our country;
• Load shedding severely hampers Government efforts to rebuild the economy and to create jobs;
• Load-shedding will remain a possibility for the immediate future and predictions are that it will continue for next 24 months.
2. South African Government’s measures being
implemented to fundamentally change the trajectory of energy
generation for South Africa3:
• A Section 34 Ministerial Determination will be issued shortly, by the Minister of Mineral
Resources and Energy, to give effect to the Integrated Resource
Plan 2019, enabling the development of additional grid capacity
from renewable energy, natural gas, hydro power, battery storage
and coal.
• Initiate the procurement of emergency power from projects that can deliver electricity into the grid within three to 12 months from approval.
• Government will put in place measures to enable municipalities in good financial standing to procure their own power from IPPs.
3. Assessment issue for potential hydropower and solar energy
farm & household energy generation potential to include:
• Environmental, social and land conditions;
• Construction estimates;
• Financial model;
• Assess off-takers and Power Purchase Agreement
• Negotiate land ownership and servitudes;
• Environmental studies and water use application license;
• Bankable energy assessment
• Detail network integration
Likelihood of accessing climate/green
bond financing
South African Government on spending more
The project fits into national and/or regional policies and plans for hydropower / solar projects planning, implementation and operations *
South Africa’s Integrated Resource Plan 2019, enables the
development of additional grid capacity from renewable energy,
natural gas, hydro power, battery storage and coal.
3 https://www.gov.za/speeches/president-cyril-ramaphosa-2020-state-nation-address-13-feb-2020-0000 (page 6)

43 | P a g e
FLAGSHIP PROJECT AGRICULTURE AND AGRI-INDUSTRIAL DEVELOPMENT
PHASE 1
Name of the Project Scoping of Potential for Industrial Expansion of Existing Agricultural
Commodities in support of DDM through downstream value added
interventions
Year of implementation 2019/20 – 2021/22
Total Amount invested to Date R1.32 million
Project Partners SBDM; CDA; LMs; District Agric Commodity Entities
Project Rationale
Primary agriculture sector contributes significantly to the District GDP
(est at R2.9 bn) and has a huge potential for expansion and thus an
opportunity for transformation. The agricultural sector is regarded as
priority sector by the South African Government as it is labour
intensive. The expansion of the primary agricultural sector and
associated value addition opportunities can result in new enterprises
development and job opportunities.
Objectives
✓ Citrus Association Engagement on Industry Expansion Opportunities
✓ Chicory Industry Engagement on Industry Expansion Opportunities
✓ Pineapple Industry Engagement on Expansion Opportunities
✓ Horticulture Industry Engagement on industry expansion opportunities
✓ Mohair & Wool Industry engagement on industry expansion opportunities
✓ Forestry industry beneficiation opportunities
✓ Deciduous Fruit Industry engagement on industry expansion
✓ Scoping on District commercial opportunity for high niche cash crops
✓ Scoping on District Opportunity on Skin Hide Value Add Enterprise Development
Project Phases ✓ Industry engagement
Project Status: Actual or proposed Start
and Finish dates 2019/20 -2020/21: Not funded
Project Social & Economic Impact tbd
Estimated investment required R3 million

44 | P a g e
FLAGSHIP PROJECT TOURISM INDUSTRY DEVELOPMENT
PHASE 1
Name of the Project Improvement of the District tourism road networks and the
development of new tourism offerings
Year of implementation 2019/20 – 2021/22
Total Amount invested to Date R0
Project Partners SBDM; CDA; LMs; Tourism Sector Partners
Project Rationale
The District has a variety of Tourism offerings for a variety of clients.
These include cultural tourism; National Park; Game Reserve; Heritage;
Endurance and Water Sport; etc.
Objectives
✓ Cost benefit analysis on upgrading road networks to easily access the District’s tourism sites and establishment.
✓
Project Phases ✓ Techno-economic feasibility
o Engagement with all relevant stakeholders in the District
Project Status: Actual or proposed Start
and Finish dates 2019/20 -2020/21: Not funded
Project Social & Economic Impact tbd
Estimated investment required R2 million
FLAGSHIP PROJECT OCEANS ECONOMY INDUSTRY DEVELOPMENT INCLUDING FRESH
WATER FISH FARMING
PHASE 1
Name of the Project Blue economy is regarded as a strategic economic sector for South
Africa
Year of implementation 2019/20 – 2021/22
Total Amount invested to Date R0
Project Partners SBDM; CDA; LMs; ECSECC; DEDEAT; National Departments
Project Rationale The District has four coastal local municipalities and no integrated
economic strategy for the oceans economy.
Objectives
✓ Intergration of Ndlambe and Kouga Small Harbour & Coastal Business Plans into a single strategy for the District.
✓ Project scoping on Ocean's Economy Industry opportunities for SRVM and Koukamma LMs
Project Phases ✓ Techno-economic feasibility
o Engagement with all relevant stakeholders in the District
Project Status: Actual or proposed Start
and Finish dates 2019/20 -2020/21: Not funded
Project Social & Economic Impact tbd
Estimated investment required R4 million

45 | P a g e
FLAGSHIP PROJECT SBDM LOCAL MUNICIPALITY TOWNSHIP INDUSTRIAL DEVELOPMENT
PHASE 1
Name of the Project Township Industrial Development
Year of implementation 2019/20 – 2021/22
Total Amount invested to Date R0
Project Partners SBDM; CDA; LMs; ECSECC; DEDEAT; National Departments
Project Rationale
The Township Industrial Development is a strategic program of the
National Government to ensure that townships become centres of
productive activity.
Objectives
✓ Scoping for the potential to establish co-shared manufacturing centres (artisan; furniture making; textiles; craft; cosmetics; cleaning chemicals; 3-D printing; agriculture & agro-processing; leather product manufacturing; panel beating workshop; auto-mechanic; renewable energy; etc.) in the SBDM Local Municipalities informed by converging resource pool of common township enterprises under one roof to enhance mass production of products of consistent quality.
✓ Scoping ICT infrastructure roll out and community ownership to allow access to township ICT innovators to develop new products.
Project Phases ✓ Techno-economic feasibility
o Engagement with all relevant stakeholders in the District
Project Status: Actual or proposed Start
and Finish dates 2019/20 -2020/21: Not funded
Project Social & Economic Impact tbd
Estimated investment required R4 million