economic outlook and emerging - bcp securities
TRANSCRIPT

1
BC
P T
op P
icks/
10
/07
/20
19
ECONOMIC OUTLOOK AND EMERGING
DR. WALTER MOLANO, PhD
CHIEF ECONOMIST
BEN HOUGH
DIRECTOR OF CORPORATE RESEARCH
MATIAS CASTAGNINO, CFA
CORPORATE RESEARCH
ARTURO GALINDO
CORPORATE RESEARCH
OCTOBER 7, 2019
DOCUFO 24
TELVIS 26
AEROAR 27
ARCOR 23
GOLLBZ 25
UNIGEL 26
KLAB 27
OUTPERFORM
UNDERPERFORM
SWAP
POGLN 22
China: Bad Memories Dr. Walter Molano, Ph.D. EM Corporate Highlights Corporate ResearchTop Picks for 4Q19 Corporate Research
1
BC
P T
op P
icks/
10
/07
/20
19CARINC 21
GTE 25
VEDLN 22
VAKBN 22

2
BC
P T
op P
icks/
10
/07
/20
19
The fiery protests in Hong Kong are a tremendous headache for Beijing. The images of thousands of black-clad middle class kids, converging into the heart of the financialdistrict in order to confront the police, strikes pangs of fear deep into the hearts of senior party officials in Beijing. Up to recently, Hong Kong was the preview of whatChina would look like in the near future; modern, prosperous and self-assured. It was paradise for anyone who wanted to work hard. Fortunes were made, and there wereendless stories of people who became astronomically rich after starting with nothing. Unfortunately, the city fell victim to its own success. The endless stream of arrivingmainlanders seeking a better life pushed wages down and rents up. Untenable prices forced young people into tiny apartments in squalid neighborhoods. The city becamea powder keg looking for a catalyst to explode. Unfortunately, the spark appeared when Chief Executive Carrie Lim, unilaterally introduced a bill to facilitate the extraditionof suspected criminals to Mainland China. The city had become an outpost for shady mainlanders looking to escape the law, and it was starting to become a problem.Therefore, the city government wanted to streamline the extradition process. Unfortunately, it was the unexpected detonator that was needed to bring the social cauldronto a boil. It was the excuse for people to vent their anger, in a state where there was no representative process. Millions took to the street, and there were pitched battleswith the police throughout the city. Although Beijing had troops at the ready in neighboring Shenzhen, it was in no hurry to engage. Hong Kong is supposed to be fullyintegrated into China by 2047, but it will probably retain a great deal of independence. China needs Hong Kong to stay that way, so it can remain the financialcenter. A rules-based legal system is the key to creating any financial hub. However, the Communist Party plays a direct role in the Chinese legal system, and it will neverbecome a rules-based system. Therefore, Beijing needs Hong Kong to continue to play that key role, with its well-established and well-respected courts system. This wayChinese companies and entrepreneurs can continue to raise the capital they need to fund the economic growth and activity. So, why is Beijing so worried aboutHong Kong?.
History plays an important role in Chinese political thought. Chinese leaders always reference the past to try to understand the future. This is why the image of millions ofblack-clad youths marching through the streets of Hong Kong and taking on the police was so terrifying. There have been many spontaneous uprisings that have explodedinto bloodbaths and revolutions. Chinese society is susceptible to the influence of cults, which have pushed the population in unexpected directions. One exampleoccurred in 1899, when a cult of martial arts enthusiasts, known as the Militia United in Righteousness, mobilized into a nationwide civil war that claimed more than100,000 lives. Commonly known as the Boxer Rebellion, it was spurred by an economic downturn due to a drought in the grain-growing northern provinces. However, abetter example occurred in the late 1850s and early 1860s, during the Taiping Rebellion, when a charismatic and economically frustrated young man, Hong Xiuquancreated a religious-based cult that took on the Qing Dynasty. More than 30 million people perished during the revolt, marking it the bloodiest civil war. EvenCultural Revolution took on a life of its own that needed to be put down. Therefore, it is normal for party officials to worry about the uprising in Hong Kong. These are thereasons why Beijing keeps close tabs on social media and the press. With a population of more than 1.3 billion, any social movement can easily grow to a scale that isuncontrollable.
The other problem is that the economic woes in Hong Kong are a precursor of what lies ahead for China. It is natural that a growth rate slows as it reachesmiddle income status. According to the Solow Growth Model, equilibrium GDP should stabilize at the growth rate. The issue is that population growthrate is negative, due to the one-child rule that was implemented during the early 1980s. On top of that, measures to curb the shadow banking system, along withtrade war, are adding to the pain. High pork prices and the weakening currency are sapping purchasing power, and many young mainlanders feel that they will neverachieve the same success of their parents. Therefore, like Hong Kong, a social-economic cauldron is simmering in the mainland and all that is needed is for anunintended spark for it to explode.
CHINA: BAD MEMORIES
Dr. Walter Molano, Ph.D.September 9, 2019

3
BC
P T
op P
icks/
10
/07
/20
19
Argentina
• Alberto Fernandez scored a major win in the primary elections held on August 11th with 48% of total votes, a level that will allow him win in the first round of the coming
elections on October 27th . A big selloff followed, with bonds plunging to 40c, ARS spiking to 60 and foreign reserves having lost US$17bn since the primaries
• A debt reprofiling announcement followed in order to target debt service between 2020-2023, although no details were provided on terms since government officials stated
it will be done through negotiations with bondholders. Additionally, capital controls were imposed, limiting USD purchases by locals, requiring shorter F/X liquidation
periods for exports, as well as forbidding transfers of foreign currency by non-residents to offshore accounts
• Due to the events that followed the primary elections, IMF has put on hold the transfer of US$5.4bn corresponding to the fifth review of the Stand-By agreement, which
was originally planned for mid-September, causing additional concerns over the sovereign liquidity position
• GDP contracted 0.3% q/q in 2Q19 while gross debt to GDP ended at 81% as of Jun19 and external debt to GDP at 40%. Additionally, the primary fiscal surplus was 0.3%
of GDP while total deficit stood at 2.9% of GDP. Monthly inflation in turn increased to 4.0% in September from 2.2% in August. Trade balance was positive US$2.7bn in
2Q19 while current account deficit totaled 2.1% of GDP
• Poverty rate reported by the INDEC was 35.4% as of June 2019, having increased 8 p.p. in the past year
• Due to capital controls, Clearstream has reported that Caja de Valores was not able to remit USD to offshore accounts of proceeds from local law bond that matured
on September 9 and that were deposited by the company at the account in Caja de Valores, since Clearstream is considered a non-resident.
• ruling party Frente Cambia Mendoza, a coalition between the PRO, UCR and CC was reelected with 52% of votes in the elections held on September 29th.
• Several protests took place in the province of Chubut, with several state workers on strike, blockading roads and complaining about the timely payment of salaries, and with
local government asking for higher fund transfers from the national administration.
EM HIGHLIGHTS
3
BC
P T
op P
icks/
10
/07
/20
19
4
BC
P T
op P
icks/
10
/07
/20
19
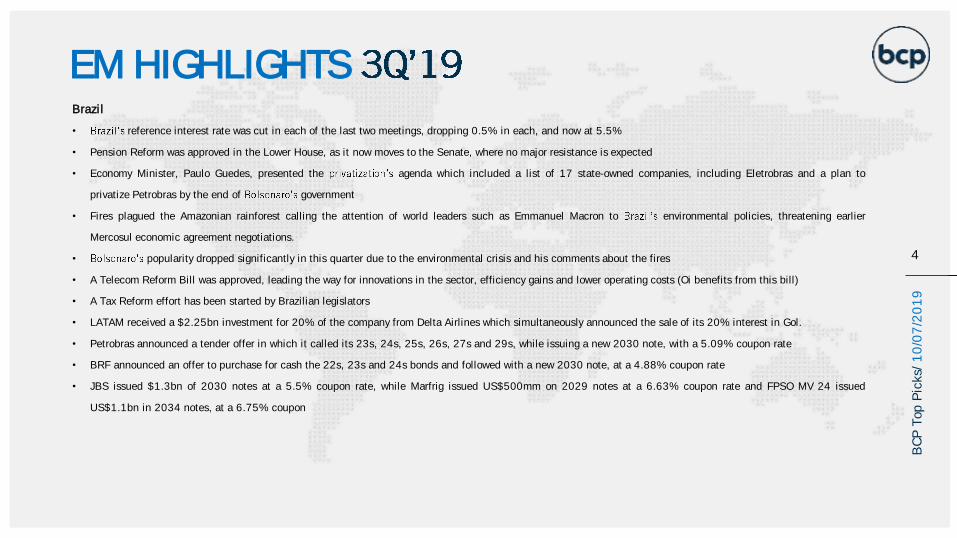
Brazil
• reference interest rate was cut in each of the last two meetings, dropping 0.5% in each, and now at 5.5%
• Pension Reform was approved in the Lower House, as it now moves to the Senate, where no major resistance is expected
• Economy Minister, Paulo Guedes, presented the agenda which included a list of 17 state-owned companies, including Eletrobras and a plan to
privatize Petrobras by the end of government
• Fires plagued the Amazonian rainforest calling the attention of world leaders such as Emmanuel Macron to environmental policies, threatening earlier
Mercosul economic agreement negotiations.
• popularity dropped significantly in this quarter due to the environmental crisis and his comments about the fires
• A Telecom Reform Bill was approved, leading the way for innovations in the sector, efficiency gains and lower operating costs (Oi benefits from this bill)
• A Tax Reform effort has been started by Brazilian legislators
• LATAM received a $2.25bn investment for 20% of the company from Delta Airlines which simultaneously announced the sale of its 20% interest in Gol.
• Petrobras announced a tender offer in which it called its 23s, 24s, 25s, 26s, 27s and 29s, while issuing a new 2030 note, with a 5.09% coupon rate
• BRF announced an offer to purchase for cash the 22s, 23s and 24s bonds and followed with a new 2030 note, at a 4.88% coupon rate
• JBS issued $1.3bn of 2030 notes at a 5.5% coupon rate, while Marfrig issued US$500mm on 2029 notes at a 6.63% coupon rate and FPSO MV 24 issued
US$1.1bn in 2034 notes, at a 6.75% coupon
EM HIGHLIGHTS
4
BC
P T
op P
icks/
10
/07
/20
19

5
BC
P T
op P
icks/
10
/07
/20
19
China
• 13th trade talk session between China and US is scheduled for early Oct.
• 6.2% GDP growth in 2Q was the lowest since 1992.
• In 3Q, renminbi depreciated against USD from 6.90 to 7.15, after PBoC chief implied that the bank had no intention to keep USD/CNY below 7.0.
• PBoC implemented long-waited rates reform to reduce borrowing costs of manufacturing and services industries. The real estate sector was excluded, and mortgage rates in
several cities increased after the reform. Rates reform marked shift in monetary tools from reserve ratios to rates.
• Chinese companies issued US$143bn USD in bonds over first eight months of the year, compared with US$123bn same period last year. Property developers accounted
for 40% of total issuance.
• Facing decline in sales and customer advances and a pending subsidiary reorganization, EVERRE underperformed relative to KAISAG, whose yield curve is now inside
• As part of energy independence plan, state-owned oil companies ramped up exploration in PRC this year. Two gas blocks were found in Tarim and Sichuan Basin, where
ANTOIL had been active.
Mexico
• 2Q19 GDP growth was 0.0%, with the IMF later decreasing the 2019 economic growth rate estimate to 0.9%. In contrast, Govt. 2020 GDP growth
estimate is 2.6%, with both S&P and Fitch estimating lower growth rates.
• The USMCA trade agreement approval by the US is likely to be delayed due to President impeachment investigation. The Mexican Govt. mentioned the trade
ratification before the US election would be the best outcome for the three countries.
• Central Bank decreased the base interest rate by 25 bps to 7.75%. The inflation target remains at 3%
• Carlos Urzua, former Secretary of Finance, resigned due to economic discrepancies with the federal administration. The sub secretary, Arturo Herrera assumed the position
• Govt is analyzing the 2020 oil coverage hedge at $49/bbl. In 2019, the oil hedge was set at $55/bbl with a total cost of US$1.2 bn.
EM HIGHLIGHTS
5
BC
P T
op P
icks/
10
/07
/20
19

6
BC
P T
op P
icks/
10
/07
/20
19
Mexico (continued)
• Pemex released an ambitions business plan highlighting its the production targets and fiscal burden reductions. It also outlined capex and the proceeds to be received
from the Federal Govt. for the Dos Bocas refinery construction. 2020 proposed spending, including capex, is 13% higher y/y.
• In September the Federal Govt. made a US$5 bn capitalization for Pemex, raising direct capitalizations to US$8 bn YTD. Proceeds were used to fund a US$5 bn cash
tender, in conjunction with issuing US$7.5 bn in seven, ten and 30-year bonds as well as exchanging US$7.6 bn bonds
• Midstream companies reached an agreement with CFE on the unfinished gas pipelines, with the Govt. mentioning the expectation to save US$4.5bn with the deal
Nigeria
• The Nigerian economy expanded 1.9% y/y in the second quarter of the year and 2.0% in the first half of the year
• Nigeria approved a 10.1 trillion-naira budget for 2020, targeting 3% growth
• Inflation of 13.4% in August remains above 6-9% central bank target
• Central Bank imposed further pressures on banks in order to boost lending, increasing min required Loan/Deposit ratio to 65% by Dec 2019 from previous 60%. Failure
to meet it shall result in a levy of additional cash reserve requirement of 50% of the shortfall. At Jun19, we estimate only Fidelity and Access to be in compliance with
the minimum.
• Zenith Bank tendered around 80% of its outstanding Eurobonds due 22, leaving only US$100mm outstanding
Russia
• FX reserves reached US$532 billion as at end of September 2019. The USD share fell from 43% to 24%. Russia is increasing its gold, Yuan and EUR holdings.
gold bullion holdings have reached US$109.5 billion as the country continues to shift is growing FX reserves away from the US dollar. The share of gold in the
reserves has reached a new record of 20.7%, up from the previous 19.6%.
EM HIGHLIGHTS
6
BC
P T
op P
icks/
10
/07
/20
19

7
BC
P T
op P
icks/
10
/07
/20
19
Russia (continued)
• In August 2019, Fitch upgraded investment grade rating to from - returning the rating to its 2014 level; the agency cited
policy mix, low external debt and robust fiscal as reasons for the upgrade.
• The number of cashless transaction in Russia soared 30x between 2010 and 2018 with the volume of US$73.6 billion (RUB 48 trillion) more than all other EU peers.
• International low-cost airlines: Ryanair, EasyJet and Wizzair have submitted bids for 33 destinations out of St. Petersburg Airport Pulkovo as of 2020, which would require
that the airport complies with the Open Skies regime.
Turkey
• GDP expanded 1.2% in 2Q19, sustaining the growth seen in previous quarters and easing concerns of a double-dip recession. Y/y, economy contracted 1.5%. With
performance better than expected, Fitch narrowed its estimated GDP contraction for 2019 to 0.3% from previous 1.1% reported last June.
• Inflation continues to decline faster than expected, ending below 10% in Sep19 (9.3% y/y) for the first time since Jul17
• With economic growth and inflation decline beating expectations, Central Bank took on an aggressive easing approach, cutting rates by 750bps in the past two months
since inew head Murat Cetinkaya was appointed, after several calls made by Erdogan for a lower rate environment
• First components of the Russian S-400 missiles were received, with further shipments expected in the coming months
• NPLs for the banking system ended at 4.3% in 2Q19, increasing 30bps q/q, while many banks estimate NPLs to finish the year below initial guidance of 6-7%. On the
other hand, the Central Bank has requested banks to set aside TRY12bn in provisions and reclassify TRY46bn worth of credits as NPLs, mostly in the energy sector.
• Yasar tender resulted in a buyback of US$44mm in face value at an average price of 78.9c
• News have UniCredit might consider taking a direct stake for its 41% indirect control interest in Yapikredi (currently hold through a 5/50 JV with KOC) in order to clear the
way for a potential sale or stake reduction
• Morgan Stanley has been appointed as financial adviser for the sale of 55% stake in Turktelekom. Recall Levent is the SPV that was formed by Garanti, Isbank
and Akbank after the mentioned stake was received from previous owner OTAS as a result of its default on a US$4.75bn loan.
EM HIGHLIGHTS
7
BC
P T
op P
icks/
10
/07
/20
19

8
BC
P T
op P
icks/
10
/07
/20
19
EM HIGHLIGHTS
8
BC
P T
op P
icks/
10
/07
/20
19
Ukraine
• In September 2019, the NPL level in banking sector fell below 50% and for the first time in recent years, reaching 49.3%
• F/X reserves reached US$22 billion
• President signed off on the Steinmeier formula for the Donbass region conflict resolution
• In September 2019, upgrades rating to on the back of economic recovery
• During 3Q19, a number of Ukrainian corporates came to the market with new Eurobond offerings: Naftogas of Ukraine, Metinvest, MHP and Kernel
• The IMF mission left Kyiv at the end of September without coming to a new agreement of an Extended Fund Facility (EFF); the main concern being the fate of PrivatBank
and a range of influence of Mr. Kolomoisky on the new government

9
BC
P T
op P
icks/
10
/07
/20
19
OVERVIEW
EMBI BROAD COMPOSITE INDEX REVIEW
0.2%
1.3%
1.5%
1.6%
2.1%
2.4%
Latin America EMBI Composite Asia Middle East CEEMEA CEMBI IG

10
BC
P T
op P
icks/
10
/07
/20
19
OVERVIEW CEMBI INDEX RETURNS
(17,6%)
(2,5%)(2,4%)(1,9%)(1,8%)
0,6%1,3% 1,4% 1,5% 1,6% 1,6% 1,6% 1,8% 1,8% 1,9% 1,9% 2,3% 2,3% 2,4% 2,4% 2,5% 2,6% 2,7% 2,8% 2,8% 3,2% 3,3%
3,8% 4,0%

11
BC
P T
op P
icks/
10
/07
/20
19
OVERVIEW GLOBAL EQUITY INDEX
(31.6%)
(9.6%)
(5.6%) (4.6%)(3.4%)
(1.4%) (1.0%)
0.0% 0.1% 0.5%
4.1%
ArgentinaMervalIndex
Hang SengIndex
IsharesMSCI
EmergingMkt Index
RTSStandard
Index
JakartaComposite
Index NASDAQ MEXBOL Nikkei 225S&P 500
Index DJIA
BrazilBovespa
Index

12
BC
P T
op P
icks/
10
/07
/20
19
PORTFOLIO REVIEW
Source: Bloomberg as of 10/03/2019
Company Industry Country Currency From Until Days Px at Recomm. Px End CPN Price Appreciation Total Return Excess return
OUTPERFORM Average Return = (5.51%) (5.49%)
CGCSA 21 COMPANIA GENERAL COMBUST Oil&Gas Argentina USD 07/08/19 09/16/19 70 98.0 76.0 9.50% (22.4%) (20.6%) (20.2%)
PDCAR 21 PROVINCIA DE CORDOBA Regional(state/provnc) Argentina USD 07/08/19 09/16/19 70 89.5 57.0 7.13% (36.3%) (34.9%) (34.6%)
GOLLBZ 25 GOL FINANCE SA Airlines Brazil USD 07/08/19 10/03/19 87 99.4 99.3 7.00% (0.1%) 1.6% 1.5%
CARINC 22 CAR INC Commercial Services China USD 07/08/19 10/03/19 87 102.3 96.0 8.88% (6.1%) (4.0%) (4.1%)
FECCN 23 FRONTERA ENERGY CORP Oil&Gas Colombia USD 07/08/19 10/03/19 87 106.9 105.8 9.70% (1.1%) 1.3% 1.2%
ALPHSA 22 ALPHA HOLDING SA Diversified Finan Serv Mexico USD 07/08/19 10/03/19 87 97.3 97.3 10.00% 0.0% 2.4% 2.3%
FIDBAN 22 FIDELITY BANK PLC Banks Nigeria USD 07/08/19 10/03/19 87 110.0 112.8 10.50% 2.5% 5.0% 4.9%
RAILUA 24 UKRAINE RAIL (RAIL CAPL) Transportation Ukraine USD 07/08/19 10/03/19 87 101.4 104.5 8.25% 3.1% 5.1% 5.0%
UNDERPERFORM Average Return = (0.04%) 0.05%
ARCOR 23 ARCOR SAIC Food Argentina USD 07/08/19 10/03/19 87 100.4 87.9 6.00% 12.4% 11.0% 11.1%
ARCO 23 ARCOS DORADOS HOLDINGS I Retail Argentina USD 07/08/19 10/03/19 87 109.0 107.3 6.63% 1.6% 0.0% 0.1%
KLAB 24 KLABIN FINANCE SA Forest Products&Paper Brazil USD 07/08/19 10/03/19 87 104.9 106.6 5.25% (1.7%) (2.9%) (2.8%)
AESGEN 25 AES GENER SA Electric Chile USD 07/08/19 10/03/19 87 104.3 105.4 5.00% (1.0%) (2.2%) (2.1%)
TELVIS 26 GRUPO TELEVISA SAB Media Mexico USD 07/08/19 10/03/19 87 104.2 107.1 4.63% (2.7%) (3.9%) (3.8%)
VEDLN 22 VEDANTA RESOURCES LTD Mining India USD 08/06/19 10/03/19 58 97.7 98.8 6.38% (1.2%) (2.2%) (2.1%)
Total Average Return = (3.17%) (3.12%)
From Until Days Px at Recomm. Px End Total Return
CEMBI 07/08/19 10/03/19 87 454.8 455.2 0.1%
13
BC
P T
op P
icks/
10
/07
/20
19
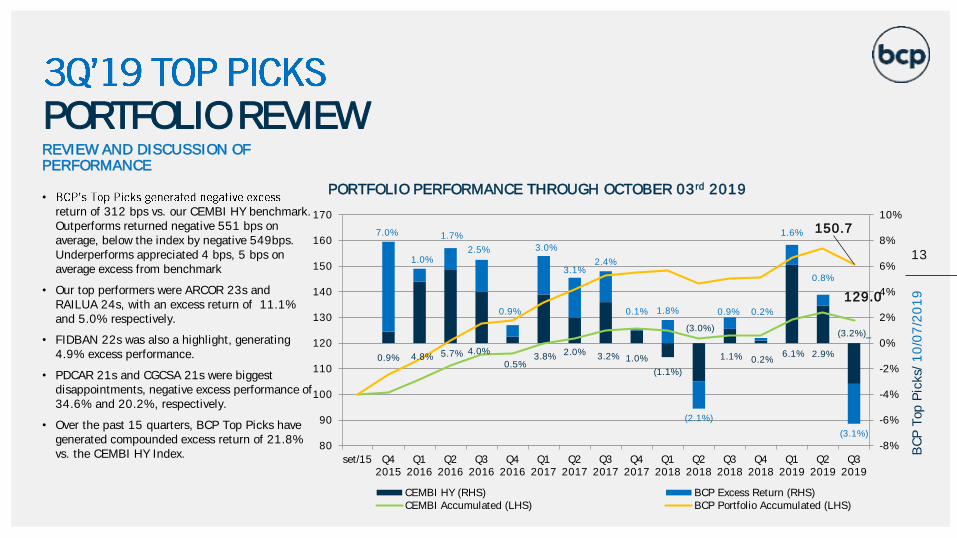
PORTFOLIO REVIEWREVIEW AND DISCUSSION OF PERFORMANCE
•
return of 312 bps vs. our CEMBI HY benchmark. Outperforms returned negative 551 bps on average, below the index by negative 549bps. Underperforms appreciated 4 bps, 5 bps on average excess from benchmark
• Our top performers were ARCOR 23s and RAILUA 24s, with an excess return of 11.1% and 5.0% respectively.
• FIDBAN 22s was also a highlight, generating 4.9% excess performance.
• PDCAR 21s and CGCSA 21s were biggest disappointments, negative excess performance of 34.6% and 20.2%, respectively.
• Over the past 15 quarters, BCP Top Picks have generated compounded excess return of 21.8% vs. the CEMBI HY Index.
PORTFOLIO PERFORMANCE THROUGH OCTOBER 03rd 2019
0.9% 4.8% 5.7% 4.0%
0.5%3.8% 2.0% 3.2% 1.0%
(1.1%)
(3.0%)
1.1% 0.2%6.1% 2.9%
(3.2%)_
7.0%
1.0%
1.7%
2.5%
0.9%
3.0%
3.1%2.4%
0.1% 1.8%
(2.1%)
0.9% 0.2%
1.6%
0.8%
(3.1%)
129.0
150.7
-8%
-6%
-4%
-2%
0%
2%
4%
6%
8%
10%
80
90
100
110
120
130
140
150
160
170
set/15 Q42015
Q12016
Q22016
Q32016
Q42016
Q12017
Q22017
Q32017
Q42017
Q12018
Q22018
Q32018
Q42018
Q12019
Q22019
Q32019
CEMBI HY (RHS) BCP Excess Return (RHS)CEMBI Accumulated (LHS) BCP Portfolio Accumulated (LHS)

14
BC
P T
op P
icks/
10
/07
/20
19
4 TOP PICKSPORTFOLIO SUMMARY
Source: Bloomberg as of 10/07/2019
Company Industry Country Currency Amt Out M/ SP/ F CPN Maturity Mid YieldMid Price
Outperform
AEROAR 27 AEROPUERTOS ARGENT 2000 Engineering&Construction Argentina USD $375 Caa1 *-/ B-/ - 6.88% 02/01/2027 8.23% 92.63
GOLLBZ 25 GOL FINANCE SA Airlines Brazil USD $650 -/ B/ B+ 7.00% 01/31/2025 7.11% 99.50
UNIGEL 26 UNIGEL LUXEMBOURG SA Chemicals Brazil USD $420 -/ B+/ B+ 8.75% 10/01/2026 8.71% 100.20
CARINC 21 CAR INC Commercial Services China USD $300 B1/ BB-/ WD 6.00% 02/11/2021 10.39% 94.63
GTE 25 GRAN TIERRA ENERGY INTL Oil&Gas Colombia USD $300 -/ B+/ B 6.25% 02/15/2025 8.75% 89.50
DOCUFO 24 DOCUFORMAS SA Diversified Finan Serv Mexico USD $300 -/ BB-/ BB- 10.25% 07/24/2024 10.44% 99.25
POGLN 22 PETROPAVLOVSK 2016 Mining Russia USD $500 -/ B-/ B- 8.13% 11/14/2022 8.49% 99.00
VAKBN 22 TURKIYE VAKIFLAR BANKASI Banks Turkey USD $672 Caa3/ -/ B 6.00% 11/01/2022 7.11% 97.00
Underperform
ARCOR 23 ARCOR SAIC Food Argentina USD $500 B3 *-/ -/ B- 6.00% 07/06/2023 9.95% 87.90
KLAB 27 KLABIN FINANCE SA Forest Products&Paper Brazil USD $500 -/ BB+/ BB+ 4.88% 09/19/2027 4.49% 102.53
TELVIS 26 GRUPO TELEVISA SAB Media Mexico USD $300 Baa1/ BBB+/ BBB+ 4.63% 01/30/2026 3.38% 106.98
VEDLN 22 VEDANTA RESOURCES LTD Mining India USD $1,000 B2/ B+/ - 6.38% 07/30/2022 6.83% 98.84

15
BC
P T
op P
icks/
10
/07
/20
19
MARKET OUTPERFORM
AEROAR 6.875% 27s
ARGENTINA
GOLBZ 7.00% 25sUNIGEL 8.75% 26s
GTE 6.25% 25s
BRAZIL
15CHINACARINC 6.00% 21s
BC
P T
op P
icks/
07
/08
/20
19
DOCUFO 10.25% 24s
COLOMBIA
MEXICO
POGLN 8.125% 22s
RUSSIA
VAKIF 6.00% 22s
TURKEY

16
BC
P T
op P
icks/
10
/07
/20
19
ARGENTINA
16
BC
P T
op P
icks/
10
/07
/20
19

17
BC
P T
op P
icks/
10
/07
/20
19
AEROAR 6.875% 27s
Aeorpuertos Argentina is the operator of 33 out of the 34 airport terminals in Argentina. In 2018 it transported 38.4mm passengers and handled more than 429
thousand flights. The company is majority owned by Corporacion America, an Argentine holding controlled by the Eurnekian family, one of the wealthiest in the country.
We view the credit as a one that should be able to survive a sovereign credit event as we think tariffs will remain denominated in USD as they were under the previous
Kirchner administration. Additionally, sinkable feature of bonds provides the company with a smoother debt amortization, which is covered more than enough with
current tariff collection that serve as collateral for bonds (8.7x coverage in FY18).
MARKET OUTPERFORM (AEROAR):
PROS:
• Strong and recognized shareholder
• Operates almost all of Argentine airports, including the two main ones (Ezeiza andAeroparque), with concession maturing in 2028 after full bond amortization
• Notes secured by tariff collection with ample interest coverage (8.7x in 2018). Incase of an event of default, per bond indenture tariff collection get trapped in thetrustee assigned accounts
• Sinkable bond, which gives the company a smoother debt amortization load
• Long USD: tariffs are set in USD (can be paid in USD or ARS at the respective f/xrate), while most of its costs are in ARS
• Transported passengers and airplane movements have remained sound despite aweaker local environment
• Very low leverage (LHA 2Q19 1.1x)
Description Amt (US$ MM) Ratings (M/SP/F) Mid Price Mid YTM
AEROAR 6.875% 2/1/2027 $375 Caa1/B-/B 92.63 8.23%
CONS:
• Covenants allow for the issuance of additional pari passu debt as long as nextdebt service coverage is 1x
• In the past there has been friction between the company and the nationalgovernment regarding the operations of the airports and the possibility ofreauctioning the concessions, although lately frictions eased and thegovernment decided not to make use of the clause that allowed for therecession of the contract in 2018
• Client concentration: Aerolineas Argentina and Latam together account fornearly 25% of revenue
• High capex program has been driving FCF to negative territory, although wethink capex should considerably ease as works in the new terminal of Ezeizaare mostly completed and expected to be ramped up in coming weeks. FCFshould return to positive territory in 2020.

18
BC
P T
op P
icks/
10
/07
/20
19
AEROAR 6.875% 27s
MARKET OUTPERFORM (AEROAR):
STRONG LIQUIDITY
• Cash and equivalents position at Mar 31, 2019 ended at US$109mm, compared to a ST debt of US$61mm
• ST corresponds mainly to the capital amortization of the secured bonds. Recall 27s are sinkable and with 32 equal quarterly capital amortizations that started in May19
AMORTIZATION SCHEDULE 06.30.2019
US$mm Jun19
Cash and cash equivalents 109
Short term debt 61
Bonds 57
Leasing 4
TOTAL DEBT PER CURRENCY (JUN19) TOTAL DEBT BY INSTRUMENT (JUN19)
Bonds99%
Leasing1%
USD100%
0
20
40
60
80
100
C&CE 2019 2020 2021 2022 2023 2024 2025 2026 2027
US$MM

19
BC
P T
op P
icks/
10
/07
/20
19
ANALYSIS OF 2Q19 RESULTS
• Quarterly revenue in real terms increased 3% y/y to AR$7,032mm, with a 12% increase in passengers transported and 1% increase in airplane movements
• For the six month period, revenue increased 8% y/y, with a 2% increase in passengers transported and 10% increase in airplane movements
• EBITDA, which we could only calculate on an accumulated basis due to lack of D&A inflation adjusted figure for previous quarter, increased 12% y/y to AR$6,700mm
• EBITDA margin for 1H19 expanded 200bps y/y to 47.4%
• Simplified free cash flow, only reported on an accumulated basis, was negative AR$2,682mm due to high capex and negative working capital, mostly on higher receivables
• Net debt as a result increased 5% since Dec18 to AR$14,357mm, including IFRS 16 debt
• Recall the 27s started paying quarterly principal amortizations in May19, having to date repaid two installments of US$25mm
• Annualized net leverage for the first half of the year inched down to 1.1x from 1.2x one year ago
AEROAR 6.875% 27s
MARKET OUTPERFORM (AEROAR):
AEOROAR (AR$MM)
2Q19 2Q18 y/y 1H19 1H18 y/y
Revenue 7,032 6,824 3% 14,825 13,735 8%
EBITDA n/a n/a 6,700 5,961 12%
EBITDA margin n/a n/a 47.4% 45.4%
AEOROAR (AR$MM) Jun19 Dec18 q/q
Total Debt 16,965 18,722 (9%)
Cash and Equivalents 2,608 5,058 (48%)
Net Debt 14,357 13,664 5%
Leverage (Total Debt/LHA EBITDA) 1.3 1.6
Net leverage (Net Debt/LHA EBITDA) 1.1 1.2
AEOROAR (AR$MM) 1H19 1H18
EBITDA 3,507 2,904
Working capital (2,030) (463)
Capex (6,296) (3,751)
Interest paid (627) (470)
Taxes paid (430) (602)
FCF (2,682) (675)

20
BC
P T
op P
icks/
10
/07
/20
19
AEROAR 6.875% 27s
MARKET OUTPERFORM (AEROAR):
Airport 2013 2014 2015 2016 2017 2018
Aeroparque 9,553 10,256 11,053 11,662 13,921 13,474
Ezeiza 8,533 8,601 9,128 9,831 9,878 10,299
Cordoba 1,572 1,673 1,948 2,213 2,846 3,398
Mendoza 1,269 1,308 1,352 1,086 1,762 2,023
Tucuman 501 523 601 670 560 957
Bariloche 835 919 1,039 1,187 1,297 1,576
C. Rivadavia 474 518 577 574 624 680
Rio Gallegos 249 259 303 269 262 241
Iguazu 737 797 863 894 999 1,112
Salta 710 750 856 972 1,129 1,122
Others 1,373 1,603 1,858 2,109 2,658 3,468
Total 25,806 27,207 29,578 31,467 35,936 38,350
Airport 2013 2014 2015 2016 2017 2018
Aeroparque 114,282 116,219 120,492 121,882 134,532 130,242
Ezeiza 65,774 66,329 66,834 68,839 66,916 75,234
Cordoba 54,482 43,943 40,327 38,188 39,000 40,910
Mendoza 19,642 20,284 21,783 23,526 28,659 33,481
Tucuman 16,892 16,183 15,700 12,644 19,274 21,354
Bariloche 12,110 11,267 11,780 11,386 13,367 11,449
C. Rivadavia 6,099 553 6,838 7,479 5,826 9,778
Rio Gallegos 8,950 9,433 10,084 10,954 12,338 14,098
Iguazu 11,283 10,366 9,155 8,251 9,171 10,232
Salta 8,767 8,230 8,361 8,721 9,065 9,807
Others 63,092 69,096 65,136 63,108 66,033 72,881
Total 381,373 371,903 376,490 374,978 404,181 429,466
AIRPLANE MOVEMENTs

21
BC
P T
op P
icks/
10
/07
/20
19
21
BC
P T
op P
icks/
10
/07
/20
19
BRAZIL
22
BC
P T
op P
icks/
10
/07
/20
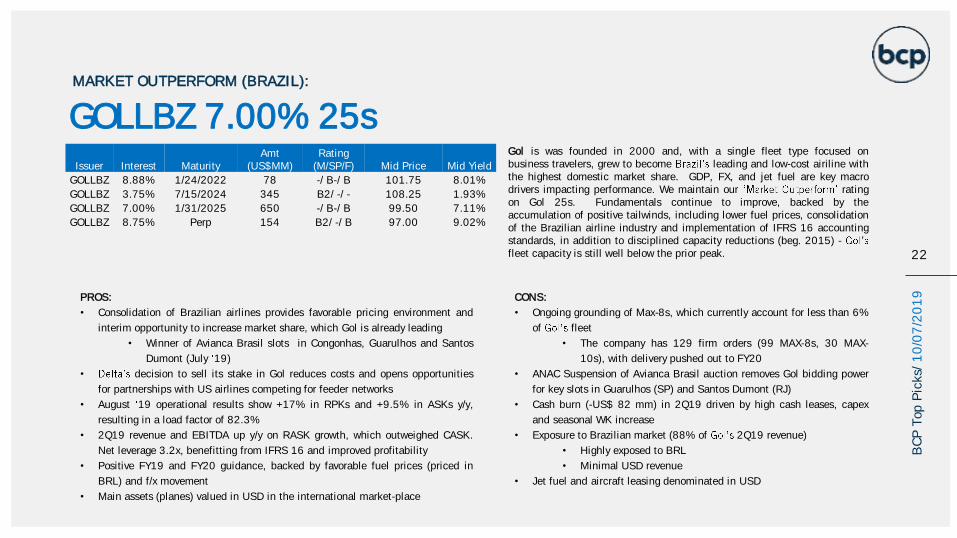
19PROS:
• Consolidation of Brazilian airlines provides favorable pricing environment and
interim opportunity to increase market share, which Gol is already leading
• Winner of Avianca Brasil slots in Congonhas, Guarulhos and Santos
Dumont (July 19)
• decision to sell its stake in Gol reduces costs and opens opportunities
for partnerships with US airlines competing for feeder networks
• August 19 operational results show +17% in RPKs and +9.5% in ASKs y/y,
resulting in a load factor of 82.3%
• 2Q19 revenue and EBITDA up y/y on RASK growth, which outweighed CASK.
Net leverage 3.2x, benefitting from IFRS 16 and improved profitability
• Positive FY19 and FY20 guidance, backed by favorable fuel prices (priced in
BRL) and f/x movement
• Main assets (planes) valued in USD in the international market-place
CONS:
• Ongoing grounding of Max-8s, which currently account for less than 6%
of fleet
• The company has 129 firm orders (99 MAX-8s, 30 MAX-
10s), with delivery pushed out to FY20
• ANAC Suspension of Avianca Brasil auction removes Gol bidding power
for key slots in Guarulhos (SP) and Santos Dumont (RJ)
• Cash burn (-US$ 82 mm) in 2Q19 driven by high cash leases, capex
and seasonal WK increase
• Exposure to Brazilian market (88% of 2Q19 revenue)
• Highly exposed to BRL
• Minimal USD revenue
• Jet fuel and aircraft leasing denominated in USD
Gol is was founded in 2000 and, with a single fleet type focused onbusiness travelers, grew to become leading and low-cost airiline withthe highest domestic market share. GDP, FX, and jet fuel are key macrodrivers impacting performance. We maintain our ratingon Gol 25s. Fundamentals continue to improve, backed by theaccumulation of positive tailwinds, including lower fuel prices, consolidationof the Brazilian airline industry and implementation of IFRS 16 accountingstandards, in addition to disciplined capacity reductions (beg. 2015) -fleet capacity is still well below the prior peak.
MARKET OUTPERFORM (BRAZIL):
GOLLBZ 7.00% 25sIssuer Interest Maturity
Amt (US$MM)
Rating (M/SP/F) Mid Price Mid Yield
GOLLBZ 8.88% 1/24/2022 78 -/ B-/ B 101.75 8.01%
GOLLBZ 3.75% 7/15/2024 345 B2/ -/ - 108.25 1.93%
GOLLBZ 7.00% 1/31/2025 650 -/ B-/ B 99.50 7.11%
GOLLBZ 8.75% Perp 154 B2/ -/ B 97.00 9.02%

23
BC
P T
op P
icks/
10
/07
/20
19
GOLLBZ 7.00% 25sRecent Highlights 2Q19 Positive & Persistent Tailwinds:
• On January 1st 2019, Gol adopted new reporting standards under IFRS 16, which had a net neutral effect on EBITDAR and net positive effect on leverage
• RPKs increased 11.7% y/y to 9.3 bn on an 8.9% y/y growth in transported passengers, and ASKs grew 6.5% y/y to 11.4 bn
• Load factor expanded to 82% in 2Q19, compared to 78.3% in 2Q18
• Revenue increased 23% y/y but decreased 3% q/q to US$801 mm, with RASK increasing 25.3% y/y as result of increased unit cost and higher demand
• EBITDA of US$187 mm was 43% higher y/y but 23% lower sequentially, with y/y results benefitting from the increased in RASK and CASK (ex-depreciation)
• EBITDA margin of 23% expanded 329 bps y/y but contracted 502 bps sequentially
• Free cash flow was negative US$82 mm, driven primarily by the addition of cash leases, in addition to capex and working capital draw down
• Cash leases of US$103 mm were substantially higher
• Capex was US$66 mm
• Working capital was US$61 mm
• Cash and equivalents were 10% lower q/q at US$622 mm
• Net Debt was flat y/y and q/q at US$2,920 mm
• Pro-forma net leverage (incl. operating leases) was 3.2x
MARKET OUTPERFORM (BRAZIL):
Gol (US$MM) IFRS 2Q19 IFRS 1Q19 IFRS 2Q18 y/y q/qRevenue 801 852 653 23% (6%)Net Income (31) 9 (520) (94%) (430%)
(-) Income Taxes 6 19 15 (63%) (70%)(-) Net Financial Result 107 106 553 (81%) 0%
EBIT 81 134 48 70% (39%)(-) Depreciation and Amortization 106 108 83 27% (2%)
EBITDA 187 242 131 43% (23%)
EBITDA margin 23% 28% 20% 329bps (502bps)
Capex (66) (27) (117) (43%) 145%Interest paid (10) (50) (13) (24%) (80%)Taxes paid (29) (6) (17) 68% 401%Cash lease (103) (94) (21) 392% 10%FCF before WK (21) 65 (37) (43%) -Working capital (61) (63) 206 (130%) (2%)FCF (82) 2 169 - -
Gol (US$MM) IFRS 2Q19 IFRS 1Q19 IFRS 2Q18 y/y q/qBalance Sheet Liabilities:Loans and Financings 426 424 468 (9%) 1%Debt Issuance * 1,399 1,382 1,118 25% 1%Aircraft Rent 157 154 136 15% 2%Aircraft Financing 1,559 1,621 1,726 (10%) (4%)
Gross Debt 3,542 3,581 3,448 3% (1%)Corporate Debt - BRL 189 185 269 (30%) 2%Corporate Debt - USD * 3,353 3,396 3,179 5% (1%)LTM Aircraft Rents x 7 years n/a n/a n/a - -
Cash 622 694 544 14% (10%)Cash and Equivalents 260 483 160 63% (46%)ST Investments 208 91 299 (30%) 129%ST Restricted Cash 106 91 0 - 17%LT Restricted Cash 48 30 85 (44%) 59%
Net Debt 2,920 2,887 2,904 1% 1%
Gross leverage (Total Debt/LQA EBITDA) 4.7x 3.7x 6.6x (1.8x) 1.0xNet leverage (Net Debt/LQA EBITDA) 3.9x 3.0x 5.5x (1.6x) 0.9x
LTM Gross leverage (Total Debt/LTM EBITDA) 4.3x 4.7x 6.1x (1.8x) (0.4x)LTM Net leverage (Net Debt/LTM EBITDA) 3.6x 3.8x 5.1x (1.6x) (0.2x)

24
BC
P T
op P
icks/
10
/07
/20
19
GOLLBZ 7.00% 25sMARKET OUTPERFORM (BRAZIL):
IFRS 16 IFRS 16Gol (US$MM) 2Q19 1Q19 4Q18 3Q18 2Q18Net income (loss) (31) 9 152 (78) (353)(-) Income Taxes 6 19 20 26 15 (-) Net Financial Result 107 106 5 98 350 EBIT 81 134 177 46 12 (-) Depreciation and Amortization 106 108 47 44 46 EBITDA (ex-rents) 187 242 223 90 58 (-) Rents n/a n/a 82 75 75 EBITDA 187 242 305 165 132 LTM EBITDA 899 844 877 805 858
Gross Debt 3,853 3,905 3,839 3,796 3,827 Short-term borrowings 306 282 316 520 398 Long-term debt 1,677 1,678 1,513 1,479 1,685 LTM Aircraft Rents x 7 years 1,870 1,945 2,010 1,797 1,744
Cash and Cash Equivalents 622 694 549 483 544 Cash and cash equivalents 260 483 213 172 160 Financial assets 208 91 123 232 299 Restricted cash ST 106 91 34 - -Restricted cash LT 48 30 178 78 85
Net Debt 3,232 3,211 3,290 3,313 3,283
Gross Leverage (Gross Debt / LQA EBITDA) 5.1x 4.0x 3.1x 5.8x 7.2xNet Leverage (Net Debt / LQA EBITDA) 4.3x 3.3x 2.7x 5.0x 6.2x
LTM Gross Leverage (Gross Debt / LTM EBITDA) 4.3x 4.6x 4.4x 4.7x 4.5xLTM Net Leverage (Net Debt / LTM EBITDA) 3.6x 3.8x 3.8x 4.1x 3.8x
Gross Debt (incl. op leases) 3,542 3,581 3,437 3,437 3,478 Short-term borrowings 306 282 316 520 398 Long-term debt 1,677 1,678 1,513 1,479 1,685 Aircraft Financing * 1,559 1,621 1,608 1,438 1,395
Cash and Cash Equivalents 622 694 549 483 544 Net Debt (incl op leases) 2,920 2,887 2,888 2,954 2,934
Pro Forma Gross Leverage (incl op leases) / Trailing LTM EBITDA 3.9x 4.2x 3.9x 4.3x 4.1xPro Forma Net Leverage (incl op leases) / Trailing LTM EBITDA 3.2x 3.4x 3.3x 3.7x 3.4x
* Prior to 1Q19 = LTM Aircraft Rents x 7 years (80%)

25
BC
P T
op P
icks/
10
/07
/20
19
GOLLBZ 7.00% 25sMARKET OUTPERFORM (BRAZIL):
2019 & 2020 Revised Guidance:
• Fundamentally, leverage trends remain favorable. Managementguidance points to almost US$1.0bn in 2019 EBITDA generation(compared to BBG consensus of US$906 mm) vs. current net debt ofUS$2.9bn (2Q19).
• Furthermore, using capex guidance and estimated interest and leasepayments, we see FCF potential of US$280 mm and US$460 mm (preWK) for 2019 and 2020, respectively.
• We understand the decrease in EPS in the revised guidance is non-cashand entirely attributable to non-cash f/x losses.
• airline industry has transformed into a three player market, dueto consolidation, pricing and profit generation - much like the UnitedStates is experiencing with its current industry structure, referred to asthe Age of
• Meanwhile, US airlines continue to compete for feeder networks. InSeptember 19, Delta announced the sale of its stake in Gol whileacquiring 20% of LATAM a surprise considering American Airlines(AA) had been vying for the JV with LATAM. We think the LT impactshould be a positive for Gol, potentially reducing costs and freeing Golto negotiate strategic partnerships with other US airlines who have amuch larger footprint in Brazil. Delta is currently operating 3 flights/dayto Brazil, compared to United with 6, and AA with 20.
Pro-Forma Cash Flow (US$MM) 2019 2019 2020 2020
(Consolidated IFRS) PreviousGuidance at 2Q19 Previous
Guidance at 2Q19
Revenue 3,315 3,443 3,698 3,953
EBITDA 928 964 1,072 1,146
EBITDA margin 28% 28% 29% 29%
(-) Capex (179) (179) (166) (166)
(-) Interest Paid * (132) (132) (132) (132)
(-) Cash Lease * (336) (336) (336) (336)
(-) Cash Taxes Paid ** (36) (38) (49) (52)
Pro-forma FCF (Before WK and taxes) 245 279 390 460
*Average 2017-2018. Cash lease includes Aircraft Rent (IS) and Lease Payments (CF) to reflect impact of IFRS 16** Based on revenue, pre-tax margin and effective income tax rate guidance. Assumes 50% cash tax payment based on historical tax expense and income tax paid

26
BC
P T
op P
icks/
10
/07
/20
19
GOLLBZ 7.00% 25sMARKET OUTPERFORM (BRAZIL):
Update on the impact of Boeing 737 MAX-8 Grounding:
• Guidance from Boeing as of 2Q19 anticipated regulator review of the MAX aircraft would conclude by year-end 2019.
• Gol has a firm order for a total of 129 737 MAXs (99 MAX-8s, 30 MAX-10s), and was slated to begin receiving MAXs per its pre-sale order with Boeing beginning in July
-2 MAXs per month.
• It currently has 7 MAX-8 aircraft in its fleet (<6% of 127 aircraft fleet), which have been grounded since March 11th 2019
• An additional 10 were slated for delivery in 2H19
• Gol planned to have 7 MAX-8s operational in 4Q19 should regulatory review be completed per Boeing guidance
• The company cited a 1-2 month turnaround to getting MAXs operational
• The MAX fleet would ~15%
• In the interim, should regulatory review extend into FY20, the company has rented seven (7) subleased aircraft to cover capacity needs during its high season
• In 2Q19, Gol leased 5 Boeing 737-800 NG aircraft, and delayed the return of three 737 NG aircraft
• The company stated it still has 11 NGs in its fleet that it will keep until the resolution of the MAX situation

27
BC
P T
op P
icks/
10
/07
/20
19
UNIGEL 8.75% 26sMARKET OUTPERFORM (BRAZIL):
PROS:
• Largest Acrylics and Styrenics producer in LatAm. Unigel is the sole producer of
Acrylonitrile and MMA, as well as the second largest in styrene and polystyrene
• Vertically integrated operations allow flexibility in final product mix, feedstock and own
feedstock produced usage
•
acrylics operation accounting for 13% of total sales
• Styrenics (52% of sales) are styrene, polystyrene and latex
• Favorable domestic environment as Brazil import tariffs range between 10% and 14%
for main petrochemical products
• Natural hedge as revenues are either in USD or USD linked
• Successful non-core divestitures in 2017 cut leverage by nearly half
• Resilient earnings despite recent spread contraction, recurrent positive FCF
• 84% of total debt was secured by the previous 2024 bond and the two
remaining export pre-payments due 2023
• The new 2026 unsecured bond proceeds will be used to repay both
CONS:
• Low control on product pricing given commodity nature
• Slow economic recovery in domestic market, as well as inherent risks
regarding Govt policies on import/export tariffs
• Operating margins are dependent on raw material and energy prices, as
propylene, benzene and ethylene account for 50% of total cogs
• Key feedstock suppliers such as Braskem, Petbra and Pemex have had or
are having supply constraints
• Impacted by petrochem pricing volatility due to the pass-through lag
• Increased product supply as large petrochem projects are coming online,
primarily styrene and MMA
• We estimate that 89% of total pro-forma debt will be USD denominated
• As of 2Q19, labor unions accounted for 19% of Brazilian and 76% of
Mexican employees
Unigel is the largest acrylics and styrenics producer in LatAm. Its verticallyintegrated operations allow flexibility in product mix as products arealso feedstock for its other operations. Despite a challenging environment inBrazil and recent petrochemical spread contraction, Unigel margins haveimproved along with positive FCF generation. The previous 24s were issued torefinance expensive supplier A/P. As of 2Q19, secured debt was 84% due tothe 24s and two remaining export pre-payment agreements from the 2017deleveraging plan. The new unsecured 26s proceeds were used to fund the24s tender and the pre-payment agreements.
Description Amt (US$ MM) Ratings M/SP/F Mid Price Mid YTM
UNIGEL 8.75% 10/01/2026 $420 - / B+ / B+ 100.20 8.71%

28
BC
P T
op P
icks/
10
/07
/20
19
MARKET OUTPERFORM (BRAZIL):
UNIGEL 8.75% 26s(US$ MM) UNIGEL BRASKEM CYDSA ALPEK MEXICHEM
1H19 1H19 1H19 1H19 1H19
Total Revenue 439 6,845 277 3,285 3,605
Adj. EBITDA 69 703 84 337 690
Interest paid (26) (320) (18) (83) (169)
Capex (14) (301) (48) (75) (121)
Working capital (15) 443 (1) 81 (281)
Taxes paid (2) (54) (24) (90) (106)
FCF 13 470 (7) 171 13
Total Debt 473 9,770 479 2,371 3,867
Cash 76 1,680 89 287 591
Net Debt 397 8,090 390 2,084 3,276
LQA Gross Leverage 3.4x 7.0x 2.8x 3.5x 2.8x
LQA Net Leverage 2.9x 5.8x 2.3x 3.1x 2.4x
EBITDA margin 16% 10% 30% 10% 19%
Rating -/B+/B+ Baa3/BBB-/BBB -/BB/BB+ Baa3/BBB-/BBB- Baa3/BBB-/BBB
Maturity 2026 2028 2027 2023 2027
Mid YTM 8.71% 4.43% 5.80% 3.11% 3.78%
Spread to Sovereign (bps) 572 77 266 79 64
29
BC
P T
op P
icks/
10
/07
/20
19
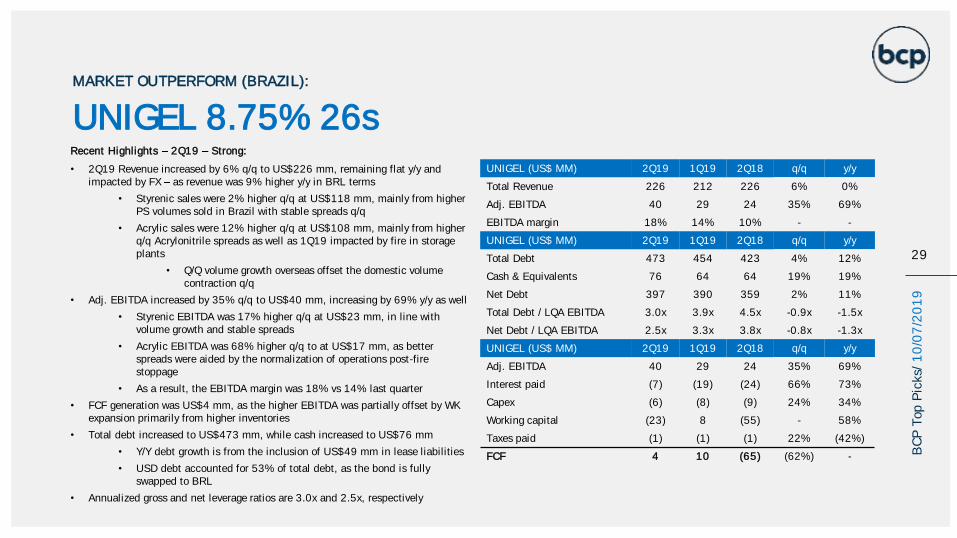
Recent Highlights 2Q19 Strong:
• 2Q19 Revenue increased by 6% q/q to US$226 mm, remaining flat y/y and impacted by FX as revenue was 9% higher y/y in BRL terms
• Styrenic sales were 2% higher q/q at US$118 mm, mainly from higher PS volumes sold in Brazil with stable spreads q/q
• Acrylic sales were 12% higher q/q at US$108 mm, mainly from higher q/q Acrylonitrile spreads as well as 1Q19 impacted by fire in storage plants
• Q/Q volume growth overseas offset the domestic volume contraction q/q
• Adj. EBITDA increased by 35% q/q to US$40 mm, increasing by 69% y/y as well
• Styrenic EBITDA was 17% higher q/q at US$23 mm, in line with volume growth and stable spreads
• Acrylic EBITDA was 68% higher q/q to at US$17 mm, as better spreads were aided by the normalization of operations post-fire stoppage
• As a result, the EBITDA margin was 18% vs 14% last quarter
• FCF generation was US$4 mm, as the higher EBITDA was partially offset by WK expansion primarily from higher inventories
• Total debt increased to US$473 mm, while cash increased to US$76 mm
• Y/Y debt growth is from the inclusion of US$49 mm in lease liabilities
• USD debt accounted for 53% of total debt, as the bond is fully swapped to BRL
• Annualized gross and net leverage ratios are 3.0x and 2.5x, respectively
MARKET OUTPERFORM (BRAZIL):
UNIGEL (US$ MM) 2Q19 1Q19 2Q18 q/q y/y
Total Revenue 226 212 226 6% 0%
Adj. EBITDA 40 29 24 35% 69%
EBITDA margin 18% 14% 10% - -
UNIGEL (US$ MM) 2Q19 1Q19 2Q18 q/q y/y
Total Debt 473 454 423 4% 12%
Cash & Equivalents 76 64 64 19% 19%
Net Debt 397 390 359 2% 11%
Total Debt / LQA EBITDA 3.0x 3.9x 4.5x -0.9x -1.5x
Net Debt / LQA EBITDA 2.5x 3.3x 3.8x -0.8x -1.3x
UNIGEL (US$ MM) 2Q19 1Q19 2Q18 q/q y/y
Adj. EBITDA 40 29 24 35% 69%
Interest paid (7) (19) (24) 66% 73%
Capex (6) (8) (9) 24% 34%
Working capital (23) 8 (55) - 58%
Taxes paid (1) (1) (1) 22% (42%)
FCF 4 10 (65) (62%) -
UNIGEL 8.75% 26s

30
BC
P T
op P
icks/
10
/07
/20
19
30
BC
P T
op P
icks/
10
/07
/20
19
CHINA

31
BC
P T
op P
icks/
10
/07
/20
19
CARINC 6% 21
MARKET OUTPERFORM (CHINA):
Car Inc (699 HK) is the largest car rental company in China with 17% market share*. The fleet is approximately 147k vehicles,expected to expand to 200k this year with ~US$400mm annual Capex. Founded by Lu Zhengyao in 2007, the company is now owned by thefounder (30%), Legend Holdings (27%) and Warbug Pincus (10%). Car parent company UCAR is also involved in the car-sharing business,which now requires no additional investment according to management. In 2Q19, 83% of rentals were self-serve with the help of Car mobileapp and GPS devices, reducing costs of human resources and rental offices. In April, the company issued US$372mm 22 senior note,US$172mm of which was exchanged from the 20s through a par-plus-cash offer.
Pros
• Market-leader position and strong brand recognition.
• High EBITDA margin. High percentage of self-service transactions.
• Small WK investment other than fleet expansion.
• Capex in Borgward cars already considered in annual Capex plan.
• Continuous high y/y growth of revenue from car rental business.
• Fleet is unsecured. Simple capital structure.
• Consistent growth in car rental business expected to become more evidentthis year as impact of car sharing business decreases.
• Traffic ticket reform making rental cars more attractive for non-local users.
Cons
• Large Capex needed to expand fleet and gain market share.
• Uncertainties lie in used vehicle market and realizable valueof disposed vehicles in a soft car market.
• Cars are not favorable collateral for local banks. In 2018, only4% of fleet were used as pledge of borrowings.
• other cash-burning businesses may restrainresources available for Car Inc.
• USD bonds structurally subordinated to onshore borrowings ofUS$622 (mostly CNY unsecured) and US$256bn CNY bonds.
* Source: ASKCI, 2018.
Ranking Amt Out (US$ mm) Ratings (M/SP/F) Mid Price Mid YTM (%)CARINC 6.125% 04/02/2020 Sr Unsecured 328 B1/BB-/WD 99.11 8.89%CARINC 6.00% 11/02/2021 Sr Unsecured 300 B1/BB-/WD 94.63 10.39%CARINC 8.875% 05/10/2022 Sr Unsecured 372 B1/BB-/- 96.00 10.68%

32
BC
P T
op P
icks/
10
/07
/20
19
CARINC 6% 21
MARKET OUTPERFORM (CHINA):
2Q19 Results
• Revenue increased 20% y/y to US$277mm.
• Total revenue increased US$45mm y/y, including US$15mm from increase ofrental revenue and US$30mm from used car sales.
• Rental revenue increased 8% y/y to US$208mm. Used car sales increased 77%y/y to US$69mm.
• Reported adj EBITDA increased 11% y/y to US$126mm, and US$100 mm wasinvested in fleet.
• LTM EBITDA margin improved y/y from 43% to 50%, boosted by higherpercentage of self-service.
• WK investment decreased 88% y/y to US$56mm with US$111mm increase inA/P related to purchase of Borgward cars, which was paid in August.
• Management guides to US$363 to US$436mm net Capex (net of proceeds fromused vehicle sales) in 2019 to purchase 50k vehicles. Quarterly Capex this yearwas more evenly distributed, while 92% Capex in last year happened in 2Q18.
• In last 18 months, y/y growth of rental revenue is much lower than fleetexpansion, with lower RevPAC (Average Daily Rental Revenue Per Rented Car).Low market concentration seems to force car rental companies into pricecompetition.
Car Inc. (US$ mm) 2Q19 1Q19 2Q18 yoy qoq
Revenue 277 274 232 20% 1%
- rental revenue 208 216 193 8% (3%)
- sales of used rental vehicles 69 58 39 77% 18%
Costs (161) (142) (124) 30% 13%
Reported adj EBITDA 126 142 113 11% (11%)
EBITDA margin 45% 52% 49% (345 bps) (636 bps)
LTM EBITDA margin 50% 51% 43% 698 bps (100 bps)
Gross margin 42% 48% 47% (468 bps) (619 bps)
Car Inc. (US$ mm) 2Q19 1Q19 2Q18 yoy qoq
WK investment (56) (112) (451) (88%) (50%)
- vehicle expansion (100) (102) (376) (73%) (2%)
- inv (23) (2) (1) 1570% 977%
- A/R (44) (5) (79) (44%) 880%
- A/P 111 (3) 5 1932% (3390%)
2321 21
1720 19
7%12%
10%4%
9% 9%
33%43%
31% 33%29%
23%
0%
10%
20%
30%
40%
50%
0
5
10
15
20
25
1Q18 2Q18 3Q18 4Q18 1Q19 2Q19
RevPAC (US$) Rental revenue y/y Fleet size y/y

33
BC
P T
op P
icks/
10
/07
/20
19
MARKET OUTPERFORM (CHINA):
1Q19 Financials
• Net operating cash flow improved y/y from negative to US$59mm. Net interest paymentdoubled y/y to US$22mm.
• In February 2019. the company made US$10mm investment in an associate Botpt Inc.
o Botpy Inc is a car insurance company registered in Cayman. No detail foundabout Botpy.
o The company now owns 40% of Botpy.
• In July 2019, UCAR Inc, the parent company of Car Inc, completed the acquisition of67% equity interest in Beijing Borgward. As part of the deal:
o Car Inc would purchase 20,000 vehicles from Borgward, 13,287 have beenfunded with US$269mm (included in Car Capex plan). After three years,Car Inc can ask Borgward to buy vehicles back.
o Car Inc would offer test driving of Borgward vehicles to customers untilDecember 2019. The company receives US$6.4m per quarter from Borgward.
• Gross debt decreased 4% q/q to US$1,877mm.
• Total borrowings decreased 28% q/q to US$622mm. Lease obligations were classified asborrowings under IFRS 16.
• USD bond outstanding increased 25% q/q with newly issued CARINC 22.
• Total cash decreased 14% q/q to US$542mm. Net debt slightly increased q/q toUS$1,335mm.
• LTM gross and net leverage both decreased q/q to 3.6x and 2.6x.
Car Inc. (US$ mm) 2Q19 1Q19 2Q18 yoy qoq
Net CFO 59 19 (371) - 218%
Capex - PPE (5) (5) (3) 89% (1%)
PPE disposal (0) 0 0 - (183%)
Capex - intangibles (0) (1) (0) (41%) (68%)
Net interest paid (22) (29) (10) 122% (24%)
Acquisition of sub (10) 0 0 - -
Increase/(Decrease) in deposits
(9) 2 0 - (470%)
FCF 13 (14) (384) (103%) (195%)
Car Inc. (US$ mm) 2Q19 1Q19 2Q18 yoy qoq
Gross debt 1,877 1,956 2,008 (7%) (4%)
- STD 722 1,210 529 37% (40%)
- LTD 1,155 746 1,479 (22%) 55%
Total cash 542 629 760 (29%) (14%)
- cash & equivalents 458 514 688 (33%) (11%)
- restricted cash 83 37 - - 124%
- other ST financial assets - 78 73 - -
Net debt 1,335 1,328 1,248 7% 1%
LTM gross leverage 3.6x 3.9x 4.3x (0.6x) (0.2x)
LTM net leverage 2.6x 2.6x 2.6x (0.1x) (0.0x)
CARINC 6% 21

34
BC
P T
op P
icks/
10
/07
/20
19
MARKET OUTPERFORM (CHINA):
2Q19 Debt Profile
• In 2Q19, the company had US$1,877mm gross debt, including:
o US$622mm borrowings, including approximately US$200mm offshore
club loan.
o US$999mm USD bonds, including US$372mm CARINC 22.
o US$ 256mm CNY bonds.
• The company improved debt term structure by refinancing short term borrowings
with longer term USD bond.
• US$722mm* STD included US$396mm borrowings (denomination unknown)
and US$328mm CARINC 20. On 2Q19 earnings call, the management implied
repaying CARINC 20 with cash.
• Car access to ST financing is key to rolling over bank loans and repaying the
remaining CARINC 20.
Debt Profile (US$ mm) 1Y 2Y 3Y 5Y
Borrowings 396 223 - 3
CNY senior note - 108 - -
Corp bonds - 106 43 -
CARINC 20 328 - - -
CARINC 21 - 300 - -
CARINC 22 - - 372 -
CARINC 6% 21
1.229
549
44 100
724 736
415
3 0
200
400
600
800
1.000
1.200
1.400
1Y 2Y 3Y 5Y
Gross Debt Term Structure (US$ mm)
1Q19 2Q19
Notes:* Difference from FX changes.

35
BC
P T
op P
icks/
10
/07
/20
19
MARKET OUTPERFORM (CHINA):
Recent Developments
• On Sept 10, Ministry of Public Security of PRC simplified the process for drivers to settle their traffic violation tickets through a cellphone app, making it more
convenient for people to use rented vehicles. For example, before the reform, a Beijing driver who rents a car in Shanghai had to report to Shanghai police if he/she
received a ticket in Shanghai. In many cases the driver only finds out when he/she has returned the rented vehicle and left Shanghai, and many are discouraged to
rent cars. In 2017, 69% of rented cars in China were used for tourism and vacation.
• Lu Zhengyao, founder & shareholder of Car Inc, has two other ventures: UCAR and Luckin Coffee. family owns 10% of UCAR (which owns 29% of Car Inc) and
31% of Luckin Coffee. Even though both entities are listed, they are in expansion phase and require substantial amount of investment. On earnings call, Car
management claimed its independence in operations from UCAR.
CARINC 6% 21

36
BC
P T
op P
icks/
10
/07
/20
19
36
BC
P T
op P
icks/
10
/07
/20
19
COLOMBIA

37
BC
P T
op P
icks/
10
/07
/20
19
GTE 6.25% 25s
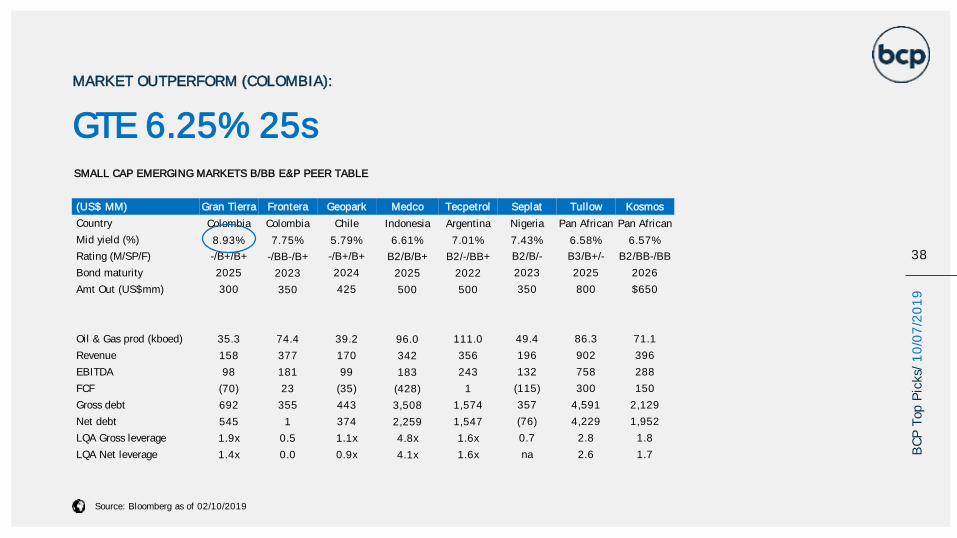
Gran Tierra is an upstream oil and gas company, with production of nearly 36kbpd in 2Q19 (29kboepd after royalties), mostly comprised of crude oil. Operations are
focused in Colombia, while contracts for exploratory blocks were recently signed in Ecuador. Bonds have recently been underperformed given production
disappointments driven by farmer blockades in the Suroriente area and electric submersible pump failures in the Acordionero field. As a result, production guidance
was lowered to 37kbpd in August from previous 42kbpd. The company is listed in the NYSE and the TSX, with a current market cap of US$452mm. Given spread to
closest peers and as production is expected to rebound to 1Q19 levels, we are upgrading GTE 25s to .
MARKET OUTPERFORM (COLOMBIA):
PROS:
• Efficient cost structure, with an operating netback of US$33/boe in 2Q19
• The company is the sole operator of the vast majority of its blocks, allowing the company to potentially decrease capex under a lower crude price environment
• Ample level of 2P reserves of 150mmboe at Dec18 (11 years of average life)
• Comfortable liquidity, with no debt amortizations until 2025 and untapped revolving credit facilities of US$300mm
• Low net leverage of 1.4x (LQA at 2Q19)
• For 2H19, 10kbpd of production is hedged against Brent decline at US$60
• Per last press releases, blockades were lifted in Suoriente, with uninterrupted production of 4.5kbpd since the end of 2Q19
Description Amt (US$ MM) Ratings (M/SP/F) Mid Price Mid YTM
GTE 6.25% 2/15/2025 $300 -/B++B 89.50 8.75%
CONS:
• Small scale, currently producing 36kbpd, mostly concentrated in the Acordionero field
• Failures in the electric submersible pump lowered production from the field by around 4.5kbpd, while farmers blockades in Suoriente interrupted production for further 4.5kbpd
• Low proven reserves, with 5 years of average reserve life
• 37kbpd revised guidance was given with a Brent of US$65. Accordingly, level might be revised further as Brent trades at US$60
• Farmer blockades in Suoriente were resolved through government commitments to increase investment in the area. If the government fails to comply with its commitments, unrest could resume.
38
BC
P T
op P
icks/
10
/07
/20
19
SMALL CAP EMERGING MARKETS B/BB E&P PEER TABLE
MARKET OUTPERFORM (COLOMBIA):
(US$ MM) Gran Tierra Frontera Geopark Medco Tecpetrol Seplat Tullow Kosmos
Country Colombia Colombia Chile Indonesia Argentina Nigeria Pan African Pan African
Mid yield (%) 8.93% 7.75% 5.79% 6.61% 7.01% 7.43% 6.58% 6.57%
Rating (M/SP/F) -/B+/B+ -/BB-/B+ -/B+/B+ B2/B/B+ B2/-/BB+ B2/B/- B3/B+/- B2/BB-/BB
Bond maturity 2025 2023 2024 2025 2022 2023 2025 2026
Amt Out (US$mm) 300 350 425 500 500 350 800 $650
Oil & Gas prod (kboed) 35.3 74.4 39.2 96.0 111.0 49.4 86.3 71.1
Revenue 158 377 170 342 356 196 902 396
EBITDA 98 181 99 183 243 132 758 288
FCF (70) 23 (35) (428) 1 (115) 300 150
Gross debt 692 355 443 3,508 1,574 357 4,591 2,129
Net debt 545 1 374 2,259 1,547 (76) 4,229 1,952
LQA Gross leverage 1.9x 0.5 1.1x 4.8x 1.6x 0.7 2.8 1.8
LQA Net leverage 1.4x 0.0 0.9x 4.1x 1.6x na 2.6 1.7
Source: Bloomberg as of 02/10/2019
GTE 6.25% 25s

39
BC
P T
op P
icks/
10
/07
/20
19
ANALYSIS OF 2Q19 RESULTS
• Revenue increased 4% q/q to US$158mm given higher average realized
prices (+11%), partially offset by an 8% decrease in production
• Gross production ended at 35kbpd, which was hit by farmer
blockades in the Suroriente fields, which interrupted production of
4.5kbpd, and electric submersible pump failures in Acordionero,
which lowered production by 4.5kbpd.
• As a result, production bottomed at 29kbpd, later recovering to
35kbpd at July after blockades were lifted
• Due to production interruptions, 2019 guidance was lowered to 37kbpd from
previous 42kbpd
• EBITDA followed, increasing 5% q/q to US$98mm
• Free cash flow burn of US$39mm, as capex remained high at US$100mm as
the company brings onstream the acquisitions made in Feb19 and further
advances in the Acordionero central processing and water injection facilities
• Gross debt increased 38% q/q to US$715mm after the issuance of
US$300mm in new 27s, while following period-end the company used part of
the proceeds to repurchase the outstanding US$115mm convertible issue
• Net debt in turn increased 14% q/q due to FCF burn
• LQA gross and net leverage increased to 1.8x and 1.3x, while the former
should decrease to 1.5x following the repurchase of the convertibles
MARKET OUTPERFORM (COLOMBIA):
GTE 6.25% 25sGTE (US$MM) 2Q19 2Q18 1Q19 y/y q/q
Revenue 158 163 153 (3%) 4%
EBITDA 98 109 93 (11%) 5%EBITDA margin 61.8% 67.0% 61.0%
GTE (US$MM) 2Q19 2Q18 1Q19 y/y q/q
Total Debt 715 398 517 80% 38%
Cash and Equivalents 201 158 65 27% 211%
Net Debt 514 240 452 115% 14%
Leverage (Total Debt/LQA EBITDA) 1.8 0.9 1.4
Net leverage (Net Debt/LQA EBITDA) 1.3 0.5 1.2
GTE (US$MM) 2Q19 2Q18 1Q19
EBITDA 98 109 93
Working capital (27) (43) (32)
Capex (100) (84) (94)
Interest expense (11) (7) (8)
Income tax expense 0 (5) (11)
FCF (39) (29) (53)

40
BC
P T
op P
icks/
10
/07
/20
19
MARKET OUTPERFORM (COLOMBIA):
GTE 6.25% 25s
0,0
5,0
10,0
15,0
20,0
25,0
30,0
35,0
40,0
45,0
Production before royalties (boepd)
Acquisition of Petroamerica and PGC in Colombia for US$488mm
Farmers blockades in Surorienteand water injection failures in
Acordionero
Blockades lifted in Suroriente
Increase in WI in Suroriente (52%) and Putumayo (50%) for
US$104mm

41
BC
P T
op P
icks/
10
/07
/20
19
41
BC
P T
op P
icks/
10
/07
/20
19
MEXICO
42
BC
P T
op P
icks/
10
/07
/20
19
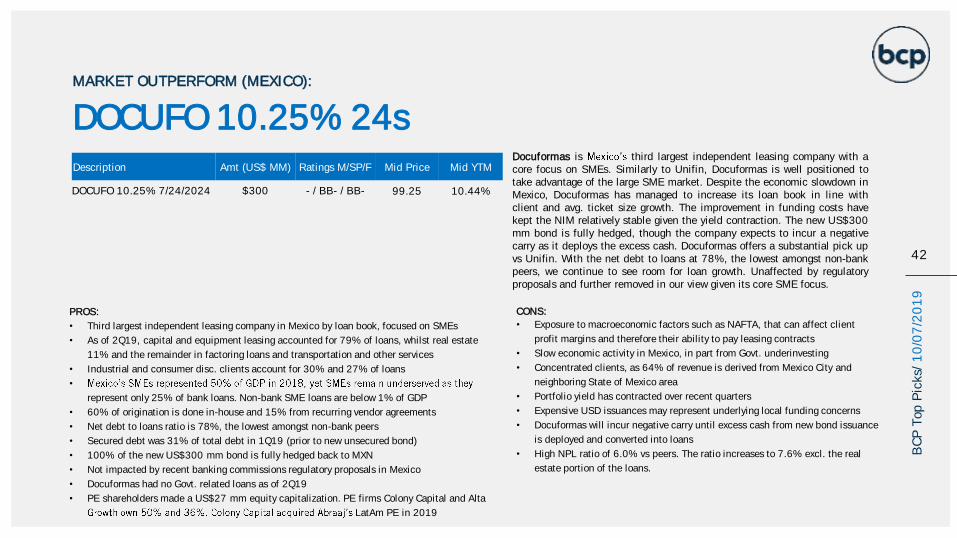
DOCUFO 10.25% 24sMARKET OUTPERFORM (MEXICO):
PROS:
• Third largest independent leasing company in Mexico by loan book, focused on SMEs
• As of 2Q19, capital and equipment leasing accounted for 79% of loans, whilst real estate
11% and the remainder in factoring loans and transportation and other services
• Industrial and consumer disc. clients account for 30% and 27% of loans
•
represent only 25% of bank loans. Non-bank SME loans are below 1% of GDP
• 60% of origination is done in-house and 15% from recurring vendor agreements
• Net debt to loans ratio is 78%, the lowest amongst non-bank peers
• Secured debt was 31% of total debt in 1Q19 (prior to new unsecured bond)
• 100% of the new US$300 mm bond is fully hedged back to MXN
• Not impacted by recent banking commissions regulatory proposals in Mexico
• Docuformas had no Govt. related loans as of 2Q19
• PE shareholders made a US$27 mm equity capitalization. PE firms Colony Capital and Alta
LatAm PE in 2019
CONS:
• Exposure to macroeconomic factors such as NAFTA, that can affect client
profit margins and therefore their ability to pay leasing contracts
• Slow economic activity in Mexico, in part from Govt. underinvesting
• Concentrated clients, as 64% of revenue is derived from Mexico City and
neighboring State of Mexico area
• Portfolio yield has contracted over recent quarters
• Expensive USD issuances may represent underlying local funding concerns
• Docuformas will incur negative carry until excess cash from new bond issuance
is deployed and converted into loans
• High NPL ratio of 6.0% vs peers. The ratio increases to 7.6% excl. the real
estate portion of the loans.
Docuformas is third largest independent leasing company with acore focus on SMEs. Similarly to Unifin, Docuformas is well positioned totake advantage of the large SME market. Despite the economic slowdown inMexico, Docuformas has managed to increase its loan book in line withclient and avg. ticket size growth. The improvement in funding costs havekept the NIM relatively stable given the yield contraction. The new US$300mm bond is fully hedged, though the company expects to incur a negativecarry as it deploys the excess cash. Docuformas offers a substantial pick upvs Unifin. With the net debt to loans at 78%, the lowest amongst non-bankpeers, we continue to see room for loan growth. Unaffected by regulatoryproposals and further removed in our view given its core SME focus.
Description Amt (US$ MM) Ratings M/SP/F Mid Price Mid YTM
DOCUFO 10.25% 7/24/2024 $300 - / BB- / BB- 99.25 10.44%

43
BC
P T
op P
icks/
10
/07
/20
19
(MXN MM) DOCUFO UNIFIN ALPHSA CREAL FINDEP
Ratings (M/SP/F) - /BB-/BB- - /BB/BB B1/B+/ - - /BB+/BB+ - /BB-/BB
Maturity 2024 2023 2022 2023 2024
Coupon 10.25% 7.25% 10.00% 7.25% 8.00%
Mid Price 99.25 103.58 97.25 106.13 91.00
Mid YTM 10.44% 6.22% 11.03% 5.43% 10.43%
2Q19 2Q19 2Q19 2Q19 2Q19
Interest Income 350 2,611 674 2,860 1,314
Interest Expense 169 1,696 474 1,099 189
Net Interest Income 181 902 200 1,760 1,125
Admin. Expenses 64 301 232 852 802
Net Operating Profit 92 538 76 703 117
Total Assets 8,029 66,657 17,180 54,015 12,112
Total Debt (incl. PERP) 5,612 58,480 13,659 39,235 7,132
Cash & Equivalents 714 4,765 1,678 512 279
Net Debt 4,898 53,715 11,981 38,723 6,853
Total Loan Portfolio 6,320 49,424 9,377 41,085 8,421
Net Debt / Net Total Loans 78% 109% 133% 97% 87%
Equity 1,502 9,739 2,401 15,936 4,265
Equity / Total Assets 19% 15% 14% 30% 35%
Total Debt / Equity 374% 600% 569% 220% 167%
NIM 10% 5% 9% 18% 36%
Efficiency Ratio (excl. provisions) 35% 35% 68% 42% 63%
NPL % 6.0% 3.9% 3.3% 1.5% 6.1%
LQA Provision % 0.9% 0.2% 1.3% 3.3% 17.2%
LQA Charge-offs % (0.4%) 0.4% (1.7%) 3.6% 17.0%
MARKET OUTPERFORM (MEXICO):
DOCUFO 10.25% 24sNet debt to net total loans
• Main metric we monitor given the non-bank nature
• Docuformas 78% ratio is the lowest amongst non-bank peers
• Historically been between high 60s and high 70s
• historical ratio under IFRS had been above
100% (incl. the PERP)
• Prior to the new US$300 mm unsecured bond, 31% of total
debt was secured debt
• Given the low ratio, we continue to see room for loan growth
• Furthermore, Docuformas NIM compares favorably to
• Yet, Docuformas 7.4% ROE is well below
• Substantial pick up at DOCUFO 24s
44
BC
P T
op P
icks/
10
/07
/20
19
DOCUFORMAS (MXN MM) 2Q19 1Q19 2Q18 q/q y/y
Total Revenue 350 382 293 (8%) 19%
Interest Expense 169 189 180 (11%) (6%)
Net Financial Margin 181 193 113 (6%) 60%
Net Operating Profit 92 41 33 124% 179%
ALPHACREDIT (MXN MM) 1Q19 4Q18 1Q18 q/q y/y
Total Assets 8,029 7,983 6,210 1% 29%
Total Debt 5,612 5,474 4,461 3% 26%
Cash & Equivalents 714 1,098 549 (35%) 30%
Net Debt 4,898 4,376 3,912 12% 25%
Total Loan Portfolio 6,320 5,958 4,888 6% 29%
Net Debt / Net Total Loans 78% 73% 80%
Equity 1,502 1,418 783 6% 92%
Equity / Total Assets 19% 18% 13%
Total Debt / Equity 374% 386% 570%
NIM 10% 11% 8%
Efficiency Ratio (excl. provisions)
35% 30% 45%
NPL % 6.0% 6.2% 6.2%
LQA Provision % 0.9% 1.0% 1.2%
LQA Charge-offs % (0.4%) 3.1% 0.8%
MARKET OUTPERFORM (MEXICO):
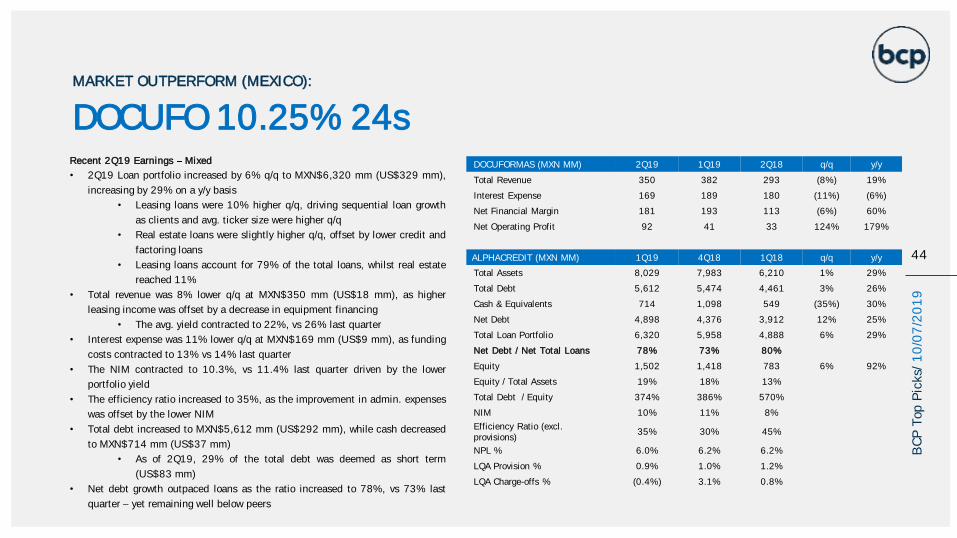
Recent 2Q19 Earnings Mixed
• 2Q19 Loan portfolio increased by 6% q/q to MXN$6,320 mm (US$329 mm),
increasing by 29% on a y/y basis
• Leasing loans were 10% higher q/q, driving sequential loan growth
as clients and avg. ticker size were higher q/q
• Real estate loans were slightly higher q/q, offset by lower credit and
factoring loans
• Leasing loans account for 79% of the total loans, whilst real estate
reached 11%
• Total revenue was 8% lower q/q at MXN$350 mm (US$18 mm), as higher
leasing income was offset by a decrease in equipment financing
• The avg. yield contracted to 22%, vs 26% last quarter
• Interest expense was 11% lower q/q at MXN$169 mm (US$9 mm), as funding
costs contracted to 13% vs 14% last quarter
• The NIM contracted to 10.3%, vs 11.4% last quarter driven by the lower
portfolio yield
• The efficiency ratio increased to 35%, as the improvement in admin. expenses
was offset by the lower NIM
• Total debt increased to MXN$5,612 mm (US$292 mm), while cash decreased
to MXN$714 mm (US$37 mm)
• As of 2Q19, 29% of the total debt was deemed as short term
(US$83 mm)
• Net debt growth outpaced loans as the ratio increased to 78%, vs 73% last
quarter yet remaining well below peers
DOCUFO 10.25% 24s

45
BC
P T
op P
icks/
10
/07
/20
19
DOCUFORMAS (MXN MM) 2Q19 1Q19 2Q18 q/q y/y
Total Revenue 350 382 293 (8%) 19%
Interest Expense 169 189 180 (11%) (6%)
Net Financial Margin 181 193 113 (6%) 60%
Net Operating Profit 92 41 33 124% 179%
ALPHACREDIT (MXN MM) 1Q19 4Q18 1Q18 q/q y/y
Total Assets 8,029 7,983 6,210 1% 29%
Total Debt 5,612 5,474 4,461 3% 26%
Cash & Equivalents 714 1,098 549 (35%) 30%
Net Debt 4,898 4,376 3,912 12% 25%
Total Loan Portfolio 6,320 5,958 4,888 6% 29%
Net Debt / Net Total Loans 78% 73% 80%
Equity 1,502 1,418 783 6% 92%
Equity / Total Assets 19% 18% 13%
Total Debt / Equity 374% 386% 570%
NIM 10% 11% 8%
Efficiency Ratio (excl. provisions)
35% 30% 45%
NPL % 6.0% 6.2% 6.2%
LQA Provision % 0.9% 1.0% 1.2%
LQA Charge-offs % (0.4%) 3.1% 0.8%
MARKET OUTPERFORM (MEXICO):
Recent 2Q19 Earnings
• Equity / Total assets was 19%, improving on a y/y basis from the US$27 mm
PE capitalization
• Per our calculations the NPL ratio improved slightly to 6.0% vs 6.2% last
quarter, with NPLs (excl. real estate) also improving to 7.6% vs 8.4% last
quarter
• Recent highlights:
• In July 2019, Docufo issued a US$300 mm senior unsecured bond
with a 10.25% coupon due 2024
• Proceeds were used to tender US$120 mm of the 22s at
101.5c, as well as addressing the short-term
debt
• The incremental debt will be used to fund loan growth
over the next 12 months
• In May 2019, Alejandro Monzo ( shareholder and CEO)
was appointed as the new Docuformas CEO
• Adam Wiaktor will remain in the board of directors
DOCUFO 10.25% 24s

46
BC
P T
op P
icks/
10
/07
/20
19
RUSSIA
46
BC
P T
op P
icks/
01
/07
/20
19
47
BC
P T
op P
icks/
10
/07
/20
19
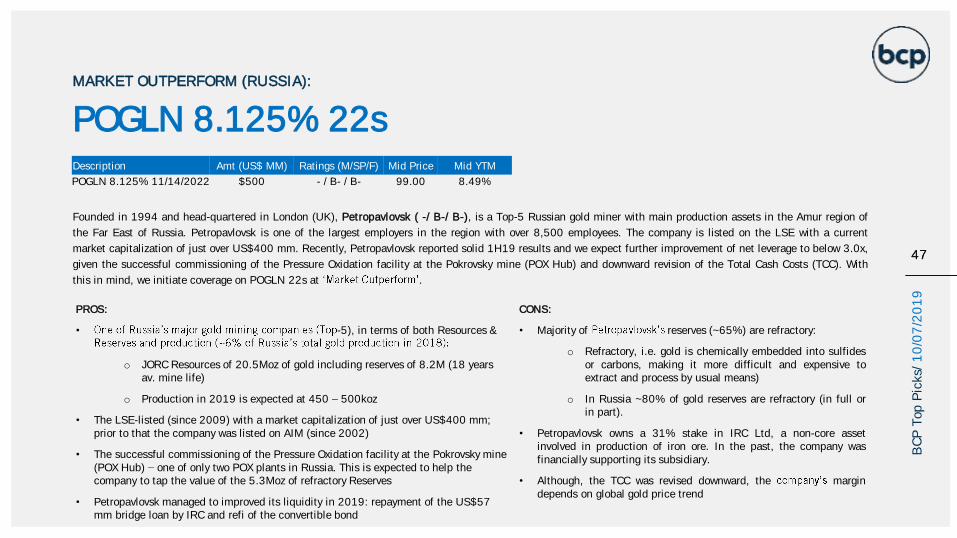
Founded in 1994 and head-quartered in London (UK), Petropavlovsk ( -/ B-/ B-), is a Top-5 Russian gold miner with main production assets in the Amur region of
the Far East of Russia. Petropavlovsk is one of the largest employers in the region with over 8,500 employees. The company is listed on the LSE with a current
market capitalization of just over US$400 mm. Recently, Petropavlovsk reported solid 1H19 results and we expect further improvement of net leverage to below 3.0x,
given the successful commissioning of the Pressure Oxidation facility at the Pokrovsky mine (POX Hub) and downward revision of the Total Cash Costs (TCC). With
this in mind, we initiate coverage on POGLN 22s at .
PROS:
• -5), in terms of both Resources &
o JORC Resources of 20.5Moz of gold including reserves of 8.2M (18 years av. mine life)
o Production in 2019 is expected at 450 500koz
• The LSE-listed (since 2009) with a market capitalization of just over US$400 mm; prior to that the company was listed on AIM (since 2002)
• The successful commissioning of the Pressure Oxidation facility at the Pokrovsky mine (POX Hub) one of only two POX plants in Russia. This is expected to help the company to tap the value of the 5.3Moz of refractory Reserves
• Petropavlovsk managed to improved its liquidity in 2019: repayment of the US$57 mm bridge loan by IRC and refi of the convertible bond
CONS:
• Majority of reserves (~65%) are refractory:
o Refractory, i.e. gold is chemically embedded into sulfidesor carbons, making it more difficult and expensive toextract and process by usual means)
o In Russia ~80% of gold reserves are refractory (in full orin part).
• Petropavlovsk owns a 31% stake in IRC Ltd, a non-core assetinvolved in production of iron ore. In the past, the company wasfinancially supporting its subsidiary.
• Although, the TCC was revised downward, the margindepends on global gold price trend
Description Amt (US$ MM) Ratings (M/SP/F) Mid Price Mid YTM
POGLN 8.125% 11/14/2022 $500 - / B- / B- 99.00 8.49%
MARKET OUTPERFORM (RUSSIA):
47
POGLN 8.125% 22s

48
BC
P T
op P
icks/
10
/07
/20
19
MARKET OUTPERFORM (RUSSIA):
48
POGLN 8.125% 22s 1H19 IFRS Financial Results
1H19 IFRS Financial Results:
• Revenue US$302 mm (+12.9% y/y and +33.1% h/h)
increased on the back of increased production
(+11.8% y/y and +1.9% h/h to 225,000 oz) and sales
(+11.7% y/y and +33.9% h/h to 225,000 oz)
o Recently commissioned POX Hub accounts
for 27% of total production, notably
increasing the potential of the
refractory ore reserves at Malomir mine
• EBITDA - US$83 mm (+37.2% y/y and +1.2% h/h)
notably higher on an annual basis and was maintained
sequentially
o With increasing contribution of POX Hub, the
TCC for refractory processing is expected to
decrease as ramp-up costs decline and
capacity utilization is increased, which should
be a supportive factor for EBITDA
Petropavlovsk, USD MM 1H19 1H18 y/y 2H18 h/h 2018 2017 y/y
Revenue 305 270 13% 229 33% 500 587 -15%
EBITDA 83 61 37% 82 1% 143 197 -27%
Interest (33) (27) 22% (34) -3% (61) (49) 24%
Capex (45) (67) -33% (67) -33% (134) (88) 52%
Taxes Paid (17) (0) 16900% (5) 240% (5) (31) -84%
FCF (pre-working capital) (12) (34) -65% (24) -50% (57) 29 -297%
Working Capital, net change (20) 101 n/a 59 n/a 160 48 233%
FCF (post-working capital) (31) 68 n/a 35 n/a 103 77 34%
EBITDA margin 27% 22% 5pp 36% 9pp 29% 34% -5pp
Shareholder's Equity 602 539 12% 601 0% 601 579 4%
Short Term Debt 97 7 1286% 0 n/a 0 7 n/a
Short Term Lease Liability 3 n/a n/a n/a n/a n/a n/a n/a
Long Term Debt 500 591 -15% 594 -16% 594 589 1%
Long Term Lease Liability 3 n/a n/a n/a n/a n/a n/a n/a
Total Debt 603 598 13 594 2% 594 596 0%
Cash 39 33 18% 26 50% 26 11 136%
Net Debt 564 565 0% 568 -1% 568 585 -3%
EBITDA LTM 165 144 15% 143 16% 143 197 -28%
Leverage 3.6x 4.2x -12% 4.2x -12% 4.2x 3.0x 37%
Net Leverage 3.4x 3.9x -13% 4.0x -14% 4.0x 3.0x 34%
FX (RUS/USD) 63.22 62.95 0% 69.08 -8% 69.08 57.73 20%

49
BC
P T
op P
icks/
10
/07
/20
19
MARKET OUTPERFORM (RUSSIA):
49
POGLN 8.125% 22s 1H19 IFRS Financial Results (continued):
• EBITDA margin 27.3% (+4.9pp y/y and -8.6pp h/h)
• Capex US$45 mm (-33% y/y and h/h) decrease is largely due to the
completion of the major portion of the POX hub
• Liquidity US$39 mm in cash and equivalents (+49.7% YTD) vs. US$100 mm
in short-term debt
• FCF negative (pre- and post-working capital) on higher tax payment
• Debt total debt of US$603 mm (+1.4% YTD) composed of:
o POGLN 20s Convertible Eurobond US$22 mm
o POGLN 22s Eurobond US$500 mm
o POGLN 24s Convertible Eurobond US$125 mm issued in June
2019 (US$100 mm were used to redeem the POGLN 20s Conv)
• Net leverage improved to 3.4x (vs. 4.0x in 2018) on stronger LTM EBITDA
and generally stable total debt (+1.4% YTD)
Petropavlovska Operational Results 1H19 1H18 2H18 y/y h/h 2018 2017 y/y
Gold produced, 000 oz 225 201 221 11.9% 1.8% 422 440 -4%
Gold sold, 000 oz 225 201 168 11.9% 33.9% 370 440 -16%
Average realized price, USD/oz 1,286 1,285 1,268 0.1% 1.4% 1,263 1,262 0.1%
Total Cash Costs (TCC), USD/oz 841 899 650 -6.5% 29.4% 786 741 6%
All-in-Sustaining Costs (AISC), USD/oz 1,029 1,138 1,117 -9.6% -7.9% 1,117 963 16%
2019 Outlook:
• Gold sales are on target to meet the full year 2019 target of 450 -
500koz (after processing gold concentrate stockpiles accumulated in
2018); 500-550koz in 2020 2022
• Capex - US$45 - 55 mm mostly for sustaining and exploration,
excluding the construction of a new floatation facility at Pioneer
announced in June 2019 at a cost of US$30 mm to be completed in a
year
• TCC (Total Cash Costs) revised downward by a US$100/oz to
US$750 850/oz due to strong operational performance, including
ramp up of the POX Hub

50
BC
P T
op P
icks/
10
/07
/20
19
MARKET OUTPERFORM (RUSSIA):
50
POGLN 8.125% 22s Recent Developments:
• New Major Shareholder On July 11, 2019, Fincraft Resources (Mr. Kenes
Rakishev) sold Fincraft Holdings, a major Petropavlovsk shareholder, to Altair
(Mr. Roman Trotsenko); Mr. Rakishev bought his stake in December 2017 from
Mr. Renova group
• Major subsidiary IRC (31.1%), a vertically integrated iron ore producer and
developer in the Russian Far East and North-eastern China, IRC is the HKSE-
listed with a market cap of HKD 553.3 M (~US$70.6 mm) with an annual
production of 1,56 mm tons (2017)
• March 2019 the outstanding loan between IRC and ICBC was successfully
refinanced and Petropavlovsk received the RUB-equivalent of US$57 mm as
full repayment of the two bridge loans advanced to IRC in 2018 by
Petropavlovsk; in addition, a US$6 mm guarantee fee is being paid too with
further US$5 mm payable by IRC no later than March 31, 2020
• Commissioned a pressure oxidation facility (POX Hub) to process its substantial
refractory resource base
• Fitch On August 22, 2019, Fitch upgraded the rating to -
• The ramp-up of the POX Hub has been better than expected in 1H19, it has
already accounted for 27% of the total production, as a result, the top
line and profitability improved. With increasing contribution of POX Hub, the TCC
for refractory processing is expected to decrease as ramp-up costs gradually
decline and capacity utilization is steadily increasing the 2019 TCC has been
already revised downwards by US$100/oz to US$750 850/oz, which should be,
in our view, a supportive factor for EBITDA going forward and we expect net
leverage to further improve to below 3.0x, which prompted us to introduce the
POGLN 22s as a .
600
800
1000
1200
1400
Global Gold Price vs. Petropavlovsk TCC, USD
Global Gold Price
Petropavlovsk TCC
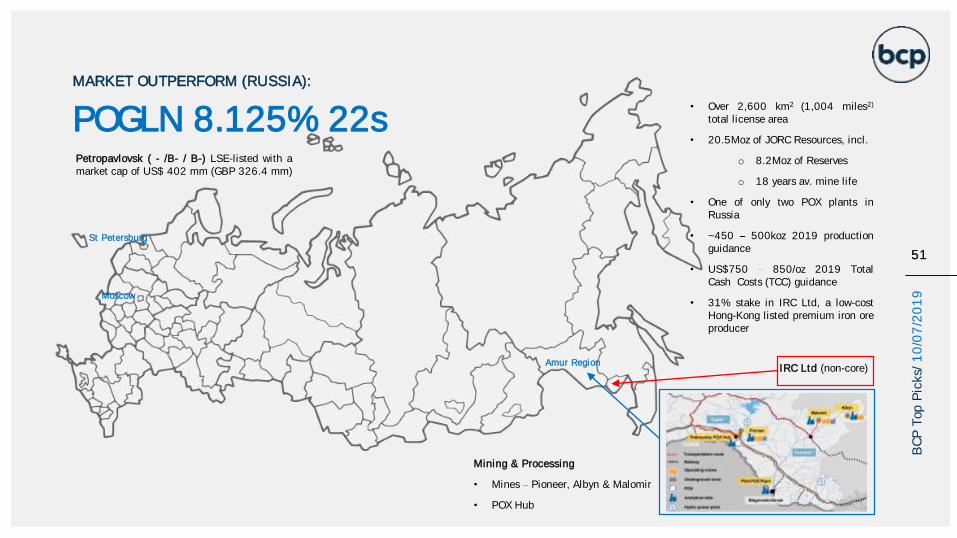
51
BC
P T
op P
icks/
10
/07
/20
19
MARKET OUTPERFORM (RUSSIA):
51
POGLN 8.125% 22s
Mining & Processing
• Mines Pioneer, Albyn & Malomir
• POX Hub
St Petersburg
Moscow
Amur RegionIRC Ltd (non-core)
JAO
Petropavlovsk ( - /B- / B-) LSE-listed with amarket cap of US$ 402 mm (GBP 326.4 mm)
• Over 2,600 km2 (1,004 miles2)
total license area
• 20.5Moz of JORC Resources, incl.
o 8.2Moz of Reserves
o 18 years av. mine life
• One of only two POX plants inRussia
• ~450 500koz 2019 productionguidance
• US$750 850/oz 2019 TotalCash Costs (TCC) guidance
• 31% stake in IRC Ltd, a low-costHong-Kong listed premium iron oreproducer

52
BC
P T
op P
icks/
10
/07
/20
19
TURKEY
52
BC
P T
op P
icks/
01
/07
/20
19

53
BC
P T
op P
icks/
10
/07
/20
19
VakifBank is third largest state-owned bank, 58% owned by the
General Directorate of Foundation and 16% by Vakif pension fund, while
the remaining 25% of shares are free float. Additionally, the bank is the
seventh largest bank in Turkey in terms of loans with a 9% market share
PROS:
• Fifth largest bank in Turkey with more than nine hundred branches
• State support
• Subordinated 22s are old style Basel II compliant, not subject to write down clauses under non-viability event
• As 20% per year of the sub 22s stop counting as TIER 2 capital, we think incentivizes for the issuer to repurchase the notes continues to increase. More than US$220mm have already been bought back since issuance
• Higher total capital ratio than the other state-owned banks and general industry
• Strong liquidity position
• Low stage 2 loans compared to the rest of the industry
CONS:
• NPLs at 4.7% above general industry levels (4.3%), although withguidance of 6% for the year in line with general industry
• High loan to deposit ratio at 123%
• 22s are subordinated bonds, which will be subject to higher volatilityunder unfavorable macroeconomic conditions
• Repurchases of the 22s have been low in the past year and beingmade opportunistically in the market instead of with a tender
• Unfavorable Halk developments in the US could add pressure to otherstate-owned banks in Turkey
Description Amt (US$ MM) Ratings (M/SP/F) Mid Price Mid YTM
VAKBN 6.00% 11/01/2022 $672 Caa1/-/B 97.00 7.11%
VAKBN 6.00% 22s
MARKET OUTPERFORM (TURKEY):
53

54
BC
P T
op P
icks/
10
/07
/20
19
(TRYbn) Vakif Ziraat Yapikredi Akbank Garanti Halk Isbank
2Q19 2Q19 2Q19 2Q19 2Q19 2Q19 2Q19
Senior bond maturity 2022 2022 2022 2022 2022 2021 2022
Senior bond yield 6.7% 6.3% 5.9% 5.6% 5.5% 7.0% 5.9%
Old style subordinated bond maturity 2022 n/a 2022 n/a n/a n/a 2022
Old style subordinated bond yied 7.5% n/a 6.9% n/a n/a n/a 7.3%
Gross loans 262 423 262 211 281 286 271
NPLs (%) 4.7% 2.1% 5.9% 4.5% 5.7% 4.0% 5.8%
Stage 2 loans 11% 5% 15% 14% 15% 8% 14%
Deposit base 215 393 226 229 260 263 259
Loans to deposits 122% 107% 115% 97% 108% 109% 105%
BCP liquidity ratio (*) 41% 35% 40% 40% 42% 38% 38%
NIM 3.6% 4.5% 3.3% 4.7% 4.9% 2.6% 3.1%
Cost / Income 38.3% 47.6% 36.2% 33.8% 40.0% 54.3% 43.0%
ROAA 0.6% 0.8% 1.1% 1.3% 1.8% 0.3% 1.1%
ROAE 7.1% 8.1% 12.5% 10.4% 15.3% 4.2% 9.5%
Total CAR 17.0% 16.0% 15.6% 17.7% 16.4% 14.6% 16.9%
CET1 10.5% 13.0% 11.6% 15.0% 14.1% 9.8% 14.0%
Interest collected / Interest accrued 87% 120% 85% 100% 95% 91% 89%
(*) Cash and equivalents to deposits + funds received + securities issued
VAKBN 6.00% 22s
MARKET OUTPERFORM (TURKEY):
PEER TABLE

55
BC
P T
op P
icks/
10
/07
/20
19
Analysis of 4Q18 results• Gross loans increased 2% q/q to TRY262bn (US$45.3bn), driven by FX loans• NPLs slightly deteriorated 10bps q/q to 4.7%, while management stated in the call it
foresees NPLs meaningfully below the 6% guidance given for 2019• Stage 2 loans share in total increased 90bps q/q to 10.9%, with management
stating that it expects the ratio above initial guidance of 11%, as they expect higher stage 2 loans that do not end up flowing to stage 3
• Coverage ratio (Total provisions / NPLs) remains above 1x at 101%• Net cost of risks decreased 80bps q/q to 150bps, with provisioning decreasing 43% q/q• Interest collected per cash flow statement represented 87% for the quarter, and 89% for
1H19• Deposit base increased 8% q/q to TRY215bn (US$37.0bn), mainly TRY deposits• Loan to deposit ratio improved to 123%, remaining higher than peers• Cash liquidity remains sound, with cash and equivalents representing 49% of total
deposits and 41% of deposits plus loans and market debt• Net Interest Income before provisions increased 8% y/y and 18% q/q to TRY2,770mm
(US$472mm)• NIM weakened 60bps y/y while improving 40bps q/q to 3.6%• Income from services remains grew 67% y/y although contracting 13% q/q • Opex grew 20% y/y and 5% q/q, broadly in line with inflation levels• Cost / Income deteriorated 130bps y/y to 38.3%• ROAA and ROAE weakened both y/y and q/q to 0.6% and 7.1%, respectively, with
TRY1.3bn negative trading cost, mostly on swap cost• Management foresees 2H19 ROAE to double 1H19 levels and end the year
above 10%.• Total CAR strengthened 175bps q/q to 17.0%, with 167bps coming from the AT1
issuance subscribed by the state• TIER1 improved 180bps q/q to 14.0% (minimum 9.5%)• CET1 increased 10bps q/q to 10.5%
MARKET OUTPERFORM (TURKEY):
VAKIF (TRY MM) 2Q19 2Q18 1Q19 y/y q/q
Financial income 10,820 7,266 9,677 49% 12%
Financial expenses (8,050) (4,694) (7,333) 71% 10%
NII before provision 2,770 2,572 2,345 8% 18%
Provisions (1,427) (496) (2,494) 187% (43%)
Income from services 855 511 979 67% (13%)
Operating expenses (1,626) (1,350) (1,548) 20% 5%
NIM 3.6% 4.2% 3.2%
Cost / Income 38.3% 37.0% 32.1%
ROAA 0.6% 1.5% 0.8%
ROAE 7.1% 16.8% 9.1%
VAKIF (TRY MM) 2Q19 2Q18 1Q19 y/y q/q
Gross loans 262,563 218,946 258,427 20% 2%
Total deposits 214,295 170,417 198,124 26% 8%
NPL/ loans 4.7% 3.9% 4.6%
Collection of interest 87.1% 96.2% 90.7%
Loans to Deposits 122.5% 128.5% 130.4%
C&CE to deposits 48.5% 46.6% 45.9%
Capital Ratio 17.0% 15.0% 15.3%
CET1 10.5% 11.8% 10.4%
VAKBN 6.00% 22s

56
BC
P T
op P
icks/
10
/07
/20
19
MARKET UNDERPERFORM
56
BC
P T
op P
icks/
10
/07
/20
19
ARCOR 6% 23s
ARGENTINA
KLAB 4.875% 27s
BRAZIL
TELVIS4.63% 26s
MEXICO
VEDLN 6.375% 22s
INDIA
57
BC
P T
op P
icks/
10
/07
/20
19
ARGENTINA
57
BC
P T
op P
icks/
10
/07
/20
19

58
BC
P T
op P
icks/
10
/07
/20
19
ARCOR 6% 23s
PROS:
• International presence, with 40 plants distributed in Latin America, exporting to more
than 120 countries
• Solid brand reputation
• Vertically integrated. Zucamor purchase in 2017 moved the company forward in self
supply of key raw materials (packaging, bottles and corrugated boxes)
• Rated above sovereign ceiling by both and Fitch, as cash generated fromexports and cash held abroad is considered by rating agencies more than enough tocover near term USD debt service. However we note that export volume share in total islow and exposure to Argentina is high
CONS:
• Significantly exposed to Argentina: Only 7% of sales volumes are exports.
Argentina accounts for nearly two thirds of revenues (including exports)
and 80% of EBITDA.
• F/X risks on local sales, which are based in local currency, partiallymitigated by exports
• Challenging environment in Brazil, which continuously books negativeEBITDA
• Highly leveraged (LHA 2Q19 net leverage 4.4x)
• Liquidity deteriorated, as cash falls below ST debt at 30% compared to44% in 4Q18 and 51% one year ago. However, we note that most of theST debt refers to local banks denominated in ARS
• Arcor and Mastellone shareholders agreement could further increaseleverage. Mastellone results are subject to volatility of international milkprices and soft demand in Argentina
Grupo Arcor is a leading confectionary and food company in Argentina, thelargest candy producer in the world and the main candy exporter of Argentina,Brasil, Chile and Peru. Additionally, through Bagley, where Arcor has 51%ownership, the company is one of the market leaders in cookies and cerealproduction in Latin America. Further, through the recent agreement withMastellone, the company will become the controlling shareholder of theleading dairy products company in Argentina.
Description Amt (US$ MM) Ratings (M/SP/F) Mid Price Mid YTM
ARCOR 6% 09/27/2023 $500 B3/-/B- 87.90 9.95%
MARKET UNDERPERFORM (ARGENTINA):
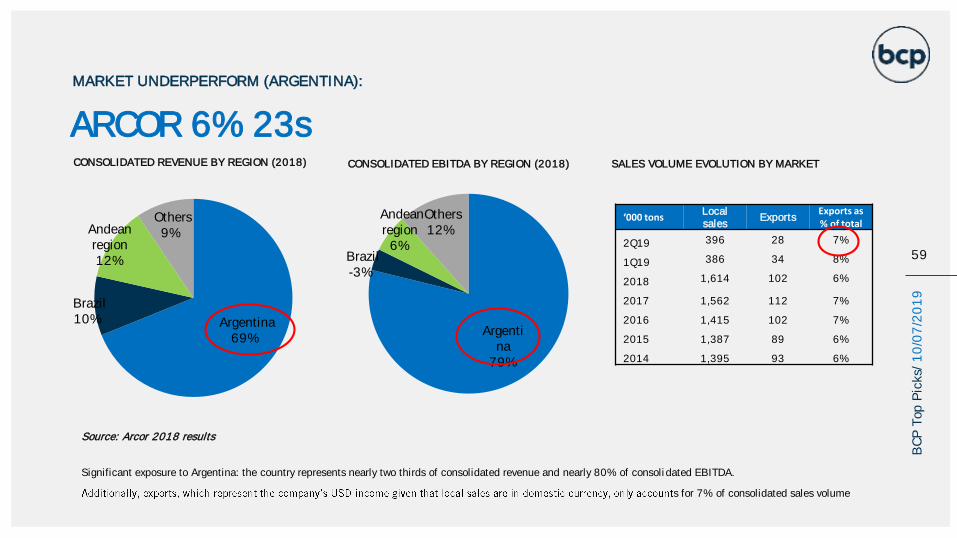
59
BC
P T
op P
icks/
10
/07
/20
19
ARCOR 6% 23s
MARKET UNDERPERFORM (ARGENTINA):
CONSOLIDATED REVENUE BY REGION (2018) CONSOLIDATED EBITDA BY REGION (2018)
Significant exposure to Argentina: the country represents nearly two thirds of consolidated revenue and nearly 80% of consolidated EBITDA.
s for 7% of consolidated sales volume
‘000 tonsLocal sales
ExportsExports as % of total
2Q19 396 28 7%
1Q19 386 34 8%
2018 1,614 102 6%
2017 1,562 112 7%
2016 1,415 102 7%
2015 1,387 89 6%
2014 1,395 93 6%
SALES VOLUME EVOLUTION BY MARKET
Source: Arcor 2018 results
Argentina 69%
Brazil 10%
Andean region 12%
Others 9%
Argentina
79%
Brazil -3%
Andean region 6%
Others 12%
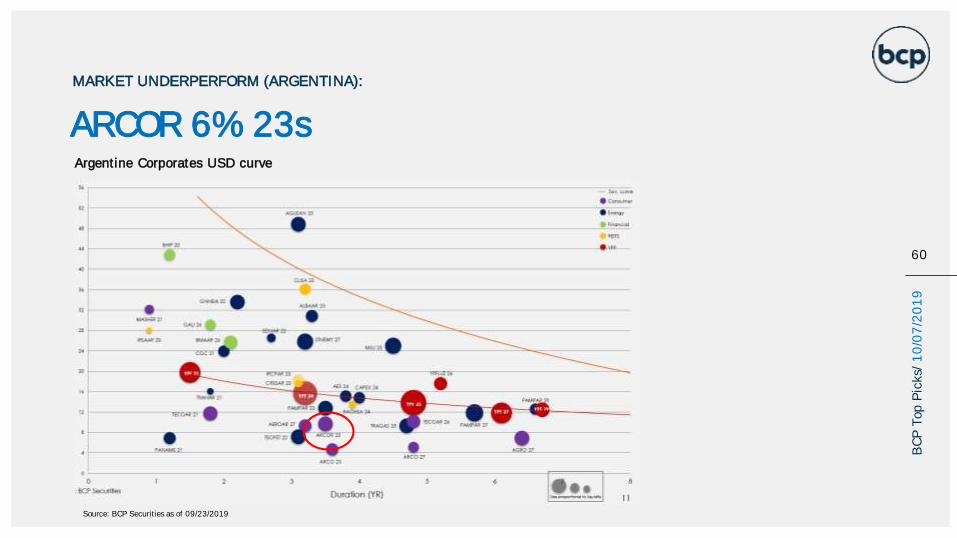
60
BC
P T
op P
icks/
10
/07
/20
19
Argentine Corporates USD curve
Source: BCP Securities as of 09/23/2019
MARKET UNDERPERFORM (ARGENTINA):
ARCOR 6% 23s

61
BC
P T
op P
icks/
10
/07
/20
19
ARCOR 6% 23s
MARKET UNDERPERFORM (ARGENTINA):
LIQUIDITY IS THIN, ALTHOUGH NEAR TERM MATURITIES ARE MOSTLY BANK DEBT IN
ARS
• Cash and equivalents position at Jun 30, 2019 ended at US$111mm, compared to a ST debt of US$357mm
• ST corresponds mostly to local bank debt, which is denominated mostly in ARS
AMORTIZATION SCHEDULE 06.30.2019
US$mm Jun19
Cash and cash equivalents 111
Short term debt 357
Bank debt 330
Bonds 17
Leasing 10
TOTAL DEBT PER CURRENCY (DEC18) TOTAL DEBT BY INSTRUMENT (MAR19)
USD63%
ARS22%
Others15%
Source: Arcor 2Q19 results
Loans41%
Bonds56%
Others3%
0
120
240
360
480
600
C&CE ST debt 1-2 years 2-5 years 5 years+
US$MM

62
BC
P T
op P
icks/
10
/07
/20
19
ANALYSIS OF 2Q19 RESULTS
• Quarterly revenue in real terms increased 4% y/y to AR$26,646mm on higher prices, which more than offset a 4% decrease in production
• During the quarter, 7% of sales volumes referred to exports and 93% to local sales
• For the six months, revenue increased 6% y/y
• EBITDA, which we could only calculate on an accumulated basis due to lack of D&A inflation adjusted figure for previous quarter, dropped 23% y/y to AR$4,172mm
• EBITDA margin for 1H19 contracted 300bps y/y to 7.6%
• Free cash flow, only reported on an accumulated basis, was negative AR$1,949mm due to high interest payments on USD debt, which accounts for nearly two thirds of total
• Net debt as a result increased 4% since Dec18 to AR$36,374mm, including IFRS 16 debt
• Cash position of AR$4,702 represented 0.31x of ST debt
• Annualized net leverage for the first half of the year deteriorated to 4.4x from 3.3x one year ago
MARKET UNDERPERFORM (ARGENTINA):
ARCOR 6% 23sARCOR (AR$MM) 1H19 1H18 y/y
Revenue 54,309 51,053 6%
EBITDA 4,172 5,397 (23%)
EBITDA margin 7.6% 10.6%
ARCOR (AR$MM) Jun19 Dec18 %
Total Debt 41,436 41,138 1%
Cash and Equivalents 4,702 5,918 (21%)Net Debt 36,734 35,220 4%
Leverage (Total Debt/LQA EBITDA) 5.0x 3.8x
Net leverage (Net Debt/LQA EBITDA) 4.4x 3.3x
ARCOR (AR$MM) 1H19 1H18
EBITDA 4,172 5,397
Working capital (504) (445)
Capex (1,102) (2,417)
Interest paid (3,685) (1,749)
Taxes paid (829) (1,206)
FCF(1,949
)(421)

63
BC
P T
op P
icks/
10
/07
/20
19
MARKET UNDERPERFORM (ARGENTINA):
ARCOR 6% 23s
1H19 ARCOR MASHER
AR$mm
Revenue 54,309 11,589
EBITDA 4,172 1,392
EBITDA margin 8% 12%
Free cash flow pre dividends (1,949) (97)
US$mm
Gross debt 975 207
Net debt 865 192
Annualized gross leverage 5.0 1.6
Annualized net leverage 4.4 1.5
Pro forma EBITDA margin 6% 9%
Pro forma net leverage 5.5 2.0
Pro forma net leverage at market
4.7 1.6
The following is a stress case scenario for next year, which considers the following factors:
We assume a 50% inflation on COGS for next twelve months
We value the fx debt at an ARS of 65
We assume a 10% revenue drop due to recession and pass-through lag

64
BC
P T
op P
icks/
10
/07
/20
19
AGREEMENT ARCOR AND MASTELLONE
• Until 2020 Mastellone family and Dallpoint (shareholder of Masher) have put options to sell shares to Arcor and Bagley but must keep a combined 51% ownership. After Jul20, they have the option to sell their remaining shares
• After 2020 and until 2025, Arcor and Bagley will have call options to own 100% of total capital stock
• Current Arcor ownership is 40.24%
• Purchases:
• May-19: 4.87% for US$13.7mm (US$2.8mm for every 1%)
• Jun-18: 2.40% for US$6mm (US$2.5mm for every 1%)
• Nov-17: 1.85% for US$5mm (US$2.7mm for every 1%)
• Apr-17: 4.86% for US$13.76mm (US$2.8mm for every 1%)
• Jan-17: 8.5% for US$35mm (US$4.1mm for every 1%)
• Dec-15: 25.0% for US$60mm (US$2.4mm for every 1%)
• Assuming an average price of US$2.9mm, for the remaining 52.5%, total cost will be US$152mm
• Consolidating MASHER and assuming US$152mm will be funded with debt issuance, pro forma net leverage at consolidated 1H19 debt and EBITDA would be 3.6x (down from 4.4x at 1H19)
• Should the purchase of the remaining stake be funded with own cash generation, pro forma net leverage would be 4.1x
• We acknowledge this transaction is unlikely to happen before 2020. Actual numbers can differ from these calculations
MASHER (ARS MM) 1H19 2018
Revenues 21,745 34,233
EBITDA 1,932 1,328
Free cash flow 146 (1,271)
Gross debt 8,796 7,441
Cash and equivalents 638 576
Net debt 8,158 6,866
LHA Gross leverage 1.6 5.6
LHA Net leverage 1.5 5.2
ARCOR + MASHER (ARS MM) 1H19 1H19
Revenue 76,054 76,054
EBITDA 6,104 6,104
Gross debt 55,333(*) 48,877
Cash and cash equivalents 5,304 5,304
Net debt 49,993 43,357
LTM Gross leverage 4.5x 4.0x
LTM Net leverage 4.1x 3.6x
(*) Arcor + Masher + US$152mm to fund remaining Masher stake
MARKET UNDERPERFORM (ARGENTINA):
ARCOR 6% 23s

65
BC
P T
op P
icks/
10
/07
/20
19
65
BC
P T
op P
icks/
10
/07
/20
19
BRAZIL

66
BC
P T
op P
icks/
10
/07
/20
19
KLAB 4.875% 27s
PROS:
• Largest Brazilian paper producer and exporter
• Leading position in Brazil with 50% share in coated board and industrial bags and
40% share in kraftliner
• Stronger domestic demand in gradual recovery could support
results
• Paper sales in the local market (50% of total) provide hedging against local currency
appreciation
• Low cash cost levels compared to international peers, US$202/t in 2Q19
• Higher product diversification, Pulp sales ~50% EBITDA (ex. Suzano ~90% pulp)
CONS:
• Both pulp and paper are based on international commodity prices
• Pulp prices declined significantly on weaker demand on China and
oversupplied market reaching US$532/ton lowest since Jan/17
• Puma II project construction of two pulp integrated packaging paper
machines parallel to Pulp unit in the midst of weak demand can spike
leverage for upcoming years.
• Capex intensive expansion at R$9.1bn, disbursed between
2019-2023 (2/3 disbursed during 2019-2021)
• Exposed to FX volatility with ~85% of costs in local currency vs ~40% of
sales, long USD
• Net leverage run rate at 4.0x, while capex for Puma II has just begun
Klabin is largest paper producer, exporting almost half of itsproduction. Through the recently completed Puma mill (1.5mm MT), it is alsoa pulp producer. installed capacity is 2mm MT of coated boards andkraftliner sack kraft. Pulp is mainly sold to Fibria through a six-year purchaseagreement that expired last quarter. Listed in Brazilian stock exchangeIbovespa - current US$4.0bn market cap.
Description Amt (US$ MM) Ratings (M/SP/F) Mid Price Mid YTM
KLAB 4.875% 07/06/2027 $500 (-/BB+/BB+) 102.53 4.49%
MARKET UNDERPERFORM (BRAZIL):
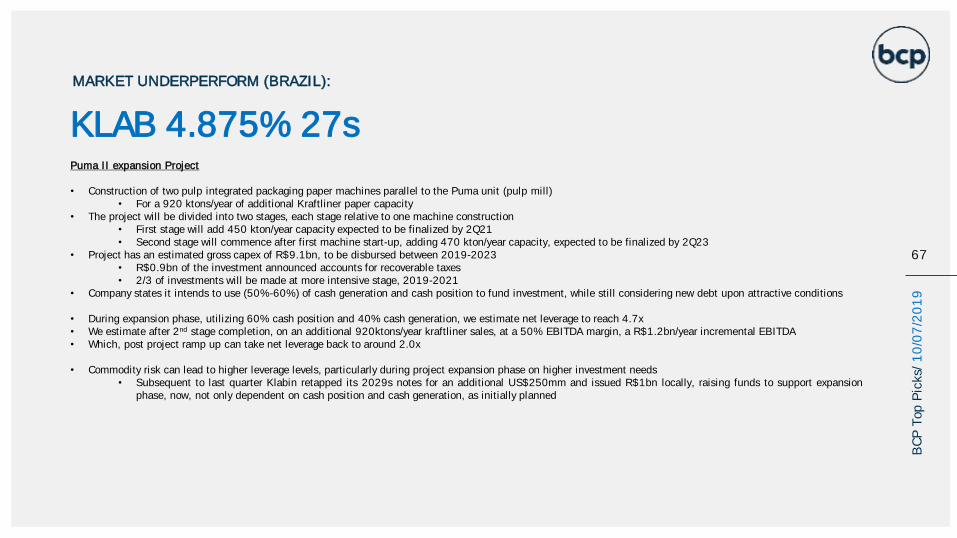
67
BC
P T
op P
icks/
10
/07
/20
19
KLAB 4.875% 27sPuma II expansion Project
• Construction of two pulp integrated packaging paper machines parallel to the Puma unit (pulp mill)• For a 920 ktons/year of additional Kraftliner paper capacity
• The project will be divided into two stages, each stage relative to one machine construction• First stage will add 450 kton/year capacity expected to be finalized by 2Q21• Second stage will commence after first machine start-up, adding 470 kton/year capacity, expected to be finalized by 2Q23
• Project has an estimated gross capex of R$9.1bn, to be disbursed between 2019-2023• R$0.9bn of the investment announced accounts for recoverable taxes• 2/3 of investments will be made at more intensive stage, 2019-2021
• Company states it intends to use (50%-60%) of cash generation and cash position to fund investment, while still considering new debt upon attractive conditions
• During expansion phase, utilizing 60% cash position and 40% cash generation, we estimate net leverage to reach 4.7x• We estimate after 2nd stage completion, on an additional 920ktons/year kraftliner sales, at a 50% EBITDA margin, a R$1.2bn/year incremental EBITDA• Which, post project ramp up can take net leverage back to around 2.0x
• Commodity risk can lead to higher leverage levels, particularly during project expansion phase on higher investment needs• Subsequent to last quarter Klabin retapped its 2029s notes for an additional US$250mm and issued R$1bn locally, raising funds to support expansion
phase, now, not only dependent on cash position and cash generation, as initially planned
MARKET UNDERPERFORM (BRAZIL):

68
BC
P T
op P
icks/
10
/07
/20
19
2Q19 RESULTS - SOFT
• Revenue remained practically flat q/q and down 4% y/y, missing consensus by2%, to US$663mm, as increase in volumes was offset by lower pulp andkraftliner prices
• In BRL revenue increased 4% q/q and 16% y/y, to R$2.6bn
• Pulp volumes increased 5% q/q to 371 ktons, following the end ofthe short fiber supply agreement (min. 900 kton/year) with Fibria
• Pulp realized prices decreased 3% q/q
• EBITDA decreased 8% q/q and 10% y/y to US$244, missing consensus by6%
• Pulp cash cost increased to US$202/ton, up 9% q/q, mainly drivenby higher costs on wood, deteriorating margins
• FCF slightly above breakeven at US$1mm, a sequential and annual decrease,driven by WK expansion, weaker EBITDA and higher capex, alreadyincorporating PUMA II project expenses
• Capex totaled US$148mm in the period, US$73mm related to thestart of Puma II Project
• Gross debt increased 24% q/q, to US$6.5bn given issuances in the period
• Company issued US$1bn on 29s and 49s bonds, US$500mm each,at 5.75% and 7.00% coupon rates, respectively
• Cash position increased to US$2.6bn, up 68% q/q
• Annualized gross and net leverage deteriorated to 6.6x and 4.0x from 4.9x and3.5x last quarter, respectively
• Subsequent to the quarter, Klabin retapped its 2029s notes for an additionalUS$250mm and issued R$1bn in the local market in CRAs (Agribusinessreceivable Certificates)
MARKET UNDERPERFORM (BRAZIL):
KLAB 4.875% 27sKLABIN (US$MM) 2Q19
BBG consensus
+/- 2Q18 1Q19 y/y q/q
Revenue 663 676 (2%) 688 660 (4%) 0%
EBITDA 244 259 (6%) 272 267 (10%) (8%)
EBITDA margin 36.8% 38.3% 39.6% 40.4%
KLABIN (US$MM) 2Q19 2Q18 1Q19 y/y q/q
Total Debt 2,485 5,692 5,247 14% 24%
Cash and Equivalents 2,624 1,702 1,565 54% 68%
Net Debt 3,861 3,990 3,682 (3%) 5%
Leverage (Total Debt/LQA EBITDA) 6.6 5.2 4.9
Net leverage (Net Debt/LQA EBITDA) 4.0 3.7 3.5
KLABIN (US$MM) 2Q19 2Q18 1Q19 y/y q/q
EBITDA 244 272 267 (10%) (8%)
Working capital (23) (9) 23
Capex (148) (59) (79)
Interest paid (71) (26) (95)
Taxes paid (1) - -
FCF 1 178 115

69
BC
P T
op P
icks/
10
/07
/20
19
69
BC
P T
op P
icks/
10
/07
/20
19
MEXICO
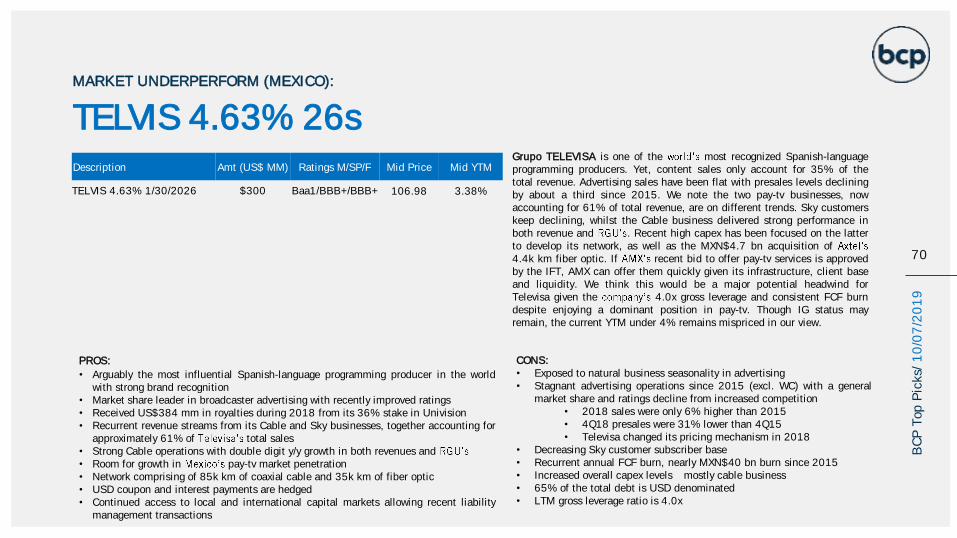
70
BC
P T
op P
icks/
10
/07
/20
19
TELVIS 4.63% 26sMARKET UNDERPERFORM (MEXICO):
PROS:
• Arguably the most influential Spanish-language programming producer in the worldwith strong brand recognition
• Market share leader in broadcaster advertising with recently improved ratings• Received US$384 mm in royalties during 2018 from its 36% stake in Univision• Recurrent revenue streams from its Cable and Sky businesses, together accounting for
approximately 61% of total sales• Strong Cable operations with double digit y/y growth in both revenues and• Room for growth in pay-tv market penetration• Network comprising of 85k km of coaxial cable and 35k km of fiber optic• USD coupon and interest payments are hedged• Continued access to local and international capital markets allowing recent liability
management transactions
CONS:• Exposed to natural business seasonality in advertising• Stagnant advertising operations since 2015 (excl. WC) with a general
market share and ratings decline from increased competition• 2018 sales were only 6% higher than 2015• 4Q18 presales were 31% lower than 4Q15• Televisa changed its pricing mechanism in 2018
• Decreasing Sky customer subscriber base• Recurrent annual FCF burn, nearly MXN$40 bn burn since 2015• Increased overall capex levels mostly cable business• 65% of the total debt is USD denominated• LTM gross leverage ratio is 4.0x
Grupo TELEVISA is one of the most recognized Spanish-languageprogramming producers. Yet, content sales only account for 35% of thetotal revenue. Advertising sales have been flat with presales levels decliningby about a third since 2015. We note the two pay-tv businesses, nowaccounting for 61% of total revenue, are on different trends. Sky customerskeep declining, whilst the Cable business delivered strong performance inboth revenue and . Recent high capex has been focused on the latterto develop its network, as well as the MXN$4.7 bn acquisition of4.4k km fiber optic. If recent bid to offer pay-tv services is approvedby the IFT, AMX can offer them quickly given its infrastructure, client baseand liquidity. We think this would be a major potential headwind forTelevisa given the 4.0x gross leverage and consistent FCF burndespite enjoying a dominant position in pay-tv. Though IG status mayremain, the current YTM under 4% remains mispriced in our view.
Description Amt (US$ MM) Ratings M/SP/F Mid Price Mid YTM
TELVIS 4.63% 1/30/2026 $300 Baa1/BBB+/BBB+ 106.98 3.38%

71
BC
P T
op P
icks/
10
/07
/20
19
TELVIS 4.63% 26sMARKET UNDERPERFORM (MEXICO):
TELEVISA (MXN MM) 2015 2016 2017 2018 LTM
Content 34,333 36,687 33,997 36,490 34,578
World cup - - - 2,734 1,010
SKY 19,254 21,941 22,197 22,002 21,499
Cable 28,488 31,892 33,048 36,233 38,851
Other businesses 8,124 8,829 7,688 8,636 8,751
Total Revenue 88,052 96,287 93,586 101,282 99,471
EBITDA 33,168 34,279 33,696 37,761 36,677
Interest paid (5,939) (7,633) (8,861) (10,129) (9,682)
Capex (27,078) (30,414) (18,537) (26,274) (28,241)
Working capital (648) (401) (6,336) (2,157) (4,605)
Taxes paid (7,824) (7,269) (6,420) (6,723) (9,270)
FCF (8,320) (11,438) (6,458) (7,522) (15,120)
Total Debt 117,400 140,070 133,404 130,987 146,938
Cash & Equivalents 49,397 47,546 38,735 32,068 37,918
Net Debt 68,003 92,524 94,669 98,918 109,020
Gross Leverage 3.5x 4.1x 4.0x 3.5x 4.0x
Net Leverage 2.1x 2.7x 2.8x 2.6x 3.0x
Customer Advances 20,470 21,709 18,798 13,638 14,610
Trend Highlights
• Stagnant content sales as they are essentially flat vs 2015
• Customer advances remain below 2015 levels
• 4Q18 presales were 31% lower than 4Q15
• Slow SKY sales growth as customers keep decreasing
• Consolidated revenue growth has been fueled by the cable
business, the segment with strong client and RGU growth
• Stable EBITDA margins
• MXN$15 bn LTM FCF burn
• Recurrent FCF burn in each of the past four years
• Nearly MXN$40 bn FCF burn since 2015
• FCF burn has been partially offset through recent non-core
asset sales
• Net debt has increased significantly since 2015, driving the
LTM net leverage to 3.0x

72
BC
P T
op P
icks/
10
/07
/20
19
TELEVISA (MXN MM) 2Q19BBG
consensus % dif 1Q19 2Q18 q/q y/y
Total Revenue 24,308 25,101 (3%) 23,395 26,702 4% (9%)
EBITDA 9,302 9,102 2% 8,765 10,546 6% (12%)
EBITDA margin 38% 36% - 37% 39% - -
TELEVISA (MXN MM) 2Q19 1Q19 2Q18 q/q y/y
Total Debt 146,938 134,095 132,546 10% 11%
Cash & Equivalents 37,918 23,563 44,593 61% (15%)
Net Debt 109,020 110,532 87,953 (1%) 24%
Total Debt / LQA EBITDA 3.9x 3.8x 3.1x 0.1x 0.8x
Net Debt / LQA EBITDA 2.9x 3.2x 2.1x -0.2x 0.8x
TELEVISA (MXN MM) 2Q19 1Q19 2Q18 q/q y/y
EBITDA 9,302 8,765 10,546 6% (12%)
Interest paid (2,332) (1,679) (2,098) (39%) (11%)
Capex (5,543) (4,758) (4,983) (17%) (11%)
Working capital 716 (4,436) (1,763) - -
Taxes paid (1,541) (4,463) (741) 65% (108%)
FCF 603 (6,571) 962 - (37%)
Recent 2Q19 Earnings Mixed
• 2Q19 Revenue decreased by 2% y/y to MXN$24.3 bn (US$1.3 mm), missing
the BBG consensus by 3%
• Content sales were 13% lower y/y at MXN$8.1 bn, with ad. sales
being 17% lower y/y from lower Govt. and corporate revenue
• Advertising was impacted as 2Q18 had higher sales from
the WC, though we are excl. the exhibition rights
• Cable sales were 3% higher q/q at MXN$10.2 bn, driven by
continuing sequential RGU growth
• SKY sales were 1% higher q/q at MXN$5.4 bn, partially offset by
broadband as video customers continue to decrease
• EBITDA decreased by 12% y/y to MXN$9.3 bn (US$0.5 bn), yet managing to
beat the BBG consensus by 2%
• Sequential growth was mainly from higher sales as 1 tend to be
the slowest quarter
• Y/Y decrease was due to a margin contraction as sales decreased
further than SG&A expenses
• As a result, the EBITDA margin was 38%, vs 39% during 2Q18
• FCF generation was MXN$0.6 bn (US$32 mm), due to working capital
contraction from lower A/R
• Capex remains heavily focused on Cable accounting for 78% of the
total
• We note customer deposits decreased q/q to similar levels vs 2Q18
TELVIS 4.63% 26sMARKET UNDERPERFORM (MEXICO):

73
BC
P T
op P
icks/
10
/07
/20
19
TELEVISA (MXN MM) 2Q19BBG
consensus % dif 1Q19 2Q18 q/q y/y
Total Revenue 24,308 25,101 (3%) 23,395 26,702 4% (9%)
EBITDA 9,302 9,102 2% 8,765 10,546 6% (12%)
EBITDA margin 38% 36% - 37% 39% - -
TELEVISA (MXN MM) 2Q19 1Q19 2Q18 q/q y/y
Total Debt 146,938 134,095 132,546 10% 11%
Cash & Equivalents 37,918 23,563 44,593 61% (15%)
Net Debt 109,020 110,532 87,953 (1%) 24%
Total Debt / LQA EBITDA 3.9x 3.8x 3.1x 0.1x 0.8x
Net Debt / LQA EBITDA 2.9x 3.2x 2.1x -0.2x 0.8x
TELEVISA (MXN MM) 2Q19 1Q19 2Q18 q/q y/y
EBITDA 9,302 8,765 10,546 6% (12%)
Interest paid (2,332) (1,679) (2,098) (39%) (11%)
Capex (5,543) (4,758) (4,983) (17%) (11%)
Working capital 716 (4,436) (1,763) - -
Taxes paid (1,541) (4,463) (741) 65% (108%)
FCF 603 (6,571) 962 - (37%)
Recent 2Q19 Earnings
• Total debt increased to MXN$147 bn (US$7.7 bn), with cash increasing to
MXN$38.0 bn (US$2.0 bn)
• Q/Q debt growth was from TV issuing a US$750 mm 30-yr bond
with a 5.25% coupon
• In July, TV also acquired a MXN$10 bn syndicated 5-yr term loan
• Annualized gross and net leverage are 4.0x and 3.0x, respectively
• Recent highlights:
• Univision is reportedly exploring sale options, with TV owning a
36% stake and currently receiving around US$0.4 bn annual
royalties
TELVIS 4.63% 26sMARKET UNDERPERFORM (MEXICO):

74
BC
P T
op P
icks/
10
/07
/20
19
74
BC
P T
op P
icks/
10
/07
/20
19
INDIA

75
BC
P T
op P
icks/
10
/07
/20
19
VEDLN 6.375% 22sMARKET UNDERPERFORM (INDIA):
PROS:
• Diversified business segments provide multiple revenue streams• Consolidation of subsidiaries (Vedanta Ltd and Cairn India Ltd)
improves access to the cash holdings• FY20 guidance previews production ramp-up across nearly all
sectors, which may provide for better results in the near term
CONS:• Exposure to commodity price fluctuation• Significant minority interests restricts dividend flow from subsidiaries• Access to liquidity of operations limited by % ownership in VEDL and subsidiaries,
particularly Zinc India• Dependence on zinc, copper and aluminum segments, supplying north of 80% of EBITDA• We calculate pro forma (LQA) pro rata gross and net leverage at the bond issuer at 8.8x
and 7.3x, respectively• Resources standalone does not generate EBITDA but has around US$6.2bn of
net debt• Market value of interest in VEDL has fallen to ~US$3.9bn, a 36% deficit
versus net debt at face
Vedanta Resources Limited is largest diversifiednatural resources company founded in 1976, active in several areasincluding zinc, oil and gas, aluminum and copper. principalasset is its 50.1% ownership in Vedanta Limited (NYSE tickerwhich contributes ~98% of consolidated EBITDA and revenue. Theremaining EBITDA is derived from 79.4% stake in KonkolaCopper Mines. Major shareholder is Volcan Investments, family trust ofchairman Anil Agarwal, that has recently completed a tender offer toacquire the remaining stake (66.5% before offer) in Resources, delistingthe company from London Stock Exchange. The offer valued total equity ofthe company at ~US$3bn.
Amt (US$ MM) Ratings (M/SP/F) Mid Price Mid YTM
VEDLN 6.375% 7/30/2022 1,000 B2/ B+/ - 98.84 6.84

76
BC
P T
op P
icks/
10
/07
/20
19
Recent 2H19 Earnings Soft
• Net revenue was flat h/h at US$6.9bn.
• Revenue from Zinc increased 9% h/h to US$1.7bn. Production increased
18% h/h to 586 kt mined metal content
• Revenue from Aluminum decreased 12% h/h to US$2bn. Production was
flat h/h at 983 kt.
• Reported EBITDA decreased 2% h/h to US$1.7bn. Increase in EBITDA from Zinc was
offset by decrease in Aluminum.
• EBITDA from Zinc increased 18% h/h to US$874mm.
• EBITDA from Aluminum decreased 70% h/h to US$74mm.
• Cash burn decreased 84% h/h to US$98mm, due to WK improvement.
• Huge WK improvement in 2H19 generated US$833mm cash, compared
with US$554mm cash outflow in 1H19.
• As is disclosed on cash flow statement, increase in A/P released US$840mm cash in
2H19. In 1H19, A/P decreased and required US$263mm WK investment.
• On balance sheet, A/P increased US$1.3bn h/h. Negative WK increased 54% h/h to
US$3.3bn.
• Dividend paid to non-controlling interest soared h/h to US$1bn.
• The company recorded US$375mm F/X exchange loss.
• Gross debt increased 2% h/h to US$16bn. Total cash decreased 4% h/h to US$5.3bn.
Net debt increased 5% h/h to US$11bn.
• LHA gross and net leverage both increased h/h to 4.7x and 3.2x.
• Pro rata LHA gross and net leverage was 8.0x and 6.3x.
VEDLN 6.375% 22sMARKET UNDERPERFORM (INDIA):
Vedanta Resources Ltd (US$ mm) 2H19 1H19 2H18 y/y h/hNet revenue before special items 6,936 7,014 8,501 (18%) (1%)- zinc India 1,515 1,440 1,866 (19%) 5%- zinc international 230 163 278 (17%) 41%- oil & gas 914 978 800 14% (6%)- iron ore 210 204 290 (28%) 3%- copper India & Australia 782 755 2,079 (62%) 4%- copper Zambia 454 511 518 (12%) (11%)- aluminium 1,949 2,228 2,115 (8%) (12%)- power 439 475 519 (15%) (7%)- others 443 261 36 1134% 70%
EBITDA reported 1,682 1,711 2,270 (26%) (2%)- zinc India 789 727 1,069 (26%) 8%- zinc international 85 15 109 (22%) 480%- oil & gas 528 572 448 18% (8%)- iron ore 45 45 51 (12%) (1%)- copper India & Australia (24) (12) 69 (135%) 93%- copper Zambia (22) (41) 56 (139%) (48%)- aluminium 74 242 261 (72%) (70%)- power 102 117 184 (45%) (13%)- others 105 46 24 341% 128%
EBITDA margin 24% 24% 26% (230 bps) (12 bps)
Vedanta Resources Ltd (US$ mm) 2H19 1H19 2H18 y/y h/hEBITDA as reported 1,683 1,710 2,270 (26%) (2%)Operating exceptional items 0 (13) - -Working capital movements 833 (554) (160) (621%) (250%)Changes in non-cash items 16 17 20 (20%) (6%)Sustaining capital expenditure (221) (214) (276) (20%) 3%Movements in capital creditors 36 71 42 (14%) (49%)Sale of PP&E 17 1 8 113% 1600%Net interest (187) (551) (324) (42%) (66%)Tax paid (236) (150) (325) (27%) 57%Expansion capital expenditure (577) (504) (548) 5% 14%Dividend paid to equity shareholders 0 (113) (67) - -Dividend paid to non-controlling interests
(1,007) (21) (804) 25% 4695%
Tax on dividend from Group companies (161) (69) 133% -Acquisition of subsidiary 81 (788) (240) (134%) (110%)Other movements including F/X movements
(375) 490 (83) 352% (177%)
Reported FCF (98) (606) (569) (83%) (84%)Vedanta Resources Ltd (US$ mm) 2H19 1H19 2H18 y/y h/hGross debt 15,980 15,687 15,194 5% 2%- ST borrowings 5,456 4,708 5,460 (0%) 16%- LT borrowings 10,524 10,979 9,734 8% (4%)
Total cash 5,277 5,492 5,606 (6%) (4%)Net debt 10,703 10,195 9,588 12% 5%LHA gross leverage 4.7x 4.6x 3.3x 1.4x 0.2xLHA net leverage 3.2x 3.0x 2.1x 1.1x 0.2x

77
BC
P T
op P
icks/
10
/07
/20
19
Production Guidance FY20
• Zinc India production was expected to exceed 1 million ton in FY19
• Zinc International production was expected to double on Gamsberg ramp-up
• Oil & gas production was expected to increase 6% ~ 16% y/y
VEDLN 6.375% 22sMARKET UNDERPERFORM (INDIA):
Segment FY20 Guidance FY19 Production
Zinc India Mined Metal and Finished Metal: c 1.0 Mtpa 936 kt
Zinc InternationalSkorpion and BMM: >170kt
Gamsberg: 180 - 200ktSkorpion and BMM: 131kt
Gamsberg: 17kt
Oil & Gas Gross Volume: 200-220 kboepd 189 kboepd
AluminiumAlumina: 1.7-1.8 Mtpa
Aluminium: 1.9 1.95 MtpaAlumina: 1.5 Mtpa
Aluminium: 1.96 Mtpa
Power TSPL plant availability: >80% -
Iron OreKarnataka (WMT): 4.5 Mtpa
Goa: To be updated on re-start of operationsKarnataka (WMT): 4.1 Mtpa
Goa: 1.3 Mtpa
ESL Hot Metal c 1.5 Mtpa 1.2 Mpta
Copper - India To be updated on re-start of operations 90 kt
Copper - ZambiaIntegrated: 90 100kt
Custom: 90 - 100kt91 kt

78
BC
P T
op P
icks/
10
/07
/20
19
VEDLN 6.375% 22sMARKET UNDERPERFORM (INDIA):
1Q20, US$ mmVedanta Limited
Standalone
Copper Mines of Tasmania
Cairn India
Holdings Limited
Zinc India (HZL)
Zinc International
Bharat Aluminium (BALCO)
Talwandi Sabo
Vedanta Star
Limited
Electrosteels Steel Limited
OthersVedanta Ltd, Consolidated
Vedanta Ltd, Pro
Rata
Konkola Copper Mines (KCM)
Vedanta Resources
Ltd, standalone
Vedanta Resources Ltd, pro
rata
business
oil & gas, al, cu, iron ore, power,
copper India
copper International
oil & gasZinc India
Zinc International
al powermining services
electrosteelcu
Zambia
ownership 100% 100% 100% 65% 100% 51% 100% 100% 90% 100% 50.1% 79% 100%ReportedRevenue 1,111 116 210 700 118 261 236 114 159 18 3,043 227 0 EBITDA 156 (4) 122 349 18 7 54 16 28 (1) 746 (11) 0 Gross debt 5,820 0 3 60 657 1,289 489 305 8,622 150 6,256 Cash & equivalents 601 893 2,648 99 5 18 5 188 4,458 2 43 Net debt 5,219 0 (893) (2,646) (39) 652 1,271 484 0 116 4,164 148 6,213 LQA gross leverage 2.9xLQA net leverage 1.4x
Pro RataRevenue 1,111 116 210 454 118 133 236 114 143 18 2,654 179 0 1,509 EBITDA 156 (4) 122 227 18 3 54 16 25 (1) 617 (9) 0 301 Gross debt 5,820 2 60 335 1,289 489 305 8,299 119 6,256 10,532 Cash & equivalents 601 893 1,719 99 3 18 5 188 3,526 2 43 1,811 Net debt 5,219 (893) (1,717) (39) 333 1,271 484 116 4,773 117 6,213 8,721 LQA gross leverage 3.4x 8.8xLQA net leverage 1.9x 7.3x
y available debt levels at Resources, and taking 50.1% of VEDL net debt and EBITDA, we calculate net leverage at a high 7.3x levels at the issuer. We also highlight market value of Resources interest in VEDL has fallen to US$3.9bn.

79
BC
P T
op P
icks/
10
/07
/20
19
VEDLN 6.375% 22sMARKET UNDERPERFORM (INDIA):
Resources standalone debt is mostly comprised of the outstanding bonds and unsecured bank borrowings
Vedanta Resource Limited Consolidated Debt (US$MM) Mar-19 Vendanta Limited (VEDL) (US$ MM) Mar-19 Vendanta Resources Standalone (US$ MM) Mar-19
Banks and Financial Inst. 4,132 Banks and Financial Institutions 3,323 Banks and Financial Institutions 809
Current Maturities of LT Borrowings 1,324 Current Maturities Of LT Borrowings 1,232 Current Maturities Of LT Borrowings 92
ST Debt 5,456 ST Debt 4,555 ST Debt 901
Banks and Financial Inst. 6,585 Banks and Financial Inst. 4,112 Banks and Financial Inst. 2,473
Non-Convertible Bonds 3,142 Non-Convertible Bonds 18 Non-Convertible Bonds 3,124
Non-Convertible Debentures 2,034 Non-Convertible Debentures 2,034 Non-Convertible Debentures -
Other 87 Other 87 Other -
LT Debt 11,848 LT Debt 6,251 LT Debt 5,597
Total Debt 17,304 Total Debt 10,806 Total Debt 6,498
Secured Borrowing 6,547 Secured Borrowings 6,435 Secured Borrowings 112
Unsecured Borrowings 9,433 Unsecured Borrowings 3,140 Unsecured Borrowings 6,293

80
BC
P T
op P
icks/
10
/07
/20
19
VEDLN 6.375% 22sTHE EQUITY KNOWS
MARKET UNDERPERFORM (INDIA):
Vedanta Resources (PLC Standalone, US$MM)
FY 1H18 2H18 1H19 2H19 2H19 1Q20
as of Sep 2017 Mar 2018 Sep 2018 Mar 2019 Jul 2019 Aug 2019
Gross Debt 6,115 5,877 6,270 6,256 6,256 6,498
Cash 15 122 52 43 43 43
Net Debt 6,100 5,755 6,218 6,213 6,213 6,455
PLC EBITDA 0 0 0 0 0 0
Market Cap of VEDL 17,888 15,867 11,911 9,898 8,800 7,100
Vedanta Resources Ownership 50.1% 50.1% 50.1% 50.1% 50.1% 50.1%
Value of Interest in VEDL 8,962 7,949 5,967 4,959 4,409 3,557
Excess Value/(Deficit) vs. VEDL 2,862 2,194 (251) (1,254) (1,804) (2,898)
As a Percentage of Net Debt 47% 38% (4%) (20%) (29%) (45%)
Headline Net Leverage 2.7x 2.1x 3.0x 3.2x 3.2x 3.2x
Bond 2024 2024 2024 2024 2024 2024
YTM 5.83% 6.50% 8.55% 8.31% 8.00% 8.00%
PLC Interest Cost (6% avg) 367 353 376 375 375 390
Implied Divident Yield 4.1% 4.4% 6.3% 7.6% 8.5% 11.0%

81
BC
P T
op P
icks/
10
/07
/20
19
Cairn Re-Listing ?
• Recent reports suggested VEDL was exploring a re-listing of Cairn, a wholly-owned E&P subsidiary of VEDL, as an alternative to fund its massive capex plan that may reach US$2.9bn.
• We see re-listing Cairn as value for Resources, but think it highlights both the large capital needs of this key subsidiary and the limited value available to benefit bondholders
• Properly accounting for minority interest, we see LQA pro rata leverage through VEDLN of 7.2x, setting a high bar for any subsidiary sale or listing to be accretive or deleveraging.
• Our sensitivity analysis shows that, pro forma for a Cairn listing, Resources is likely to have higher pro rata net leverage, even assuming a generous 6x EBITDA multiple and 50% public holding
in Cairn as proceeds are directed to investment and minority interest increases.
• pro rata pro forma LQA net leverage would increase from 7.2x to 7.5x.
Analyzing a Cairn Listing:
• Cairn is an E&P subsidiary which last quarter generated US$122 mm of EBITDA and had a net cash position of US$893 mm
• The company has participated in recent exploration acreage auctions, accumulating approximately 50 of the 80 areas awarded
• Related capex is said to be at least US$600 mm over the next three years, perhaps expanding to US$2.9 bn for Cairn to achieve an ambitious target of doubling production.
• The after tax PV10 of existing Proven reserves is US$1.6 bn, according to SEC criteria
• We have a large universe of smaller E&Ps which trade at a discount to PV10 on at TEV basis.
• EBITDA multiples for this universe, which are often growing quickly, are quite modest
• Using run rate 1Q20 Cairn EBITDA, and assuming a very generous 6x EBITDA multiple, Cairn would be valued at a TEV of US$2.9 bn with a market cap of US$3.8 bn.
• These values are almost 2x the PV10 value of reserves and therefore do not appear immediately realistic
• If they were to sell 50% to the public at this lofty valuation to raise capital for investment:
• Cairn would have US$2.7 bn cash on the balance sheet
• LTD would then only own 50% of EBITDA and the cash balance
• On a pro rata basis, Cairn would lose US$244 mm of EBITDA and gain US$850 mm of pro rata cash balance (from US$450 increasing to US$1.4 bn)
• Optically, consolidated cash balance would increase (until the capex is deployed)
• However, LTD and HoldCo access to both EBITDA and cash balance would diminish and more than offset this improvement in leverage due to increased minority interest.
• Therefore pro rata leverage would increase at HoldCo while not providing any proceeds to deal with upcoming maturities
• VEDL share price action more accurately reflect our view that such a transaction would be neutral to value creation and liquidity.
VEDLN 6.375% 22sMARKET UNDERPERFORM (INDIA):

82
BC
P T
op P
icks/
10
/07
/20
19
DISCLAIMERDISCLOSURE APPENDIX
REGULATION AC - ANALYST CERTIFICATION
The following analysts certify that all of the views expressed in this report accurately reflect their respective personal vi ews about the subject securities and issuers. They also certify that no part of their respective compensation was, is, or will be, directly or indirectly, related to the specific recommendations or views expressed by them in this report: Ben Hough, Dr. Walter Molano Ph.D., Matias Castagnino CFA & Arturo Galindo.
COMPANY SPECIFIC DISCLOSURES
covered in BCP research. As a result, investors should be aware that BCP may have a conflict of interest that could affect the objectivity of this report. Further, BCP may trade the securities (or related derivatives) that are the subject of this research report for its own account and for certain customers, and may from time to maintain long or short positions in the securities (or in related derivatives) of the companies mentioned in this report. Such financial and trading interests may be contrary to any recommendation in the report.
clients and our proprietary trading desks that reflect opinions that are contrary to the opinions expressed in this research.
MEANINGS OF RATINGS
Top Picks Universe
Broad Diversified High-Yield Index over the next 3 6 months.
-Yield Index over the next 3 6 months.
-Yield Index over the next 3 6 months.
he CEMBI Broad Diversified High-Yield Index over the next 3 6 months.

83
BC
P T
op P
icks/
10
/07
/20
19
DISCLAIMER (CONTINUED)Quasi Sovereign Universe
The spread of the bond to its similarly duration sovereign controller bond is expected to decrease over the next 3 6 months.
The spread of the bond to its similarly duration sovereign controller bond is expected to remain unchanged over the next 3 6 months.
The spread of the bond to its similarly duration sovereign controller bond is expected to increase over the next 3 6 months.
ration sovereign controller bond over the next 3 6 months.
High Octane UniverseBonds that in our view have an equity investment risk profile and we think risk/return is significantly skewed to the upside
Bonds that in our view have an equity investment risk profile and we think risk/return is skewed to the upside
Bonds that in our view have an equity investment risk profile and we think risk/return is balanced
Bonds that in our view have an equity investment risk profile and we think risk/return is skewed to the downside
Bonds that in our view have an equity investment risk profile and we think risk/return is significantly skewed to the downside
GENERAL RESEARCH DISCLOSURES AND DISCLAIMERS
This report is intended only for institutional investors, and should not be redistributed to retail investors. BCP research is not a solicitation or offer to buy or sell any security or financial instrument or to participate in any trading strategy. The products mentioned in this report may not be eligible for sale in some states or countries.
The analysts principally responsible for the preparation of BCP research receive compensation based upon various factors, including quality, accuracy and value of research, firm profitability or revenues (including overall investment banking revenues), client feedback and competitive factors. The compensation of BCP analysts is not linked to specific investment banking or capital markets transactions by BCP. Analysts employed by non-U.S. affiliates may not be registered with FINRA, may not be associated persons of BCP, and may not be subject to FINRA regulations regarding research related activities.

84
BC
P T
op P
icks/
10
/07
/20
19
DISCLAIMER (CONTINUED)BCP research is based on public information. BCP makes every effort to use reliable, comprehensive information, but makes no representation that the information is accurate or complete. Facts and views presented in BCP research have not been reviewed by, and may not reflect information known to, professionals in other BCP business areas, including investment banking personnel. BCP analysts may interact with sales and trading desk personnel in connection with their research, including to ascertain pricing and liquidity in the fixed income markets.
This report has been prepared independently of any issuer of securities mentioned herein and not in connection with any proposed offering of securities or as agent of any issuer of any securities. BCP has no authority to make any representation or warranty on behalf of the issuers. BCP policy prohibits research personnel from disclosing a recommendation, investment rating, or investment thesis for review by an issuer prior to the publication of a research report containing such rating, recommendation or investment thesis.
BCP may update its research reports and ratings as it deems appropriate, but has no obligation to do so. BCP has no obligation to inform clients of any changes in facts, assumptions, opinions, estimates, or ratings. Certain outstanding reports may contain discussions and/or investment options relating to securities, financial instruments and/or issuers that are no longer current. Neither BCP nor any officer or employee of BCP accepts any liability whatsoever for any direct, indirect or consequently damages or losses arising from any use of this report or its contents.
BCP research and ratings should not be used or relied upon as investment advice. BCP research does not provide individually tailored investment advice. BCP research has been prepared without regard to the circumstances and objectives of those who receive it. BCP recommends that investors independently evaluate particular investments and strategies, and encourages investors to seek the advice of a financial adviser. Investors should consider this report as only a single factor in
es and objectives. The securities, instruments, or strategies discussed in BCP research may not be suitable for all investors, and certain investors may not be eligible to purchase or participate in some or all of them. Securities discussed in this report may be rated below investment grade and should therefore only be considered for inclusion in accounts qualified for speculative investment.
The value of and income from your investments may vary because of changes in interest rates, foreign exchange rates, default rates, prepayment rates, prices, market indexes, operational or financial conditions of companies or other factors. Past performance is not necessarily a guide to future performance. Estimates of future performance are based on assumptions that may not be realized. Investors may experience a loss of their original capital investment in such securities.
International investing entails greater risk, as well as greater potential rewards compared to U.S. investing. These risks include political and economic uncertainties of foreign countries as well as the risk of currency fluctuations. These risks are magnified in countries with emerging markets, since these countries may have relatively unstable governments and less established markets and economies.
Bonds are subject to interest rate risk. When interest rates rise, bond prices fall; generally the longer a bond's maturity, the more sensitive it is to this risk. Bonds may also be subject to call risk, which is the risk that the issuer will redeem the debt at its option, fully or partially, before the scheduled maturity date.

85
BC
P T
op P
icks/
10
/07
/20
19
DISCLAIMER (CONTINUED)The market value of debt instruments may fluctuate, and proceeds from sales prior to maturity may be more or less than the amount originally invested or the maturity value due to changes in market conditions or changes in the credit quality of the issuer. Bonds are subject to the credit risk of the issuer. This is the risk that the issuer might be unable to make interest and/or principal payments on a timely basis. Bonds are also subject to reinvestment risk, which is the risk that principal and/or interest payments from a given investment may be reinvested at a lower interest rate. Bonds rated below investment grade may have speculative characteristics and present significant risks beyond those of other securities, including greater credit risk and price volatility in the secondary market.
INTERNATIONAL DISCLOSURES
Singapore: This report is distributed in Singapore by BCP Securities Asia Pte Ltd to accredited investors, expert investors or institutional investors only (as defined in the applicable Singapore laws and regulations and is not intended to be distributed directly or indirectly to any other class of person). Recipients of this report in Singapore are to contact BCP Securities Asia Pte Ltd in respect of any matters arising from, or in connection with, this report. BCP Securities Asia Pte Ltd is registered with the Accounting and Corporate Regulatory Authority.
Spain: The report is distributed in Spain by BCP European Agencia de Valores, S.A., supervised by the Spanish Securities Markets Commission (CNMV), and is written and distributed in accordance with rules of conduct for financial research under Spanish regulations. This report is only intended for persons who are Eligible Counterparties or Professional Clients within the meaning of Article 78bis and Article 78ter of the Spanish Securities Market Act. It is not intended to be distributed or passed on, directly or indirectly, to any other class of persons. There is no obligation to register or file any report and any supplemental documentation or information with the CNMV. Neither verification nor authorization or compliance revision by the CNMV regarding this document and related documentation or information needs to be fulfilled in accordance with the Spanish Securities Market Act.
Brazil: This report is distributed in Brazil by BCP Securities Brazil (RJ) in accordance with applicable regulations. No approval is required for publication or distribution of this report in Brazil. The views expressed above accurately reflect personal views of the authors about the subject companies and their securities. The compensation of the equity research analyst(s) is indirectly affected by revenues deriving from the business and financial transactions of BCP. Where a Brazil based analyst has taken part in the preparation of this research report, the Brazil based analyst whose name appears first assumes primary responsibility for its content from a Brazilian regulatory perspective and for its compliance with CVM Instruction 483.
COPYRIGHT AND USER AGREEMENT
Copyright 2019 BCP Securities, LLC. All rights reserved. This research report is prepared for the use of BCP clients and may not be redistributed, retransmitted or disclosed, in whole or in party, or in any form or manner, without the express written consent of BCP. Any unauthorized use or disclosure is prohibited. Receipt and review of this research report constitutes your agreement not to redistribute, retransmit, or disclose to others the contents, opinions, conclusions, or information contained in this report (including any investment recommendations, estimates or price targets) without first obtaining expressed permission from an authorized officer of BCP.

86
BC
P T
op P
icks/
10
/07
/20
19
GENERAL RESEARCH DISCLOSURES AND DISCLAIMERS
This report is intended only for institutional investors, and should not be redistributed to retail investors. BCP research is not a solicitation or offer to buy or sell anysecurity or financial instrument or to participate in any trading strategy. The products mentioned in this report may not be eligible for sale in some states or countries.
The analysts principally responsible for the preparation of BCP research receive compensation based upon various factors, including quality, accuracy and value ofresearch, firm profitability or revenues (including overall investment banking revenues), client feedback and competitive factors. The compensation of BCP analysts is notlinked to specific investment banking or capital markets transactions by BCP. Analysts employed by non-U.S. affiliates may not be registered with FINRA, may not beassociated persons of BCP, and may not be subject to FINRA regulations regarding research related activities.
BCP research is based on public information. BCP makes every effort to use reliable, comprehensive information, but makes no representation that the information isaccurate or complete. Facts and views presented in BCP research have not been reviewed by, and may not reflect information known to, professionals in other BCPbusiness areas, including investment banking personnel. BCP analysts may interact with sales and trading desk personnel in connection with their research, including toascertain pricing and liquidity in the fixed income markets.
Brazil: This report is distributed in Brazil by BCP Securities Brazil (RJ) in accordance with applicable regulations. No approval is required for publication or distributionof this report in Brazil. The views expressed above accurately reflect personal views of the authors about the subject companies and their securities. The compensation ofthe equity research analyst(s) is indirectly affected by revenues deriving from the business and financial transactions of BCP. Where a Brazil based analyst has taken partin the preparation of this research report, the Brazil based analyst whose name appears first assumes primary responsibility for its content from a Brazilian regulatoryperspective and for its compliance with CVM Instruction 483.
COPYRIGHT AND USER AGREEMENT
Copyright 2019 BCP Securities, LLC. All rights reserved. This research report is prepared for the use of BCP clients and may not be redistributed, retransmittedor disclosed, in whole or in party, or in any form or manner, without the express written consent of BCP. Any unauthorized use or disclosure is prohibited.Receipt and review of this research report constitutes your agreement not to redistribute, retransmit, or disclose to others the contents, opinions, conclusions, orinformation contained in this report (including any investment recommendations, estimates or price targets) without first obtaining expressed permission froman authorized officer of BCP.

87
BC
P T
op P
icks/
10
/07
/20
19
GREENWICH, CT +1-203-629-2181 / MIAMI, FL +1-305-358-6445 / LOS ANGELES, CA +1-424-210-8466 / MADRID +34-91-310-
6980 / MEXICO +52-55-5025-5500 / RIO DE JANEIRO +55-21-2227-4160 / SINGAPORE +65-6225-3171
87
BC
P T
op P
icks/
07
/08
/20
19