economic performance of state-owned enterprises in
TRANSCRIPT
February 2020
Economic performance of state-owned enterprises in emerging economies A cross-country study

The contents of this publication reflect the opinions of the individual authors, Sanja Borkovic and Peter Tabak, and do not necessarily reflect the views of the European Bank for Reconstruction and Development (EBRD).
Sanja Borkovic is an Associate Economist and Peter Tabak is a Regional Lead Economist at the EBRD.
All charts in this report use authors’ calculations based on the Orbis database (published by Bureau van Dijk, a Moody’s Analytics company)

In general, the private sector has been growing as a share of the economy in countries where the European Bank for Reconstruction and Development (EBRD) invests. However, state ownership remains prevalent in many sectors and, in some countries, has even increased (in Hungary, Poland and Turkey, for example). What is more, many larger-scale privatisation plans have stalled, been delayed or been very slow to implement. The share of state ownership was an important measure of economic transition in the 1990s, but is now less closely followed. This study aims to put the metric back on the radar by looking at non-financial state-owned enterprises (SOEs) in 25 of the economies where the EBRD invests. In addition to measuring the size of each country’s state-run sector, it will assess its performance in terms of profitability, liquidity and indebtedness. Our research shows that, almost three decades since the start of transition, there are still quite a few countries with a large state-owned footprint and/or in need of improvement in the state-owned sector in areas from corporate governance to financial management.
Abstract
Economic performance of state-owned enterprises in emerging economies: A cross-country study February 2020 1

2 February 2020 Economic performance of state-owned enterprises in emerging economies: A cross-country study
Abstract 1
Introduction 4
Country, time and SOE coverage 5
Data sources 6
Indicators observed 7
Data limitations and cleaning 8
Results 9 Overview of the state sector 9 Sector size 10 Employment 13 Liquidity 14 Profitability 15 Indebtedness 17
SOEs by sector 20
Utilities 20 Transport 22 Manufacturing 24
Potential future work 26
Conclusions 27
References 28
Annex 1 29
Annex 2 30
Acronyms 31
Contents
Economic performance of state-owned enterprises in emerging economies: A cross-country study February 2020 3

0
10
20
30
40
50
60
70
80
100
Mid-2010 Mid-1994
Turk
men
ista
n
Bela
rus
Uzbe
kist
an
Tajik
ista
n
Ukra
ine
Serb
ia
Bosn
ia a
nd H
erz.
Russ
ia
Mon
tene
gro
Mol
dova
Kaza
khst
an
Turk
ey
Slov
enia
Rom
ania
Latv
ia
North
Mac
edon
ia
Croa
tia
Pola
nd
Mon
golia
Lith
uani
a
Kyrg
yz R
epub
lic
Geor
gia
Bulg
aria
Azer
baija
n
Arm
enia
Alba
nia
Slov
ak R
epub
lic
Hung
ary
Esto
nia
Introduction
The share of state ownership was an important measure of economic transition in the 1990s, but is now less closely followed. Although, in general, the private sector has been growing as a share of the economy in countries where the EBRD invests, state ownership remains prevalent in many sectors and has even been increasing in some countries such as Hungary, Poland and Turkey. What is more, many larger-scale privatisation plans have stalled, been delayed or been very slow to implement (for example, in Cyprus, Kazakhstan, Slovenia and Ukraine).
Measuring the size, scope and effectiveness or efficiency of state ownership is still important. EBRD diagnostic studies of Croatia, Serbia and Slovenia, for instance, have uncovered many areas ripe for improvement, from corporate governance to financial management. The large footprint and low efficiency of state-owned enterprises (SOEs) can
also have significant and various negative effects on the private sector. SOEs can have unfair competitive advantage from subsidies, get away with providing low-quality services to private customers, or create financial problems for suppliers by not paying bills on time.
The aim of this study is to provide a much-needed snapshot of state ownership in economies where the EBRD invests and to identify those countries and sectors that most need to improve SOE performance.
Chart 1. Private-sector share of GDP (per cent)
Source: EBRD Transition Report 1994 and Transition Report 2010 - Recovery and Reform.
4 February 2020 Economic performance of state-owned enterprises in emerging economies: A cross-country study

The survey sample for our study was limited to 25 of the 38 economies in which the EBRD invests, largely due to the (un)availability of data. While the survey covered Europe quite extensively, the focus in Central Asia and the southern and eastern Mediterranean (SEMED) region was on the largest economies.
• Central Europe and the Baltic states: Croatia, Estonia, Hungary, Latvia, Lithuania, Poland, Slovak Republic, Slovenia
• South-eastern Europe: Albania, Bosnia and Herzegovina, Bulgaria, Cyprus, North Macedonia, Greece, Kosovo, Montenegro, Romania, Serbia
• Eastern Europe and the Caucasus: Belarus, Georgia, Moldova, Ukraine
• SEMED: Egypt
• Central Asia: Kazakhstan
• Turkey
The state-owned sectors of some countries were deemed insufficiently representative, however. Representativeness was judged on the availability of asset data, typically the most widely available indicator. While some countries had a relatively high number of SOEs listed in the Orbis database (published by Bureau van Dijk (BvD), a Moody’s Analytics company), five (Albania, Belarus, Cyprus, Egypt and Georgia) had asset data for fewer than 10 per cent of their SOEs for the period under review. They were consequently deemed insufficiently representative.1 These countries (and others) were omitted from results calculations, effectively reducing the sample to 20 countries (or fewer, depending on the availability of data on a particular indicator).
The study analysed the performance of non-financial companies in which state ownership exceeded 25 per cent. We included minority state ownership (25-50 per cent), as governments can still wield significant influence over the operations of these enterprises, for example, by introducing regulations benefiting the companies in question or blocking certain decisions. Financial companies were not included due to the distortions that could arise from their sizeable leverage (especially banks and insurance companies) compared with non-financial firms and the different nature of their operations.
We included SOEs owned both by the state and sub-sovereign entities (regions, municipalities). Centrally and locally owned SOEs were bundled together, as Orbis’s SOE identification criteria do not facilitate automatic separation. Overall, the sample comprised around 17,600 SOEs.2
Our analysis focused on 2014 to 2016. Data availability analysis for 2008-16 showed significant variation over time in the number of companies for which certain indicator data were available (for most countries, for example, asset data were quite limited for 2008-09, but far more available for 2014-15). This is why, when considering a time-series analysis, attention must be paid to the underlying number of SOEs for which data are available in the years in question. We chose the more recent 2014-16 period for the purposes of this report.
Country, time and SOE coverage
1 Georgia stood out, with around 4,350 SOEs recognised by Orbis,
but no available asset data.
2 The average number of SOEs with data on assets for at least one
year in the 2008-16 period.
Economic performance of state-owned enterprises in emerging economies: A cross-country study February 2020 5
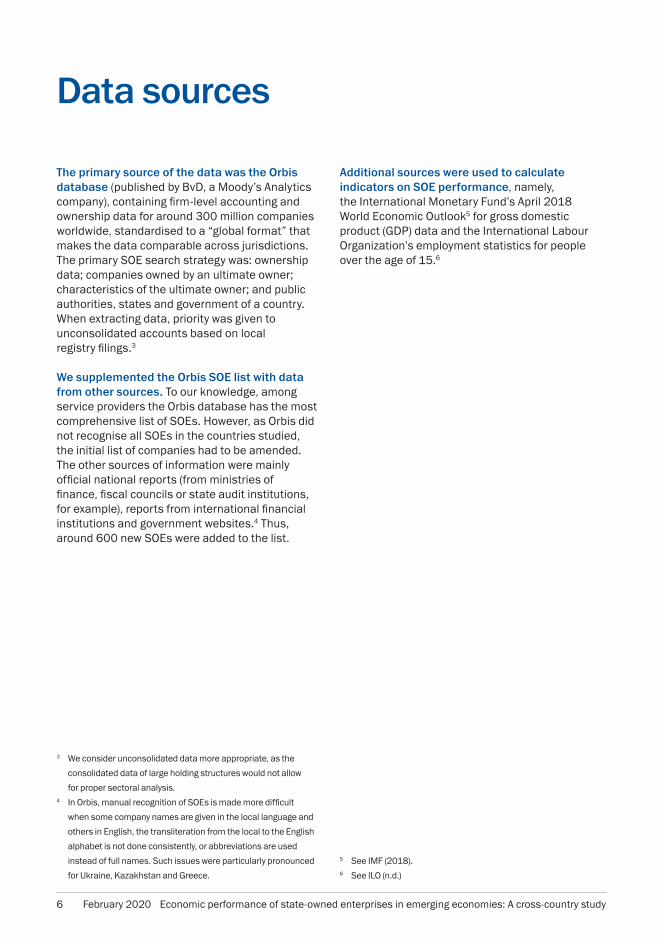
The primary source of the data was the Orbis database (published by BvD, a Moody’s Analytics company), containing firm-level accounting and ownership data for around 300 million companies worldwide, standardised to a “global format” that makes the data comparable across jurisdictions. The primary SOE search strategy was: ownership data; companies owned by an ultimate owner; characteristics of the ultimate owner; and public authorities, states and government of a country. When extracting data, priority was given to unconsolidated accounts based on local registry filings.3
We supplemented the Orbis SOE list with data from other sources. To our knowledge, among service providers the Orbis database has the most comprehensive list of SOEs. However, as Orbis did not recognise all SOEs in the countries studied, the initial list of companies had to be amended. The other sources of information were mainly official national reports (from ministries of finance, fiscal councils or state audit institutions, for example), reports from international financial institutions and government websites.4 Thus, around 600 new SOEs were added to the list.
Additional sources were used to calculate indicators on SOE performance, namely, the International Monetary Fund’s April 2018 World Economic Outlook5 for gross domestic product (GDP) data and the International Labour Organization’s employment statistics for people over the age of 15.6
Data sources
3 We consider unconsolidated data more appropriate, as the
consolidated data of large holding structures would not allow
for proper sectoral analysis.4 In Orbis, manual recognition of SOEs is made more difficult
when some company names are given in the local language and
others in English, the transliteration from the local to the English
alphabet is not done consistently, or abbreviations are used
instead of full names. Such issues were particularly pronounced
for Ukraine, Kazakhstan and Greece.
5 See IMF (2018).6 See ILO (n.d.)
6 February 2020 Economic performance of state-owned enterprises in emerging economies: A cross-country study

Indicators observedIndicators observed
SOE size and performance were gauged based on 22 indicators. Definitions of these diverse indicators are available in Annex 1. They can be grouped into six clusters:
1.Overview of the
state sector (number of SOEs, value added
as a percentage of GDP, percentage of listed SOEs)
2.Sector size
(assets, revenues, shareholders’ funds, share of assets of top 10 companies,
five largest SOEs’ share of total SOE assets)
3.Employment
(percentage of total employment, cost of
employees)
4.Liquidity
(ratio, credit days, collection days)
5.Profitability
(profit/loss, return on assets (ROA), return on equity (ROE))
6.Indebtedness
(financial debt, ratio of financial debt to earnings before
interest, tax, depreciation and amortisation (EBITDA), total debt,
ratio of debt to equity, share of long-term liabilities, implied
interest rate)
The financial data of all firms were observed in US dollars.
Indicators observed
Economic performance of state-owned enterprises in emerging economies: A cross-country study February 2020 7

Despite the highly comprehensive nature of the Orbis database, it has several limitations, which can be summarised as follows:
• Some SOEs are not identified as such or missing.
• There is a total absence of data on certain SOEs.
• There is a lack of data on certain indicators:
– no Belarusian or Georgian data on SOE assets; no Turkish data on number of employees; no data on credit periods for SOEs of North Macedonia
– more than half of (the nearly 40,000) SOEs in the database lack data for most indicators in most years
– peculiarities by country: Moldova has 2-3 times more SOEs with asset data in 2012 and 2014 than in other years, while many Egyptian SOEs have data on employees or revenues for only one year.
• There are potential inconsistencies in data for certain indicators:
– in Estonia, the 2011-16 credit period for many companies was cut to 0-1 day
– for some SOEs in the Slovak Republic, the same number of employees was repeated for several years in a row.
• Certain data are suspicious:
– dubious data: negative values for balance- sheet or profit-and-loss account items (such as assets, revenue and financial debt)
– outliers: overly high values for some indicators (for example, data on implied interest rates might show distortions due to large write-downs of financial assets, which were entered as financial expenses alongside interest charges).
• There were changes in SOE ID numbers after initial data downloads, making subsequent updates more challenging, notably in:
– Greece and Kazakhstan.
Data issues were alleviated by quality checks and data-cleaning procedures. Suspicious data were dropped from our calculations, usually by limiting floor or ceiling values, as we note in those sections that delve into the indicators in more detail. In addition, weighted averages were calculated wherever appropriate (mostly for liquidity, profitability and indebtedness ratios) to increase the relative importance of larger companies.
Still, caution is needed when interpreting the results. Complete time series for all indicators over the 2008-16 period were available for just 260 SOEs in eight countries. The remaining SOEs had at least one year of data missing, meaning that the consistency of some time series may be an issue. That was particularly the case with data on value added, the ratio of financial debt to EBITDA, and implied interest costs. Also, as only current owners of companies were listed, the sample may be less representative historically, especially if there were major privatisations in the meantime (for example, Poland in 2008-11). For similar reasons, data on nationalised companies prior to nationalisation (when they were still private) could not be automatically excluded; this had to be done manually when information on nationalisation was obtained (for example, Hungarian MAL Zrt in 2010).
The results in the following section are based on data available as of end November 2018.7
Data limitations and cleaning
7 The cut-off date for data from Orbis was 21 July 2018, except for
60 or so SOEs that were added between then and at the end of
November 2018.
8 February 2020 Economic performance of state-owned enterprises in emerging economies: A cross-country study

0 1000 2000 3000 4000 5000 6000 7000 8000
KosovoTurkey
MontenegroMoldova
LithuaniaBosnia and Herz.
GreeceNorth Macedonia
KazakhstanEstonia
HungarySlovak Republic
SloveniaLatvia
CroatiaSerbia
BulgariaRomania
PolandUkraine
(2016)
*With data on assets
0
1
2
3
4
5
6
Pola
nd
Rom
ania
Hung
ary
North
Mac
edon
ia
Bulg
aria
Slov
enia
Serb
ia
Slov
ak R
epub
lic
Croa
tia
Mon
tene
gro
(Percentage of GDP; 2014-16)
Results8
Chart 2. Number of SOEs* Chart 3. Value added
8 Weighted averages are reported for shareholders’ funds,
employee costs, liquidity and profitability indicators, debt to equity,
long-term to total liabilities, implied interest rates and financial
debt to EBITDA. The data are weighted by firm assets. 9 The average number of SOEs with data on assets in 2014-16.
Crimean SOEs were included in Ukrainian SOE listings until 2013.
10 Charts 2-39 in this report use authors’ calculations based on the
Orbis database (published by Bureau van Dijk (BvD), a Moody’s
Analytics company).11 Value added was calculated as the sum of profit/loss and the
cost of employees where both sets of data were available for a
company in a given year.12 For at least 80 per cent of SOEs with data on assets in
2014-16.
Overview of the state sector
The number of SOEs analysed ranged from 20 in Kosovo to around 8,000 in Ukraine.9 As Ukraine is the largest country in the sample, it unsurprisingly boasts the greatest number of SOEs. The majority are sub-sovereign companies, while the rest (around 2,500) are centrally owned. Almost 90 per cent of the SOEs examined for this study are majority owned by the state. The only country where the state predominantly holds minority stakes (two-thirds of the total) is Greece.
SOEs in Montenegro seem to add the most value. However, this should be treated with caution due to the significant lack of data available. Overall, time series on value added11 were some of the least complete series. Data were available for a sufficient share of companies12 in fewer than half of the countries studied. Among those, Montenegrin SOEs created the most value added, at 5.5 per cent of GDP. By way of comparison, the value added of Polish SOEs was 1.5 per cent of GDP.
Source: Authors’ calculations based on the Orbis database.10 Source: Authors’ calculations based on the Orbis database.10
Economic performance of state-owned enterprises in emerging economies: A cross-country study February 2020 9

0
5
10
15
20
25
30
35
40
45
Koso
voLa
tvia
Esto
nia
Bulg
aria
Slov
ak R
epub
licUk
rain
ePo
land
Hung
ary
Turk
eySl
oven
iaKa
zakh
stan
Rom
ania
Gree
ce
North
Mac
edon
iaCr
oatia
Lith
uani
aSe
rbia
Mol
dova
Mon
tene
gro
Bosn
ia a
nd H
erz.
(Percentage of all SOEs, 2016)
Sector size
Based on asset size, the SOE sector is smallest in Turkey and largest in Montenegro and Ukraine. While Turkey’s SOE assets accounted for only 7 per cent of GDP in 2014-16, in Montenegro and Ukraine that figure was around 100 per cent.14 Overall, the average size of the state-owned sector is around 47 per cent of GDP. Two other countries of the former Yugoslavia (Serbia and Croatia) ranked highly in this regard — unsurprising, considering that their transition started later due to the break-up of Yugoslavia and the civil war in the 1990s. In contrast, Turkey abandoned its planned economy and state-dominated corporations in the early 1980s, which may explain the state’s relatively smaller share of GDP. However, the size of the SOE sector in Turkey may have increased considerably since 2016, as the government expropriated a number of companies belonging to businessmen facing terrorism charges after July 2016.
14 Negative values on assets were omitted from calculations.
Results (continued)
Bosnia and Herzegovina has the largest percentage of listed SOEs. Somewhat surprisingly, listed SOEs are not that common in the more developed central and eastern European economies, unlike the relatively less developed and smaller countries. Bosnia and Herzegovina ranks first, with one in three SOEs listed. However, this is mostly the result of a mass privatisation programme in the late-1990s, when two stock exchanges were established to enable citizens to invest in their national enterprises. In reality, the exchanges are illiquid and very few companies use them to raise capital. Furthermore, most of the listed companies are too small to efficiently use the stock exchange to raise capital.13
Chart 4. Listed SOEs
13 See World Bank (2015).
Source: Authors’ calculations based on the Orbis database.10
10 February 2020 Economic performance of state-owned enterprises in emerging economies: A cross-country study
0
20
40
60
80
100
120
Turk
eyM
oldo
vaKo
sovo
Rom
ania
Hung
ary
Lith
uani
aBu
lgar
iaPo
land
Kaza
khst
anLa
tvia
North
Mac
edon
iaGr
eece
Esto
nia
Bosn
ia a
nd H
erz.
Slov
enia
Slov
ak R
epub
licCr
oatia
Serb
iaUk
rain
eM
onte
negr
o
(Percentage of GDP)
2016 2014
0
10
20
30
40
50
60
70
80
90
(Percentage of assets; 2016)
Pola
ndRo
man
iaLa
tvia
Slov
enia
Bulg
aria
Mol
dova
Kaza
khst
anSl
ovak
Rep
ublic
Lith
uani
aSe
rbia
Bosn
ia a
nd H
erz.
Hung
ary
Gree
ceCr
oatia
Esto
nia
Mon
tene
gro
Turk
eyNo
rth M
aced
onia
Ukra
ine
Koso
vo
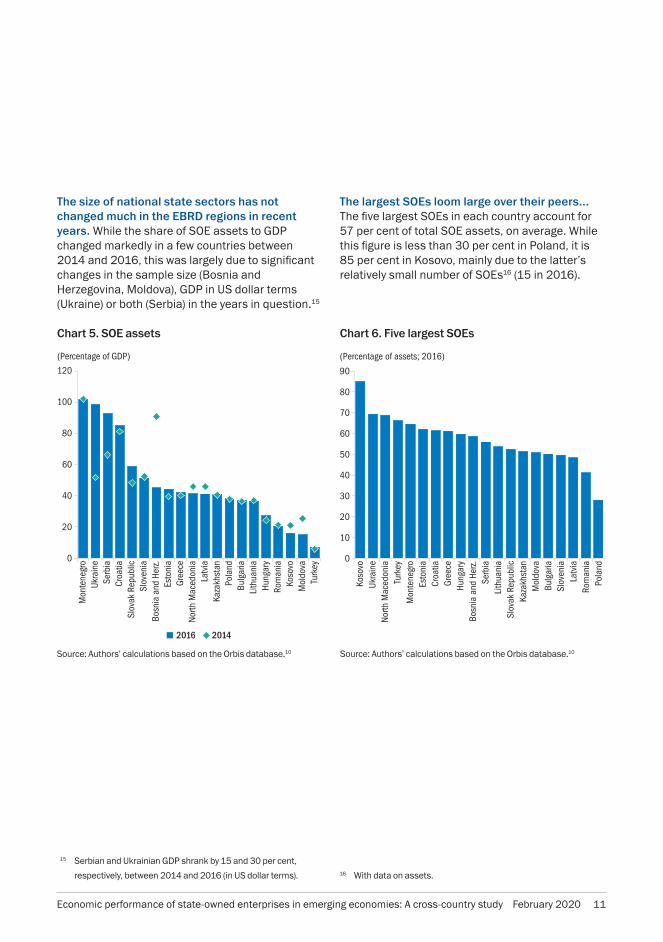
The size of national state sectors has not changed much in the EBRD regions in recent years. While the share of SOE assets to GDP changed markedly in a few countries between 2014 and 2016, this was largely due to significant changes in the sample size (Bosnia and Herzegovina, Moldova), GDP in US dollar terms (Ukraine) or both (Serbia) in the years in question.15
Chart 5. SOE assets
15 Serbian and Ukrainian GDP shrank by 15 and 30 per cent,
respectively, between 2014 and 2016 (in US dollar terms).
The largest SOEs loom large over their peers... The five largest SOEs in each country account for 57 per cent of total SOE assets, on average. While this figure is less than 30 per cent in Poland, it is 85 per cent in Kosovo, mainly due to the latter’s relatively small number of SOEs16 (15 in 2016).
Chart 6. Five largest SOEs
16 With data on assets.
Source: Authors’ calculations based on the Orbis database.10 Source: Authors’ calculations based on the Orbis database.10
Economic performance of state-owned enterprises in emerging economies: A cross-country study February 2020 11
0
10
20
30
40
50
60
70
80
90
Turk
eyM
oldo
vaKo
sovo
Rom
ania
Hung
ary
Gree
ceBu
lgar
iaKa
zakh
stan
Latv
iaPo
land
Esto
nia
North
Mac
edon
iaSl
oven
iaBo
snia
and
Her
z.Li
thua
nia
Slov
ak R
epub
licSe
rbia
Croa
tiaUk
rain
eM
onte
negr
o(Percentage of GDP)
2016 2014
(Percentage of assets; 2016)
0
10
20
30
40
50
60
70
80
90
Turk
eyM
oldo
vaM
onte
negr
oHu
ngar
ySl
ovak
Rep
ublic
Gree
ceBo
snia
and
Her
z.Ko
sovo
Rom
ania
Bulg
aria
North
Mac
edon
iaEs
toni
aSl
oven
iaLi
thua
nia
Serb
iaKa
zakh
stan
Croa
tiaLa
tvia
Ukra
ine
Pola
nd
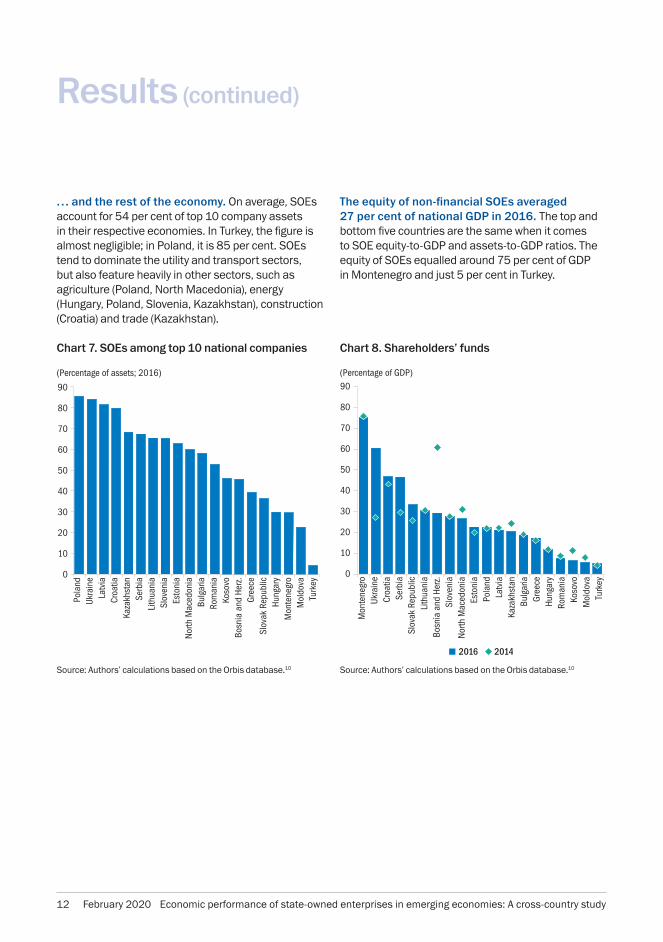
The equity of non-financial SOEs averaged 27 per cent of national GDP in 2016. The top and bottom five countries are the same when it comes to SOE equity-to-GDP and assets-to-GDP ratios. The equity of SOEs equalled around 75 per cent of GDP in Montenegro and just 5 per cent in Turkey.
Chart 8. Shareholders’ fundsChart 7. SOEs among top 10 national companies
… and the rest of the economy. On average, SOEs account for 54 per cent of top 10 company assets in their respective economies. In Turkey, the figure is almost negligible; in Poland, it is 85 per cent. SOEs tend to dominate the utility and transport sectors, but also feature heavily in other sectors, such as agriculture (Poland, North Macedonia), energy (Hungary, Poland, Slovenia, Kazakhstan), construction (Croatia) and trade (Kazakhstan).
Results (continued)
Source: Authors’ calculations based on the Orbis database.10Source: Authors’ calculations based on the Orbis database.10
12 February 2020 Economic performance of state-owned enterprises in emerging economies: A cross-country study

0
5
10
15
20
25
30
35
40
Turk
eyKo
sovo
North
Mac
edon
iaRo
man
iaLi
thua
nia
Esto
nia
Mol
dova
Slov
ak R
epub
licKa
zakh
stan
Bulg
aria
Bosn
ia a
nd H
erz.
Gree
ceLa
tvia
Hung
ary
Mon
tene
gro
Serb
iaCr
oatia
Pola
ndUk
rain
eSl
oven
ia
(Percentage of GDP; 2014-16)
0123456789
10111213141516
Gree
ce
Mol
dova
Kaza
khst
an
Rom
ania
Esto
nia
Hung
ary
Slov
ak R
epub
lic
North
Mac
edon
ia
Lith
uani
a
Slov
enia
Croa
tia
Koso
vo
Mon
tene
gro
Serb
ia
Ukra
ine
Latv
ia
Bulg
aria
(Percentage of total national employment)
2016 2014
SOEs generate revenues of around 15 per cent of GDP. The scale of revenues to GDP ranges from 5 per cent in Kosovo to 33 per cent in Slovenia. In general, most revenues come from SOEs in the utility and transport sectors.
Chart 9. Revenues
Employment
Non-financial SOEs account for 5 per cent of total employment, on average. Their contribution varies from 2 per cent in Greece to more than 14 per cent in Bulgaria.17 While some economies (Kosovo, North Macedonia and Moldova, for example) saw this share change significantly between 2014 and 2016, this was primarily down to changes in the number of companies providing employee data.
Chart 10. SOE employment
17 Poland and Bosnia and Herzegovina were excluded from
calculations as significantly fewer SOEs posted employee data
in 2016 than in previous years, while Turkey was omitted due to
lack of data.
Source: Authors’ calculations based on the Orbis database.10 Source: Authors’ calculations based on the Orbis database.10
Economic performance of state-owned enterprises in emerging economies: A cross-country study February 2020 13
0
1
2
3
4
5
Serb
iaM
oldo
vaNo
rth M
aced
onia
Hung
ary
Ukra
ine
Croa
tiaPo
land
Bosn
ia a
nd H
erz.
Slov
enia
Latv
iaBu
lgar
iaGr
eece
Mon
tene
gro
Slov
ak R
epub
licTu
rkey
Lith
uani
aKo
sovo
Rom
ania
Kaza
khst
anEs
toni
a
(2016)
0
5
10
15
20
25
30
35
40
45
Latv
ia
Esto
nia
Hung
ary
Slov
enia
Ukra
ine
Slov
ak R
epub
lic
Pola
nd
Croa
tia
Rom
ania
Bulg
aria
Serb
ia
Bosn
ia a
nd H
erz.
Mon
tene
gro
North
Mac
edon
ia
(Percentage of total revenue; 2014-16)
Liquidity
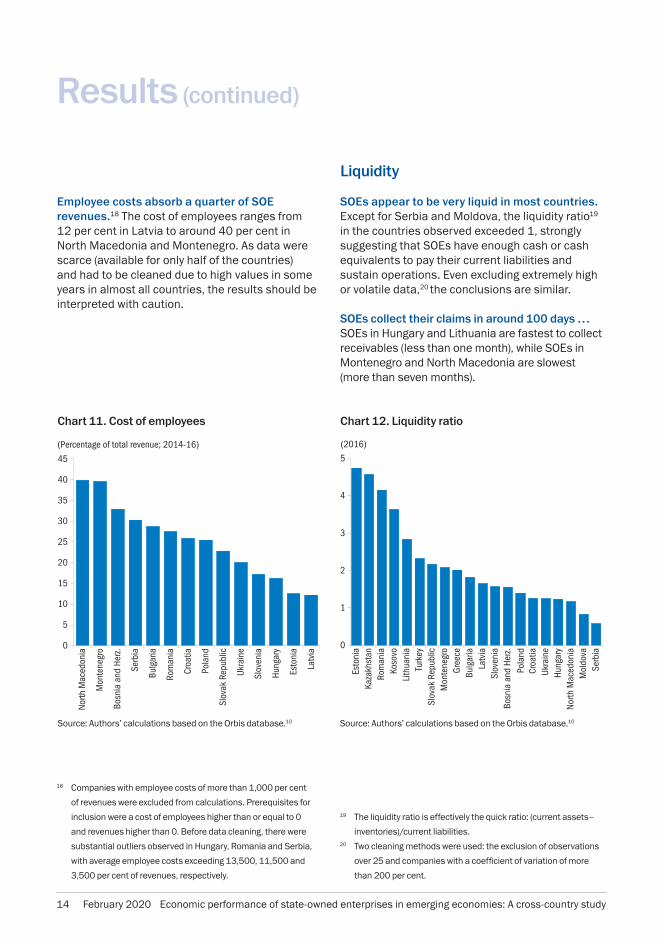
SOEs appear to be very liquid in most countries. Except for Serbia and Moldova, the liquidity ratio19 in the countries observed exceeded 1, strongly suggesting that SOEs have enough cash or cash equivalents to pay their current liabilities and sustain operations. Even excluding extremely high or volatile data,20 the conclusions are similar.
SOEs collect their claims in around 100 days … SOEs in Hungary and Lithuania are fastest to collect receivables (less than one month), while SOEs in Montenegro and North Macedonia are slowest (more than seven months).
Chart 12. Liquidity ratio
19 The liquidity ratio is effectively the quick ratio: (current assets–
inventories)/current liabilities.20 Two cleaning methods were used: the exclusion of observations
over 25 and companies with a coefficient of variation of more
than 200 per cent.
Employee costs absorb a quarter of SOE revenues.18 The cost of employees ranges from 12 per cent in Latvia to around 40 per cent in North Macedonia and Montenegro. As data were scarce (available for only half of the countries) and had to be cleaned due to high values in some years in almost all countries, the results should be interpreted with caution.
Chart 11. Cost of employees
18 Companies with employee costs of more than 1,000 per cent
of revenues were excluded from calculations. Prerequisites for
inclusion were a cost of employees higher than or equal to 0
and revenues higher than 0. Before data cleaning, there were
substantial outliers observed in Hungary, Romania and Serbia,
with average employee costs exceeding 13,500, 11,500 and
3,500 per cent of revenues, respectively.
Source: Authors’ calculations based on the Orbis database.10 Source: Authors’ calculations based on the Orbis database.10
Results (continued)
14 February 2020 Economic performance of state-owned enterprises in emerging economies: A cross-country study
0 50 100 150 200 2500
50
100
150
200
250
HRVHUN
HRVLVA
LTUPOL
BGR
SRB
KAZSVK GRC
UKRROU
BIH TUR
KOS
MNE
HRVMDA
SVN
Cred
it pe
riod
Collection period
(Days, 2014-16)
-1.0
-0.5
0.0
0.5
1.0
1.5
2.0
2.5
3.0
3.5
(Percentage of GDP; 2014-16)
Serb
iaBo
snia
and
Her
z.Bu
lgar
iaGr
eece
Mol
dova
Slov
enia
Mon
tene
gro
Koso
voTu
rkey
Rom
ania
Pola
ndNo
rth M
aced
onia
Lith
uani
aLa
tvia
Hung
ary
Kaza
khst
anCr
oatia
Esto
nia
Slov
ak R
epub
licUk
rain
e
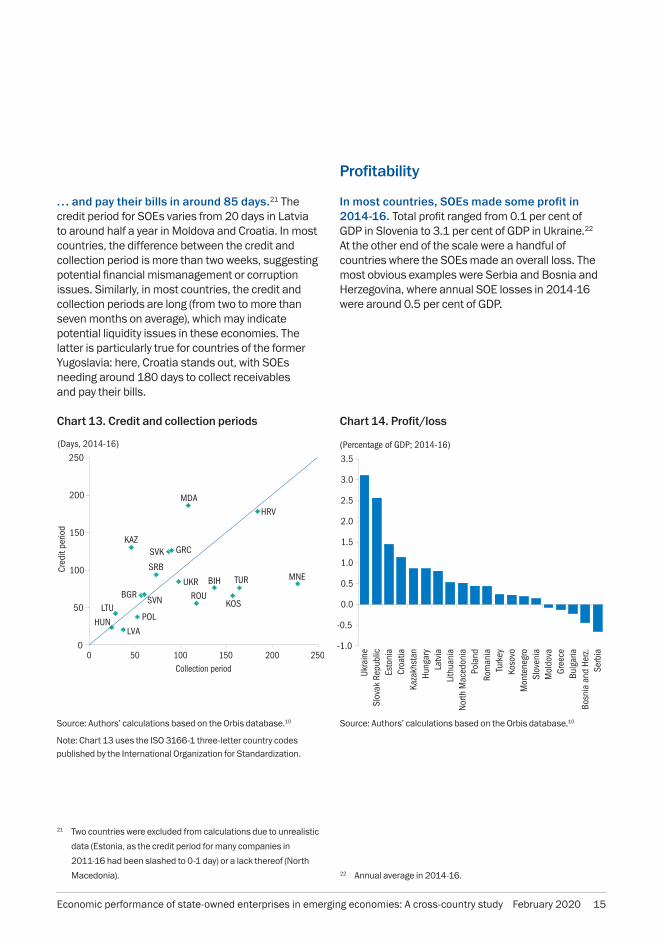
… and pay their bills in around 85 days.21 The credit period for SOEs varies from 20 days in Latvia to around half a year in Moldova and Croatia. In most countries, the difference between the credit and collection period is more than two weeks, suggesting potential financial mismanagement or corruption issues. Similarly, in most countries, the credit and collection periods are long (from two to more than seven months on average), which may indicate potential liquidity issues in these economies. The latter is particularly true for countries of the former Yugoslavia: here, Croatia stands out, with SOEs needing around 180 days to collect receivables and pay their bills.
Chart 13. Credit and collection periods
21 Two countries were excluded from calculations due to unrealistic
data (Estonia, as the credit period for many companies in
2011-16 had been slashed to 0-1 day) or a lack thereof (North
Macedonia).
Source: Authors’ calculations based on the Orbis database.10
Note: Chart 13 uses the ISO 3166-1 three-letter country codes published by the International Organization for Standardization.
Profitability
In most countries, SOEs made some profit in 2014-16. Total profit ranged from 0.1 per cent of GDP in Slovenia to 3.1 per cent of GDP in Ukraine.22 At the other end of the scale were a handful of countries where the SOEs made an overall loss. The most obvious examples were Serbia and Bosnia and Herzegovina, where annual SOE losses in 2014-16 were around 0.5 per cent of GDP.
Chart 14. Profit/loss
22 Annual average in 2014-16.
Source: Authors’ calculations based on the Orbis database.10
Economic performance of state-owned enterprises in emerging economies: A cross-country study February 2020 15

-30
-25
-20
-15
-10
-5
0
5
10
15
Serb
iaGr
eece
Bosn
ia a
nd H
erz.
Mon
tene
gro
Ukra
ine
Slov
enia
Bulg
aria
North
Mac
edon
iaPo
land
Mol
dova
Lith
uani
aCr
oatia
Latv
iaHu
ngar
yKo
sovo
Esto
nia
Rom
ania
Turk
eySl
ovak
Rep
ublic
Kaza
khst
an
(Percentage; 2014-16)
-2
-1
0
1
2
3
4
5
6
7
8
Ukra
ine
Bosn
ia a
nd H
erz.
Bulg
aria
Mol
dova
Gree
ceNo
rth M
aced
onia
Serb
iaM
onte
negr
oSl
oven
iaLi
thua
nia
Koso
voCr
oatia
Pola
ndLa
tvia
Rom
ania
Hung
ary
Esto
nia
Turk
eySl
ovak
Rep
ublic
Kaza
khst
an
(Percentage; 2014-16)
The ROE ranged from 13 per cent in Kazakhstan to -30 per cent in Serbia. The considerable negative ratio in Serbia was a consequence of an outlier (a large SOE had an extremely low 2015 ROE of around -16,500 per cent). Excluding this, Serbian SOEs posted an average ROE of 7.4 per cent, faring much better on this indicator than on overall profitability. However, it could be that the ROE was propped up by the relatively high indebtedness of Serbian SOEs and, consequently, relatively lower equity levels. Hence, individual ROE ratios should be examined in the context of SOE indebtedness.
Chart 16. Return on equity
The ROA23 of SOEs averaged 1.7 per cent in 2014-16. Kazakhstan seems to have had the most profitable firms (with an ROA of more than 6 per cent), but they are likely to have received a significant boost from the currency depreciation of 2015 (of around 50 per cent). This is typical of countries and companies that see (commodity) exports increase in value due to depreciation; wage costs and domestic input prices adjust more slowly, boosting profits. Ukraine, in contrast, experienced even greater depreciation over the same period, but armed conflict meant companies were unable to capitalise on it.
Chart 15. Return on assets
23 ROA and ROE were not automatically taken from Orbis, but
recalculated to increase sample size.
Results (continued)
Source: Authors’ calculations based on the Orbis database.10 Source: Authors’ calculations based on the Orbis database.10
16 February 2020 Economic performance of state-owned enterprises in emerging economies: A cross-country study

(Percentage of GDP)
0
5
10
15
20
25
30
Turk
eyM
oldo
vaHu
ngar
yRo
man
iaBu
lgar
iaLi
thua
nia
Bosn
ia a
nd H
erz.
North
Mac
edon
iaPo
land
Koso
voSl
ovak
Rep
ublic
Latv
iaUk
rain
eM
onte
negr
oGr
eece
Kaza
khst
anSl
oven
iaEs
toni
aCr
oatia
Serb
ia
2016 2014
Serbian and Croatian SOEs are the most (financially) indebted, while the opposite is true for Turkish, Moldovan and Hungarian SOEs. The financial debt of SOEs in Serbia and Croatia was 23 per cent of GDP (compared with less than 1 per cent in Turkey, Moldova and Hungary and average financial debt for all countries of 8 per cent of GDP). In Serbia and Croatia, a large amount of debt is held by a handful of firms. In Croatia, three road companies hold US$ 5.6 billion of debt (more than 11 per cent of GDP) amassed during the rapid expansion and modernisation of the country’s road infrastructure. In Serbia, almost 60 per cent of all SOE debt is held by five SOEs; the largest two are in the utilities sector (electricity and gas) and have more than doubled their debt since 2010.
In most countries, the financial debt of SOEs did not change much from 2014 to 2016. Even when there was a more significant change, this was largely a consequence of changes in sample size and/or GDP. Slovenia and Latvia are notable exceptions, with SOEs deleveraging by 25-30 per cent between 2014 and 2016.
Indebtedness
Chart 17. Financial debt
Source: Authors’ calculations based on the Orbis database.10
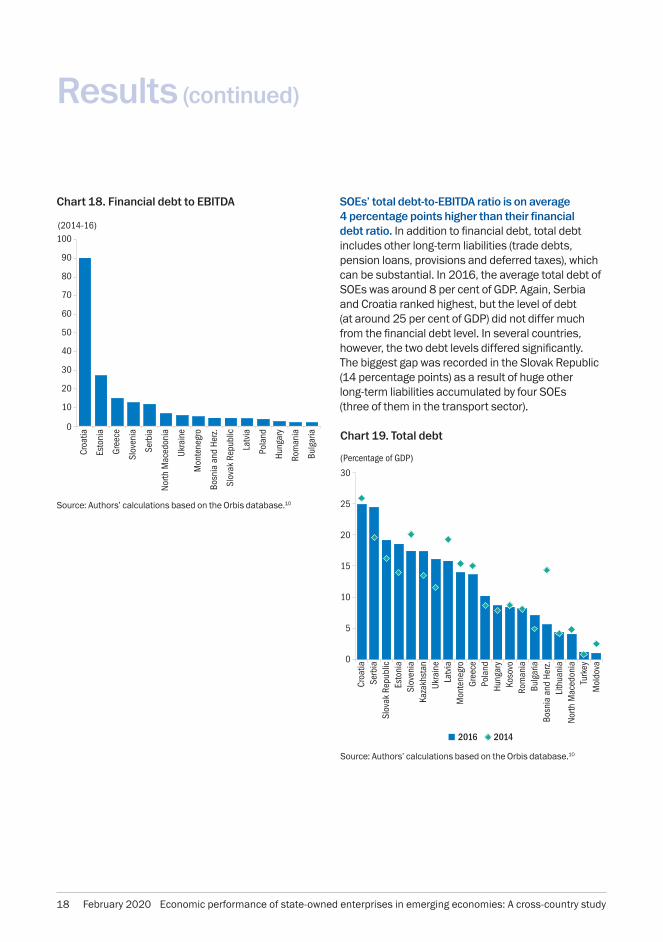
SOEs in some countries may find it difficult to pay off their debt. Results based on this indicator should be treated with caution, due to the lack of data in certain countries and the calculation requirements, which further shrank the sample.24 That said, Croatian SOEs may be worst off in terms of debt repayment, as the financial debt of SOEs with positive EBITDA is on average 90 times EBITDA.25 In contrast, Bulgarian SOEs seem to be in pretty good shape, with the debt of just 1.5 times EBITDA. Alternative calculations26 suggest that SOEs in Croatia, Greece and Serbia are least able to pay off their debt (with debt-to-EBITDA ratios between 5 and 6), while the opposite is true for SOEs in Bulgaria, Hungary and Romania (with ratios of less than 1). (See Chart 18 on page 18.)
24 The calculation was confined to firms that had financial debt
higher than or equal to 0 (to eliminate unsound data) and positive
non-zero EBITDA. Negative EBITDA was excluded, as it would have
reduced national averages (whereas loss-makers are more likely
to have repayment problems). Zero EBITDA was omitted, as a
denominator cannot have zero value. Data were not available for
Kazakhstan, Kosovo, Lithuania, Moldova or Turkey.25 Values of more than 1,000 were excluded from calculations. The
three Croatian road companies were not among the outliers. Prior
to cleaning, Serbia ranked first, with financial debt of almost 180
times EBITDA due to the extremely high financial debt-to-EBITDA
ratio (18,000) of one relatively large SOE in 2014. 26 The sum of a country’s SOE financial debt was divided by the sum
of its EBITDA. The only condition was that a company had data on
both variables in a given year.
Economic performance of state-owned enterprises in emerging economies: A cross-country study February 2020 17
0
5
10
15
20
25
30
(Percentage of GDP)
Mol
dova
Turk
eyNo
rth M
aced
onia
Lith
uani
aBo
snia
and
Her
z.Bu
lgar
iaRo
man
iaKo
sovo
Hung
ary
Pola
ndGr
eece
Mon
tene
gro
Latv
iaUk
rain
eKa
zakh
stan
Slov
enia
Esto
nia
Slov
ak R
epub
licSe
rbia
Croa
tia
2016 2014
0
10
20
30
40
50
60
70
80
90
100(2014-16)
Bulg
aria
Rom
ania
Hung
ary
Pola
nd
Latv
ia
Slov
ak R
epub
lic
Bosn
ia a
nd H
erz.
Mon
tene
gro
Ukra
ine
North
Mac
edon
ia
Serb
ia
Slov
enia
Gree
ce
Esto
nia
Croa
tia
SOEs’ total debt-to-EBITDA ratio is on average 4 percentage points higher than their financial debt ratio. In addition to financial debt, total debt includes other long-term liabilities (trade debts, pension loans, provisions and deferred taxes), which can be substantial. In 2016, the average total debt of SOEs was around 8 per cent of GDP. Again, Serbia and Croatia ranked highest, but the level of debt (at around 25 per cent of GDP) did not differ much from the financial debt level. In several countries, however, the two debt levels differed significantly. The biggest gap was recorded in the Slovak Republic (14 percentage points) as a result of huge other long-term liabilities accumulated by four SOEs (three of them in the transport sector).
Chart 19. Total debt
Chart 18. Financial debt to EBITDA
Source: Authors’ calculations based on the Orbis database.10
Source: Authors’ calculations based on the Orbis database.10
Results (continued)
18 February 2020 Economic performance of state-owned enterprises in emerging economies: A cross-country study
0
20
40
60
80
100
120
140
160
180
Mon
tene
gro
Lith
uani
aM
oldo
vaSe
rbia
Turk
eyUk
rain
eBo
snia
and
Her
z.Ka
zakh
stan
Pola
ndBu
lgar
iaCr
oatia
Slov
enia
Esto
nia
Latv
iaSl
ovak
Rep
ublic
Gree
ceHu
ngar
yRo
man
iaKo
sovo
(Percentage; 2016)
0
10
20
30
40
50
60
70
80
90
(Percentage of total liabilities)
Mol
dova
North
Mac
edon
iaSe
rbia
Bosn
ia a
nd H
erz.
Bulg
aria
Lith
uani
aUk
rain
eTu
rkey
Hung
ary
Pola
ndM
onte
negr
oGr
eece
Kaza
khst
anCr
oatia
Esto
nia
Slov
enia
Rom
ania
Latv
iaSl
ovak
Rep
ublic
Koso
vo
2016 2014
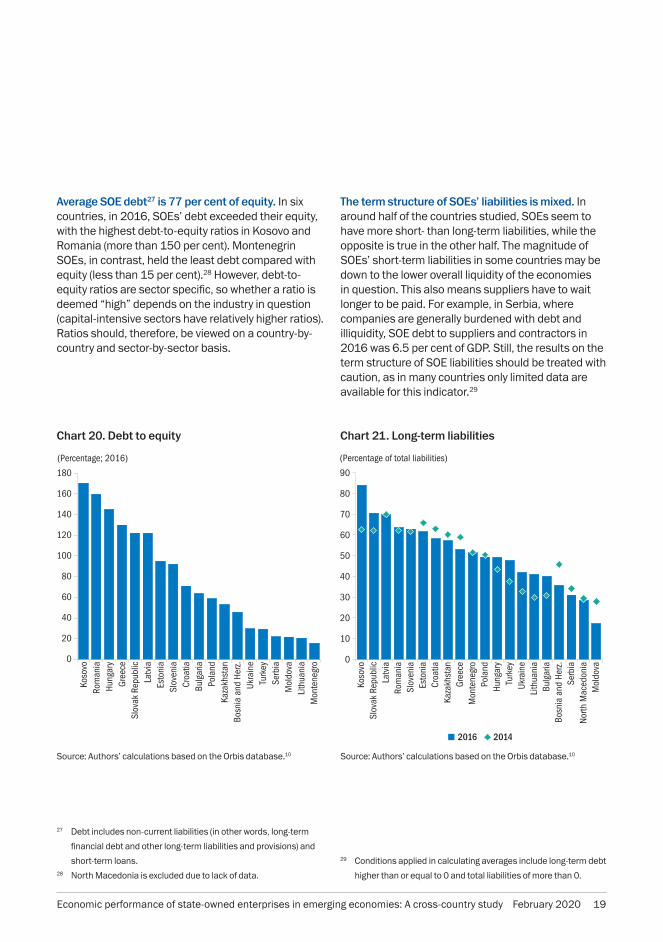
Average SOE debt27 is 77 per cent of equity. In six countries, in 2016, SOEs’ debt exceeded their equity, with the highest debt-to-equity ratios in Kosovo and Romania (more than 150 per cent). Montenegrin SOEs, in contrast, held the least debt compared with equity (less than 15 per cent).28 However, debt-to-equity ratios are sector specific, so whether a ratio is deemed “high” depends on the industry in question (capital-intensive sectors have relatively higher ratios). Ratios should, therefore, be viewed on a country-by-country and sector-by-sector basis.
Chart 20. Debt to equity
27 Debt includes non-current liabilities (in other words, long-term
financial debt and other long-term liabilities and provisions) and
short-term loans. 28 North Macedonia is excluded due to lack of data.
The term structure of SOEs’ liabilities is mixed. In around half of the countries studied, SOEs seem to have more short- than long-term liabilities, while the opposite is true in the other half. The magnitude of SOEs’ short-term liabilities in some countries may be down to the lower overall liquidity of the economies in question. This also means suppliers have to wait longer to be paid. For example, in Serbia, where companies are generally burdened with debt and illiquidity, SOE debt to suppliers and contractors in 2016 was 6.5 per cent of GDP. Still, the results on the term structure of SOE liabilities should be treated with caution, as in many countries only limited data are available for this indicator.29
Chart 21. Long-term liabilities
29 Conditions applied in calculating averages include long-term debt
higher than or equal to 0 and total liabilities of more than 0.
Source: Authors’ calculations based on the Orbis database.10 Source: Authors’ calculations based on the Orbis database.10
Economic performance of state-owned enterprises in emerging economies: A cross-country study February 2020 19

SOEs by sector30
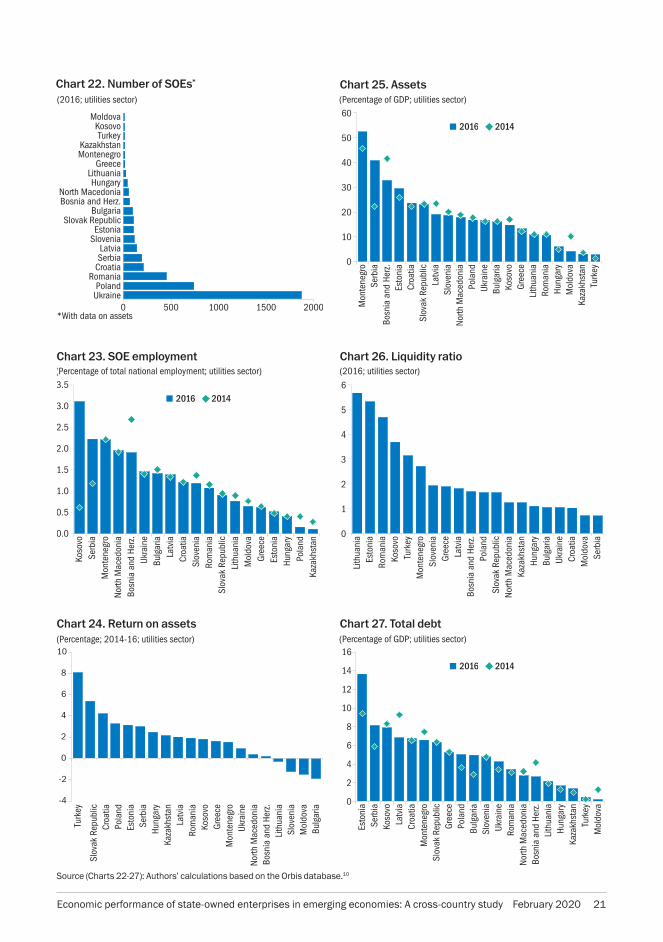
Utilities
Summary
• The number of utility-sector SOEs ranged from 7 in Moldova to 1,870 in Ukraine.
• In terms of assets and equity to GDP, the state-owned utility sector is the largest in Montenegro, Serbia and Bosnia and Herzegovina and smallest in Turkey, Kazakhstan and Moldova. While Turkey’s state-owned utility assets equate to less than 3 per cent of GDP, Montenegro’s figure is more than 50 per cent. Overall, the average size of the state-owned utility sector in asset terms is around 19 per cent of GDP. The equity of state-owned utilities equals 1 per cent of GDP in Moldova and 40 per cent of GDP in Montenegro, compared with an overall average ratio of 11 per cent.
• Slovenian state-owned utilities generate revenues of up to 14 per cent of GDP, while utilities in Kosovo contribute up to 3 per cent of total employment. State-owned utilities in Serbia, Montenegro, North Macedonia and Bosnia and Herzegovina also employ a relatively sizeable slice of their country’s workforce (around 2 per cent). In contrast, Kazakhstan’s state-owned utilities generate the least revenue and contribute least to employment (0.9 per cent of GDP and 0.1 per cent of total employment, respectively).
• Lithuanian and Estonian state-owned utilities are the most liquid (with a liquidity ratio of more than 5), while Serbian and Moldovan utilities are the most illiquid (with a liquidity ratio of less than 1).
• Latvian and Hungarian utilities are fastest to pay their bills and Kazakh utilities are fastest to collect their receivables (it takes them less than a month). State-owned utilities in Montenegro and North Macedonia, in contrast, need around 11 months to collect their receivables, while Greek utilities take more than 4 months to pay their dues.
• While state-owned utilities seem to be most profitable in Turkey and the Slovak Republic (average ROA in 2014-16 of more than 5 per cent), the opposite goes for Bulgaria and Moldova (average ROA equal to or less than –1.5 per cent).
• Estonian state-owned utilities are most indebted (total debt of 14 per cent of GDP); Turkish and Moldovan utilities the least (total debt of less than 1 per cent of GDP).
30 Results by sector should be treated with greater caution and
examined in more detail due to the relatively smaller samples
(sometimes comprising only a few companies) and potentially
more pronounced data issues. The cleaning options applied to
country-level results hold, as do the time periods observed (2016
for stock and 2014-16 for flow variables). Source for all charts:
author’s calculations based on the Orbis database (published by
BvD, a Moody’s Analytics company).
20 February 2020 Economic performance of state-owned enterprises in emerging economies: A cross-country study
0 500 1000 1500 2000*With data on assets
MoldovaKosovoTurkey
KazakhstanMontenegro
GreeceLithuaniaHungary
North MacedoniaBosnia and Herz.
BulgariaSlovak Republic
EstoniaSlovenia
LatviaSerbia
CroatiaRomania
PolandUkraine
(2016; utilities sector)
0.0
0.5
1.0
1.5
2.0
2.5
3.0
3.5
Kaza
khst
anPo
land
Hung
ary
Esto
nia
Gree
ceM
oldo
vaLi
thua
nia
Slov
ak R
epub
licRo
man
iaSl
oven
iaCr
oatia
Latv
iaBu
lgar
iaUk
rain
eBo
snia
and
Her
z.No
rth M
aced
onia
Mon
tene
gro
Serb
iaKo
sovo
(Percentage of total national employment; utilities sector)
2016 2014
-4
-2
0
2
4
6
8
10
Bulg
aria
Mol
dova
Slov
enia
Lith
uani
aBo
snia
and
Her
z.No
rth M
aced
onia
Ukra
ine
Mon
tene
gro
Gree
ceKo
sovo
Rom
ania
Latv
iaKa
zakh
stan
Hung
ary
Serb
iaEs
toni
aPo
land
Croa
tiaSl
ovak
Rep
ublic
Turk
ey
(Percentage; 2014-16; utilities sector)
0
10
20
30
40
50
60
Turk
eyKa
zakh
stan
Mol
dova
Hung
ary
Rom
ania
Lith
uani
aGr
eece
Koso
voBu
lgar
iaUk
rain
ePo
land
North
Mac
edon
iaSl
oven
iaLa
tvia
Slov
ak R
epub
licCr
oatia
Esto
nia
Bosn
ia a
nd H
erz.
Serb
iaM
onte
negr
o
(Percentage of GDP; utilities sector)
2016 2014
0
1
2
3
4
5
6
Serb
iaM
oldo
vaCr
oatia
Ukra
ine
Bulg
aria
Hung
ary
Kaza
khst
anNo
rth M
aced
onia
Slov
ak R
epub
licPo
land
Bosn
ia a
nd H
erz.
Latv
iaGr
eece
Slov
enia
Mon
tene
gro
Turk
eyKo
sovo
Rom
ania
Esto
nia
Lith
uani
a
(2016; utilities sector)
0
2
4
6
8
10
12
14
16
Mol
dova
Turk
eyKa
zakh
stan
Hung
ary
Lith
uani
aBo
snia
and
Her
z.No
rth M
aced
onia
Rom
ania
Ukra
ine
Slov
enia
Bulg
aria
Pola
ndGr
eece
Slov
ak R
epub
licM
onte
negr
oCr
oatia
Latv
iaKo
sovo
Serb
iaEs
toni
a
(Percentage of GDP; utilities sector)
2016 2014
Chart 23. SOE employment
Chart 24. Return on assets
Chart 26. Liquidity ratio
Chart 27. Total debt
Source (Charts 22-27): Authors’ calculations based on the Orbis database.10
Chart 22. Number of SOEs* Chart 25. Assets
Economic performance of state-owned enterprises in emerging economies: A cross-country study February 2020 21

Transport
Summary
• The number of SOEs in the transport sector ranges from 3 in Kosovo and Bosnia and Herzegovina to around 340 in Ukraine.
• In terms of both assets and equity, the state-owned transport sector is largest in Ukraine and smallest in Moldova and Kosovo. While state-owned transport assets in Moldova and Kosovo account for less than 2 per cent of GDP, in Ukraine they make up more than 36 per cent. In asset terms, the average size of the transport sector in the countries studied is 11 per cent of GDP. The equity of state-owned transport companies is less than 0.5 per cent of GDP in Moldova and Kosovo compared with 25 per cent in Ukraine and a country average of 6 per cent.
• Montenegrin state-owned transport firms generate the most revenues (5 per cent of GDP), while Bulgaria’s companies contribute most to total employment (2.8 per cent), both followed closely by Latvian state-owned transport companies. In contrast, transport SOEs in Kosovo produce only 0.3 per cent of GDP in revenues, while Polish state transport firms employ only 0.1 per cent of the country’s workforce.
• Croatia’s transport SOEs are the most liquid (with a liquidity ratio of more than 4.5), while Hungarian and Bosnian firms are the most illiquid (with a liquidity ratio of less than 0.7).31 Liquidity seems to be problematic (with a ratio of less than 1), too, for state-owned transport companies in Greece, Latvia, North Macedonia, Poland and Serbia.
• Latvian transport SOEs are among the fastest ones to pay their bills and collect their receivables (less than 20 days), while Turkish firms are among the slowest (needing around 11 months to collect and almost four months to pay their bills).
• While Estonia’s state-owned transport companies seem to be the most profitable (with an average ROA in 2014-16 of around 4.5 per cent), the opposite is true for transport SOEs in Kosovo (with an average ROA of – 5.5 per cent).
• Slovakian transport firms are most indebted (with total debt of 12 per cent of GDP); Turkish and Kosovan SOEs are the least burdened (0.2-0.3 per cent of GDP).32
31 Moldovan SOEs were excluded, as only one company provided
data on its liquidity ratio.32 Moldovan SOEs were omitted, as data on total debt were only
available for one company.
SOEs by sector (continued)
22 February 2020 Economic performance of state-owned enterprises in emerging economies: A cross-country study

(2016; transport sector)
0 50 100 150 200 250 300 350 400
KosovoBosnia and Herz.
MoldovaTurkey
KazakhstanLithuania
North MacedoniaMontenegro
EstoniaGreece
SloveniaSlovak Republic
HungaryCroatia
LatviaBulgaria
SerbiaRomania
PolandUkraine
*With data on assets
(Percentage of total national employment; transport sector)
0.0
0.5
1.0
1.5
2.0
2.5
3.0
3.5
Pola
ndKo
sovo
Gree
ceBo
snia
and
Her
z.Ka
zakh
stan
Mol
dova
North
Mac
edon
iaRo
man
iaEs
toni
aSl
oven
iaLi
thua
nia
Croa
tiaSe
rbia
Hung
ary
Mon
tene
gro
Slov
ak R
epub
licUk
rain
eLa
tvia
Bulg
aria
2016 2014
(Percentage; 2014-16; transport sector)
-6
-4
-2
0
2
4
6
Koso
voBo
snia
and
Her
z.Gr
eece
Mon
tene
gro
North
Mac
edon
iaBu
lgar
iaUk
rain
eLi
thua
nia
Rom
ania
Pola
ndHu
ngar
yLa
tvia
Serb
iaCr
oatia
Turk
eySl
oven
iaSl
ovak
Rep
ublic
Kaza
khst
anM
oldo
vaEs
toni
a
(Percentage of GDP; transport sector)
0
5
10
15
20
25
30
35
40
Koso
voM
oldo
vaTu
rkey
Bosn
ia a
nd H
erz.
Rom
ania
Pola
ndHu
ngar
yLi
thua
nia
Latv
iaNo
rth M
aced
onia
Esto
nia
Croa
tiaGr
eece
Serb
iaKa
zakh
stan
Bulg
aria
Slov
enia
Slov
ak R
epub
licM
onte
negr
oUk
rain
e
2016 2014
(2016; transport sector)
0
1
2
3
4
5
6
Hung
ary
Bosn
ia a
nd H
erz.
Serb
iaPo
land
North
Mac
edon
iaLa
tvia
Gree
ceUk
rain
eKa
zakh
stan
Slov
enia
Mon
tene
gro
Bulg
aria
Lith
uani
aTu
rkey
Slov
ak R
epub
licRo
man
iaEs
toni
aKo
sovo
Croa
tia
0
2
4
6
8
10
12
Turk
eyKo
sovo
North
Mac
edon
iaLi
thua
nia
Bosn
ia a
nd H
erz.
Bulg
aria
Serb
iaCr
oatia
Pola
ndRo
man
iaGr
eece
Esto
nia
Hung
ary
Latv
iaUk
rain
eKa
zakh
stan
Mon
tene
gro
Slov
enia
Slov
ak R
epub
lic
(Percentage of GDP; transport sector)
2016 2014
Source (Charts 28-33): Authors’ calculations based on the Orbis database.10
Chart 28. Number of SOEs*
Chart 29. SOE employment
Chart 30. Return on assets
Chart 31. Assets
Chart 32 . Liquidity ratio
Chart 33. Total debt
Economic performance of state-owned enterprises in emerging economies: A cross-country study February 2020 23

Manufacturing
Summary
• The number of SOEs in the manufacturing sector ranges between 2 and 4 in Baltic states and Montenegro, and 665 in Ukraine.33
• In terms of assets, the state-owned manufacturing sector is largest in Serbia (at close to 7 per cent of GDP), while in terms of equity, it is largest in Montenegro (at around 3 per cent of GDP). State-owned manufacturing is smallest in Estonia and the Slovak Republic (with assets corresponding to just 0.1 per cent of GDP). Serbian and Ukrainian SOEs have total negative equity of 3.8 and 0.5 per cent of GDP, respectively. Serbian manufacturing SOEs seem to stand out for all the wrong reasons in other respects too.
• Polish manufacturing SOEs generate the most revenue (6 per cent of GDP), while Serbian firms contribute most to total employment (1.2 per cent). In contrast, manufacturing SOEs in most countries make less than 1 per cent of GDP in revenues and employ less than 0.3 per cent of the total workforce.
• Bulgarian manufacturing SOEs are extremely liquid (with a liquidity ratio of 8) and Serbian SOEs are the most illiquid (with a liquidity ratio of less than 0.3). Liquidity seems to be an issue for SOEs in Ukraine, too (where the ratio is less than 1).34
• Hungarian SOEs are the fastest to pay their bills (around 20 days), while Kazakh and Slovakian state manufacturers rush to collect receivables (in around one month).35 Serbian and Greek SOEs, meanwhile, need almost nine months to pay their bills, while Montenegrin, Croatian and Greek SOEs need more than six months to collect receivables.
• Bulgarian and Hungarian manufacturing SOEs seem to be very profitable (with an average ROA in 2014-16 of around 12 per cent), unlike Serbian state-owned manufacturers (with an average ROA in the same period of –12 per cent).36
• While in most countries the debt of state-run manufacturers is fairly low (less than 0.5 per cent of GDP), in Serbia it is quite high (at almost 5 per cent of GDP).
34 Although Latvian and Estonian manufacturing SOEs seem to
score poorly on liquidity, in each case, this is down to one illiquid
company (out of a total of two in the sector with data on assets).35 Latvian and Estonian manufacturing SOEs need only 4 and 14
days, respectively, to collect receivables, but the result is affected
by the small number of companies in the sample (2).36 Again, the result for Estonian state-owned manufacturers was
strongly influenced by developments at just one company.
33 Kosovo was omitted from the assessment, as there were no
data on Kosovan state-owned manufacturers.
SOEs by sector (continued)
24 February 2020 Economic performance of state-owned enterprises in emerging economies: A cross-country study

(Percentage; 2014-16; transport sector)
-35
-30
-25
-20
-15
-10
-5
0
5
10
15
Esto
nia
Serb
iaBo
snia
and
Her
z.Uk
rain
eGr
eece
Slov
enia
North
Mac
edon
iaCr
oatia
Slov
ak R
epub
licM
oldo
vaM
onte
negr
oLa
tvia
Pola
ndLi
thua
nia
Kaza
khst
anTu
rkey
Rom
ania
Hung
ary
Bulg
aria
(Percentage of GDP; manufacturing sector)
0
1
2
3
4
5
6
7
8
9
Mol
dova
Lith
uani
aBu
lgar
iaLa
tvia
North
Mac
edon
iaGr
eece
Hung
ary
Kaza
khst
anTu
rkey
Mon
tene
gro
Rom
ania
Slov
enia
Croa
tiaBo
snia
and
Her
z.Po
land
Ukra
ine
Serb
ia
2016 2014
Esto
nia
Slov
ak R
epub
lic
(Percentage of total national employment; manufacturing sector)
0.0
0.2
0.4
0.6
0.8
1.0
1.2
1.4
1.6
1.8
Esto
nia
Slov
ak R
epub
lic
Lith
uani
aKa
zakh
stan
Pola
ndGr
eece
Rom
ania
Latv
iaNo
rth M
aced
onia
Bosn
ia a
nd H
erz.
Mol
dova
Bulg
aria
Mon
tene
gro
Hung
ary
Ukra
ine
Croa
tiaSl
oven
iaSe
rbia
2016 2014
(Percentage of GDP; manufacturing sector)
0
1
2
3
4
5
6
7
8
9
Serb
iaLa
tvia
Esto
nia
Ukra
ine
Mon
tene
gro
Pola
ndLi
thua
nia
Slov
enia
Bosn
ia a
nd H
erz.
Gree
ceTu
rkey
Slov
ak R
epub
licM
oldo
vaHu
ngar
yNo
rth M
aced
onia
Kaza
khst
anCr
oatia
Rom
ania
Bulg
aria
(2016; manufacturing sector)
0 100 200 300 400 500 600 700
LatviaEstonia
MontenegroLithuania
Slovak RepublicMoldova
KazakhstanGreeceTurkey
North MacedoniaBosnia and Herz.
SloveniaHungaryCroatia
BulgariaRomania
PolandSerbia
Ukraine
*With data on assets
(Percentage of GDP; manufacturing sector)
0
1
2
3
4
5
6
7
8
Esto
nia
Slov
ak R
epub
licLa
tvia
Lith
uani
aRo
man
iaGr
eece
North
Mac
edon
iaTu
rkey
Kaza
khst
anBu
lgar
iaM
oldo
vaSl
oven
iaBo
snia
and
Her
z.Hu
ngar
yM
onte
negr
oCr
oatia
Pola
ndUk
rain
eSe
rbia
2016 2014
Source (Charts 34-39): Authors’ calculations based on the Orbis database.10
Chart 34. Number of SOEs*
Chart 35. SOE employment
Chart 36. Return on assets
Chart 37. Assets
Chart 38. Liquidity ratio
Chart 39. Total debt
Economic performance of state-owned enterprises in emerging economies: A cross-country study February 2020 25
This study could be deepened and expanded in several ways. First, the sample could be enlarged to include missing SOEs and other economies in which the EBRD invests for which Orbis data are available. Second, more in-depth studies could be conducted, focusing on specific countries or sectors and providing more detail on areas that EBRD interventions could target. Third, SOE performance could be compared with that of national private-sector peers or SOEs in certain developed economies. Lastly, a cross-country analysis of the performance of state-owned financial institutions could be performed.
Potential future work
26 February 2020 Economic performance of state-owned enterprises in emerging economies: A cross-country study

Conclusions
Almost three decades on from the start of transition, the non-financial state-owned sector remains substantial. Even though the economies in which the EBRD invests have recorded a significant increase in the private sector’s share of the economy over the past two decades, SOEs are still prevalent and many will continue to play an important role in future. While decisions on whether a public company is fulfilling its goal(s) and whether it should be privatised are political, the operational efficiency of SOEs should remain an economic issue. That is particularly important if public finances are strained or unsustainable.
There is room to improve SOE performance in many of the economies where the EBRD invests. This paper shows considerable differences in the economic variables associated with SOEs in economies from central Europe to Central Asia and SEMED. This suggests that there is significant opportunity in many economies to improve the operational efficiency of SOEs and enhance corporate governance. Ultimately, this would bolster public finances and benefit all citizens and businesses.
Economic performance of state-owned enterprises in emerging economies: A cross-country study February 2020 27

International Labour Organization (n.d.)Employment statistics: https://ilostat.ilo.org/topics/employment/ (last accessed 10 December 2019).
International Monetary Fund (2018)World Economic Outlook, April 2018, Washington, DC (available at: https://www.imf.org/en/Publications/WEO/Issues/2018/03/20/world-economic-outlook-april-2018).
World Bank (2015)Financial Sector Assessment Program: Bosnia and Herzegovina. Capital Markets Technical Note 98305, June 2015, Washington, DC (available at: http://documents.worldbank.org/curated/en/283201468186564489/pdf/98305-WP-P150589-Box393168B.pdf).
References
28 February 2020 Economic performance of state-owned enterprises in emerging economies: A cross-country study

Annex 1.
Definition of indicators
Collection period (debtors / operating revenue) * 360
Credit period (creditors / operating revenue) * 360
Debt to equity (gearing) (non-current liabilities + loans) / shareholders’ funds * 100
Financial debt long-term debt + loans
Financial debt to EBITDA financial debt / EBITDA
Implied interest rate (financial expense / financial debt) * 100
Liquidity ratio (current assets - stocks) / current liabilities
Long-term liabilities non-current liabilities / (current + non-current liabilities) * 100
ROA (profit before tax / total assets) * 100
ROE (profit before tax / shareholders’ funds) * 100
Shareholders’ funds(total equity) capital + other shareholders’ funds
Total debt non-current liabilities + loans
Value added profit/loss for period + cost of employees
Source: Orbis database and authors.
Economic performance of state-owned enterprises in emerging economies: A cross-country study February 2020 29

Annex 2.
Translation of NACE Rev. 2* to sectors referred to in this paper
Agriculture A - Agriculture, forestry and fishing
Energy B - Mining and quarrying
Manufacturing C - Manufacturing
UtilitiesD - Electricity, gas, steam and air-conditioning supply
E - Water supply; sewerage, waste management and remediation activities
Construction F - Construction
Trade G - Wholesale and retail trade; repair of motor vehicles and motorcycles
Transport H - Transportation and storage
Tourism I - Accommodation and food services
Other services
J - Information and communication
L - Real estate activities
M - Professional, scientific and technical activities
N - Administrative and support services
O - Public administration and defence; compulsory social security
P - Education
Q - Human health and social work
*Statistical classification of economic activities in the European Union
Source: Authors.
30 February 2020 Economic performance of state-owned enterprises in emerging economies: A cross-country study

Acronyms
BvD Bureau van Dijk, a Moody’s Analytics company
EBITDA Earnings before interest, tax, depreciation and amortisation
EBRD European Bank for Reconstruction and Development
GDP Gross domestic product
ILO International Labour Organization
IMF International Monetary Fund
ROA Return on assets
ROE Return on equity
SEMED Southern and eastern Mediterranean
SOE State-owned enterprise
NACE Statistical classification of economic activities in the European Union
US United States
Economic performance of state-owned enterprises in emerging economies: A cross-country study February 2020 31

Notes
32 February 2020 Economic performance of state-owned enterprises in emerging economies: A cross-country study
© European Bank for Reconstruction and Development
All rights reserved. No part of this publication may be reproduced or transmitted in any form or by any means, including photocopying and recording, without the written permission of the copyright holder. Such written permission must also be obtained before any part of this publication is stored in a retrieval system of any nature.
Terms and names used in this report to refer to geographical or other territories, political and economic groupings and units, do not constitute and should not be construed as constituting an express or implied position, endorsement, acceptance or expression of opinion by the European Bank for Reconstruction and Development or its members concerning the status of any country, territory, grouping and unit, or delimitation of its borders, or sovereignty.
1228 Economic performance of state-owned enterprises in emerging economies: A cross-country study

European Bank for Reconstruction and DevelopmentOne Exchange SquareLondon EC2A 2JNUnited Kingdomwww.ebrd.com