economic performance of the airline industry - mid … strong economic cycle is unambiguously good...
TRANSCRIPT
1

1. Consumers of air transport and the wider economy have benefited from the doubling of unique connections between cities and the halving of air transport costs in real terms over the past two decades.
2. It is fast and price effective connectivity between cities that is the source of benefits to travellers and shippers.
3. These connections are also the source of economic flows (people, goods, capital, ideas) that generate wider benefits through boosting business productivity.
2

1. Two measures of the economic value of air transport are the value of international trade carried by air and the spending by the tourists that arrive by air.
2. This year the 20% rise in the US dollar will reduce the value of non‐$ trade and tourist spending, when translated into US$ as in the chart
3. Evenso we forecast that the industry will carry internationally traded goods worth $6 trillion this year (almost 35% by value of total international trade) and the tourists the industry carries are forecast to spend a total of $650 billion.
3
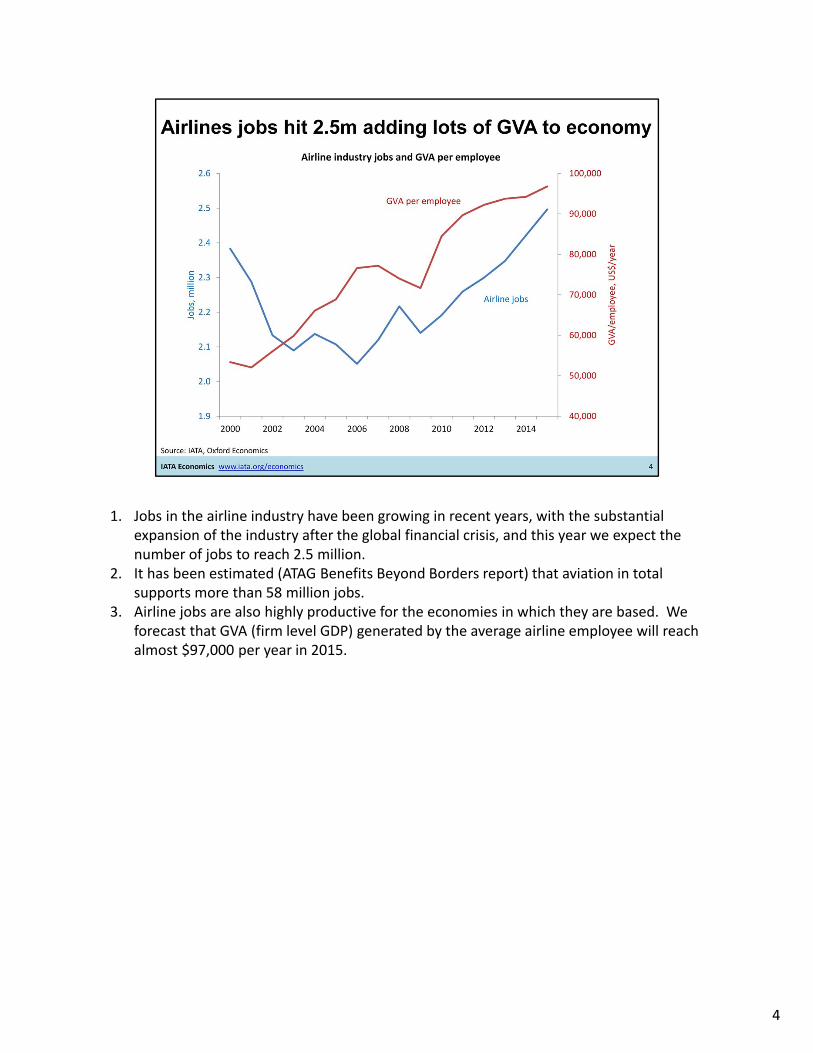
1. Jobs in the airline industry have been growing in recent years, with the substantial expansion of the industry after the global financial crisis, and this year we expect the number of jobs to reach 2.5 million.
2. It has been estimated (ATAG Benefits Beyond Borders report) that aviation in total supports more than 58 million jobs.
3. Airline jobs are also highly productive for the economies in which they are based. We forecast that GVA (firm level GDP) generated by the average airline employee will reach almost $97,000 per year in 2015.
4
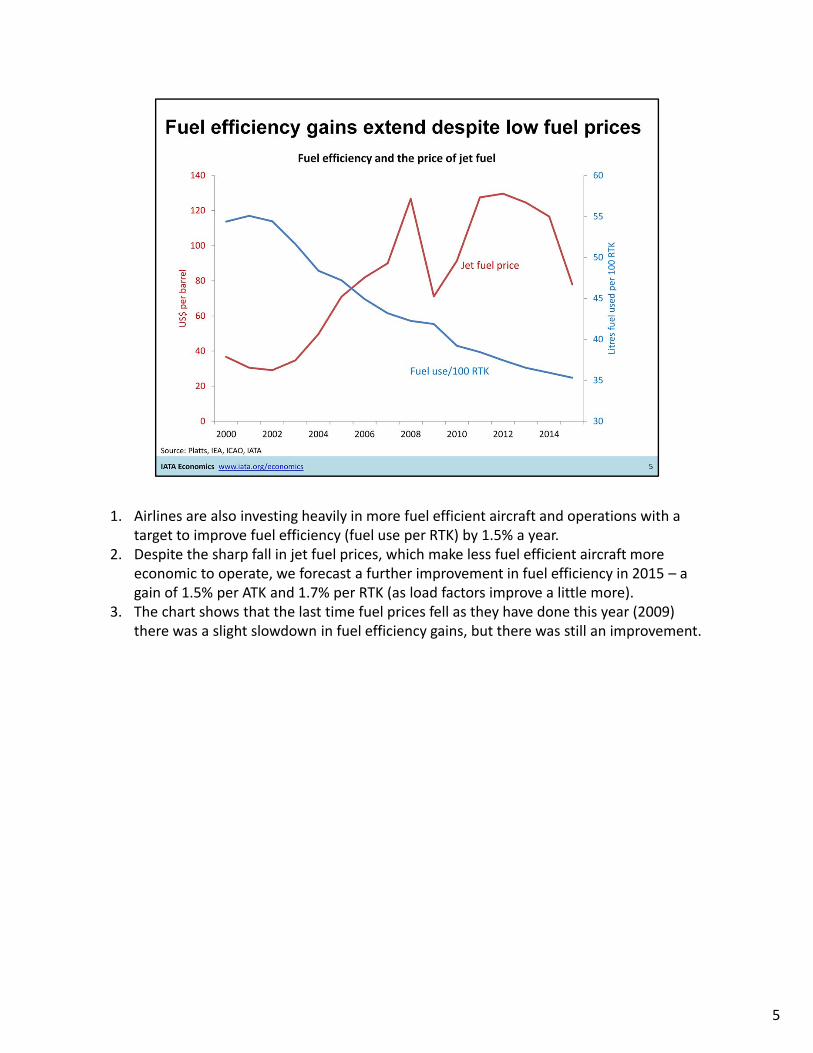
1. Airlines are also investing heavily in more fuel efficient aircraft and operations with a target to improve fuel efficiency (fuel use per RTK) by 1.5% a year.
2. Despite the sharp fall in jet fuel prices, which make less fuel efficient aircraft more economic to operate, we forecast a further improvement in fuel efficiency in 2015 – a gain of 1.5% per ATK and 1.7% per RTK (as load factors improve a little more).
3. The chart shows that the last time fuel prices fell as they have done this year (2009) there was a slight slowdown in fuel efficiency gains, but there was still an improvement.
5
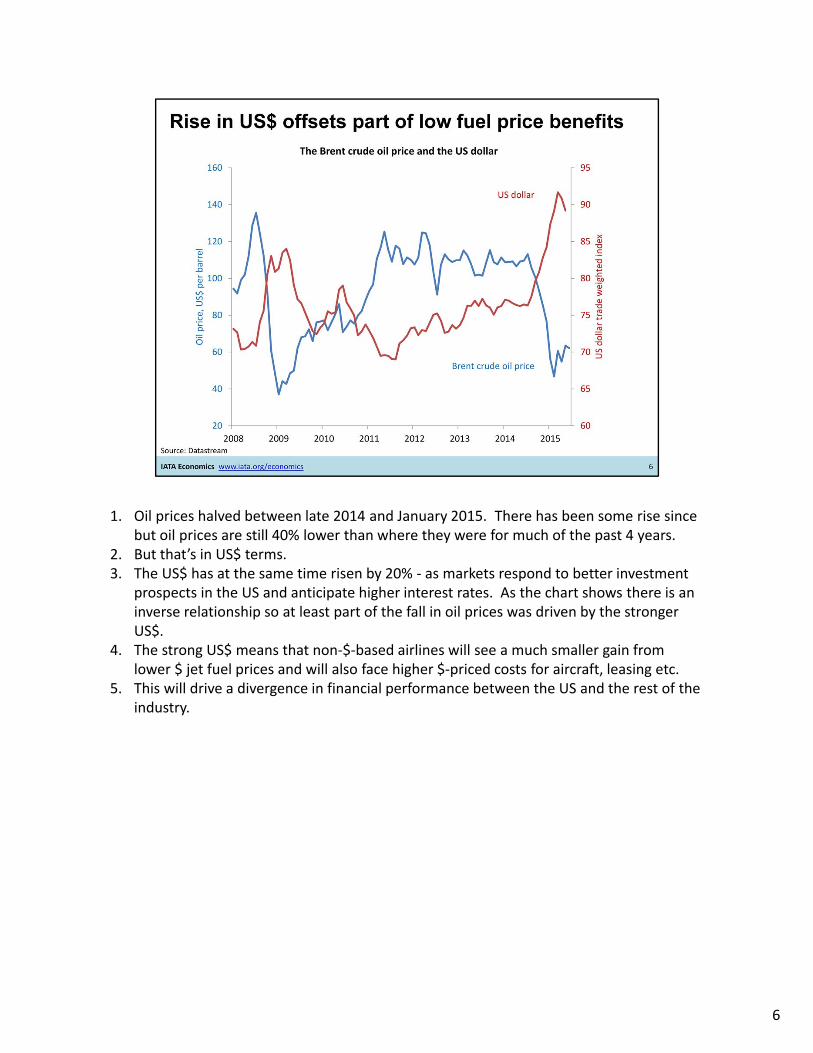
1. Oil prices halved between late 2014 and January 2015. There has been some rise since but oil prices are still 40% lower than where they were for much of the past 4 years.
2. But that’s in US$ terms.3. The US$ has at the same time risen by 20% ‐ as markets respond to better investment
prospects in the US and anticipate higher interest rates. As the chart shows there is an inverse relationship so at least part of the fall in oil prices was driven by the stronger US$.
4. The strong US$ means that non‐$‐based airlines will see a much smaller gain from lower $ jet fuel prices and will also face higher $‐priced costs for aircraft, leasing etc.
5. This will drive a divergence in financial performance between the US and the rest of the industry.
6
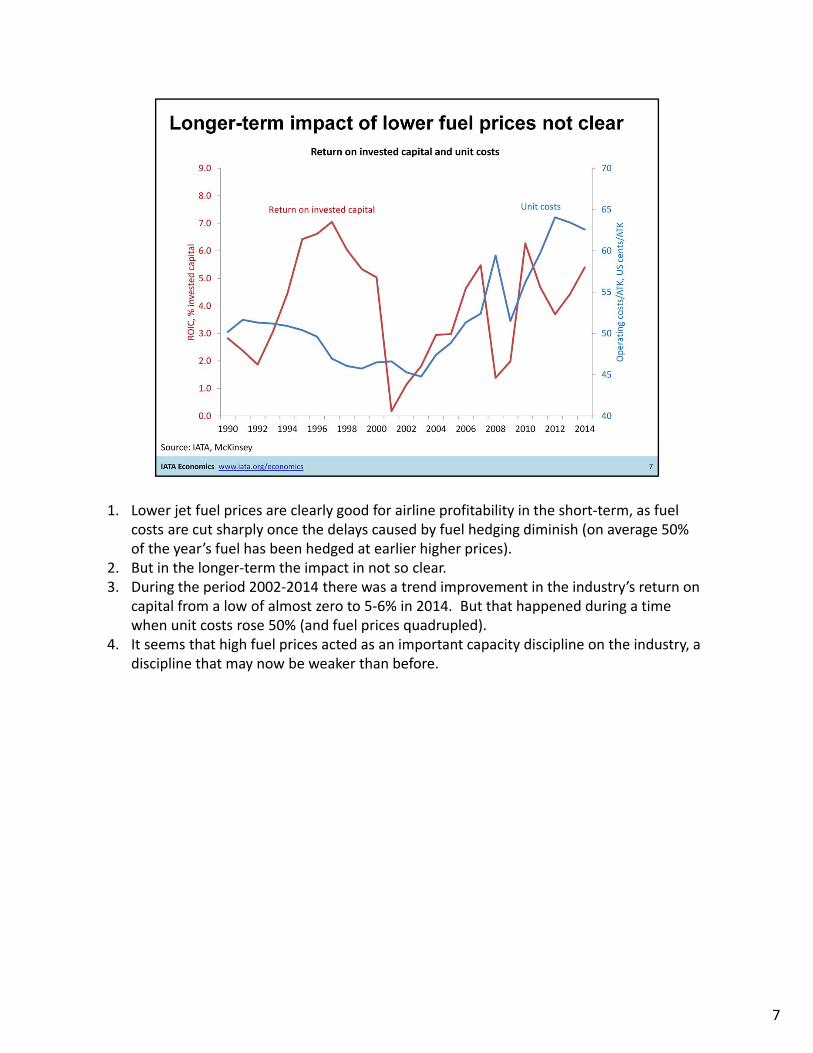
1. Lower jet fuel prices are clearly good for airline profitability in the short‐term, as fuel costs are cut sharply once the delays caused by fuel hedging diminish (on average 50% of the year’s fuel has been hedged at earlier higher prices).
2. But in the longer‐term the impact in not so clear.3. During the period 2002‐2014 there was a trend improvement in the industry’s return on
capital from a low of almost zero to 5‐6% in 2014. But that happened during a time when unit costs rose 50% (and fuel prices quadrupled).
4. It seems that high fuel prices acted as an important capacity discipline on the industry, a discipline that may now be weaker than before.
7

1. One reason for questioning whether low fuel prices will lead to a sustained improvement in airline profitability is the history of the past 6 decades, when real cost reductions were consistently passed on to consumer in lower fares and cargo rates.
2. The intensity of competition in the airline industry usually means that consumers, rather than investors, are the beneficiaries of cost reductions and efficiency improvements.
8
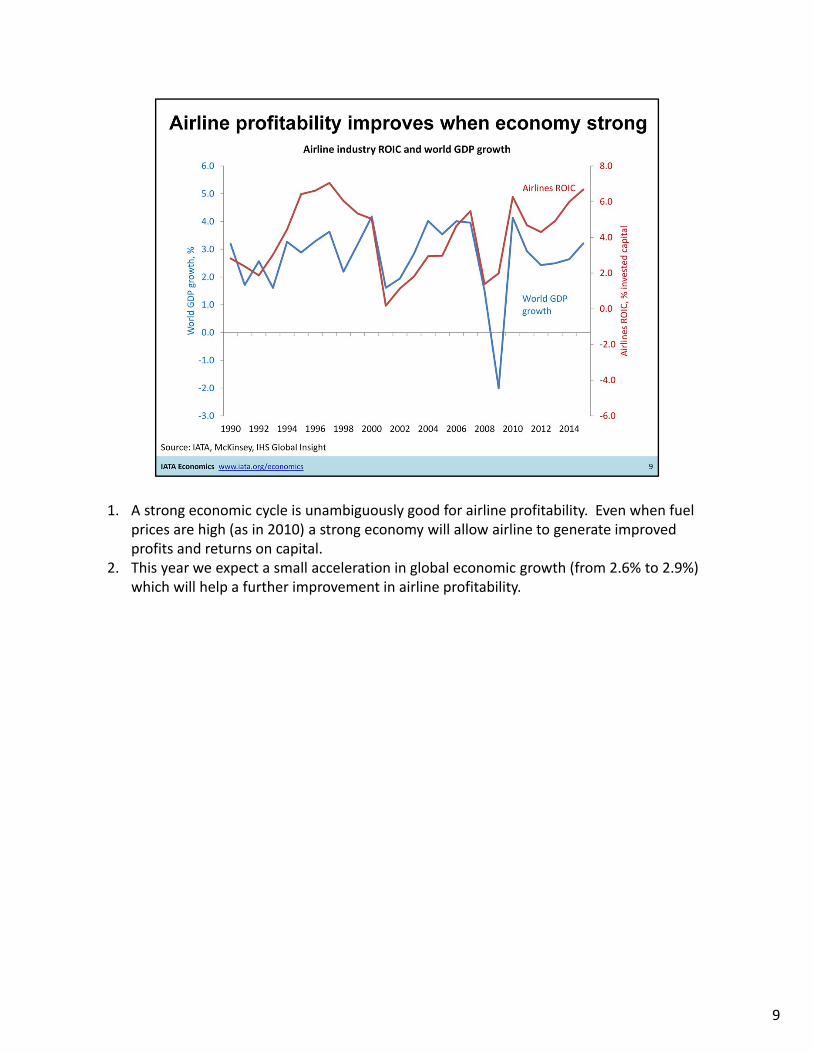
1. A strong economic cycle is unambiguously good for airline profitability. Even when fuel prices are high (as in 2010) a strong economy will allow airline to generate improved profits and returns on capital.
2. This year we expect a small acceleration in global economic growth (from 2.6% to 2.9%) which will help a further improvement in airline profitability.
9
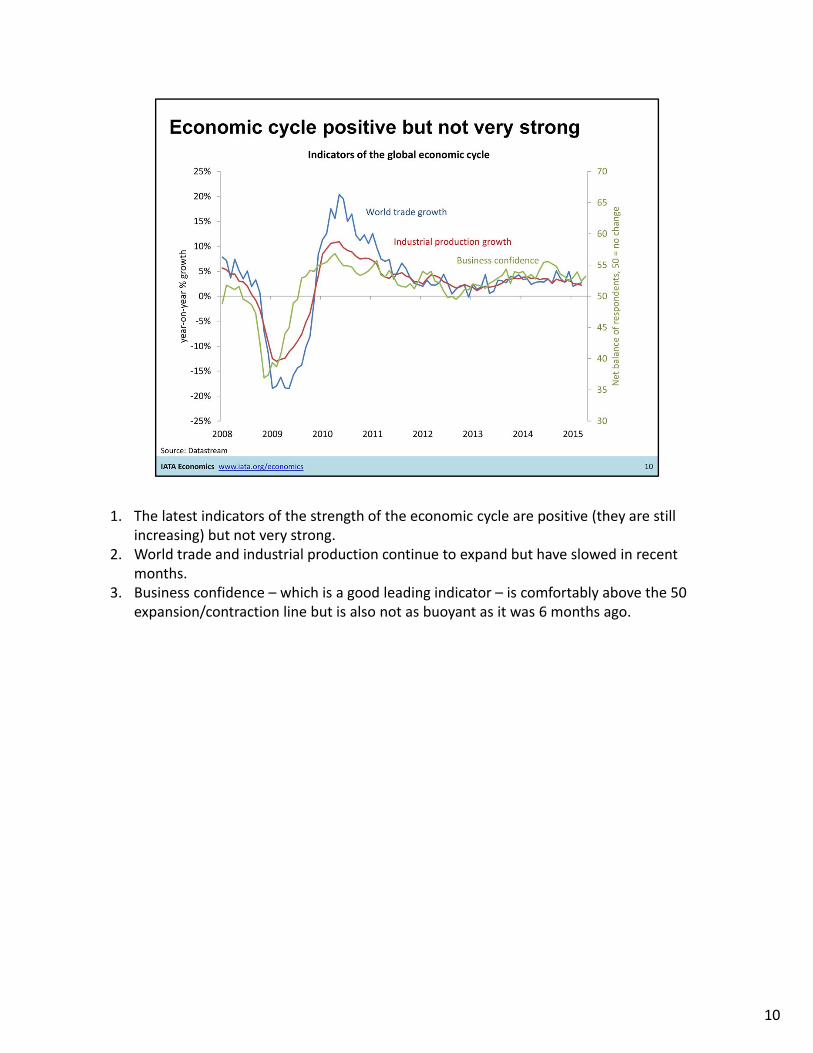
1. The latest indicators of the strength of the economic cycle are positive (they are still increasing) but not very strong.
2. World trade and industrial production continue to expand but have slowed in recent months.
3. Business confidence – which is a good leading indicator – is comfortably above the 50 expansion/contraction line but is also not as buoyant as it was 6 months ago.
10
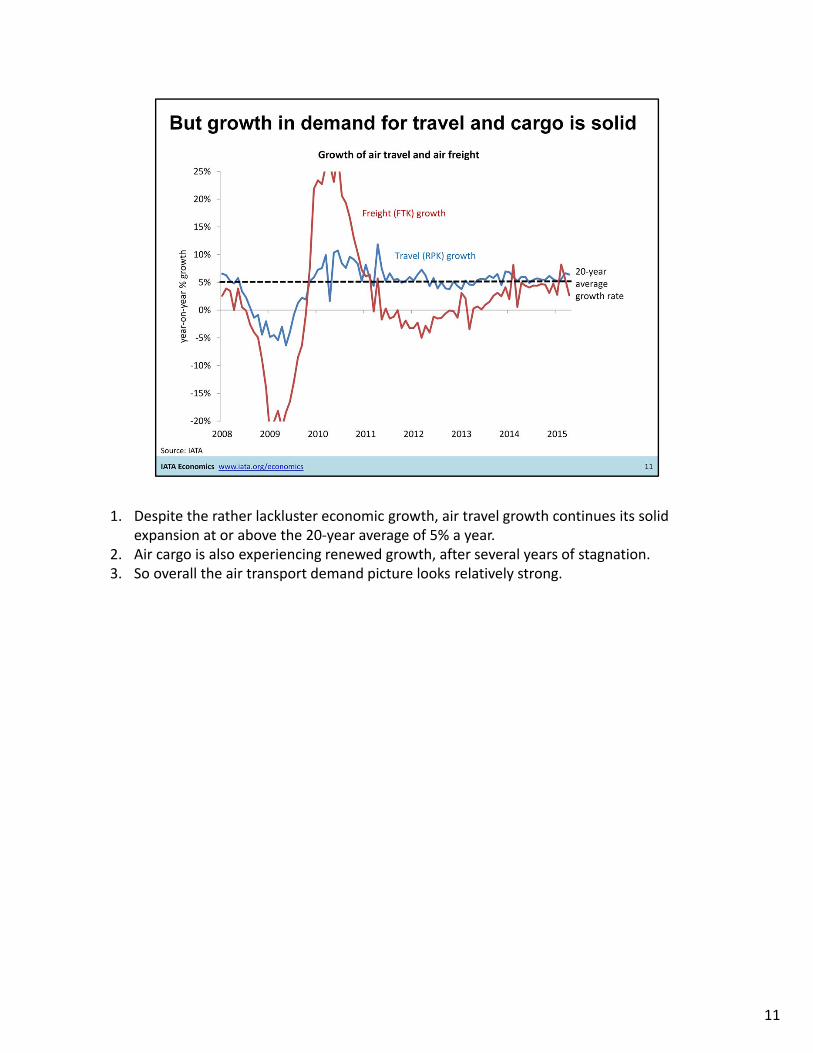
1. Despite the rather lackluster economic growth, air travel growth continues its solid expansion at or above the 20‐year average of 5% a year.
2. Air cargo is also experiencing renewed growth, after several years of stagnation.3. So overall the air transport demand picture looks relatively strong.
11
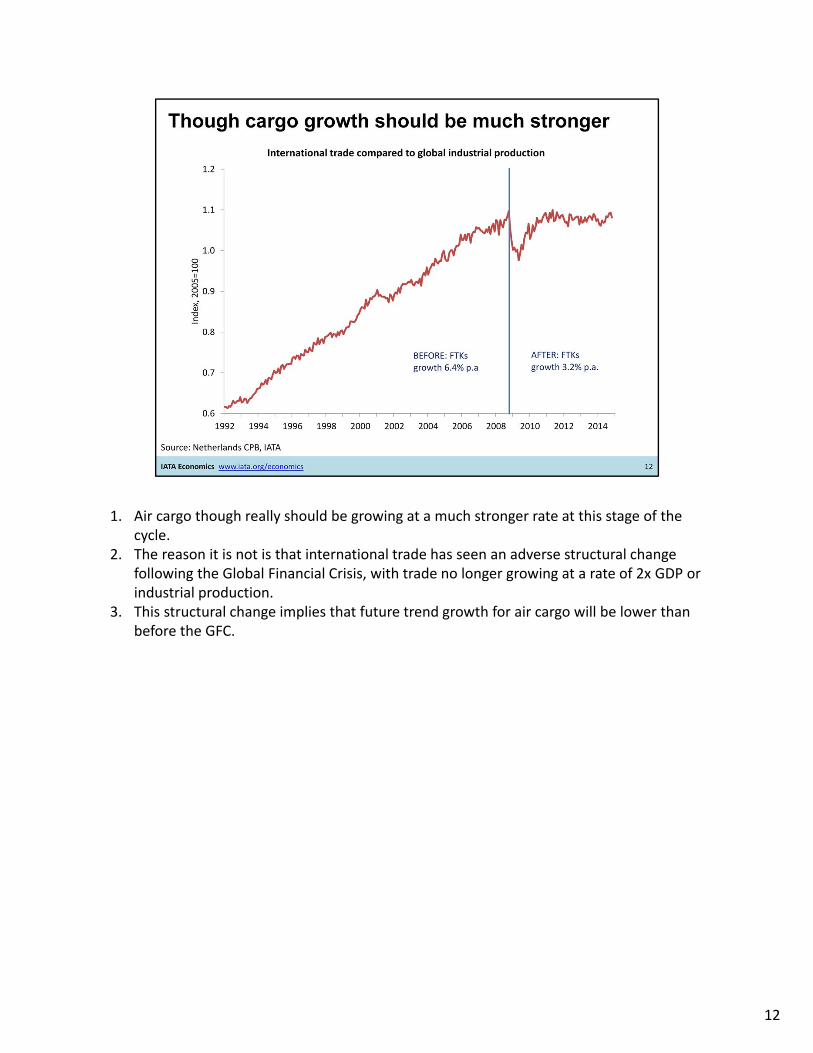
1. Air cargo though really should be growing at a much stronger rate at this stage of the cycle.
2. The reason it is not is that international trade has seen an adverse structural change following the Global Financial Crisis, with trade no longer growing at a rate of 2x GDP or industrial production.
3. This structural change implies that future trend growth for air cargo will be lower than before the GFC.
12
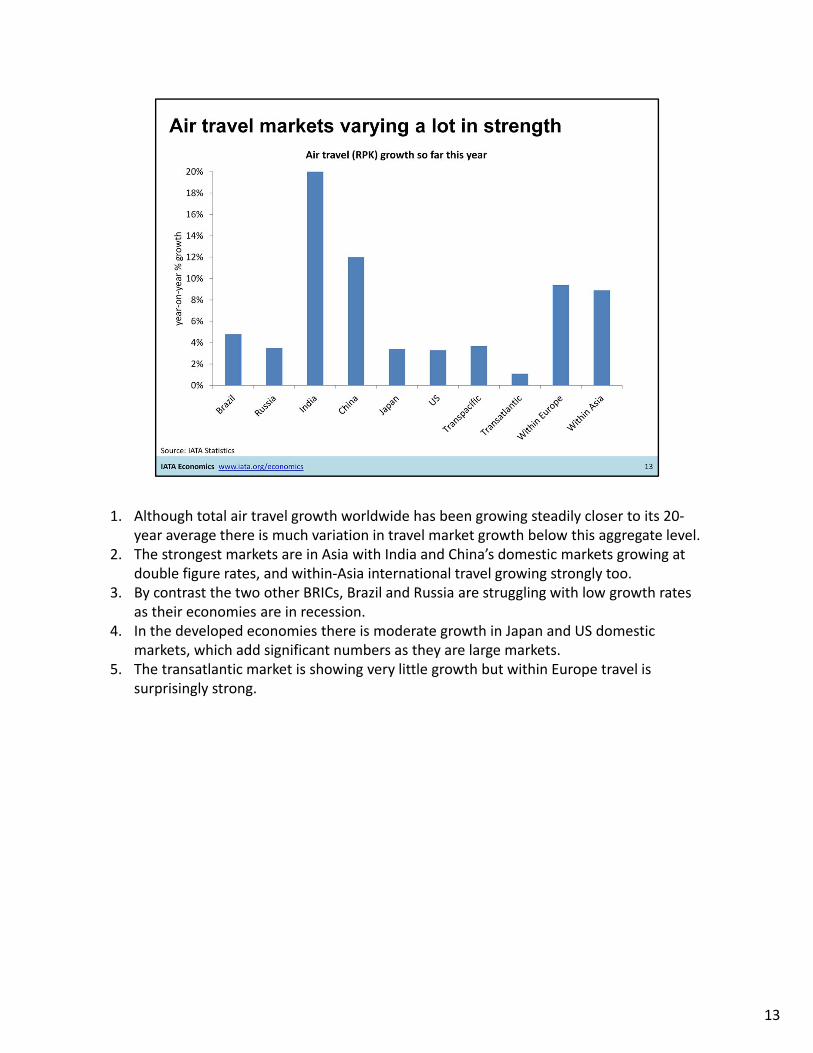
1. Although total air travel growth worldwide has been growing steadily closer to its 20‐year average there is much variation in travel market growth below this aggregate level.
2. The strongest markets are in Asia with India and China’s domestic markets growing at double figure rates, and within‐Asia international travel growing strongly too.
3. By contrast the two other BRICs, Brazil and Russia are struggling with low growth rates as their economies are in recession.
4. In the developed economies there is moderate growth in Japan and US domestic markets, which add significant numbers as they are large markets.
5. The transatlantic market is showing very little growth but within Europe travel is surprisingly strong.
13
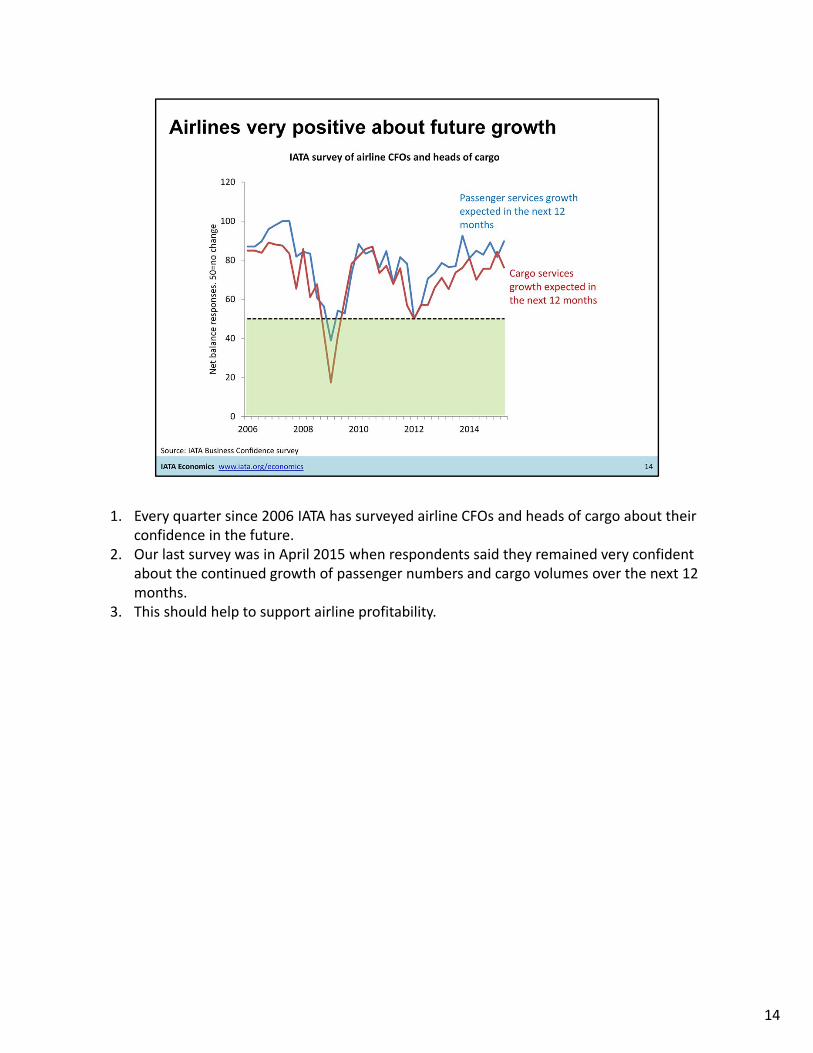
1. Every quarter since 2006 IATA has surveyed airline CFOs and heads of cargo about their confidence in the future.
2. Our last survey was in April 2015 when respondents said they remained very confident about the continued growth of passenger numbers and cargo volumes over the next 12 months.
3. This should help to support airline profitability.
14
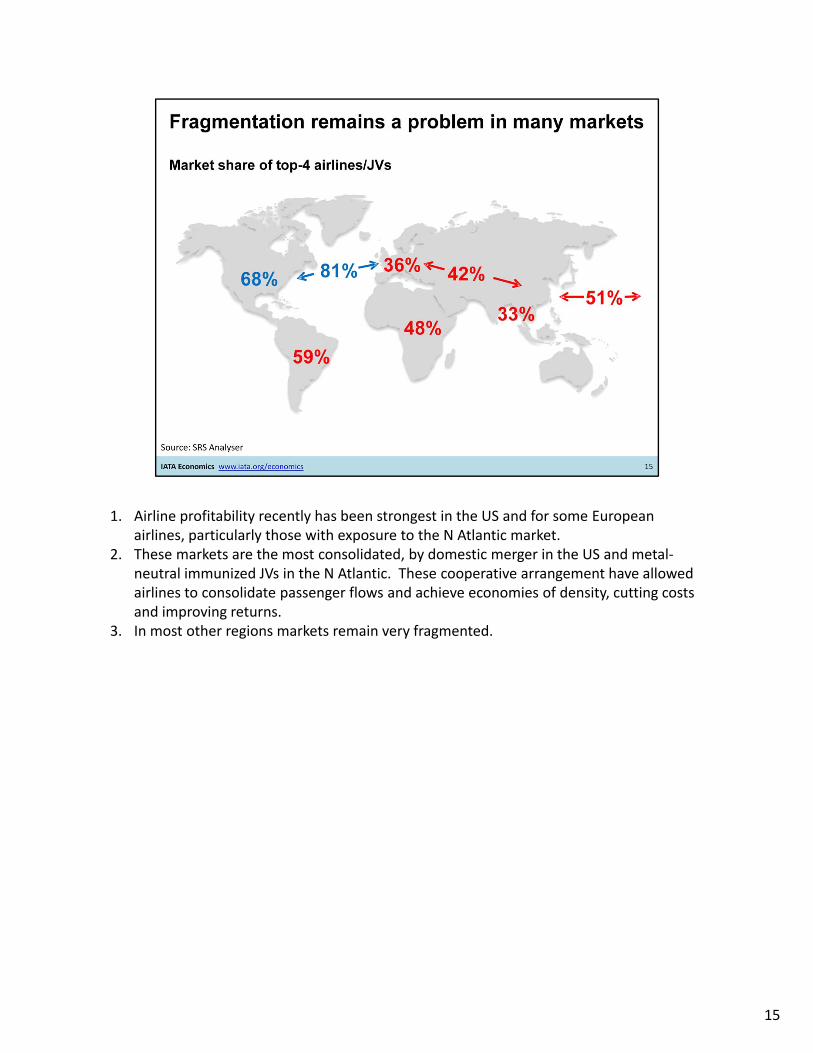
1. Airline profitability recently has been strongest in the US and for some European airlines, particularly those with exposure to the N Atlantic market.
2. These markets are the most consolidated, by domestic merger in the US and metal‐neutral immunized JVs in the N Atlantic. These cooperative arrangement have allowed airlines to consolidate passenger flows and achieve economies of density, cutting costs and improving returns.
3. In most other regions markets remain very fragmented.
15
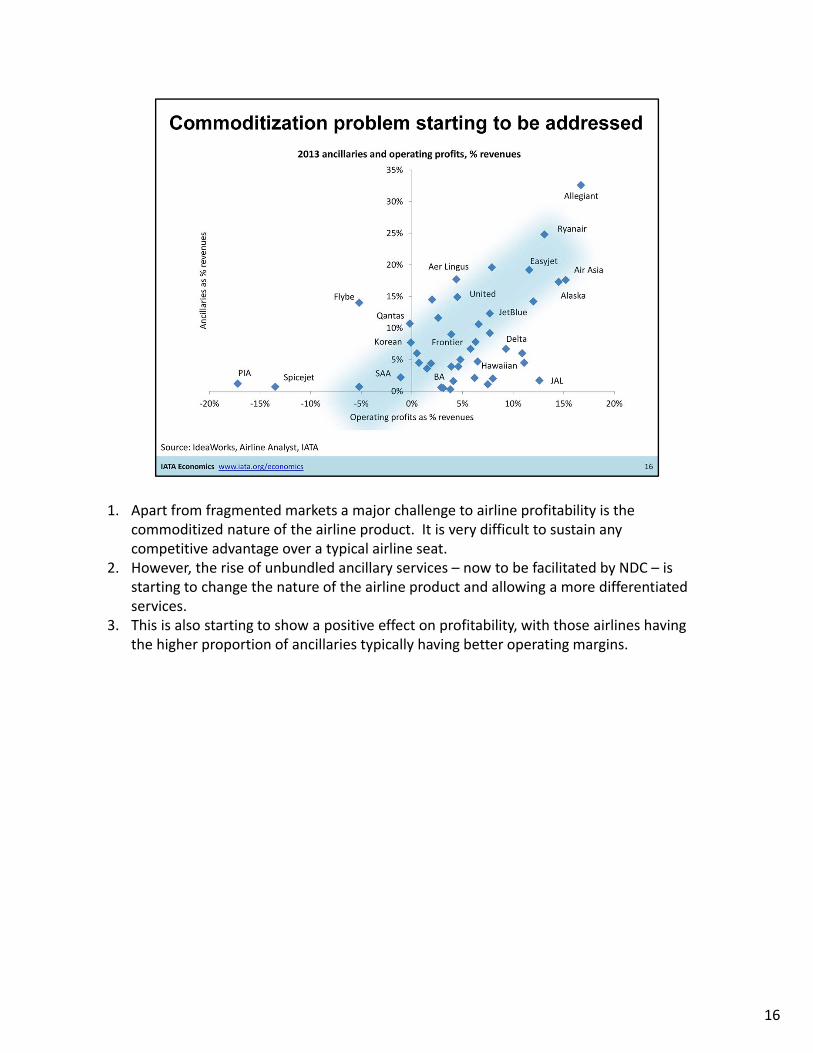
1. Apart from fragmented markets a major challenge to airline profitability is the commoditized nature of the airline product. It is very difficult to sustain any competitive advantage over a typical airline seat.
2. However, the rise of unbundled ancillary services – now to be facilitated by NDC – is starting to change the nature of the airline product and allowing a more differentiated services.
3. This is also starting to show a positive effect on profitability, with those airlines having the higher proportion of ancillaries typically having better operating margins.
16
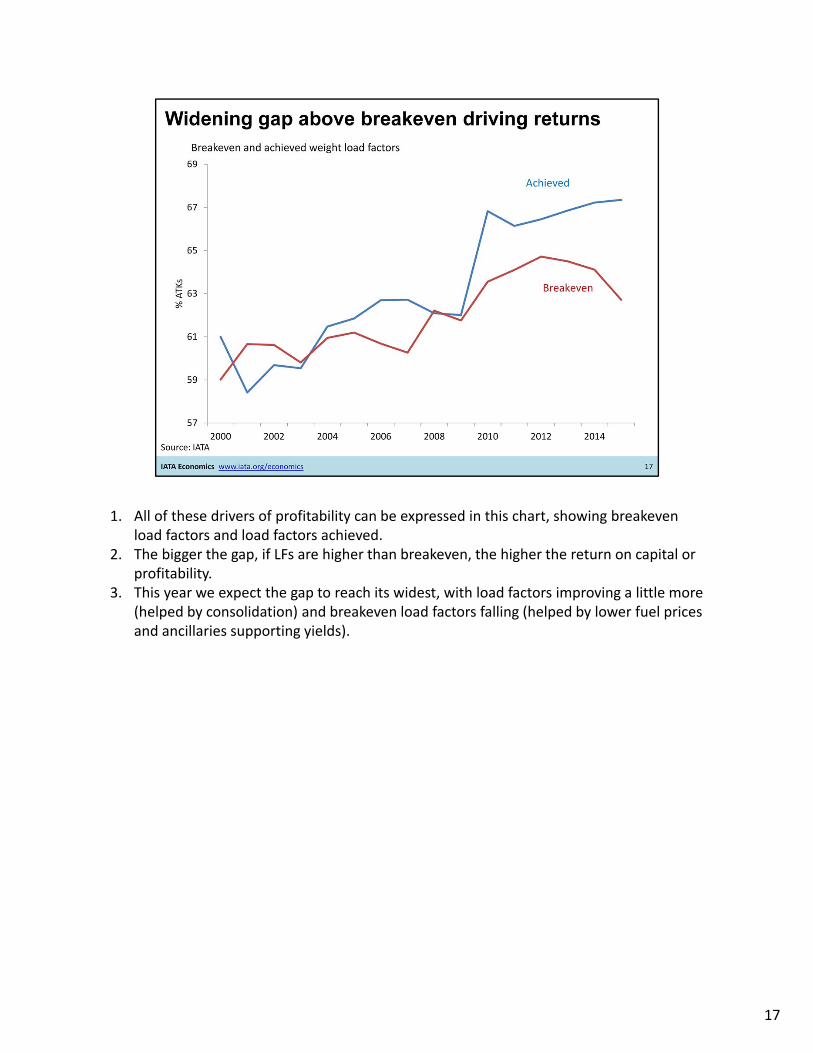
1. All of these drivers of profitability can be expressed in this chart, showing breakeven load factors and load factors achieved.
2. The bigger the gap, if LFs are higher than breakeven, the higher the return on capital or profitability.
3. This year we expect the gap to reach its widest, with load factors improving a little more (helped by consolidation) and breakeven load factors falling (helped by lower fuel prices and ancillaries supporting yields).
17
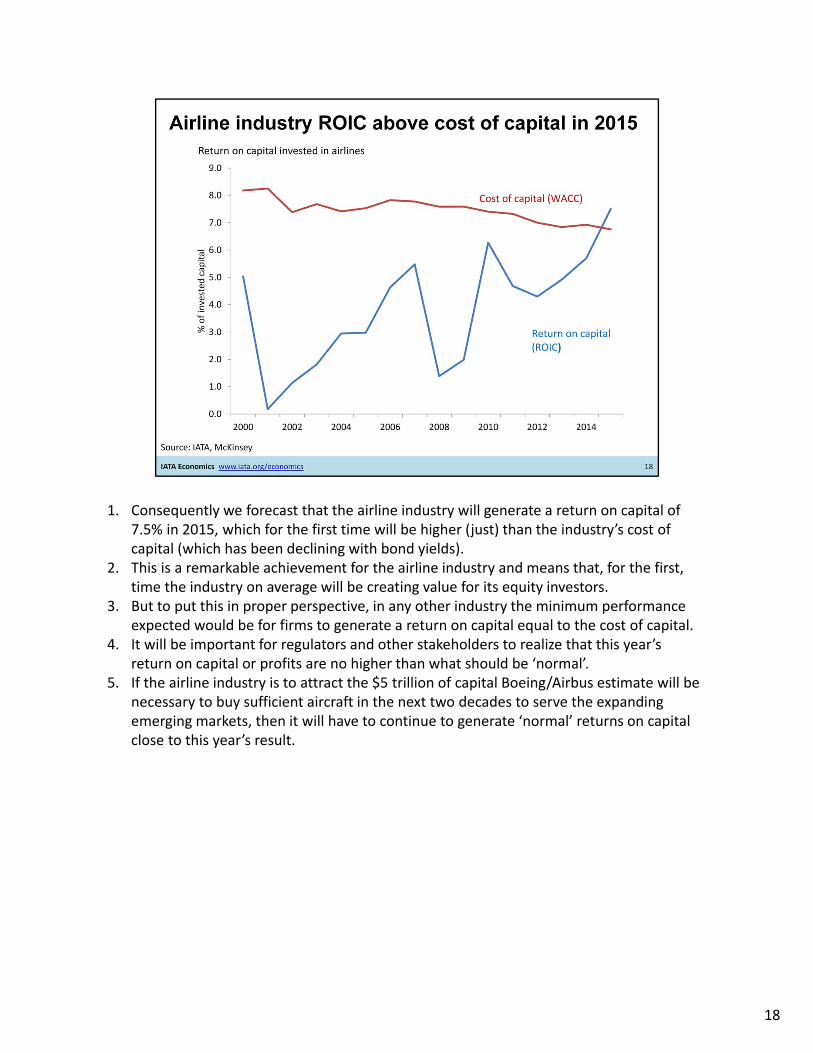
1. Consequently we forecast that the airline industry will generate a return on capital of 7.5% in 2015, which for the first time will be higher (just) than the industry’s cost of capital (which has been declining with bond yields).
2. This is a remarkable achievement for the airline industry and means that, for the first, time the industry on average will be creating value for its equity investors.
3. But to put this in proper perspective, in any other industry the minimum performance expected would be for firms to generate a return on capital equal to the cost of capital.
4. It will be important for regulators and other stakeholders to realize that this year’s return on capital or profits are no higher than what should be ‘normal’.
5. If the airline industry is to attract the $5 trillion of capital Boeing/Airbus estimate will be necessary to buy sufficient aircraft in the next two decades to serve the expanding emerging markets, then it will have to continue to generate ‘normal’ returns on capital close to this year’s result.
18
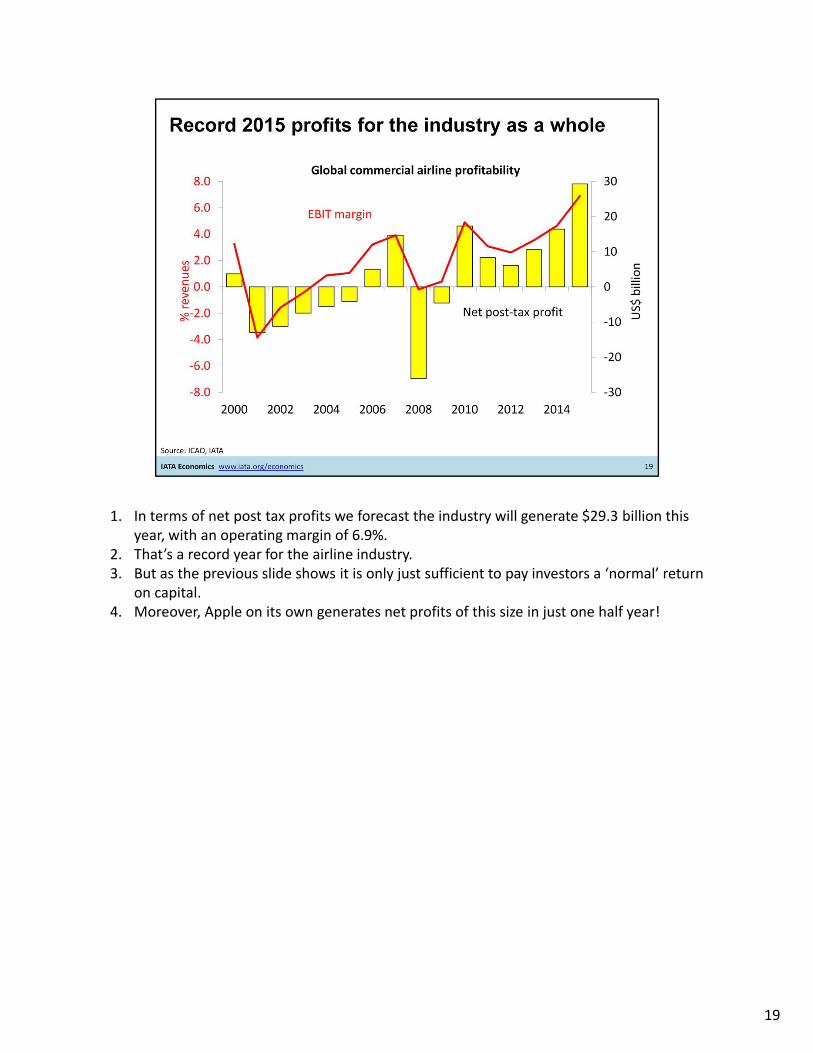
1. In terms of net post tax profits we forecast the industry will generate $29.3 billion this year, with an operating margin of 6.9%.
2. That’s a record year for the airline industry.3. But as the previous slide shows it is only just sufficient to pay investors a ‘normal’ return
on capital.4. Moreover, Apple on its own generates net profits of this size in just one half year!
19
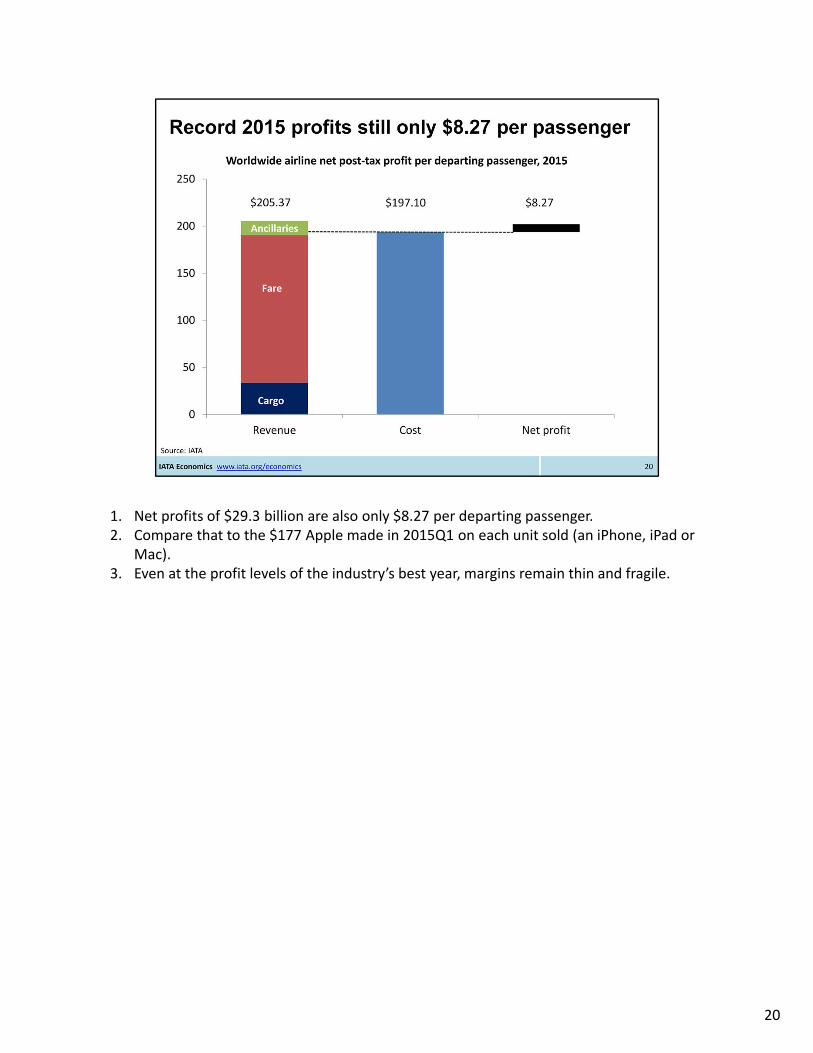
1. Net profits of $29.3 billion are also only $8.27 per departing passenger.2. Compare that to the $177 Apple made in 2015Q1 on each unit sold (an iPhone, iPad or
Mac).3. Even at the profit levels of the industry’s best year, margins remain thin and fragile.
20
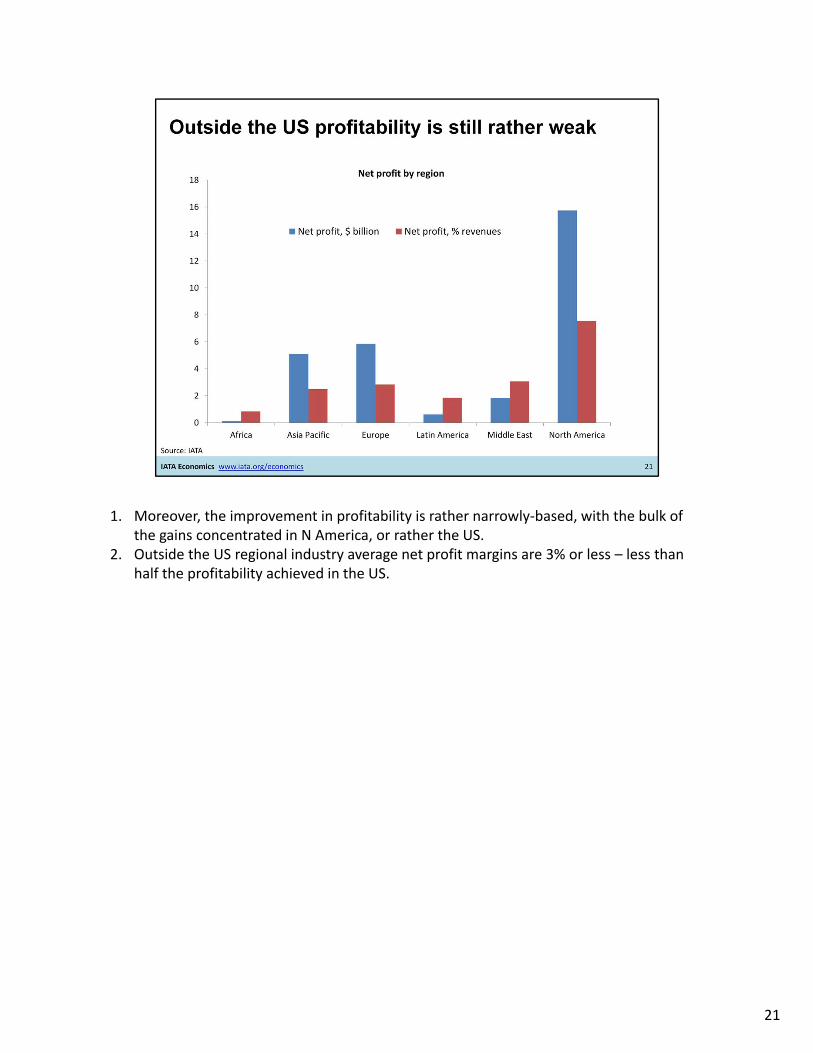
1. Moreover, the improvement in profitability is rather narrowly‐based, with the bulk of the gains concentrated in N America, or rather the US.
2. Outside the US regional industry average net profit margins are 3% or less – less than half the profitability achieved in the US.
21
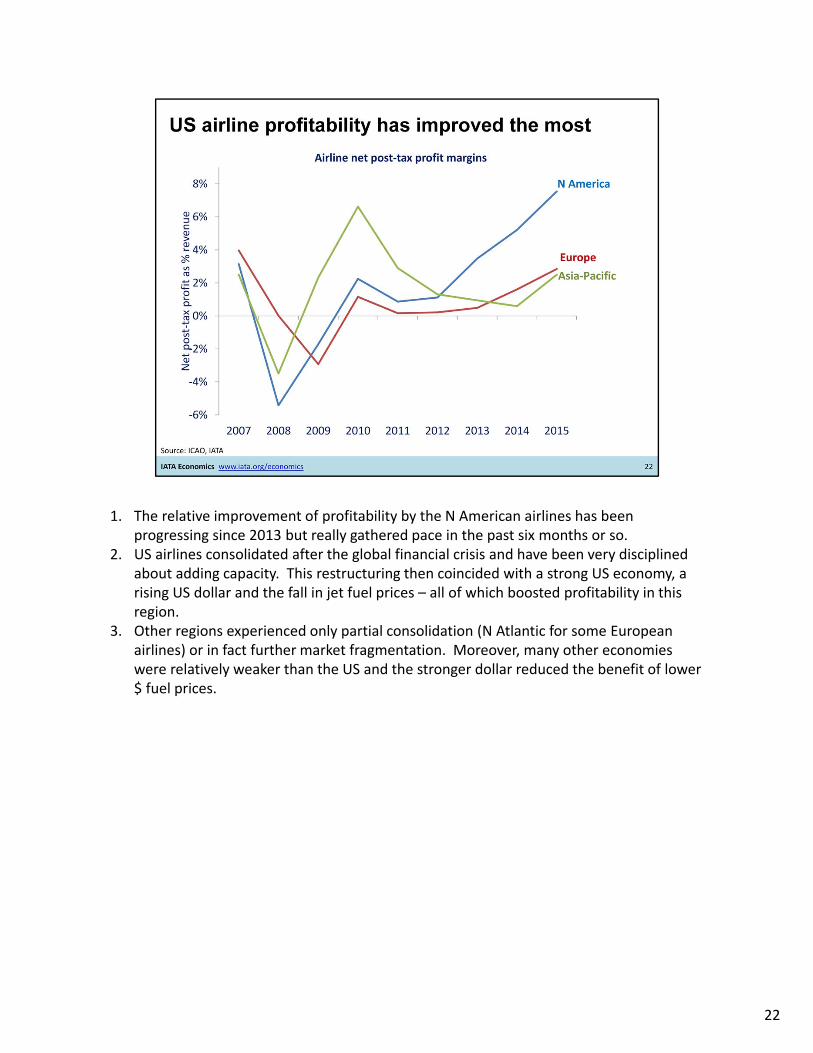
1. The relative improvement of profitability by the N American airlines has been progressing since 2013 but really gathered pace in the past six months or so.
2. US airlines consolidated after the global financial crisis and have been very disciplined about adding capacity. This restructuring then coincided with a strong US economy, a rising US dollar and the fall in jet fuel prices – all of which boosted profitability in this region.
3. Other regions experienced only partial consolidation (N Atlantic for some European airlines) or in fact further market fragmentation. Moreover, many other economies were relatively weaker than the US and the stronger dollar reduced the benefit of lower $ fuel prices.
22
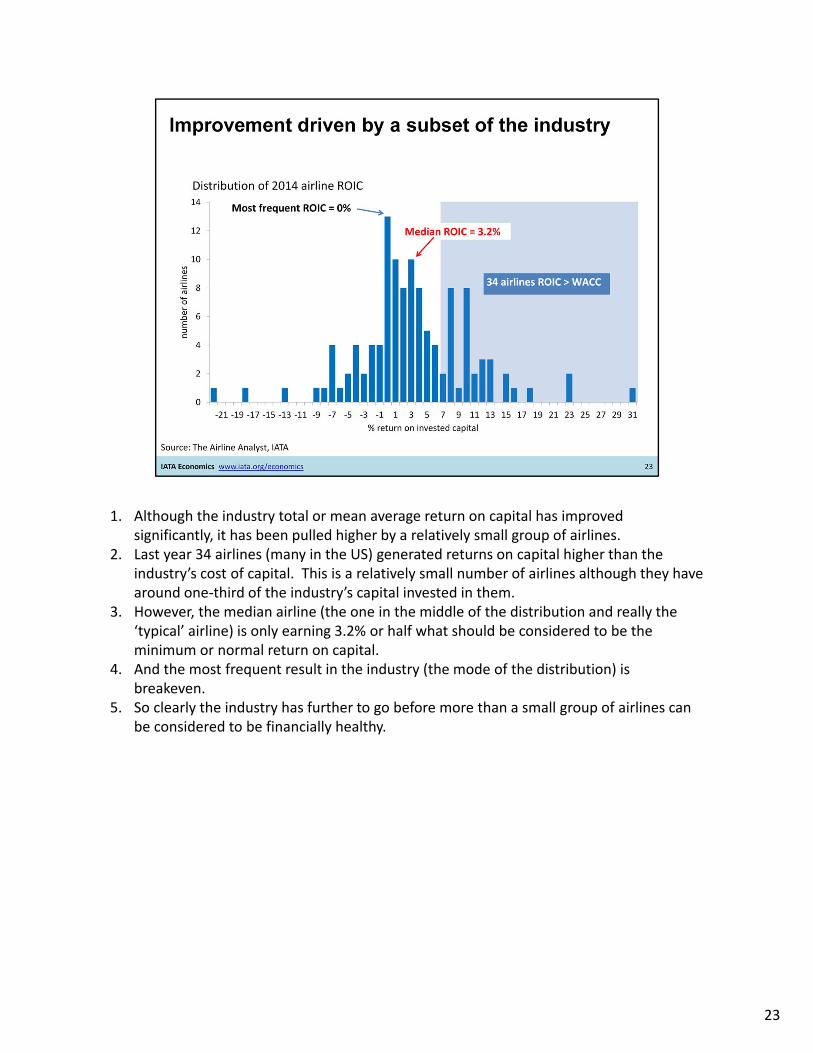
1. Although the industry total or mean average return on capital has improved significantly, it has been pulled higher by a relatively small group of airlines.
2. Last year 34 airlines (many in the US) generated returns on capital higher than the industry’s cost of capital. This is a relatively small number of airlines although they have around one‐third of the industry’s capital invested in them.
3. However, the median airline (the one in the middle of the distribution and really the ‘typical’ airline) is only earning 3.2% or half what should be considered to be the minimum or normal return on capital.
4. And the most frequent result in the industry (the mode of the distribution) is breakeven.
5. So clearly the industry has further to go before more than a small group of airlines can be considered to be financially healthy.
23
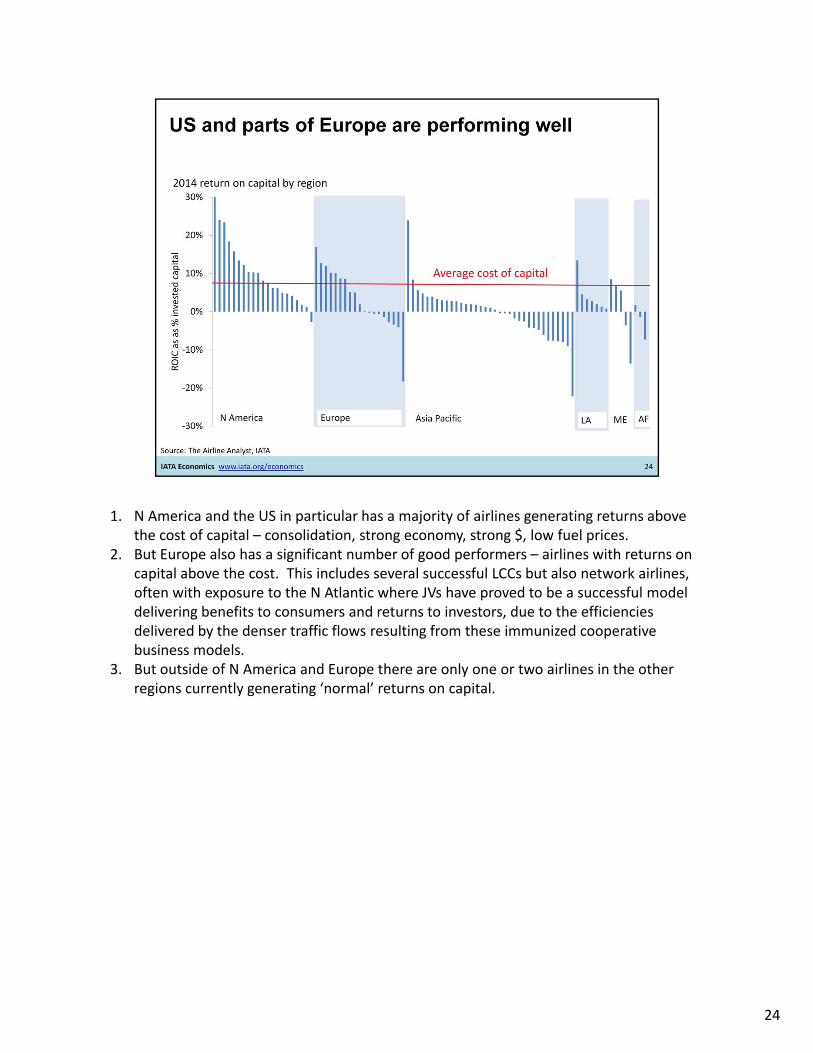
1. N America and the US in particular has a majority of airlines generating returns above the cost of capital – consolidation, strong economy, strong $, low fuel prices.
2. But Europe also has a significant number of good performers – airlines with returns on capital above the cost. This includes several successful LCCs but also network airlines, often with exposure to the N Atlantic where JVs have proved to be a successful model delivering benefits to consumers and returns to investors, due to the efficiencies delivered by the denser traffic flows resulting from these immunized cooperative business models.
3. But outside of N America and Europe there are only one or two airlines in the other regions currently generating ‘normal’ returns on capital.
24
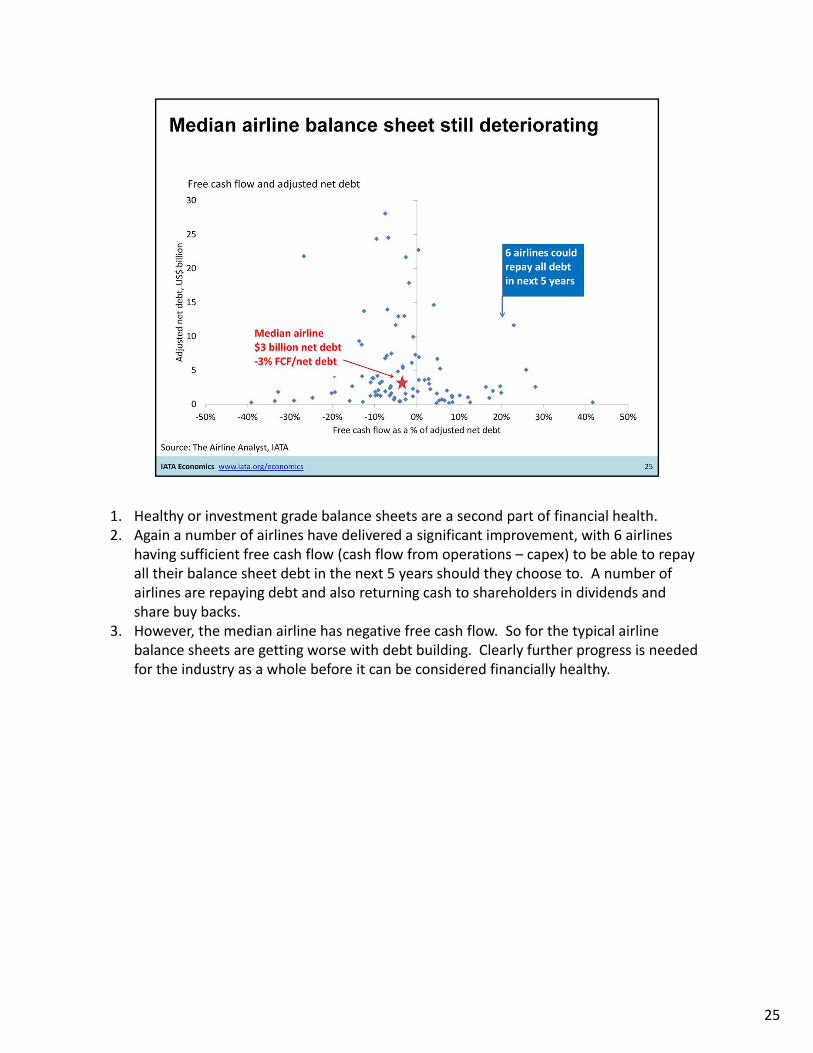
1. Healthy or investment grade balance sheets are a second part of financial health.2. Again a number of airlines have delivered a significant improvement, with 6 airlines
having sufficient free cash flow (cash flow from operations – capex) to be able to repay all their balance sheet debt in the next 5 years should they choose to. A number of airlines are repaying debt and also returning cash to shareholders in dividends and share buy backs.
3. However, the median airline has negative free cash flow. So for the typical airline balance sheets are getting worse with debt building. Clearly further progress is needed for the industry as a whole before it can be considered financially healthy.
25