economic policy centre
TRANSCRIPT


Economic Policy Centre SECURING OUR ENERGY FUTURE 1
Economic Policy Centre www.economicpolicycentre.com
About the Economic Policy Centre
The purpose of the Economic Policy Centre (EPC) is to promote high quality research and debate across all areas of economics in a free democratic society. The EPC's vision is to close the gap between economic policy and knowledge. Ultimately it brings together economic opinion formers - in academia, business, the media and government - in new and innovative ways.
Team and Partnership Network DAN LEWIS – CHIEF EXECUTIVE DR TIM EVANS – CHAIRMAN Senior Fellows DAVID KERN CORIN TAYLOR DR RICHARD WELLINGS
Advisory Board PROFESSOR NICK BOSANQUET SIR JOHN BOURN KCB PHILIP COLLINS CLAIRE FOX TIM HARFORD ANGELA KNIGHT CBE PAUL ORMEROD STEPHEN POLLARD PROFESSOR GAREL RHYS CBE ASHLEY SEAGER DAVID SMITH PROFESSOR DAVID B. SMITH PROFESSOR MICHAEL STUERMER GILES WILKES
This paper is published by the Economic Policy Centre. The analysis and findings of this paper is the author’s alone and should not be taken to represent the views of either the Advisory Board or of the Senior Fellows. With many thanks to Security Futures for sponsoring the publication of this paper. Security Futures is a non-profit, non-partisan security policy research group based in London. The organisations aim is to facilitate timely and targeted high-level policy discussions in order to inform and guide policy formation on issues of UK strategic national importance. This publication reflects the personal views of the author and it should not be assumed that it reflects the institutional views of the sponsoring organization. On the cover: This word cloud is created from wordle www.wordle.net and words are sizes according to the number of times they appear in the text of this paper. Economic Policy Centre, Unit 3 Cedar Court, 1 Royal Oak Yard, London SE1 3GA.

Economic Policy Centre Why and how it must be done 2
Contents
About the Author ..................................................................................................................... 4 Summary .................................................................................................................................. 5 Introduction.............................................................................................................................. 7 Chapter 1: What’s Wrong with the Existing Policy Framework?...................................... 11
Who are the Policy Implementers (Deliverers)? .................................................................. 17 Chapter 2: How far can we go with existing Clean Electricity Technologies today?..... 19
Solar Photovoltaics .............................................................................................................. 19 Onshore Wind ...................................................................................................................... 21 Offshore Wind ...................................................................................................................... 22 Large Hydro ......................................................................................................................... 22 Severn Tidal Barrage ........................................................................................................... 23 Wave and Tidal Stream ....................................................................................................... 24 Nuclear................................................................................................................................. 25 Coal with Carbon Capture and Storage (CCS) fitted ........................................................... 26
Chapter 3: Don’t Bet on Gas – the UK Way ........................................................................ 29 Chapter 4: Popular Policy Solutions and why they won’t work ....................................... 36
Energy Efficiency ................................................................................................................. 36 Carbon Taxes....................................................................................................................... 38 Carbon Emissions Trading................................................................................................... 38 Personal Carbon Trading..................................................................................................... 40 Independent Carbon Policy Committee ............................................................................... 40 Feed-In-Tariffs (FITs) ........................................................................................................... 40 A new Energy Agency/ Quango (s) / Ministry / Minister ...................................................... 41 Capacity Payments .............................................................................................................. 42 Distributed Micro-Generation (DMG) ................................................................................... 43
Chapter 5: A Solution that will work.................................................................................... 45 The Clean and Secure Energy Obligation (CSEO).............................................................. 45 Gaining entry into the Clean and Secure Club .................................................................... 46 The Clean and Secure Points System................................................................................. 46 Possible Changes in Prospect ............................................................................................. 49 The New Financing Arrangements of the CSEO................................................................. 50
Chapter 6: Policy Recommendations.................................................................................. 51 Policy Focus......................................................................................................................... 51 Bureaucratic Streamlining.................................................................................................... 51 Surplus Energy Policy Disposal ........................................................................................... 51 Strategic ............................................................................................................................... 51 Conclusion ........................................................................................................................... 52
Appendix 1: UK Energy in Numbers.................................................................................... 53
Chart 1: E.ON’s 2007 Projection of UK Electricity Supply and Demand ................................... 8 Chart 2: OFGEM’s Scenario Range for Spare Capacity Margins ............................................. 9 Chart 3: Solar Module Prices – the last 8 years ...................................................................... 20
Table 1: Summary of new RO Bands...................................................................................... 12 Table 2: UK Coal and Oil-fired plants due to close by 2016 ................................................... 14 Table 3: Main Quangos charged with delivering the Government’s Targets on Energy Policy
.......................................................................................................................................... 17 Table 4: Some Regional Bodies connected with the Implementation of Energy Policy.......... 17

Economic Policy Centre SECURING OUR ENERGY FUTURE 3
Table 5: Estimated Clean Electricity Generator Metrics – UK Bias......................................... 19 Table 6: Annual Global Solar Pv Production Figures .............................................................. 20 Table 7: Tidal Electric’s Alternative to the Severn Barrage – Tidal Lagoons .......................... 24 Table 8: The World’s Largest Coal Consumers (2008) ........................................................... 27 Table 9: The UK Gas Story 1997-2008 in Billion Cubic Metres: (Source: National Grid) ....... 29 Table 10: The Rapid Growth in UK Gas for Electricity (Source: BERR Energy Statistics) ..... 30 Table 11: UK Gas Imports by Country in 2008........................................................................ 33 Table 12: UK Energy Ministers since 1997 ............................................................................. 41 Table 13: Example CSEO Rankings for New, Proposed and Existing Technologies and
Electricity Sources............................................................................................................ 48 Table 14: UK Household Electricity Prices – relative to other European Nations................... 53 Table 15: UK Industrial Electricity Prices – relative to other European Nations...................... 54 Table 16: UK Total Annual Electricity Demand in Terrawatt Hours: 1970 – 2007 .................. 55 Table 17: UK Electricity Consumption per Capita relative to the Rest of the World (2005) .... 55 Table 18: UK Energy Efficiency relative to the Rest of the World ........................................... 56 Table 19: CO2 Annual Emissions per Capita.......................................................................... 57 Table 20: How Carbon Efficient is the UK? ............................................................................. 57 Table 21: Where the UK gets its Electricity from – Fuel input for Electricity Generation 2007 58 Table 22: Who uses the Electricity ? ....................................................................................... 58

Economic Policy Centre Why and how it must be done 4
About the Author Dan Lewis is the Chief Executive of the Economic Policy Centre, a think tank and policy research organisation that is the leading hub of the UK economics community. Since graduating in 1994 in Modern Languages and History, he worked until 2001 in financial organisations in the City of London and Luxembourg. More recently, he ran the Economic Research Council and remains a Research Fellow with the Centre for Policy Studies. A regular contributor to the high quality national and international media his outlets include amongst others: Wall Street Journal, Al-Jazeera, Sky News, BBC Radio, The Daily Telegraph and World Finance Magazine. A prolific author, over the years his publications have included: Recharging The Nation - The Challenge and Cost of Renewable Electricity Generation (2003), The Essential Guide to British Quangos 2005, The Larceny of the Lottery (2007, CPS with Ruth Lea), The Digest of Energy Statistics 2008 and The Essential Guide to EU Quangos 2009. Significantly, he has edited the following publications: Electrifying Britain - forward with Coal, Gas or Nuclear? (2005, ERC, Lodge, Cragg, Grimston), The New Economics of Energy Security (2006, ERC, Ingham, Robinson, Marshall), Cost-Effective Defence (2006, ERC, Page), Creative Destruction in the Music Industry - The Way Ahead (2006, ERC, Dodge), Cracks in the Foundations? A Review of the Role and Functions of the Bank of England after Ten Years of Operational Independence (2007, ERC, Smith), Playing with Monetary Fire (2007, ERC, Congdon), New Nuclear Build in the UK - The Criteria for Delivery (2008, ERC, Hawkins), The Digest of Energy Statistics 2008 (2008, ERC, Hawkins, Lewis), The Essential Guide to EU Quangos 2009 (2009, ERC, Lewis, Ruffle) and Aqua Britannia! How UK Water plc can maintain high investment levels within acceptable pricing limits and raise its profile overseas (2009, ERC, Hawkins). As well also being the CEO of Future Energy Strategies – www.future-es.com - an energy reporting company that researches the energy industry of tomorrow, he currently lives in Surrey with his wife and enjoys playing tennis in his free time.

Economic Policy Centre SECURING OUR ENERGY FUTURE 5
Summary What’s wrong:
• Britain needs to re-order energy policy putting energy security first,
affordability second and environmentally clean energy third • Because over the last 20 years, consecutive governments have not done this,
the prospect of electricity shortages from the middle of the next decade are very real
• The consequences of which are of inestimable damage to the UK’s economy and reputation
• Britain has too much energy policy long on aspiration, woefully short on practicality, with all too little consideration given over to the pursuit of the national interest
• There are currently nine main drivers of the energy policy framework which are very costly, ineffective and do not place sufficient value on energy security
• Of critical importance to the existing framework is the EU which has placed a much bigger burden on the UK than on other EU states with an unachievable renewables target by 2020 and the premature closing of coal-fired plants not compliant with the Large Combustion Plant Directive
• UK energy policy is overstaffed by big budget bureaucratic quangos, mostly created in the last 10 years, who hold themselves in high regard
• Too much government support is focused on expensive and still quite experimental clean energy technologies that cannot provide large quantities of scaleable, secure, predictable and dispatchable power – solar, wind, tidal stream and to some extent coal fitted with carbon capture and storage
• And virtually none too to those that can – large hydro, severn tidal barrage / tidal lagoons, nuclear, interconnectors with France, continental Scandinavia and even Iceland
• While global gas supplies are growing, unlike oil it is a regional non-fungible commodity and the UK’s exposure to those supplies is limited
• Limited future UK gas supplies are a huge problem because of the UK’s burgeoning intermittent renewables programme, its long-term commitment to reducing carbon and its impending energy gap – all of which will require a lot of gas for some time
• Unfortunately, the UK has failed to grasp this central fact and the government even harbours the illusion that gas demand will fall 30% by 2020
• The UK government has not helped to set up adequate long-term supply contracts in the LNG market, is woefully short of gas storage, its own domestic supplies in the North Sea have not been well managed and are declining fast
• There are a great many popular policy solutions that will take us nowhere or anyway not very far
• Energy efficiency will only increase energy consumption, carbon taxes require international agreement and faith that our politicians can set the price and correctly predict the outcome
• With carbon trading, the price will never be high, stable or long-term enough and personal carbon trading is not worth the effort. New committees, quangos or other organization(s) have never yet yielded any returns, capacity payments are a solution in search of a problem and distributed micro-generation and smart meters could only ever shave off some peak demand

Economic Policy Centre Why and how it must be done 6
Policy Reform:
• Britain needs less energy policy, a lot more focus and a long-term framework to deliver 100% secure and decarbonised electricity by 2060 – a Clean and Secure Energy Obligation
• Modelled on the existing Renewables Obligation it will have a much lower buyout price but a much longer guaranteed market into the future – critical to lowering the cost of capital and pricing in capital intensive big impact, long-term solutions
• A clean and secure points system to be established for differing technologies and what they can contribute to the UK’s electricity supply to harness a competitive, evolutionarily flexible system that for the first time gives a rating to energy security
• Clean and Secure Energy Committee to be staffed by the Chancellor, Secretary of State for Defence and the relevant Secretary of State for Energy to meet and take updated submissions once a year
To save funds, create energy policy focus and mitigate the risk of the lights going out, the UK should;
• Close down a large range of energy policy quangos mostly created in the last 10 years
• Wind down as quickly as possible all existing government-funded R&D programmes
• Abolish the Climate Change and Carbon Capture Levies • After a positive confrontation with the EU, keep coal-fired stations open beyond
2015 and renegotiate the renewables target along longer-term lines to include other clean and secure energy technologies
• Set a limit to be reviewed annually on how much intermittent power can safely be integrated into the National Grid and the Distribution Network
• Keep the Infrastructure Planning Commission in place • Postpone the rollout of smart meters - to be reviewed again in 2020

Economic Policy Centre SECURING OUR ENERGY FUTURE 7
Introduction At its heart, effective energy policy should be simple. What energy policy has to do is to achieve a quite straightforward set of priorities within defined limits. Those priorities, in order of importance are; Energy Security - without certain access to energy, there can be no economic activity Energy Affordability - unless the price of that access is low enough, economic activity will be limited Environmentally Clean Energy - making the procurement of energy clean primarily at the point of generation and secondly, at the point of consumption to the general benefit of the human environment And whilst energy use can be broadly divided up into heating and cooling, transport fuel and electricity, historically and today, energy policy has really always been understood to be about the UK's electricity supply. That then will be the focus of this report. These three priorities are clear-cut and should not be hard to implement. And yet in Britain today, successive governments have made the energy policy framework needlessly complex and spectacularly ineffective. The latest manifestation of distorted energy policy priorities was thus described in the 2007 Energy White Paper1, which outlined four slightly muddled, feel-good, energy policy goals;
1. To put ourselves on a path to cutting the UK’s carbon dioxide emissions – the main contributor to global warming – by some 60% by about 2050, with real progress by 2020
2. To maintain the reliability of energy supplies 3. To promote competitive markets in the UK and beyond, helping to raise the rate of
sustainable economic growth and to improve our productivity 4. To ensure that every home is adequately and affordably heated
That the UK is now set not to deliver on any of these four goals is damning enough. It’s worse still that, faced with an impending energy gap from retiring nuclear and coal power stations, the government’s preferred choice of replacement technologies has veered, for too long, towards the highly marginal. Moreover, as policy errors have been compounded over time, our situation has become ever more precarious because, as clearly illustrated by the White Paper, energy security has not been prioritised as the number one aim. For all these and a whole host of other reasons outlined below, a perfect storm is gathering against the secure, affordable and environmentally clean supply of the UK’s electricity supply. Today, the UK is simultaneously facing and finding itself in peril from;
• A once in a century credit crunch • The exhaustion of Britain's economically exploitable energy resources of coal, oil and
gas • Nuclear power stations facing imminent retirement without certain replacement
1 Meeting the Energy Challenge – A White Paper on Energy, May 2007 – as published by the Department for Trade and Industry

Economic Policy Centre Why and how it must be done 8
• An ageing electrical infrastructure that will be hard to replace because it is managed by a firm with a staggering net £22.6 billion pounds of debt2 (National Grid Plc)
• The world's most expensive renewables programme that has failed to achieve scale • Location - at the wrong end of the European gas pipeline • A mistaken faith that by building Liquefied Natural Gas (LNG) import facilities,
adequate LNG shipments will miraculously appear • A precarious situation at the very fringes of and uncommitted to the emerging
European electricity market • Vulnerability to EU policy and regulations that do not serve the national interest • Uneven competition for fast dwindling LNG gas supplies that will go where the price is
highest – the Pacific Basin • A prospective dependency on Russian gas • An expanding population forecast to grow faster than planned for available electricity
supply3
E.ON, a major European utility is quite clear about the UK’s emerging energy gap. And this chart, from two years ago is probably the most pessimistic outlook. Chart 1: E.ON’s 2007 Projection of UK Electricity Supply and Demand
Undoubtedly, in the last two years, the recession has curbed electricity demand and whilst power stations will still be closed, the energy gap will not be as great as imagined. This chart from OFGEM shows Great Britain’s electricity de-rated capacity margins in a range of scenarios which they have named; Green Transition, Green Stimulus, Dash for Energy and Slow Growth. What all of them show is that once again, the danger point for margin appears to be in the middle of the next decade and given what we now know about the UK economy, slow growth seems the most likely and dangerous scenario. 2 As at 31st March 2009 3 According to the October 09 report by the Office for National Statistics, the population could rise from 61.3m today to 71.6m by 2033

Economic Policy Centre SECURING OUR ENERGY FUTURE 9
Chart 2: OFGEM’s Scenario Range for Spare Capacity Margins
On current trends, Slow Growth seems likely because as the OFGEM4 report, Project Discovery: Energy Market Scenarios, revealed, the UK would have to spend £200bn on new power stations and related energy infrastructure in the next 10-15 years to avoid running into energy shortfalls. However, the UK’s energy stakeholders were only spending about half of this. And yet faced with such huge problems, policymakers have instead succumbed to the siren voices of lobbies peddling worthy - but highly marginal – technological solutions like;
• Smart Metering • Distributed Micro-Generation • On and Offshore giant wind turbines • Solar Photovoltaics • Combined Heat and Power • Carbon Capture and Storage • Energy Efficiency • Biogas
And this has led to a panoply of proposed and sometimes implemented but nevertheless ineffective policy solutions such as;
• Carbon Trading • Personal Carbon Trading • Carbon Taxes • Capacity Payments • Feed-In-Tariffs • Independent Carbon Policy Committees • A new Energy Department / Agency / Quango • More powers for the regulator, OFGEM
4 Project Discovery Energy Market Scenarios – published 9th October 2009 by OFGEM

Economic Policy Centre Why and how it must be done 10
As this paper will show, the consequence of these choices is that in the years to come, Britain faces the prospect of an energy crunch that will shake its economy and its political class to its very core. For when the national electricity supply stops, it will prove far, far worse than just the lights going out as they did in the much less technologically sophisticated Britain of the 1970s. Without electricity, petrol and diesel pumps no longer function, supermarkets will run out of fresh and frozen food within hours and what they do have cannot be paid for at the electronic tills. Perhaps worst of all, the water supply will dry up because it cannot function without power to the water pumping stations. Looting and riots will invariably ensue before order is restored at enormous cost to the UK’s economy and reputation. And yet, whilst this latter scenario is a doomsday one, it’s far from impossible. If we have learnt anything from this financial crisis, it should be that the worst things, or extreme events, can happen. But quite unlike the Credit Crunch, this is no Black Swan – a high-impact, hard-to-predict and rare event. On the contrary, the UK’s energy predicament is real, widely known and broadly anticipated. But all too little is being done about it. The question then is how do we take steps to retrieve the situation? That in essence, is what this paper is about.
Economic Policy Centre SECURING OUR ENERGY FUTURE 11
Chapter 1: What’s Wrong with the Existing Policy Framework? Britain has in the last decade developed at great cost and to little effect, too much energy policy working to unobtainable goals, overlooked by quangos, often subordinated to the EU, with virtually no consideration given to strategic national energy security interests. The UK does not lack for energy policy. The problem is that it has an abundance. As it stands the UK has no less than nine policy drivers directed at energy policy. These are;
1. The Renewables Obligation (RO) 2. The EU’s 2020 Energy Targets 3. The EU’s Large Combustion Plant Directive 4. The Climate Change Levy and Levy Exemption Certificates 5. The EU’s Emissions Trading Scheme 6. The Climate Change Act 7. The Carbon Reduction Commitment (to be implemented later this year) 8. The Carbon Capture Levy 9. R&D Programmes
The Renewables Obligation, introduced in April 2002, is the government’s main mechanism for increasing the share of renewable electricity generation. It requires electricity suppliers to source from renewables a growing proportion of the electricity they supply. A complex trading system administered by the Non-Fossil Purchase Agency, eligible renewable generators receive a Renewables Obligation Certificate (ROC) for each megawatt hour generated, which they can then sell on to the electricity supplier. If electricity suppliers cannot buy enough ROCs to meet their requirement (and this always happens), they can pay a “buyout” price (a premium set by OFGEM) for any shortfall. In other words, the buyout price is a premium on each megawatt hour they failed to generate by renewable methods. For the period from the 1st April 2008 to 31st March 2009, that buyout price was £35.76, expected to rise to £37.19 over the next year5. Starting at 3% in 2003, the proportion of renewables is meant to rise annually, to 10.4% by 2010 and supposed to reach 15.4% by 2015. It is guaranteed by law until 2037 (extended for 10 years by Chancellor Alistair Darling in the 2008 Pre-Budget report), however the RO can be rebanded – raising or lowering the subsidy for a given technology – every three years. Arguably, one of the better features of the RO was that it was technologically neutral – there was one price for all renewables (except large hydro) and so the cheapest could win. It was also a far too generous tariff for onshore wind, as many wind farms were able to achieve an internal rate of return of up to 25%6. And nor has the credit crunch much increased the overall cost of debt and lowered the rate of return. According to research by New Energy Finance, the increase in the Project Spread from around 1% to 3% and the Term Swap from near zero to 1.5% for a typical European Wind Farm has been largely offset by a fall in the ECB base
5 See http://www.newenergyfocus.com/do/ecco.py/view_item?listid=1&listcatid=32&listitemid=2236 6 According to a March 2009 note from OFGEM, Helping to Shape the Energy Future of GB Consumers – UBS is quoted as saying that the Internal Rate of Return (IRR - the true annual rate of earnings on an investment) for wind had fallen from 22% to 14% - still pretty good. An article by Jonathan Leake, Environment Editor of the Sunday Times Consumers beware the costly spin of wind turbines published 29th March 2009 assumed capex costs of £3-4 million for a 3MW onshore wind turbine, working at a 35% load factor, producing 9,200 MWh a year, receiving the market price of £36 per megawatt hour plus £48 for each ROC of 1 MWh. This tallies with an internal rate of return of around 17% or all your money back in 4.5 years, excluding the cost of debt, servicing costs and not uncommon mechanical breakdown.

Economic Policy Centre Why and how it must be done 12
rate from 4 to 1%7. The fall in base rate set by the Bank of England has meanwhile been that much more dramatic – from 5% to 0.5% in less than a year. Consequently, onshore wind with the lowest capex costs per megawatt was and still is the most popular choice for developers. This has led to sustained protests by other renewable industry lobbies and last year this worked – the government agreed to introduce banding to the RO, i.e. choosing what rates of subsidy would apply to each type of renewable energy. So government has once again reverted to picking winners. Table 1: Summary of new RO Bands8 Generation Type ROCs/MWh
Hydro-electric 1
Onshore Wind 1
Offshore Wind 1.5
Wave 2
Tidal Stream 2
Tidal Impoundment – Tidal Barrage 2
Tidal Impoundment – Tidal Lagoon 2
Solar Photovoltaic 2
Geothermal 2
Geopressure 1
Landfill Gas 0.25
Sewage Gas 0.5
Energy from Waste with CHP 1
Pre-banded gasification 1
Pre-banded pyrolysis 1
Standard gasification 1
Standard pyrolysis 1
Advanced gasification 2
Advanced pyrolysis 2
Anaerobic Digestion 2
Co-firing of Biomass 0.5
Co-firing of Energy Crops 1
Co-firing of Biomass with CHP 1
Co-firing of Energy Crop with CHP 1.5
Dedicated Biomass 1.5
Dedicated Energy Crops 2
Dedicated Biomass with CHP 2
Dedicated Energy Crops with CHP 2
Critics contend that the RO has a great many faults, starting with cost. Before the banding was implemented, it had been estimated that the financial burden would be £1 billion per year by 20109. A 2005 report by the National Audit Office, Renewable Energy, concluded that the 7 See Cost of Debt, Typical European Wind Farm – powerpoint presentation to the Westminster Energy Forum, 24th September 2009. A presentation by Angus McCrone. 8 See Department of Energy and Climate Change – Government Response to the Statutory Consultation on the Renewables Obligation Order 2009 – published December 2008 9 The high cost of the RO was correctly anticipated by the Public Accounts Committee in 2005, see http://www.publications.parliament.uk/pa/cm200506/cmselect/cmpubacc/413/413.pdf

Economic Policy Centre SECURING OUR ENERGY FUTURE 13
then ROC buyout price of £30 was far too high and whereas onshore wind could get started on an IRR of 8%, the RO raised that to between 17 and 25%10. In September 2008, the International Energy Agency published “Deploying Renewables – Principles for Effective Policies” by Dr Paolo Frankl, which compared the effectiveness of renewables policies across 35 countries. The UK’s RO was firmly in the bottom rung when it came to effectiveness11. With no reduction of the RO for onshore wind and increases for the other renewable technologies, it will inevitably now be even more expensive. There are also additional indirect costs incurred by the consumer by National Grid – a regulated monopoly – in order to make the investments to integrate additional gigawatts of intermittent power, often in new locations far from the main population hubs. As was earlier mentioned, because it favoured the cheapest technology, onshore wind, from the consumer’s point of view, it was not a bad thing financially. However, the fundamental shortcoming here is that it did take into account the intrinsically lower value of intermittent power providers – like wind and solar - and indirectly worked against the financial viability of baseload and dispatchable suppliers of renewable electricity – like hydro. Moreover, right from the start, the RO did not include large hydroelectric plants over 20 megawatts. Fully amortised hydroelectric power is the cheapest form of electricity bar none, yet the capital sums required, the long construction time and the even longer payback period means that it is still very hard to finance, especially in today’s climate. If the RO had been sectioned off for additional construction of new large hydro plant, this could have made a useful impact. Moreover, some investors have found the RO a very difficult proposition when it comes to raising finance. This is because of the unpredictable impact of a floating price in the secondary market. For this secondary market’s floating price is determined by the demand from utilities for renewables in order to meet requirements that they were not able to fulfil by other means. As one cynical analyst opined confidentially, “ . . . the way for windfarm operators to maximize profits from the RO is to secure their own windfarm, then fund local opposition to all other future developments, in order to drive up the buyout price they would receive because of the limited supply”. The EU’s 2020 target – the EU Renewables Directive, was signed into force as one of the last acts of outgoing Prime Minister, Tony Blair. The UK, along with other European nations, is now committed to transforming the European energy sector and producing Europe-wide 20% of its energy – not just electricity, but heating, cooling and transport fuel too - from renewables by 2020. This poses a special problem for this country because of all the EU countries, the UK, in spite of a lower target of 15%, actually has the biggest gap – over 13% - to close; from 1.30% in 2005 to 15%. Signing up to targets is one thing, actually achieving them is quite another. Few seriously consider that much impact could be made in transport and heating and cooling, so almost all of the increase in renewables will have to be made in electricity. A study commissioned by DBERR from Poyry Energy Consulting was scathing12 about its feasibility. It estimated the cost to the UK in 2020 of meeting its 15% burden share at between EUR 5 and 6.7 billion with lifetime costs between EUR 59 and 93.1 billion. Of particular note is the fact that the target has a clear bias in favour of relatively small modular power plants like wind turbines, which are available off the shelf and could conceivably start paying for themselves quickly and works against large energy secure low carbon alternatives such as nuclear, CCS-fitted coal power stations, large hydro and even interconnectors with the continent. The EU’s Large Combustion Plant Directive applies to all combustion plants with a thermal output greater than 50 megawatts licensed to operate before the 1st July 1987 and in operation in 2000. The LCP aims to reduce acidification, ground level ozone and particles throughout Europe by reducing emissions of sulphur dioxides, nitrogen oxides and particulate matter. Those plants not able to meet the cost of complying with the directive – principally
10 See Box 17 of the NAO Report, Renewable Energy – pdf page 41 11 See http://www.futures-e.org/WS-Rome/Frankl%20Futures-E_Principles%20Effective%20Policies_v%201.1%20short.pdf 12 Compliance Costs for Meeting the 20% Renewable Energy Target in 2020 – Poyry Consulting Ltd.

Economic Policy Centre Why and how it must be done 14
through Flue Gas Desulphurisation technology (FGD) - have a scheduled “end of life” date of the 31st December 2015 or 20,000 hours of use. Table 2: UK Coal and Oil-fired plants due to close by 2016 Plant Name Fuel Capacity (GW)
Tilbury Coal 1.1
Cockenzie Coal 1.2
Didcot Coal 2.1
Ferrybridge Coal 1.0
Ironbridge Coal 1.0
Kingsnorth Coal/Oil 2.0
Littlebrook Oil 1.2
Fawley Oil 1.0
Grain Oil 1.4
Total Capacity 12.0
There is little doubt about the harmful effects of coal-fired pollution, but the LCPD rather than stimulate investment in cleaner coal technology, has actually worked to accelerate the closure of these plants without any consideration given over to replacement. This is particularly the case with the UK, whose coal plants are much older and less easy to convert. In fact, it is quite possible that five of these plants may even have to close earlier, by spring 2013. This is because according to a report by Utilyx, they are using up their allotted 20,000 hours much faster than anticipated. And ironically, because coal plants are trying to reduce their emissions of harmful substances, they are buying more Russian coal because it has a lower sulphur content at 0.3% rather than the British coal’s 1.6%. The Climate Change Levy and Levy Exemption Certificates. These were introduced on April 1st 2001 and were intended to reduce annual emissions by industry by some 2.5 million tonnes by 2010. A levy is paid by industrial users for their consumption of energy and the existing rates – adjusted for inflation annually – that industrial users have to pay are: - 0.456 pence a kilowatt hour for electricity, 0.159 pence a kilowatt hour for gas, 1.018 pence per kg for LPG and 1.242 pence per kilo for coal13. Part of the revenue from the CCL is used to fund energy efficiency initiatives, including the Carbon Trust. Levy Exemption Certificates are issued by OFGEM if the electricity supplied is already from renewable sources. The Climate Change Levy (CCL) thus constitutes an additional subsidy to the renewables industry (approx. £160m per year by 2010) on top of the existing RO whilst bizarrely, excluding nuclear power. However in terms of it costs to reduce carbon dioxide emissions, the National Audit Office (NAO) estimated that it cost at between £5 and £11 per ton whereas the RO’s cost was between £70 and £140. This is slightly disingenuous because the RO was not designed primarily to reduce carbon, but to encourage renewables. The EU’s Emissions Trading Scheme (ETS) launched on the 1st January 2005. The UK has a proposed annual cap of emissions traded within the scheme of 246.2 million tonnes of CO2 for the phase 2 period from 2008-2012. This is only about 40% of the UK’s total emissions of some 530 million (which does not include livestock emissions, forestry and land use changes). The system is meant to work by putting a price on carbon. A cost is created for emissions, which wasn’t there before, thus creating an incentive to avoid it. If one sets a limit on carbon emissions and issues carbon permits to trade, i.e. the right to emit carbon, then it creates commercial flexibility for companies – they can either reduce carbon and fulfil their 13 See CCL Rate Increase 1st April 08 http://www.cclevy.com/cclyear8forms.html

Economic Policy Centre SECURING OUR ENERGY FUTURE 15
quota or if they can’t afford that, buy permits from those firms that have reduced more than their required amount. Although carbon trading has become big business, it has not become an incentive for large-scale power plant investment. Trading volumes are still rising, but the price of carbon has been simply too low and volatile and does not price far enough into the future to be considered as capital for serious long-term investment. Phase 2 is currently suffering from the credit crisis with a crash in prices. Moreover, its overall credibility as a market instrument is seriously in doubt, as long as governments are able to issue more permits to trade – thus keeping the price down – well below what a declining emissions base would require. The UK’s Climate Change Act, which became law on The 26th November 2008, enshrined in law the ambition that the nation’s emissions should be at least 80% lower than the 1990 baseline. The act created an “independent” Committee on Climate Change (CCC) chaired by Lord Adair Turner to advise the government on emissions targets and to report to Parliament on progress made in reducing greenhouse gas emissions. The CCC holds board meeting once a month and produced a launch report last December – Building a low-carbon economy-which advocated that the UK reduces unilaterally its emissions by at least 34% relative to 1990 by 2020 and claiming that this would cost only 1% of GDP in 2020. The act also created a carbon budgeting system which caps emissions over five year periods, the first to be set by 1st June 2009, for the periods 2008-12, 2013-17 and 2018-22. Moreover, another major provision of the act was to include international aviation and shipping emissions for the first time. Whilst the act is long on aspiration, it is woefully short on how to meet these targets. Creating a delivery framework that can actually succeed appears to be very much an afterthought. The Carbon Reduction Commitment is a mandatory cap and trade scheme initially proposed by the 2007 Energy White Paper to begin with a three year introductory phase in 2010. It is anticipated that the scheme will achieve emissions reductions of at least 4m tons of CO2 per year by 2020 and is intended to cover emissions not already included by Climate Change Agreements and the EU Emissions Trading System. The participants will be large public and private sector organizations across the UK like supermarkets, water companies, local authorities and all central government departments, which consume over 6,000 megawatt-hours in a half-hourly slot. These are thought to be account for 10% of UK emissions. This policy is mistaken. For by creating an additional carbon trading market with almost certainly higher carbon prices (with fixed price sales) rather than joining the existing EU ETS, two extra burdens land simultaneously on the scheme’s unwilling participants. The Carbon Capture Levy was introduced in November 2009 due to come into force in 2011 and may continue beyond 2030. The levy could raise £9.5 bn to subsidise up to four demonstration carbon capture and storage plants. The goal is that this tax will facilitate the financial viability for all new coal stations after 2020 to be CCS ready on deployment and make Britain the world leader in CCS. It is far more likely that new coal-fired power stations won’t get built at all and these four demonstration plants will become expensive legacy first-of-a-kind-plants, not unlike the Advanced Gas-Cooled Nuclear Reactors which never became an export success either. The range of government-financed Research and Development Programmes attached to energy policy is extensive. These are;
i) The Marine Renewable Deployment Fund – which has a budget of £50m. Alas, it has struggled to give away the money. In a written answer to Greg Clark MP,

Economic Policy Centre Why and how it must be done 16
Shadow Secretary of State for Energy and Climate Change, Mike O’Brien, the Minister of State for the Department of Energy and Climate Change (DECC) conceded that only two grants had been made to the European Marine Energy Centre, £831,000 in 2005-06 and £300,000 in 2006-0714
ii) The BERR (Department of Business, Enterprise and Regulatory Reform, now the Department for Energy and Climate Change) Technology Programme – a £100m fund with £15m designated specifically for energy projects and a further £40m earmarked for engineering and manufacturing projects, which may be applied to renewable energy schemes. It is overseen by a “Technology Strategy Board” and in its own words, “We work closely with other organisations who are involved in innovation, research and technology, combining and focusing resources. Programmes and activities are often jointly funded with Research Councils, Government Departments, Regional Development Agencies and the devolved administrations of Scotland, Wales and Northern Ireland”. What this means is that it is a kind of intra-quango funding board.
iii) The Carbon Trust Applied Research Programme provides grants of between £50k and £500k for business and academia seeking to develop carbon saving technologies for commercial application. The merit of this scheme is that there is a competition to obtain the funds and it is over-subscribed, thus creating superfecundity15. However, what this situation also tells us is that it could easily be contracted out by government to a venture capital firm (which if not up to the job, could be replaced) and thus not crowd out the private sector provision of risk capital. Such a step would have the added benefit of creating commercial accountability, which barely exists between today’s government and its many agencies.
iv) The Carbon Trust Marine Energy Challenge/Accelerator aims to accelerate progress in cost reduction for wave and tidal stream technologies and to reduce the cost of marine energy by up to 20% by 2020. Although the £1m scheme has more takers (5) the Marine Renewable Deployment Fund, a 20% reduction would still leave wave and tidal stream as far more expensive technologies and is thus a gain not worth having.
v) The Scottish Administration’s Wave and Tidal Energy Support which has a budget of £13m provides grants to businesses to support the installation and commissioning/deployment of pre-commercial wave and tidal electricity generating devices at the European Marine Energy Centre in Orkney.
vi) Supergen (Sustainable Power Generation and Supply Initiative) which is a £2.5m scheme over 5 years run by the Engineering and Physical Sciences Research Council to conduct research into marine energy conversion and delivery. A collaborative project, it is run between five universities, four of which are situated in Scotland.
vii) The Scottish Administration’s Marine Supply Obligation, introduced in 2007 works very like the RO, except that it targets Scottish electricity suppliers to source a rising proportion of their power from marine energy generators. It is also far more expensive than the RO, with a buyout price several times higher than the RO, with £175 for wave power and £105 for tidal stream.
viii) UK Environmental Transformation Fund began operation on the 1st April 2008 and is jointly administered by DEFRA and BERR. The fund has £400m from 2008-2011 and aims to accelerate the commercialization of low carbon energy and energy efficiency technologies in the UK. No grants are made directly from the fund, but it exists to finance grant funding bodies such as the Carbon Trust and BERR.
14 See http://www.theyworkforyou.com/wrans/?id=2009-02-04c.242495.h 15 Superfecundity is an evolutionary scientific term, which describes an environment where more living organisms evolve than can be supported. That in turn creates competition in the ecosystem for limited resources and over time, this leads to the dying out of many species and the ongoing improvement of existing ones. Many economists now see the economy as something very similar and it is sometimes referred to as the econosphere.

Economic Policy Centre SECURING OUR ENERGY FUTURE 17
ix) The Offshore Wind Technology Capital Grants Scheme – under this there is a competition for grants supporting the demonstration of next generation technology for offshore wind administered by BERR.
x) The Low Carbon Buildings Programme is an £86m grant programme for microgeneration technologies launched in April 2006. Phase 1 provided grants to householders and phase 2 for public sector and charitable organizations.
xi) Fusion Research – the UK funds the International Thermonuclear Experimental Reactor (ITER) to the tune of £20m each year. If the plant works and is completed in 2018, it will generate 500 MW of power – at a cost of £9 billion or £18m per megawatt, although that figure is expected to rise significantly by 2018. In fact, it was very recently reported that “ . . . faced with ballooning costs and growing delays, ITER’s seven partners are likely to build only a skeletal version of the device at first.”16. The UK also has its own experimental reactor, the JET machine, near Abingdon, 9 miles south from Oxford. It has thus far succeeded in producing a peak of 16.1 MW and containing 10 MW of power for over 0.5 seconds at equally enormous cost.
So the policy drivers are very much dominated by the EU (2020 target, EU ETS), the overall thrust is almost entirely geared towards renewables, reducing carbon is the sina qua non. There is absolutely no consideration given to energy security, and the R&D programmes tend to be run by quangos that concentrate on the most expensive and experimental technologies with a view to overcoming technical barriers or making them, hopefully, one day, commercially viable. Who are the Policy Implementers (Deliverers)? Having analysed the existing policy drivers, there is another aspect to this, which merits closer attention – the policy deliverers. Table 3: Main Quangos charged with delivering the Government’s Targets on Energy Policy
Energy Savings Trust
Carbon Trust
Climate Change Projects Office
Climate Change Committee
OFGEM
Table 4: Some Regional Bodies connected with the Implementation of Energy Policy
EGENSW – the Southwest Renewables Energy Agency
Renewables East
Renew North
The Wales Centre of Excellence for Anaerobic Digestion
This is by no means an exhaustive list. All regional development agencies have extensive energy policy programmes to meet regional targets and this is to some extent replicated by local authorities. However, only a few of them have created stand alone renewables agencies.
16 See Fusion dreams delayed – as published by Nature 27th May 2009

Economic Policy Centre Why and how it must be done 18
All in all, what the UK’s energy policy framework resembles is a scattergun, randomly fired and aimed in the wrong direction. Should we be so surprised that this surfeit of policies, policy-implementers and policy goals has produced such poor outcomes?

Economic Policy Centre SECURING OUR ENERGY FUTURE 19
Chapter 2: How far can we go with existing Clean Electricity Technologies today? Despite the impending energy gap, the government continues to over-reward costly, still quite experimental, low output and less reliable technologies with short lifespans like on and offshore wind, solar photovoltaics, wave and to some extent, carbon capture and storage. It would do far better – and in the long run be much cheaper - to often a guaranteed market for large impact projects with predictable and dispatchable power capabilities like a Severn Tidal Barrage / Tidal Lagoons, a Nuclear Replacement Programme and small and large hydropower. It’s well worth taking stock of the performance metrics of existing clean technologies today. Table 5: Estimated Clean Electricity Generator Metrics – UK Bias Technology Typical
Load factor
Cost per installed kilowatt
Max. plant lifetime in years
Realistic potential expansion to 2019 in MW
Predictable and dispatchable power?
Probability of falling costs - 2009 - 2019
Level of UK government support
Solar PV 10% £4,500 25 150 No Moderate High
Onshore Wind 25% £1000 20 9000 No Low Very high
Offshore Wind 30% £3000 20 7000 No Low High
Large Hydro 30 - 50%
£1,40017 200 150 Mostly Low None
Severn Tidal Barrage (Cardiff-Weston)
23% £1,620 - £2,550
125 8640 Yes Low None
Tidal Stream 40% £3000 40 300 Yes Low High
Wave 25% £3,000 40 50 Yes Low High
Nuclear 80- 90%
£1,250 - £1,750
40 6000 Yes Low Low
Coal fitted with Carbon Capture and Storage
45% £2,000 40 2000 Yes Moderate High but limited
Solar Photovoltaics There’s no escaping the fact that the UK does not have a significant solar resource. Measured in terms of solar radiation, in high summer at best, it reaches 500 watts per square metre and drops to below 100 in winter. According to a 2006 European Commission study18, this translates into an annual yield of up to 1200 kilowatt hours per square metre on the South Coast of England and 800 on the West Coast of Scotland. With a typical efficiency conversion rate of 15%, this means that for every square metre of solar photovoltaics, only 150 kilowatt hours are generated in the course of a year. The same study showed that a 1 kWp system with optimally-inclined modules could generate just under 1000 kilowatt hours a year (600 in parts of Scotland) compared to up to 1650 in Spain. Low efficiency however would not matter if solar pv were several times cheaper than it is today – arguably at an installed cost of £1-£2 per watt rather than the current £4-£6 that most retail investors seem to pay. There have been
17 Figure based on construction of Glendoe Hydro Scheme - £140m for 100 MW, completed December 2008 18 See Photovoltaic Solar Electricity Potential in European Countries – the yearly sum of global irradiation incident on optimally-inclined south-oriented photovoltaic modules measured in kilowatt hours per square metre.

Economic Policy Centre Why and how it must be done 20
many forecasts of falling solar prices based on increased production achieving economies of scale. Yet it is worth noting that over the last few years, in spite of a tenfold increase in production, there has only been overall a 30% drop to what is still a very high price.19 Table 6: Annual Global Solar Pv Production Figures Year Solar production
2001 395 MW
2002 approx 500 MW
2003 744 MW
2004 1200 MW
2005 1727 MW
2006 2533 MW
2007 3800 MW
2008 5950 MW
Increased production has not led to low prices because of the silicon supply shortage – a major feedstock cost for the solar industry. Demand has outstripped supply in silicon and this has sent prices higher. The price of high-grade silicon per kilo has risen from $15 in 2000 to $70 in 2006 and sometimes as high as $400 per kilogram on the spot market. However only 5-10% of business takes place in the spot market and most long-term contracts are in the $50-$60 range. This silicon shortage is now easing and in 2008, polysilicon supply to the solar industry grew by 127% in megawatt terms – faster than the 110% growth in the industry. Chart 3: Solar Module Prices – the last 8 years
However whilst the module prices have fallen (typically 60% of the total), the overall installation cost appears to have barely changed in the last few years. This is due to the rise in the cost of labour and little or no change in the cost of inverters, charge controllers and batteries.
19 Solar prices here are defined as the Solar Module Retail Price Index – 125 watts and higher as kept by the consultancy, SolarBuzz – see http://www.solarbuzz.com/Moduleprices.htm - not everyone thinks they are an accurate reflection of solar prices because they are allegedly always at the high end of prices because they only reflect retails sales channels.

Economic Policy Centre SECURING OUR ENERGY FUTURE 21
Any downward price pressure on solar pv that is being brought to bear on the market will be thanks to the new emergence of Chinese manufacturers who have been able to capitalize on cheaper workers rather than on expensive machinery. What has had a far bigger impact on the price of solar power – at the production level – has been the onset of recession in the last 12 months, which has lowered module prices by a good 10%. Demand destruction has its uses! Over the next 10 years, there is a moderate chance of a further 20% fall in the installed cost per watt and up to a 10% increase in efficiency (1% per annum) to 25%. On grounds of cost and scalability therefore, solar pv will not be a player in the UK’s expansion of renewable electricity over the next 10 years. But it may grow fast from a very low base if it combines with a recovery in the UK housing and construction market. Of great import too is the fact that solar power installations are deployed with much longer lifespans. At the moment, silicon-based modules decline in efficiency by up to 1% a year and the assorted electronics that come with them, usually will not last more than 10 years. If solar panels and all the associated balance of systems paraphernalia could be built that last for 50 years, rather than 25 and 10 or less, then the economics will become very viable. By no means everyone is as pessimistic as this author about the near-term outlook for solar power. Indeed there is a semi-messianic belief that solar grid parity20 (SGP) – the point at which the lifetime cost of an installed photovoltaic electricity system is equal to or cheaper than mains supplied electricity to the end customer – is now not more than a few years away. These optimists point to First Solar, a US solar manufacturer, announcing that it had reduced its manufacturing cost of solar modules to just under $1 per watt in February 200921 and that solar module prices in the next 18 months will drop to $2 per watt across the industry. They may be right. But the odds are that this heralds the arrival of SGP first in a few relatively wealthy countries, with sunny climates and high (and insecure) conventional grid prices – e.g. California and Italy. Britain however, because of its climate will be one of the very last countries to benefit. The key metric to watch is the fully installed cost per watt for a turnkey system to the end customer, relative to other sources of power. This price still remains several times larger than the manufacturing cost per watt, or even the wholesale price paid by the downstream supplier prior to installation. Onshore Wind Onshore wind is the most visible contributor to the renewables target but has risen substantially in cost from £600,000 per installed megawatt in 2002 to £1 million today. Since 2002, a global rise in steel prices and construction costs has driven that figure up. Add to this the supply bottlenecks in some very specific components; turbine blades, bearings, gearboxes, generators, main shafts, control cabinets and complex steel castings. In the last few years, Britain has not been able to repeat the take-up rate of Germany in constructing onshore wind farms during the 90s. As at October 2009, the UK has a total of 3,233 MW22 of onshore wind operational, 812 MW under construction, 3,280 MW consented and 7,386 MW in planning. The failure at the planning stage is high for wind farm developers and it is quite plausible that a change of government in 2010 might make it even harder for wind farm operators to bring their plants online. Britain’s tortuous planning laws simply make it so. For all that, there is a chance of falling costs beyond 2010, when China will be mass-manufacturing wind turbines23 (although 20 See Solar Grid Parity by Dan Lewis – as published in the May 2009 E&T magazine, the journal of the Institution of Engineering and Technology 21 See First Solar passes $1 per watt industry milestone http://investor.firstsolar.com/phoenix.zhtml?c=201491&p=irol-newsArticle&ID=1259614 22 See regularly updated statistics here http://www.bwea.com/statistics/ - as at 12th June 2009 23 See Reuters, June 9th 2009 - Acciona expects 20 percent fall in wind turbine costs http://www.reuters.com/article/GCA-BusinessofGreen/idUSTRE5582MK20090609 "Costs will come down as manufacturing picks up in places like China and Korea," Esteban Morras, chief executive of renewable energy firm

Economic Policy Centre Why and how it must be done 22
this may be negated by a fall in the pound against the renminbi) and in general there will be more manufacturing of wind turbines in the developing world rather than - as at present – in high-cost nations like Germany and Denmark. Offshore Wind Offshore wind was initially the great white hope of the industry because it was widely anticipated that it could circumvent many of the planning issues and work at a higher load factor. But at £3m an installed megawatt it is three times as expensive as onshore wind and investors have not stepped up to the challenge as was hoped. In fact, quite the reverse, they are retreating. Last year in May, Royal Dutch Shell withdrew from the London Array wind farm citing rising costs. And last November, Centrica’s £3 billion wind investment programme was called into question when the company said it would be “revisiting the economics”, particularly of offshore wind24. Combined with the credit crunch, rising costs have become so serious, that according to the British Wind Energy Association, an additional state funding of £2 billion is required to go ahead on building nine offshore wind farms that have planning consent25. In the end, Chancellor Alistair Darling made available an additional £525m in the 2009 budget through the Renewables Obligation to drive forward the most at risk offshore projects – and five already approved of offshore sites were apparently saved26. Offshore wind has run into the same supply bottlenecks as onshore wind plus one other very important one – the lack of jack-up barges. These are six-legged vessels that can prop themselves up on stilts on the sea floor (up to 40m in depth) and root the wind turbine tower to the sea floor as well as connecting the nacelle (nose cone) and turbine blades with a crane. Nor has the anticipated higher load factor of 40% has not materialized. These last few years in the UK, albeit from a small sample, it has been between 25 and 30%. To date, the UK has 598 MW of offshore wind operational, 1,246 MW under construction, 3,613 MW consented and 1,980 MW in planning. Large Hydro According to the British Hydropower Association, given the right conditions, the potential is there for up to 750 MW of new, larger Hydro and between 750 MW and 1,250 MW of small and micro hydro. The European Union puts the overall UK figure much lower at 600 MW. Top of all the estimates is the World Atlas 2007 of Hydropower and Dams, which puts the technically feasible conventional (excluding pumped storage and tidal barrages) hydropower potential at 4,200 MW. For all that, there has been only one plant completed over the last decade, Scottish and Southern Electricity’s Glencoe 100 MW plant, which went operational in December 2008 after 5 years of construction. The real obstacles for expanding hydro in the UK remain; difficulties in obtaining planning consent, long payback periods and environmental opposition.
Acciona Energia told reporters. And also is to be noted how the Chinese green stimulus package has post-bidding, left out all the foreign manufacturers for a EUR 5 billion order of 25 wind turbine orders, despite many of these firms having invested in China and sourced parts locally – see Foreign companies blowing in the wind in the Asia Times, June 11th 2009 http://www.atimes.com/atimes/China_Business/KF11Cb02.html 24 See “Centrica to review wind farms as costs mount” http://www.telegraph.co.uk/finance/newsbysector/epic/cna/3460892/Centrica-to-review-wind-farms-as-costs-mount.html 25 See “Energy firms demand £2bn to save wind farms” http://business.timesonline.co.uk/tol/business/industry_sectors/natural_resources/article5950324.ece 26 See http://www.cnplus.co.uk/hot-topics/sustainability/budget-2009-analysis-five-off-shore-wind-farms-will-go-ahead-after-budget-cash-boost/5201181.article

Economic Policy Centre SECURING OUR ENERGY FUTURE 23
Severn Tidal Barrage How much power the STB would generate is largely to do with where the barrage would be placed.
Whilst bigger and smaller stretches exist as per the image above, largely for environmental reasons, in recent years, a consensus appears to be building for the stretch between Cardiff and Weston Super-Mare which would equate 8,000-8,640 MW at peak and 16.8-17.2 terawatt hours (TWh or trillion watt hours) over a year. With a tidal range of up to 15 metres and a flow of up to 24 km per hour, the Severn is the 2nd best site in the world, behind Canada’s Bay of Fundy. But plans and studies for a tidal barrage on the Severn have been done, revised and updated since 1923. Indeed since 1973, these studies are estimated to have cost over $100m. Yet still, the barrage remains on the drawing board and the government has recently set up a new Severn Tidal Power Feasibility Study Consultation with a decision to be made in 2010 and an informed decision following another public consultation in late 2010. If at that stage it was given the green light, the planning and consenting may take 3-5 years and the construction a further 5-7 years. In the last decade there have been three studies. In January 2002, capital costs for the Barrage were estimated to be between £10.3 and £14 Billion pounds in 2001 prices. Over the estimated lifetime of 120 years, this would be easily recoverable. The critical point though, is how soon you would look for payback. In that study, Price Waterhouse Coopers calculated that the full cost of the Barrage, including grid strengthening could be recovered by electricity sales of £60 MW after nearly 7 years. After that point, it would become economic, able to charge £20 per MW hour plus a premium of perhaps £7 a MW for its ability to meet a fluctuating demand, its contribution to security of supply and its clean generation. Moreover, it would control flooding of the Severn, then costing £120 m a year. Since then, two new studies have emerged. One by the Sustainable Development Commission (a government quango headed by Sir Jonathon Porritt) in 2007 which put the cost at £15 billion and a preliminary study by the Severn Tidal Power Consultation which put the cost at £20.9 billion. One company, Tidal Electric, for years has argued that the best way to exploit the Severn Estuary is with Tidal Lagoons. According to their figures, well-placed tidal lagoons throughout the Severn Estuary27 would yield 32.9 TWh – nearly twice as much as the conventional Severn Tidal Barrage model. Tidal Electric effectively creates walled dams, which capture the predictable tide, rather than the usual random rainwater, which fuels hydropower. The offshore impoundment structure looks like a rocky island and is fitted with conventional low-head hydroelectric generating equipment.
27 See here http://www.tidalelectric.com/SevernFullMap.htm

Economic Policy Centre Why and how it must be done 24
Table 7: Tidal Electric’s Alternative to the Severn Barrage – Tidal Lagoons Location Area (Sq. KM) Tidal Range (m) Capacity
Oxwich Bay 4 6.5 48 MW
Swansea Bay 5 7 60 MW
Scarweather 24 7 300 MW
West Nash 8 7 100 MW
Culver Sand 10 7 120 MW
Watchet 8 7 95 MW
Bridgewater Bay 91 10 1900 MW
Weston-super-Mare 4 10 90 MW
Sand Bay 3 10 70 MW
English Grounds 40 10 850 MW
Cardiff 72 10 1500 MW
Welsh Grounds 72 10 1500 MW
Oldbury Sands 12.5 10 270 MW
Total 353.5 6903 MW
One of the advantages of this technology is that it would work at much higher load factor (about 60%), have a much lower environmental impact on wading bird populations and dispatch predictable power. The theoretical environmental advantages of tidal lagoons are considerable. The tidal lagoons would actually create wildlife habitat rather than destroy it whilst additionally not engendering the sewage dispersal issues that a barrier would inevitably create. There would also be the economic advantage of much more scope for keeping ports and shipping routes open. There has however been no small amount of argument between the then DTI and Tidal Electric about whether their numbers and costs stacked up. In an April 2006 report, looking at the feasibility of a Tidal Lagoon in Swansea Bay by Tidal Electric28, a study commissioned by the DTI (but not endorsed or reviewed by them) accused Tidal Electric of massively understating the cost of the project. Tidal Electric put the cost of the 60 MW plant at £81.5m whereas the study put it at around £234m. The major bones of contention were to do with the cost of the embankment, the cost of decommissioning and the predicted annual energy output. Tidal Electric felt strongly that the report was misleading and one-sided in its findings. A 2005 study by OFGEM29 put the cost of a tidal lagoon at £47.31 - £76.20 per megawatt hour compared to £53.81 - £72.26 for offshore wind. For all that, until a tidal lagoon is constructed, we will not have a firm idea of costs one way or another. Only then will we have proven costs and capabilities, which on the face of it, are quite superior to a Severn Tidal Barrage, although an STB combined with a road and a railway running along the top would be a significant infrastructure gain for Wales. Wave and Tidal Stream Great Britain and Ireland situated as they are with thousands of kilometres of ocean (& shoreline) to the North, the West and the South, can call up pretty much the highest global
28 See Tidal Lagoon Power Generation Scheme in Swansea Bay – a report on behalf of the Department of Trade and Industry and the Welsh Development Agency - http://www.berr.gov.uk/files/file30617.pdf 29 See ASSESSMENT OF THE BENEFITS FROM LARGE-SCALE DEPLOYMENT OF CERTAIN RENEWABLE TECHNOLOGIES prepared by Cambridge Economic Policy Associates and Climate Change Capital for OFGEM

Economic Policy Centre SECURING OUR ENERGY FUTURE 25
wave energy density in the world. Until recently there was quite a buzz about Britain’s slew of wave and tidal firms (Wavegen, Lunar Energy, TidalStream, Marine Current Turbines, SMD Hydrovision, Pelamis Wave Power, IHC Engineering Business) actually deploying technology on some scale, perhaps several hundred megawatts over the next decade. That now looks very unlikely. Whilst they may have the technology, they do not have access to the capital to roll out on that sort of scale. Lunar Energy is instead concentrating on expanding in Korea, Marine Current Turbines have greatly scaled back their ambitions and Pelamis Wave Power, is being hit by technical problems and the collapse of Babcock & Brown, who own 77% of their shares. It may well be though that towards the end of the next decade, these technologies become more deployable and affordable. Nuclear After many years in the cold, nuclear power is back with a vengeance. Concerns about energy security, fossil fuel prices, the environment and predictability of electricity prices have priced it back into the picture and into political favour. Britain’s past nuclear programme has not been helped by the fact that of the 19 reactors built, 15 are different designs. The equivalent figures for France meanwhile are 58 and 3. So perhaps for this reason and others, we should not be surprised that the companies that have the financial resources, the balance sheet strength, the portfolio diversity and the skills to deliver a new nuclear build programme in the UK - EDF, EON, RWE, Gaz de France, Iberdrola and maybe even Centrica and Vattenfall – are nearly all foreign. Today, they are performing a complicated dance around the British government, determined to extract as much gain as possible before committing to a nuclear replacement programme. And no one of these companies has pursued additional subsidies more shamelessly than EDF, perhaps because of its French heritage as much as its industrial interest. Their bargaining chip will be the licensed sites for nuclear power stations, purchased by auction from the Nuclear Decommissioning Agency or in the case of EdF, acquired as part of their £12.4 Bn purchase of British Energy. So far, the utilities have nominated a total of 11 sites in England and Wales for consideration as possible host sites for nuclear power stations and nine of them have previously been home to nuclear reactors. The auction is raising more funds than anticipated - £387m so far. In April 2009, Ed Miliband, the Energy and Climate Change Secretary confidently suggested that the combination of EDF Energy’s plans and, RWE and EON’s joint venture took the theoretical declared plans for new build to “ …12.4 gigawatts, greater than our existing, but ageing, nuclear capacity”30. Although plausible, these plans are currently more notional than Mr Miliband would imply. The bottom line is that no company is yet committed to spending a penny on a single new nuclear plant. It is unlikely of course that any of these firms that have bought sites would then decide not to go ahead at some stage, with building a plant. But the cost of pulling out before construction by selling back the site to another party would be very inconsequential to the multi billion pound balance sheets of these utilities. Such a decision might be taken if it were deemed more commercially viable to pursue far more lucrative opportunities in other countries. For many of them offer far fewer planning restrictions and more power stations. Besides in Britain, there is a lingering danger of a changed political landscape and the re-emergence of public scepticism. Despite a media blitz following Ed Miliband’s most recent nuclear announcement on the 9th November31, virtually nothing has changed. This was merely a formal declaration of existing government policy. The timeline for a nuclear rollout in the UK would look something like this; 30 See The Times – E.ON and RWE outbid rivals for reactor sites - April 30th 2009 31 See The Guardian – Ed Miliband paves way for most ambitious fleet of nuclear reactors in Europe http://www.guardian.co.uk/environment/2009/nov/09/energy-policy-nuclear-coal

Economic Policy Centre Why and how it must be done 26
2009-2011 – pre-licensing of designs and pre-planning work. The government has been doing a lot of work32 to assess the readiness of the UK supplier base to meet the requirements for new nuclear plants. What they have found is that whilst there is an available capability and capacity in services (e.g. project management, design), there is next to nothing in the capacity to manufacture key components (Reactor Pressure Vessels, Nuclear Steam Supply System, etc.) and nuclear engineering skills. More optimistic scenarios suggest that 70-80 percent of the value of a UK plant (up to 90% according to Lord Mandelson33) could come from UK companies and proposals have been made to build a steel plant that can make the ultra heavy forgings in the UK. This will however be largely at the discretion of the utility and it is unlikely for the early plants that UK participation would be very high. Moreover, not unlike with defence procurement, UK sourcing of nuclear components may turn out to be far more expensive than buying off the shelf components abroad. Not everyone agrees of course. There may well be a good case for a new pressure reacting vessel forging plant in the UK as only a few companies worldwide have the capacity to forge single-piece containment vessels and the UK, by only ordering a few at a time, will be at the bottom of the queue. Sheffield Forgemasters are keen to add a fifth world capacity and will probably receive a hefty wedge of public cash to do so. 2011-2012 – submission of proposal to the new Infrastructure Planning Commission, an untested new public body which should give the go-ahead in months rather than years. One can’t be sure however, that it will work as efficiently as planned. Sign-off would then be required by the Nuclear Installations Inspectorate, which should be straightforward. 2012 – breaking of ground of the first plant, if all goes to plan, to be finished in five years in 2017. One can’t assume that it will all go to plan. The Olkiluoto plant in Finland is 38 months behind schedule leading to TVO (the plant buyer) to ask for EUR 2.4bn in compensation while Areva-Siemens is claiming one billion euros from TVO. This first-of-a-kind plant could be expected to run into some cost and time overruns. Quite apart from some of the engineering difficulties, the project also had a lot of East European workers under French direction trying to make sense of a Finnish regulatory regime. Project management though is getting better in Britain and there is a reasonable chance that a turnkey plant could be ready in 5-6 years. The big factor that might significantly delay the project is an external one – our position in the international queue. As it stands, the UK would be well down the list in a global series of identical plants – probably at least 4th or 5th in the world for EPR (European Pressurized Water Reactor) plants and 8th or 9th for an AP1000 (made by Westinghouse). It’s quite possible that since Angela Merkel’s election victory in Germany, a big order for nuclear power may go ahead and the UK could move even further down that queue. 2012 + every 18-24 months thereafter – construction starts on a second plant, so that the specific construction team from the first plant responsible for the early plant section can be transferred over without delay to repeat their task on the second. This staggering may well continue on a rolling timeframe so that a new plant breaking ground every 18-24 months so that by 2020-2025, there could be a surge of nuclear power, with 6 new plants, contributing in capacity between 1200 and 1600 megawatts each. Optimists argue that it is conceivable that the build rate could be much faster, with two or three series progressing in parallel – a staggered chain say for EdF to build EPRs and for RWE/EON to build AP1000s, simultaneously. All in all, whilst the outlook now for nuclear power is much brighter than it has been at any time since the 1970s, there is much more certainty about the rate at which it starts and very little about where it ends up in the next 10-15 years, let alone 30. Coal with Carbon Capture and Storage (CCS) fitted No new sizeable coal-fired plant has been built in the UK since the second units of Drax were commissioned in 1986. Scaled-up and effective CCS facilities would provide a boost to the
32 See The Supply Chain for a UK Nuclear New Build Programme – a report submitted to the Department for Business Enterprise & Regulatory Reform by the National Metals Technology Centre – February 2009 33 See UK Government to Outsource Nuclear Energy Work To Private Sector: UK Business Secretary – as published in Nuclear Energy Business Review – published 23rd June 2009

Economic Policy Centre SECURING OUR ENERGY FUTURE 27
prospects for delivering new coal-fired power projects to the UK. And news that in October 2009, Britain is set to build its first coal-fired carbon capture station at Hatfield with EUR 164m of European funding some might think augurs well for big changes ahead. But no one should hold their breath for a large-scale rollout of CCS-fitted coal-fired plant. To encourage the development of CCS, DECC launched its CCS competition in 2008, which - following the retirement of the BP-led Peterhead project – now has three participants. More recently, DECC has raised its aspirations by confirming that approval would be given for up to four new fossil-fuel plants with CCS facilities, which – if necessary - could be retro-fitted. They are now going to be guaranteed with a Carbon Capture Levy (Tax) worth £9.5bn over 20 years. Effective approval for RWE’s 2,000 MW plant at Pembroke and Centrica’s 1,020 MW at Kings Lynn endorses this strategy. Discussions about E.ON’s coal-fired plant proposal at Kingsnorth, and especially the proposed CCS facilities, continue. The latest on the government’s attempts to kick-start global CCS leadership in the UK manifests itself in a Carbon Capture Levy, worth up to £9.5bn over 20 years, to guarantee the operation of four coal-based (never gas) carbon capture and storage plants. There is though a deep, semi-imperial misperception about the UK’s influence on the future direction of carbon capture and storage. The starting point to take on board is that the UK in 2008 consumed a mere 1.1% of global coal demand34, China 42% and the USA 17%. Contrary to what some CCS advocates would argue, this will never be a firm opening basis to create a world-leading industry from. Britain definitely will not win this race. It will be won by scale and only China and the USA could do that, if they wanted to. Table 8: The World’s Largest Coal Consumers (2008) Ranking Country Million tons oil equivalent Percentage
1 China 1406.30 42.57%
2 USA 565.00 17.10%
3 India 231.40 7.00%
4 Japan 128.70 3.90%
5 South Africa 102.80 3.11%
6 Russian Federation 101.30 3.07%
7 Germany 80.90 2.45%
8 South Korea 66.10 2.00%
9 Poland 59.40 1.80%
10 Australia 51.30 1.67%
Rest of World 510.50 15.45%
The second uncomfortable fact about CCS for the UK is that its supporters overrate the energy security value of coal compared with gas. They all too readily overlook that in 2008, whilst the UK consumed 58.2 million tones of coal, a full 75% of it or 43.9 million tonnes was imported and of that, 21.5 million tonnes came from Russia35. This means that well over 10% of the UK’s electricity supply is generated by Russian coal - far, far more than from gas. Russian coal is popular in the UK because it has a low sulphur content, about 0.3% compared to a typical lump of UK coal, which has about 1.6%. This matters a lot because under the
34 See BP Statistical Review of World Energy 2009 35 See the 2008 figures cited here which come from the Association of UK Coal Importers.

Economic Policy Centre Why and how it must be done 28
terms of the EU’s Large Combustion Plant Directive, from the beginning of 2008, emissions of sulphur oxides had to be reduced and so the easiest way for a coal-fired plant to do this, which was not, fully FGD compliant (Flue Gas Desulphurisation) was to burn Russian coal. Carbon capture and storage coal-fired plants also work at a lower thermal efficiency requiring more coal to produce the same amount of electricity. Perhaps as much as 24-40% more for pulverized coal plants and 14-25% for Integrated Gasification Combined Cycle Plants36. In the end, cost is king. A paper published in July 2009 by the Harvard Kennedy School entitled The Realistic Costs of Carbon Capture put the likely range of costs of abatement for capture – and excluding transport and storage – at between USD 100 – 150 per ton of CO2 abated for first-of-a-kind plans and plausibly USD 30-50 per ton of CO2 for nth-of-a-kind plants. These very high initial capital costs suggest that if it is not scaled up quickly, the technology will remain financially out of reach for the foreseeable future. So CCS is not the saviour many would like it to be and with the best will in the world, it’s hard to credit the idea that the UK will ever lead the world in it. £9.5 billion would be better spent elsewhere.
36 See 2005 IPCC Report http://www.ipcc.ch/pdf/special-reports/srccs/srccs_wholereport.pdf - footnote 4, page 4.

Economic Policy Centre SECURING OUR ENERGY FUTURE 29
Chapter 3: Don’t Bet on Gas – the UK Way Globally, supplies of gas are quite abundant and thanks to technological advances, about to get better. Due to its burgeoning intermittent renewables programme, a long-term commitment to reducing carbon and its impending energy gap, Britain is going to need a lot of gas for some time. Unfortunately, the UK has failed to grasp this central fact and the government even harbours the illusion that gas demand will fall 30% by 2020. It has not helped to set up adequate long-term supply contracts in the LNG market, it is woefully short of gas storage, its own domestic supplies in the North Sea have not been well managed and are declining fast and it has failed to diversify gas sources away from countries who do not share Britain’s liberal democratic outlook. The speed of change of the UK’s use of gas and where it has been sourced from has been consistently far faster than regulators, politicians or even energy analysts can easily keep up with. In 200837, the UK consumed 93.9 Bcm (billion cubic metres) of gas and gross imports amounted to 36.46 Bcm, of which 35.42 were by pipeline from Continental Europe and 1.04 from Liquefied Natural Gas tankers. In the same year, the UK also exported 8.8 Bcm38. By 2015 it is forecast the UK will rely on pipeline gas (40%) and LNG (30%) thus creating an unprecedented 70% gas import dependence39. Britain first discovered that it had abundant gas in the 1960s, but it took the oil shocks of the 1970s and the miners’ strikes of the 70s and 80s to persuade the utilities that gas could not only be exploited, but also turned into electricity at considerable economic, environmental and energy security gain. It was a surprise because initially at the time of deregulation they thought it would be a marginal fuel operating for only a few hours a year. The dash for gas was unexpected from near 0 to 40% of UK electricity supply in less than a decade. What project developers discovered was that Combined Cycle Gas Turbines (CCGT) were cheap, modular and infrastructure demand-lite. And it has to be said, this was largely due to companies like Enron and Glencoe. They opened up energy trading, increasing the liquidity of the gas market and developing CCGT projects in cooperation with the regional electricity companies against 15 year Power Purchase Agreements, which for the first time, created a viable project, finance model. Table 9: The UK Gas Story 1997-2008 in Billion Cubic Metres: (Source: National Grid) 1997 1998 1999 2000 2001 2002 2003 2004 2005 2006 2007 2008
Inputs 78.96 83.51 93.73 103.02 105.02 103.72 107.89 103.91 99.92 97.69 99.82 104.30
UKCS 77.72 81.48 90.69 98.60 99.28 97.03 97.79 91.07 83.60 74.91 66.83 63.45
Imports 0.00 0.06 0.27 1.44 1.74 4.04 5.74 9.43 12.00 20.21 29.13 36.58
Storage 1.25 1.97 2.77 2.89 3.90 2.56 4.29 3.36 4.29 2.56 3.84 4.27
Norway 0.00 0.00 0.23 1.18 1.38 3.44 5.15 7.07 9.29 13.11 20.08 26.18
BBL 0.00 0.00 0.00 0.00 0.00 0.00 0.00 0.00 0.00 0.84 7.11 8.43
IUK 0.00 0.06 0.04 0.26 0.37 0.61 0.60 2.36 2.23 2.82 0.58 1.13
LNG 0.00 0.00 0.00 0.00 0.00 0.00 0.00 0.00 0.48 3.44 1.36 0.84
IUK Exports
0.00 0.16 4.06 8.66 7.46 7.85 11.17 5.09 3.38 5.56 4.74 4.24
37 See article on Platts – Analysis: BP stats show increasing diversity of UK gas supplies – 12th June 2009. Note that BERR, BP and National Grid figures on gas do not tally exactly for many reasons not worth going into. 38 See Natural gas – exports 2008 country ranks http://www.photius.com/rankings/economy/natural_gas_exports_2008_1.html 39 See excellent paper by Global Energy Advisory – Energy Risks: Uncertain but not imaginable – Investment failure fails customers – published 25th February 2009 by Aily Armour-Biggs

Economic Policy Centre Why and how it must be done 30
Irish Exports
1.98 2.86 3.63 4.32 4.61 4.64 4.88 4.72 5.26 6.00 6.36 6.66
In less than two short decades, Britain has gone from deriving most of its electricity from coal and nuclear, flaring off vast quantities of gas from the oilfields, to net gas exporter, to the dash for (electric) gas in the 90s, to production peak in the North Sea in 2001, to record gas prices in 2008, to projected – yet to be realized - huge imports in LNG and by pipeline from Russia and Norway. It’s also to be taken on board that during this period, the UK’s gas storage capacity failed to respond to these changing events. The UK of course had for long escaped the need for gas storage because it had gas fields on stream in the North Sea to tap into which acted like virtual storage and LNG advocates would argue that we can, unlike landlocked nations on the continent, tap into the emerging global LNG market. Yet today gas storage stands at a paltry 4.34 bcm40, about 4% of average annual consumption or 14-16 days’ worth of supply. This compares badly to Germany, which has 21% or 73 days, and France (where there is much lower demand) of 24% or 91 days. And two gas storage projects – Stag Energy’s Gateway and Portland Gas’s at Portland Port in South Dorset – set to increase the UK’s meagre capacity by a combined 2.5 bcm have been seriously delayed by the credit crunch. All this while in 2004, Ofgem predicted that the UK would need to have built a capacity of 10 bcm by the end of 200941. There are two further figures beyond the headline figure of storage capacity;
i) How quickly can you dispatch the gas around the country? ii) How many days storage are there at peak demand in winter? iii) In times of a European mainland gas shortage will it be re-exported via the
interconnector, regardless of the UK’s situation? To use the jargon, gas storage can be kept in a state of hot standby, 12 hour standby or fast injection. So some foresight of gas shortages is required in order for storage to meet the shortfall. This might be semi-predictable in the event of an annual winter dispute between the Ukraine and Russia. It would be much less so in the event of a major earthquake in Japan shutting down some of the nuclear power stations and boosting demand for gas in the Pacific Basin or a new and possibly protracted conflagration in the Middle East, involving Iran, Israel and the USA. And the greatest prospect of not being able to meet demand for the UK would be in winter when gas prices are at their highest which could very possibly coincide with a shortage in the European mainland, resulting in the re-export of gas in gas storage facilities back to the continent. Arguably, this means that UK gas storage is much less than official figures actually suggest. Table 10: The Rapid Growth in UK Gas for Electricity (Source: BERR Energy Statistics42) Year UK gas use for electricity in Bcm
1990 0.60
1991 0.61
1992 1.64
1993 7.48
40 See The Guardian, 9th October 2009 – Gas storage capacity will only grow by tiny fraction, minister admit 41 See The Guardian, 12th January 2009 – Plans to increase Britain’s gas storage capacity left in tatters by credit crunch 42 Specifically, Natural gas and colliery methane production and consumption, 1970 to 2007 – according to BERR, 1 GWh is officially converted into Bcm by multiplying by 0.0914

Economic Policy Centre SECURING OUR ENERGY FUTURE 31
1994 10.75
1995 14.11
1996 18.46
1997 23.02
1998 24.47
1999 28.84
2000 29.67
2001 28.60
2002 30.15
2003 29.67
2004 31.15
2005 30.07
2006 28.37
2007 32.31
If you want to know why the UK ran through its gas resources so fast, compared to other nations, there are three short answers as to how British policy was lacking;
• A sovereign wealth fund • A depletion policy • Long-term gas supply contracts
None of which the UK had43. Britain instead used the receipts from North Sea Oil and Gas as straightforward tax receipts and went into the pot of HM Treasury and as such was largely spent on the welfare state, health and education with relatively few discernible gains. Norway took a different path, setting up a sovereign wealth fund44, which was specifically geared to investing these surplus resources to generate returns to meet, anticipated public pension provision. Arguably, it would have been better still for the economy to return the funds back to the taxpayer in the form of tax cuts and increasing the quantity of investment capital available to the higher-returning private sector. But creating a fund worth $325 billion as at the end of 200845 as Norway has and holding 0.77% of global equity markets is not a bad result. Norges Bank Investment Management even forecasts that it may reach $399 billion by the end of 2009 and nearly $700 billion by 2014. The Netherlands however set out on a different track. In 1961, the then government instigated a depletion policy based upon the “Nota de Pous” legislation which meant that the exploitation of their gas reserves had to be harmonized with the sale of such gas and the security of long-term gas supply. This translated into a commitment by the state-owned gas, infrastructure and transport company, N.V. Nederlandse Gasunie, to ensure sufficient reserves to cover 25 years of the sum of Netherlands domestic gas demand plus contracted export commitments. Britain’s initially abundant supplies of gas led to the then rational creation of a spot-market model for the trading of its North Sea gas. It was rational because short-term purchasing of gas when there is lots of it drives down prices much faster than long-term supply contracts.
43 See Credible energy policy by Professor Dieter Helm, as published by Policy Exchange in December 2008. 44 Statens Penjonsfond – Utland – the State Pension Fund 45 See Annual report 2008 by Norges Bank http://www.norges-bank.no/templates/report____73483.aspx

Economic Policy Centre Why and how it must be done 32
The downside to this approach was that when supply tightened, the spot market reacted vigorously upwards and the UK was left badly exposed to the highest gas prices in Europe. Unfortunately, this feast of surplus North Sea gas supplies could not last and Britain’s policymakers were slow to realize it. Amongst other reasons, that’s why Britain failed to exploit the long-term opportunity of increased price stability and security of supply that further integration into European gas and electricity markets that such an action might well have created. Writing in Credible Energy Policy, a paper for Policy Exchange, Dr Dieter Helm said that the combination of these factors (amongst others) was that “. . . Gas import dependency is here to stay for at least another two decades. It cannot now be avoided: it is too late”46. Worrying about gas import dependency has much to do with our fear of Russia. The irony is that contrary to received opinion, Russia’s direct gas imports to the UK remain very low. In late 2007, it was estimated to be as low as 2%47 of total UK demand but no one could possibly really know. Contrary to received opinion, it is actually very hard to distinguish the Russian gas contribution that comes via the Interconnector UK pipeline, which connects Bacton to Zeebrugge in Belgium, and the BBL interconnector pipeline with Holland. That’s because Russian gas molecules look the same as everyone else’s! The specifics of it are that there is a contract between GasTerra in the Netherlands to provide Centrica with 8 bcm per year and at the same time, there is a contract with Gazprom for GasTerra to receive 4 bcm. How many of those 4 bcm of gas molecules that make up the 8 bcm which actually reach Britain is anyone’s guess as they are also supplied to much bigger customers48 like Germany (19.2 bcm), the Netherlands (33.1), Italy (8.8) and then, just behind the UK, France (7.5) and Belgium (6.3). That’s why that it is highly unlikely that at present the UK is receiving any more than 1 bcm of gas per year indirectly from Russia, something like 1-2% of our total annual consumption. The power of Russia over UK gas supply is actually more subtle and twofold. Firstly, its ability to affect prices across Europe, providing as it did, some 41% of European gas imports in 2006. And secondly, its ability to reduce supply, indirectly affecting Britain most, situated as it is at the furthest point from the European gas pipeline network and involuntarily curtail investment as Gazprom has done, through incompetently running up huge debts just before the credit crunch. Some might argue that that one can perhaps get too carried away with the fear of gas import dependency. The real threat is monopoly provision of energy, wherever it comes from. They have a point. In the name of energy security, British miners achieved monopoly power, which led to the exercising of this power through strike action, and ultimately to the last miners strike of 1983. The irony was that it was imported coal from Communist Poland and imported uranium for our nuclear power plants that kept the lights on and broke the strike. So should we have anything to fear from importing most of our gas from Norway, a friendly country which discovered the rule of law and representative government long before it discovered hydrocarbons? The weakness of this argument is that Norway – at the moment – has no rational incentive not to follow the higher price lead of Saudi Arabia for oil and Russia for gas. It is entirely in their best interests to sell these resources at as high a price as possible whether they see eye to eye with these nations or not. And as long as Russia, Iran and Qatar go through with their plans to create an Opec-style cartel49 that would control 60% of the world’s gas supplies, that influence – with Norway’s acquiescence - over rising prices can only grow. Add to this that
46 See P.23 of Credible energy policy 47 See Daily Telegraph, 2nd October 2007 – UK gas prices could rise after Gazprom row - //www.telegraph.co.uk/news/worldnews/1564905/UK-gas-prices-could-rise-after-Gazprom-row.html - deriving the precise origin of the gas at the end of the pipeline to the UK is hard to do. 48 See Natural gas sales by country of destination 2008 - http://www.gasterra.com/figures/Pages/Exportsales.aspx 49 See The Guardian, 22nd October 2008 – Russia, Iran and Qatar announce cartel that will control 60% of world’s gas supplies

Economic Policy Centre SECURING OUR ENERGY FUTURE 33
whilst in theory, the UK could draw down gas from all over the world, in practice, it is far from happening. Table 11: UK Gas Imports by Country in 200850 Country Bcm Delivered by
Norway 25.30 Pipeline
Netherlands 9.00 Pipeline
Belgium 1.12 Pipeline
Trinidad & Tobago 0.47 LNG
Algeria 0.37 LNG
Qatar 0.12 LNG
Egypt 0.08 LNG
And for what data is available so far for 2009 – a UK government source confirms - the only other country we have received gas from is Nigeria. The key point to understand is that for the UK, Russia exerts far more influence over the price of gas than over the quantity of supply (from Russia), which is unknown, probably very small, but highly influential on the market price. So much for the existing supply of gas by pipeline, but what of the future? As mentioned before, the UK is at present only connected via two pipelines for gas imports. However there are ongoing European projects, which will have an indirect impact on UK gas supply and prices. Two of these are about increasing the quantity of Russian gas to continental Europe. Nordstream, slated to bring 55 bcm annually of Russian gas across the Baltic into Germany is due to be completed by 2011, but there are real fears that the project may be delayed due to the deterioration of Gazprom’s balance sheet and the higher costs of financing in the credit crunch. Should anyone be in doubt of this, a quick look at Gazprom’s rapid decline in share price since the onset of the credit crisis – from a high of 350.47 in May 2008 to a range the last few months of between 180 and 130 rubles speaks volumes. Southstream, also a Gazprom project, anticipated for completion by 2015, was set to carry 63 bcm annually from the Russian black sea coast through Bulgaria, North West Serbia, Hungary, and Greece and then across the Adriatic Sea to Italy. This latter pipeline now has a much less certain future. Alternatives do exist to deeper Russian integration to the European gas market. Primarily the Nabucco project, which proposes transporting up to 31 bcm of gas (by 2020) all the way from the coast of the Caspian Sea in Azerbaijan, via Georgia and Turkey, Bulgaria, Romania, Hungary and to Austria. The Russian-Georgian war of August 2008 now makes this look a much more risky proposition. Of lesser importance, less than 10 bcm, are the Skanled pipeline, connecting Norway to Sweden and Denmark, pipelines connecting Turkey, Greece and Italy and an Algeria-Sardinia pipeline. The cumulative effect of all these pipelines going ahead would be substantial. The odds are however, that they won’t. In the face of growing demand for gas-fired electricity, the UK will almost certainly have to look even more to LNG imports. But how much LNG can the UK realistically expect to import?
50 From Platts, June 12th 2009 – ANALYSIS: BP stats show increasing diversity of UK gas supplies

Economic Policy Centre Why and how it must be done 34
The starting point that cannot be ignored is that LNG gas is always more expensive than pipeline because it has to be liquefied by chilling it to –260 F, compressed to 1/600th of its volume, transported by tanker and then re-gasified into natural gas at the LNG import terminal. Losses occur during the LNG process because the liquefaction process loses anywhere from 8 to 13% of the gas, some gas is allowed to boil off to reduce refrigeration requirements and some gas is used to power the LNG tanker. The total loss for a journey over thousands of miles therefore can amount to 15%. For all that, 2009 is already showing a big increase in LNG imports and their source of supply for the UK. This is due to the opening up of the South Hook LNG terminal, the participation of companies like Centrica and GDF-Suez in the spot LNG market, picking up cargoes from as far away as Australia and the soon to be opened Dragon LNG Terminal. Whilst in 2008, the UK only received 14 LNG cargoes, by June 2009, there had already been 33. This growth has been impressive but there are far too many clouds on the horizon, ultimately to do with global demand and the UK’s location in the wrong corner of the world and its comparative inability to sufficiently compete for limited LNG cargoes. Much of this is to do with projected future demand in the Pacific Basin. The central point is that while China imported only 3.9 bcm via LNG in 2007, this is forecast to rise to between 50 and 100 bcm in 2020. Japan, already the world’s largest consumer of LNG used 88.8 bcm in 2007, which is expected to rise to 110-115 bcm by 2020. Korea, also an additional 20 bcm by 2020 and India another 10 bcm. All this when Saudi Arabia and Abu Dhabi took the decision to no longer export gas via LNG, but use it for domestic consumption instead. Japan also has an unwanted role in providing unanticipated spikes in global demand for LNG. An earthquake in July 2007 put 10 GW of nuclear plant out of action, which could only be replaced at short notice by LNG, leading to high spot prices for LNG cargoes, which were diverted away from European markets to Japan. As a geologically unstable island chain with a large nuclear fleet, this is quite likely to happen again, especially if Britain continues to procure gas in the spot market rather than on long-term supply contracts. As a February 2009 paper by Global Energy Advisory concluded on LNG, “Within the industry it is well known that 83% of global LNG is already contracted on a long-term basis. Therefore the UK will have to compete, on a global scale, for the remaining 17%, which by any standards, is a relatively small energy resource”. There is however room for some optimism in available supply on the grounds of the slump in global industrial demand and technological advances in the extraction of gas from shale. The fall in industrial production – a driver of gas prices - year-on-year is huge; down 19% in Japan, 18% in Italy, 17% in Germany, 15% in Canada, 13% in France and Russia, 11% in the US and UK and 10% in Brazil and a 12% rise in China can’t make up for that51. But unlike oil, gas prices are still very regional and by far the greatest fall has been in the USA. From a peak of just over $12 per million British Thermal Units in July 2008, the price has collapsed to less than $3.5 today52. This staggering fall was driven by technological advances, specifically hydraulic fracturing, which has made it possible to drill for hitherto trapped natural gas in shale rock. And the potential gas reserves this technology has made available are so substantial that just one field, the Marcellus Shale, is so large, that it may contain as much natural gas as the North Field in Qatar, the largest ever discovered53. It’s interesting though that whilst future plans are afoot to sell some of this gas abroad by LNG, the market is deemed to be not Europe across the Atlantic, but from Canada’s West Coast to the Pacific Basin.
51 See optimistic but as ever insightful article by Ambrose Evans-Pritchard, Daily Telegraph, 12th October Energy Crisis is postponed as new gas rescues the world 52 See US Natural Gas Wellhead Price http://tonto.eia.doe.gov/dnav/ng/hist/n9190us3m.htm 53 See Low and Behold by Edward L. Morse in Foreign Affairs – Volume 88 No. 5 – September/October 2009

Economic Policy Centre SECURING OUR ENERGY FUTURE 35
What this shows is that while the global picture on gas supply is good thanks to the recession, US gas shale and an LNG supply surge, the UK is ill-placed to benefit from lower prices. Household demand may be dropping in the UK for gas, but the requirement for CCGT is growing as the CCGT fleet continues to expand. And there has been no corresponding fall for gas prices for consumers in the UK. According to National Grid’s GB Seven Year Statement 2009 from May of this year, the UK is expected to acquire an additional 10.3 GW of CCGT capacity by the Financial Year 2015/201654, a figure which already excludes 5 GW of CCGT already under construction. That’s why all too few energy analysts agree with Malcolm Wicks MP in his October 2008 report for the Prime Minster, Energy Security: A national challenge in a changing world which posited that thanks to the measures in the Energy White Paper total UK gas demand would be in 2020 66 bcm or a good 30 bcm lower than it is today. The government’s view that widescale adoption of energy efficiency and renewables by this date making such a substantial impact on UK gas demand is shared by virtually no one. All in all, as Dieter Helm, Professor of Energy Policy at the University of Oxford argued in a September 2007 paper55, “. . .LNG can be seen not as a competitive panacea which “solves” gas dependency in Europe, but rather as one useful part of the armoury in reducing the acceleration in import dependency on Russia. And to the extent that Russia influences or colludes with LNG suppliers, its effects on dependency are yet further limited”. Thus it is fair to conclude that in the years to come, largely through its own mismanagement, the UK faces a prolonged period of relatively uncertain gas supply and the volatile and high prices that will come with it. For all the reasons outlined in this short chapter and more, it would be foolhardy indeed to bet on gas meeting the UK’s energy gap. But that is exactly what Britain has done.
54 See Figure E.4 from the GB Seven Year Statement 2009 - http://www.nationalgrid.com/uk/sys_09/default.asp?action=mnchE_5.htm&Node=SYS&Snode=E_5&Exp=Y#Generation 55 The Russian dimension and Europe’s external energy policy – published 3rd September 2007 by Dieter Helm.
Economic Policy Centre Why and how it must be done 36
Chapter 4: Popular Policy Solutions and why they won’t work There are a great many popular policy solutions that will take us nowhere or anyway not very far. Energy efficiency will only increase energy consumption, carbon taxes require international agreement and faith that our politicians can set the price and correctly predict the outcome. With carbon trading, the price will never be high, stable or long-term enough and personal carbon trading is not worth the effort. New committees, quangos or other organization(s) have never yet yielded any returns, capacity payments are a solution in search of a problem and distributed micro-generation could only ever shave off some peak demand. A great handicap in meeting Britain’s energy challenge has been a prolonged and utterly misplaced faith in policies and concepts that in the real world, just do not work. Energy Efficiency56 "It is a confusion of ideas to suppose that the economical use of fuel is equivalent to diminished consumption. The very contrary is the truth" The quote above is from an economist, William Stanley Jevons in his 1865 book, The Coal Question, which illustrates quite nicely just how long this canard has been around. It has since become known as the Jevons Paradox57. Energy efficiency should be understood as the numbers of dollars produced per barrel of oil equivalent input. To that end, this author for the first time produced these figures for the Economic Research Council in the Digest of Energy Statistics 2008 and they make for interesting reading. Contrary to received opinion, the UK is one of the most energy efficient countries of the world, producing $940 per barrel of oil equivalent input, giving it a world ranking of seven and far ahead of most its European neighbours. But the central fact is that, for reasons that will be explained, it is not possible to produce more from less, only less from less, or much more from more. The trend throughout world history is that as any country becomes richer, it produces more dollars per barrel of oil equivalent, as it learns to allocate capital more efficiently. But because that same country has more money from GDP growth it rebounds as an additional economic input and becomes an indirect additional energy input. Here are some real world examples of how this might happen. A typical UK consumer decides to religiously switch off all lights, standby buttons, phone chargers when all these appliances are not in use and to run his washing machine and dishwasher at night. He makes an estimated saving of say, £200 per year. But what does the consumer do with that extra money? Obviously he/she does not burn it in its cash form and take it out of circulation, contracting by a miniscule amount the money supply available to the private sector. This consumer may choose instead to make an additional trip to Spain with a budget airline, or to buy more electronic goods which are invariably made in China where many fewer dollars of output are created per barrel of oil equivalent input (less than $200). This consumer may have reduced his personal energy footprint, but in reality, what has really happened is that he has transferred and expanded it to elsewhere in the wider global economy. 56 See excellent paper by Horace Herring Does Energy Efficiency Save Energy: The Implications of accepting the Khazzoom-Brookes Postulate – available here http://technology.open.ac.uk/eeru/staff/horace/kbpotl.htm published April 1998. 57 The Jevons paradox – technological progress that increases the efficiency with which a resource is used, tends to increase (rather than decrease) the rate of consumption of that resource.

Economic Policy Centre SECURING OUR ENERGY FUTURE 37
Another example, as Horace Hering argued (see footnote 53), is how larger and wider-bodies passenger aircraft were developed partly in the belief that they would replace smaller aircraft and reduce the number of flights. This idea was recently rehashed again for the launch of the Airbus A380, the world’s largest passenger aircraft. What actually happens is that the lower cost per passenger led to a massive increase in air travel, much greater than that offset by the increased size of the aircraft. One further example would have to be with road vehicles. In the last 20 years, the internal combustion engine of an ordinary car has become even more efficient, churning out more speed for less power, whilst delivering it at a lower price, with probably much greater improvements in terms of vehicle weight and hybrids just around the corner. Think of it this way; there would certainly not be more vehicles on the road if they had become less efficient and much more costly. The truth is that you can't reduce energy demand through energy efficiency, unless you are committed to contracting the money supply, reducing purchasing power and ultimately engendering a recession. You can't save energy, because the money from that energy saving rebounds typically into the money supply and this may even have a multiplier effect if it is given over to a bank which lends out typically 7 times what is on deposit (in pre-Basel II times, capital adequacy ratio was usually 12-13%). So putting your savings into a bank account may be the most energy intensive action you can take. In woefully small academic circles, the debate about the inefficacy of energy efficiency measures continues. In 1980, economists Daniel Khazzoom and Leonard Brookes (and Chief Economist at the UK Atomic Energy Agency) agreed that attempts to reduce energy consumption by increasing energy efficiency at the micro level would merely raise aggregate demand for energy across the national economy. In 1992, US economist Harry Saunders argued that “energy efficiency gains can increase energy consumption by two means: by making energy appear effectively cheaper than other inputs; and by increasing economic growth, which pulls up energy use” and named Khazooms and Brookes’ work, the Khazzoom-Brookes Postulate. For all this, highly respected consultancies such as McKinsey continue to produce large studies on curbing global energy demand58 and energy efficiency remains a mainstay of UK energy policy, capped as it is with the aptly-named quango, the Energy Savings Trust, a body to which far too many who should know better are in a state of high deference. 59 To be fair, some environmentalists have recognized the rebound effect. In a paper for the Cambridge Centre for Climate Change Mitigation Research60, it was estimated that the direct rebound effect would be an additional energy demand of 10%, but the compound effect would be 31% by 2020 and 52% by 2030. This acknowledgement of the rebound effect though has led some greens to believe more fervently in green taxes to soak up the rebound effect, the limits of which will be discussed later. Britain’s policymaking establishment must come round to the idea that the country needs more energy, not less and that the long-term solution is to promote the expansion of clean and secure energy whose input has no negative environmental impact. 58 See Curbing Global Energy Demand Growth: The Energy Productivity Opportunity – published May 2007 by the McKinsey Global Institute 59 Particularly the BBC, see UK “tops” energy wasters league http://news.bbc.co.uk/1/hi/uk/6075794.stm which shows virtually no understanding of the subject and almost all the national newspapers in receipt of large advertising commissions from the Energy Savings Trust and one suspects, some PR companies and conference organisers. 60 See The macroeconomic rebound effect and the world economy – by Terry Barker, Athanasios Dagoumas and Jonathan Rubin – published online 28th May 2009 - http://www.springerlink.com/content/h1453654m8855732/fulltext.pdf

Economic Policy Centre Why and how it must be done 38
One day, the penny will drop on the futility of energy efficiency, and William Stanley Jevons will deserve the credit. For as he said in landmark book The Coal Question in 1865; “The reduction of the consumption of coal, per ton of iron, to less than one third of its former amount, was followed, in Scotland, by a ten fold increase in total consumption, between the years 1830 and 1863, not to speak of the indirect effect of cheap iron in accelerating other coal-consuming branches of industry”. Carbon Taxes Although only formally levied in a handful of countries61 this is a popular idea amongst many in the media and European policymaking circles because at first glance, they are attractively simple and fair to all the alternatives. Perhaps unsurprisingly, some of the most impressive arguments against carbon taxes are made by those promoting carbon trading. Leaving aside the immense difficulties that will come from implementing an agreed transnational level of taxation, Dr Richard Sandor, the inventor of carbon trading makes three compelling points against carbon taxes62. Put simply, he has little confidence in government’s ability to forecast and be flexible. His objections are expressed here as rhetorical questions based on an interview this author conducted with him in early 2006;
i) How do you set the price and the size of the tax? ii) How do you know what the response of the market is going to be? iii) If any or all of the following; price, size of the tax and the market response are
wrong, can a government move very quickly to adjust that tax once it is in place? In a letter to the Economist magazine63, Henry Derwent, President of the International Emissions Trading Association argued that “Carbon taxes may seem seductively simple and fair in principle, but in practice they are neither. . . tax systems, more so than market systems, are prone to tweaks around the edges, giving free rides and special exemptions to favoured industries. The simplicity of taxes is their downfall; both the industries affected and their customers who ultimately foot the bill will cry foul”. Thus far the evidence is that governments around the world have found it very difficult to bring in carbon taxes, on top of many existing green taxes and they will find it even harder to reach international agreement on the right price and quantity. The greatest problem of all however with carbon taxes is that whilst they crudely attempt to price in the cost of anthropogenically-induced climate change, however big or small that may be, over the next century, there is no consideration given within a carbon tax to energy security. Carbon Emissions Trading The idea of carbon trading is American, originally pioneered by Dr Richard Sandor, a Chicago School economist, who based it on the successful pollution trading schemes of sulphur dioxide of the 1980s. By putting a price on carbon, you create a cost to its emission, which wasn’t there before, thus creating an incentive not to do so. If you set a limit on carbon emissions and issue carbon permits to trade, i.e. the right to emit carbon, then it creates commercial flexibility for companies – they can either reduce carbon and fulfil their quota or, if they can’t afford that, buy permits from those firms that have reduced more than their required amount. In principle, carbon trading has a lot more going for it than carbon taxation and unsurprisingly, many more countries are signed up to it under the jurisdiction of the EU Emissions Trading 61 Sweden was first in 1991, followed by Finland, the Netherlands and Norway in the 1990s. British Columbia, one of Canada’s provinces, implemented a carbon tax in July 2008. 62 See interview with Dr Sandor Counting carbon as conducted by Dan Lewis and published by Power Engineer magazine, June/July 2006 63 Capping, not taxing – June 11th 2009, letters page of The Economist.

Economic Policy Centre SECURING OUR ENERGY FUTURE 39
Scheme, the Clean Development Mechanism of the Kyoto Protocol and the Joint Implementation Market. In 2008, the global carbon market grew by 83%, seeing a turnover of 4.9 billion tonnes of carbon dioxide, worth an estimated $125 billion64. It does however have several shortcomings, some of which are fatal.
i) The carbon price is not stable. Since inception, volatility has been the order of the day. Whilst this suits traders, it is a negative incentive to investors seeking to make a calculated return over a given time period.
ii) The carbon price does not price far enough into the future. Many low carbon technologies have very high front-end capital expenditure costs. These could be overcome if there was a guaranteed income stream many years into the future, but the carbon markets do not price forward more than a few years and are unlikely ever to do so.
iii) The carbon price is not high enough. This depends on whom you speak to, but the vast majority of projects have only been able to finance cheap, easy and very profitable projects like HFC-23 removal – a hyper greenhouse gas that Chinese chemical firms threaten to manufacture as a waste gas byproduct from the manufacture of the refrigerant gas HFC-22, unless they receive the credits. The alternative is potentially groundbreaking, very expensive and research-intensive technology like carbon capture and storage, which would require much higher carbon prices.
iv) It does not place any value on energy security. For the UK and many other countries, this is much closer to a hard numbers certainty in the near future than what may or may not happen to the climate many decades hence.
v) It relies on governments to set a declining annual quantity of permits to emit a metric ton of carbon dioxide. Over time, this would push up the price of carbon and increase investment in low carbon technologies. Clearly, this has not happened and the record of EU governments has been to allocate more permits than there were carbon emissions. In fact, in 2005, the EU’s ETS managed to allocate 4% more permits than there were carbon emissions, sending the carbon price into freefall. This overallocation of permits often results from lobbying by high carbon fuel producers.
vi) It does not permit the inclusion of nuclear power. Odd, when it is clearly a very low carbon source of power and when coal plants do receive carbon credits under the Clean Development Mechanism when they co-fire with biomass.
vii) Defining additionality and avoiding VAT fraud – the additionality principle is that carbon reduction projects are only meant to receive carbon credits if it can be established beyond doubt that the project would not succeed without them. What happens all too often is that many projects, which are already fully financed and even in a state of construction, end up receiving carbon credits as a bonus thus demonstrating that no additional carbon reduction actually took place. Recently, a new type of fraud has taken place, VAT carousel on carbon credits. How this works is that a trader of carbon credits buys them from a country free of VAT, sells them to a country with VAT and invoices for the VAT which is not then passed over to the tax authorities. Then they re-export the same credits again, reclaiming the VAT and repeating the process ad infinitum. To combat this, the UK and France recently made Carbon Credits VAT zero-rated and the European Union is looking to harmonise a reverse charge system, which was effective in VAT fraud on mobile phones65.
64 See Carbon Market Up 83% In 2008, Value Hits $125 Billion – from http://www.environmentalleader.com/2009/01/14/carbon-market-up-83-in-2008-value-hits-125-billion/ January 14th, 2009 65 See Brussels targets carbon trading fraud ahead of Copenhagen summit – by Ashley Seager, the Guardian, 29th September.

Economic Policy Centre Why and how it must be done 40
Personal Carbon Trading Research into this version of carbon trading has been pushed very hard by the Royal Society of Arts and is now up and running on a very small scale. The concept is that we will one day all carry around carbon permits on our credit cards and happily trade with each other, with average UK per capita emissions of nine tonnes of CO2. Apart from all of the problems outlined above, critics would cite the difficulty of designing a trading system on that scale for such low values and be able to continually monitor and verify its operation. As Dr Richard Sandor said “. . . the cost of collection is impossible relative to the collection fees. You’d need to systemically design and it would be very hard to monitor and verify millions [of people] and do it cost-effectively” (see footnote 59). Independent Carbon Policy Committee This is an idea pushed very hard for some time by some energy economists and has recently been created in a much-watered down form as the Climate Change Committee. The concept was to reprise the relative success of the Monetary Policy Committee in fighting inflation (creating Non-Inflationary Consistently Expanding growth) and appoint experts who would be in charge of the policy levers for reducing carbon. The underlying flaw to this idea was that it took Britain decades of very expensive policy experimentation to find out, what was an effective way to find an acceptable balance between inflation, growth and employment. When it was set up in 1997, a consensus had already emerged that interest rates should be the lever and it was this policy that worked, rather than the Monetary Policy Committee itself. In fact, it’s unlikely that, had the then Chancellor continued in his post with existing control over interest rates, there would have been very little difference to the overall economy as interest rate decisions would probably have been very similar. Had a semi-independent MPC been set up in the 1950s, 1960s, 1970s or even the late 1980s, it would most likely have been an unmitigated disaster as they would have implemented the clever policy ideas of the time; wage and price controls, fixed currency, Exchange Rate Mechanism etc. all of which have now been discredited. Similarly, a Carbon Policy Committee today would have no clear idea of how best to optimally reduce carbon dioxide emissions at the lowest possible cost to the economy. This is a debate that has only just begun. Feed-In-Tariffs (FITs) Many policy advocates for renewables look to Germany’s initial 1990 Stromeinspeisungsgesetz and the subsequent success of their feed-in-tariff policy (Erneubareenergiegesetz or EEG) from 2000 in financing capacity in short order for renewable technologies such as onshore wind and solar pv. They argue that Britain should do the same. Unlike, a trading system of green certificates such as the Renewables Obligation, FIT believers would argue, FITs offer transparent prices to developers and policymakers alike and create certainty for investors. What is often overlooked though is that the high rollout of windpower in Germany was first of all made possible by planning laws and a culture that unlike Britain, generally welcomed infrastructure and development (not least in housing). In the ten years from 1990, Germany reached a capacity of 4,500 MW66 and after the introduction of the EEG in 2000, it accelerated still further, reaching by the end of 2008 a total of 23,903 MW. The UK where the installed capacity is still just under 3,500 MW bears no comparison. So planning, not FITs, is the most important reason for the difference between the UK and Germany in the take-up speed of onshore wind.
66 To see a detailed discussion of these issues, read the paper Comparison of feed-in tariff, quota and auction mechanisms to support wind power development by Lucy Butler and Karsten Neuhoff, Faculty of Economics, Cambridge University – published 25 October 2007.

Economic Policy Centre SECURING OUR ENERGY FUTURE 41
The second point is that the German feed-in-tariffs were very generous to developers, which was clearly a big incentive to them. During the period of highest growth, the FIT for wind was as high 5.5 eurocents per kilowatt hour (plus 3.2 eurocents per kwh in the first 5 years) and up to 57.4 eurocents per kilowatt hour for solar photovoltaic installations. The downside to this generosity was that it made viable the operation of wind farms at a very low load factor, about half what it is in the UK. A 2005 statistics study from RWE and E.ON found that the average load factor for 1000 MW of wind installed was just 16% for RWE and a paltry 12% for E.ON67. In other words, a 1 MW wind turbine installed in the UK produces twice as much power as its equivalent in Germany because the UK load factor for wind turbines averages around 25% and, in a good year, a bit more. So, when measured by the power actually produced rather than the capacity installed, the UK’s RO is actually cheaper than Germany’s FITs. Yet what should also be understood is that the FIT operates independently of market prices. When market prices were low, as they were in 2002, from the UK perspective, German FITs looked very expensive. Since the large rise in wholesale prices, which has to be added to the ROC buyout price, the RO now looks more expensive - per individual unit produced - than the German FIT. Perhaps that’s why for some people whether FITs or green certificates are the better way forward is by no means resolved and a great academic debate has been raging. A much celebrated paper, Comparison of feed-in tariff, quota and auction mechanisms to support wind power development by Lucy Butler and Karsten Neuhoff68 concluded that FITs reduced costs to the consumers and resulted in larger deployment. Perhaps then a more balanced conclusion is that while FITs have some advantages over tradable green certificates, both the ROC system and Germany’s FITs offer a too generous rate of return to the detriment of the consumer and the long-term security of our energy supply. A new Energy Agency/ Quango (s) / Ministry / Minister Table 12: UK Energy Ministers since 1997 Minister Year appointed
Lord Hunt/Ed Miliband 2009
Mike O’Brien 2008-09
Malcolm Wicks 2007-08
Alistair Darling with Lord Truscott 2006-07
Malcolm Wicks 2005-06
Mike O’Brien 2004-05
Stephen Timms 2002-04
Brian Wilson 2001-02
Peter Hain 2001
Helen Liddell 1999-2001
John Battle 1997-99
67 See German results cast doubt on UK’s wind farm proposals – The Independent, Sunday 31st July 2005. 68 See Butler L, Neuhoff K. Comparison of feed-in tariff, quota and auction mechanisms to support wind power.... Renewable Energy (2007)
Economic Policy Centre Why and how it must be done 42
That the UK is now on its twelfth Energy Minister since 1997 is quite indicative of how unfocussed, bureaucratic and low down the set of government priorities, British energy policy has become. Add to this the proliferation and confusion of government ministries which periodically have also rebranded themselves and the energy portfolio that sits under them – usually extending to at least two ministries and often more. Today we have the Department of Energy and Climate Change (DECC), which did at least succeed in taking over some of the energy functions of the precursor departments, DBERR (Department for Business, Enterprise and Regulatory Reform and DEFRA (Department for Environment, Food and Rural Affairs). Those two departments were barely on speaking terms, fighting countless turf wars and channeling resources to various new quangos to little effect. Before these there was the Department for Trade and Industry which was preceded in 2005 by the Department for Productivity, Energy and Industry for a week until the name was changed back to the DTI. There has not been a Department of Energy since 1992 when most of its functions were absorbed into other bodies or departments. Although there was a Ministry of Fuel and Power from 1942-1957, it then became the Ministry of Power until 1969 when it disappeared into the Ministry of Technology. With each new Ministry and Minister, invariably arrives a new range of quangos to implement the latest policy emphasis. Many energy policy analysts look back to the period of 1973-1992 when the UK last had an aptly-named Energy Department and almost no quangos as a relative golden period, at least in terms of understanding who did what. They have a point, that this is a problem, but a single energy agency or department is not a winning solution. The root cause of Britain’s energy woes is not bureaucracy, but the failure to create a policy framework that encourages the long-term investment in clean and secure electricity supplies at an affordable price to the consumer. Capacity Payments Another popular idea is to re-introduce capacity payments, to ensure a sufficient margin of backup capacity. This idea is not unique to the UK - electricity market designers have in various forms around the world used capacity payments to pay for a sufficient safety margin. There are two things wrong with this argument; firstly it ignores the negative experience to the consumer of capacity payments in the UK in the 1990s. And secondly, the UK already has a competitive reserve market, which has replaced a much inferior regulated capacity market. Before the introduction of the New Electricity Trading Arrangements (NETA) in 2001, the UK electricity market worked on a Pool-based system69 from 1990 in preparation for privatization of the electricity industry. Generators were required to bid into a centralized market (the Pool) and the system operator used a computer programme (GOAL) to schedule generation to match demand with information in the bids. Under this electricity pool system, generators received capacity payments to create spare capacity, which on the face of it was a sound idea. What actually happened in practice was that it became a scam, as both generators and customers learned to game the system, withdrawing capacity to cause an artificial tightness in the market and raise pool prices. The large portfolio generators learned how to collude and manipulate the Pool price to their advantage and to the detriment of the consumer, by creating higher System Marginal Prices and capacity payments. The flawed system also created over-investment in plant capacity, which created a highly wasteful plant margin of 30%, also paid for by the consumer, compared to today’s 15%.
69 See lecture by David Currie to the Institute of Economic Affairs – The New Electricity Trading Arrangements in England and Wales – 10th October 2000 - http://www.iea.org.uk/record.jsp?ID=369&type=book

Economic Policy Centre SECURING OUR ENERGY FUTURE 43
Advocates of capacity payments also fail to recognize that they are a solution in search of a problem because the National Grid already tenders competitively for reserves to balance demand and supply. Today the UK has a system of bilateral trading where suppliers and generators can do deals with one another to ensure that supply equals demand within a supplier’s portfolio. National Grid plays a role in balancing the system, as a supplier of last resort and if not enough generation is procured, then NG directly contracts with the generators or the demand side to keep it stable. This is done not just on an hourly basis, but forward in the maintenance of a reserve. These reserves of spare capacity are divided up into four segments depending on the timescale they are required, from under two minutes to 24 hours in advance. These segments are known as BM Start-up, Short Term Operating Reserve (STOR), Demand Management and Fast Reserve. They are also known as ancilliary service contracts and the National Grid regularly tenders for the provision of all of them. However, there may be a good argument for extending the contracting out of reserves beyond 24 hours notice and having a higher system margin than 15%. This might be required if a terrorist attack on a large power station or two – or indeed a substation - were to succeed in shutting down several gigawatts of power or if the proportion of intermittent power were to grow substantially. This is a decision that depending on the terrorist or supply risk, may have to be a political one on an annual basis and additional standby reserve could be put out to competitive tender. Distributed Micro-Generation (DMG) Distributed Micro-Generation can be broadly defined as the small-scale production of heat and/or electricity from a low carbon source. Typically, this would include solar pv panels, small wind turbines and micro combined heat and power. Overlapping strongly with micro-generation – because no one really agrees what the capacity cut-off is - is decentralised energy. This is energy that is generated at, or near to, its point of use and does not rely on the high voltage transmission system, but on the distribution network. This may include energy generated for a single home or for a local community. Today, the impact of distributed micro-generation to Britain’s overall electricity supply is very tiny. Out of a combined capacity of around 80,000 MW, small wind contributes just over 20 MW, small hydro (less than 5 MW) around 70 MW, solar pv some 22 MW and CHP 214 MWe for plants smaller than 1 MWe. There is however no question, that much more microgeneration is coming because from the 1st April 2010, the feed-in-tariffs have been raised several times. From 10p a kilowatt hour or less to 36.5p/kWh for small solar photovoltaic systems up to 4kW, 28p/kWh for systems up to 10kW and up to 23.0p/kWh for small wind turbines between 1.5kW and 15kW. This massively raises the yield on the investment (between 5 and 8% according to DECC), reducing the payback time to the owner and makes it more of an investment rather than a lifestyle choice. There are several problems with increasing DMG, which although not insurmountable are costly and of questionable benefit.
i) Why should Distribution Network Operators (DNOs) be forced to buy electricity from households at up to nearly ten times the market price of around 4-5p a kilowatt hour?
ii) Do retail consumers really want to pay additional costs for the full-scale upgrading (increased circuit breaker ratings, reconfiguring of network and sequential switching, increase in voltage etc.), of the distribution network, so that it can become capable of receiving way above market price electricity exports from the home and workplace?
iii) Do homeowners really want much higher voltage lines traipsing into and around their homes (Think of health, safety and nimbyism)?

Economic Policy Centre Why and how it must be done 44
Exporting large amounts of intermittent electricity to the distribution network creates a whole range of problems equally as difficult as load-balancing gigawatts of intermittent wind power on the National Grid. That’s why the extension of the argument for DMG rests in the near future on a rollout of so-called Smart Meters. Smart meters have had a very good press and supporters would argue that they are vital to the creation of an intelligent distribution network70. The UK is set to have one in every home by 2020. At an estimated fully installed cost of £200 for all 27m UK households they would not be cheap. They may even cost as much as 50% more than the government’s estimates of £9 billion or perhaps £500 per household according to Ernst & Young71. And the savings incurred are very much geared towards the convenience of the DNOs (no more manual meter readings, ability to remotely shave peak household demand, ability to measure exported electricity) rather than that of the consumers, who themselves might save a low single digit percentage each year. In that respect, it’s very possible that from the consumer’s point of view, they will not pay for themselves before they have to be replaced – all electronic equipment has a high hardware refresh rate – and maybe after as short a period as 10 years. One microgeneration company, Windsave, which recently, sad to say, went bust, did have some pioneering electronics worth saving. A small wind turbine combined with a box of electronics that only fed into the baseload demand of the said home. This avoided all the problems that occur when exported electricity meets the distribution network. These devices could be connected with a range of small intermittent renewable technologies.
70 They have also had some bad press following revelations that Lord Truscott who was working as a consultant for Landis & Gyr, a Swiss-based smart meter company, pressed DBERR to speed up the rollout of meters from 12 years to 10 http://www.timesonline.co.uk/tol/news/politics/article6727621.ece 71 See figures in “Government gears up £30m in grants to promote charging points for electric vehicles” – The Times, November 20th
Economic Policy Centre SECURING OUR ENERGY FUTURE 45
Chapter 5: A Solution that will work Britain has a surplus of energy policy and could do with a great deal less. Too much of it is geared towards appeasing marginal but vocal interests which achieve even more marginal outcomes. Particularly in these straightened financial times, there is an intense need to get back to basics and reorder energy policy along secure, affordable and clean lines within a much streamlined bureaucracy. As this paper has shown, Britain’s existing energy policy framework has been unable to address the following problems;
i) A failure to provide a clear long-term signal to nuclear energy provision ii) A failure to overcome the shortcomings of carbon trading which contributes
nothing to the UK’s power supply iii) The total inadequacy of the European approach of over-regulation, short-term
focus, over-emphasis on intermittent renewables, reducing carbon and increasing future energy dependency on Russia
iv) A failure to address concerns over securing future gas supplies v) An over bureaucratic / quango approach vi) A failure to create genuine competition between technologies vii) A failure to lower the cost of capital by providing long term incentives and supply
commitments for new projects viii) A failure to face up to the limitation of load-balancing intermittent power at the
National Grid and Distribution Network level ix) A failure to create liquidity in the forward electricity market
The Clean and Secure Energy Obligation (CSEO) It is thus proposed to introduce a Clean and Secure Energy Obligation. This will be modelled on the Renewables Obligation, but will be different in three crucial areas;
i) Buyout prices will be much lower, at £12 a megawatt hour, with no favourable banding for different technologies
ii) More technologies will be included – especially dispatchable and baseload generating types like nuclear, hydro and wind combined with storage and allow for more interconnectors with clean and secure energy supplies on the European mainland
iii) It will be guaranteed much further into the future – 2060 – when the electricity supply will be 100% secure and decarbonised.
By setting a long-term goal of a 100% decarbonised and secure electricity sector by 2060, Britain could for the first time have a policy framework that matches political aspiration in a commercially viable framework. Today Britain can say that when the existing renewables and nuclear portfolios are added together, it has a clean and secure electricity supply equal to just under 20%. This is patently inadequate. The CSEO will also start to value foreign renewable and nuclear power as an asset. It will create investment criteria for more cross-stabilisation with the emerging European electricity grid, both across the Channel with France, across the North Sea with Scandinavia’s excellent and highly liquid electricity markets and encourage further investment in Norway’s hydropower resources, currently just 29 GW. The theoretical potential of Norway’s

Economic Policy Centre Why and how it must be done 46
hydropower capacity is some five times larger72. And following the election victory of Chancellor Angela Merkel in Germany, it is quite likely that a new German nuclear build programme will ensue, an increase in the supply to which the UK would do well to be better connected. Gaining entry into the Clean and Secure Club So what are the criteria for electricity generating technologies to become certified as clean and secure? Today, responsibility for energy security is split between OFGEM, the DNOs, the National Grid, the European Union, the Department for Energy and Climate Change and all its underling organisations. Critical to delivering energy security in the future is the creation of clear lines of responsibility for it and to enable long-term investment in clean energy technologies that can primarily to deliver baseload, dispatchable and home-grown power in preference to intermittent and imported sources that either cannot contribute more than a - still worthwhile - but only a sizeable fraction, or are subject to external supply shocks beyond the control of the UK government and UK energy stakeholders. Energy Security is a political responsibility and politicians must be made directly accountable for it. This requires a new and uncomplicated structure – the Clean and Secure Energy Committee. This will be staffed by three politicians; specifically, the Chancellor, the Secretary of State for Defence, and the nearest equivalent to the Secretary of State for Energy of the serving government. Their task will be, once a year to take hearings, gather information and make a decision on what technologies can be admitted to and expelled from the Clean and Secure Energy Club. They would not only take submissions from technology lobbyists such as nuclear, solar and wind, from green and other NGOs, but also from foreign-owned DNOs, from foreign state-owned hydrocarbon suppliers, the National Grid and other players who will doubtless emerge over time. For the first time, they will be held accountable to provide clean and secure energy to the UK and in order to differentiate between the contribution each can make, a points system will be created that they can compete to improve their ranking on. The Clean and Secure Points System After no small amount of acrimonious debate, it is now a mainstream view that a points system is a sensible approach to filtering cost-effective immigration into the UK. For example, amongst many other criteria like earning power, age and English language proficiency, a person with a PhD gets 50 points, a Masters Degree 35 points, a UK qualification 5 points and none of the above, 0 points73. The UK now needs to implement a similar system for enticing and creating a competitive merit order for the provision of increasingly clean and security electricity supplies and its related infrastructure. All technologies, energy sources and related infrastructure should be ranked out of 5 (5 = excellent, 0 = of no net benefit) according to the following criteria in no particular order;
• Ability to provide baseload power - is this an always-on power source? • Ability to provide dispatchable power – how quickly can it be ramped up to provide
a shortfall in power? • Ability to quickly switch off power – how well can it cope with a sudden fall in
demand and market price?
72 According to the World Atlas 2007 of the International Journal of Hydropower & Dams, Norway produced 119,300 gigawatt hours of hydropower electricity in 2005/06 but has a gross theoretical potential of 600,000 if all its potential sites were developed. 73 A quite ruthless filtering system, see http://www.workpermit.com/uk/hsmp_calculator.htm

Economic Policy Centre SECURING OUR ENERGY FUTURE 47
• Ability to provide clean power at the point of production and consumption – how much CO2 and particulates does it produce per megawatt hour and how much do they relatively affect the UK?
• Ability to withstand external fuel supply shocks – can it be stockpiled, how easily can alternative supplies be sourced?
• Ability to generate home-grown power – can it be provided for in the UK? • Ability to provide secure power from abroad – are there contracts in place to
ensure that supplies will still reach the UK in the event of interruption on the European mainland, or just possibly, further afield from Iceland or North Africa?
• Is the fuel/power sourced from a country that is a liberal democracy or sympathetic to liberal democracy?
• Ability to integrate with existing energy infrastructure – can it be easily and at low cost integrated with the existing electricity infrastructure and if not, what are the changed infrastructure benefits from a new setup?
• Ability to withstand an attack by terrorists – is there a heightened or lessened risk with this kind of power from people who would do us ill?
• Ability to lower electricity costs for the UK retail consumer – what will be the impact on UK electricity bills for households?
• Ability to lower electricity costs for the UK business consumer – what will be the impact on electricity prices for companies?
• Ability to deliver long-term stable prices – will electricity production prices remain stable and relatively impervious to outside influences and will it help to create a deeper forward electricity market?
• Ability to provide power on a long-term basis – what is the length of the contract? • Ability to last – what is the lifespan of the plant and what are the estimated ongoing
costs?

Economic Policy Centre Why and how it must be done 48
Table 13: Example CSEO Rankings for New, Proposed and Existing Technologies and Electricity Sources
Technology and Electricity Source Bas
eloa
d
Dis
patc
habl
e Po
wer
Switc
h O
ff
How
cle
an
Exte
rnal
fuel
su
pply
sho
cks
Hom
e-gr
own
pow
er
Secu
re p
ower
fr
om a
broa
d
Libe
ral
Dem
ocra
cy
Infr
astr
uctu
re
Inte
grat
ion
Terr
oris
m
Ret
ail P
rices
Com
mer
cial
Pr
ices
Pric
e St
abili
ty
Long
-term
co
ntra
ct
Life
span
and
on
goin
g co
sts
Tota
l:
Large Hydropower 4 4 5 5 5 5 0 5 4 4 5 5 4 4 5 64Tidal Lagooon 5 4 4 5 5 5 0 5 2 4 3 3 5 4 4 58Nuclear 5 4 1 4 5 5 0 5 4 3 4 4 4 4 5 57Wind with storage 4 3 5 5 5 5 0 5 4 5 3 3 5 3 2 57New interconnector - France 5 5 5 5 3 0 4 5 3 3 3 4 3 3 4 55New interconnector - Norway 4 5 5 5 3 0 4 5 3 3 3 4 3 3 4 54Small Hydro 4 3 5 5 5 5 0 5 2 5 3 0 4 3 4 53Landfill Gas 4 3 5 3 5 5 0 5 3 3 4 4 4 3 2 53Small wind with storage 4 3 5 5 5 5 0 5 4 5 1 0 5 3 2 52Tidal Barrage 3 2 4 4 5 5 0 5 2 4 3 3 4 4 4 52Sewage Gas 4 3 5 3 5 5 0 5 3 3 3 3 4 3 2 51CHP 4 3 4 2 5 5 0 5 3 4 3 3 3 3 3 50New interconnector - Iceland 4 3 5 5 3 0 4 5 3 3 2 2 3 3 4 49Onshore wind 1 1 5 5 5 5 0 5 2 5 2 2 4 3 2 47Coal imported 4 4 2 1 4 0 4 3 4 4 4 4 2 3 3 46Wave 3 2 4 5 5 5 0 5 1 5 1 1 4 3 2 46Tidal Stream 3 2 4 5 5 5 0 5 1 5 1 1 4 3 2 46Offshore wind 1 1 5 5 5 5 0 5 2 5 1 1 4 3 2 45Small wind 1 1 5 5 5 5 0 5 2 5 2 0 4 3 2 45Solar PV 1 1 4 5 5 5 0 5 2 5 1 0 5 3 3 45Micro-CHP 4 3 4 3 5 5 0 5 2 4 2 0 3 3 2 45Concentrated Solar Thermal Power - North Africa 3 3 5 5 3 0 3 3 3 3 2 2 3 3 4 45Coal domestic 4 4 2 1 5 0 0 4 4 4 3 3 3 4 3 44
North Sea Gas (Norway, Netherlands) 4 5 5 3 2 0 3 5 4 3 2 2 1 3 2 44LNG - Trinidad & Tobago 4 5 5 3 1 0 2 5 4 3 3 3 1 2 2 43Coal with CCS fitted (imported) 4 4 2 4 4 3 4 3 1 3 1 1 1 2 3 40LNG - Algeria 4 5 5 3 1 0 2 2 4 3 3 3 1 2 2 40LNG - Egypt 4 5 5 3 1 0 2 2 4 3 3 3 1 2 2 40LNG - Qatar 4 5 5 3 1 0 2 2 4 3 3 3 1 2 2 40Coal with CCS fitted (domestic) 4 4 2 4 4 5 0 4 1 3 1 1 1 2 3 39Russian Gas 4 5 5 3 1 0 0 1 4 3 3 3 1 2 2 37

Economic Policy Centre SECURING OUR ENERGY FUTURE 49
The function of this points system would be to discover quickly in a fair and open way what systems would best serve the UK going forward and put pressure on those with a low score to improve their ranking. It thus becomes incumbent upon the losers to strive to achieve higher ratings for the provision of clean and secure electricity. The points awarded here can easily be quibbled with, but not very much and over time, they will change and new technologies will emerge whilst others disappear. It may well be for example that many gigawatts of intermittent wind power become much easier to load-balance and would contribute more to the UK, with greater stabilization with the continent. There will also be a need to add in new filters as the system evolves over time. However these filters must be subservient to the ultimate merit order of energy policy; security, affordability and being environmentally clean. What’s interesting is how the current energy policy investment framework shows barely any favour to the winners of this table; large hydropower, tidal lagoons, nuclear, wind with storage and new interconnectors. And what’s disturbing is how those at the bottom of the table, gas and carbon capture and storage, seem all set, to capture a large share of the UK’s electricity market. UK energy policy really is back to front. However, what for the first time will be created is a points system that embraces evolutionary flexibility in a long-term delivery framework. It would acknowledge the rapidly changing world we live in and factor in technological changes that have yet to happen. Some of these high tech, even sci-fi and strategic changes currently at the fringes that might happen are listed below; Possible Changes in Prospect Solar grid parity. Whilst grid-connected solar pv would be a clear loser, who’s to say that in 25 years time, the price might have fallen so much that all new roofs are automatically installed with solar capabilities and grid and distribution network technology has come on so far that load-balancing and storing large quantities of it are not a problem? India cracks and develops the thorium nuclear fuel cycle. Natural thorium contains no fissile material that can be used in weapons, does not create hazardous waste, would never create a meltdown and it is several times more abundant than uranium. As an alternative feedstock to a nuclear plant, this would be popular for all sorts of reasons with all sorts of people. The main stumbling block until now has been how to provide thorium fuel with enough neutrons to keep the reaction going, and do so in an efficient and economical way. Nano-engineered super strong and lightweight wind turbine blades, which make turbines of several hundred megawatts capacity a possibility. Wind turbine blades, like aircraft propellers, have moved from wood to metal to carbon fibre. Much stronger and lighter blades are still a possibility and could be much longer-lasting. Magnetic levitation wind power generator. The repelling properties of magnets lift the vertically aligned turbine blades off the ground making it frictionless, reducing maintenance costs by up to 50% and increasing the ability to work at previously untappable lower windspeeds. China already has one and they are still working on it. Carbon dioxide becomes a valuable commodity, for some unspecified feedstock use, which actually resulted in reducing its content in the atmosphere, rather than as an environmental negative. It already has a carbon-neutral value to the fizzy drinks and nightclub industries as well as an airborne fertiliser for greenhouses to increase plant yields. Some speculate that it could be the feedstock for the growth of giant algae ponds which is then extracted and converted into biodiesel fuel for vehicles, which although still carbon neutral, would be far better than 1st generation biofuels. Russia becomes a friendly liberal democracy. It sells off its hydrocarbon assets to private investors and develops cheap reliable nuclear power plants for sale to the UK.

Economic Policy Centre Why and how it must be done 50
Iran has a reasonably bloodless revolution and becomes a quite liberal elective democracy. This has to be at least a possibility in the next 15 years and would open up a massive source of gas supplies to the world. Plugged in electric cars become a major source of power to the electricity grid. Today the UK has 33 million vehicles on the road. By 2030, if 1 million of them with an average engine size of 65 kw were plugged into the grid and actually power it when they are not being used, this would have a huge impact on the electricity market. The bottom line is that a lot could happen in the next 50 years, both good and bad. We merely need a system like this one that can embrace both those possibilities. The New Financing Arrangements of the CSEO Annually assessing the pros and cons of the different technologies and their relative abilities to provide and clean and secure electricity to the UK would be a major step forward. Of equal importance is to develop a financial framework that can deliver the long-term incentives for high capital expenditure projects with low but steady returns. The Clean and Secure Energy Obligation buyout price will be set much lower than the RO, at £12 per megawatt hour. However it will be guaranteed until 2060. All the renewables, interconnectors, nuclear and clean coal technologies will be included. To be excluded from the CSEO are gas and coal. Their share of the UK’s electricity market will consequently decline to zero by 2060. The other incentive, which will help reduce the Weighted Average Cost of Capital, will be the government offering a long-term financial indemnity for the decommissioning of all new power plants built under the scheme, which may reduce the cost of the debt by as much as 50 basis points.

Economic Policy Centre SECURING OUR ENERGY FUTURE 51
Chapter 6: Policy Recommendations Policy Focus
• Freeze RO going forward for existing Power Purchase Agreements and reduce the buyout price to £12 per megawatt hour henceforth
• Rename the RO the Clean and Secure Energy Obligation and include large impact, low carbon and secure technologies with a target of 100% clean and secure energy supply by 2060
• Set up Clean and Secure Energy Committee to be staffed by the Chancellor, the Secretary of State for Defence and the relevant Secretary of State for Energy to meet and take updated submissions once a year
Bureaucratic Streamlining
• Abolish the Climate Change Committee • Abolish the Energy Savings Trust • Abolish the Carbon Trust • Abolish the Climate Change Projects Office • Abolish the Office of Climate Change • Abolish REGENSW – the Southwest Renewables Energy Agency • Abolish Renewables East • Abolish Renew North • Suggest to the Welsh Assembly that they do not need to fund The Wales Centre of
Excellence for Anaerobic Digestion Surplus Energy Policy Disposal
• Wind up as quickly as possible, all R&D Programmes; the Marine Renewable Deployment Fund, the BERR Technology Programme, the Carbon Trust Applied Research Programme, the Carbon Trust Marine Energy Challenge, the Scottish Administration’s Wave and Tidal Energy Support, Supergen, the Scottish Administration’s Marine Supply Obligation, UK Environmental Transformation Fund, Offshore Wind Technology Capital Grants Scheme, the Low Carbon Buildings Programme and Fusion Research.
• Abolish the Climate Change Levy • Abolish the Carbon Capture Levy
Strategic
• Keep coal-fired stations open beyond their 2015 deadline until new clean and secure plants come onstream
• Set a limit - to be reviewed annually - by the CSEO Committee on how much intermittent renewable power can be safely integrated into the National Grid
• An annual decision to be taken annually by the CSEO Committee on what the spare capacity margin should be across the system
• Keep the Infrastructure Planning Commission and its powers • Postpone the rollout of Smart Meters until 2020. Spending £9bn over 10 years and
possibly much more for dubious gains is not acceptable and on the face of it is a dumb investment. Cheaper off the shelf solutions may or may not become available for Smart Grids and the Distributed Micro Generation technologies which go with them. Far better to wait and see.
• Going forward in relations with the European Union, repatriate energy policy powers so that they can be redirected back towards the pursuit of national interest

Economic Policy Centre Why and how it must be done 52
Conclusion Britain can make a choice in energy policy or it can continue to drift and confront disaster in the near future. For too long, received opinion has fretted about the UK’s carbon footprint without giving a moment’s thought to its energy security footprint. This is no longer acceptable. These policy recommendations will not be popular to implement. But we have now reached the stage, made more dangerous by a fiscal crisis, where the choices that must be made are not between good and bad, but between bad and much worse. It’s high time to face up to the UK’s energy predicament as it is, not as we wish it were. Make no mistake about it: the longer we leave it, the harder it will get.

Economic Policy Centre SECURING OUR ENERGY FUTURE 53
Appendix 1: UK Energy in Numbers All too often, in energy matters, we are assuaged or alarmed with comments or figures by our politicians and media pundits. And far too often, after careful analysis, these comments don’t actually stand up to factual analysis. This appendix is aimed at giving the reader a strong background of facts about Britain’s energy conundrum to serve as a riposte to those who are sparing with the facts. Table 14: UK Household Electricity Prices – relative to other European Nations74 Country Household Price in EUR cents per kilowatt hour
Demark 26.35
Germany 21.48
Belgium 19.72
Cyprus 17.80
Austria 17.79
Ireland 17.69
Netherlands 17.30
EA15 (EUR Currency Block) 17.11
Sweden 16.98
Norway 16.39
EU27 (27 EU Member States) 16.33
Luxembourg 15.91
Hungary 15.48
Portugal 14.80
United Kingdom 14.58
Slovakia 14.21
Spain 13.66
Czech Republic 12.74
Poland 12.59
Finland 12.23
France 12.13
Slovenia 11.47
Romania 10.61
Greece 10.47
Malta 9.93
Croatia 9.90
Lithuania 8.60
Latvia 8.42
Estonia 8.14
Bulgaria 7.11
74 See Eurostat figures: Electricity prices for second semester 2008 (December 31st) – based on consumption of between 2500-5000 kilowatt hours per year. Figures for Italy were not available. http://epp.eurostat.ec.europa.eu/portal/page?_pageid=1073,46587259&_dad=portal&_schema=PORTAL&p_product_code=KS-QA-08-045
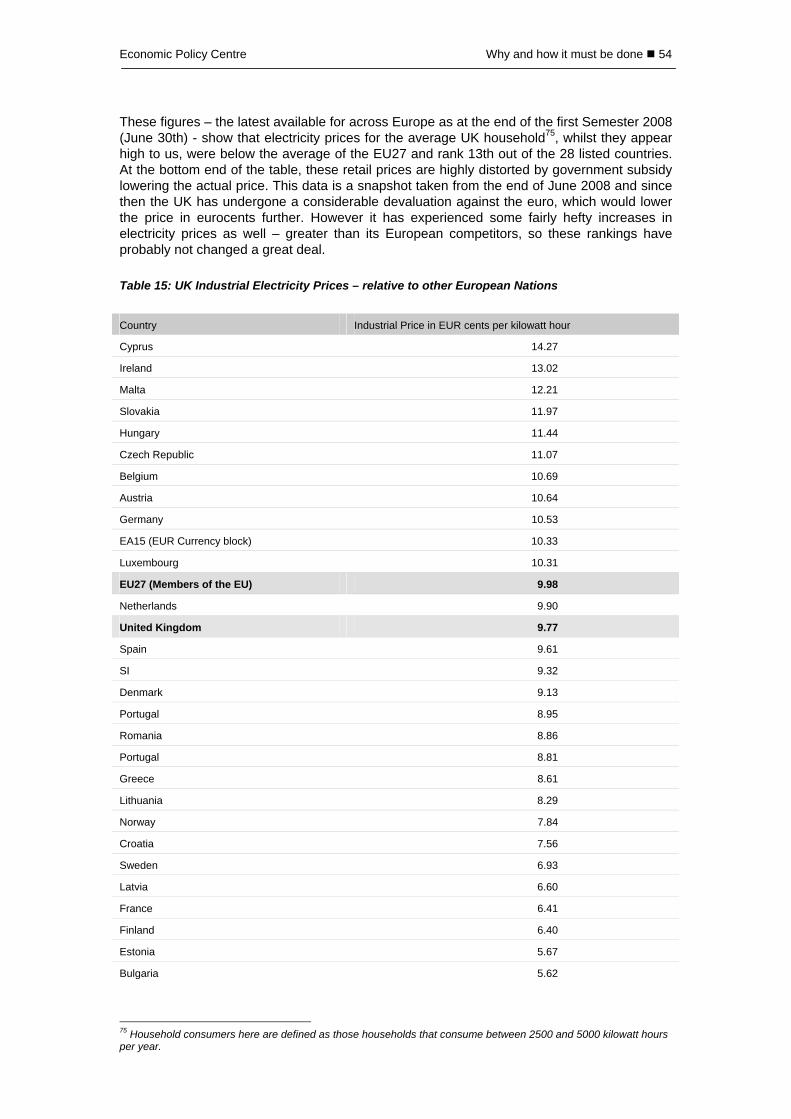
Economic Policy Centre Why and how it must be done 54
These figures – the latest available for across Europe as at the end of the first Semester 2008 (June 30th) - show that electricity prices for the average UK household75, whilst they appear high to us, were below the average of the EU27 and rank 13th out of the 28 listed countries. At the bottom end of the table, these retail prices are highly distorted by government subsidy lowering the actual price. This data is a snapshot taken from the end of June 2008 and since then the UK has undergone a considerable devaluation against the euro, which would lower the price in eurocents further. However it has experienced some fairly hefty increases in electricity prices as well – greater than its European competitors, so these rankings have probably not changed a great deal. Table 15: UK Industrial Electricity Prices – relative to other European Nations Country Industrial Price in EUR cents per kilowatt hour
Cyprus 14.27
Ireland 13.02
Malta 12.21
Slovakia 11.97
Hungary 11.44
Czech Republic 11.07
Belgium 10.69
Austria 10.64
Germany 10.53
EA15 (EUR Currency block) 10.33
Luxembourg 10.31
EU27 (Members of the EU) 9.98
Netherlands 9.90
United Kingdom 9.77
Spain 9.61
SI 9.32
Denmark 9.13
Portugal 8.95
Romania 8.86
Portugal 8.81
Greece 8.61
Lithuania 8.29
Norway 7.84
Croatia 7.56
Sweden 6.93
Latvia 6.60
France 6.41
Finland 6.40
Estonia 5.67
Bulgaria 5.62
75 Household consumers here are defined as those households that consume between 2500 and 5000 kilowatt hours per year.

Economic Policy Centre SECURING OUR ENERGY FUTURE 55
These figures show once again that UK industrial consumers76 of electricity are paying prices right in the middle range of European nations. They do not show the very high cost for UK industrial consumers of going to the fairly illiquid spot electricity market – which can at times cost several times as much. Of note is the UK disparity between consumer and industrial prices, which is also about average. The gap is largest in Denmark (17.22), followed by Germany (10.95), Sweden (10.05), Belgium (9.03) and Norway (8.55). Table 16: UK Total Annual Electricity Demand in Terawatt Hours: 1970 – 200777 1970 192.41
1975 212.78
1980 224.25
1985 234.09
1990 274.43
1995 295.85
2000 330.59
2005 347.15
2006 345.33
2007 342.55
What these figures demonstrate is that in spite of many efforts to reduce electricity demand in the last 40 years, they have largely come to naught as demand has grown by 80%, almost exactly at half the rate of annual growth in the economy of 2.3% (1970-2005). However, the curiosity is that for the first time, in the last 3 recorded years we have seen falling electricity demand and when the figure comes in for 2008, this will almost certainly show a continued drop as the recession and higher electricity prices take hold. For calendar 2009, National Grid is forecasting a drop in peak electricity demand of 600-1000 megawatts78. When the recession is over, one can reasonably expect electricity consumption to grow at 1% a year again as the demands of a bigger population and the shift to electricity for heating and transport continues, combined with the continuing growth of electrical applications. Table 17: UK Electricity Consumption per Capita relative to the Rest of the World (2005)79 Ranking Country Annual kilowatt hour consumption
1 Iceland 28,057
2 Norway 25,145
3 Canada 17,307
4 Qatar 16,454
5 Finland 16,123
6 Luxembourg 15,961
7 Sweden 15,430
8 Kuwait 15,348
9 United States 13,640
10 United Arab Emirates 12,412
11 Australia 11,439
76 Industrial consumers here are defined as those who consume annually between 500 and 2000 megawatt hours. 77 See Digest of UK Energy Statistics, DUKES http://www.berr.gov.uk/whatwedo/energy/statistics/source/electricity/page18527.html 78 See http://www.guardian.co.uk/business/2009/jan/24/recession-britain Lights go out across Britain as recession hits home 79 Figures from the World Bank – Key Indicators as at 2005

Economic Policy Centre Why and how it must be done 56
12 Bahrain 11,366
13 New Zealand 9,733
14 Taiwan / Chinese Taipei 9,550
15 Belgium 8,515
16 Singapore 8,358
17 Switzerland 8,235
18 Japan 8,233
19 Austria 7,889
20 Korea, South 7,779
21 France 7,707
22 Brunei 7,495
23 Germany 7,111
24 Netherlands 6,989
25 Slovenia 6,916
26 Saudi Arabia 6,813
27 Israel 6,759
28 Denmark 6,659
29 Czech Republic 6,343
30 United Kingdom 6,254
By international standards and given the UK’s relatively high standard of living, the UK is a very low consumer of electricity, with a ranking of 30. This reflects not our energy efficiency, but our mild climate, close proximity for most of the population between work and home, smaller homes, smaller family units and this country’s generally high urban density. Table 18: UK Energy Efficiency relative to the Rest of the World80 Ranking Country Dollars of output per Barrel of Oil Equivalent
1 Hong Kong 1,554
2 Switzerland 1,292
3 Japan 1,272
4 Denmark 1,179
5 Ireland 1,097
6 Uruguay 1,014
7 United Kingdom 940
8 Israel 881
9 Italy 827
10 Austria 819
Contrary to received opinion, the UK is a highly energy efficient country with a world ranking of 7.
80 See Digest of Energy Statistics 2008 – as published by the ERC – 2005 data

Economic Policy Centre SECURING OUR ENERGY FUTURE 57
Table 19: CO2 Annual Emissions per Capita81 Ranking Country CO2/Population (T CO2/capita)
1 Qatar 44.73
2 Kuwait 29.44
3 Bahrain 25.19
4 Luxembourg 24.83
5 United Arab Emirates 24.35
6 Netherlands Antilles 20.98
7 United States 19.61
8 Australia 18.40
9 Trinidad and Tobago 17.84
10 Canada 17.00
11 Saudi Arabia 13.83
12 Brunei 13.62
13 Estonia 11.85
14 Czech Republic 11.54
15 Taiwan / Chinese Taipei 11.41
16 Netherlands 11.21
17 Russia 10.79
18 Belgium 10.67
19 Finland 10.57
20 Ireland 10.55
21 Oman 10.51
22 Kazakhstan 10.22
23 Singapore 9.93
24 Germany 9.86
25 Japan 9.50
26 Austria 9.37
27 Korea, South 9.30
28 Cyprus 9.29
29 United Kingdom 8.80
What this table shows is that by international standards, UK citizens, in spite of their wealth, are relatively low emitters of carbon dioxide, with a world ranking of 29. Table 20: How Carbon Efficient is the UK?82 Ranking Country 2005 GDP (in Dollars) Annual CO2
emissions $ of output per ton of CO2
1 Switzerland 259,570,000,000 44,980,000 5,770.79
2 Sweden 271,840,000,000 50,950,000 5,335.43
3 Hong Kong 207,930,000,000 40,730,000 5,105.08
4 Norway 187,790,000,000 37,000,000 5,075.41
81 Figures from IEA 2005 data 82 Based on IEA 2005 figures
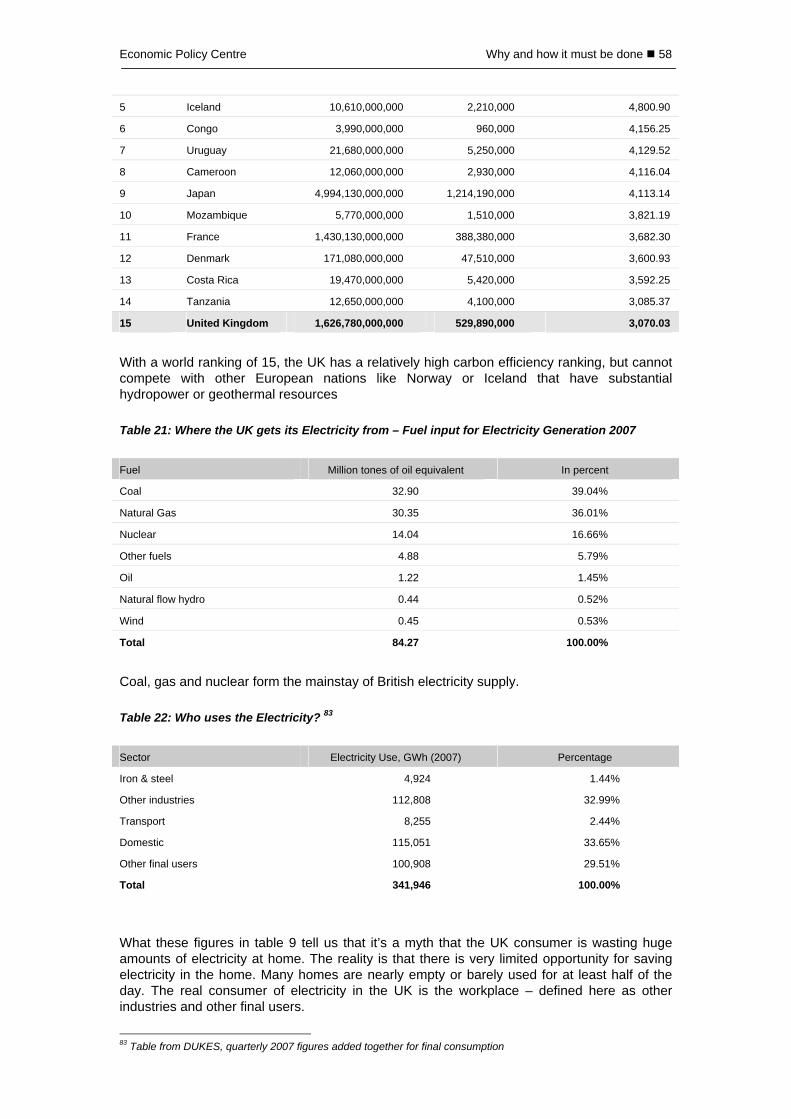
Economic Policy Centre Why and how it must be done 58
5 Iceland 10,610,000,000 2,210,000 4,800.90
6 Congo 3,990,000,000 960,000 4,156.25
7 Uruguay 21,680,000,000 5,250,000 4,129.52
8 Cameroon 12,060,000,000 2,930,000 4,116.04
9 Japan 4,994,130,000,000 1,214,190,000 4,113.14
10 Mozambique 5,770,000,000 1,510,000 3,821.19
11 France 1,430,130,000,000 388,380,000 3,682.30
12 Denmark 171,080,000,000 47,510,000 3,600.93
13 Costa Rica 19,470,000,000 5,420,000 3,592.25
14 Tanzania 12,650,000,000 4,100,000 3,085.37
15 United Kingdom 1,626,780,000,000 529,890,000 3,070.03
With a world ranking of 15, the UK has a relatively high carbon efficiency ranking, but cannot compete with other European nations like Norway or Iceland that have substantial hydropower or geothermal resources Table 21: Where the UK gets its Electricity from – Fuel input for Electricity Generation 2007 Fuel Million tones of oil equivalent In percent
Coal 32.90 39.04%
Natural Gas 30.35 36.01%
Nuclear 14.04 16.66%
Other fuels 4.88 5.79%
Oil 1.22 1.45%
Natural flow hydro 0.44 0.52%
Wind 0.45 0.53%
Total 84.27 100.00%
Coal, gas and nuclear form the mainstay of British electricity supply. Table 22: Who uses the Electricity? 83 Sector Electricity Use, GWh (2007) Percentage
Iron & steel 4,924 1.44%
Other industries 112,808 32.99%
Transport 8,255 2.44%
Domestic 115,051 33.65%
Other final users 100,908 29.51%
Total 341,946 100.00%
What these figures in table 9 tell us that it’s a myth that the UK consumer is wasting huge amounts of electricity at home. The reality is that there is very limited opportunity for saving electricity in the home. Many homes are nearly empty or barely used for at least half of the day. The real consumer of electricity in the UK is the workplace – defined here as other industries and other final users.
83 Table from DUKES, quarterly 2007 figures added together for final consumption

Economic Policy Centre SECURING OUR ENERGY FUTURE 59
So the big picture is that the UK’s industrial and retail consumers pay close to European average prices for electricity, the long-term trend of growing electricity demand is well-established, the UK is by international standards, a very low consumer of electricity, it is consumed mostly at work, the UK is highly energy efficient relative to the rest of the world and a relatively low and efficient producer of carbon dioxide. All this while coal and natural gas provide 75% of our electricity needs, nuclear 16% and the rest, not very much at all.