economic progress as cancer risk factor - the max planck institute for
TRANSCRIPT

Max-Planck-Institut für demografische ForschungMax Planck Institute for Demographic ResearchKonrad-Zuse-Strasse 1 · D-18057 Rostock · GERMANYTel +49 (0) 3 81 20 81 - 0; Fax +49 (0) 3 81 20 81 - 202; http://www.demogr.mpg.de
© Copyright is held by the authors.
Working papers of the Max Planck Institute for Demographic Research receive only limited review.Views or opinions expressed in working papers are attributable to the authors and do not necessarilyreflect those of the Institute.
Economic progress as cancer risk factorI. Puzzling facts of cancer epidemiology
MPIDR WORKING PAPER WP 2005-021AUGUST 2005
Svetlana V. Ukraintseva ([email protected])Anatoly I. Yashin ([email protected])

1
Economic Progress as Cancer Risk Factor I. Puzzling Facts of Cancer Epidemiology
*Svetlana V. Ukraintseva1,2 and Anatoly I. Yashin1,2
1Duke University, Center for Demographic Studies, Durham, USA
2Max Planck Institute for Demographic Research, Rostock, Germany
E-mails: [email protected]; [email protected]
*Corresponding author Tel: +1 (919) 668-2712; E-mail: [email protected] Abstract The increase in cancer burden in developed countries refers to three major causes: population aging, an increase in the cancer incidence rate, and an improvement in the survival of cancer patients. Among these reasons, only the increase in the cancer incidence rate is a negative factor that could be really managed to decrease cancer burden; it, thus, urgently needs explanation and action to develop adequate cancer prophylactics. We have conducted a comparative analysis of cancer incidence and mortality rates in different countries of the world for different time periods. The typical age-trajectory of overall cancer incidence rate (for both sexes and all cancers combined) is characterized by a peak in early childhood, low risk in youth, increasing risk afterwards, and a leveling-out or even a decline in cancer risk for the oldest old. Patterns of age-specific cancer mortality resemble the incidence rate patterns; however, mortality is commonly lower and its curve shifts towards higher age. This shift could be due to a time lag between the age of cancer diagnosis and death from the disease. Analysis of time and place differences in the cancer incidence rate revealed that the overall cancer risk is higher in more developed regions as compared with less developed ones, and that until recently it increased over time along with economic progress. The proportions of separate cancer sites within the overall cancer morbidity differ between more and less developed regions, and their change over time is also linked to economic development. Surprisingly, cancer incidence and mortality rates exhibit different time trends. This divergence is most probably related to the substantial improvement in the survival of cancer patients observed in the last 50 years in developed countries. This improved survival has decreased cancer mortality but not its incidence, which has increased. This suggests that in developed countries cancer treatment has seen much more substantial progress than cancer prophylaxis, which has hardly seen positive results for the majority of human cancers (with a few exceptions). In our second paper we discuss possible explanations of the link between economic progress and the increase in the overall cancer risk. Key words: cancer incidence rate, age-patterns, time trends, place differences, economic progress
__________

2
Table of contents 1. Introduction 2. Data Source and Basic Definitions 3. Common Features of Cancer Rate Patterns 3.1 Age-specific cancer incidence rates 3.2 Age-specific cancer mortality 4. Higher Overall Cancer Risk in More Developed Countries 4.1 Standardized incidence and mortality rates 4.2 Age-specific cancer risk 5. Cancers That Are More Common In Less Developed Regions 6. Overall Cancer Risk Increased Along With Economic Progress 6.1 Increasing overall cancer incidence rate in the second half of the 20th century 6.2 Decreasing incidence rates for separate cancer sites 6.3 Declining overall cancer risk in the 1990s in some developed countries 7. Why Does Cancer Mortality Decline, While The Incidence Rate Continues To Increase? 7.1 The lag between cancer incidence and mortality increases 7.2 Decline in cancer mortality: competition between incidence and survival 8. Concluding Remarks 9 Acknowledgements References
___________________
1 Introduction
The term "cancer" refers to a group of diseases characterized by the uncontrolled growth and
spread of abnormal cells. The initiation and promotion of cancer are influenced both by external
factors (e.g., tobacco, radiation, some chemical and infectious agents) and internal ones (e.g.,
inherited mutations, the immune status, and aging). Despite substantial investments in cancer
research (e.g, the 2004 budget of the USA National Cancer Institute (NCI) provides about six
billion US dollars), and significant progress in the understanding of cancer biology, the exact
causes of cancer remain a mystery in many cases, and the global cancer burden is increasing
(Parkin et al., 2001). Worldwide, more than 10,000,000 people are diagnosed with cancer and
more than 6,000,000 die of the disease every year. These figures emphasize the importance of
understanding the factors responsible for time trends and place differences in cancer incidence,
mortality, and survival rates worldwide.
The cancer incidence rate. The overall cancer risk dramatically increased in most
countries of the world during the second half of the 20th century (IARC 1965-2003). In the
United States, however, the overall cancer incidence rates dropped an average of 0.5 percent per
year from 1991 to 2001 (Jemal et al. 2004a) owing to modest progress in cancer prevention as
well as other developments, such as changes in the population structure over time. Still, about

3
1,368,030 new cancer cases are expected for the USA in 2004 (Jemal et al. 2004b); this figure
excludes more than one million skin cancers. The majority of all cancers (about 80 percent) are
diagnosed in people aged 55 and above (IARC 1965-2003). The populations of developed
countries “age” over time (i.e., the proportion of elderly increases). Age-specific cancer rates,
however, do not depend on population aging, and the reasons for higher cancer risks in elderly
individuals from the more developed regions (compared to the less developed ones) remain
largely unexplained.
Cancer mortality. The death toll associated with cancer is high; cancer is the second most
frequent cause of death in the United States. The American Cancer Society (ACS) predicts
563,700 deaths for 2004 (Jemal et al. 2004b). The National Institutes of Health (NIH) estimate
indirect mortality costs alone at $95.2 billion (the costs of lost productivity due to premature
death). Three major factors contribute to cancer mortality: population aging, the cancer incidence
rate, and the survival rates of cancer patients. The latter has been steadily improving, and is
probably a major reason for the recent decline in cancer mortality. In the USA, death rates
decreased (by 1.1 percent per year) for all cancers combined from 1993 to 2001 (Jemal et al.
2004a)
Survival of cancer patients. In the past 50 years, we have seen a remarkable increase in
the survival of cancer patients. For instance, five-year survival in the USA improved from an
average of 35 percent over the period 1950-54 to 63 percent over the period 1989-97 (Ries et al.
2001). This increase has been due mainly to the rapid spread of new anti-cancer treatments, such
as advanced chemotherapy. It is highly effective against several prevalent cancer sites (e.g.,
melanoma of the skin, prostate, breast, bladder, corpus uteri, and children’s leukemia). The five-
year survival for these sites has been increasing during the last 50 years, reaching 80-97 percent
(Ries et al. 2001). This positive achievement has negatively affected the global cancer burden,
however: The number of individuals with cancer has drastically risen in the developed countries.
At the same time, modern chemotherapy has failed to substantially improve survival from some
other cancers (e.g., the pancreas, liver, lung, esophagus, stomach, and myeloma). It varies from 4
to 28 percent, depending on the site and country (Berrino et al. 1995, Ries et al. 2001).
Unfortunately, some of the latter cancers are prevalent (e.g., of the lung and stomach) or rapidly
increasing in prevalence (e.g., of the myeloma and liver), which means that the coming years
may not see a rapid fall in cancer mortality. Together with cancer incidence and population
aging, survival from cancer is a key factor that defines the values for cancer mortality and for the
cancer burden in modern human populations.

4
The cancer burden. A major outcome of the increasing cancer incidence, improved
survival of cancer patients, and population aging is the increasing global burden of cancer. It is
manifest in the total number of individuals with cancer within a population (cancer prevalence),
as well as associated costs. Currently, there are over 22,400,000 cancer patients worldwide. The
cancer burden is generally higher in the more developed countries despite a higher quality of
medical help there. The NCI estimated that almost nine million Americans with a history of
cancer were alive in 1999. The NIH estimated the overall cost for cancer in the year 2002 at
$171.6 billion, including $60.9 billion for direct medical costs (total of all health expenditures),
and $15.5 billion for indirect morbidity costs (lost productivity due to illness). The total number
of cancer cases is expected to double by 2050 if current incidence rates remain stable, solely due
to population aging (Edwards et al. 2002). In case of continued improvement in cancer patient
survival (which is highly probable), the increase in the cancer burden will be even more
pronounced.
Pivotal role of understanding trends in cancer incidence rates. As stated above, the
increase in the global cancer burden can be attributed to three major factors: (1) an improvement
in the survival of cancer patients, (2) an increase in the overall cancer risk, and (3) population
aging. What steps can modern society take to meet these challenges?
Population aging is causally linked to fertility decline during the reproductive period and
improvements in old age survival. The latter is, in fact, a positive social and medical
achievement and it is thus unlikely that society will simply aim at reducing the number of old
people in order to reduce the cancer burden. The development of new effective anti-aging
interventions that diminish some of the negative effects of aging is a more realistic approach.
Improvement in the survival of cancer patients is another positive medical achievement
with a negative effect in that it elevates the cancer burden. It is very likely that this effect will
increase over time, due to promising new anti-cancer interventions. Again, it is unlikely that
human society will favor increasing cancer fatality in order to reduce the cancer burden.
Thus, there is only one factor that is genuinely negative – increased cancer risks – and it
is this factor that urgently needs attention to reduce the cancer burden. It is very important to
further our understanding of the causes underlying the increases in cancer incidence rates over
time as well as the higher cancer risks in the more developed regions.
Despite substantial progress in uncovering the biological mechanisms of cancer, the
major factors responsible for determining trends in the cancer incidence rate remain unknown.
Does an increase in carcinogenic load elevate cancer risks along with economic progress? Or is

5
this elevated risk just an effect of better diagnostics in the more developed countries, not caused
by new cancer cases but simply not recognized before? Another possibility is that people in the
more developed countries have higher vulnerability to cancer due to e.g., a relaxation in
environmental selection.
In this paper (I. Facts), we analyze age-patterns, time trends, and place differences in
cancer incidence and mortality rates in different countries around the world, focusing on an
intriguing association between the overall cancer risk and economic development. We show that
this association is widely observed phenomenon across human populations. In next paper (II.
Explanations), we discuss factors of economic progress that could be largely responsible for
higher cancer rates in more developed countries and pay special attention to the factors that
elevate cancer risk increasing individual vulnerability to cancer rather than increasing
carcinogenic load in populations.
2 Data Source and Definitions
Source of data. For this analysis, we used data extracted from cancer registers published by the
International Agency for Research on Cancer (IARC), part of the World Health Organization, in
the book series “Cancer Incidence in Five Continents” (IARC 1965-1997), “Trends in Cancer
Incidence and Mortality” (Coleman et al. 1993), the GLOBOCAN data bases (1998, 2001), and
the EUCAN data base (1999), which altogether cover over 200 populations worldwide for the
years 1957-2000. In addition, other sources were used, including the WHO Health for all
Database (2000), the US National Cancer Institute (NCI) publications of SEER (The
Surveillance, Epidemiology, and End Results) Program statistics on cancer incidence and
survival, data from the Russian National Research Centre for Oncology, and other relevant
materials that cover cancer history during recent time periods in different countries.
Basic definitions. The age-specific cancer incidence rate is defined as the number of new
cancer cases (registered for the first time) per 100,000 people in a population of a given age in a
particular year or time interval. Age-specific cancer mortality rate stands for the number of
cancer deaths per 100,000 people in a population of a given age in a particular year or time
interval. Five-year survival from cancer denotes the proportion of cancer patients who survived
five years after diagnosis. Cancer prevalence is the proportion of individuals with diagnosed
cancer (no matter when the diagnosis was made) relative to the general population of a given
age. The prevalence characterizes the cancer burden.

6
3 Common Features of Cancer Rate Patterns
3.1 Age-Specific Cancer Incidence Rates
Various age-patterns of the cancer incidence rate. There is a prevalent belief that the shape of
the incidence rate pattern is an invariant characteristic of a particular cancer site. For instance,
based on data from the USA population in the previous century, Rainsford et al. (1985) and
Volpe and Dix (1986) held that male lung cancer exhibits an exponential rate increase until very
old ages, regardless of time and place. They believed that the exponential nature of the lung
cancer age-pattern is independent of environmental carcinogenicity and best attributed to some
aspect of the intrinsic aging process. This view implies that such a shape is an inherent trait of
the lung cancer pattern. Based on this prevalent view, we initially believed that specific traits in
cancer incidence rate patterns (e.g., a peak or a plateau) depend in the main on the cancer site.
However, a comparison of incidence rate curves showed that their shape depends not only on the
cancer site and sex, but also on the timing, place, and the current prevalence of a cancer.
Fig.1-3 are about here
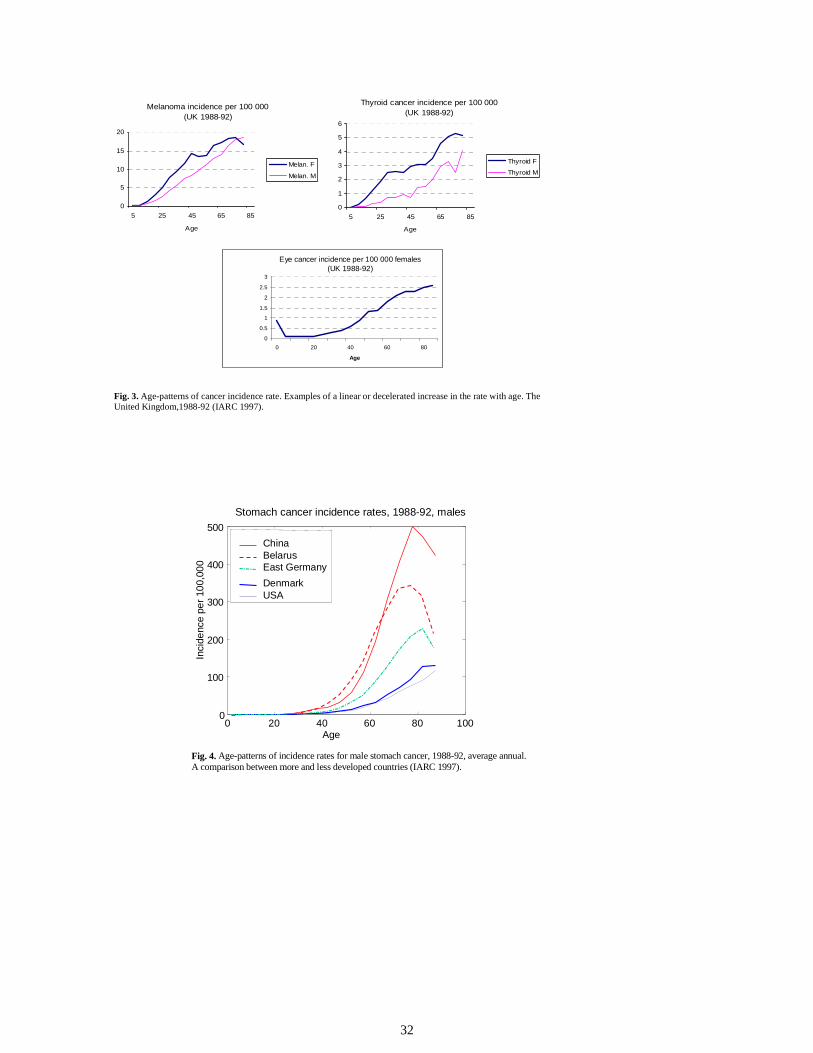
Figures 1-3 show three typical age-patterns for the cancer incidence rate: (1) an
accelerated increase in the rate until very old age (85 and above), (2) a wave-like shape with a
peak at middle-old ages (about 70), and (3) a linear or decelerated increase in the rate with a
tendency to level off at old ages. However, these patterns are quite “plastic” and do not depend
exclusively on a cancer site. Figures 4 and 5 show the age-specific rates for stomach and ovarian
cancers. We see that the patterns for these cancers differ among countries. Sometimes, the
incidence rate manifests a peak at old ages, and sometimes it does not.
Fig.4 and 5 are about here
Figure 6 shows examples of time and place differences in the incidence rate patterns for
lung and breast cancers, which represent today’s most prevalent cancer sites. In the past, male
lung cancer was less common in the USA and Japan. Its age-pattern in 1960-62 had a wave-like
shape, with a peak at about 70-75 years of age. In 1980-92, the peak shifted to older ages.
Female lung cancer did not exhibit a peak in the 1960s at all, but later began to resemble the
male pattern.
Fig.6 is about here

7
In the UK, there is currently no peak in the male lung cancer curve (Figure1 above),
although a peak was evident during the 1930s and 40s – at the age of approx. 65 (Doll 1971).
Breast cancer is less common in Russia (Moscow) than in the UK. It was also less prevalent in
the Russia in the past than nowadays. The incidence rate curve for this cancer peaked in Russia
in 1987, but not in the UK. In 1967 the peak shifted to younger ages. It can be said that the high
incidence cancer sites of today (e.g., male lung, prostate, and colon) exhibit an age-related
accelerated increase in the incidence rate until very old ages more often than do the sites with a
low incidence (e.g., thyroid and eye cancers), while the latter sites more often exhibit a leveling
off in the rate with age. The differences in the shape of the incidence rate pattern for the same
cancer site may reflect time and place differences in carcinogenic exposures.
Typical age-pattern of the overall cancer risk. Despite obvious differences, cancer rate
patterns do have common features, which can be seen most clearly in the age-patterns of the
overall cancer risk (i.e., for all sites combined) (Figure 7).
Fig. 7 is about here
These features include:
(1) a peak in early childhood,
(2) the lowest rate in youth,
(3) an increase in the rate, starting in the reproductive period and more pronounced since
its end, and
(4) deceleration or decline in cancer risk at old ages (75 and over).
These features are recurrent over time and place (IARC 1965-97; see also the figures in Sections
4 and 6 below), and can be drawn not only from period data, but also cohort data (Figure 8).
Fig. 8 is about here
Animal experiments revealed similar features for cancer rate patterns in rodent species;
in particular, an intriguing decline in cancer risks at old ages (Pompei et al. 2001). The latter is a
very significant finding because many cancer researchers are not aware of the reality of such a
decline in humans. They believe that it is spurious due to e.g., an underestimation of new cancer
cases at old ages. However, a decline such as this in laboratory animals cannot be due to a

8
diagnostic bias, which in turn suggests that the decline in humans is also not artificial. Studies of
random autopsies of older individuals also confirm diminishing cancer risks in advanced years
(Kuramoto et al. 1993; Stanta et al. 1997). Several explanations for this phenomenon have been
suggested. Firstly, differential selection that favors the survival of individuals without cancer
(Vaupel and Yashin 1988). The possibility that older subjects are no longer exposed to certain
prevalent carcinogens (e.g., the proportion of smoking people declines in advanced years) could
also contribute to such a decline. Finally, some ambivalent effects of individual aging contribute
to the deceleration in cancer rates at old ages (Ukraintseva and Yashin 2001, 2003). We discuss
these and other possible explanations for the typical features of the cancer incidence rate patterns
in Chapter 1.2.
3.2 Age-Specific Cancer Mortality
The overall cancer mortality rate exhibits a peak at oldest old ages (90 and over) and then
declines. This peak is lower than the respective peak in the incidence rate, and shifts towards
older ages (Figure 9).
Fig. 9 is about here
Such a shift is likely to be due to a time lag between the age at the clinical manifestation
of cancer and death from the disease. The decline in overall cancer mortality after age 90 may
have several reasons. First, cancer mortality in any particular year may reflect the cancer
incidence rate observed in an earlier year. All explanations on the decline of the cancer incidence
rate at old ages then are also applicable to the decline in cancer mortality at oldest old ages.
A second reason may be competing causes of death. Some data indicate that the share of
deaths from cancer diminishes with advanced age to the benefit of deaths from acute
pathological conditions. Bordin and co-authors (1999) reviewed the complete clinical and
autopsy records of 114 patients aged 97-106 who died in Trieste, Italy; the patients represented
99 percent of all extreme-aged deaths in a particular hospital and 70 percent in the area. The
control group included 151 younger patients (65-74) who died during the same period in the
same hospital. The authors found that the most prevalent causes of death in the oldest old were
pneumonia (35 percent) and pulmonary embolism (14 percent). Cancer was responsible for only
6 percent of deaths in the extreme aged, but for 42 percent in the younger group. The authors

9
concluded that the extreme aged died from acute events in most cases, while the middle-aged
individuals died in most cases from chronic diseases (Figure 10).
Fig. 10 is about here
If a person with cancer dies from an acute pathological event (e.g., pneumonia, heart
attack, or the flu), then this person will contribute statistically to cancer incidence, but not
necessarily to cancer mortality. The competing deaths, thus, are masking part of the potential
mortality from cancer in the oldest old.
In summary, the decline in cancer mortality at oldest old ages may reflect a respective
decline in the cancer incidence rate at earlier ages, and/or it may be due to the impact of
competing deaths from acute events.
4 Higher Overall Cancer Risk in the More Developed Countries
4.1 Standardized Incidence and Mortality Rates
Standardized cancer incidence and mortality rates for all sites combined show a clear association
with economic development. Figure 11 illustrates these rates for selected regions of the world in
1990.
Fig.11 is about here
We see from this figure that the cancer incidence rate tends to be higher in more
developed regions than in less developed ones. The United States exhibits the highest values of
this index for both sexes. In almost all countries, except India and Columbia, the male incidence
rate is higher than that for females. This difference seems to be larger in more developed
countries.
Overall cancer mortality is also higher in more developed regions, and higher in males
than in females. Surprisingly, however, the regions with a higher cancer incidence do not
necessarily have correspondingly higher cancer mortality. For instance, the highest male cancer
risks are observed in the United States, while male cancer mortality in the United States is not
the highest among the countries represented. In fact, it is lower than in many other countries
(e.g., the UK, Denmark, and Germany). The highest male cancer mortality is seen in Russia. In
less developed regions, there is a closer relationship between cancer mortality and cancer

10
incidence than in more developed ones. In Mongolia, the incidence and mortality rates are almost
the same.
Since cancer mortality reflects the contributions of both incidence and survival from
cancer, the difference between cancer incidence and mortality rates observed in a country can
partly be attributed to the rate of survival of cancer patients in that country. Less developed
regions exhibit poor survival from cancer, the values of age-standardized incidence rates in these
regions therefore are closer to the mortality values than in the more developed regions.
4.2 Age-Specific Cancer Risk
A comparison of the curves of age-specific cancer incidence rates in different countries (Figures
12-13) provides us with more information than we would get by simply looking at age-
standardized values.
Fig. 12-13 are about here
The UK, the USA, West Germany, Sweden, Australia, and Denmark represent
economically more developed regions from climatically different parts of the earth.
Economically less developed regions (also from climatically different parts of the Earth) are
China, Ecuador, Colombia, India, Thailand, and Belarus. Clear differences in age-specific cancer
incidence rates can be seen between the more and less developed regions. The rates are
commonly higher in more developed countries than in less developed ones, for both males and
females.
Figure 13 shows the age-specific rates for intermediately developed regions (represented
by East Germany, Poland, and Yugoslavia) in comparison with more and less developed ones
(Canada and Thailand, respectively).
Fig. 13 is about here
It can be seen that the curves of the incidence rate for intermediately developed regions
are located between the curves for the more and less developed ones.
Ethnic and climatic factors seem to contribute less substantially to the differences in the
cancer incidence rates between countries than life styles linked to economic development. In
countries with similar levels of economic development but a different climate (e.g., West

11
Germany vs. Australia), the cancer rate patterns look more similar than in countries with
different levels of economic development but similar ethnic groups and climatic conditions (e.g.,
pre-unification East and West Germany) (Figure 14).
Fig. 14 is about here
Thus, the overall cancer risk is positively associated with economic progress. It is higher
in more developed regions than in less developed ones. This can be observed not only for age-
adjusted but also for age-specific values of the cancer incidence rate, particularly at ages above
40. Factors of economic progress that may be responsible for such an intriguing association are
discussed in Chapter 2.2. .
5 Cancers that are More Common in Less Developed Regions
A comparison of standardized incidence rates for different cancer sites in more and less
developed regions reveals that, unlike the overall risk, a few cancers manifest higher rates in less
developed countries. These include tumors of the cervix, liver, and oesophagus (Figure 15).
Fig. 15 (1, 2) is about here
The risk of these cancers has proven to be higher in the presence of infectious factors
(IARC Monographs 1994, 1995).
Liver cancer. A strong association has been established between chronic infection with
hepatitis B and C viruses and liver cancer. This cancer is less common in western countries and
has high rates in southern Africa and south-east Asia. The high rates may be linked to hepatitis B
and C infection, with their occurrence being much higher in African and Asian populations than
in Europe (Parsonnet, 1999; EstEve et al. 1993).
Cervical cancer. Cervical cancer is caused by infection with HPV (Human Papilloma
Virus), which is more common in less developed countries. This infection is transmitted most
frequently by sexual intercourse, thus explaining an association that has been observed with the
number of sexual partners and age at first intercourse. The HPV infection is probably responsible
for the observed higher incidence of cervical cancer in less developed countries (Parsonnet,
1999; EstEve et al. 1993).

12
Stomach cancer. Differences in stomach cancer risks between more and less developed
regions are not obvious when standardized rates are compared (Figure 15). Nevertheless, the
cancer’s age-specific incidence rate at old ages is often higher in less developed regions,
especially in Eastern and Asian countries than in Western Europe and the USA (Figure 4 above).
The contribution of H. pilory infections to the higher risk of stomach cancer was shown in a
number of studies (Brenner et al., 2000; Parsonnet, 1999). The infection is thought to be more
common in less developed countries, possibly because individuals in these countries do not have
relevant antibiotics at their disposal to the same degree as their peers in more developed
countries. Treatment with several antibiotics (e.g., metronidazole) has proven to protect against
stomach cancer.
Dietary factors are also considered to be important causes of the disease, in particular high
consumption of smoked, salted, and fried foods, and low consumption of green leafy vegetables
and citrus fruits (EstEve et al. 1993). This accords with observations that smoked and salted food
is prevalent in countries with high stomach cancer rates (e.g., China). However, the role of diet
in stomach cancer risks is still questionable. For instance, the risks began to decrease in Japan
immediately after changes in the food consumption patterns, reflecting “westernization”, towards
increased consumption of meat, fat, and eggs, and a decreased rude cereal (e.g., barley) intake
(Kagawa et al. 1978). At the same time, the proportion of vegetables did not change significantly
in the diet. In other words, the usual physician’s recommendation to eat more grain and
vegetables, and less fat, does not correspond to a true link between these food components and
the risk of stomach cancer.
In summary, a few cancers exhibit a higher incidence rate in less developed regions.
Infection is thought to be one of the main risk factors for these cancers. Successful treatments of
the respective infectious conditions (e.g., gastritis, cervicitis, and hepatitis) provide an effective
prophylaxis against stomach, cervical, and liver cancers and this has probably resulted in a
commonly lower risk of these cancers in more developed countries. At the same time, the
incidence rates for the majority of other cancer sites are higher in more developed regions. It is
not clear which aspects of economic development are primarily responsible for these higher
rates, but it is clear that prophylactic measures have not yet been effective enough for most
human cancers.

13
Leading cancer sites differ in more and less developed regions. Differences in incidence
rates of specific cancer sites between more and less developed countries result in different sets of
the most common cancers (Figure 16).
Fig. 16 is about here
We see from Figure 16 that male lung and female breast cancers are the most common
cancer sites in both more and less developed countries. However, the next two most common
sites are different for the two groups. For males, these are stomach and liver cancer in the less
developed regions, while prostate and colon cancer is more common in more developed ones.
For females, they are cervical and stomach cancers in less developed regions and colon and lung
cancers in more developed ones.
6 Overall Cancer Risk Increased Along with Economic Progress
6.1 Increasing Overall Cancer Incidence Rate in the Second Half of the 20th Century
Age-standardized rates. In most countries represented in the IARC reports, the standardized
overall cancer incidence rates showed a tendency to increase during the second half of the last
century, in parallel with economic progress. Figure 17 shows an example, with the time
trajectories of the standardized rates in Denmark, Sweden, the UK, Kazakhstan, and Russia
calculated for different time periods between 1980 and 1998.
Fig.17 is about here.
It can be seen from this figure that the overall cancer risk is higher in the more developed
countries (Denmark, Sweden, and the UK) compared to the less developed ones (Kazakhstan and
Russia). The risk increased over time in all countries. In other words, time trends in the
standardized cancer incidence rate also show an association with economic progress. Changes in
the standardized rate may mask changes in the age-specific rate. Indeed, a monotonic increase in
the standardized rate may be accompanied by a decline in the age-specific rate for some ages.
For this reason, the analysis of age-specific incidence rates may provide more information on the
forces responsible for the observed changes.
14
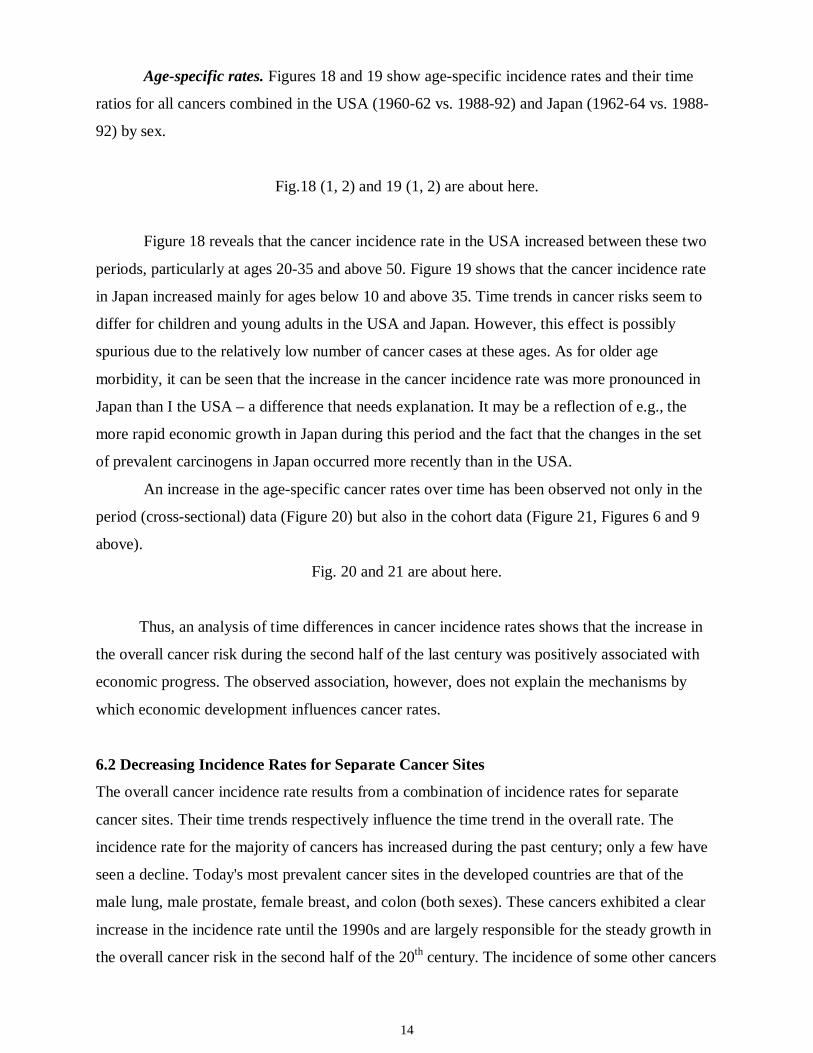
Age-specific rates. Figures 18 and 19 show age-specific incidence rates and their time
ratios for all cancers combined in the USA (1960-62 vs. 1988-92) and Japan (1962-64 vs. 1988-
92) by sex.
Fig.18 (1, 2) and 19 (1, 2) are about here.
Figure 18 reveals that the cancer incidence rate in the USA increased between these two
periods, particularly at ages 20-35 and above 50. Figure 19 shows that the cancer incidence rate
in Japan increased mainly for ages below 10 and above 35. Time trends in cancer risks seem to
differ for children and young adults in the USA and Japan. However, this effect is possibly
spurious due to the relatively low number of cancer cases at these ages. As for older age
morbidity, it can be seen that the increase in the cancer incidence rate was more pronounced in
Japan than I the USA – a difference that needs explanation. It may be a reflection of e.g., the
more rapid economic growth in Japan during this period and the fact that the changes in the set
of prevalent carcinogens in Japan occurred more recently than in the USA.
An increase in the age-specific cancer rates over time has been observed not only in the
period (cross-sectional) data (Figure 20) but also in the cohort data (Figure 21, Figures 6 and 9
above).
Fig. 20 and 21 are about here.
Thus, an analysis of time differences in cancer incidence rates shows that the increase in
the overall cancer risk during the second half of the last century was positively associated with
economic progress. The observed association, however, does not explain the mechanisms by
which economic development influences cancer rates.
6.2 Decreasing Incidence Rates for Separate Cancer Sites
The overall cancer incidence rate results from a combination of incidence rates for separate
cancer sites. Their time trends respectively influence the time trend in the overall rate. The
incidence rate for the majority of cancers has increased during the past century; only a few have
seen a decline. Today's most prevalent cancer sites in the developed countries are that of the
male lung, male prostate, female breast, and colon (both sexes). These cancers exhibited a clear
increase in the incidence rate until the 1990s and are largely responsible for the steady growth in
the overall cancer risk in the second half of the 20th century. The incidence of some other cancers

15
which were more prevalent in the past (e.g., stomach and cervical cancer) has decreased in many
countries as the economic situation progressed. Figure 22 illustrates this, showing the
standardized incidence rate for cervical cancer.
Fig. 22 is about here
Summing up, different time trends can be seen in the incidence rates for individual cancer
sites and it is the balance between the cancers that are increasing and those that are decreasing in
frequency which results in the time trend for the overall cancer risk. Until recently, this overall
risk increased in most countries of the world. This indicates that factors associated with
economic progress that promote cancer have been more influential than the factors that prevent
cancer.
6.3 Declining Overall Cancer Risk in the 1990s in Some Developed Countries
Age-standardized rate. After a steady increase during the second half of the last century, the
overall cancer risk (age-standardized) showed a deceleration or even a decline in the 1990s in
several developed countries, such as the USA, Sweden, and Denmark (Ries et al. 2001,Holly et
al. 2001, McKean-Cowdin 2000,Lynn et al. 2000, Health for all 2000). At the same time,
intermediately developed countries (e.g., Russia) continue to see increases in the overall rate (see
Figure17 above). The decline in overall cancer risk was the most pronounced in the USA
between 1992 and 1998 (Cole et al. 1996, Ries et al. 2001, Health in US 2001, Holly et al. 2001,
Jemal et al. 2004a). It was largely due to decreasing incidence rates for some of the most
prevalent cancer sites (e.g., of the male lung, male prostate, and colon in both sexes). The exact
reasons for the decline in rates are not clear; reference is usually made to declining exposure to
tobacco smoking. However, time trends in tobacco smoking do not seem to fit very well these
trends (to be discussed in part II. Explanation).
Incidence rates for separate cancer sites: alarming trends. At the same time, incidence
rates for some other prevalent cancers (e.g., skin melanoma and female breast cancer) continue
to increase. There has also been a deceleration in the long-term decline in the incidence rate of
those cancers that showed an almost linear fall over the past decades in the USA and in other
developed countries. These include stomach and cervical cancers (Ries et al. 2001, Health in US
2001, Holly et al. 2001, Health for all 2000, Levi et al. 1999).

16
A particularly important point is that while the incidence of some of today’s most prevalent
cancers is decreasing, the incidence of some other cancers that are less prevalent now is rising
steeply and these may, in turn, in future become the more prevalent sites in developed countries.
Examples include myeloma, non-Hodgkin’s lymphoma, liver, thyroid, and kidney cancers. Rare
in the past, they have seen an incident rate increase of more than 100 percent during a mere 50
years, meaning that they may replace today’s most prevalent sites soon, if this trend continues
(Table 1).
Table 1. Changes in incidence and survival rates for separate cancers during 1950-1998 in the USA (Source: Ries et al. 2001). Cancer Change in incidence rate
1950 -1998 (%) 5-Year 1950
survival ( %) 1997
*Melanoma 477 49 89
*Lung 248 6 15
Myeloma 222 6 28
*Prostate 194 43 97
Non-Hodgkin’s lymphoma
185 33 54
Liver 180 1 6
Thyroid 155 80 95
Kidney 131 34 62
Brain 69 21 31
*Breast 63 60 87
Bladder 54 53 82
Childhood cancers
35 20 79
*Colon 15 41 62
Pancreas 14 1 4
Leukaemias 11 10 46
Corpus U 3.7 72 86
Ovarian 1 30 52
Esophagus -3 4 15

17
*Stomach -79 12 20
Cervix -79 59 72
All sites 60 35 63 * - Most prevalent sites today; red - poor 5-year survival; blue - high 5-year survival; green- moderate 5-year survival; pink - rapid increase in the incidence rate during 50 years.
A similar development has occurred in the past. For instance, melanoma and female lung
cancer were not among the most prevalent cancer sites in the USA 50 years ago, in contrast to
stomach cancer (Ries et al. 2001). However, opposite trends in these cancers' incidence rates in
the second half of the last century resulted in the fact that melanoma and female lung cancer are
now among the 10 most prevalent cancer sites in the USA, while stomach cancer is not (Ries et
al. 2001).
Thus, one should interpret recent positive trends in the overall cancer risk with caution,
taking into account the speed of increase in the rates of today’s less prevalent cancer sites.
Cancers with both a rapidly increasing incidence rate and poor survival most urgently require
prophylactic and therapeutic measures, even if these cancers are rare today. Myeloma, non-
Hodgkin’s lymphoma, liver, and brain cancers are examples (see Table 1 above).
7 Why Does Cancer Mortality Decline While the Incidence Rate Continues to
Increase?
7.1 The Lag between Cancer Incidence and Mortality Increases
The age-pattern of the overall cancer mortality rate resembles that of the incidence rate (Figure 9
above). The values for mortality are usually lower than for incidence, however. The lag between
cancer incidence and mortality rates increased over time for both sexes (Figure 23).
Fig. 23 is about here
One can see from this figure that cancer mortality in the UK of 1963-65 was closer to the
incidence than in 1996, especially for males. The ratio of the age-specific cancer mortality to the
incidence rate decreased over time at all ages. One reason may be the improvement in the
survival of cancer patients observed in most developed countries during the past decades. For
females, the ratio is lower than for males (except at old ages). Higher female survival from
cancer certainly contributes to this difference. For instance, five-year survival from cancer in
18
countries of the EU varied in 1996 between 45-60 percent for females; this compares to 30-45
percent for males (EUCAN 1999).
7.2 Decline in Cancer Mortality: Competition Between Incidence and Survival
7.2.1 Overall Cancer Mortality
Despite the recent and slight decrease in the standardized incidence rate in some developed
countries, the standardized mortality rates for all cancers combined showed a clear decline in
many European countries and the USA before any decrease in the incidence rate was observed
(Health for all 2000, McKean-Cowdin 2000, Levi et al. 1999, Cole et al. 1996). Figure 24 shows
the trends in the standardized cancer mortality rate as compared to the trends in the incidence
rate for all sites combined in the five countries discussed above.
Fig.24 is about here.
The figure shows a decline in overall cancer mortality in Sweden since 1976, the UK and
Kazakhstan since 1990, and in Russia since 1994. The overall cancer incidence rate continued to
increase during these years in all countries except Kazakhstan (the least developed region of the
four). Interestingly, the cancer mortality rate was the lowest in Sweden, while the incidence rate
in that country was one of the highest among the countries compared. To understand the reasons
for such divergence, it has to be taken into account that cancer mortality does not result entirely
from the cancer incidence rate. Improvements in the survival of cancer patients are likely to be
the most important contributor to a decline in cancer mortality. This contribution is most
significant in Sweden, where the survival of cancer patients is the highest in the EU.
7.2.2 Mortality for Individual Cancer Sites
Non-Hodgkin’s lymphoma. The mortality for particular cancer sites continues to increase over
time. The rise reflects the corresponding growth in the cancer incidence rate. For instance, the
increase in mortality from Non-Hodgkin’s lymphomas observed during previous decades in
developed countries is related to a significant increase (almost twofold) in the respective
incidence rate for the same period.
Hodgkin’s disease. Contrarily, a decline in cancer mortality over time does not
necessarily result in a corresponding decline in the cancer incidence. Progress in the survival of
cancer patients may also contribute to such a decline. This survival is commonly higher in more
developed countries than in less developed ones (Sankaranarayanan et al. 1998, Berrino et al.

19
1995). For instance, a large decrease (about 75 percent) in Hodgkin’s disease mortality during
1950-1997 in the USA is likely to be entirely due to a substantial increase in the 5-year survival
from this cancer (from 30 percent in the 1950s to 84 percent in the 1990s). The incidence rate of
Hodgkin’s disease increased for the same period by 14 percent (Ries et al. 2001). This shows that
this factor does not contribute to declining mortality.
Cervical cancer. Cervical cancer shows a decline in both incidence and mortality rates.
Its incidence rate had already begun to decrease in the 1950s in the USA and Europe (Figure 20).
The 5-year survival of patients with cervical cancer rose by about 10 percent over the same
period (EstEve et al. 1993, Ries 2001, Health for all 2000). Under such favorable conditions, the
observed decline in mortality from cervical cancer is to be expected (Ries 2001, Levi et al.
1999).
Breast cancer. Female breast cancer is an example of a cancer that exhibits an increase in
the standardized incidence rate over time in most countries. Nonetheless, trends in breast cancer
mortality vary considerably between the countries. Figure 25 shows time trends in breast cancer
incidence and mortality for selected countries.
Fig. 25 is about here.
We see from this figure that breast cancer incidence and mortality rates are generally
higher in the more developed countries (Denmark, Sweden, and the UK) than in the less
developed ones (Kazakhstan and Russia). The breast cancer incidence rate increased over time in
all countries, while the cancer’s mortality rate rose in Russia and Kazakhstan only. The decline
in the mortality rate from breast cancer has been observed in Sweden since 1975 and in the UK
since 1990. It is surprising that the breast cancer incidence rate is higher in Sweden than in the
UK, while mortality from this cancer is lower in Sweden than in the UK.
The variability in trends of breast cancer mortality cannot be explained without taking into
account large differences in survival from this cancer among the countries compared. It differs
significantly even between countries with a similar standard of medical assistance (e.g. the EU
states). For instance, the 5-year survival of breast cancer patients in 1996 was about 81 percent in
Sweden but only about 67 percent in the UK (EUCAN 1999). In Russia of 1999, it was even
lower (about 54 percent) than in the UK of 1996 (Health in Russia 2000). The rise in breast
cancer mortality in Russia reflects an increasing incidence rate on the grounds of poor survival

20
from this cancer. The differences in the survival of cancer patients are likely to be a major
contributor to a divergence between incidence and mortality trends.
7.2.3 Why Does Survival From Cancer Differ Among Developed Countries?
Variability in survival of cancer patients can reasonably be expected when regions with clearly
different levels of economic development and medical assistance are compared (e.g. Europe and
Africa). Variability is not obvious in the case of countries with similar economic and health care
conditions, however. The large difference between countries such as Sweden and the UK in the
survival of cancer patients is surprising and requires explanation. Figure 26 shows the mean five-
year-survival for all cancers combined in 1996 in European countries. It can be seen from this
figure that survival varies among the countries, ranging from 37.5 percent in the UK to 53
percent in Sweden.
Fig 26 is about here
This difference appears puzzling. It is also unclear, why survival is highest in Sweden (53
percent), while neighboring Denmark (with a similar climate, economic system, and health
service) has almost the lowest survival value among the EU countries (about 40 percent). As for
individual cancer sites, the highest five-year survival rates are observed in different countries
(e.g., prostate cancer in Sweden, lung cancer in France, colon cancer in the Netherlands).
However, the lowest five-year-survival rates for almost all sites are found in only two countries
(the UK and Denmark) (Table. 2).
Table 2. Differences in five-year survival from cancer among EU countries in 1996 (EUCAN 1996). Cancer Highest Survival Lowest Survival
Lung France (20%) UK, Denmark (7%)
Prostate Germany (65%), Sweden (70 %) Denmark (42%), UK (45%)
Breast Sweden, France, Finland (80%) Austria (63%), UK (67%)
Colon Netherlands (56%) UK (40 %), Denmark (43%)
Stomach Austria, Spain, Germany (25-30%) UK (12 %), Denmark (15%)

21
This variability raises an important practical question: Which factors determine the
differences in survival from cancer between countries with similar standards of medical
assistance? Climatic, cultural, and ethnic differences may play a role, as may differences in
medical care. For instance, access to medical specialists is limited in the UK compared to
Sweden and this may lead to a higher proportion of patients in the UK being diagnosed with
cancer at a late stage. This, in turn, will worsen prognosis and survival from cancer. The
differences in treatment in a given country, such as preference of chemotherapy over surgery, or
surgery over radiotherapy, may be important as well. Even a preference for a particular brand
name of a drug in a country may influence the outcome of anti-cancer treatment. Pharmaceutical
companies use slightly different technologies to manufacture drugs with presumably the same
action. This may produce certain differences in the drug’s efficiency. International differences in
schemes of compensatory treatment (applied after the main course of cancer therapy) may be one
more reason.
The exact causes of the large variability in survival from cancer therefore are not clear and
require further study; their importance should not be underestimated. Understanding the reasons
behind the differences in survival from cancer among equally developed countries could help
improve survival even without additional investments in the development of new cancer
therapeutics. In this chapter, we have only briefly shown that survival from cancer depends not
only on standard anti-cancer treatment but also from other, hidden, factors.
In conclusion of this section, the contemporary decline in overall cancer mortality in
developed countries results from time trends in both incidence rates and survival from cancer.
These trends are different for individual cancer sites. Since the overall cancer risk increased
during the second half of the 20th century in most countries studied, and the effectiveness of anti-
cancer treatment has noticeably improved only in the last 20-30 years, it was relatively recent
that the decline in overall cancer mortality began to be observed.
8 Concluding Remarks
Comparison of cancer incidence and mortality rate curves as well as age-standardized values in
different countries of the world for different time periods shows that:
(1) The overall cancer risk, until recently, has increased over time along with economic
progress. It is also higher in the more developed regions than in the less developed ones for the
same time point. The individual cancer sites’ contributions to the overall rate also have changed
in a way linked to economic development.

22
(2) Cancer incidence and mortality rates exhibit different time trends. While cancer
incidence increased over time, mortality rates begun to decline. This divergence most probably
reflects substantial progress in the survival of cancer patients during the last 50 years. Improved
survival has decreased cancer mortality, but not its incidence. Both rising cancer incidence and
falling mortality from cancer elevated the cancer burden in developed countries.
(3) The modest deceleration/decline in cancer incidence and significant decrease in
mortality rates during the last decade in the USA, together, indicate that the progress in
developing new effective cancer treatments has been more substantial than the progress in
developing effective cancer prophylaxis.
(4) A comparative analysis of trends in incidence rate for separate cancer sites suggests that
the recent positive tendency towards a decline in the overall cancer risk in the developed
countries may be temporary. The decline was largely the result of the decreasing rates of a few
prevalent cancer sites (e.g., male lung, male prostate, and colon). However, there are some other
cancer sites (less prevalent now) with an incidence continuing to increase rapidly; these may
become more prevalent in the near future and result in overall cancer risk elevation. Examples of
cancers that are most worrying are myeloma, non-Hodgkin’s lymphoma, and liver cancer. They
not only have a continually increasing incidence, but also show poor 5-year survival rates. The
development of effective prophylactics and treatments for these cancers is necessary in order to
maintain the decline in cancer incidence and mortality rates in the future.
(5) Understanding the reasons behind increases in cancer incidence rate in the developed
countries is of great importance. Three major processes contribute to the increase in the cancer
burden worldwide: population aging, a rising cancer incidence rate, and an improving survival of
cancer patients. Among these, only one factor – the increase in the cancer incidence rate – is
genuinely negative. It is this factor that requires most attention, with the first step constituting an
urgent search for explanations in order to develop adequate prophylactic measures. Which
aspects of economic progress and western life style are primarily responsible for the elevated
risks of the majority of cancers? Which aspects have influenced the changes in the proportions of
individual cancer sites making up the overall rate? We address these questions and discuss
possible explanations in the next paper (Economic Progress as Cancer Risk Factor II. Why is
Overall Cancer Risk higher in More Developed Countries?).
9 Acknowledgements We are very thankful to Prof. J.W. Vaupel for the possibility to conduct this study at Max Planck Institute for Demographic Research, as well as for his valuable comments on the paper. We

23
also thank C. Meulen, S. Backer and R. Flibotte-Lüskow for their great help in preparing this manuscript.
References
Berrino F, Sant M, Verdecchia A. et al. (eds.) Survival of cancer patients in Europe. The EUROCARE Study. IARC Sci. Publ. #132, 1995. Lyon: IARC. Bordin P, Da Col PG, Peruzzo P, Stanta G, Guralnik JM, and Cattin L: Causes of death and clinical diagnostic errors in extreme aged hospitalized people: a retrospective clinical-necropsy survey. J Gerontol A Biol Sci Med Sci 54(11): M554-9, Nov 1999. Brenner H, Arndt V, Sturmer T, Stegmaier C, Ziegler H, and Dhom G. (2000) Individual and joint contribution of family history and H. pilory infection to the risk of gastric carcinoma. Cancer, 88(2): 274-9. Cheron G and Desmedt JE: Peripheral and central somatosensory pathways and evoked cerebral potentials during aging. Rev. Electroencephalogr. Neurophysiol. Clin.10, 146-152, 1980. Ciftcioglu N, Bjorklund M, Bergstrom K, and Kajander EO: Nanobacteria: an infectious cause for kidney stone formation. Kidney Int. 56, 1893-1898, 1999. Cole P and Rodu B: Declining cancer mortality in the United States. Cancer, 78:10, 2045-8, Nov, 1996. Coleman MP, Esteve J, Damiecki P, Arslan A, and Renard H (Eds.) Trends in cancer incidence and mortality IARC Sci. Publ. #121, 1993. Lyon: IARC. Dean W: Biological Aging Measurement. Center for Biogerontology, Los Angeles, 1988. Diffley J, Evans TR, De Bono JS, Dalgeish AG, Caramichael J, et al. 2000 Phase I study of ONO-4007, a synthetic analogue of the lipid A moiety of bacterial lipopolysaccharide. Clin Cancer Res, 6(2):397-405. Dilman V. 1994 Development, Aging and Disease. A new rationale for an Intervention Strategy. Chur: Harwood Academic Publications. Dinse GE, Umbach DM, Sasco AJ, Hoel DG, Davis DL. 1999 Unexplained increases in cancer incidence in the United States from 1975 to 1994: possible sentinel health indicators? Annu Rev Public Health. 20:173-209. Doll R. (1971) The age distribution of cancer: Implications for models of carcinogenesis. J Stat Soc A, 134: 133-166. Edwards BK, Howe HL, Ries LA, Thun MJ, Rosenberg HM, Yancik R, Wingo PA, Jemal A, Feigal EG. Annual report to the nation on the status of cancer, 1973-1999, featuring implications of age and aging on U.S. cancer burden. Cancer. 2002 May 15;94(10):2766-92.

24
EstEve J, Kricker A, Ferlay J, and Parkin DM (Eds). Facts and figures of cancer in the European Community. IARC WHO, 1993. Lyon: IARC. EUCAN: Cancer Incidence, Mortality and Prevalence in the European Union in 1996, version 3.1. Ferlay J, F Bray, Sankila R, Parkin DM. IARC Cancer Base No. 4. IARC Press: Lyon 1999. (a product of European Network of Cancer Registries) Falk PG, Hooper LV, Midtvedt T, and Gordon JI: Creating and maintaining the gastrointestinal ecosystem: what we know and need to know from gnotobiology. Microbiol Mol Biol Rev 62(4): 1157-70, Dec 1998. Finch CE and Tanzi RE: Genetics of aging. Science, 278 (5337): 407-11, Oct 17, 1997. Franceschi C and Ottaviani E: Stress, inflammation and natural immunity in the aging process: a new theory. Aging Clin. Exp. Res. 9, Suppl. to 4, 40-31, 1997. Giovannucci E: Insulin and colon cancer. Cancer Causes control, 6:164-79, 1995. GLOBOCAN: Cancer incidence and mortality worldwide. Ferlay J., Parkin DM, and Pisani P. IARC Cancer Base No. 3. 1998, Lyon: IARC Press. (Comment: A description of the method used for estimating GLOBOCAN data is published in: Parkin, D.M., Pisani, P. and Ferlay, J. Estimates of the worldwide incidence of twenty-five major cancers in 1990. Int J. Cancer: 80, 827-841 (1999). Pisani, P., Parkin, D.M., Bray, F.I. and Ferlay, J. Estimates of the worldwide mortality from twenty-five major cancers in 1990. Int. J. Cancer: 83, 18-29 (1999)). GLOBOCAN 2000 (2001). Ferlay J, Bray F, Pisani P, Parkin DM, and Ferlay I: GLOBOCAN 2000: Cancer Incidence, Mortality and Prevalence Worldwide, version 1.0. IARC Cancer Base No.5 Lyon, France, IARC Press. Gonzalez FJ. (2000) Genetic polymorphisms in metabolizing enzymes. Cancer detection and prevention, Vol 24, Suppl. S-104: 153. Gosden, R.G. (1985) Biology of Menopause: The Causes and Consequences of Ovarian Ageing. London: Academic Press. Grove G and Kilgman A: Age-associated changes in human epidermal cell renewal. J. Geront. 38, 137-142, 1983. Guyton A.C and Hall JE. 1996 Textbook of Medical Physiology. W.B. Saunders Co., Philadlephia: 906-909. Harvard report on cancer prevention: Causes of human cancer. Smoking. Cancer Causes Control. Suppl 1:S5-6, Nov 7, 1996. (see also: Monson and Wals) Health for all. Data Base. (2000) WHO Regional Office for Europe. Health in Russia. 1999 Statistics. (2000) Russian Ministry of Health publication.

25
Health US (1997-2001) Department of Health and Human Services (DHHS) Publications. Henrich JB. The postmenopausal estrogen/breast cancer controversy. JAMA 1992 Oct 14;268(14):1900-2. Hekimi S, Lakowski B, Barnes TM and Ewbank JJ: Molecular genetics of life span in C. elegans: how much does it teach us? Trends Genet, 14(1): 14-20, Jan, 1998 . Holly L. Howe, Phyllis A. Wingo, Michael J. Thun, Lynn A.,G Ries, Harry M. Rosenberg, Ellen G. Feigal, and Brenda K. Edwards: Annual Report to the Nation on the Status of Cancer (1973 Through 1998), Featuring Cancers With Recent Increasing Trends. Journal of the National Cancer Institute, Vol. 93, No. 11, 824-842, June 6, 2001. Hoshino K, Kimura O, Kawaguchi H, Fukui H, Ikeda M, and Sasaki T. 2000 [Effect of radiotherapy for inoperable remnant and recurrent gastric cancer--focusing of improvement in quality of life]. Gan To Kagaku Ryoho, 27(4): 599-603. [Article in Japanese] Hunter DJ and Willet WC: Diet, body size and breast cancer. Epidemiol Rev, 15: 110-32, 1993. IARC (The International Agency for Research on Cancer [France]). (1965-2003) Cancer Incidence in Five Continents. Volumes I-VIII. IARC Sci. Publ. Lyon: IARC Press. IARC (1997) Cancer Incidence in Five Continents. Parkin, D.M., Whelan, S.L., Ferlay, J., Raymond, L., Young, J., editors. Volume VII. IARC Sci. Publ. No.143. Lyon: IARC Press. IARC Monographs on the Evaluation of Carcinogenic Risks to Humans (1972-2001) Vol. 1 - 78, Lyon: IARC Press. Separate Volumes: IARC Monographs on the Evaluation of Carcinogenic Risks to Humans Vol. 31, 1983, Lyon: IARC Press (Some Food Additives and Naturally Occurring Substances). IARC Monographs on the Evaluation of Carcinogenic Risks to Humans Vol. 38, 1986, Lyon: IARC Press (Tobacco Smoking). IARC Monographs on the Evaluation of Carcinogenic Risks to Humans Vol. 35, Suppl. 7, 1987, Lyon: IARC Press (Coal, coal-tars, soots). IARC Monographs on the Evaluation of Carcinogenic Risks to Humans Vol. 45, 1989, Lyon: IARC Press (Occupational Exposures in Petroleum Refining; Crude Oil and Major Petroleum Fuels). IARC Monographs on the Evaluation of Carcinogenic Risks to Humans Vol. 50, 1990, Lyon: IARC Press (Some Pharmaceutical drugs). IARC Monographs on the Evaluation of Carcinogenic Risks to Humans Vol. 56, 1993, Lyon: IARC Press (Salted fish). IARC Monographs on the Evaluation1 of Carcinogenic Risks to Humans Vol. 59, 1994, Lyon: IARC Press (Hepatitis viruses). IARC Monographs on the Evaluation2 of Carcinogenic Risks to Humans Vol. 61, 1994, Lyon: IARC Press (Schistosomes, Liver Flukes, and Helicobacter pylori). IARC Monographs on the Evaluation of Carcinogenic Risks to Humans No. 64, 1995, Lyon: IARC Press (Human Papillomaviruses). IARC Monographs on the Evaluation of Carcinogenic Risks to Humans Vol. 62, 1995, Lyon: IARC Press (Wood dust).

26
IARC Monographs on the Evaluation of Carcinogenic Risks to Humans Vol. 66, 1996, Lyon: IARC Press (Some Pharmaceutical drugs). IARC Monographs on the Evaluation of Carcinogenic Risks to Humans (1998) Volume 72. (Hormonal Contraception and Postmenopausal Hormonal Therapy). Lyon: IARC. Jemal A, Clegg LX, Ward E, Ries LA, Wu X, Jamison PM, Wingo PA, Howe HL, Anderson RN, Edwards BK. Annual report to the nation on the status of cancer, 1975-2001, with a special feature regarding survival. Cancer. 2004a ,101(1):3-27. Jemal A., Tiwari RC., Murray T., Ghafoor A., Samuels A., Ward E., Feuer EJ., and MJ. Thun. Cancer Statistics, 2004 . CA Cancer J Clin 2004b, 54: 8-29 Johnson BE and Kelly MJ: Overview of genetic and molecular events in the pathogenesis of lung cancer. Chest, 103 (1 Suppl):1S-3S, Jan, 1993. Kagawa Y: Impact of Westernisation on the Nutrition of Japanese: Changes in Physique, Cancer, Longevity and Centenarians. Prev Med, 7(2): 205-17, Jun 1978. Kearney J, Giovannucci E, Rimm EB, et al: Diet, alcohol, and smoking and the occurrence of hyperplastic polyps of the colon and rectum (United States). Cancer Causes Control, 6: 45-56, 1995. Kenyon C: A conserved regulatory system for aging. Cell, 105(2): 165-8, Apr 20, 2001. Keogh EV and Walsh RJ: Rate of greying of human hair. Nature, 207(999): 877-8, Aug 21, 1965. Kozma L. Age-dependent variation of doubling times in malignant disorders: why are the doubling times of tumours in childhood shorter than in adulthood? Med Hypotheses, 1998, 50(5):419-22. LeMarchand L,Kolonel LN, Wilkens LR, et al: Animal fat consumption and prostate cancer: a prospective study in Hawaii. Epidemiology, 5: 276-82, 1994. Levi F., Lucchini F., Negri E., et al: Cancer Mortality in Europe. Eur.J.Cancer P.1477-1516, Vol.35, 1999. Longnecker MP: Alcoholic beverage consumption in relation to breast cancer: meta-analysis and review. Cancer Causes Control , 5: 73-82, 1994. Lynn A.G., Ries, Phyllis A. Wingo, Daniel S. Miller, Holly L. Howe, Ph.D. ! (NAACCR), Hannah K. Weir, Ph.D. (CDC), Harry M. Rosenberg, Ph.D. (NCHS), Sally W. Vernon, Ph.D. (University of Texas), Kathleen Cronin, Ph.D. (NCI), and Brenda K. Edwards, Ph.D. (NCI): The annual report to the nation on the status of cancer, 1973-1997, with a special section on colorectal cancer. Cancer 88(10): 2398-2424, 2000. MacMahon B and Worcester J: Age at menopause. United States,1960-1962. Vital Health Stat 1, 11(19):1-20, Oct, 1966 .

27
Maehara Y, Emi Y, Tomisaki S, Oshiro T, Kakeji Y, Ichiyoshi Y, Sugimachi K. Age- related characteristics of gastric carcinoma in young and elderly patients. Cancer, 1996, 77(9):1774-80 Masoro E: Metabolism. In: Finch, C., Hayflick, L. (Ed.). Handbook of the biology of aging. Van Nostrand Reinhold, NY, 540-563, 1985. McKean-Cowdin R., Feigelson H. S., Ross R. K. et al: Declining Cancer Rates in the 1990s. J. Clin. Oncol. 18: 2258-2268, 2000. McKee M, Bobak M, Rose R, Shkolnikov V, Chenet L, and Leond D: Patterns of smoking in Russia. Tob Control, 7(1):22-6, Spring, 1998 . McKinaly S, Jefferys M, and Thompson B: An investigation of the age at menopause. J Biosoc Sci, 4(2):161-73, Apr, 1972 . Miccozzi MS: Functional consequences from varying patterns of growth and maturation during adolescence. Horm Res ,39 (Suppl 3): 49-58, 1993. Monson R and Wals J (eds.): Harvard Report on Cancer Prevention. Cancer Causes&Control, Vol.1, Suppl.1, 1996. Nakamura E, Lane M, Roth G, and Ingram D: A strategy for identifying biomarkers of aging. Exp. Gerontology, Vol.33. – 4, 1998. Napalkov NP, Knyazev PG, Anisimov VN, and Lichachev AY: [Modern Knowledge on Mechanism of Carcinogenesis.] VNIIMI Review, pp.84, Moscow, 1987. Oganov RG: [Prophylactic medicine]. Medicine News, #9(12), p.4,1995. Ogawa T, Kitagawa M, and Hirokawa K: Age-related changes of human bone marrow a histometric estimation of proliferative cells, apoptotic cells, T cells, B cells and macrophages. Mech. Ageing Dev. 117, 57-68, 2000. Parkin DM, Bray FI, Devesa SS. 2001 Cancer burden in the year 2000. The global picture. Eur J Cancer. 37 Suppl 8:S4-66. Parkin DM, Pisani P, and Ferlay J: Estimates of the worldwide incidence and mortality of twenty five major cancers in 1990 (GLOBOCAN data base, 1998). Parsonnet J. (ed): Microbes and Malignancy., NY: Oxford Univ. Press, 1999. Pawson IG: Growth and development in high altitude populations: a review of Ethiopian, Peruvian, and Nepalese studies. Proc R Soc Lond B Biol Sci. 27, 194(1114): 83-98, Aug, 1976. Peer PG, van Dijck JA, Hendriks JH, Holland R, and Verbeek AL: Age-dependent growth rate of primary breast cancer. Cancer 71:11, 3547-51, Jun 1993.

28
Pompei F, Polkanov M, Wilson R. (2001) “Age distribution of cancer in mice: the incidence turnover at old age.” Toxicol Ind Health, 17 (1): 7-16. Poppleton PK and Brown PE: The secular trend in puberty: has stability been achieved? Br J Educ Psychol, 36(1): 95-100, Feb, 1966. Pozharisski KM, Likhachev AJ, Klimashevski VF, and Shaposhnikov JD: Experimental intestinal cancer research with special reference to human pathology. Adv Cancer Res 30: 165-237, 1979. Reichman ME, Judd JT, Longcope C, et al: Effects of alcohol consumption on plasma and urinary hormone concentrations in premenopausal women. JNCI, 85: 722-7, 1993. Remmen H, Ward W, Sabia R, and Richardson A: Gene expression and protein degradation. In: Masoro, E. (Ed.). Handbook of Physiology: Section 11, Aging. Oxford Univ. Press, N.Y, 1995. Rainsford J, Cohen P, Dix D.On the role of aging in cancer incidence: analysis of the lung cancer data. Anticancer Res. 1985 Jul-Aug;5(4):427-30. Ries LAG, Eisner MP, Kosary CL, Hankey BF, Miller BA, Clegg L, and Edwards BK (eds): SEER Cancer Statistics Review, 1973-1998, National Cancer Institute. Bethesda, MD, http://seer.cancer.gov/Publications/CSR1973_1998/, 2001. Ries LAG, Smith MA, Gurnry JG et al. (eds): Cancer Incidence and Survival among Children and Adolescents: United States SEER Program, 1975-1995. The National Cancer Institute (NCI) monograph., NIH pub. Bethesda, MD, 1999. Ross SH: Cervical cancer prevention. Nurs Spectr (Wash D C) 23, 8 (6): 12-4; quiz 14, Mar, 1998. Rubin H: Cell aging in vivo and in vitro. Mech. Ageing Dev. 98, 1-35, 1997. Sandler DP, Wilcox AJ and Horney LF: Age at menarche and subsequent reproductive events. Am J Epidemiol, 1984, 119(5): 765-74. Sankaranarayanan K, Chakraborty R, and Boerwinkle E: Ionizing radiation and genetic risks. VI. Chronic multifactorial diseases: a review of epidemiological and genetical aspects of coronary heart disease, essential hypertension and diabetes mellitus. Mutat Res. 436:21-57, 1999. Semiglazov V, Moiseenko V, Chernomordikova M. [Growth kinetics of breast cancer] Vopr Onkol, 1989, 35(3):288-93. Sloan D, Fleizer D, Richards G, Murray D, and Brown R: Increased incidence of experimental colon cancer associated with long-term metronidazole therapy. Am. J. Surg., 145, 66-70, 1983. Smith D: Resistance to causes of death: a study of cancer mortality resistance in the oldest old. In: The Paradoxes of Longevity, Robine J-M et. al. (Eds), Springer Verlag, 61- 71, 1999. Smith D: Changing causes of death of elderly people in the United States, 1950-1990. Gerontology 44:331-335,1998.

29
Sohal R and Weindruch R: Oxidative stress, caloric restriction, and aging. Science, 273, 59-63, 1996. Soussi T: Antibodies in the sera of patients with various types of cancer: a review. Cancer Res, 1, 60(7): 1777-88, Apr, 2000. Strachan DP, Carrington D, Mendall MA., Ballam L, Morris J, Butland BK, Sweetnam PM, and Elwood A.: Relation of Chlamydia pneumoniae serology to mortality and incidence of ischaemic heart disease over 13 years in the caerphilly prospective heart disease study. BMJ, 318, 1035-1039, 1999. Strehler BL: Time, Cells and Aging. Academic Press, New York, London, 1962. Steinberg KK, Thacker SB, Smith SJ, Stroup DF, Zack MM, Flanders WD, Berkelman RL. A meta-analysis of the effect of estrogen replacement therapy on the risk of breast cancer. JAMA 1991 Apr 17;265(15):1985-90 Tanner JM: Menarcheal age. Science, 6, 214(4521): 604, 606, Nov, 1981. Thomas F, Renaud F, Benefice E, de Meeus T, and Guegan JF: International variability of ages at menarche and menopause: patterns and main determinants. Hum Biol , 73(2):271-90, Apr, 2001. Tominaga S. Major avoidable risk factors of cancer. Cancer Lett 143, 1: S19-23, 1999. Trepka MJ, Heinrich J, and Wichmann HE: The epidemiology of atopic diseases in Germany: an East-West comparison. Rev Environ Health, 11(3): 119-31, Jul-Sep, 1996 . Ukraintseva SV: [Evolution of morbidity in human history]. Clinical Gerontology #4, (in Russian), 61-65, 1998. Ukraintseva SV and Kogan I: Age-related human blood cholesterol levels. Z.Gerontologie Geriartie, 34, 127, 1999. Ukraintseva SV and Sergeev AS: Analysis of genetic heterogeneity of bronchial asthma as related to the age of onset. Russian Journal of Genetics 36, 2, 201-205, 2000. Ukraintseva SV: Why is the proportion of centenarians increasing today? Is it possible that some centenarians originate from a frail part of a generation? Advances in Gerontology #5, 2000. Ukraintseva SV and Yashin A.I (2001). How individual aging may influence human morbidity and mortality patterns. Mech. Aging & Development, 122: 1447-1460. Ukraintseva SV and Yashin A.I (2003) Individual aging and cancer risk: How are they related? Demographic Research, Vol. 9-8. Van Keep PA, Brand PC, and Lehert P: Factors affecting the age at menopause. J Biosoc Sci Suppl, (6):37-55, 1979.

30
Vaupel JW, Manton KG, and Stallard E: The impact of heterogeneity in individual frailty on the dynamics of mortality. Demography, 16 (3): 439 - 54, Aug, 1979. Vaupel J, Carey J, Christensen K, et al: Biodemographic trajectories of longevity. Science Vol.280- P.855-860, 1998. Vogel V and Motulsky G: Human Genetics. Problems and Approaches, 3rd ed. Springer pp. 240-252, Berlin, 1997. Volpe EW, Dix D.On the role of aging in cancer incidence: cohort analyses of the lung cancer data. Anticancer Res. 1986 Nov-Dec;6(6):1417-20. Wermers G, Dasgurta J and Dubey D: Stress, the immune system, and cancer. In: Cancer, Stress, and Death. Day S (Ed), NY, Plenum Pub, Corp, pp. 33-60, 1986. Willett WC: The search for the causes of breast and colon cancer. Nature, 338: 389-94, 1989. Whelton P: Blood pressure in adults and the elderly. In: Epidemiology of Hypertension. Bulpitt, C. (Ed.), Elsevier, N.Y., 52-53, 1985. Yashin AI, Manton KG, and Vaupel JW: Mortality and aging in a heterogeneous population: a stochastic process model with observed and unobserved variables. Theor Popul Biol, 27 (2): 154-75, Apr, 1985. Zang, EA, Wynder, EL. (1996) Differences in lung cancer risk between men and women: Examination of the evidence. Journal of the National Cancer Institute 88(3-4):183-192.

31
Lung cancer incidence per 100 000(UK 1988-92)
0
100
200
300
400
500
600
700
800
900
5 25 45 65 85 105
Age
Lung M
Lung F
Stomach cancer incidence per 100 000 (UK 1988-92)
0
50
100
150
200
250
300
5 25 45 65 85
Age
Stomach M
Stomach F
Colon cancer incidence per 100 000(UK 1988-92)
0
50
100
150
200
250
300
350
400
5 25 45 65 85
Age
Colon M
Colon F
Bladder cancer incidence per 100000(UK 1988-92)
0
50
100
150
200
250
300
0 20 40 60 80
Age
Bladder M
Fig. 1. Age-patterns of cancer incidence rate. Examples of accelerated increase in the rate until very old age (80+). Thepattern of the female lung cancer incidence rate differs from that for males. The former manifests a wave-like shape witha peak at about age 70. The United Kingdom, 1988-92 (IARC 1997).
Endometrium cancer incidence per 100 000 women (UK, 1988-92)
0
10
20
30
40
50
0 20 40 60 80
Age
Ovarian cancer incidence per 100 000 women (UK, 1988-92)
0
10
20
30
40
50
60
0 20 40 60 80
Age
Other endocrine cancer incidences per 100 000, women (UK, 1988-92)
0
0.2
0.4
0.6
0.8
1
1.2
1.4
1.6
0 10 20 30 40 50 60 70 80 90Age
Brain cancer incidence per 100 000 (UK, 1988-92)
0
5
10
15
20
25
0 20 40 60 80
Age
Brain M
Brain F
Fig. 2. Age-patterns of cancer incidence rate. Examples of a wave-like change in the rate with age. The United Kingdom, 1988-92 (IARC 1997).
32
Melanoma incidence per 100 000 (UK 1988-92)
0
5
10
15
20
5 25 45 65 85
Age
Melan. F
Melan. M
Thyroid cancer incidence per 100 000 (UK 1988-92)
0
1
2
3
4
5
6
5 25 45 65 85
Age
Thyroid F
Thyroid M
Eye cancer incidence per 100 000 females (UK 1988-92)
0
0.5
1
1.5
2
2.5
3
0 20 40 60 80
Age
Fig. 3. Age-patterns of cancer incidence rate. Examples of a linear or decelerated increase in the rate with age. The United Kingdom,1988-92 (IARC 1997).
Fig. 4. Age-patterns of incidence rates for male stomach cancer, 1988-92, average annual.A comparison between more and less developed countries (IARC 1997).
0 20 40 60 80 1000
100
200
300
400
500
Stomach cancer incidence rates, 1988-92, males
Age
Inci
denc
e pe
r 10
0,00
0
USA
ChinaBelarus
Denmark
East Germany

33
Fig. 5. Age-patterns of the incidence rates for ovarian cancer. A comparison between more and less developed countries (IARC 1997).
Lung cancer incidence rate in 1960-62 and 1988-92 Japan males
0.0
200.0
400.0
600.0
800.0
0 10 20 30 40 50 60 70 80
Age
Inci
den
ce p
er 1
00 0
00
JapLungM60-62
JapLungM88-92
Fig. 6. Examples of time and place differences in age-patterns of the cancer incidence rate for today’s most prevalent sites (Aksel and Dvoirin 1991, IARC 1965-1997).
Lung cancer incidence rate in 1960-62 and 1988-92 The USA (Connecticut), by sex
0
200
400
600
800
0 10 20 30 40 50 60 70 80Age
Inci
denc
e p
er 1
000
00
Lung M88-92
Lung F88-92
Lung M60-62
Lung F60-62
Breast cancer incidence per 100 000 women,Russia (Moscow) 1967, 1987
0
20
40
60
80
100
120
140
160
180
5 25 45 65 85Age
1987
1967
Breast cancer incidence per 100 000 women,Russia (Moscow) 1987, the UK 1989
0
50
100
150
200
250
300
5 25 45 65 85Age
Mos1987UK 1989

34
Cancer incidence rate for all sites combined The USA, 1988-92
0
1000
2000
3000
4000
5000
0 10 20 30 40 50 60 70 80 Age (years)
Inci
denc
e pe
r 10
0 00
0
Male
Female
Fig. 7. Cancer incidence rate for all sites combined in the USA (1988-92), average annual (IARC 1997).
a. All ages
0
10
20
0 5 10 15 20
Age (years)
Inci
denc
e pe
r 10
0 00
0
MaleFemale
Cancer incidence rate for all sites combined The USA, 1988-92
b. Children and teens
Cancer incidence rate in different male cohorts, Japan (Miyagi)
0
1000
2000
3000
50 55 60 65 70 75 80 85Age
Inci
de
nce
pe
r 10
0 0
00
189419041909
Fig. 8. Cancer incidence rate in different birth cohorts of Japanese men. The cohort rate is restored from period data for 1971-1997 (IARC 1965–1997). The rate decelerates (or decreases) with advanced age for all birth cohorts.

35
Cancer incidence and mortality rates for all sites and both sexes combined, the USA
0
1000
2000
3000
4000
0 10 20 30 40 50 60 70 80 90 100
Age (years)
Cas
es p
er 1
00 0
00
MortalityIncidence
Fig. 9. Cancer incidence rate (1988-92), average annual, and mortality rate (1990) in the USA (combined from sources: IARC 1997, Health US 1996-1997, Smith 1996, 1999).
0
5
10
15
20
25
30
35
40
45
Pulm
. Em
bolis
m
Pulm
. Ede
ma
Pneu
mon
ia
Sene
scen
ce
Mio
car.
Infa
rct
Athe
rosc
lero
sis
Can
cer
Causes of death at old age (% of all cases)
65-74
97-106
Fig. 10. Causes of death in the oldest old (97-106) in comparison with a younger group (65-74) (Bordin 1999).

36
Fig. 11. Age-standardized incidence and mortality rates for all cancer sites combined in 1990. A comparison between more and less developed countries, by sex (GLOBOCAN 1998).
400 300 200 100 0 100 200 300 400
India
Western Africa
Thailand
Less developed regions
Mongolia
China
Colombia
Japan
Russian Federation
Germany
More developed regions
United Kingdom
Denmark
Australia
United States of America
Incidence v. Mortality
ASR (World), per 100,000 (All ages)
incidence Fmortality Fincidence Mmortality M
Males Females
Fig. 12 (1). Age-specific cancer incidence rate (all sites but skin) for males, 1988-92, average annual. Males. Acomparison between more and less developed countries (IARC 1997).
0 20 40 60 80 1000
1000
2000
3000
4000
5000
Cancer incidence rate, 1988-92, males
Age
Inci
denc
e pe
r 10
0,00
0
Colombia
West Germany
China
The USA
Ecuador
The UK

37
Fig. 12 (2). Age-specific cancer incidence rate (all sites, but skin), 1988-92, average annual. Females. Acomparison between more and less developed countries (IARC 1997).
0 20 40 60 80 0
500
1000
1500
2000 Cancer incidence rate, 1988-92, females
Age
Inci
denc
e pe
r 10
0,00
0
India Thailand Belarus Denmark Sweden Australia
Fig. 13. Age-specific cancer incidence rate (all sites but skin), 1988-92, average annual. Intermediatelydeveloped regions in comparison with more and less developed ones (IARC 1997).
0 20 40 60 800
500
1000
1500
2000
2500
3000
3500
4000Cancer incidence rates, 1988-92, males
Age
Inci
denc
e pe
r 10
0,00
0
CanadaThailand
East Germany PolandYugoslavia

38
Fig. 14. Age-specific cancer incidence rate (all sites combined) by ethnicity and place, 1988-92, average annual (IARC 1997). Economic development produces more differences in age-patterns of cancer risk than ethnicity or climate.
0 20 40 60 800
1000
2000
3000
4000
5000Cancer incidence rate, 1988-92, males
Age
Inci
denc
e pe
r 10
0000
East GermanyWest GermanyAustralia
80 60 40 20 0 20 40 60 80 Thyroid
NasopharynMultiple myeloma Hodgkin's disease Testis Melanoma of skin Brain, nervous system Other Pharynx Pancreas Kidney/etc.
Leukaemia Larynx Non-Hodgkin lymphoma Oral cavity Oesophagus Bladder Liver Colon/Rectum Prostate Stomach Lung
Incidence: ASR (World) per 100 000 (All ages)
Males
More developed regions Less developed regions
Fig. 15 (1). Age-standardized incidence rates for separate cancer sites in 1990. More developed regions in comparison with less developed ones, males (GLOBOCAN 1998).

39
Kidney, etc.
Bladder
Larynx
Other cancers
Non-Hodgkin lympomia
Lung
Stomach
Prostate
Colon/Rectum
More developed regionsMales, age 15-65+
New cancers: 2,091,422
Cervix uteri
Ovary etc.
Pancreas
Other cancers
Corpus uteri
Breast
Stomach
Colon/Rectum
Lung
More developed regionsFemales, age 15-65+
New cancers: 1,867,749
Oral cavity
Prostate
Bladder
Other cancers
Colon/Rectum
Lung
Oesophagus
Stomach
Liver
Less developed regionsMales, age 15-65+
New cancers: 2,109,178
Oesophagus
Liver
Ovary etc.
Other cancers
Lung
Breast
Colon/Rectum
Cervix uteri
Stomach
Less developed regionsFemales, age 15-65+
New cancers: 1,851,248
Fig. 16. Most common adult cancers in more and less developed regions in 1990 (GLOBOCAN 1998). Male lung and female breast cancers are the most common cancer sites in both more and less developed regions. However, the next two most common sites are different in these regions for each sex.
Fig. 15 (2). Age-standardized incidence rates for separate cancer sites in 1990. More developed regions in comparison with less developed ones, females (GLOBOCAN 1998).
6 5 4 3 2 1 0 1 2 3 4 5 6
NasopharynOther
LarynHodgkin's Multiple
BladdeOral
Kidney, Brain, nervous
ThyroiMelanoma of
PancreaOesophagu
Non-Hodgkin Leukaemi
LiveCorpus Ovary,
LunStomac
Cervix Colon/Rectu
Breas
Incidence: ASR (World) per 100 000 (all ages)
Females
More developed regions Less developed regions

40
Fig. 17. Cancer incidence rate , age-standardized (ASR), in more and less developed countries at different years (Health for all 2000). Overall rate is higher in more developed countries (UK, Sweden, Denmark) than in less developed ones (Russia, Kazakhstan), and has increased over time.
150
200
250
300
350
400
450
500
550
600
1970 1975 1980 1985 1990 1995 2000
Denmark Kazakhstan Russia
Sweden United Kingdom
Age-standardized cancer incidence rate (ASR), all sites (incidence per 100 000)

41
Fig. 18 (1). Overall cancer incidence rate in the United States, 1960-62 and 1988-92 (average annual), by sex (IARC 1965-1997). The rate increased over time both for males and females, beginning approximately at 50 years of age.
Cancer incidence rate in the USA (Connecticut), 1960-62 and 1988-92
0.0
1500.0
3000.0
4500.0
0 5 10 15 20 25 30 35 40 45 50 55 60 65 70 75 80 85
Age
Inci
den
ce p
er 1
00 0
00US 60 MUS 60 FUS 88 MUS 88 F
Cancer incidence rate ratio: 1988-92 / 1960-62, USA (Connecticut), males and females.
0
1
2
3
0 10 20 30 40 50 60 70 80
Age
Inci
denc
e ra
te
ratio
US 88/60 MUS 88/60 F
Fig. 18(2). Cancer incidence rate ratio 1988-92 to 1960-62 in the United States (IARC1965-1997). The rate increased over time largely at ages 20-40, and above age 50. The relative increase does not show a substantial sex difference.

42
Fig. 19(1). Cancer Incidence rate in Japan 1962-64 and 1988-92, by sex (IARC 1965-1997). The rate increased over time both for males and females, beginning approximately at 35 years of age.
Cancer incidence rate in Japan, 1962-64 and 1988-92
0
1000
2000
3000
0 5 10 15 20 25 30 35 40 45 50 55 60 65 70 75 80 85
Age
Inci
denc
e p
er 1
00 0
00
Jap M 62Jap F 62Jap M 88Jap F 88
Fig. 19(2). Cancer incidence rate ratio 1988-92 to 1962-64 in Japan (IARC 1965-1997). The rate increased over time at ages 0-9, and after age 35. The relative increase seems to be higher for males than for females at old ages.
Cancer incidence rate ratio: 1988-92 / 1962-64, Japan (Miyagi), males and females.
0
1
2
3
0 10 20 30 40 50 60 70 80Age
Inci
denc
e ra
te r
atio
Jap 88/62 MJap 88/62 F

43
Fig. 20. Changes in period (cross-sectional) overall cancer incidence rate in the United States 1975-1994
(adapted from Dinse et al. 1999).
40 50 60 70 80 90 1000
1000
2000
3000
4000
White
Age
Inci
denc
e pe
r 10
0 00
0
1990-941985-891980-841975-79
1990-941985-891980-841975-79
Males
Females
Cancer icidence rates in male cohorts, Japan
0
1000
2000
3000
0 5 10 15 20 25 30 35 40 45 50 55 60 65 70 75 80 85
Age
Inci
denc
e pe
r 10
0 00
0
1899M
1909M
1919M
1929M
1939M
Fig. 21. Overall cancer incidence rate in different male cohorts in Japan (IARC1965-1997). One can see that the rate increased in successive generations of Japanese men.

44
Fig. 22. Change in cervical cancer incidence rate, age-standardized (ASR), in more and less developed countries over time (Health for all 2000). Until recently, the rate declined in all countries compared.
10
12
14
16
18
20
22
24
1970 1975 1980 1985 1990 1995 2000
Denmark Kazakhstan Russia
Sweden United Kingdom
Age-standardized cancer incidence rate (ASR), Cervix uteri (incidence per 100 000)
Fig. 23. The ratio of cancer mortality to the cancer incidence rate at different time periods in the UK (IARC 1965-1997,EUCAN 1999). The ratio decreased over time. It is higher for males than for females at all ages except old ages.
Ratio of cancer mortality to the incidence rate in the UK, 1963-66 and 1996, males
0
0.2
0.4
0.6
0.8
1
25 35 45 55 65 75Age
Mor/Inc M63Mor/Inc M96
Ratio of cancer mortality to the incidence rate in the UK, 1963-66 and 1996, females
0
0.2
0.4
0.6
0.8
1
25 35 45 55 65 75Age
Mor/Inc F63Mor/Inc F96
0
0.2
0.4
0.6
0.8
1
25 35 45 55 65 75Age
Mor/Inc M63Mor/Inc F63
Ratio of cancer mortality to the incidence rate in the UK, 1963-66, males and females
Ratio of cancer mortality to the incidence rate in the UK, 1996, males and females
0
0.2
0.4
0.6
0.8
1
25 35 45 55 65 75Age
Mor/Inc M96Mor/Inc F96

45
150
200
250
300
350
400
450
500
550
600
1970 1975 1980 1985 1990 1995 2000
Denmark Kazakhstan Russia
Sweden United Kingdom
Age-standardized cancer incidence rate (ASR), all sites (rate per 100 000)
150
160
170
180
190
200
210
220
230
240
1970 1975 1980 1985 1990 1995 2000
Age-standardized death rate (SDR), malignant neoplasms (rate per 100 000)
Fig. 24(1). Cancer incidence rate overtime and place (ASR) (Health for all2000). The overall rate is higher inmore developed countries (UK,Sweden, Denmark) than in lessdeveloped ones (Russia, Kazakhstan).The cancer risk increased in moredeveloped countries until recently. Inless developed countries the increasecontinues.
Fig. 24(2). Cancer mortality rate overtime and place (SDR) (Health for all2000). A decrease in cancer mortalityin Sweden has been observedbeginning from 1976. In othercountries this decrease occurredapprox.15 years later. The highcancer risk in Sweden (Fig. 25 (1)) isaccompanied by lowest cancermortality. This fact reflects thehighest in EU survival of cancerpatients in Sweden.
Fig. 25(2). Breast cancer mortality SDR)over time and place (Health for all 2000).The mortality is higher in moredeveloped countries. However,convergent time trends may change thissituation soon. The rates increase inRussia and Kazakhstan but decline inSweden and UK. An interpretation ofthese trends should take into accountsignificant differences in survival frombreast cancer between more and lessdeveloped regions.10
15
20
25
30
35
40
45
1970 1975 1980 1985 1990 1995 2000
Standardized death rates (SDR) from female breast cancer (rate per 100000)
0
20
40
60
80
100
120
140
1970 1975 1980 1985 1990 1995 2000
Denmark Kazakhstan Russia
Sweden United Kingdom
Female breast cancer incidence per 100000 (ASR)
Fig. 25(1). Breast cancer incidence rate(ASR) over time and place (Health forall 2000). The rate is higher in moredeveloped countries (UK, Sweden,Denmark) than in less developed ones(Russia and Kazakhstan). The increasein the rate appeared earlier in moredeveloped countries than in lessdeveloped ones.

46
Country #UK 1Denmark 2Italy 3Netherlands 4Finland 5Germany 6Spain 7France 8Austria 9Sweden 10
Fig. 26. Survival of cancer patients in EU countries in 1996, both sexes and all sites combined (EUCAN 1999).
Five-year survival f rom cancer in countries of the E U, both sexes
25
35
45
55
0 1 2 3 4 5 6 7 8 9 10 11Country
Sur
vivo
rs (
%)
EU Surv Mean