economic review - kansas city fed
TRANSCRIPT

ECONOMIC REVIEWFederal Reserve Bank of Kansas City1 Memorial DriveKansas City, Missouri 64198-0001Special Issue 2018 FEDERAL RESERVE BANK OF KANSAS CITY
ECONOMICREVIEW
Special Issue 2018 Agriculture in a
Global Economy
Exploring the Economic Impact of Changing Climate Conditions and Trade Policies on Agricultural Trade:A CGE Analysis
The Business Merits of Agricultural Trade
Agriculture and International Labor Flows
Agrifood Foreign Direct Investment and Waves of Globalization of Emerging Markets: Lessons for U.S. Firms
EC
ON
OM
IC R
EV
IEW
FE
DE
RA
L RE
SER
VE
BA
NK
OF K
AN
SAS C
ITY
SPEC
IAL ISSU
E 2018

FEDERAL RESERVE BANK OF KANSAS CITY
ECONOMICREVIEW
Special Issue 2018 Agriculture in a Global Economy
Foreword 3By Esther L. George
Exploring the Economic Impact of Changing Climate 5 Conditions and Trade Policies on Agricultural Trade: A CGE Analysis By Eddy Bekkers and Lee Ann Jackson The Business Merits of Agricultural Trade 27 By Michael A. Boland
Agriculture and International Labor Flows 55By Philip Martin
Agrifood Foreign Direct Investment and Waves of 75 Globalization of Emerging Markets: Lessons for U.S. FirmsBy Titus Awokuse and Thomas Reardon


The global marketplace has a longstanding and well-established role in the agribusiness economy. Today, amid growing popula-tions and rising incomes, international relationships have taken
on even greater prominence. Meanwhile, the scope of trade has ex-panded. It is not only farm products that move between nations, but also capital and labor that now cross international borders, creating an increasingly global agricultural dynamic.
Over the summer months, the world saw the emergence of some uncertainty among significant agricultural trading partners. These de-velopments pushed the prices of several major agricultural commodi-ties sharply lower, affecting global food prices and also potentially rais-ing questions about economic growth and the future prospects for the movement of capital and labor in an international context.
On July 17 and 18, the Federal Reserve Bank of Kansas City hosted a symposium, “Agriculture in a Global Economy,” to explore the ways in which agriculture is positioned as a global industry and the implica-tions of this global connectedness in the years ahead. The articles in this issue are from this symposium, and it is my hope that the insights they provide will help inform business and policy decisions made in the context of our global agricultural economy.
Esther L. GeorgePresident and Chief Executive OfficerFederal Reserve Bank of Kansas City
Foreword


Agricultural trade will play a significant role in the future con-tribution of the agriculture sector to local and global economic outcomes, including economic growth, rural employment, and
food prices. Trade outcomes will be affected by changes in production that result from productivity effects associated with climate change. In addition, government intervention in markets may also have signifi-cant effects, both on production incentives for farmers and, ultimately, on the competitive conditions in international markets. This paper ex-plores the ways in which changing global agricultural productivity and policy patterns affect economic outcomes.
In the face of expected increased temperature stresses, variable wa-ter availability, limits to arable land and continued population growth, debates about how to ensure global food supply will meet future de-mand are intensifying. In the future, changing climate conditions may alter the relative productivity of regional agricultural production and, as a result, affect the trading patterns. Trade can play an important role in enabling products to move to areas of shortage. At the same
Exploring the Economic Impact of Changing Climate Conditions and Trade Policies on Agricultural Trade: A CGE Analysis By Eddy Bekkers and Lee Ann Jackson
Eddy Bekkers is a research economist at the World Trade Organization. Lee Ann Jack-son is a counsellor in the agriculture and commodities division of the World Trade Organization and secretary to the Committee on Agriculture. The opinions expressed are those of the authors and are not meant to represent the positions or opinions of the WTO, the Federal Reserve Bank of Kansas City, or the Federal Reserve System. This article is on the bank’s website at www.KansasCityFed.org
5

6 FEDERAL RESERVE BANK OF KANSAS CITY
time, the trading system is also affected by direct and indirect policy interventions. Policy decisions related to public support for agriculture and trade policies will influence outcomes by affecting the decisions of farmers, consumers, and traders and by altering the relative competi-tiveness of products on the marketplace.
Complex global models are increasingly being used to understand how economic and agricultural systems interact. Purely biophysical models are likely to underestimate the shifting between crops that occurs due to farmers’ responses to changes in land and crop prices. However, models that ignore biophysical relationships and focus mainly on eco-nomic responses may overestimate the importance of price changes (Bal-dos and Hertel 2013). The challenge is to develop models that capture the essential relationships of both natural systems and economic systems while incorporating links between the two. Some authors examine these relationships by focusing on the natural resource endowments of coun-tries or regions (see for example, Anderson and Strutt 2014).
Economic models are being extended to incorporate different types of land so that they reflect land use choices, particularly the conver-sion of forest into agricultural land (Gouel and Laborde 2018; FAO 2017). The heterogeneity of land within countries—and its influence on the way climate change affects land use—has also received a lot of attention (see for example, Ahammad and others 2015; Nelson and others 2013). The analysis in this paper is based on a largely economic model that includes differentiated land uses, allowing some aspects of the biophysical constraints to be reflected in the results. In particular, the model allows for limited possibilities to transform forest land into agricultural land and crop land into grazing land (and vice versa), with the total supply of land highly inelastic. This extension of the model is essential to evaluate the effects of climate change on the global distribu-tion of agricultural production.
This paper focuses on the specific question of how trading relation-ships and climate change effects interact to determine trade patterns over time. Time lags associated with the effect of policy decisions are also important in terms of how agricultural and economic systems ad-just to changing environmental and economic conditions. Some policy decisions, such as investments in research and development, will have longer-term effects on agricultural productivity and resulting compara-

ECONOMIC REVIEW • SPECIAL ISSUE 2018 7
tive advantages. Other decisions, such as the imposition of tariffs, will have immediate economic effects and may also have lingering effects once tariffs are removed. Long-term scenario studies of agriculture have become increasingly important to understanding the trade-offs inher-ent in policy decisions and the current and future effects that result from these changes.
In this paper, we explore the potential effect of climate-change-related productivity growth and trade costs on global economic out-comes, including exports and imports, import dependency, and export market concentration. Using simulations from a dynamic computable general equilibrium (CGE) model, we first examine the outcomes of a baseline projection of the global economy until 2040 without addi-tional policy shocks. Then, under two scenarios, we examine how the baseline results would change as a result of shocks to the productivity growth of agricultural crops due to climate change and as a result of increases in global trade costs.
This modeling exercise is useful in several ways. First, results from this general equilibrium model reflect systemic interactions and capture the indirect, as well as direct, outcomes of policy choices. Second, be-cause the model is computable, the scenario results provide additional insight into the size and direction of changes over time. Third, dynamic CGE modeling allows analysts to look at the expected effects of climate change and trade policies on future trading patterns.
Section I describes the model of the global economy that we use for our simulations and the underlying data. Section II outlines the base-line projections and the experiments that we implement to highlight how trade policy enables or inhibits products to move within the global trading system and how these affect different parts of the economy. Sec-tion III discusses the results of our simulations.
I. Economic Model and Baseline Data
We conduct our analysis with the WTO Global Trade Model (GTM), a recursive dynamic CGE model based on version 7 of the Global Trade Analysis Project (GTAP) model. The model features multiple sectors, multiple factors of production, intermediate linkag-es, multiple types of demand (private demand, government demand, investment demand, and intermediate demand by firms), nonhomo-

8 FEDERAL RESERVE BANK OF KANSAS CITY
thetic preferences for private households, a host of taxes, and a global transport sector. Each region has a representative agent collecting factor income and tax revenues and spending them under utility maximiza-tion on private consumption, government consumption, and savings. Firms display profit-maximizing behavior, choosing the optimal mix of factor inputs and intermediate inputs. Savings are allocated to invest-ment in different regions. A more detailed description of the model can be found in Aguiar and others (forthcoming).
The GTM is calibrated to the current GTAP database, which has 141 regions and 57 sectors, and contains additional features such as en-dogenous capital accumulation and isoelastic factor supply of land and natural resources. The baseline projections of this model will include changes in geographical patterns of net exports and patterns of growth in different crops. All parameters other than those related to the supply functions of land and natural resources are set at standard values pro-vided by the GTAP 109.2 database.
For the sake of computational efficiency—and to focus the analyti-cal results—we use an aggregation of the GTAP data that focuses on 26 sectors, 15 regions, and five factors of production (see Table 1). The sec-toral aggregation includes the sectors of interest related to agricultural trade as well as a disaggregation of certain commodity crops.
Changes in agricultural production over time can result from shifts in land use or improvements in yields. As the climate shifts and the location of production changes, agricultural productivity may face new limitations. To account for this, the model incorporates a nested struc-ture for land allocation that allows for shifts in land use for forest, crop, and livestock production. In this structure, agricultural land can be ex-panded by reducing the amount of forest land. We extend the model with a nested structure for the allocation of land across sectors, follow-ing Hertel and others (2008). In particular, the model allocates the total amount of land across forest or across agricultural sectors according to an elasticity of transformation function. Agricultural land, in turn, can be allocated across crops or across livestock. And crop land, in turn, can be allocated across different crops with an elasticity of transformation function, whereas grassland is a homogeneous good used in the differ-ent livestock sectors. We follow Hertel and others (2008) and set the elasticities of transformation between forest and agriculture, crops and livestock, and different types of crops at 0.25, 0.5, and 1, respectively.

ECONOMIC REVIEW • SPECIAL ISSUE 2018 9
Regions Sectors
Other developed countries Crops
Other Asian countries Paddy rice
Japan Wheat
China Cereal grains nec
India Vegetables, fruit, nuts
ASEAN Oil seeds
Canada Sugar cane, sugar beet
North America Plant-based fibers
Mexico Crops nec
Brazil Livestock
Latin America and Caribbean Cattle, sheep, goats, horses
European Union 28 Animal products nec
Middle East and North Africa Raw milk
Sub-Saharan Africa Wool, silk-worm cocoons
Rest of world Resource extraction
Forestry
Fishing
Coal
Processed food
Meat: cattle, sheep, goats, horses
Meat products nec
Vegetable oils and fats
Dairy products
Processed rice
Sugar
Food products nec
Beverages and tobacco products
Other
Textiles
Other manufactures
Services
Table 1Overview of Regions and Sectors
Unlike Hertel and others (2008), we do not model different agri-eco-logical zones within each region.
As usual with CGE projections, there are a few necessary quali-fications to keep in mind. First, CGE models allow researchers to conduct thought experiments about what the world would be like

10 FEDERAL RESERVE BANK OF KANSAS CITY
if certain changes occurred. The results should not be interpreted as unconditional predictions, since they cannot control for many un-known factors that could change. Moreover, the results are sensitive to assumptions about base parameters and underlying model structure.
Second, while the model described here aggregates sectors to allow for a more detailed examination of crops within the agriculture sector, the aggregation does not include biofuels as a subsector for analysis. New biofuel mandates and subsidies could have effects on international food prices, and these effects could increase depending on mandates in the United States and the European Union. Changes to the fossil fuel economy, including the potential expansion of alternatives to fossil fu-els, could lead to the removal of biofuel mandates. Including biofuel in the model’s structure would likely lead to different results for products like sugar and corn. However, the inclusion of biofuels would require modeling the interaction between fuel and food markets in more detail and is out of the scope of this exercise. Furthermore, other work shows that the effect of biofuel targets on food prices is limited (Delzeit and others 2018).
Third, this model does not include tariff quotas explicitly in its analysis of constraints on trade. In this model, the changes in tariffs are used to capture market access barriers. Given the prevalence of tariff quotas in the agriculture sector, the exclusion of these policy measures could mean that our simulations underestimate the potential effects of the trade policy and climate shocks on trade outcomes.
Fourth, assumptions about agricultural productivity growth play an important role in the results generated through model simulations. As noted previously, the underlying parameters for agricultural produc-tivity growth in the model follow average productivity growth; this has implications for the results, particularly those related to price trends.
II. Design of Dynamic Projections
Before exploring the effect of rising trade costs and climate change on global agricultural trade, we first construct a baseline scenario for the world economy. We start the simulations in 2014 based on the lat-est release of GTAP, GTAP 10.2. Following standard approaches, we construct a baseline using projections on growth in GDP per capita, population, the labor force, and skills to discipline our trajectory of the

ECONOMIC REVIEW • SPECIAL ISSUE 2018 11
world economy until 2040. The growth in population, the labor force, and skills are imposed on the projections, and GDP per capita growth is targeted by endogenizing noncapital-augmenting productivity growth, while allowing for endogenous capital accumulation based on recursive dynamics. GDP per capita growth is based on the Organisation for Economic Co-operation and Development (OECD) Shared Socioeco-nomic Pathways projections, SSP2 (Dellink and others 2017). Popula-tion and labor force growth come from the United Nations population projections, medium variant for 2015 (UN Department of Economic and Social Affairs 2015). Changes in the number of skilled and un-skilled workers are inferred from projections on education levels by the International Institute for Applied Systems Analysis (IIASA) (KC and Lutz 2017). The changes in the share of tertiary-educated individuals are used as a proxy for changes in the share of skilled workers.
Besides these standard features of projections in dynamic CGE models, we model three additional dynamics. First, we allow for chang-es in the preference parameters as countries grow richer, so that income elasticities change over time with a country’s level of income per capita. The income elasticities for consumption are particularly important, be-cause they allow the model to capture the effect of rising incomes on agriculture consumption. Private consumption is modeled according to a constant difference elasticity (CDE) utility function, which displays little change over time in income elasticities as countries grow richer. We regress the parameter determining income elasticities on GDP per capita and impose the predicted changes on the model. As a result, income elasticities for agricultural goods fall as countries grow richer, whereas income elasticities for services rise.
Second, the model allows for differential productivity growth across sectors, based on empirical estimates employing both EU KLEMS and OECD-STAN total factor productivity data. The estimates im-ply higher productivity growth in manufacturing than in services. The estimates also predict higher-than-average productivity growth in agri-culture, which is in line with the literature on structural change (Her-rendorf, Rogerson, and Valentinyi 2013). However, the CGE literature tends to estimate productivity separately for the agricultural sectors (Ludena and others 2007; Fontagné, Fouré, and Ramos 2012), which implies a lower productivity growth in agriculture than in other sectors,

12 FEDERAL RESERVE BANK OF KANSAS CITY
especially in countries with high GDP growth. Higher than average productivity growth would imply falling real agricultural prices, whereas separate (lower than average) productivity estimates for the agricultural sectors would imply strongly rising prices. To take a middle ground between the two approaches, we assume that productivity growth in the agricultural sector follows average productivity growth.
Third, the domestic saving rates are targeted to the projections of the Centre d’Etudes Prospectives et d’Informations Internationales (CEPII) model Macroeconometrics of the Global Economy (MaGE) (Fontagne and others 2012). In this model, saving rates are determined by demographic development in a life-cycle framework. Saving rates stay virtually constant in the basic model, with savings a Cobb-Douglas share of national expenditures. Targeting the saving rates to the projec-tions from a macroeconomic model makes the model more realistic and also helps the model to get closer to a steady state with converging rates of return, given that the base year (2014) saving rates are too large for a steady state with constant rates of return, especially in countries such as China. Further details on the three extensions are in Bekkers and others (2018).
We examine the effect of two separate shocks, rising trade costs as a result of trade tensions and climate-induced productivity change, on geographical patterns of net exports (including import dependency and export concentration) and on patterns of growth for different ag-riculture crops. First, we explore the effect of a global increase in tar-iffs—based on the estimates of Nicita, Olarreaga, and Silva (2018)—on the size of noncooperative tariffs. We work with a scenario in which the tariffs rise by half the level predicted by Nicita, Olarreaga, and Sil-va (2018). Second, we examine the effect of climate change on crop productivity using the predicted changes in yield per hectare of the International Model for Policy Analysis of Agricultural Commodities and Trade (IMPACT) from the International Food Policy and Research Institute (IFPRI). These projections have also been employed in the comparison of different agricultural economic models in the Agricul-tural Model Intercomparison and Improvement Project (AgMIP) (Von Lampe and others 2014).

ECONOMIC REVIEW • SPECIAL ISSUE 2018 13
III. Results and Discussion
We project the GTM baseline for the world economy to provide a core baseline, assuming there are no climate-change-related productiv-ity effects and no changes in trade-related policies. As mentioned previ-ously, the baseline assumes that GDP per capita growth, population, la-bor force, and skills grow at exogenously set rates. Our core calibration results for the development of real crop prices are moderately higher than projections obtained by Anderson and Strutt (2014), who find that real international prices increased from 2007 to 2030 by about 2 percent. This can be attributed to differences in assumptions about productivity growth, as they assume that productivity growth is higher in the primary sectors than in manufacturing and services, whereas we assume that productivity growth in agriculture is smaller than in manu-facturing (as discussed previously).
Chart 1 illustrates the projected cumulative percentage change in average crop prices in the baseline scenario and in the two experiments. The chart shows that average crop prices fall moderately in the baseline by 0.5 percent over 25 years. The results from the two experiments show the same trend in prices, but the size of the effect differs. A hypo-thetical increase in global tariffs would reduce prices temporarily, but lead to a permanently lower price level, as the higher tariffs imposed in the experiment in 2019 would lead global demand for crops to fall. Climate change leads to higher global crop prices due to reductions in land-augmenting crop productivity. Globally, the effect from climate-change-induced productivity changes is modest, with crop prices in-creasing by 2.5 percent—about 3 percent more than in the baseline. The trend in real food prices over time, first declining and then rising, can be explained by the fact that land as a fixed production factor be-comes an increasing constraint over time on the expansion of agricul-tural production.
Additional charts in the appendix show the effect of the two experi-ments, higher tariffs and climate change, on the prices of crops, livestock, and processed food in different regions. The appendix charts make clear that the average picture—rising food prices as a result of climate change and falling prices as a result of higher tariffs—holds in most countries. A notable exception is the United States, where rising tariffs lead to higher producer prices of crops, livestock, and processed food.

14 FEDERAL RESERVE BANK OF KANSAS CITY
Global export shares of different commodities will also be affected by changes in GDP, population, the labor force, and sectoral produc-tivity. Table 2 highlights results for U.S. global export shares by com-modity. In the baseline, the U.S. global market share in agricultural commodities exports (excluding intraregional trade), both crops and livestock, remains relatively stable. This compares favorably to the de-cline in global market share in manufacturing and services exports over the baseline period. U.S. global export shares of wheat decrease more than other commodities in the baseline due to the increased export share in other regions such as Canada and the rest of the world (Russia and non-EU Eastern Europe).
The hypothetical increase in global tariffs would moderately reduce the United States’ market share in global agricultural commodities, though the reduction is much smaller than in manufacturing goods. Wheat, fruits and vegetables, livestock, and processed food are among the agriculture commodities that experience larger decreases in U.S. global export shares due to increased trade costs. China, ASEAN, and India pick up market share in these products.
Additional results on changes in market shares in all regions and all scenarios are displayed in appendix Charts A-3–A-6. Chart A-3 shows that the United States loses market share for crops but restores its share partially in the climate-change scenario. Chart A-4 shows that
Chart 1Percentage Change in Global Crop Prices under Different Scenarios
−12
−10
−8
−6
−4
−2
0
2
4
−12
−10
−8
−6
−4
−2
0
2
4
2015 2020 2025 2030 2035 2040
Baseline Tariffs Climate change
Percentage points Percentage points

ECONOMIC REVIEW • SPECIAL ISSUE 2018 15
the United States loses market share in processed food under the trade-cost scenario, whereas India gains market share. Chart A-6 makes clear that there is a relatively large change in the U.S. market share in manu-facturing goods from 2015 to 2040, which is even more pronounced under the trade-cost scenario. The changes seem an order of magnitude larger than the changes for agricultural goods and processed food.
Results from the climate-change scenario indicate that productiv-ity changes have a moderate effect on U.S. market shares in global ex-ports, though the U.S. share of crops picks up somewhat from about 20 percent to 20.5 percent. This slight pickup reflects the fact that climate change has more beneficial effects on crop productivity in more moderate climate zones. U.S. export shares in this scenario decrease slightly compared with the baseline results for livestock, reflecting the growth of livestock production in regions with available grazing land. Regions losing export market share are India, Other Asia, and Latin America (only slightly).
Another way to analyze the trade effects of these different sce-narios is to examine the change in export market concentration. The Herfindahl-Hirschman index (HHI) is a common measure of market concentration used to determine market competitiveness. The index
Table 2Share of U.S. Exports in Global Exports for Different Commodities
Initial (percent)
Baseline (percent)
Trade costs (percent)
Climate change (percent)
Sectors 2015 2040 2040 2040
Agriculture 20.50 19.12 18.39 19.67
Crops 21.40 19.87 19.20 20.49
Wheat 19.36 15.14 14.40 16.04
Other grains 35.16 32.72 31.77 32.72
Vegetables and fruits 15.29 13.40 12.89 13.72
Oil seeds 34.12 31.68 29.10 32.71
Plant fibers 26.05 21.42 20.02 22.16
Livestock 12.92 13.30 12.24 13.21
Processed food 12.62 10.98 8.46 11.05
Manufactures 12.08 9.54 6.76 9.49
Services 14.39 12.74 10.74 12.68
16 FEDERAL RESERVE BANK OF KANSAS CITY
can take values ranging from 0 to 1, with increases in the HHI generally indicating a decrease in competition and an increase in market power.
Table 3 displays HHIs for the 15 exporting regions (excluding intra-regional trade). For agricultural products, the index ranges from 0.099 for processed foods to 0.23 for oil seeds in the 2040 baseline. For manu-facturing and services, the baseline indexes are 0.134 and 0.126, respec-tively. The baseline results show that despite the reallocation of market shares, export market concentration for agricultural commodities is not expected to change much over time. As a comparison, export concentra-tion in the manufacturing sectors is expected to rise from 0.128 to 0.134, which can be explained by the continuing increase in China’s market share. A hypothetical increase in tariffs would lead to a moderate fall in the HHI for most agricultural products, implying that exports would become less concentrated.
Table 4 shows the share of exports to different destinations (as a share of total U.S. exports) in the model’s baseline results. For agricul-tural commodities, the share of exports to Chinese and African markets are expected to rise, whereas the share of exports to European and Japa-nese markets are expected to fall.
Regional differences in GDP growth and agricultural productivity mean that trade among countries will differ substantially in 2040. Asian developing economies will account for larger shares of U.S. exports of many agricultural commodities. For example, Table 4 illustrates the im-portance of the Chinese market for oil seeds from the United States. The simulations also indicate the large and increasing importance of China as a destination for U.S. livestock. Absent policy changes, the share of livestock exports to China is expected to rise further. According to the baseline projections, ASEAN economies will be increasingly important markets for U.S. wheat and plant fibers. Specifically, the share of wheat exports to ASEAN countries are expected to increase from around 17 percent in 2015 to around 22 percent in 2040, while the share of plant fiber exports are expected to increase from around 21 percent in 2015 to around 26 percent in 2040.
Table 5 shows results for the baseline simulations on changes to import dependency (the share of imports in total demand) from 2015 to 2040 for different sectors and commodities. The regions with the lowest import dependency on agriculture include India (expected to

ECONOMIC REVIEW • SPECIAL ISSUE 2018 17
Table 3Herfindahl-Hirschman Index of Regional Export Shares for Different Commodities
Initial Baseline Trade costs Climate change
Sectors 2015 2040 2040 2040
Agriculture 0.101 0.099 0.097 0.101
Crops 0.106 0.104 0.101 0.105
Wheat 0.177 0.163 0.155 0.173
Other grains 0.197 0.184 0.181 0.185
Vegetables and fruits 0.108 0.107 0.107 0.108
Oil seeds 0.238 0.230 0.227 0.229
Plant fibers 0.148 0.158 0.160 0.150
Livestock 0.122 0.132 0.134 0.133
Processed food 0.107 0.099 0.099 0.099
Manufactures 0.128 0.134 0.142 0.133
Services 0.149 0.126 0.112 0.126
fall slightly from 2.45 in 2015 to 2.10 in 2040) and Latin America (expected to fall from 8.21 in 2015 to 7.82 in 2040). In contrast, the regions with the highest import dependency on agriculture include the EU (expected to decrease from 31.59 in 2015 to 30.32 in 2040) and Canada (expected to decrease from 33.19 to 29.79 in 2040). Import dependency in the United States is not expected to change substantially for the different commodities examined here. Import dependency is expected to be stable for most other countries as well, though Canada is expected to see a slight reduction in import dependency, and Other Asia is expected to see a slight increase.
Chart 2 displays the cumulative effect of the two experiments, an increase in trade costs and changes in crop productivity due to climate change, on welfare. The table makes clear that most countries lose con-siderably with rising tariffs (up to almost 5 percent for Mexico and Other Asia). The small improvement for the United States is due to the standard terms of trade effects: imposing higher tariffs reduces world demand for goods imported by the United States, thus improving the terms of trade. The effect of climate-change-related changes in crop productivity on welfare is more moderate, with the most affected re-gions being India and Other Asia. However, these small effects should

18 FEDERAL RESERVE BANK OF KANSAS CITY
Tabl
e 4
Shar
e of
Des
tina
tion
Mar
kets
in U
.S. E
xpor
ts fo
r V
ario
us C
omm
odit
ies
Sect
orYe
arO
ther
Asia
(p
erce
nt)
Japa
n (p
erce
nt)
Chi
na
(per
cent
)In
dia
(per
cent
)AS
EAN
(p
erce
nt)
Can
ada
(per
cent
)M
exic
o (p
erce
nt)
LAC
(p
erce
nt)
EU
(per
cent
)M
ENA
(per
cent
)SS
A (p
erce
nt)
Agric
ultu
re20
159.
268.
3228
.32
1.25
7.37
8.00
10.4
37.
488.
836.
651.
60
2040
10.6
64.
9036
.57
1.12
8.38
5.37
9.22
6.58
5.55
7.32
2.22
Cro
ps20
158.
888.
7527
.86
1.32
7.55
7.67
10.4
37.
778.
676.
991.
69
2040
10.6
64.
9036
.57
1.12
8.38
5.37
9.22
6.58
5.55
7.32
2.22
Whe
at20
159.
8811
.24
2.29
0.00
17.4
70.
2410
.97
17.9
72.
855.
6312
.22
2040
12.3
76.
971.
670.
0022
.16
0.20
9.17
15.3
71.
595.
5317
.68
Oth
er g
rain
s20
1512
.15
21.5
112
.25
0.00
1.23
3.04
18.5
418
.97
2.58
8.52
0.78
2040
14.6
515
.12
14.1
20.
001.
352.
6617
.76
20.0
42.
1710
.60
1.08
Vege
tabl
es
and
fruits
2015
11.2
75.
642.
985.
245.
6826
.69
8.08
3.43
19.7
76.
930.
61
2040
16.6
23.
884.
325.
796.
4821
.06
9.52
2.92
14.9
49.
560.
93
Oil
seed
s20
154.
753.
8660
.34
0.00
7.17
1.66
7.73
1.40
8.16
3.98
0.02
2040
3.97
1.76
70.7
70.
006.
551.
085.
971.
044.
403.
720.
02
Plan
t fibe
rs20
1511
.69
1.26
25.1
92.
0321
.41
0.06
9.20
7.05
0.96
20.5
90.
02
2040
11.5
70.
5522
.56
2.01
26.1
20.
047.
496.
540.
5622
.11
0.03
Live
stock
2015
14.5
02.
2834
.78
0.27
4.83
12.6
210
.46
3.48
10.9
91.
920.
36
2040
15.7
71.
2842
.50
0.18
5.75
9.14
9.07
2.98
7.47
2.11
0.52

ECONOMIC REVIEW • SPECIAL ISSUE 2018 19
Tabl
e 5
Impo
rt D
epen
denc
y: T
he S
hare
of I
mpo
rts
in D
eman
d
Sect
orYe
arO
ther
Asia
(p
erce
nt)
Japa
n (p
erce
nt)
Chi
na
(per
cent
)In
dia
(per
cent
)AS
EAN
(p
erce
nt)
Can
ada
(per
cent
)U
SA
(per
cent
)LA
C
(per
cent
)EU
(p
erce
nt)
MEN
A (p
erce
nt)
SSA
(per
cent
)
Agric
ultu
re20
1520
.21
22.4
16.
952.
4513
.60
33.1
913
.00
8.21
31.5
919
.95
3.23
2040
22.0
523
.41
7.44
2.10
14.9
029
.79
12.4
87.
8230
.32
21.2
93.
74
Cro
ps20
1524
.37
27.3
29.
043.
1315
.46
50.3
420
.18
11.8
245
.51
23.7
53.
41
2040
28.2
329
.25
10.3
62.
7417
.47
46.7
119
.72
11.7
345
.40
26.1
34.
06
Whe
at20
1526
.39
87.1
81.
970.
0498
.94
84.6
615
.93
46.1
030
.07
36.1
472
.15
2040
42.9
988
.76
1.08
0.02
98.9
482
.63
18.7
843
.49
30.7
339
.71
69.0
9
Oth
er
grai
ns20
1584
.39
95.8
46.
330.
1530
.55
15.7
92.
6525
.91
28.4
637
.02
1.48
2040
83.5
695
.97
4.71
0.15
27.9
215
.04
2.61
26.0
928
.77
38.9
91.
54
Vege
tabl
es
and
fruits
2015
20.1
913
.19
2.26
6.50
15.5
081
.31
39.7
87.
6460
.27
13.3
21.
67
2040
24.1
713
.99
2.54
6.10
16.2
080
.88
42.1
27.
3160
.22
15.0
01.
92
Oil
seed
s20
1554
.46
93.6
057
.28
0.91
15.4
315
.93
15.9
55.
5858
.08
39.9
21.
05
2040
60.8
493
.72
58.2
80.
8114
.84
15.2
616
.88
5.14
58.3
344
.09
1.25

20 FEDERAL RESERVE BANK OF KANSAS CITY
be interpreted with care for three reasons. First, climate change will have other economic effects on welfare—for example, on revenues in tourism areas, on labor productivity as a result of higher temperatures, and on production in coastal areas. Second, the effect of climate change is expected to accelerate in later years, with most climate change studies employing time horizons up to 2100. Third, the calculated effect repre-sents the average welfare effects in a country (on a representative agent). However, producers in specific sectors that depend heavily on crops, such as farmers, may be affected more severely.
IV. Conclusions
The simulations described in this paper provide insights into the potential effects of climate change and trade policies on future trading patterns and agricultural prices. Results from the baseline projections show crop prices falling moderately to the year 2040. The simulations indicate that climate change and the resulting productivity effects on agriculture lead to rising crop prices, on average. In contrast, policy changes that disrupt trade, modeled as increases in trade costs, lead to lower crop prices on average than those in the baseline due to reduced global demand for crops.
Chart 2
Change in Real Income (Welfare) in Response to Both Climate Change and Trade Cost Shocks
-5
-4
-3
-2
-1
0
1
-5
-4
-3
-2
-1
0
1
Other D
ev
Other A
siaJap
anChin
aIn
dia
ASEAN
Canad
aUSA
Mexi
co
Brazil
LAC
EU_28
MENA
SSA
Rest of
Worl
d
Climate change
Trade costs
Percentage points Percentage points

ECONOMIC REVIEW • SPECIAL ISSUE 2018 21
The model also provides some insights into the potential trade ef-fects for the United States. Baseline projections show the U.S. mar-ket share in agricultural trade rising slightly, while the market shares in manufacturing and services trade decrease slightly. The destination of U.S. exports also evolves over the baseline scenario, with developing Asian economies and Sub-Saharan Africa increasing their share of U.S. crop exports in 2040.
Taking into consideration the possibility of productivity changes due to climate change or economic effects due to increased tariffs, the modeling results highlight how outcomes may differ from the baseline. The climate-change scenario suggests that the United States’ share in global agricultural exports will moderately increase due to the more moderate climate in the United States. In contrast, the increased-tarriffs scenario shows that for most agricultural commodities, the U.S. share of global exports will fall below those projected in the baseline. Future research will examine the interaction between these two scenarios.

22 FEDERAL RESERVE BANK OF KANSAS CITY
Appendix Additional Charts and Tables
Chart A-1Cumulative Percentage Change in Food Prices for Different Regions as a Result of Higher Tariffs
Chart A-2Cumulative Percentage Change in Food Prices for Different Regions as a Result of Climate Change
Oth
er d
ev
Oth
er A
sia
Japa
n
Chi
na
Indi
a
ASEA
N
Can
ada
USA
Mex
ico
Braz
il
LAC
EU_2
8
MEN
A
SSA
Rest
of w
orld
Crops
Livestock
Procfood
10
4
2
0
−2
−4
−6
−8
8
6
10
4
2
0
−2
−4
−6
−8
8
6
Percentage points Percentage points
Oth
er d
ev
Oth
er A
sia
Japa
n
Chi
na
Indi
a
ASEA
N
Can
ada
USA
Mex
ico
Braz
il
LAC
EU_2
8
MEN
A
SSA
Rest
of w
orld
12
6
4
2
0
−2
10
8
12
6
4
2
0
−2
10
8
Crops
Livestock
Procfood
Percentage points Percentage points

ECONOMIC REVIEW • SPECIAL ISSUE 2018 23
Chart A-3Market Share of Different Regions for Crops under Different Scenarios
Chart A-4Market Share of Different Regions for Livestock under Different Scenarios
5
10
15
20
25
5
10
15
20
25
Initial Baseline
Trade costs Climate change
Percent Percent
Oth
er d
ev
Oth
er A
sia
Japa
n
Chi
na
Indi
a
ASEA
N
Can
ada
USA
Mex
ico
Braz
il
LAC
EU_2
8
MEN
A
SSA
Rest
of w
orld
5
10
15
20
25
5
10
15
20
25Initial Baseline
Trade costs Climate change
Percent Percent
Oth
er d
ev
Oth
er A
sia
Japa
n
Chi
na
Indi
a
ASEA
N
Can
ada
USA
Mex
ico
Braz
il
LAC
EU_2
8
MEN
A
SSA
Rest
of w
orld

24 FEDERAL RESERVE BANK OF KANSAS CITY
Chart A-5Market Share of Different Regions for Processed Food under Different Scenarios
Chart A-6Market Share of Different Regions for Manufactures under Different Scenarios
5
10
15
20
25
5
10
15
20
25Initial Baseline
Trade costs Climate change
Percent Percent
Oth
er d
ev
Oth
er A
sia
Japa
n
Chi
na
Indi
a
ASE
AN
Can
ada
USA
Mex
ico
Braz
il
LAC
EU_2
8
MEN
A
SSA
Rest
of w
orld
Initial Baseline
Trade costs Climate change
Percent Percent
Oth
er d
ev
Oth
er A
sia
Japa
n
Chi
na
Indi
a
ASEA
N
Can
ada
USA
Mex
ico
Braz
il
LAC
EU_2
8
MEN
A
SSA
Rest
of w
orld
5
10
15
20
25
30
35
5
10
15
20
25
30
35

ECONOMIC REVIEW • SPECIAL ISSUE 2018 25
References
Aguiar, Angel, Eddy Bekkers, Erwin Corong, Dominique van der Mensbrugghe, and Robert Teh. Forthcoming. “The WTO Global Trade Model.”
Ahammad, Helal, Edwina Heyhoe, Gerald Nelson, Ronald D. Sands, Shinichiro Fujimori, Tomoko Hasegawa, Dominique Van Der Mensbrugghe, Elodie Blanc, Petr Havlik, Hugo Valin, Page Kyle, Daniel Mason-D’croz, Hans Van Meijl, Christoph Schmitz, Herman Lotze-Campen, Martin Von Lampe, and Andrzej Tabeau. 2015. “The Role of International Trade under a Changing Climate: Insights from Global Economic Modelling,” in Aziz Elbehri, ed., Climate Change and Food Systems: Global Assessments and Implications for Food Security and Trade, pp. 292–312. Rome: Food and Agriculture Organization of the United Nations.
Anderson, Kym, and Anna Strutt. 2014. “Emerging Economies, Productivity Growth and Trade with Resource-Rich Economies by 2030.” Australian Ag-ricultural and Resource Economics, vol. 58, pp. 590–606. Available at https://doi.org/10.1111/1467-8489.12039
Baldos, Uris Lantz C., and Thomas W. Hertel. 2013. “Looking Back to Move Forward on Model Validation: Insights from a Global Model of Agricultural Land Use.” Environmental Research Letters, vol. 8, no. 3, pp. 1–8. Available at https://doi.org/10.1088/1748-9326/8/3/034024
Bekkers, Eddy, Giulia Sabbadini, Robert Koopman, and Robert Teh. 2018. “Long Run Trends in International Trade: The Impact of New Technologies.”
Carabenciov, Ioan, Charles Freedman, Roberto Garcia-Saltos, Douglas Laxton, Ondra Kamenik, and Petar Manchev. 2013. “GPM6 - The Global Projection Model with 6 Regions.” IMF Working Paper no. 13-87, April.
Dellink, Rob, Jean Chateau, Elisa Lanzi, and Bertrand Magne. 2017. “Long-Term Economic Growth Projections in the Shared Socioeconomic Pathways.” Global Environmental Change, vol. 42, pp. 200–214.
Delzeit, Ruth, Gernot Klepper, Florian Zabel, and Wolfram Mauser. 2018. “Glob-al Economic-Biophysical Assessment of Midterm Scenarios for Agricultural Markets—Biofuel Policies, Dietary Patterns, Cropland Expansion, and Pro-ductivity Growth.” Environmental Research Letters, vol. 13, no. 2, pp. 1–11.
Fontagné, Lionel, Jean Fouré, and Maria Priscila Ramos. 2013. “MIRAGE-e: A General Equilibrium Long-Term Path of the World Economy.” CEPII Work-ing Paper no. 2013-39, December.
Fuglie, Keith O. 2008. “Is a Slowdown in Agricultural Productivity Growth Contributing to the Rise in Commodity Prices?” Agricultural Economics, vol. 39, no. S1, pp. 431–441. Available at https://doi.org/10.1111/j.1574-0862.2008.00349.x
Gouel, Christophe, and David LaBorde. 2018. “The Crucial Role of International Trade in Adaptation to Climate Change.” Paper presented at the 21st Annual Conference on Global Economic Analysis, Cartagena, Colombia, June 13–15,
Herrendorf, Berthold, Richard Rogerson, and Ákos Valentinyi. 2013. “Growth and Structural Transformation,” in Philippe Aghion and Steven Durlauf, eds., Handbook of Economic Growth, vol. 2B, pp. 855–941. Holland: Elsevier. Available at https://doi.org/10.1016/B978-0-444-53540-5.00006-9

26 FEDERAL RESERVE BANK OF KANSAS CITY
Hertel, Thomas W., ed. 1997. Global Trade Analysis: Modeling and Applications. Cambridge: Cambridge University Press.
Hertel, Thomas W., Huey-Lin Lee, Steven Rose, and Brent Sohngen. 2008. “Modeling Land-Use Related Greenhouse Gas Sources and Sinks and their Mitigation Potential.” GTAP Working Paper no. 44.
KC, Samir, and Wolfgang Lutz. 2017. “The Human Core of the Shared Socio-economic Pathways: Population Scenarios by Age, Sex, and Level of Educa-tion for All Countries to 2100.” Global Environmental Change, vol. 42, pp. 181–192.
Ludena, Carlos E., Thomas W. Hertel, Paul V. Preckel, Kenneth Foster, and Alejan-dro Nin. 2007. “Productivity Growth and Convergence in Crop, Ruminant, and Nonruminant Production: Measurement and Forecasts.” Agricultural Economics, vol. 37, no. 1, pp. 1–17. Available at https://doi.org/10.1111/j.1574-0862.2007.00218.x
Nelson, Gerald, Hugo Valin, Ronald D. Sands, Petr Havlík, Helal Ahammad, Del-phine Deryng, Joshua Elliott, Shinichiro Fujimori, Tomoko Hasegawa, Edwi-na Heyhoe, Page Kyle, Martin von Lampe, Hermann Lotze-Campen, Daniel Mason-D’Croz, Hans Meijl, Dominique Van der Mensbrugghe, Christoph Müller, Alexander Popp, Richard Robertson, and Dirk Willenbockel. 2013. “Climate Change Effects on Agriculture: Economic Responses to Biophysical Shocks.” Proceedings of the National Academy of Sciences, vol. 111, no. 9, pp. 3274–3279. Available at https://doi.org/10.1073/pnas.1222465110
Nicita, Alessandro, Marcelo Olarreaga, and Peri Silva. 2018. “Cooperation in WTO’s Tariff Waters?” Journal of Political Economy, vol. 126, no. 3, pp. 1302–1338.
Organisation for Economic Co-operation and Development (OECD) and Food and Agriculture Organization of the United Nations (FAO). 2018. OECD-FAO Agricultural Outlook. Paris: OECD.
UN Department of Economic and Social Affairs, Population Division. 2015. “World Population Prospects: The 2015 Revision.” New York: United Nations.
Von Lampe, Martin, Dirk Willenbockel, Helal Ahammad, Elodie Blanc, Yongxia Cai, Katherine Calvin, Shinichiro Fujimori, Tomoko Hasegawa, Petr Havlik, Edwina Heyhoe, Page Kyle, Hermann Lotze‐Campen, Daniel Mason d’Croz, Gerald C. Nelson, Ronald D. Sands, Christoph Schmitz, Andrzej Tabeau, Hugo Valin, Dominique van der Mensbrugghe, and Hans van Meijl. 2014. “Why Do Global Long‐Term Scenarios for Agriculture Differ? An Overview of the Agmip Global Economic Model Intercomparison.” Agricultural Eco-nomics, vol. 45, no. 1, pp. 3–20.

Since the early 1990s, there has been a growing convergence of global production and trade in agriculture, which is also true for other industries. Firms with supply chains that operate within
the food-marketing channel have increased the vertical coordination of these chains through greater use of contractual arrangements. The rationale for this coordination has been articulated by multiple winners of the Nobel Memorial Prizes in Economics such as Coase (1937), Hol-mström (1979), Ostrom (1990), Williamson (2005), and Hart (2017). The ability of firms to govern activities beyond their vertical boundaries has broadened the application of these economists’ work, especially in agriculture. In doing so, it has laid the groundwork for the development of global supply and value chains within these marketing channels.
In this article, I describe the advantages and disadvantages of ag-ricultural international trade. In doing so, I focus on firms operating beyond the farm gate in the food economy. Because virtually all global trade in food made from agricultural products is sold through some form of supply or value chain, I first define and describe these terms. Furthermore, because the governance of these supply chains differs among the types of agricultural products, I discuss this concept in terms of types of agriculture. Finally, I discuss the role of bilateral and mul-tilateral agreements and describe current risks that are important for producers, agribusinesses, and lenders.
The Business Merits of Agricultural Trade
By Michael A. Boland
Michael A. Boland is a professor of agricultural economics, E. Fred Koller endowed chairholder in agribusiness management, and director of the University of Minnesota Food Industry Center. This article is on the bank’s website at www.KansasCityFed.org
27

28 FEDERAL RESERVE BANK OF KANSAS CITY
I. Global Trade Flows
The United States has long exported a higher value of agricultural goods than it imports, with Canada, Mexico, and East Asian countries being key U.S. trade partners. When discussing why countries or firms engage in trade, three terms are common: marketing or distribution channels, supply chains, and value chains. These terms are related to logistics, the process of providing activities within a firm involving de-livery of raw materials, packaging, and distribution of the product to buyers.
What are marketing channels?
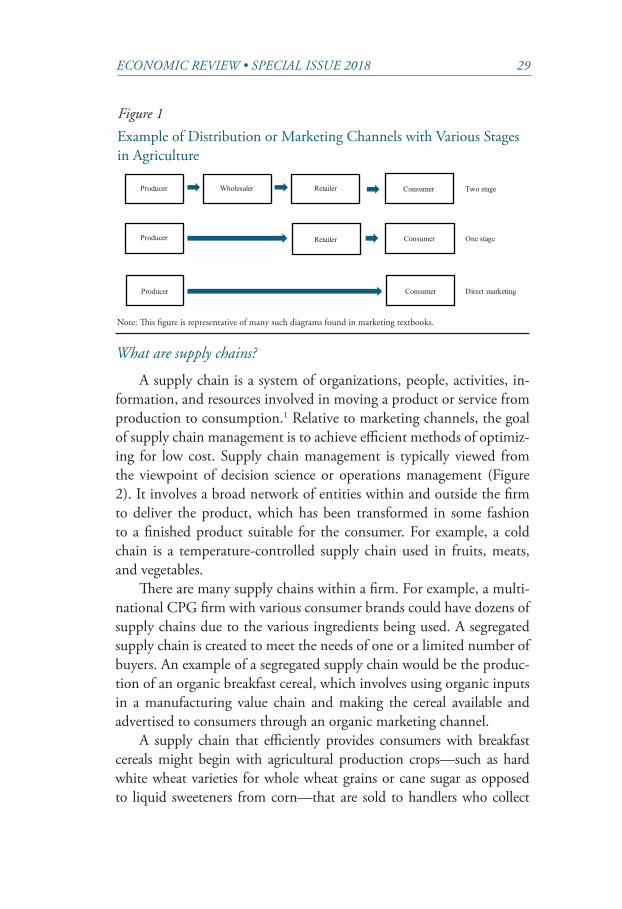
A marketing or distribution channel is often viewed from the point of the buyer or customer, as seen in Figure 1. In the food system, the customer, from the viewpoint of a consumer packaged goods (CPG) firm, would be a consumer. The same would be true for a restaurant or food service organization. Marketing or distribution channels are more narrow than supply or value chains and consider the five Ps of the marketing mix—packaging, people, price, product, and promotion—when considering how to provide maximum value to customers. A di-rect marketing channel would be one where a producer sells directly to a consumer, as in a farmer’s market.
Stages that may lie in between the producer and consumer include processing, wholesaling or distribution, and retailing. The food system contains multiple stages with various marketing or distribution chan-nels. For example, consider a marketing channel for breakfast cereals. Consumers desire cereals in a variety of packaged forms (for example, boxed, bagged, or single-serve) with a variety of nutritional needs (use of whole grains, no added sugars) and product attributes (organic, non-genetically modified [GM], no artificial dyes or colors, no corn sweet-eners) which are communicated to the consumer in a variety of meth-ods (in-store promotion, digital coupons, advertising). A simplified set of stages in the marketing channel would include production, process-ing, wholesaling, and retailing to consumers. The processor must work with multiple stages in the channel.
ECONOMIC REVIEW • SPECIAL ISSUE 2018 29
What are supply chains?
A supply chain is a system of organizations, people, activities, in-formation, and resources involved in moving a product or service from production to consumption.1 Relative to marketing channels, the goal of supply chain management is to achieve efficient methods of optimiz-ing for low cost. Supply chain management is typically viewed from the viewpoint of decision science or operations management (Figure 2). It involves a broad network of entities within and outside the firm to deliver the product, which has been transformed in some fashion to a finished product suitable for the consumer. For example, a cold chain is a temperature-controlled supply chain used in fruits, meats, and vegetables.
There are many supply chains within a firm. For example, a multi-national CPG firm with various consumer brands could have dozens of supply chains due to the various ingredients being used. A segregated supply chain is created to meet the needs of one or a limited number of buyers. An example of a segregated supply chain would be the produc-tion of an organic breakfast cereal, which involves using organic inputs in a manufacturing value chain and making the cereal available and advertised to consumers through an organic marketing channel.
A supply chain that efficiently provides consumers with breakfast cereals might begin with agricultural production crops—such as hard white wheat varieties for whole wheat grains or cane sugar as opposed to liquid sweeteners from corn—that are sold to handlers who collect
Figure 1 Example of Distribution or Marketing Channels with Various Stages in Agriculture
Note: This figure is representative of many such diagrams found in marketing textbooks.
Producer
Producer
Producer
Wholesaler Retailer Consumer
Retailer Consumer
Consumer
Two stage
One stage
Direct marketing

30 FEDERAL RESERVE BANK OF KANSAS CITY
the crop and then sell it bulk to breakfast cereal manufacturers who use a food extrusion technology to create the actual cereal flakes. This manufacturing process is quite complicated and involves a number of processes. The cereal is packaged, shipped, and stored in a distribution center warehouse and sold to a wholesaler or directly to a retail grocer or food service distributor that sells to consumers. The breakfast cereal firm uses logistics services to manage this entire process. Inventory manage-ment, warehouse replenishment, demand forecasting, and raw material procurement are included in this process. Thus, a supply chain is defined as an integrated process through which a number of business entities cooperate in an effort to acquire raw materials through product procure-ment, convert these raw materials into specified finished products, man-age standards of quality, and deliver the finished products to retailers.
What are value chains?
A value chain is a set of activities that a firm operating in a specific industry performs to produce a product or service (Porter 1980). In this way, supply chains link value chains (Figure 3). A firm’s value chain is designed to capture value for all firms by carrying out activities to meet the demand of consumers, who could be individual retail grocers, food services, or restaurant chains. Consumer demand is the source of the value and the value added to a product. That value, as viewed from the perspective of a consumer, is obtained through research and development (for example, an almond innovation lab or a private la-bel brand kitchen), market research on consumer trends (for example, NPD Group or Nielsen), the creation of product and service innova-tions valued by consumers (for example, an internal customer solutions lab for food starches) and economic conditions underlying consumer
Figure 2 Example of a Supply Chain for Agricultural Products
Note: This figure is representative of many such diagrams found in marketing textbooks
Producer Logistics Buyer Distribution
center Processing
plant Logistics Logistics
Product flow management
Supply planning
Retail grocer Food service Wholesaler
Inventory management and replenishment
Demand forecasting

ECONOMIC REVIEW • SPECIAL ISSUE 2018 31
income that affect product demand (for example, government reports by the Bureau of Labor Statistics).
One type of CPG manufacturing value chain for breakfast cereal is the process used by an individual manufacturer to create the cereal, including research on consumer demand for product attributes such as whole-grain, vitamin-fortified, or natural food colors; packaging at-tributes such as material or portion size; or certain types of production systems such as those using non-GM or organic ingredients. A com-pany with a value chain that handles global feed and food grain trading might be in the business of delivering grain at a specified grade year-round at certain intervals; its value comes from the entire process, from origination to delivery, as opposed to just origination.
Summary
Supply chain management can be thought of as functions that man-age the flow of product, and value chain management can be thought of as functions that manage consumer demand. Ideally, these activities should work together within a firm. An economist might think of this as a firm maximizing consumer demand as measured by value subject to an internal constraint on the cost of procuring the ingredients for the product supply. Within a firm, the job descriptions for individual employees reflect these viewpoints, and the employees are working to-ward the same goal. Consumers purchase food products daily directly
Figure 3 Representation of Porter’s (1980) Value Chain Activities
Inbound logistics
Production
Outbound
logistics
Service
Procurement
Research and development
Personnel management
Marketing and sales
Organizational structure
Supp
ortin
g ac
tiviti
es
Primary activities

32 FEDERAL RESERVE BANK OF KANSAS CITY
through a retail grocery or food service, but a firm is not producing those products in “real time.” It must anticipate the needs of consum-ers years in advance and build a system to supply the product inputs and services needed to meet that anticipated demand. Most food value chains and supply chains exist with global reach. Generally speaking, agricultural producers and firms that supply farmers, producers, and ranchers with inputs are at the beginning of such chains, and participa-tion in these chains allows for increased opportunities and risk.
II. The Modern Food System Is Dependent on Trade
Goldberg (2018) describes the modern global food system as the “biggest quasi-public utility in the world” (p. xvi). The changing nature of entities involved in the food system—including firms supplying in-puts to farmers, agricultural producers, handlers of commodity ingre-dients, CPG firms, and grocery retailers—in conjunction with public policy as evidenced by recent Farm Bills, helped change the food system from one focusing on the lowest-cost supply of food to one focusing on how consumers perceive value. In their mission statements, food systems firms often talk about being a “wellness company” or “life science com-pany.” Retail grocers employ dieticians to help consumers shop. CPG firms create segregated supply chains for organic products. Farmers bal-ance production against societal goals related to water, employment, and the environment. This process has been ongoing for a long time, as noted by economists such as Kinsey (2001) and Sexton (2000, 2012). How-ever, several changes in the mid-1990s accelerated these trends.
Farm policy in the United States changed dramatically in 1996 with the so-called “Freedom to Farm” Bill (Sumner, Alston, and Glaub-er 2010). However, that bill reflected a number of prior changes includ-ing the 1948 General Agreement on Tariffs and Trade (GATT), which culminated in the creation of the World Trade Organization (WTO) in 1994. Prior to these events, the United States had established free trade zones with Canada and signed a free trade agreement with Israel in 1985. However, the real increase in bilateral and multilateral free trade agreements began in the mid-1990s. An examination of these agree-ments shows the effect of trade in both agricultural goods and, even more importantly, services, which included sanitary and phytosani-tary regulations (SPS), scientific protocols, and processes for approval

ECONOMIC REVIEW • SPECIAL ISSUE 2018 33
of products. Different countries have different tolerances for risk and safety. The precautionary principle suggests that temporary regulations are needed to prohibit a new product or technique because scientific evidence on possible risk is incomplete and consumer demand for more information may be lacking.
Global production of high-value foods, particularly processed foods, has grown rapidly since the mid-1990s for reasons described by Beckman, Dyck, and Heerman (2017). However, exports of pro-cessed foods have remained at the same percentage levels. The lack of growth in processed food trade is partly due to the preference of many manufacturers to locate production units close to their consumer bases rather than export the finished products. Consider a product such as ice cream or yogurt. A CPG firm such as General Mills has more than 50 global food brands used on hundreds of stock keeping units (SKUs). Many of these products use dry milk ingredients such as dairy proteins in their formulations, while other products are primarily dairy-based (for example, Oui, Yoplait, and Häagen-Dazs), with dozens of supply chains to create these products. General Mills does almost 25 percent of its business outside the United States, using processing plants in other countries to manufacture its products and then exporting ice cream and yogurt to those countries. To produce its dairy products, General Mills needs to source fluid milk in those countries using origination models similar to what Nestlé uses in more than 30 countries includ-ing Brazil, Chile, China, Colombia, Indonesia, Morocco, Pakistan, Sri Lanka, Thailand, and Uzbekistan (Goldberg and Herman 2005, 2006).
All of these issues point toward the importance of trade in agri-cultural products as well as increased trade in perishable agricultural goods such as fresh fruits and vegetables. The United States did not have enough productive land in a subtropical environment to produce the many kinds of fresh fruits and vegetables needed to feed a popula-tion that tripled between 1945 and 2010 (Alston and Pardey 2014). The increasing U.S. population led to a growing awareness of the need for supply chains that could source fresh fruits and vegetables globally and a growing convergence of consumer diets in many countries, which can be seen in the types of products sold in retail grocery stores (Rear-don and others 2003).

34 FEDERAL RESERVE BANK OF KANSAS CITY
III. The Governance of the Global Food System
Rodrik (2018) argues that four aspects of trade agreements may yield ambiguous economic welfare and efficiency results: trade-related intellectual property rights (TRIPS), rules about cross-border capital flows, investor-state dispute settlement procedures, and harmonization of regulatory standards (that is, SPS). SPS in particular has been critical for agriculture because it includes issues such as bans on GM-foods or meat produced with growth promotants, which have been found to be protectionist barriers. Rodrik (2018) argues that countries’ assessments of risk and concepts of businesses and their relationships with stake-holders will likely vary.
Gereffi, Humphrey, and Sturgeon (2005) define five types of global value chain governance: market, modular, relational, captive, and hier-archical (Figure 4). These types are listed in increasing order of com-plexity: the market type suggests arms-length transactions, whereas the hierarchical type suggests formal vertical integration. Modular, rela-tional, and captive types are increasingly vertically coordinated. Modu-lar chains are characterized by highly complex transactions and a great-er need for capabilities from suppliers but also by the ability to codify a transaction like a market governance system. Relational governance systems are similar to modular systems, but they are less able to codify transactions. Captive governance systems are different from modular systems in that they require low capability from their suppliers, since they have built asset-specific investments. For a long time, market type governance was typical in agricultural trade, with price and grade specifications being standard. For example, fruit might be purchased in boxes of a certain weight and size, and a variety of intermediaries such as brokers and wholesalers might facilitate trade.
More recently, so-called “supply chain captains” have moved toward modular systems and away from market systems to meet consumer de-mand for a year-round supply of various fruits, new forms of packaging such as smaller containers of pre-cut fruits, and greater attention to quality including extended shelf life. Meeting these demands requires a deeper relationship with suppliers. Sporleder and Boland (2011) dis-cuss supply chain captains such as large retail grocers and restaurants, which face a more complex regulatory environment with regard to fun-gicide and pesticide residues and food safety inspections. Furthermore,

ECONOMIC REVIEW • SPECIAL ISSUE 2018 35
stakeholder concerns about labor standards and similar issues have grown.2 Consequently, retailers have turned to turnkey suppliers who can deal with all of these issues (for example, using e-verify for labor or tracing food through the supply chain to verify sustainability claims). Retailers have moved away from wholesalers and toward greater coor-dination through contracts of a certain duration with regular audits and inspections. Furthermore, retailers and their suppliers have begun placing greater emphasis on the efficiency of the entire supply chain.
IV. Agricultural Trade Is Important to Firms
Presentations by firm CEOs are often scrutinized very carefully for information. Boland and Çakır (2018) suggest that the economist Jo-seph Bain (1959), who helped create the field of industrial organization within the economics profession, was likely the first to note that such presentations often contain clues about market competitiveness. Using public archiving services available for industry publications, I create a digital database of presentations on the topic of trade by food economy CEOs and senior managers (“senior leaders”) who reported to the CEO
Figure 4 Five Global Value Chain Governance Types
Source: Gereffi, Humphrey, and Sturgeon (2005).
Materials
Val
ue
Lead firm
Lead firm
Lead firm
Customers
Component and material
Component and material
Market Modular Relational Captive Hierarchical
Low
Suppliers
High
Turnkey supplier
Relationalsupplier Price
Degree of explicit coordination
Degree of power asymmetry
End use
Captivesuppliers
Integrated firm
chai
ns
suppliers suppliers

36 FEDERAL RESERVE BANK OF KANSAS CITY
beginning in 1995. The industry publications in this database include AgriMarketing, Baking and Snack, Beverage Industry, Bloomberg Busi-nessWeek, The Economist, Feedstuffs, Food Institute, Food Processing, Food and Beverage Processing, Milling and Baking News, Meat and Poultry, The Wall Street Journal, and World Grain. I include these outlets because they represent a broad overview of food system firms excluding production agriculture and because they have an archival service that is searchable. I then search the database for words including “GATT,” “World Trade Organization,” “Farm Bill,” “trade agreements,” “trade,” and individual names for trade agreements such as “NAFTA” and “CAFTA-DR.” In addition, I search under specific firms, updating Boland, Golden, and Tsoodle’s (1998) set of firms characterized as closely held (for example, family-owned firms and cooperatives) or publicly held.
Chart 1 shows that the total number of firms in the database de-creased from 1995 to 2018 due to mergers or other changes in owner-ship. On average, seven senior leaders spoke about the need for trade annually. However, as a percentage of total food economy firms, the number of senior leaders discussing trade steadily increased from 19 percent (using 1996–98 data) to 25 percent (using 2015–17 data). Furthermore, this percentage is already at 17 percent after the first six months of 2018. Clearly, senior leaders of food economy firms are con-cerned about trade and the need for trade.
While economics has few laws relative to other sciences, the law of comparative advantage states that the ability of any firm to produce goods and services at a lower opportunity cost than a different firm gives the first firm a comparative advantage. In practice, comparative advantage is often thought about in terms of average costs of produc-tion. However, when thinking about comparative advantage in terms of global trade, transportation costs become important as well as any policy issues that favor one form of agriculture over another. It is use-ful, for example, to think about distance when considering trade. The main port terminals in the European Union are almost half as far away as port terminals in East Asian countries (Wang and others 2000). Yet East Asian countries are far more important markets for U.S. agricul-tural products.
A U.S. food economy firm engaged in exports may quote prices in terms of free on board or freight on board (FOB) from a certain port of

ECONOMIC REVIEW • SPECIAL ISSUE 2018 37
origin. Taylor (2017) reports that in 2016, New Orleans Ports Region accounted for 36 percent of all U.S. agricultural exports; no other port averaged more than 6 percent. The FOB price for ports in the New Orleans region means that the seller is responsible for transporting the product to the port and including the cost of loading it onto the ship. New Orleans ships 46 percent of all agricultural products that are bulk commodities, and the two primary means of transportation to the port are barge shipping via the Mississippi River and rail transport. A buyer pays the FOB price at that port and then is responsible for shipping the product through the Caribbean and Panama Canal (if headed for East Asian countries), paying the insurance, unloading the product at its destination port, and transporting it to its final stop. The buyer assumes all risk once the ship leaves the port of New Orleans. Alternatively, a seller could price via cost, insurance, and freight (CIF) pricing and deliver the product to its final destination. Thus, the ratio of CIF to FOB prices is greater than 1, and the difference in price represents unit transport cost.
In many ways, transportation costs are analogous to a tariff. The increase in width of the Panama Canal has resulted in the ability to use bigger ships, which may be slower for fuel efficiency reasons but can carry more volume. This leads, in turn, to a shift in the supply curve
Chart 1 News Articles and CEO and Senior Leader Presentations on Trade Topics, 1996–2018
Note: Firms include all food economy firms in a particular year.
10
20
30
40
50
60
10
20
30
40
50
60
1996 1999 2002 2005 2008 2011 2014 2017
NumberNumberIndividual presentationsArticlesFirms
38 FEDERAL RESERVE BANK OF KANSAS CITY
and greater trade. Free trade agreements, in contrast, decrease tariffs, leading to a shift in the demand curve and greater trade.
V. The Role of Trade for Production Agriculture and Food Economy Firms
By many different measures, U.S. producers are some of the most efficient in the world when comparing different FOB prices. Gardner (2002) documents the role of the public-private sector to explain why this has happened over time. Nevertheless, not all agricultural systems are alike. The USDA reports agricultural products in terms of bulk, intermediate, and consumer-oriented (BICO). Bulk products include canola, corn, peanuts, rice, soybeans, and wheat that are designed for further processing. Intermediate products include soybean meal and oil, other vegetable oils, distiller’s grains, and sweeteners, and are gener-ally used as ingredients in other products. Consumer-oriented products include beef, pork, poultry, fruit and vegetables, tree nuts, and dairy products. All three categories have increased, on average, since 1995. Consumer-oriented products have increased the fastest, reflecting the growth in global supply chains. However, for an audience of those in production agriculture, it is useful to think about U.S. agriculture in terms of annual crops, perennial crops, meat and poultry, and dairy.
Annual crops
Casual readers of any Midwestern U.S. newspaper or media outlet tend to read about annual crops such as corn and soybeans. In certain regions, readers might read about cotton, rice, and wheat.3 Many of these crops are sold in market-type governance systems. Farm policy discussions in a Farm Bill tend to contain many issues related to these annual crops. The two most widely used farm management textbooks make frequent use of these types of annual crop examples, which are used as inputs for livestock and poultry feed (such as soybean meal and corn) and energy (such as corn). These products or the outputs of their use as ingredients (for example, dry distiller’s grain from corn-ethanol production) are important exports, and imports of these products are minimal. Thus, tariffs enacted by countries importing these crops may lead to less trade if these products do not displace other markets.
ECONOMIC REVIEW • SPECIAL ISSUE 2018 39
Virtually all vegetables are annual crops except asparagus, although many vegetables such as lettuce may have several crops per year. Most of these vegetables are sold through modular, relational, or captive-type value chain governance systems. For example, Green Giant-branded canned or frozen vegetables come from certain U.S. growing regions in addition to Mexico, The Netherlands, and Peru. U.S. vegetables are grown under production contracts (for example, varietal selection and the type of farming system) and marketing contracts (for example, ton-nage contracts based on a market price) with growers. Martinez (2002) has written about vertical coordination in agriculture, which describes more of a modular or relational governance system. Global producers are more likely to be captive suppliers because of the nature of the farm-ing system in those countries and the difficulty of switching buyers. The same would be true for Birds Eye Foods or other vegetable processors.
The total volume of vegetable production in the United States has declined relative to the total use of vegetables since the 1990s. Some of this decline is due to issues related to the supply of U.S. vegetables, including a decrease in the number of vegetable producers, an increase in costs of inputs such as labor and water, and a decrease in expected future prices caused by trade agreements that reduced average import tariffs and increased imports. Demand for canned and frozen vegetables relative to fresh vegetables also decreased during this period. Canners and processors were not able to change their business strategy to enter the fresh market due to varietal issues suitable for a grower’s geography and irreversible fixed assets with regard to canning and processing facili-ties and a lack of capital investment to consider change (Boland 2016). Lettuce, spinach, tomatoes, potatoes, and dry edible bean imports had the highest growth in imports during this period (Johnson 2016).
Perennial crops
The United States is a producer of perennial crops such as stone fruits, including peaches and plums; citrus fruits, such as lemons and oranges; pome fruits, such as apples and pears; berries, such as strawber-ries and blueberries; and nuts, such as walnuts and almonds. Exports of perennial crops are important for California, Oregon, and Wash-ington state producers. Planting an orchard is similar to an irreversible investment. It takes three to five years for the crop to bear fruit or nuts,

40 FEDERAL RESERVE BANK OF KANSAS CITY
and many fruits are alternate bearing. Most of these fruits and nuts are sold through modular, relational, captive, or even integrative-type value chain governance systems. However, some perennial crops that have seen rapid growth in recent years, such as blackberries, blueberries, and hazelnuts, are moving from market-type transactions to modular and relational governance systems. Greater awareness of the benefits of fruit and nut consumption, a growing perception that fresh fruit is bet-ter than canned or frozen, changes in consumer tastes and preferences (for example, purchasing fruits and vegetables by variety name such as Honeycrisp apples or Yukon gold potatoes), and an increasing U.S. population with higher average income have helped increase demand for fresh fruits and nuts.
On the supply side, a number of developments in fruits and nuts have affected production. A higher cost of inputs such as labor and water have changed producer enterprise diversification from certain fruits, such as citrus and stone, to almonds and walnuts. In addition, new land in Georgia, Oregon, and Washington has been brought into berry production. Public investments in disease-resistant nut varieties at the Oregon State Agricultural Experiment Station (AES) have helped increase the supply of hazelnuts. Similar public-private investments in production technologies at the University of California AES have helped reduce the cost of raisin grape and almond production, among other fruits and nuts.
All of the changes that have affected demand and supply can be seen in the U.S. supply and utilization for fruits and nuts from the mid-1990s to 2016. Overall domestic production increased but the effects were mixed (for example, prune, pear, and peach production decreased, while berry and nut production increased). Imports of citrus, berries, grapes, and stone and pome fruits increased, but so did exports of ber-ries, grapes, and stone and pome fruits. Like vegetables, fruit imports were greater than exports even accounting for consumption of tropical fruits such as bananas, which has remained somewhat constant during this period.
Livestock and poultry
Global trade in poultry and meat has increased significantly since the mid-1990s. Meat and poultry exports are transported to many of the

ECONOMIC REVIEW • SPECIAL ISSUE 2018 41
same markets as annual and perennial crops. Many of these governance models are modular in nature. Factors such as an increase in per family incomes, changes in relative prices and their substitutes (for example, the ratio of beef to poultry prices has been declining for almost 40 years), dietary preferences for more meat protein, product innovations such as boxed beef and chicken, and changes in food service menus have in-creased the demand for trade in poultry and livestock meat.
Much of this trade is in chilled rather than frozen products—and in disassembled products rather than whole animal carcasses—due to technology improvements that have increased the supply and trade in these products. For example, more efficient feed due to genetic im-provements and animal housing systems has led to lower average costs and greater supply. The creation of quotas through trade agreements has also increased the trade and supply of these products, as has a great-er number of livestock and poultry production systems globally and a diffusion of animal systems technology. Research and development of meat products such as turkey has increased the overall supply of meat traded globally, and the harmonization of veterinary protocols and SPS measures through trade agreements and WTO membership have helped increase trade. Finally, the use of quotas in trade agreements (for example, the Hilton quota for Argentinean, Paraguayan, and Uruguay-an beef in the EU) has led to greater trade (Marshall and others 2000).
However, the greatest increase in trade of U.S. meat and poultry products came from the NAFTA trade agreement—in particular, from trade with Mexico. The animal and meat sector accounts for the major-ity of SPS notifications in WTO-member countries, and these include the implementation of a new procedure, rule, or requirement that may act as a barrier to trade.
Dairy
Global trade in dry milk powder products has increased in the past 20 years. Factors such as increased consumer family income, increased awareness of the health benefits of milk-based products, and changes in how food is consumed (for example, increased snacking, smaller por-tions, and greater protein) have increased demand for dairy-based foods that use dry milk powder. Fonterra and Glanbia has been a global leader

42 FEDERAL RESERVE BANK OF KANSAS CITY
in developing dairy protein-based products in this category. Primary exporters include New Zealand and the United States.
Butter demand has also increased due to new research on its health benefits and changing consumer taste for products such as European-style butter and spreadable butter products. A small amount of trade occurs in butter: the third largest U.S. butter brand in 2018 was Ker-rygold, which is imported from Ireland, although the United States has many regional butter brands as well. Likewise, cheese demand has in-creased in part due to its use in various foods (for example, pizza). The abolition of dairy quotas in the EU and corresponding expansion in the EU Green Belt—that is, Ireland, The Netherlands, Denmark, north-ern Germany, Poland, and Lithuania—as well as cheaper animal sys-tem technologies (for example, robotic milkers and other labor-saving devices) and improvements in feed efficiency and milk production per cow have led to greater supply.
VI. The Role of Free Trade Agreements
Much of the discussion around the GATT and the formation of the WTO has focused on the average tariff rate reductions. These re-ductions helped facilitate trade and allowed comparative advantage to become more apparent, as membership in the WTO included an ob-ligation to undertake no policies that would enable supply of an agri-cultural commodity to increase for reasons unrelated to price discovery. Certainly, this has helped trade of annual crops. Market access barriers, such as tariffs, are a significant obstacle to trade. Importing countries may escalate tariff rates based on the level of processing, with primary products being levied the lowest rates. In addition, countries may use other measures such as SPS to encourage imports of relatively unpro-cessed agricultural commodities at the expense of more processed prod-ucts. However, bilateral and multilateral free trade agreements (FTA) have also been important, especially for perennial crops.
The United States has negotiated a number of FTAs with 20 countries (Office of the U.S. Trade Representative 2016). These agree-ments have dozens of chapters that involve complex negotiations on trade issues. The goal of SPS measures is to protect the health and lives of humans, animals, and plants from risks arising from trading agricultural products. To minimize unwarranted impacts on trade, the

ECONOMIC REVIEW • SPECIAL ISSUE 2018 43
WTO SPS agreement establishes general requirements and procedures for application of SPS measures by member countries. Under this agreement, member countries have the right to apply the levels of protection from risk as they see appropriate. However, the agreement requires all partnering countries to commit to using science and risk analysis as a foundation for the application of SPS measures. The agree-ment also encourages member countries to implement the provisions regarding fundamental principles such as harmonization, equivalency, transparency, and regionalization of SPS measures.
The WTO SPS agreement is a significant step toward eliminat-ing SPS trade barriers, but implementation issues persist. In 2016, the Office of the U.S. Trade Representative noted that SPS trade barriers cost U.S. farmers and small businesses hundreds of millions of dollars and that their elimination is a high priority for the U.S. government. Regulations related to animal disease comprised almost one-third of all trade concerns in SPS from 1995 to 2015 (Beckman, Dyck, and Heerman 2017). A number of these concerns were related to increased trade in animal meat products, the foot-and-mouth disease outbreak in the early 2000s, and the isolated Bovine Spongiform Encephalopathy disease (that is, BSE or mad-cow disease). One of the main reasons for implementation problems is the lack of close cooperation, information sharing, and trust between trading partners. There is a close link be-tween free trade agreements and the implementation of SPS measures. The United States requires all partnering countries in an FTA to com-mit to the WTO SPS agreement that mandates using science and risk analysis as a foundation for SPS measures. This has helped in a number of cases, most recently in the avian flu outbreak of 2016. Çakır, Boland, and Wang (2018) note that the ability of the U.S. turkey industry to work with United States and international stakeholders using protocols established in SPS policies in FTAs helped trade in U.S. turkey prod-ucts to continue during the avian flu outbreak.
Many FTAs create quotas or increase or decrease existing quotas. For example, NAFTA includes a small quota for beet sugar from the Taber, Alberta factory in Canada into the United States. The FTA with Chile allows additional volumes of certain types of cheeses from the Xth Region near Puerto Montt not typically produced in the United States, such as Parmesan-type or Roquefort-type cheeses. Many import-

44 FEDERAL RESERVE BANK OF KANSAS CITY
ers of fruits and vegetables built supply chains when tariff duties were reduced to zero or close to zero after trade agreements were signed. Vegetables began to be sourced from Central America while counter -seasonal fruit production began in the Central Valley in Chile and Pe-ruvian coastal regions (Gallo 2018). Table 19 in Beckman, Dyck, and Heerman (2017) shows that the United States, New Zealand, Australia, and Singapore have the lowest average applied tariffs of any countries in the world.
Sporleder and Boland (2011) note that a key component of the food system is the concept of a marketing year and perishability. In the northern hemisphere, the marketing year is often assumed to be-gin October 1 with the harvesting of that year’s annual or perennial crop and to end 12 months later on September 30 with inventories being depleted to prepare for the next year’s crop.4 Consumers in the United States have benefited from counter-seasonal production for cer-tain fruits (Chile) and vegetables (Peru). Without refrigeration in a cold supply chain from production to consumption, fruits, vegetables, dairy, and meat would perish rapidly. Changes in refrigeration and related technologies have helped increased trade in these products.
Coyle and Ballenger (2000) note that these technologies include improved communication systems, allowing for better monitoring of quality, tracking of shipments, and coordinating of steps through the marketing chain of perishable food products. Greater use of intermodal systems and the reefer box (a mobile refrigerated warehouse) from the point of production to the point of consumption, combined with mod-ern container terminals, have allowed for quicker turnaround in ports and faster delivery of product over greater distances. Improvements in refrigeration and controlled atmospheric packaging and humidity control have reduced spoilage and allowed the substitution of cheaper ocean shipping for air transport. Many packaging innovations—includ-ing fruit and vegetable coatings, bioengineering, and other techniques that reduce deterioration of food products—have helped shippers ex-tend the shelf life of products. Port technologies have also improved. Crane use and capacity have increased, as have storage space and access to highway and rail connections. Customs and inspection services have improved to become more efficient and timely. Such improvements and

ECONOMIC REVIEW • SPECIAL ISSUE 2018 45
increased use of digital technologies such as sensors and blockchain may help reduce costs and margins.
VII. Current Issues in Agricultural Trade
Since the mid-1990s, the United States has seen enormous increas-es in the volume and value of agricultural trade. However, several issues still require resolution, and some may never be resolved due to differing attitudes toward risk and safety.
Global trademarks, certification marks, and geographic indications
As with privacy concerns (for example, Right to Be Forgotten) and standardized financial accounting reporting between the EU and United States, the debate over geographic indicators may never be re-solved, although a “work-around” solution appears to be developing. The issue under contention is, essentially, whether policies on foods with geographic indications are creating a vertical supply curve—which is how the United States views them—or whether the food is actually differentiated and on the inelastic part of the demand curve—which is how the EU views them. Alston and others (1997) show that market-ing the differentiation of a product’s features and benefits has a greater effect than generic commodity advertising. Indeed, Boland and others (2012) find that these benefits are almost four times larger with regard to prunes marketed by a California cooperative. Thus, at least in Cali-fornia, empirical studies have found greater benefits to promoting the differentiated features of a product rather than where it happened to be grown. This debate has become important in current NAFTA rene-gotiations because recent trade agreements between the EU, Canada, and Japan allowed five cheeses (Asiago, Feta, Fontina, Gorgonzola, and Munster) to be recognized as geographic indications. This was the first time geographic indications were recognized in a trade agreement. Cer-tainly, certification marks and trademarks are important issues.
Animal of origin versus farm of origin and country of origin
Current trade negotiations between the EU and Mercosur coun-tries (that is, Argentina, Brazil, Paraguay, and Uruguay) have several issues to work through; however, a key factor in beef trade discussions is that the EU requires animals to be traced individually. Although Uru-
46 FEDERAL RESERVE BANK OF KANSAS CITY
guay can trace animals individually, Brazil is only able to trace them to the farm of origin. The WTO has ruled that U.S. Country-of-Origin Labeling regulations in beef violate U.S. trade obligations by imposing burdensome recordkeeping and verification requirements on livestock producers and meat processors. These issues are also important to gro-cery retailers and restaurants. The so-called “Born in Mexico, raised in Canada, and slaughtered in the U.S.A.” label recognizes modern beef supply chains in North America.
Timely resolution of SPS issues
A common criticism of many SPS issues, especially in meat prod-ucts, is their timely resolution. Bovine spongiform encephalopathy, a disease that affected Canada, the United States, and Great Britain at various times since the early 1990s, caused great trade disruptions. Timely resolution was a major issue because importing countries could not agree on common definitions such as what constituted a “young” or “old” animal as measured in months. Age may appear to be an easy problem to resolve, but it is nevertheless contentious among scientists.
Management of global price risk in a supply chain
Firms with global supply chains seek to manage global price sup-ply risk. However, doing so is difficult for many products such as dairy, meat and poultry, fruits, and vegetables. Marketing contracts are com-mon, but the price discovery process may depend on publicly reported prices in thin markets due to limited numbers of buyers and sellers (Adjemian, Saitone, and Sexton 2016). The ability to manage price throughout the supply chain is not readily apparent as evidenced by frequent mentions of the topic in quarterly reports of food economy firms that report to the U.S. Securities and Exchange Commission. Anecdotal evidence suggests that this is especially true in dairy, which is regulated through marketing orders in the United States and lacks timely and transparent data on current and future demand and supply, since milk supply is elastic regardless of where it is produced.
Compliance and enforcement of “buy American” in school nutrition programs
In the United States, school nutrition programs are required to “buy American.” However, many producer organizations argue that

ECONOMIC REVIEW • SPECIAL ISSUE 2018 47
this requirement is not enforced, and many school programs may not be in compliance. “Buying American” has been a big issue especially in canned peaches, canned pears, and applesauce. Reports have found that some school nutrition programs are purchasing imported foods rather than U.S. produced foods (Kalb 2015; Rodriguez 2018). This has implications for importing firms with global supply chains that may have purchased U.S. trademarked brands to use on imported fruit.
Organizational structural issues
Marketing organizations such as farmer-owned cooperatives have proved successful in many industries. A key part of these organizations’ success has been the ability to pool large volumes of supply and market that volume to buyers. Some marketing cooperatives have been suc-cessful in developing globally differentiated products, especially in cit-rus and almonds (Pozo, Boland, and Sumner 2009; Boland, Pena, and Sumner 2009). However, the development of global dairy brands by cooperatives has been limited because of the capital needed to invest in these technologies. For example, while dairy farmers might like to receive the price of milk used in products such as Bailey’s Irish Cream or whey protein powder jugs, they might not want to pay for the re-search and development to create these products and then market them globally. Some cooperatives such as Glanbia have developed innovative organizational forms that allow cooperatives to become part of these supply chains and have capital for the investments (Boland 2013).
Implementation of Food Safety Modernization Act (FSMA)
The United States believes it has the most modern food safety system in the world, and the recent FSMA implementation will affect global sup-ply chains. One key issue is the Foreign Supplier Verification Program, which requires importers to verify that food imported into the United States is produced in a manner that provides the same level of public health protection as that required of U.S. food producers. In addition, the Third Party Certification establishes a program for the accreditation of third-party auditors to conduct food safety audits and issue certifica-tions of foreign facilities producing food for humans or animals. The FSMA also includes other regulations on shipping and transportation yet to be implemented. Recent concerns over the mislabeling of organic

48 FEDERAL RESERVE BANK OF KANSAS CITY
grain imports will likely put greater pressure on global supply chains, especially those that require a segregated supply chain built around or-ganic labeling. Finally, adulteration risk must be considered in light of several dairy issues in China and the horsemeat issue in Ireland. All of these issues place increased pressure on possible DNA testing of certain food products, similar to what is happening with certain animal breeds.
Unforeseen policy decisions
Unforeseen issues often arise in agricultural trade, such as the Rus-sian embargo on many agricultural products from the EU from 2015 to the present. The embargo severely disrupted EU supply chains, par-ticularly in dairy. The current United States and Chinese trade war is another example, and it may have large effects on U.S. soybean, turkey, and chicken exports.5 In the spring of 2017, Canada abruptly put into effect policies designed to shut off U.S. exports of ultrafiltered milk, which had dramatic effects on dairy farmers in western Wisconsin and certain other regions. China’s decision in January 2017 to not import corn ethanol but to relax imports of certain beef products was not well understood, and rice market access continues to be an issue.
VIII. Implications for Lenders
Lenders have an important role to play in global supply chains in agricultural trade. The increased need for working capital and term loans for investments have helped create the global food system. How-ever, it is apparent that there are risks associated with the opportunities. For example, lenders financing production agriculture assets that are contingent upon exports have a degree of risk that is not readily under-stood due to fluctuations in exchange rates, lack of transparent infor-mation on future supplies in the United States and in export markets, lack of understanding of forecast demand and what is happening in ex-port markets, and political risk due to changes in policy. Firm strategy can likewise be an issue. Firms practicing transfer-pricing methods can choose in what country to declare profits based on tax policies, which can disguise where the profits originated in an integrated supply or value chain. Loans made for fruits, nuts, and vineyards (olive and wine) that are long-term investments relative to annual crops deserve scrutiny, especially if the products are designed for the export market.

ECONOMIC REVIEW • SPECIAL ISSUE 2018 49
For example, consider the dairy industry, which has a very elastic supply. The abolition of quotas in the EU was known well in advance, and dairy farmers began to prepare for expansion as they anticipated greater income on their farms. Farmers invested in their farms and built and financed milk-processing plants for the additional capacity. Mean-while, dairy farmers in Argentina, Chile, New Zealand, and parts of the United States were responding to the same demand signals. As a result, the milk supply increased faster than demand, and events such as the Russian embargo had a tremendous economic effect. Similarly, dairy producers in California, Idaho, and New Mexico expanded production in anticipation of East Asian demand for dried milk, even though In-dia had already begun exporting limited dairy products and China was building a dairy industry.
The effects of disruptive technologies such as plant- or lab-based meat and aquaculture on meat demand and corresponding feed grain markets are unknown. The use of plant-based proteins in such meat products might create demand for certain nuts and vegetables.6 Geo-graphic diversification of fruits and nuts could happen in Missouri and Arkansas. Similarly, advances in electric cars and similar technologies could affect the demand for corn ethanol.
Some structural changes in policy have economic effects on farm-ers and their cooperative balance sheets in the form of economic obso-lescence, as shown by Boland, Crespi, and Turner (2014). These effects are well documented with regard to land prices. However, such effects are probably not incorporated into interest rates. Capital may become stranded in value chains due to changes in policy. Readers can think of other examples of risk that are likely to occur throughout the 21st century.
50 FEDERAL RESERVE BANK OF KANSAS CITY
Endnotes
1Both military and management experts have used “supply chain” inter-changeably with “logistics” and “operations research” since the 19th century, be-ginning in Napoleonic France. Keith Oliver, a management consultant writing in the Financial Times in 1982, is generally credited as the first person to use the phrase “supply chain management.”
2A description of stakeholder theory can be found in Boland, Cooper, and White (2016) and Fuller, Brester, and Boland (2018)
3Beet or cane sugar might be another crop as noted by Risch, Boland, and Crespi (2014).
4This is somewhat simplistic because many feed and food grains, fruits (such as raisin grapes, peaches, and apricots, which can be dried), nuts, powdered milk, and frozen concentrate juices can be stored for more than 12 months.
5The Economist (2018), citing Bindiya Vakil, CEO of Resilinc, which is a sup-ply chain analytics and management firm, writes that “most companies are unable to quantify the risk of a serious trade war.”
6Plant- or lab-based meat protein is a truly disruptive technology for the meat industry in many ways, because its advantages appear to far outweigh those of the meat industry. However, a detailed public analysis of this supply chain has not been conducted, as the research is being done in the private sector.

ECONOMIC REVIEW • SPECIAL ISSUE 2018 51
References
Adjemian, Michael K., Tina L. Saitone, and Richard J. Sexton. 2016. “A Frame-work to Analyze the Performance of Thinly Traded Agricultural Commod-ity Markets.” American Journal of Agricultural Economics, vol. 98, no. 2, pp. 581–596. Available at https://doi.org/10.1093/ajae/aav074
Alston, Julian M., John M. Crespi, Harry M. Kaiser, and Richard J. Sexton. 2007. “An Evaluation of California’s Mandated Commodity Promotion Programs.” Review of Agricultural Economics, vol. 29, no. 1, pp. 40–63.
Alston, Julian M., and Phil Pardey. 2014. “Agriculture in the Global Economy.” Journal of Economic Perspectives, vol. 28, no. 1, pp. 121–146. Available at https://doi.org/10.1257/jep.28.1.121
Bain, Joseph S. 1959. Industrial Organization: A Treatise. New York: Wiley.Beckman, Jayson, John Dyck, and Kari E.R. Heerman. 2017. “The Global Land-
scape of Agricultural Trade, 1995–2014.” USDA Economic Research Service, Economic Information Bulletin no. 181.
Boland, Michael A. 2016. “NORPAC Foods: An Oregon-Based Fruit and Veg-etable Processor,” unpublished case study.
———. 2013. “The Irish Dairy Industry and the Evolution of Glanbia.” In Pro-ceedings of Economics and Management of Networks Conference, November 21–23, 2013, Agadir, Morocco. Available at http://emnet.univie.ac.at/em-net-2013/conference-program
Boland, Michael A., and Metin Çakır. 2018. “Agribusiness Economics and Man-agement,” in Gail L. Cramer, Krishna P. Paudel, and Andrew Schmitz, eds., The Routledge Handbook of Agricultural Economics, pp. 760–778. New York: Routledge Press.
Boland, Michael A., Brendan Cooper, and James M. White. 2016. “Making Sus-tainability Tangible: Land O’Lakes and the Dairy Supply Chain.” American Journal of Agricultural Economics, vol. 98, no. 2, pp. 648–657. Available at https://doi.org/10.1093/ajae/aav062
Boland, Michael A., John M. Crespi, and Tracy M. Turner. 2014. “Measuring Sunk Costs in Agricultural and Food Industry Assets: Why Some Assets Sell Below Appraisal.” Journal of Agricultural and Food Industrial Organization, vol. 12, no. 1, pp. 53–63. Available at https://doi.org/10.1515/jafio-2014-0009
Boland, Michael A., John M. Crespi, Jena Silva, and Tian Xia. 2012. “Measuring the Benefits to Advertising under Monopolistic Competition.” Journal of Ag-ricultural and Resource Economics, vol. 37, no. 1, pp.144–155.
Boland, Michael A., Hilda Pena, and Daniel Sumner. 2009. “Blue Diamond Growers and the World Almond Industry,” in M.A. Boland and E. Gallo, eds., International Agribusiness Strategy Cases: A Book in Honor of Professor Ray Goldberg, pp. 172–182. Manhattan, KS: K-State Printing Services.
Boland, Michael A., Bill Golden, and Leah Tsoodle. 2008. “Agency Problems in the Food Processing Industry.” Journal of Agricultural and Applied Economics, vol. 40, no. 2, pp. 623–34.
Çakır, Metin, Michael A. Boland, and Yanghao Y. Wang. 2018. “The Economic Impacts of 2015 Avian Influenza Outbreak on U.S. Turkey Industry and the Loss Mitigating Role of Free Trade Agreements.” Applied Economic Perspectives and Policy, vol. 40, no. 2, pp. 297–315. Available at https://doi.org/10.1093/aepp/ppx027

52 FEDERAL RESERVE BANK OF KANSAS CITY
Coase, Ronald. 1937. “The Nature of the Firm.” Economica, vol. 4, no. 16, pp. 386–405. Available at https://doi.org/10.1111/j.1468-0335.1937.tb00002.x
Coyle, William T., and Nicole Ballenger. 2000. “Technological Changes, Trans-portation Sector, Distance and U.S. Food and Agricultural Exports.” USDA Economic Research Service, Miscellaneous Publication no. 1566.
The Economist. 2018. “Trade Wars Threaten to Disrupt American Firms’ Global Supply Chains,” The Economist, May 3.
Fuller, Kate, Gary W. Brester, and Michael A. Boland. 2018. “Genetic Engineer-ing and Risk in Varietal Selection of Potatoes.” American Journal of Agri-cultural Economics, vol. 100, no. 2, pp. 600–608. Available at https://doi.org/10.1093/ajae/aax098
Gallo, Javier Ernesto. 2018. The Miracle of Peruvian Agribusiness Systems: Paradoxes and Opportunities. Washington D.C.: CreateSpace Independent Publishing Platform.
Gardner, Bruce L. 2002. American Agriculture in the Twentieth Century: How It Flourished and What It Cost. Cambridge, MA: Harvard University Press.
Gereffi, Gary, John Humphrey, and Timothy Sturgeon. 2005. “The Governance of Global Value Chains.” Review of International Political Economy, vol. 12, no. 1, pp. 78–104. Available at https://doi.org/10.1080/09692290500049805
Goldberg, Ray A. 2018. Food Citizenship: Food System Advocates in an Era of Dis-trust. Oxford: Oxford University Press.
Goldberg, Ray A., and Kerry Herman. 2006. “Nestlé’s Milk District Model: Eco-nomic Development for a Value-Added Food Chain and Improved Nutri-tion.” Harvard Business School Teaching Note 906-413, February.
———. 2005. “Nestlé’s Milk Districts: Case Supplement.” Harvard Business School Supplement 906-411, November.
Hart, Oliver. 2017. “Incomplete Contracts and Control.” American Economic Re-view, vol. 107, no. 7, pp. 1731–1752. Available at https://doi.org/10.1257/aer.107.7.1731
Holmström, Bengst. 1979. “Moral Hazard and Observability.” The Bell Journal of Economics, vol. 10, no. 1, pp. 74–91.
Johnson, Renée. 2016. “The U.S. Trade Situation for Fruit and Vegetable Prod-ucts.” Congressional Research Service 7-5700
Kalb, Loretta. 2015. “Sacramento City Unified Faces Criticism for Buying Chi-nese Canned Fruit,” The Sacramento Bee, November 15.
Kinsey, Jean D. 2001. “The New Food Economy: Consumers, Farms, Pharms, and Science.” American Journal of Agricultural Economics, vol. 83, no. 5, pp. 1113–1130.
Marshall, Maria I., Michael A. Boland, Daniel Conforte, and Deborah Cesar. 2002. “A Case Study of Beef Production and Export in Uruguay,” in Barry Krissoff, Mary Bohman, and Julie Caswell, eds., Global Food Trade and Con-sumer Demand for Quality. New York: Kluwer Academic/Plenum Publishers.
Martinez, Stephen. 2002. “Vertical Coordination of Marketing Systems: Lessons from the Poultry, Egg and Pork Industries.” Agricultural Economic Report, no. 807, May.
Office of the U.S. Trade Representative. 2016. “Free Trade Agreements.” Available at https://ustr.gov/trade-agreements/free-trade-agreements

ECONOMIC REVIEW • SPECIAL ISSUE 2018 53
Ostrom, Elinor. 1990. Governing the Commons: The Evolution of Institutions for Collective Action. Cambridge: Cambridge University Press.
Porter, Michael E. 1980. Competitive Strategy. New York: The Free Press. Pozo, Veronica, Michael A. Boland, and Daniel Sumner. 2009. “Sunkist Growers:
Refreshing the Brand.” Review of Agricultural Economics, vol. 31, no. 3, pp. 628–639.
Reardon, Thomas, C. Peter Timmer, Christopher Barrett, and Julio Berdegué. 2003. “The Rise of Supermarkets in Africa, Asia, and Latin America.” Ameri-can Journal of Agricultural Economics, vol. 85, no. 5, pp. 1140–1146.
Risch, Corey C., Michael A. Boland, and John M. Crespi. 2014. “Survival of U.S. Sugar Beet Plants from 1897 to 2011.” Agribusiness, vol. 30, no. 3, pp. 265–277. Available at https://doi.org/10.1002/agr.21372
Rodriguez, Robert. 2018. “California Peach Canners Feeling Sour over Schools Buying Imported Food,” The Fresno Bee, April 19.
Rodrik, Dani. 2018. “What Do Trade Agreements Really Do?” Journal of Eco-nomic Perspectives, vol. 32, no. 2, pp.73–90.
Sexton, Richard J. 2012. “Market Power, Misconceptions, and Modern Agricul-tural Markets.” American Journal of Agricultural Economics, vol. 95, no. 2, pp. 209–219.
———. 2000. “Industrialization and Consolidation in the U.S. Food Sector: Implications for Competition and Welfare.” American Journal of Agricultural Economics, vol. 82, no. 5, pp. 1087–1104.
Sporleder, Thomas L., and Michael A. Boland. 2011. “Exclusivity of Agrifood Supply Chains: Seven Fundamental Economic Characteristics.” International Food and Agribusiness Management Review, vol. 14, no. 5, pp. 27–51.
Sumner, Daniel, Julian Alston, and Joseph Glauber. 2010. “Evolution of the Eco-nomics of Agricultural Policy.” American Journal of Agricultural Economics, vol. 92, no. 2, pp. 403–23.
Taylor, April. 2017. “Profiles of Top U.S. Agricultural Ports.” USDA Agricultural Marketing Service, April. Available at https://www.ams.usda.gov/sites/de-fault/files/media/PortProfiles2017.pdf
Wang, Zhi, William T. Coyle, Mark Gehlhar, and Tom Vollrath. 2000. “The Im-pact of Distance on U.S. Agricultural Exports: An Econometric Analysis,” in William Coyle and Nicole Ballenger, eds., Technological Changes in the Trans-portation Sector–Effects on U.S. Food and Agricultural Trade. USDA Economic Research Service, Miscellaneous Publication no. 1566.
Williamson, Oliver E. 2005. “The Economics of Governance.” The Ameri-can Economic Review, vol. 95, no. 2, pp. 1–18. Available at https://doi.org/10.1257/000282805774669880

Wage and salary workers account for two-thirds of average employment in U.S. agriculture, which has 2.3 million full-time equivalent jobs. Hired farm workers are concen-
trated in three interrelated ways: by commodity, area, and size of farm. Two-thirds of the farm wages covered by unemployment insurance are paid to workers employed by five of 20-plus North American Industry Classification System (NAICS) sectors: crop support services, fruits and nuts, greenhouses and nurseries, dairies, and vegetable farms.
About 70 percent of hired crop workers employed on U.S. farms were born in Mexico, and 70 percent of these Mexican-born workers are unauthorized, making half of the crop workforce unauthorized. Crop workers are aging and settling; the flexible fresh blood in the crop work-force are H-2A guest workers, over 90 percent of whom are from Mexico.
As labor costs rise, farm employers are adopting “4-S” strategies: satisfy current workers to retain them, stretch workers with mechani-cal aids that increase their productivity, substitute machines for workers or switch to less labor-intensive crops, and supplement current workers with H-2A guest workers. Satisfy and stretch are shorter-term strate-gies, while substitute and supplement are longer-term options. Produce buyers can also buy abroad, setting up a race between imports, ma-chines, and guest workers as sources of labor-intensive commodities.
Agriculture and International Labor Flows
By Philip Martin
Philip Martin is a professor emeritus of agricultural and resource econom-ics at the University of California-Davis. This article is on the bank’s website at www.KansasCityFed.org
55

56 FEDERAL RESERVE BANK OF KANSAS CITY
Farm-related businesses often hire workers similar to farm work-ers—that is, immigrants with few other U.S. job options. However, workers in food processing are more diverse, including a significant share of refugees in meatpacking. Agriculture and farm-related indus-tries usually offer jobs rather than careers, explaining why many em-ployers have expressed more interest in recruiting new workers than in trying to retain current employees.
I. International Migration
The number of international migrants—persons living outside their country of birth for at least a year—more than doubled from 1980 to 2015 from 103 million to 244 million. As of 2015, interna-tional migrants make up 3.3 percent of the world’s people (United Na-tions Department of Economic and Social Affairs 2015). The number of international migrants is projected to increase faster than the world’s population. By 2050, when there are projected to be almost 10 billion people, there could be 400 million international migrants, equivalent to the world’s fifth-most populous country (Evans 2010).
Most people do not migrate, and those who cross national bor-ders typically move only a short distance. This means that regional mi-gration systems are more important than global migration systems, as most people move between neighboring countries. The largest migra-tion corridor is from Mexico to the United States, which involves 12 million people, or 10 percent of people born in Mexico. Other sig-nificant corridors involve 3 to 4 million people moving from Russia to Ukraine, from Bangladesh to India, and from Ukraine to Russia. The Russia-Ukraine corridor highlights the importance of two-way migra-tion flows: slightly more Russians moved to Ukraine than Ukrainians to Russia (World Bank 2016).1
International migration patterns can be examined in many ways, including whether the sending and receiving countries are developing or industrial (with a per capita income of $13,000 or more in 2015). Some 58 percent of international migrants in 2015 were in industrial countries that have a sixth of the world’s people, including 85 million people from developing countries (Table 1). Another 55 million migrants moved from one industrial country to another, as from Canada to the United States. Some 90 million people moved from one developing country to

ECONOMIC REVIEW • SPECIAL ISSUE 2018 57
another, as from Bangladesh to Malaysia or Nicaragua to Costa Rica. And 13 million people moved from an industrial country to a develop-ing country.
North America, which includes Canada and the United States, has 5 percent of the world’s people and 22 percent (54 million) of the world’s international migrants. Canada has one of the highest shares of foreign-born residents at 20 percent, while the United States has the most international migrants at 44 million; 14 percent of U.S. residents are international migrants.
Canada and the United States are traditional countries of immi-gration with systems to select settlers. Most Canadian immigrants are admitted after one member of the family achieves enough points for education, knowledge of English or French, and having a Canadian job offer, while most U.S. immigrants are sponsored by U.S.-based rela-tives. Many economists as well as President Donald Trump have urged the United States to adopt a Canadian-style points- or merit-based se-lection system that favors skilled workers over family members (Orre-nius and Zavaodny 2010). The United States has the most unauthor-ized migrants of any country, over 11 million in 2016.
Migration is sometimes called international flow without a global governance regime. By comparison, global cooperation led the World Trade Organization to reduce barriers to cross-border flows of goods and capital. Migration’s “missing regime” means that United Nations (UN)
Table 1International Migration 2015
Origin
Destination
Industrial (millions)
Developing (millions)
Total (millions)
Industrial 55.5 13.2 68.7
Developing 85 90 175
Total 140.5 103.2 243.7
Shares (percent)
Industrial 23 5 28
Developing 35 37 72
Total 58 42 100
Source: United Nations Department of Economic and Social Affairs (UN DESA) 2015.

58 FEDERAL RESERVE BANK OF KANSAS CITY
agencies such as the International Labor Organization (ILO) and the UN High Commissioner for Refugees (HCR) set out global norms for workers who cross borders and refugees fleeing persecution but do not advise governments on how many migrants to send abroad or accept.
The ILO, for example, does not seek to reduce barriers to labor migration. Instead, the ILO aims to ensure migrant workers are treated the same as local workers. The UN HCR cares for people outside their country of citizenship who face persecution due to “race, religion, na-tionality, membership of a particular social group or political opinion.” Many migrants cross borders and apply for asylum, as with the million who moved to Germany in 2015, and the UN HCR and governments determine whether these applicants for asylum are, in fact, refugees.
One reason that UN agencies focus on conditions for migrants rather than the number of migrants is that a key element of national sovereignty is determining who can enter and what noncitizens may do within national borders. Governments have been more willing to allow UN agencies to set standards for the treatment of international mi-grants than to yield sovereignty over decisions about who can enter their countries. The stalled Doha round of General Agreement on Trade in Services (GATS) negotiations failed to reduce barriers to service-worker movements, as industrial countries rejected proposals made by develop-ing countries to facilitate the entry of migrant service providers.2
Most migrants move to neighboring countries or remain within a regional grouping of countries, as from Mexico to the United States or within the 27-member European Union, explaining why most migra-tion flows are regulated unilaterally, bilaterally, or regionally. The most common migration policy is unilateral, as when governments decide how to respond to employers who request permission to recruit and employ guest workers. Some labor flows are regulated bilaterally, as with the Canada-Mexico Seasonal Agricultural Worker Program, and some regional agreements permit the free movement of workers within a region, as with the European Union.
The arrival of over a million asylum seekers in Europe in 2015 and an upsurge in Central American women and children seeking asylum in the United States prompted global leaders in September 2016 to propose a Global Compact for “safe, orderly, and regular” Migration (GCM) that includes common principles to strengthen the global

ECONOMIC REVIEW • SPECIAL ISSUE 2018 59
governance of migration and to promote the positive contributions of migrants (see Rural Migration News 2017).
A draft GCM, expected to be signed by world leaders in Morocco in December 2018, has 23 recommendations, including two on la-bor migration. GCM recommendation five calls on governments to open “regular pathways” to migrant workers that reflect “demographic and global labour market realities” by developing model labor mobility agreements by sector, such as for agriculture and hotels, and allowing migrant workers to arrive with their families. Recommendation six calls for fair and ethical recruitment, including prohibiting recruiters from charging fees to migrant workers and enforcing expansive joint liability so that firms using contractors to bring migrants into workplaces are jointly liable for any labor law violations. Finally, the draft GCM asserts migrant guest workers should be able to change employers to escape exploitative employers, but it does not discuss whether employers who paid all of the costs of the migrant workers they bring into a country would be compensated if their employees changed employers.
The United States withdrew from the GCM negotiations in De-cember 2017, saying the negotiations were “inconsistent with U.S. im-migration and refugee policies and the Trump Administration’s immi-gration principles.” Many other migrant-receiving countries are likely to reject the GCM’s approach, which calls on governments to admit immigrants entitled to settle rather than guest workers expected to leave when their contracts end.3
II. Agricultural Employment
There is no comprehensive measure of employment on U.S. farms. The Bureau of Labor Statistics (BLS) projects stable average employ-ment of 1.5 million wage and salary workers in U.S. agriculture be-tween 2016 and 2026, while self-employed farm operators and fam-ily members are projected to drop slightly from 850,000 to 828,000 (Table 2). Wage and salary employment rose 23 percent from 2006 to 2016, from 1.2 million to 1.5 million, reflecting the concentration of farm production on fewer and larger farms that rely more on hired workers and expanded production of labor-intensive commodities such as strawberries.

60 FEDERAL RESERVE BANK OF KANSAS CITY
There are several other measures of average hired farm worker em-ployment. The National Agricultural Statistics Service (NASS) from the U.S. Department of Agriculture (USDA) reports an average 730,000 farm workers hired in the United States in 2016, 22 percent of whom were hired in California, down from 750,000 in 2006, 21 percent of whom were hired in California. NASS excludes agricultural service workers brought to farms by farm labor contractors (FLCs) and other nonfarm employers. According to the BLS’s Quarterly Census of Em-ployment and Wages (QCEW), more workers in California are brought to farms by nonfarm crop support services (an average 215,000 workers in 2016) than are hired directly by crop farmers (an average 173,000 workers in 2016).4
The QCEW reports employment and wages paid to workers cov-ered by unemployment insurance (UI). The BLS estimates that 81 per-cent of all hired workers on farms were covered in 2016. QCEW data show farm worker employment rose almost 20 percent from 2006 to 2016, reflecting both the expanded production of berries, cherries, and other labor-intensive commodities and more large-farm employers that satisfy the federal 10/20 rule requiring them to enroll in the unemploy-ment insurance system.5
For example, average UI-covered employment in Wisconsin dair-ies rose 87 percent from 2006 to 2016, from 7,600 to 14,200. The number of dairy cows was stable at 1.2 million over the decade, but the number of Wisconsin dairies rose from 700 to 1,100, reflecting fewer and larger dairies in the state. In California, the number of dairy cows was stable at 1.9 million over the decade, though the number of dairy establishments fell from 1,600 to 1,200, and hired worker employment rose slightly from 17,600 to 18,000.
Table 2Agricultural Sector Employment, 2006–26
Sector2006
(thousands)2016
(thousands)2026
(thousands)Change, 2006–16
(percent)Change, 2016–26
(percent)
Ag wage and salary 1,219 1,501 1,518 23 1
Ag self-employed 893 850 828 −5 −3
Total ag 2,112 2,351 2,346 11 0
Hired share (percent) 58 64 65
Source: U.S. Bureau of Labor Statistics.

ECONOMIC REVIEW • SPECIAL ISSUE 2018 61
These average employment data are not a count of unique farm workers. Due to seasonality and turnover, there are more farm work-ers than average or full-time equivalent jobs. California extracted all Social Security numbers reported by agricultural employers and found that 848,000 unique workers filled the state’s average 421,300 agricul-tural jobs in 2015, two workers per year-round equivalent job (Martin, Hooker, and Stockton 2017). Earlier studies found an average three workers per year-round equivalent job. The reduction from three to two workers per job reflects longer seasons in many crops and reduced flows of workers into and out of the farm workforce.
QCEW data consider a year-round job to be 52 weeks at 40 hours a week or 2,080 hours a year. Analysts divide total wages by average jobs during the four reference weeks of each year to obtain an average annual wage for California farm workers of $30,300 or $14.55 an hour for all of those employed on farms, including hired managers, supervi-sors, and field and livestock workers.
However, most farm workers are not employed full time and thus earn less, making headlines that suggest average earnings for field and livestock workers are $15 an hour and $30,000 a year misleading (Kitroeff and Mohan 2017). California took all Social Security num-bers reported by agricultural employers and assigned farm workers who had more than one job to the NAICS or commodity in which they had their highest earnings (Table 3).6 The average earnings of the 705,000 primary farm workers, those whose highest earnings from all jobs were in agriculture, were $17,400 in 2015—57 percent of the $30,300 aver-age of all persons with at least one agricultural job. Although hours of work data are not collected, the fact that primary farm workers earn less than $30,300 reflects a combination of wages lower than $14.55 an hour and fewer than 2,080 hours of work.
Primary farm workers whose maximum earnings were in cattle or dairy had average wages that were 85 percent of what a year-round work-er would have earned. However, those employed by farm labor contrac-tors (FLCs), the largest employment category, earned 44 percent of what a year-round worker would have earned, less than $10,000. The com-modities with the most workers, FLCs and fruits and nuts, had work-ers with the largest gaps between what a year-round worker would have earned and what the average worker actually earned (Martin, Hooker,

62 FEDERAL RESERVE BANK OF KANSAS CITY
and Stockton 2017). About 10 percent of workers whose maximum earnings were in California agriculture in 2015 earned 85 percent or more of what a year-round worker would have earned.
The QCEW provides commodity- and county-specific data on farm employment and wages, and QCEW data have been used to determine whether changes in average wages indicate labor shortages. Hertz and Zahniser (2013) find evidence of possible farm labor shortages in some commodities and counties.
III. Hired Farm Workers
Several data sources provide partial pictures of the characteristics and earnings of farm workers, making farm worker demographics akin to a room of unknown size and shape, with each data source analo-gous to a window into the room. Some windows are large and clear, while others are small and clouded, making it hard to draw an accurate portrait of the people who work for wages on U.S. farms.
Table 3California Primary Worker Average Annual Earnings, 2015
Commodity
Number of primary
workers
Primary worker earnings (mil-lions of U.S.
dollars)
Average primary worker earnings (U.S. dollars)
Average pri-mary / average FTE earnings
(percent)
Agriculture, forestry, fish 705,000 12,288 17,434 58
Crop production 260,000 5,554 21,467 66
Vegetables and melons 48,500 1,232 25,818 68
Fruits and nuts 154,000 2,850 17,008 57
Greenhouse 32,700 981 30,007 84
Other crops 18,000 452 25,117 68
Animal production 32,700 983 30,061 86
Cattle and ranch 25,800 789 30,389 85
Dairy cattle 20,234 614,889 30,389 87
Support activities for agriculture and forestry 408,670 5,602 13,709 50
Support activities for crop production 403,000 5,440 13,498 50
Soil prep 17,900 358 19,971 53
Postharvest crop activities 62,310 1,549 24,859 65
FLCs 293,900 2,903 9,878 44
Farm management services 16,800 407 24,307 66
Source: Martin, Hooker, and Stockton (2017).

ECONOMIC REVIEW • SPECIAL ISSUE 2018 63
The National Agricultural Workers Survey (NAWS) provides the most comprehensive data, but it does not interview H-2A guest work-ers or livestock workers.7 The NAWS finds that 70 percent of U.S. and 85 percent of California crop workers were born in Mexico, usually in the west central states of Jalisco, Guanajuato, and Michoacán. These Mexican-born workers are aging and settling, with an average age of 39 compared with the median age of all U.S. workers, 42. NAWS crop workers have, on average, 15 years of U.S. farm work experience, and many are reaching the age at which workers traditionally move out of heavy hand-harvest jobs such as picking fruit from ladders.
Most crop workers live with their families in one place—that is, most are not migrants who follow the ripening crops, which explains why three-fourths of crop workers have just one farm employer during the year. The families of crop workers usually include children who are U.S. citizens, and over half of NAWS families receive some form of public assistance. The NAWS interviews mostly semiskilled equip-ment operators, irrigators, and other workers involved in nonharvest tasks; fewer than 20 percent of the interviewees were in harvesting jobs. Aging and settling crop workers average 35 weeks of work a year, and one-fourth have at least one nonfarm job.
Foreign-born newcomers have been the flexible fresh blood in the farm workforce over the past two decades. Unauthorized newcomers from rural Mexico, who made up over 20 percent of the NAWS sample in 2000, were willing to move to labor-short areas and fill vacant jobs. These newcomers now make up only 1 percent of the NAWS sample, and the decline in newcomers helps to explain why less than 5 percent of NAWS workers have at least two farm jobs 75 miles apart.
The United States apprehends about 1,000 foreigners a day just inside the Mexico-U.S. border: 304,000 in fiscal year 2017, down from 530,000 in fiscal year 2016.8 Many of those apprehended have paid $5,000 or more to smugglers and, if they elude the Border Patrol and enter the United States, are unlikely to seek seasonal farm jobs. This means that the 2007–09 recession may have marked the end of the era of abundant and flexible unauthorized Mexican farm workers. Today’s newcomers to farm work are mostly authorized Mexican workers with H-2A visas that tie them to a particular employer and job.
Other data paint different pictures of farm workers. The Cur-rent Population Survey (CPS) estimates average U.S. hired worker

64 FEDERAL RESERVE BANK OF KANSAS CITY
employment at 787,000 in 2012, one-third of whom work in Califor-nia. The CPS reports an average 676,000 farm laborers and field su-pervisors: over 80 percent of these workers are male with a median age of 34, one-half are Hispanic, 45 percent are foreign-born, 60 percent are U.S. citizens, one-half are married, and one-third have less than a ninth grade education. In other words, CPS data suggest a younger, better educated, and less Hispanic farm workforce than is reported in the NAWS.
IV. 4-S Responses
Farm employers are adjusting to the arrival of fewer unauthorized Mexican newcomers with 4-S strategies: satisfying current workers, stretching them with mechanical aids that increase productivity, sub-stituting machines for workers where possible and switching to less la-bor-intensive crops, and supplementing current workforces with H-2A guest workers. Satisfying and stretching are short-term responses, while mechanization, crop switching, guest workers, and imports are longer-term responses.
Most farmers believe that the supply of labor inside U.S. borders is fixed or inelastic, so that higher wages shuffle workers between farms rather than attracting more U.S. workers into farm work. This belief prompts some farmers to offer benefits and bonuses to satisfy current workers to retain them. Surveys find that many workers resent being seen as interchangeable members of crews that can range from 20 to 60 workers, with crew leaders favoring some workers over others and harassing some women. Training first-level supervisors and developing mechanisms to reduce favoritism and harassment may satisfy current workers and keep them on one farm longer.
Stretching workers means increasing their productivity. Most fruits and vegetables are over 90 percent water, and workers spend much of their time carrying harvested produce down ladders to bins or to the end of rows to receive credit for their work. Three major changes could increase worker productivity. Management changes include better scheduling and coordination between sales and production teams to reduce worker wait-ing time and maximize hours of work. Repicking fields twice instead of three times—leaving more produce to pick on each pass through the field—can raise workers’ piece rate earnings and reduce hours per acre.

ECONOMIC REVIEW • SPECIAL ISSUE 2018 65
Dwarf trees mean smaller ladders and faster picking, making fruit-har-vesting jobs more attractive to women and older workers.
Slow-moving conveyor belts in front of workers reduce the need for harvesters to carry bags or trays of harvested produce, enabling them to pick faster. The machine sets the pace of work, so workers harvesting lettuce, broccoli, and other vegetables behind a conveyor belt are often paid hourly wages and offered a group bonus rather than individual piece rates. Strawberry pickers may work for individual piece rates with and without conveyor belts, but crews behind conveyor belts become more homogeneous as slower pickers drop out.
Substitution means replacing workers with machines. Many fresh fruits and vegetables are fragile, and human hands are gentler than me-chanical fingers on fresh table grapes or peaches. Machines are fixed costs, and workers are variable costs, meaning that farmers of commod-ities with uncertain futures may be reluctant to invest in machines, as with smaller raisin grape growers and producers of traditional apple va-rieties. When there are profitable alternative crops, some farmers switch from hand-harvested to more mechanized crops, as from raisin grapes to almonds in the San Joaquin Valley.
Farmers anticipating too few seasonal workers have been able to supplement their workforces with legal guest workers under the 1917–21 and 1942–64 Mexico-U.S. Bracero programs and under the H-2 and H-2A programs since 1952 (Martin 2009). Receiving Department of Labor certification to employ H-2A guest workers requires employ-ers to satisfy three major obligations: trying and failing to recruit U.S. workers, providing free and approved housing to guest workers, and paying the state or regional Adverse Effect Wage Rate—$13.18 in Cali-fornia in 2018.
The H-2A program evolved from a World War II program that im-ported mostly Jamaicans to cut sugarcane in Florida and pick apples along the eastern seaboard. The program shrank after enactment of the Immigration Reform and Control Act of 1986 (IRCA), which imposed sanctions on U.S. employers who knowingly hired unauthorized workers (Martin 2014). The IRCA also legalized over 1.1 million unauthorized farm workers, three times the estimated number of persons who quali-fied by having done at least 60 days of farm work in 1985–86. Many of those who became immigrants via the Special Agricultural Worker pro-

66 FEDERAL RESERVE BANK OF KANSAS CITY
gram used false documents, which created an industry to provide false documents to other unauthorized foreigners to satisfy the I-9 worker documentation requirements. In this way, the IRCA increased rather than decreased illegal migration (CAW 1992; Martin 1994).
The IRCA helped to spread legal and unauthorized Mexican-born workers throughout U.S. agriculture (CAW 1992). Meanwhile, the Florida sugarcane harvest was mechanized in response to worker suits alleging underpayment of wage. Only 15,100 farm jobs were certified to be filled with H-2A guest workers in fiscal year 1995, including a quarter in tobacco (Martin 2004).
The H-2A program remained small and concentrated on the east-ern seaboard until the 2007–09 recession, when the slowdown in unau-thorized Mexico-U.S. migration prompted California and Washington farmers to request more H-2A workers (Chart 1). Over 200,000 farm jobs were certified to be filled with H-2A workers in fiscal year 2017, including almost 22,000 in berries, 12,700 in apples, and 12,500 in tobacco.
Most H-2A workers are in the United States less than the usual 10-month maximum stay permitted: at an average stay of six months, 200,000 H-2A jobs means that 100,000 or 10 percent of the million full-time equivalent jobs in U.S. crop agriculture are filled by H-2A workers. In the mid-1950s, when the employment of hired farm work-ers averaged 2 million, a peak 450,000 Bracero guest workers filled 20 percent of crop jobs. If the H-2A program continues to expand, H-2A workers will be a higher share of the farm workforce than Braceros were in the mid-1950s.
H-2A workers are brought into the United States through several mechanisms. The most common mechanism is direct employment, when a farmer works with a U.S. lawyer or agent to recruit guest work-ers abroad and transport them to the United States, making the farmer responsible for ensuring program regulations are followed. The second mechanism involves employer associations such as the NC Grow-ers Association or the Washington Farm Labor Association recruiting and transporting H-2A workers, sometimes moving them from one farm to another to ensure H-2A workers are fully employed; in this mechanism, the association is jointly liable with farmers for violations of program rules. The third mechanism involves farm labor contractors

ECONOMIC REVIEW • SPECIAL ISSUE 2018 67
such as Fresh Harvest moving H-2A workers from one farm to another. All three mechanisms are expanding.
V. Imports
An alternative to producing labor-intensive commodities in the United States is importing them from lower-wage countries. About half of the fresh fruit and one-third of the fresh vegetables consumed in the United States are imported. Mexico accounts for about half of U.S. fruit imports and two-thirds of U.S. fresh vegetable imports, and since 2014, the United States has had an agricultural trade deficit with Mex-ico despite exporting $4 billion worth of corn and soybeans in 2016 and $2.5 billion worth of pork and dairy products.9 The leading U.S. imports from Mexico were fresh and frozen fruits and vegetables worth $11 billion, representing almost half of the $23 billion of U.S. agricul-tural imports from Mexico in 2016 (Chart 2).
Mexico’s export-oriented vegetable agriculture has been trans-formed over the past two decades, in part with U.S. capital and exper-tise. Many Mexican growers have protected culture structures, growing berries, tomatoes, and other vegetables under metal hoops encased in plastic, reducing pest and disease problems; controlled entry and exit
Chart 1H-2A Jobs Certified and Visas Issued, 2005–16
Note: The number of jobs certified exceeds the number of visas issued because some H-2A workers fill more than one job, and some employers who are certified do not recruit all of the H-2A workers they could. Sources: U.S. Departments of Labor and State.
0.2
0.4
0.6
0.8
1.0
1.2
1.4
1.6
1.8
20,000
40,000
60,000
80,000
100,000
120,000
140,000
160,000
180,000
2005 2006 2007 2008 2009 2010 2011 2012 2013 2014 2015 2016
Certified jobs per visa issuedNumber
Jobs certified (L)Visas issued (L)Jobs/visa (R)

68 FEDERAL RESERVE BANK OF KANSAS CITY
reinforces worker adherence to food safety protocols. Yields are up to three times higher for crops grown under protected culture than those grown in open fields.
The North American Free Trade Agreement (NAFTA) accelerated the adoption of science-based standards to evaluate the risk of trans-mitting pests and diseases across the border and promoted rapid trans-border shipments of perishable commodities, encouraging some U.S. growers and packers to form partnerships with Mexican growers to pro-duce for U.S. supermarkets. Supply chains are integrated in the sense that a U.S. grower-packer may sign a contract to supply produce year-round to a U.S. fast-food restaurant or supermarket chain and grow the requisite produce in both the United States and Mexico.
Immigration enforcement, NAFTA renegotiations, and guest worker bills pending in Congress could reshape the farm-labor land-scape. The Trump Administration has stepped up border enforcement, which has reduced apprehensions of foreigners just inside the U.S. border. Increased efforts to detect and remove unauthorized foreign-ers convicted of U.S. crimes means that searches for criminals in im-migrant neighborhoods may detect other unauthorized foreigners who have not been convicted of U.S. crimes, spreading fear in immigrant neighborhoods, especially when state and local police agencies coop-
Chart 2Mexico-U.S. Agricultural Trade, 1990–2016
Source: U.S. Census Bureau.
5
10
15
20
25
5
10
15
20
25
U.S. exports
U.S. imports
1990
1991
1992
1993
1994
1995
1996
1997
1998
1999
2000
2001
2002
2003
2004
2005
2006
2007
2008
2009
2010
2011
2012
2013
2014
2015
2016
Billions of U.S. dollars Billions of U.S. dollars

ECONOMIC REVIEW • SPECIAL ISSUE 2018 69
erate with the federal Immigration and Customs Enforcement (ICE) agency. Farmers report that many of their workers stay home after ICE searches or news of police activity that could lead to their detection.
Candidate Trump called NAFTA “the worst trade deal ever nego-tiated by the U.S. government,” and President Trump threatened to withdraw the United States from NAFTA if Canada and Mexico re-fused to renegotiate the agreement, which went into effect in 1994. NAFTA promoted the integration of fruit and vegetable supply chains, and a revised NAFTA could slow the growth of Mexican fruit and veg-etable exports.
The H-2A program could be modified by legislation. The House Judiciary Committee approved the Agricultural Guestworker Act (HR 4092) in October 2017 to make it easier for U.S. farmers to hire legal foreign farm workers. HR 4092 is included in the Securing America’s Future Act (HR 4760), which House Speaker Paul Ryan has promised to bring to the floor if it can win majority support among Republicans.
HR 4092 would replace the current H-2A program with a new H-2C program allowing up to 450,000 guest workers to be admitted each year, including 40,000 for meatpacking. The number of H-2C visas could rise by 10 percent in the next year if all visas were requested in the previous year. Currently unauthorized workers would have to return to their countries of origin and re-enter the United States with H-2C visas to be employed legally.10 Each H-2C visa would be valid for 24 months, so there could be 900,000 H-2C workers after two years.
Employers of H-2C guest workers, who could offer year-round farm or farm-related jobs in dairies, timber, food processing, and meat-packing, would attest to their need for guest workers after posting job vacancies with state workforce agencies. They would have to hire qualified U.S. workers until the date that their guest workers departed at their own expense for U.S. jobs. Employers would not have to provide H-2C guest workers with free housing while employed in the United States, but H-2C guest workers could switch to other employers after the E-Verify system to check the legal status of new hires became man-datory for all employers. Employers would have to pay H-2C workers at least 115 percent of the federal or state minimum wage, or $8.34 an hour in states with the federal minimum wage of $7.25.

70 FEDERAL RESERVE BANK OF KANSAS CITY
HR 4092 is another in a long line of guest worker bills that aim to eliminate the need for farmers to use lawyers to hire foreign farm work-ers, but it is unlikely to be enacted. Democrats and worker advocates oppose ending current employer recruitment, housing, and Adverse Ef-fect Wage Rate (AEWR) requirements; furthermore, some Republicans do not want to “reward” currently unauthorized workers with guest worker visas. Finally, many farm groups oppose the cap on admissions, arguing that 450,000 visas are insufficient.
VI. Farm-Related Workers
The U.S. food and fiber system includes over 21 million work-ers: many are employed in input industries that range from banking to equipment manufacturing to chemicals and fertilizer, many are em-ployed on farms, and many are employed in output industries that in-clude food and beverage manufacturing, transportation, food retailing and food service, and eating and drinking places. The USDA’s Eco-nomic Research Service (ERS) estimated that the average 2.6 million jobs on farms in 2016 accounted for one-eighth of the 21.4 million jobs in the food system; jobs in food service and eating and drinking places accounted for 57 percent of food-system jobs (Chart 3).
Some nonfarm businesses related directly to production agriculture hire workers who are similar to farm workers—that is, immigrants with few other U.S. job options. For example, workers employed in seasonal food-packing and -processing industries are often immigrants from Mexico or the children of such immigrants. Year-round meatpacking and dairy-processing firms employ more U.S. citizens and legal immi-grants, including a significant number of refugees.
Over half of food system jobs are in food services, including res-taurants and bars. The workers employed in these service industries include young adults working their first jobs in fast-food restaurants, many part-time workers employed in a wide array of casual and fine dining establishments, and food-preparation workers and cooks, some of whom are immigrants. As with production agriculture, many food-related industries offer jobs rather than careers, explaining high worker turnover and an employer focus on recruitment rather than retention.
President George W. Bush encouraged Congress to enact compre-hensive immigration reform in 2006–07, and ICE mounted raids in

ECONOMIC REVIEW • SPECIAL ISSUE 2018 71
meatpacking to check the legal status of workers to demonstrate seri-ousness about “closing the labor market door” to unauthorized workers. Six Swift & Company plants were targeted on December 12, 2008, and almost 1,300 or 20 percent of the 7,000 workers on the first shift at these plants were arrested. Swift and the United Food and Commer-cial Workers International Union, which represented workers at five of the six plants, denounced the raids, but Swift’s need to raise wages to resume operations and other issues led to its sale to JBS in July 2007 (Rural Migration News 2007).
VII. Conclusions
Hired farm workers do most of the work on U.S. farms, and their share of the workforce is rising as agriculture restructures into fewer and larger farms. The Census of Agriculture (COA) reported that over 600,000 farms paid wages to hired workers in 2012, but only one-sixth of these COA “farm employers” were registered with the UI system, which includes over 80 percent of hired farm workers.
Hired farm workers are mostly Mexican-born men who have settled in the United States and have families that often include U.S.-citizen
Chart 3. U.S. Food System Employment, 2016
Source: USDA Economic Research Service.
12.2 million jobs
2.6
0.9
1.9
0.5
3.2
Food service, eatingand drinking places(6.3% of U.S. employment)
Food and beverage stores(1.7 percent)
Textile, apparel, and leather manufacturing(0.2 percent)
Food, beverage, and tobacco
manufacturing(1.0 percent)
Forestry, fishing, and related activities(0.5 percent)
Farming(1.4 percent)

72 FEDERAL RESERVE BANK OF KANSAS CITY
children. Few are willing to migrate from farm to farm seeking jobs, although the growing share of crop workers who are employed by FLCs must sometimes commute long distances to jobs from their homes to the jobs that have been arranged for them—sometimes two hours one way, as from Stockton to Napa, California. The children of farm work-ers educated in the United States rarely follow their parents into the fields for extended periods.
Rising farm wages and fewer flexible and unauthorized newcomers have encouraged many farm employers to adopt the 4-S strategies of satisfying their current workers to retain them, stretching them with mechanical aids, substituting machines for workers, and supplementing current workers with H-2A guest workers. The most viable long-term strategies are mechanization and guest workers, although trade policies could spur or shrink imports of labor-intensive commodities.
Nonfarm businesses that process and pack farm commodities hire workers who are similar to farm workers, but the workforces in year-round farm-related jobs include higher shares of U.S. citizens and legal immigrants such as refugees. Workers in seasonal food packing and pro-cessing industries are more similar to farm workers.

ECONOMIC REVIEW • SPECIAL ISSUE 2018 73
Endnotes
1The next largest bilateral migration flows involve 2 to 3 million migrants from Turkey to Germany, Kazakhstan to Russia and Russia to Kazakhstan, China to Hong Kong, and India to the United Arab Emirates.
2Developing countries led by India aimed to reduce barriers to the “move-ment of natural persons” who provide services over borders in the GATS ne-gotiations’ so-called Mode 4 provision of services by exempting migrant service providers from minimum wage and payroll tax obligations. These countries also called for an end to economic needs tests that give local workers first priority for vacant jobs. Industrial countries rejected these requests, making exceptions for intracorporate transfers of managers and skilled workers between subsidiaries of multinational corporations.
3For a critique of GCM recommendations five and six see https://migration.ucdavis.edu/rmn/blog/post/?id=2163
4California requires all agricultural employers to cover their workers under unemployment insurance.
5Federal law has since 1978 required farms employing 10 or more workers for 20 weeks in a year, or paying $20,000 in wages in a quarter, to register and pay UI taxes on their employees’ wages. Some states including California require smaller farm employers to register and pay UI taxes. The BLS estimates that average em-ployment in U.S. agriculture (NAICS 11) was 1.6 million in 2016; 81 percent of these workers were covered by the UI system.
6Primary farm workers were those with their highest earnings in agriculture in 2015. Some 136,000 workers had at least one farm job in 2015 but had their highest earnings in a nonfarm job.
7Martin (2017) includes a more complete analysis of NAWS data.8Data from Table 33 of the forthcoming 2017 DHS Yearbook of Immigra-
tion Statistics.9These commodities were one-third of the $18 billion of U.S. agricultural
exports to Mexico in 2016.10Currently unauthorized workers would have a year after enactment to sat-
isfy this touch-back requirement, and could receive pre-approval for re-entry with the support of their current farm employer.

74 FEDERAL RESERVE BANK OF KANSAS CITY
References
Commission on Agricultural Workers (CAW). 1992. Report of the Commission on Agricultural Workers.
Evans, Robert. 2010. “World Migrants Could Total 405 Million by 2050.” Re-uters, November 28.
Hertz, Tom, and Steven Zahniser. 2013. “Is There A Farm Labor Shortage?” Amer-ican Journal of Agricultural Economics, vol. 95, no. 2, pp. 476–481. Available at https://doi.org/10.1093/ajae/aas090
Kitroeff, Natalie, and Geoffrey Mohan. 2017. “Wages Rise on California Farms. Americans Still Don’t Want the Job.” Los Angeles Times, March 17.
Martin, Philip. 2017. “Immigration and Farm Labor. Challenges and Issues.” Gi-annini Foundation of Agricultural Economics, June.
———. 2014. “The H-2A Program; Evolution, Impacts, and Outlook,” in David Griffith, ed., (Mis)managing Migration: Guestworkers’ Experiences with North American Labor Markets, pp. 33–62. Santa Fe: SAR Press.
———. 2009. Importing Poverty? Immigration and the Changing Face of Rural America. New Haven: Yale University Press.
———. 1994. “Good Intentions Gone Awry: IRCA and U.S. Agriculture.” The Annals of the Academy of Political and Social Science, vol. 534, pp. 44–5. Avail-able at https://doi.org/10.1177%2F0002716294534001004
Martin, Philip L., Brandon Hooker, and Marc Stockton. 2017. “Employment and Earnings of California Farmworkers in 2015.” California Agriculture, vol. 72, no. 2, pp. 107–113. Available at https://doi.org/10.3733/ca.2017a0043
Orrenius, Pia M., and Madeline Zavaodny. 2010. Beside the Golden Door: U.S. Im-migration Reform in a New Era of Globalization. Washington, D.C.: American Enterprise Institute.
Rural Migration News. 2017. “Global Migration.” Rural Migration News, vol. 23, no. 4. ———. 2007. “Enforcement: Swift Fallout, Mismatches.” Rural Migration News,
vol. 13, no. 1. UN Department of Economic and Social Affairs (DESA). 2015. International
Migration Report. World Bank. 2016. Migration and Remittances Factbook.
European and U.S. trade and foreign direct investment (FDI) into the agrifood sector of developing and emerging economies in Africa, Asia, and Latin America have been important for 500
years. As the economic and policy context has evolved, globalization has proceeded in three recent (in the past 500 years) waves. The first wave, from the 1400s to the 1970s, focused mainly on European (and later U.S.) FDI into and trade with Africa, Asia, and Latin America. Importantly, this wave included only “vertical FDI,” with plantations, first-stage processing, and trade “entrepots” in those regions and sec-ond-stage transformation and receiving facilities in the home countries.
The second wave of globalization, from the 1980s to the present, focused again on European and U.S. FDI into and trade with the emerg-ing economies (which we simplify to emerging markets, or EM) in Af-rica, Asia, and Latin America. This wave followed the liberalization of national EM trade regimes and the global agrifood economy. It was also motivated by the rise of the EM domestic markets. The second wave thus continued with some vertical FDI, but also included extremely large horizontal FDI to make and sell inside the EMs themselves.
The third wave of globalization differs from the first and second waves not by the market but by the actors. In particular, the third wave
Agrifood Foreign Direct Investment and Waves of Globalization of Emerging Markets: Lessons for U.S. FirmsBy Titus Awokuse and Thomas Reardon
Titus Awokuse is a professor and chair of the Department of Agricultural, Food, and Resource Economics at Michigan State University. Thomas Reardon is a professor in the department. This article is on the bank’s website at www.KansasCityFed.org
75

76 FEDERAL RESERVE BANK OF KANSAS CITY
features exports from and FDI by EM agrifood enterprises, both do-mestic and regional, and increasingly EM-based global multinationals. These EM firms took off in the 2000s and 2010s, emerging out of the rich soil of the rapidly growing and transforming EM markets—just as U.S. firms like Cargill, ADM, and Dole had taken off over a century prior, a time of similar, albeit more gradual growth and transformation of the U.S. agrifood economy. The new EM firms compete with or sometimes partner with U.S. and European firms.
This paper discusses the evolution of the three waves of globaliza-tion, focusing on the roles and strategies of FDI and trade of agrifood firms (those involved in farm inputs, farming, wholesale, processing, and retail) in EMs. Section I presents definitions and concepts. Sec-tion II briefly reviews information from the first wave, which is well treated in the historical literature. Section III discusses the second wave and links the external firms’ FDI and trade strategies and actions with the evolution of domestic EM food economies. Section IV delves into the nature of the emerging third wave, a relatively new topic and not yet adequately treated in the literature. Section V uses the evolution of these waves of globalization to draw lessons for U.S. firms undertaking current and future global strategies.
I. Definitions and Concepts
In addition to imports and exports, U.S. and European firms have sent into Africa, Asia, and Latin America both vertical FDI and hori-zontal FDI (terms introduced by Horstmann and Markusen [1992], Markusen [1984], and Helpman [1984]). “Vertical FDI” is undertaken when supply chains are spatially fragmented over their vertical stages, such as FDI in a banana plantation in Central America and ripening and wholesale distribution facilities in the United States. “Horizontal FDI” is undertaken when a company sets up FDI affiliate operations—such as farms, factories, or service firms—in a country in which it wants to sell at least part of the products from those operations to host country consumers or firms (such as McDonald’s making and selling burgers in Mexico).
The demand-side condition for horizontal FDI is that the FDI firm perceives effective demand in that country. The supply-side condition for vertical or horizontal FDI is that the FDI firm has some advantage

ECONOMIC REVIEW • SPECIAL ISSUE 2018 77
in the host economy, such as being a “first mover” in a product or technology, having lower capital costs, or having specialized knowledge. Examples include FDI from General Foods and Nestlé into Mexico in the 1980s and FDI from Walmart into Mexico in the 1990s.
Theorists have set out models of firms’ choice of vertical versus hor-izontal FDI. There are two main strands of theory. The first strand tends to focus on the supply-side comparative advantage of the FDI firm. A leading example is Markusen’s (2002) generalized model of the determi-nants of the dichotomous choice between horizontal and vertical FDI and trade (though the model is applicable to the choices as a continuum or even overlapping sets). He called it the “knowledge-capital” (KC) model. It was applied empirically to the agriculture and food sector (as an aggregate) compared with various nonagrifood sectors by Awokuse, Maskus, and An (2012). The basic idea of the KC model is that a firm will undertake FDI in the host country just to supply the (FDI firm’s) home country if factors (land, labor, or natural resources) are cheaper in the host than at home; if the supply chain can be “fragmented” into a series of segments in different places (as when ingredients for the final product are produced in one place and processed into final form in an-other); if the domestic market in the host country is small or lacking; or if the FDI firm has some advantage (in particular, R&D, special skills, or a market network) that allows it to organize a value chain with the host as the upstream and the home country as the downstream.
The second strand of theory tends to focus on the host-market de-mand perspective. A leading example is the Product Cycle theory, a concept from classical economists such as Ricardo that was then for-malized as part of a link to trade theory by Vernon (1966, 1979). Trans-lated into the context of the agrifood economy, the essential idea is that a product has a life cycle that starts as a new product or niche and is then commoditized into a bulk and widely distributed product, perhaps growing and diffusing over national markets, until it reaches “maturity.” At that point, its profitability has been competed down, and the prod-uct either declines, “dies,” or transitions into differentiated products that themselves are niche products and again grow into commodities.
This theory focuses mainly on the determinants of demand in the host country. These determinants are mainly whether the innovation product from the home country has a demand market in the foreign

78 FEDERAL RESERVE BANK OF KANSAS CITY
country based on the income of consumers and the (factor) opportu-nity costs of consumers. For example, if the innovation is a consumer time-saver, such as a washing machine or processed packaged food, the U.S. innovating firm would look for countries with sufficient consumer income or demand for time-saving products to export the product to that country. As costs of production in the country (or transport costs to the country) justify FDI in place of exports, the firm would under-take FDI in the country. The “tipping point” for the firm to undertake FDI might be other multinational enterprises (MNEs) or domestic firms beginning to imitate the product. In this case, the FDI firm will want to cut out transport costs and produce the product in the host country to more effectively compete.
II. First Wave of Globalization (1400s to 1970s): Vertical FDI in Host Country Plantations and Trade Depots
The development of trade routes during this period led to many new products being traded to and consumed in the home countries and produced in the tropics. The quest for trade was integrated with exploration: Columbus was sent by Spain to find an alternative route to the Indonesian “spice islands” to undercut the Portuguese monopoly and “stumbled on” America in his path (Milton 1999).
Four forces drove FDI and trade in this period. First, charter com-panies and MNEs from European countries and later the United States competed for plantation and trade depot bases. Second, transportation technology rapidly transformed (compared with the previous millen-nium), with changes in sailing boat design, the rise of product-fitted steamboats, and trains. Third, domestic markets developed in Western Europe and later the United States from increases in incomes driven by industrialization and urbanization. As incomes rose, consumers sought variety (tropical products) and deseasonalization as well as reductions in prices for products such as dried cod. Fourth, companies and govern-ments sought substitutes for an initial monopoly of a country, product, or exporting region. For example, from the 1500s to the 1900s, the Dutch pursued Icelandic cod as an alternative to Norwegian/German cod via the Hanseatic League. England sidestepped the Dutch’s lock on cod by founding colonies (before the Pilgrims) in Massachusetts (“Cape Cod”) and Newfoundland (Kurlansky 1998).

ECONOMIC REVIEW • SPECIAL ISSUE 2018 79
The charter companies and MNEs such as the U.S. United Fruit Company undertook FDI in a vertically integrated (VI) and economi-cally, politically, and militarily integrated fashion along the supply chain: plantations and collection centers for sourcing from smallhold-ers; trade depots and first-stage processing factories in tropical coun-tries (or in temperate ones such as Cape Cod); transport facilities and train, boat, and port systems in sending and receiving areas; storage and second-stage processing facilities in home countries; and concomitant investments by companies and their governments in military and po-litical support for these operations.
Interpreted under the Product Cycle view, the home market’s de-mand was the impetus for innovation not only in processing technol-ogy in the home and host countries but also in transport technology and military and governance institutions for colonization and trade. The FDI was limited to vertical FDI because there was as yet little or no local demand for a commoditized form of the products in the host countries during this period.
The main trade was in tropical products such as sugar, rubber, coffee, spices, tea, jute, cotton, bananas, and pineapples from Africa, Asia, and Latin America to European, U.S., and Chinese markets. The FDI typically identified a niche local product in one tropical region and developed it into a commodity in the initial area or introduced it into other regions. As these products were exported to Europe and the United States, they moved from exotic niches to basic commodities over time.
III. Second Wave of Globalization (1980s to Present): U.S. and European FDI into Emerging Markets Shifts from Only Vertical to Mainly Horizontal
The second wave of globalization differs from the first in several key ways. In the first wave, the great majority of agrifood FDI was upstream in the supply chain in plantations, associated trade and trans-port, and first-stage processing. In the second wave, agrifood FDI has been mainly midstream and downstream in first-stage processing (mill-ing), second-stage processing (manufacture of consumer-ready foods), logistics, retail, and food service. In addition, most FDI in the first

80 FEDERAL RESERVE BANK OF KANSAS CITY
wave of globalization was in tropical food and fiber; in the second wave, most FDI was in grains, meat, dairy, and produce.
The second wave also differs from the first in that most FDI has become horizontal, rather than vertical (though some vertical FDI has continued). In other words, the EMs have become a market rather than only an export platform back to the United States and Western Eu-rope. Furthermore, the second wave has seen a great deal of capital and knowledge transmission (in the first wave, there was little capital or knowledge transmission beyond the FDI export enclave).
Finally, the two waves of globalization differ in the role played by governments. In the first wave, the home governments played a direct, interventionist role. In the second wave, home governments play an in-direct role, promoting policy “conditionality” so that host governments implement supportive policies and infrastructure to help U.S. and West-ern European FDI in and exports to Africa, Asia, and Latin America.
Drivers of horizontal FDI into EMs in the second globalization
Several key changes occurred in EMs from 1980 to 2010 that pro-vided an impetus for U.S. and Western European horizontal FDI in processing and retail as well as in farm inputs and agriculture in Africa, Asia, and Latin America.
First, there were major policy changes that made EMs much more accessible as destinations for both exports and FDI. There were wide-spread Structural Adjustment Policies and transitions away from “com-mand and control” and socialist economies toward liberalization of markets and FDI and privatization of agrifood parastatals.
Second, demand changed rapidly from the 1970s to the present. For example, income growth and urbanization changed the face of the food markets in EMs. South Korea urbanized as much in 20 years as the United States had in 100 years. In 1970, the shares of the urban in the total population were 24 percent in Asia and Africa and 55 percent in Latin America; in 2010, the shares were 45 percent in Asia, 40 percent in Africa, and 75 percent in Latin America. In addition, diets changed deeply over this period. Demand for time-saving foods and shopping modes—such as processed foods, fast food, and supermarkets—rap-idly increased. This shift was correlated with rapid urbanization and women entering the away-from-home workforce. The latter increased

ECONOMIC REVIEW • SPECIAL ISSUE 2018 81
women’s opportunity cost of cooking and shopping and led to a very rapid spread of purchased-processed foods and supermarket chains, especially from the 1990s on. Demand for nonstaple foods (meat, fish, poultry, dairy, horticulture products, and edible oils) also grew rapidly from the 1970s to the present. The animal product demand, in turn, has spurred rapid growth in demand for soybeans and yellow corn for feed.
Third, supply changed rapidly in EM countries over the past sev-eral decades. On the one hand, EM governments, especially in Asia and Latin America, have made large public investments in road, port, and electrical infrastructure. While much of the supply chain infrastructure of the first wave of globalization was geared toward the movement of tropical products to ports, the infrastructure in the second wave has been more connected with domestic markets, internal production zones, and linking rural to urban areas. On the other hand, there has been major technological change in EMs, much of it transferred from technology innovation in the United States and Europe. These changes occurred along the supply chain, from the use of farm chemicals and new seeds and mechanization in the Green Revolution (starting in the 1960s and 1970s) to changes in processing, transport, and storage tech-nologies post-farm-gate (Reardon and others 2018).
The upshot of these changes was that starting in the 1980s, EMs became attractive destinations for exports from the United States as well as horizontal FDI in the food markets (Henderson, Handy, and Neff 1996). The latter are growing in volume five to 10 times faster than the “mature” U.S. and Western European markets. Moreover, with ur-banization, the diffusion of supermarkets, and the gradual emergence of modern wholesalers and logistic companies, the EM markets have moved from being fragmented to having more integrated and agglom-erated domestic markets. This has reduced the transaction costs to ex-port to them or to sell to them from an FDI base.
Waves of transformation and FDI over countries and products
Despite heterogeneous conditions, there is some regularity in the “waves” of diffusion of both FDI (from the United States and Europe) and domestic agrifood sector transformation in EMs, over countries and within countries, and over products.

82 FEDERAL RESERVE BANK OF KANSAS CITY
The first wave of transformation was in countries that started their post-World War II growth spurt, urbanized, and industrialized earlier—in particular, South American countries, East Asia outside China, and South Africa. Processing transformation (the rise of large processors) began to occur with FDI liberalization and the start of privatization in the mid-1980s and early 1990s. Processing transformation “took off” mainly in the 1980s, while retail transformation (the spread of super-markets and fast food chains) began in the early 1990s.
The second wave of transformation was in countries that had their growth and urbanization spurts later or had prolonged internal socio-political pressure to limit FDI. In Central America, Mexico, and South-east Asia, processing transformation took off in the 1980s, but process-ing and retail transformation did not start until the mid- to late 1990s.
The third wave of transformation was in countries such as in Chi-na, India, and Vietnam that had their growth and urbanization spurts mainly in the 1990s and 2000s or had lagged liberalization into the 1990s. Processing transformation occurred somewhat before retail transformation, with the latter mainly beginning in the late 1990s and the 2000s. In addition, processing and retail transformation began in parts of Africa late in the third wave (or perhaps in a fourth wave).
In each country, the transformation (and the FDI) also took place in waves over products. The transformation of processing, retail, and whole-sale of grains (and processed grains) took place earlier, benefitting from economies of scale and then scope. This transformation was followed by transformation in semiprocessed foods such as meats and dairy. The last wave of transformation was in fresh horticultural products.
Retail transformation and FDI
After the liberalization of retail FDI and the privatization of state retail, private investment in EM supermarket chains surged in the 1990s and 2000s (Reardon and others 2003). The FDI from West-ern Europe and the United States was fueled by push factors (satu-rated home markets with low margins) and pull factors in EMs (higher returns and initially light competition combined with growing de-mand) (Reardon and Berdegué 2002).
Supermarkets spread in waves in EMs, taking off from the late 1980s through the present. By country, supermarkets spread first

ECONOMIC REVIEW • SPECIAL ISSUE 2018 83
among the upper, then middle, then lower classes; from large cities to secondary cities to rural towns; and shifted from a focus on dry foods (and nonfood) to semiprocessed to fresh produce (Reardon and others 2003). These paths were similar to those trod more gradually in the United States.
The share of modern retail in overall food differs over the waves of diffusion, with the deepest penetration to date in the first-wave coun-tries: the share was near half by the late 1990s and 50 to 60 percent in the 2000s. In the second-wave countries, the share was about 30 to 50 percent by the 2000s, and in the third-wave countries, the share was 10 to 30 percent. The fastest spread was in the third-wave countries in Asia, where the supermarket sector grew at three to five times the rate of gross domestic product (GDP) per capita growth (Reardon and oth-ers 2012).
As an illustration, we show the rapid pace of growth in the Lat-in American supermarket sector, drawing from Popkin and Reardon (2018). Table 1 reports retail chain sales of edible groceries for 2002, 2006, 2011, and 2016 along with compound annual sales growth rates compared with real GDP growth rates. The data are from Planet Retail, a retail services and analysis company that tracks the leading chains in each country. Planet Retail does not track smaller local chains, regional (in-country) chains or independent stores, so the sales data underesti-mate all modern food retail. But the table nevertheless provides a rough idea of trends, and no official data exist for comparison. We show data for 12 countries covering about 100 chains. The table shows that food sales from chains increased from $40 billion in 2002 to $154 billion in 2011, a fourfold increase. The real increase is lower, but we report the nominal increase here because the inflation data are ambiguous.
For comparison, using the same data source, roughly the same time period, and the same method as Popkin and Reardon (2018), Rear-don and others (2012) show that modern food retail sales in East and Southeast Asia grew from about $51 billion in 2002 to $198 billion in 2009, a similar fourfold increase to that found in Latin America.
To become cost-competitive with traditional retail, supermarket chains (whether MNEs or the leading domestic firms in EMs) have increasingly modernized their procurement systems. The capacity for such modernization was related to the transfer of procurement

84 FEDERAL RESERVE BANK OF KANSAS CITY
Wav
es S
ales
200
2 S
ales
200
6
Com
poun
d sa
les
grow
th 2
001–
06
(per
cent
)
Com
poun
d re
al
GD
P gr
owth
20
02–0
6
(per
cent
) S
ales
201
1
Com
poun
d sa
les
grow
th 2
006–
11
(per
cent
)
Com
poun
d re
al
GD
P gr
owth
20
06–1
1 (p
erce
nt)
Sal
es 2
016
Com
poun
d sa
les
grow
th 2
011–
16
(per
cent
)
Com
poun
d re
al
GD
P gr
owth
20
11–1
6 (p
erce
nt)
Firs
t wav
e
Arg
entin
a3,
057
5,03
613
912
,207
194
13,6
562
−0.2
Bra
zil19
,110
36,8
5318
492
,039
204
72,0
19−5
−0.4
Uru
guay
344
504
104
1,25
320
61,
450
33
Seco
nd w
ave
Cos
ta R
ica
563
1,05
917
52,
058
144
2,71
16
4
Chi
le2,
101
4,77
823
611
,300
194
11,5
360.
43
Col
ombi
a2,
032
3,09
911
55,
892
145
6,03
80.
54
Ecu
ador
566
853
115
1,57
613
42,
251
72
Gua
tem
ala
377
512
84
1,05
516
31,
036
−0.4
4
Mex
ico
11,3
6817
,155
113
24,3
317
222
,027
13
Third
wav
e
Bol
ivia
2843
114
9217
517
914
5
Nic
arag
ua46
128
294
290
183
563
145
Per
u25
136
510
62,
251
447
2,85
65
4
Tabl
e 1
Edi
ble
Gro
cery
Sal
es o
f Lea
ding
Mod
ern
Ret
ail C
hain
s an
d G
DP
Gro
wth
ove
r Se
lect
ed
Lati
n A
mer
ican
Cou
ntri
es (
2002
–16)
Not
es: A
ll sa
les a
re in
nom
inal
mill
ions
of U
.S. d
olla
rs. B
razil
’s fa
ll in
sale
s fro
m 2
011–
16 c
an b
e ex
plai
ned
by th
e 20
15–1
6 cr
isis,
whe
re G
DP
fell
and
a nu
mbe
r of t
he m
ayor
reta
ilers
(Cas
ino,
Car
-re
four
, and
Wal
mar
t) re
port
ed a
dec
reas
e in
thei
r sal
es. W
e us
e 20
15 sa
les d
ata
from
Mex
ico
as fo
r 201
6, re
tail
plan
et re
port
ed a
fall
in sa
les,
yet a
ll ne
ws a
rtic
les r
epor
ted
an in
crea
se.
Sour
ce: P
opki
n an
d Re
ardo
n (2
018)
.
ECONOMIC REVIEW • SPECIAL ISSUE 2018 85
technology from U.S. and Western European chains and its further dif-fusion among leading domestic chains (Reardon and others 2003). The supermarket chains in EMs have started to buy directly from processors (including under contracts), specify private standards, use centralized procurement and logistics via distribution centers, and use special-ized-dedicated wholesalers who distribute to their stores and organize procurement from suppliers according to volume, quality, and timing specifications (Reardon and Timmer 2012). These modernizations have gone by far the furthest in processed and semiprocessed foods but have started to be applied to fresh produce as well (see, for example, Berde-gué and others [2005]).
Food processing transformation and FDI
Similar to the retail sector, the processing sector has transformed in structure and conduct with the heavy influence of FDI from the United States and Western Europe. The processing sector in EMs has under-gone three phrases of transformation. These phases are depicted as a J curve by Reardon (2015), with concentration on the vertical axis and time on the horizontal axis. The shift from the left to the middle of the J was a move from a semiconcentrated to a deconcentrated processing sector (with the shift from the 1970s/1980s era of parastatals to the pro-liferation of SMEs with liberalization and privatization from the 1980s to 2000s). The shift from the middle to the right of the J was a move from a fragmented sector to an again concentrated one with the deluge of FDI and domestic private-sector-driven consolidation. The second and third phase tend to overlap in most EMs, with the consolidation phase more advanced in the “first-wave countries” and less advanced in the others.
Following the privatization of the EM parastatals, there was a pro-liferation of small and medium-sized enterprises (SMEs) in process-ing grain, dairy, meat, fish, and produce both to fill the gap left by the demise of public-sector operations in EMs and to meet growing urban demand. This is what Reardon and others (2012) call the tran-sitional stage of the agrifood value chain transformation. Examples in-clude dairy, wheat, and horticultural product processing SMEs in Brazil and maize, vegetable, and fruit processing in Africa (Farina and others

86 FEDERAL RESERVE BANK OF KANSAS CITY
2005; Farina 1997; Broutin and Bricas 2006; Jaffee and Morton 1995; Rubey 1995; Tschirley and others 2015).
Privatization and FDI liberalization led to an avalanche of FDI in processing from Western Europe, the United States, and then Japan in the past two to three decades. As a consequence, foreign firms formed a major share of the processing sector in a number of first- and second-wave countries by the end of the 1990s, and the trend started in third- and even fourth-wave countries in the 2000s and 2010s. (They were joined by EM MNEs in the third wave of globalization, as we discuss later.)
The (re-)consolidation phase comprises both first-stage and sec-ond-stage processing. Some companies specialize in one—for example, ADM conducts mainly first-stage processing for ingredients. Others straddle the two—for example, Nestlé handles milk collection, first-stage processing, and second-stage milk processing into confections.
The first subphase of the consolidation phase was FDI in first-stage processing of grain and edible oil products globally and for internal markets of countries receiving FDI. The case of soy is illustrative. Brazil independently began soy production in the 1970s for the European and then the Chinese market, as animal production soared from the 1980s to the present. Brazil very quickly grew as a soy producer: its output in 2000 was similar to the output of the United States in 1970, and by 2015, its output was neck and neck with that of the United States. But the United States had a head start on investment and well surpassed Brazil in investment in first-stage processing by firms such as ADM and Cargill. These firms had grown from small to large while the U.S. ag-riculture and food industry grew from the 1870s through the 1970s. By the 1980s, the United States had achieved technological leadership in many of the agriculture and food-industry-related fields as well as a massive capital base—and low returns in a highly contested home mar-ket. The 1980s and 1990s were thus a period of intense outward FDI, especially for first-stage processors such as ADM and Cargill, which set up operations in Brazil and Argentina as FDI rules were liberalized and soy production there took off. The 1990s and 2000s were another wave of outward FDI for the same pull and push reasons by food indus-try firms such as Smithfield (in first- and second-stage processing) and Kraft. Firms such as ADM set up cross-country FDI networks in China (receiving soybeans), Brazil (sending raw and processed soybeans), and Western Europe (receiving raw and processed soybeans).

ECONOMIC REVIEW • SPECIAL ISSUE 2018 87
The second subphase of consolidation and third phase of the J curve was in second-stage manufactured foods. FDI was typically “horizontal” into EMs to sell to their extremely fast-growing markets for processed foods.
Again, the United States’ prior experience of food industry trans-formation prepared U.S. firms to be important in horizontal FDI in EMs. Firms that had been small enterprises in the early stages of food system transformation in Western Europe and the United States in the latter part of the 1800s and the first half of the 1900s became the tech-nological leaders and giants of outward FDI by the 1970s and 1980s. In addition to their experience, the competition in their home mar-kets pushed them to outward FDI. The draw was clear: packaged food sales were growing only 2 to 3 percent annually in developed countries compared with 13 percent, 28 percent, and 7 percent in low-, lower-middle, and upper-middle income developing countries, respectively (Wilkinson and Rocha 2009).
An archetypal example of the second-stage processing sector FDI was that of dairy and Nestlé. Nestlé (and several other large dairy firms such as Parmalat) swept into Latin America in the 1980s following FDI liberalization and income growth and undertook many mergers and ac-quisitions, such as in the dairy sector in Brazil (Farina and others 2005). By the 2010s, Nestlé had a 61 percent market share in Latin American packaged foods (confections, soups, pet food, baby food, dairy, and baked goods). Cook (1985) shows that similar processes took place with U.S. food multinationals in Mexico in the 1980s. These processes continued elsewhere in Latin America from the 1990s to the present.
Wholesale and logistics transformation and FDI
While governments played a major role in the development and transformation of wholesale markets, the overall segment of wholesale and logistics underwent changes similar to those in processing.
First, as with the left-most part of the “J curve,” governments directly induced a first stage of wholesale transformation from tradi-tional, fragmented wholesale to government-run wholesale markets (of private wholesalers) and distribution parastatals (such as the Food Cor-poration of India). This shift created economies of agglomeration and sometimes economies of scale relative to the traditional fragmented wholesale sector, such as in Africa (Tollens 1997). The large markets

88 FEDERAL RESERVE BANK OF KANSAS CITY
created by this investment are huge. For example, Mexico City’s whole-sale market is the largest in the world. And China’s wholesale market volume increased 11,000 percent from 1990 to 2000 (Huang and oth-ers 2007; Ahmadi-Esfahani and Locke 1998).
Second, the traditional wholesale sector has been restructuring in several ways. The public-sector wholesale market segment is consoli-dating wholesale markets in some countries, such as South Africa and wholesalers within wholesale markets in others, such as Mexico (Louw and others 2007; Echánove and Reardon 2006). In some countries, there is also evidence of a decline in the share of traditional village bro-kers but a proliferation of rural town and secondary city wholesalers in Asia (Reardon and others 2012).
Third, beyond the traditional wholesale sector, a modern wholesale sector is emerging. This can be called “re-intermediation”—a shift in procurement among supermarket and fast food chains and large proces-sors from the traditional fragmented spot market to, as much as pos-sible, specialized, dedicated wholesalers (Reardon and Berdegué 2002).
Co-evolution of downstream and midstream segments and links to FDI
First, domestic processing and agribusiness firms as well as FDI MNEs (via “follow sourcing,” discussed later) have been established in the EMs. FDI retailers (as well as large domestic retailers) and proces-sors have begun to source directly from these large local firms, cutting out intermediation. For example, Walmart and large domestic chains in Mexico shifted from sourcing from the wholesale market to sourcing from the U.S. firm Driscoll’s for strawberries produced by Driscoll’s in Mexico (Reardon and others 2007).
Second, large-scale firms in different segments facilitate each oth-er’s growth through “co-evolution.” To reduce transaction costs and make sure private standards are met, supermarket chains tend to source from large processors. For example, large processors target product differentiation to the requests of supermarkets such as Carrefour and Walmart in Brazil, for example, for milk and juice products by Nestlé in Brazil (Farina and others 2005).
Third, modern retailers in EMs have been shifting from using tradi-tional wholesale channels for procurement to using modern (dedicated) wholesalers and “third-party logistics” (3PL) firms. The emergence of

ECONOMIC REVIEW • SPECIAL ISSUE 2018 89
these modern or new-generation wholesalers and 3PL firms helps the re-tailers to outsource (to these wholesalers) the imposition of their private standards and other transaction requirements, such as specific packing; to face a shorter supply chain and thus lower transaction costs; to over-come idiosyncratic market failure in logistics and other intermediation services that are common in the traditional food markets of developing countries; to reduce market risk by having longer-term relations with distribution companies rather than relying only on the spot market; to use incentive pricing and relationships to encourage (or require) whole-salers and third-party logistics firms to undertake supply chain invest-ments, such as in cold chain, or even backward-integrating by investing in a packing plant and organizing contract farming schemes (see Rear-don and others [2007] for the case of lemons in Mexico); and to avoid traditional wholesale markets to the extent possible, as supermarkets often consider these markets to deliver low and inconsistent quality at relatively high transaction costs.
To obtain these logistics services and other services, FDI firms in EMs often require “follow sourcing” of their service providers in home markets. U.S. and Western European retailers (as well as large proces-sors) operating in EMs sometimes prefer to “import” the services of processors, wholesalers, and especially 3PL firms on which they rely in their home markets or globally. This “importation” can be both into the region or country of the retailer or across zones in a country as the retailer spreads its stores. For example, Dries, Reardon, and Swinnen (2004) note that in April 2003, Tesco signed an agreement with the U.S.-based multinational ProLogis for the lease of a large distribution center in the Czech Republic. Reardon and Berdegue (2002) note that the Carrefour distribution center in Brazil was a product of a joint ven-ture between Carrefour, Cotia Trading (a major Brazilian wholesaler distributor), and Penske Logistics (a U.S. global multinational firm) that started in 2001.
Moreover, as local and regional agrifood production capacity has grown in EMs, especially over the past three decades, there has been a tendency to undertake joint ventures in addition to the usual main mode of FDI via mergers and acquisitions, and to a much lesser extent, greenfield investments. The arrangements take several forms. The first form is co-processing, which has become increasingly common (as with
90 FEDERAL RESERVE BANK OF KANSAS CITY
Kellogg’s or Nestlé) as the domestic processing sector has developed in EMs. The second form is joint ventures, such as U.S. companies partnering with fruit companies in the southern hemisphere to elimi-nate seasonality using “north-south corridors” (for example, the joint venture between Naturipe in the United States and Hortifrut in Chile, with operations in Mexico for berries).
IV. The Rise of the Third Wave of Globalization: FDI from Emerging Markets into Emerging Markets
There are several key differences between the second wave of glo-balization and (since its start in the 1990s) the contemporaneous third wave of globalization. In the second wave of globalization, FDI was mainly focused midstream and downstream. In the third wave of glo-balization, FDI is beginning to reemphasize farming and first-stage processing and reintroduce the importance of vertical FDI (while also featuring substantial horizontal FDI).
In the second wave, Europe and the United States were the main leaders in FDI, and developed countries were the only leaders. How-ever, in the third wave, EM firms are rising and will be perhaps equal or greater over time in FDI compared with U.S. and European firms. In the second wave, the leading EMs were the main EM target of FDI. In the third wave, the “second rung” of newly emerging markets (such as Nigeria in Africa) will be increasingly major targets of FDI. Finally, in the third wave of globalization, home governments (of FDI firms) will return to the key roles they had in the first wave, providing more than just “policy support” (for example, the Chinese government is investing in Brazil’s infrastructure as an export platform to China).
Patterns in the third wave of globalization: echoes of the first and second waves
Many of the U.S. agrifood MNEs dominant in the second wave of globalization had developed from small and medium firms like Cargill and John Deere. These firms started as small enterprises in the 1800s and then “grew up” during the transformation of the U.S. agrifood system from the 1880s to 1980s—“hitching their wagons to a star.” When they reached a large size and faced a contested or inadequate home market, they began interstate and then international FDI. They

ECONOMIC REVIEW • SPECIAL ISSUE 2018 91
first acquired similar firms in other developed regions (just as Nestlé bought Carnation in the 1980s), and then moved into EMs—first into the early risers, such as Brazil and Mexico, and then into the intermedi-ate and recent risers, such as India and China.
In parallel fashion but later on, as EMs’ agrifood economies grew and transformed rapidly from the 1980s to the 2000s (much faster, in fact, than the agrifood economy of the United States in the century before), an increasing number of small and medium enterprises in EMs grew into giant agrifood MNEs by 2010.
Another important parallel of the third wave of globalization to the first is that governments and companies in EMs are making large investments in infrastructure in “lower-rung” countries. The purpose of this investment is either to improve the supply chain of exports to or from the host country or to improve the political acceptance of FDI by the host country. A key example is the “Belt and Road Initiative” of China to build infrastructure in Asia and Africa to connect with them as well as Europe. This initiative is similar in purpose and economic approach to the United States’ infrastructure investment in the Philip-pines in the 1900s or Britain’s infrastructure investment in Africa and Asia in the 1800s. In 2017, China invested $20 billion in Brazil in the energy, logistics, and agricultural sectors. Some of that investment has been in improving poor interior infrastructure to get soybeans to ports and on to China.
Examples on the export side from large firms in EMs to other EMs include exports of frozen chicken from large companies like Sadia in Brazil to Nigeria and Thailand; exports of frozen fish by Chinese com-panies to the United States, other Asian countries, Europe, and Africa; exports by Bimbo of Mexico, now the largest baked goods firm in the world, all over the world but especially to Latin America; and exports of first-stage-processed soy by Grupo Maggi, the largest soy farming and processing operation in the world, to Europe and China.
Examples of emerging regional FDI by regional multinationals in-clude Nando’s, a South African retail fast food chain with 1,000 outlets in 30 countries in Africa, Asia, Europe, Canada, and the United States; Alibaba, a retail/wholesaler that recently invested $200 million in India to buy the Indian food delivery app Zomato; Charoen Pokphand (CP) in Thailand, with sales of $45 billion (two-thirds the size of ADM), with the largest shrimp farm in the world in Indonesia, feed mills all

92 FEDERAL RESERVE BANK OF KANSAS CITY
around Asia, and many other investments in Asia and Africa; COFCO Group in China, which has $34 billion in sales (compared with Mon-delez International, which has revenues of $26 billion) and important investments in Asia and Latin America; and Bimbo in Mexico, with $15 billion of sales (about the same as General Mills), plants around Latin America, and operations in the United States.
Moreover, large EM regional multinationals have also acquired large U.S. and European agrifood companies. Examples include the Chinese company Shuanghui’s 2014 acquisition of the U.S. company Smithfield Foods, which had been the largest pork processor in the world, and ChemChina’s 2017 purchase of Syngenta.
V. Implications for U.S. Suppliers
The second and third waves of globalization present U.S. firms with opportunities and challenges as well as needs for investment. The op-portunities are both for horizontal and vertical FDI.
Horizontal FDI is warranted because of rapidly transforming EM markets with deep and growing demand for processed foods and di-versity in meat, fish, dairy, and produce. Exporting to these markets, as well as FDI to be competitive with local EM firms as well as other MNEs, are both opportunities. Besides growth, EMs are becoming far easier for FDI firms to operate in or export to due to urbanization and rapidly improving road infrastructure. For the leading EMs, such as China, the infrastructure on the Eastern seaboard is already as good or better than U.S. infrastructure. EMs that are still catching up, such as India, still face infrastructure challenges, and urbanization sometimes increases transaction costs through congestion rather than reducing them through agglomeration.
Moreover, growth in EMs is moving beyond the lead countries of a decade or two ago and into countries such as Nigeria. The same kinds of transformations seen in leading EMs (increases in incomes, the growing opportunity costs of women’s time, and demand for quality and product differentiation) are emerging quickly in what were once “second-rung” countries.
Finally, the improved infrastructure and complementary business structure in many EMs means that there are opportunities to build ex-port platforms to developing as well as developed countries. Previously,

ECONOMIC REVIEW • SPECIAL ISSUE 2018 93
we gave the example of Smithfield using Eastern European pork produc-tion and first-stage processing bases to supply cheap commodity pork to sophisticated and branded Western European operations’ second-stage processing and distributing. But this will be an opportunity more and more from and to EMs themselves, such as U.S. FDI firms producing inputs in Myanmar to ship to FDI finishing operations in China.
Complementarity is also ripe for more joint ventures with EM firms, not just for interseason production of produce, as at present, but for in-creased production for the local EM as well as exports to “second-rung” EMs that are fast becoming major markets.
The challenges are born from these opportunities (and vice versa). While European and Japanese firms have been both competitors and partners in EM markets (as in China, where Land O’Lakes and Grace-land Fruit had European and Japanese joint ventures as well as Taiwanese joint ventures in FDI), the competition will intensify for FDI operations with these countries in the EM markets. Moreover, many EM firms are now or soon to be the equal of U.S. firms. EM firms will buy more and more U.S., European, and Japanese agrifood firms to compete in EM markets as well as the U.S. home market. The era of sharp differences in technical knowledge is largely over, so competition will intensify quickly. U.S. trade policies may also be a determinant of how easy and how wel-come U.S. firms’ FDI and exports will be.
All of these challenges and opportunities have investment implica-tions. It is not to be forgotten that in the first wave of globalization, once one European power invested in infrastructure systems in an FDI host country, other European firms and countries ran to do the same. It is likely that in the next decade, the U.S. firms and perhaps government will be in a similar position with China for the EMs. Moreover, U.S. firms probably have less and less inherent advantage in any food product (depending on the product), and will have to constantly invest and seek comparative strengths in a new world triply globalized.
94 FEDERAL RESERVE BANK OF KANSAS CITY
References
Ahmadi-Esfahani, Fredoun Z., and Christopher G. Locke. 1998. “Wholesale Food Markets with ‘Chinese Characteristics’.” Food Policy, vol. 23, no. 1, pp. 89–103. Available at https://doi.org/10.1016/S0306-9192(98)00017-7
Awokuse, Titus O., Keith E. Maskus, and Yiting An. 2012. “Knowledge Capi-tal, International Trade, and Foreign Direct Investment: A Sectoral Analy-sis.” Economic Inquiry, vol. 50, no. 3, pp. 707–723. Available at https://doi.org/10.1111/j.1465-7295.2011.00371.x
Berdegué, Julio A., Fernando Balsevich, Luis Flores, and Thomas Reardon. 2005. “Central American Supermarkets’ Private Standards of Quality and Safety in Procurement of Fresh Fruits and Vegetables.” Food Policy, vol. 30, no. 3, pp. 254–269. Available at https://doi.org/10.1016/j.foodpol.2005.05.003
Broutin, Cécile, and Nicolas Bricas. 2006. Agroalimentaire et Lutte Contre la Pauvre-té en Afrique Subsaharienne: Le Rôle des Micro et Petites Enterprises. Paris: Gret.
Cook, Roberta L. 1985. “The Mexican Dry Grocery Subsector: Strategies Sup-porting the Establishment of Voluntary Food Chains.” PhD dissertation, Michigan State University.
Dries, Liesbeth, Thomas Reardon, and Johan F.M. Swinnen. 2004. “The Rap-id Rise of Supermarkets in Central and Eastern Europe: Implications for the Agrifood Sector and Rural Development.” Development Policy Review, vol. 22, no. 5, pp. 525–556. Available at https://doi.org/10.1111/j.1467-7679.2004.00264.x
Echánove, Flavia, and Thomas Reardon. 2006. “Wholesale Markets, Horticulture Products, and Supermarkets in Mexico.” Michigan State University, Staff Pa-per Series no. 11586.
Farina, Elizabeth M.M.Q., ed. 1997. Estudos de Caso em Agribusiness, Focalizando as Seguintes Empresas: Moinho Pacifico, Illycaffe, Cocamar, Sadia, Iochpe-Max-ion, Norpac. São Paulo: Pioneira.
Farina, Elizabeth M.M.Q., Graciela E. Gutman, Pablo J. Lavarello, Rubens Nunes, and Thomas Reardon. 2005. “Private and Public Milk Standards in Argentina and Brazil.” Food Policy, vol. 30, no. 3, pp. 302–315. Available at https://doi.org/10.1016/j.foodpol.2005.05.008
Jaffee, Steven M., and John Morton, eds. 1995. Marketing Africa’s High-Value Foods: Comparative Experiences of an Emergent Private Sector. Dubuque: Kendall/Hunt.
Helpman, Elhanan. 1984. “A Simple Theory of International Trade with Multina-tional Corporations.” Journal of Political Economy, vol. 92, no. 3, pp. 451–71.
Henderson, Dennis R., Charles Handy, and Steven A. Neff, eds. 1996. “Foreign Direct Investment in the Processed Food Sector.” USDA Economic Research Service, Globalization of the Processed Foods Market, Agricultural Economic Report no. 742.
Horstmann, Ignatius J., and James R. Markusen. 1992. “Endogenous Mar-ket Structures in International Trade.” Journal of International Economics, vol. 32, no. 1–2, pp. 109–129. Available at https://doi.org/10.1016/0022-1996(92)90038-L

ECONOMIC REVIEW • SPECIAL ISSUE 2018 95
Huang, Jikun, Xiaoxia Dong, Yuhua Wu, Huayong Zhi, Xianfang Nui, Zhurong Huang, and Scott Rozelle. 2007. Regoverning Markets: The China Meso-level Study. Report, Beijing: Center for Chinese Agricultural Policy, Chinese Acad-emy of Sciences, July.
Kurlansky, Mark. 1998. Cod: A Biography of the Fish that Changed the World. London: Penguin.
Louw, André, Chikazunga Davison, Jordaan Danie, and Biénabe Estelle. 2007. “Restructuring Food Markets in South Africa: Dynamics in Context of the Tomato Sub Sector.” Meso report for the Regoverning Markets Program, University of Pretoria, May.
Markusen, James R. 2002. Multinational Firms and the Theory of International Trade. Cambridge, MA: MIT Press.
———. 1984. “Multinationals, Multi-plant Economies, and the Gains from Trade.” Journal of International Economics, vol. 16, no. 3–4, pp. 205–226. Available at https://doi.org/10.1016/S0022-1996(84)80001-X
Milton, G. 1999. Nathaniel’s Nutmeg: Or the True and Incredible Adventures of the Spice Trader Who Changed the Course of History. New York: Farrar, Straus and Giroux.
Popkin, B.M., and T. Reardon. 2018. “Obesity and the Food System Transforma-tion in Latin America.” Obesity Reviews, vol. 19, no. 8, pp. 1028–1064. Avail-able at https://doi.org/10.1111/obr.12694
Reardon, Thomas. 2015. “The Hidden Middle: The Quiet Revolution in the Midstream of Agrifood Value Chains in Developing Countries.” Oxford Re-view of Economic Policy, vol. 31, no. 1, pp. 45–63. Available at https://doi.org/10.1093/oxrep/grv011
Reardon, Thomas, Ruben Echeverría, Julio Berdegué, Bart Minten, Saweda Liv-erpool-Tasie, David Tschirley, and David Zilberman. 2018. “Rapid Trans-formation of Food Systems in Developing Regions: Highlighting the Role of Agricultural Research & Innovations.” Agricultural Systems, February 28. Available at https://doi.org/10.1016/j.agsy.2018.01.022
Reardon, Thomas, Kevin Z. Chen, Bart Minten, and Lourdes Adriano. 2012. The Quiet Revolution in Staple Food Value Chains: Enter the Dragon, the Elephant, and the Tiger. Asian Development Bank and International Food Policy Re-search Institute.
Reardon, Thomas, and C. Peter Timmer. 2012. “The Economics of the Food Sys-tem Revolution.” Annual Review of Resource Economics, vol. 4, pp. 225–264.
Reardon, Thomas, C. Peter Timmer, and Bart Minten. 2012. “The Supermarket Revolution in Asia and Emerging Development Strategies to Include Small Farmers.” PNAS: Proceedings of the National Academy of Science of the United States of America, vol. 109, no. 31, pp. 12332–12337.
Reardon, Thomas, Julio Berdegué, Flavia Echánove, Roberta Cook, Nancy Tuck-er, and Ana Martínez. 2007. Supermarkets and Horticultural Development in Mexico: Synthesis of Findings and Recommendations to USAID and GOM. Re-port submitted by MSU to USAIDMexico and USDAWashington.

96 FEDERAL RESERVE BANK OF KANSAS CITY
Reardon, Thomas, C. Peter Timmer, Christopher B. Barrett, and Julio Berdegué. 2003. “The Rise of Supermarkets in Africa, Asia, and Latin America.” Ameri-can Journal of Agricultural Economics, vol. 85, no. 5, pp. 1140–1146.
Reardon, Thomas, and Julio A. Berdegué. 2002. “The Rapid Rise of Supermarkets in Latin America: Challenges and Opportunities for Development.” Devel-opment Policy Review, vol. 20, no. 4, pp. 317–334. Available at https://doi.org/10.1111/1467-7679.00178
Rubey, Lawrence. 1995. “The Impact of Policy Reform on Small-Scale Agribusi-ness: A Case Study of Maize Processing in Zimbabwe.” African Rural and Urban Studies, vol. 2, no. 2–3, pp. 93–119.
Tollens, Eric. 1997. “Wholesale Markets in African Cities: Diagnosis, Role, Ad-vantages, and Elements for Further Study and Development.” FAO Food Supply and Distribution to Cities in French-Speaking Africa, Food Into Cit-ies Collection.
Tschirley, David, Thomas Reardon, Michael Dolislager, and Jason Snyder. 2015. “The Rise of a Middle Class in Urban and Rural East and Southern Africa: Implications for Food System Transformation.” Journal of International De-velopment, vol. 27, no. 5, pp. 628–646. Available at https://doi.org/10.1002/jid.3107
Vernon, Raymond. 1979. “The Product Cycle Hypothesis in a New Interna-tional Environment.” Oxford Bulletin of Economics & Statistics, vol. 41, no. 4, pp. 255–267. Available at https://doi.org/10.1111/j.1468-0084.1979.mp41004002.x
———. 1966. “International Investment and International Trade in the Product Cycle.” The Quarterly Journal of Economics, vol. 80, no. 2, pp. 190–207. Avail-able at https://doi.org/10.2307/1880689
Wilkinson, John, and Rudi Rocha. 2009. “Agro-industry Trends, Patterns and De-velopment Impacts.” In Carlos A. da Silva, Doyle Baker, Andrew W. Shepherd, Chakib Jenane, and Sergio Miranda-da-Cruz, eds., Agro-industries for Devel-opment, FAO/UNIDO, pp. 46–92. New York: CAB International.

Economic ReviewPRESIDENT AND CHIEF EXECUTIVE OFFICER
Esther L. George
RESEARCH STEERING GROUPKelly J. Dubbert, First Vice President and Chief Operating OfficerKevin L. Moore, Senior Vice PresidentDiane M. Raley, Senior Vice PresidentLuke Woodward, Senior Vice President
ECONOMIC RESEARCHCraig S. Hakkio, Senior Vice President and Special Advisor on Economic PolicyJonathan L. Willis, Vice President and Senior Research and Policy AdvisorGeorge A. Kahn, Vice President and EconomistNicholas Sly, Assistant Vice President and EconomistWillem Van Zandweghe, Assistant Vice President and EconomistHuixin Bi, Senior EconomistBrent Bundick, Senior EconomistTaeyoung Doh, Senior EconomistFumiko Hayashi, Senior EconomistJosé Mustre-del-Río, Senior EconomistJun Nie, Senior EconomistJordan Rappaport, Senior EconomistA. Lee Smith, Senior EconomistDidem Tüzemen, Senior EconomistAaron Smalter Hall, Senior Data ScientistDavid Rodziewicz, Commodity Specialist
REGIONAL AND COMMUNITY AFFAIRSAlison Felix, Vice President and Branch Executive, Denver BranchNathan Kauffman, Vice President and Branch Executive, Omaha BranchChad Wilkerson, Vice President and Branch Executive, Oklahoma City BranchJason P. Brown, Assistant Vice President and EconomistKelly D. Edmiston, Senior EconomistCortney Cowley, EconomistNida Çakır Melek, Economist
SUPERVISION AND RISK MANAGEMENTCharles S. Morris, Vice President and EconomistJim Wilkinson, Assistant Vice President and EconomistW. Blake Marsh, EconomistRajdeep Sengupta, Economist
EDITORIAL SUPPORTElizabeth Cook Willoughby, Editorial AdvisorRichard A. Babson, Senior EditorBeth Norman, Layout Designer

Special Issue 2018
The Economic Review (ISSN0161-2387) is published quarterly by the Federal Reserve Bank of Kansas City, 1 Memorial Drive, Kansas City, Missouri 64198-0001. Subscriptions and ad-ditional copies are available without charge. Send requests to the Public Affairs Department, Federal Reserve Bank of Kansas City, 1 Memorial Drive, Kansas City, Missouri 64198-0001. Periodical postage paid at Kansas City, Missouri.POSTMASTER: Send address changes to Economic Review, Public Affairs Department, Federal Reserve Bank of Kansas City, 1 Memorial Drive, Kansas City, Missouri 64198-0001.The views expressed are those of the authors and do not necessarily reflect the positions of the Federal Reserve Bank of Kansas City or the Federal Reserve System. If any material is reproduced from this publication, please credit the source.

ECONOMIC REVIEWFederal Reserve Bank of Kansas City1 Memorial DriveKansas City, Missouri 64198-0001Special Issue 2018 FEDERAL RESERVE BANK OF KANSAS CITY
ECONOMICREVIEW
Special Issue 2018 Agriculture in a
Global Economy
Exploring the Economic Impact of Changing Climate Conditions and Trade Policies on Agricultural Trade:A CGE Analysis
The Business Merits of Agricultural Trade
Agriculture and International Labor Flows
Agrifood Foreign Direct Investment and Waves of Globalization of Emerging Markets: Lessons for U.S. Firms
EC
ON
OM
IC R
EV
IEW
FE
DE
RA
L RE
SER
VE
BA
NK
OF K
AN
SAS C
ITY
SPEC
IAL ISSU
E 2018