economic trends and commercial construction indicators for metropolitan washington
DESCRIPTION
Economic Trends and Commercial Construction Indicators for Metropolitan Washington. Cooperative Forecasting and Data Subcommittee September 9, 2004. Department of Human Services, Planning and Public Safety. Economic Trends in Metropolitan Washington 1999 – 2003. Population Employment - PowerPoint PPT PresentationTRANSCRIPT
1
Economic Trends and Commercial Construction Indicators
for Metropolitan Washington
Cooperative Forecasting and Data Subcommittee
September 9, 2004
Department of Human Services, Planning and Public Safety

2
Economic Trends in Metropolitan Washington 1999 – 2003
• Population• Employment• Labor Force• Construction• Mortgage Rates, Home
Sales, and Housing-Related Inflation
•Inflation
•Income
•Retail Sales
•Airline Passengers
3
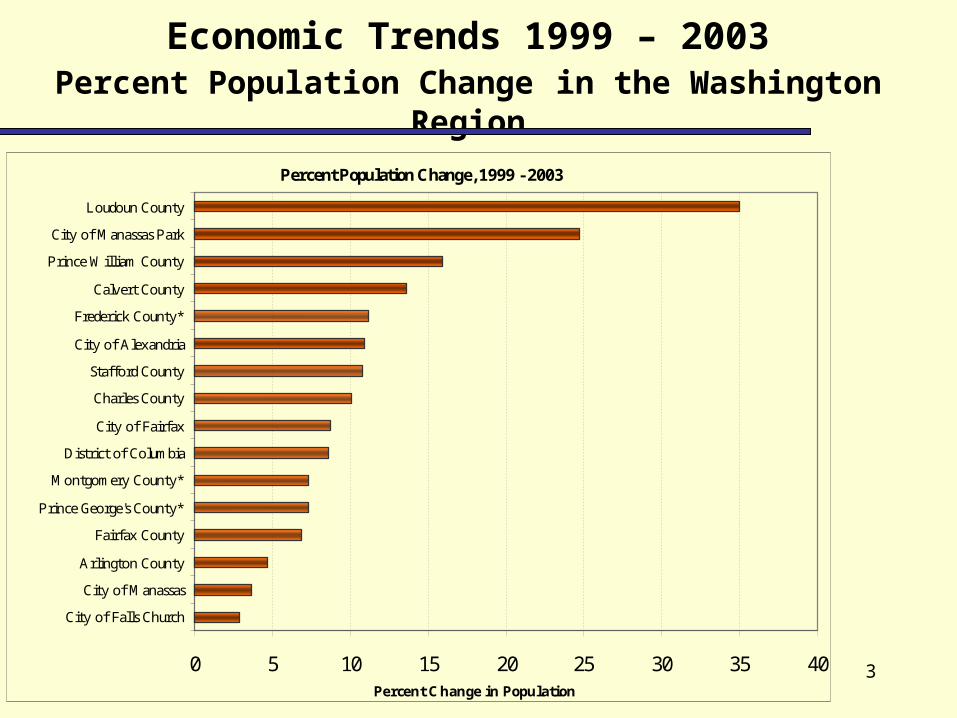
Economic Trends 1999 – 2003Percent Population Change in the Washington Region
Percent Population Change, 1999 - 2003
0 5 10 15 20 25 30 35 40
City of Falls Church
City of Manassas
Arlington County
Fairfax County
Prince George's County*
Montgomery County*
District of Columbia
City of Fairfax
Charles County
Stafford County
City of Alexandria
Frederick County*
Calvert County
Prince William County
City of Manassas Park
Loudoun County
Percent Change in Population

4
Economic Trends 1999 – 2003At-Place Employment in the Washington Region
2,300
2,350
2,400
2,450
2,500
2,550
2,600
2,650
1999 2000 2001 2002 2003
Year
(Tho
usan
ds)

5
Economic Trends 1999 – 2003Annual Unemployment Rate
0.0%
1.0%
2.0%
3.0%
4.0%
5.0%
6.0%
7.0%
8.0%
1999 2000 2001 2002 2003
Year
Une
mpl
oym
ent
Rat
e
Washington DC-MD-VA MSA Suburban Jurisdictions a/ District of Columbia
6
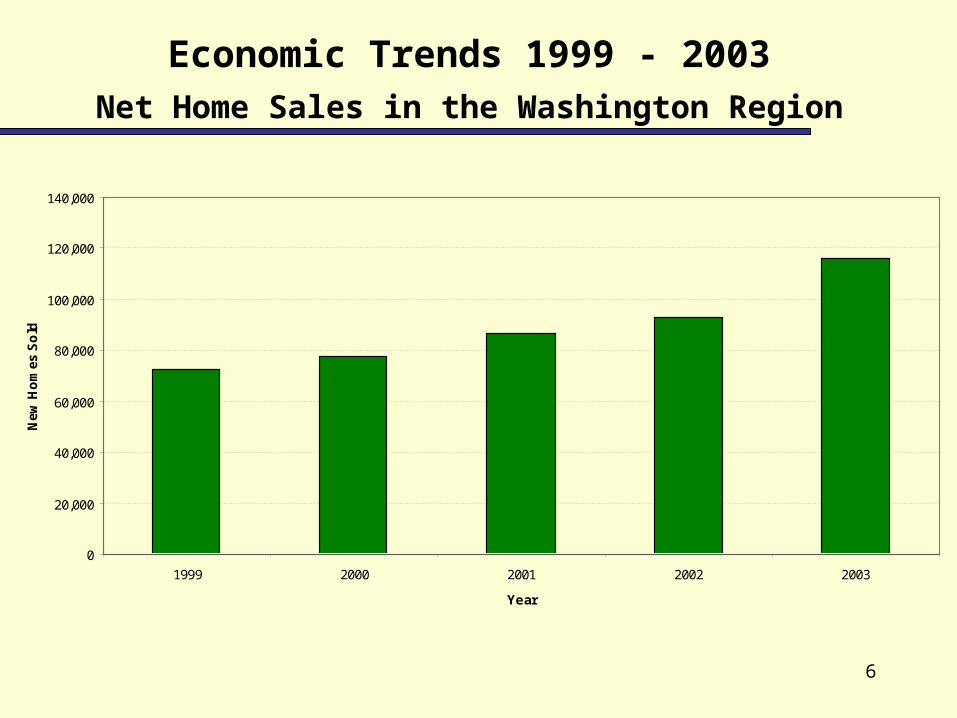
Economic Trends 1999 - 2003 Net Home Sales in the Washington Region
0
20,000
40,000
60,000
80,000
100,000
120,000
140,000
1999 2000 2001 2002 2003
Year
New
Ho
mes
So
ld

7
Economic Trends 1999 - 2003 Housing Units Authorized in the Washington Region
0
5,000
10,000
15,000
20,000
25,000
30,000
35,000
40,000
1999 2000 2001 2002 2003
Uni
ts A
utho
rize
d
8
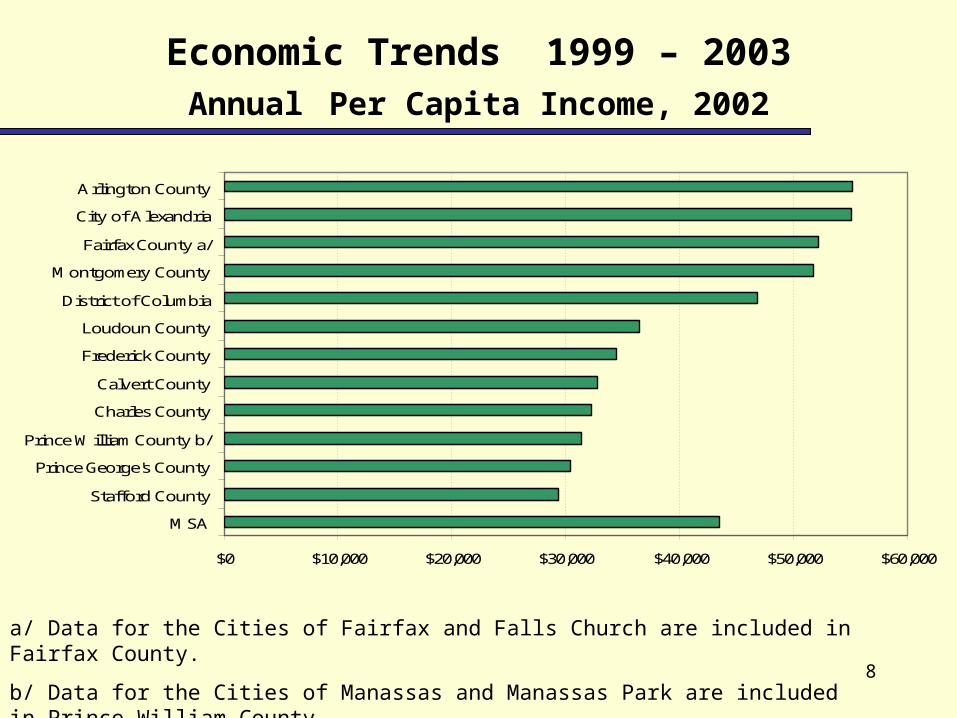
Economic Trends 1999 – 2003Annual Per Capita Income, 2002
a/ Data for the Cities of Fairfax and Falls Church are included in Fairfax County.
b/ Data for the Cities of Manassas and Manassas Park are included in Prince William County.
$0 $10,000 $20,000 $30,000 $40,000 $50,000 $60,000
MSA
Stafford County
Prince George's County
Prince William County b/
Charles County
Calvert County
Frederick County
Loudoun County
District of Columbia
Montgomery County
Fairfax County a/
City of Alexandria
Arlington County
9
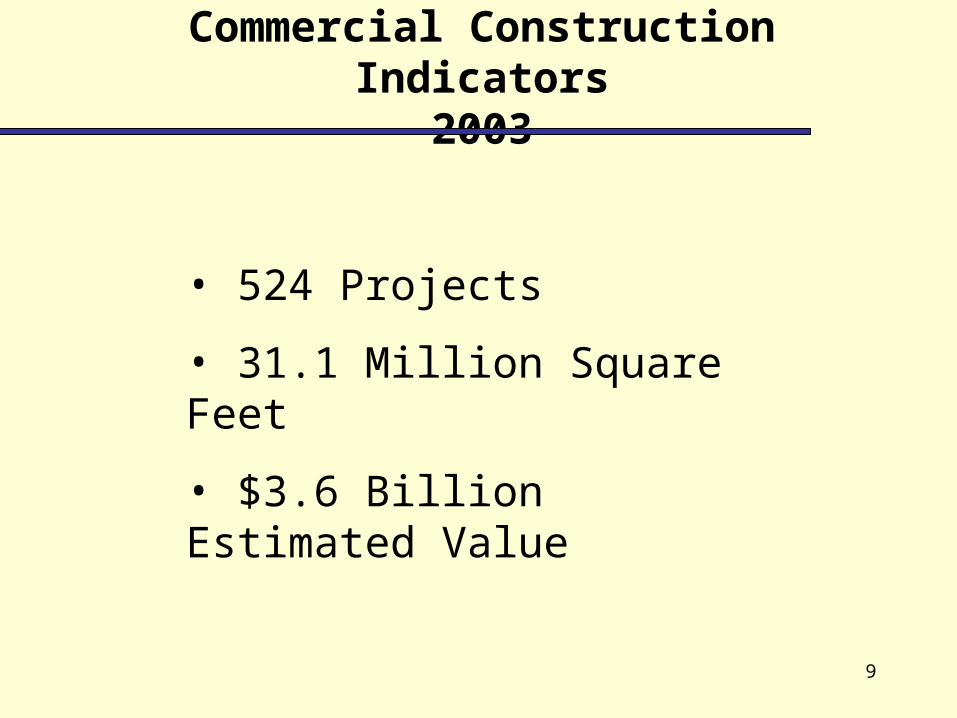
Commercial Construction Indicators2003
• 524 Projects
• 31.1 Million Square Feet
• $3.6 Billion Estimated Value

10
Commercial Construction Starts 1980 to 2003
Total Square Feet
11
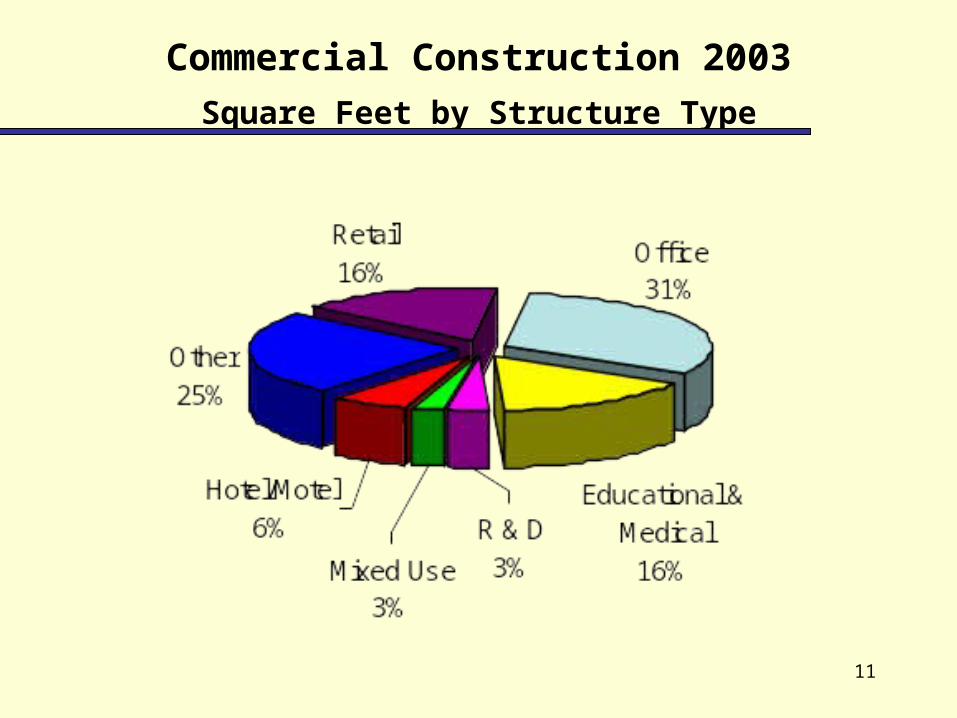
Commercial Construction 2003
Square Feet by Structure Type
12
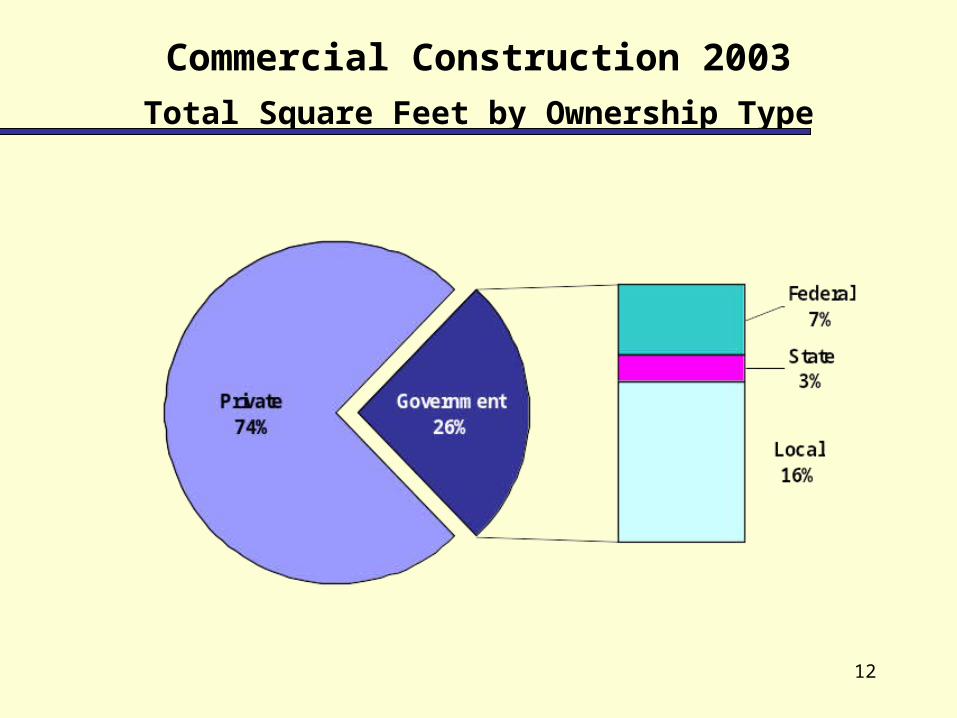
Commercial Construction 2003
Total Square Feet by Ownership Type

13
Commercial Construction 2003
Total Square Feet by Structure Type and State Group
14
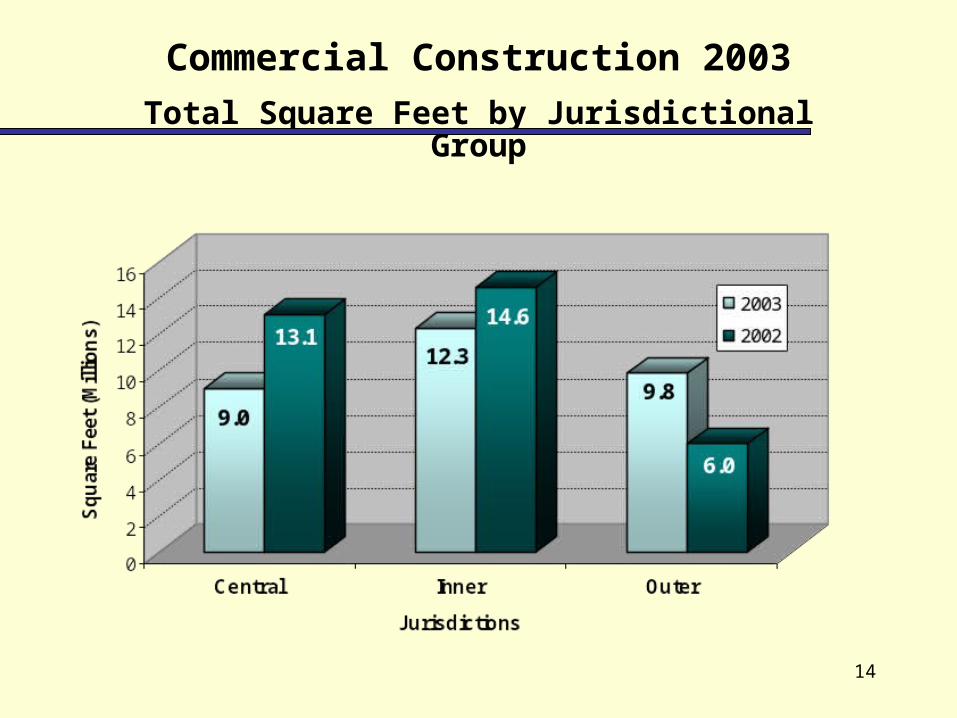
Commercial Construction 2003
Total Square Feet by Jurisdictional Group

15
Commercial Construction 2003Total Square Feet by Metrorail and Commuter Station Areas

16
Commercial Construction in Regional Activity Centers and Clusters
43% in Regional Activity Centers
55% in Regional Activity Clusters