economic valuation of natural resources
TRANSCRIPT

NOAA COASTAL OCEAN PROGRAMDecision Analysis Series No. 5
ECONOMIC VALUATION OFNATURAL RESOURCES
A Handbook for Coastal Resource Policymakers
U.S. DEPARTMENT OF COMMERCENational Oceanic and Atmospheric Adminstration
Coastal Ocean Office
Science for Solutions

The Decision Analysis Series has been estab-lished by NOAA’s Coastal Ocean Program (COP)to present documents for coastal resource deci-sion makers which contain analytical treatments ofmajor issues or topics. The issues, topics, andprincipal investigators have been selected throughan extensive peer review process. To learn moreabout the COP or the Decision Analysis Series,please write:
NOAACoastal Ocean Office 1315 East West Highway, Sta. 15140Silver Spring, MD 20910
phone: 301-713-3338fax: 301-713-4044
Photograph used on cover and in chapter open-ings is by Skip Brown; used with permission of theMaryland Sea Grant College.

NOAA COASTAL OCEAN PROGRAMDecision Analysis Series No. 5
ECONOMIC VALUATION OFNATURAL RESOURCES
A Handbook for Coastal Resource Policymakers
Douglas W. LiptonUniversity of Maryland
Katherine WellmanBattelle Seattle Research Center
with the collaboration of:
Isobel C. SheiferNOAA Coastal Ocean Office
Rodney F. WeiherNOAA Office of the Chief Scientist
June 1995
U.S. DEPARTMENT OF COMMERCERonald H. Brown, Secretary
National Oceanic and Atmospheric AdminstrationD. James Baker, Under Secretary
Coastal Ocean OfficeDonald Scavia, Director
Science for Solutions


v
ACKNOWLEDGMENTS
This handbook has grown out of a series of workshops sponsored by the NOAA CoastalOcean Program (COP). The workshops were developed to meet an expressed priority need onthe part of coastal resource managers for more information in the area of environmental valuation.The workshop concept was developed by Rodney Weiher and Katherine Wellman, both at thetime in the Economics Group in the NOAA Office of the Chief Scientist, who were asked byCOP to formulate a program to meet managerial needs. Nancy Bockstael and Douglas Lipton ofthe University of Maryland's Department of Agricultural and Resource Economics were broughtinto the team. Together this team, with coordination from Isobel Sheifer of COP, helped to laythe foundation and framework of the workshops and the handbook that grew out of them.
The handbook contains the written substance of the material being taught at the workshops.The first part of each workshop is devoted to the teaching of a core curriculum by Wellman andLipton, who have been participating in these workshops beginning with a pilot in Durham, New Hampshire, in summer 1992. The second part of the workshop involves the innovative use of casestudies through which workshop attendees get an opportunity to try out these newly studied tech-niques in actual case situations under the tutelage of a case leader. In addition to individualsalready mentioned, case studies have been facilitated by Lewis Queirolo of the NOAA NationalMarine Fisheries Service, Rebecca Baldwin of the U.S. Forest Service, and Elliot Rosenberg of theEnvironmental Protection Agency.
Among those making the greatest contribution to the development of this handbook havebeen the participants in the workshops. By filling out evaluation forms at the end of each sessionand by their private conversations with teachers and other workshop personnel, participants havehelped us improve what we teach, how we teach it, and the sequence of teaching exercises.Participation levels in case study sessions and the kind of discussions that take place have indicat-ed to us which cases were the best tools to promote the learning experience we hoped to achieve.
As the handbook has developed and become refined, we feel it is important to transfer thiskind of information to the widest possible audience of coastal managers, regardless of their work-shop attendance. To that end, we have undertaken a revision of materials to make the documenta stand-alone learning tool and have included cases from many regions of the country to make the scope of this part of the learning truly national. However, it should be noted that a case studyfor one region can be used by managers anywhere as a guide to understanding environmental valu-ation. The problems recounted in these cases have general applicability.
Merrill Leffler and Sandy Harpe have been responsible for editing and design of the text.Economic Valuation of Natural Resources is not a textbook but a guide for policy makers and
managers regarding how to assess and understand the economic value of the coastal resources forwhich they are stewards. We hope it will receive wide distribution and use.

CONTENTS
Preface 1
Chapter 1. History and Legislative Mandates for Environmental Valuation 3
Chapter 2. Concepts in Environmental Valuation 9
Chapter 3. Economic Tools for Use in Coastal Management Decisionmaking 23
Chapter 4. Measuring the Value of Goods and Services Traded in Markets 33
Chapter 5. Measuring the Value of Non-Market Goods and Services 41
Chapter 6. Benefit Transfer 55
Chapter 7. Theory and Application: Reconciling Differences 59
Case Studies 67
About the Case Studies 69
1. Oyster Restoration in Chesapeake Bay 71
2. Salmon Habitat Restoration in Alaska 77
3. Florida Keys National Marine Sanctuary 81
4. Coastal Barrier Island Preservation in North Carolina 89
5. Artificial Reef Program in Lake Erie, Ohio 93
6. Red Snapper Fishery Management in the Gulf of Mexico 99
7. Wetland Restoration in Louisiana 107
8. Nonpoint Source Pollution in California 115
Glossary 123
List of Acronyms 127
For Further Reading 129
PREFACE vii

PREFACE
rofessionals who are responsible for coastal environmental and natural resource planning andmanagement have a need to become conversant with new concepts designed to provide quan-
titative measures of the environmental benefits of natural resources. These amenities range frombeaches to wetlands to clean water and other assets that normally are not bought and sold in every-day markets.
At all levels of government — from federal agencies to townships and counties — decision-makers are being asked to account for the costs and benefits of proposed actions. To non-special-ists, the tools of professional economists are often poorly understood and sometimes inappropriatefor the problem at hand. This handbook is intended to bridge this gap.
The most widely used organizing tool for dealing with natural and environmental resourcechoices is benefit-cost analysis — it offers a convenient way to carefully identify and array, quanti-tatively if possible, the major costs, benefits, and consequences of a proposed policy or regulation.The major strength of benefit-cost analysis is not necessarily the predicted outcome, which de-pends upon assumptions and techniques, but the process itself, which forces an approach to deci-sion-making that is based largely on rigorous and quantitative reasoning.
However, a major shortfall of benefit-cost analysis has been the difficulty of quantifying bothbenefits and costs of actions that impact environmental assets not normally, nor even regularly,bought and sold in markets. Failure to account for these assets, to omit them from the benefit-costequation, could seriously bias decisionmaking, often to the detriment of the environment. Econo-mists and other social scientists have put a great deal of effort into addressing this shortcoming bydeveloping techniques to quantify these non-market benefits.
The major focus of this handbook is on introducing and illustrating concepts of environmen-tal valuation, among them Travel Cost models and Contingent Valuation. These concepts, com-bined with advances in natural sciences that allow us to better understand how changes in the nat-ural environment influence human behavior, aim to address some of the more serious shortcomingsin the application of economic analysis to natural resource and environmental management andpolicy analysis.
Because the handbook is intended for non-economists, it addresses basic concepts of eco-nomic value such as willingness-to-pay and other tools often used in decision making such as cost-effectiveness analysis, economic impact analysis, and sustainable development. A number of re-gionally oriented case studies are included to illustrate the practical application of these conceptsand techniques.
P
1

The National Oceanographic and Atmospheric Administration’s Coastal Ocean Program andits Economics Group participated in the development of this handbook and a series of regionalworkshops for state and local coastal planners and managers in an effort to apply advances in phys-ical sciences to modern environmental economic, management, and policy problems.
2 ECONOMIC VALUATION OF NATURAL RESOURCES: A HANDBOOK

History 4
Legislative Mandates 6
Wetlands Permitting 6
Nonpoint Source Pollution Control 6
Environmental Regulation 6
Fisheries Management 7
Litigation of Oil and Hazardous Waste Spills 7
Others 8
HISTORY AND LEGISLATIVE MANDATES FOR
ENVIRONMENTAL VALUATION
In the earliest versions of benefit-cost analysis of federal projects, there was no provision for ac-counting for economic gains or losses due to environmental benefit or harm. Even when aware ofthe physical harm a project or policy would have on the environment, decisionmakers were un-able to quantify these using the available economic tools of the time. Economic theory has pro-gressed to address the problems of environmental valuation, as have federal environmental lawsand regulations.
1
3

HISTORY
Environmental valuation has its origin in the River and HarborAct of 1902. This Act required a board of engineers to report onthe desirability of the Army Corps of Engineers’ river and harbor pro-jects by accounting for both the costs and benefits to commerce.
In the 1930s, the idea of broader social justification for projectsemerged as a theme. For example, the Flood Control Act of 1936authorized federal participation in flood-control schemes if the bene-fits of such actions exceeded the estimated costs. The practice ofsuch analyses then spread to other agencies concerned with water de-velopment projects. The purpose was both to justify public worksprojects and to help decide who should pay for these projects.
By the end of World War II, federal agencies had broadenedtheir approach to account for secondary, or indirect, benefits andcosts as well as intangibles. Intangibles reflected what are now con-sidered environmental assets. This was really the beginning of bene-fit-cost analysis (as will be discussed in greater detail in Chapter 3).In the 1950s, a federal interagency committee produced the Green
Environmental Valuation Legislative History
¨ River and Harbor Act of 1902
¨ Flood Control Act of 1936
¨ Broadened approach to include intangibles
¨ Green Book published in 1950
¨ Environmental movement of the late 1960s
¨ National Environmental Policy Act of 1969
¨ Clean Air Act of 1970
¨ Clean Water Act of 1972
¨ Comprehensive Environmental Response, Compensationand Liability Act of 1980 and natural resource damageassessment
¨ Executive Order 12291 (Regulatory Iimpact Analysis)issued in 1981
4 ECONOMIC VALUATION OF NATURAL RESOURCES: A HANDBOOK

Book, an attempt to codify and agree on general principles of projectjustification. This document was notable for bringing in the languageof welfare economics.1
In the late 1960s, the environmental movement began. Pollu-tion control was of particular concern and the economics communitywas ready and willing to play a role. Unfortunately, the economicview had little impact on the initial surge of legislation for pollutioncontrol. Two of the cornerstones of federal environmental policy onpollution control — the Clean Air Act of 1970 and the Clean Wa-ter Act of 1972 — explicitly prohibited weighing benefits and costsin the setting of environmental standards. Instead, standards werebased solely on public health criteria.
While the National Environmental Policy Act of 1969 (asamended through 1982) required the use of benefit-cost analysis inenvironmental impact statements, environmental valuation did notreally come into its own until the 1980s, when Executive Order12291 (the Regulatory Impact Analysis requirement) was issued.2
Additional environmental legislation, particularly the Comprehen-sive Environmental Response, Compensation and Liability Act of1980 (CERCLA), gave natural resource trustees the right to claimdamages for injuries to natural resources that result from the releaseof oil and other hazardous materials into publicly owned rivers, lakes,estuaries, oceans, or other aquatic or terrestrial habitats. The naturalresource damage assessment process explicitly calls for the estimate ofinterim lost values of injured natural resources and resource services.
During the 1980s, interest in environmental valuation contin-ued to expand, and this attention has continued into the 1990s.This increased attention stems from the implementation of the OilPollution Act of 1990 and its subsequent natural resource damageassessment regulations. The Act put pressure both inside and outsideof government to improve the decision-making criteria affecting pub-lic funds and resources. In addition, relatively recent legislativemandates, through amendments to existing legislation, havestrengthened the requirement of net economic benefit analysis aspart of management and regulatory programs.
CHAPTER 1: HISTORY AND LEGISLATIVE MANDATES FOR ENVIRONMENTAL VALUATION 5
1 Interagency River Basin Committee, Proposed Practices for Economic Analysis of RiverBasin Projects.
2 Early in the Reagan Administration the President issued Executive Order 12291. This Or-der requires cabinet-level departments to prepare benefits-cost analyses justifying majorrules. These analyses are scrutinized by the Office of Information and Regulatory Affairswithin the Office of Management and Budget. Executive Order 12291 has subsequentlybeen superseded by Executive Order 12866.

LEGISLATIVE MANDATES
The following section provides a summary of legislation whichindicates the extent of the applications of environmental valuationin the coastal and marine resource management and policy arena.
¨ WETLANDS PERMITTING. Among the many pieces of leg-islation related to wetlands, the most important is probably Sec-tion 404 of the Clean Water Act which is a component of thepermit process necessary for wetlands conversion for development.When making a permitting decision, the Army Corps of Engineersis expected to balance the public and private benefits of the pro-ject against the costs, and to take into account environmental val-ues. No guidelines are provided on how the Army Corp of Engi-neers should measure costs and benefits. Nor is there any require-ment that an actual study be conducted. However, agencies mak-ing recommendations to the Corps can (and occasionally do)make their arguments in terms of costs and benefits.
¨ NONPOINT SOURCE POLLUTION CONTROL. Section319 of the Clean Water Act establishes a national program tocontrol nonpoint sources of water pollution. In addition, Section6217b of Coastal Zone Act Reauthorization Amendments of1990 requires that all states with coastal management programsmust develop and submit to EPA and NOAA for approval aCoastal Nonpoint Pollution Control Program. Under Section6217g, EPA is required to publish guidance for specifying eco-nomically feasible management measures. All management mea-sures in Guidance Specifying Management Measures for Sources ofNonpoint Pollution in Coastal Waters are to be economically achiev-able and cost-effective. This language does little to aid the coastalmanager or planner in actually evaluating which managementmeasures create the greatest welfare to society. In order to deter-mine the depth and breadth of nonpoint source pollution control,the value of the resources (water quality, shellfish beds, recre-ation) must be determined. Once the value of the resources is es-tablished, the costs of such regulations can be weighed against thebenefits (i.e., enhanced resource and resource service quality).
¨ ENVIRONMENTAL REGULATION. The National Environ-mental Policy Act (NEPA) requires federal government agenciesto conduct an assessment of environmental impacts of proposedlegislation and “other major federal actions significantly affecting
6 ECONOMIC VALUATION OF NATURAL RESOURCES: A HANDBOOK

the quality of the human environment.” Over the years this au-thority has been extended to include any actions funded in part orregulated by the federal government, even though they are carriedout by private parties. The result of the assessment is an Environ-mental Impact Statement (EIS). Under NEPA, benefit-costanalysis is discussed but not required. When a benefit-cost analy-sis is prepared, a discussion of the relationship between the analy-sis and any analyses of unquantifiable environmental impacts, val-ues and amenities must be included.
¨ FISHERIES MANAGEMENT. The Magnuson Fishery Con-servation and Management Act of 1976 and its amendments re-quire the preparation of fishery management plans under federaljurisdiction by the Fisheries Management Councils for review bythe Secretary of Commerce/National Oceanic and AtmosphericAdministration (NOAA). Benefit-cost analysis is required underthe regulatory impact review component of the plan. Typicalanalyses might include determining the value of a recreationalfishing day or the value of a sector of the commercial fishing in-dustry to society. The National Marine Fisheries Service (forCommerce and NOAA) has issued guidance from time to time oneconomic analysis, but the adequacy of these analyses has yet tobe challenged in court.
¨ LITIGATION OF OIL AND HAZARDOUS WASTESPILLS. The Comprehensive Environmental Response, Com-pensation and Liability Act of 1980 (CERCLA) mandates thepreparation of regulations by which natural resource damages fromspills of oil or hazardous substances should be assessed to compen-sate society for losses before the resources are fully restored. TheOil Pollution Act of 1990 (OPA) also mandates the preparationof regulations by which natural resource damages, specifically fromoil spills, will be calculated. Under CERCLA and OPA, in theevent of a spill of oil or other hazardous substances, the publicmust be compensated for natural resource injuries in order tomake them as well off as they would have been without the spill.In developing a damage claim, the resource trustees must deter-mine the value of lost resources and service flows pending restora-tion. In this case, values may include the value of injured marinemammals or seabirds or the value society attaches to just knowingthat a natural wilderness area exists. CERCLA and OPA naturalresource damage assessment has attempted to incorporatestate-of-the-art environmental valuation techniques. Methods formeasuring damages are discussed by name in the regulations, in-
CHAPTER 1: HISTORY AND LEGISLATIVE MANDATES FOR ENVIRONMENTAL VALUATION 7

cluding travel costs, hedonic valuation, and contingent valuation.Also discussed is the range of types of values, including market-re-lated, nonmarket use values, and nonuse values.
¨ OTHERS. The Coastal Zone Management Act of 1972 (asamended) identifies coastal resource uses subject to managementthat may require benefit-cost analysis including the siting of majorfacilities related to energy; fisheries developments, recreation,ports and transportation; and the location of new commercial andindustrial developments. In addition, the Act encourages thepreparation of Special Area Management Plans (SAMP) for rea-sonable coastal-dependent economic growth. Net economic ben-efit analysis, in this case, is prepared by state Coastal Zone Man-agement (CZM) programs and submitted to NOAA, which issuesSAMP funds.
The Marine Protection, Research and Sanctuaries Act of1972 (as amended) requires that public and socio-economic benefitsderived from sanctuary designation be assessed as part of the approvalprocess for a proposed site. In addition, an environmental impactstatement, fisheries management guidance, and ocean pollution regu-lations are required.
The National Estuary Program (NEP) was established underSections 317 and 320 of the Water Quality Act of 1987 (amend-ments to the Clean Water Act). Under the NEP, the Administratorof EPA is authorized to convene management conferences that repre-sent a partnership across federal, state, and local levels, designed toreach consensus on priority problems of the estuary, the causes ofthose problems, and the actions that must be taken to correct thoseproblems. The management conference also provides a mechanismfor obtaining commitments to take action. These commitments, re-flected in the Comprehensive Conservation and Management Plan(CCMP), are the result of the NEP process. Development of theCCMP is critically dependent on the determination of values of estu-arine functions and services. Environmental valuation could be anintegral part of the scientific characterization process, linking sciencewith policy-relevant issues. Such values could play a major role inthe socio-political acceptability of action plan alternatives laid out asa part of the CCMP development and implementation process. Re-cent guidelines on the role of environmental valuation in NEP plan-ning have been issued by the EPA Ocean Coastal Protection Divi-sion.
8 ECONOMIC VALUATION OF NATURAL RESOURCES: A HANDBOOK
A Sampling of LegislativeMandates
¨̈ Wetlands Permit-ting: Section 404 ofClean Water Act
¨ Litigation of Oiland Hazardous WasteSpills: The Compre-hensive Environ-ment Response,Compensation andLiability Act of1980
¨̈ Oil Pollution Actof 1990
¨̈ Coastal ResourceManagement:Coastal Zone Man-agement Act of1972 (as amended)
¨̈ Marine SanctuaryDesignation:Marine Protection,Research and Sanc-tuaries Act of 1972(as amended)

Economic Value 10
Scarce Resources, Large Demands 11
Consumer and Producer Surplus 13
Environmental Valuation 16
The Social Accounting Scheme: A Case Study 18
CONCEPTS IN ENVIRONMENTAL VALUATION
The term value in economics has a precise definition — it is the price individuals are willing topay in order to obtain a good or service. The basic economic concepts of supply and demand areemployed to estimate willingness-to-pay (called producer surplus and consumer surplus, respective-ly). This idea of value and its measure remain consistent whether a market good or a state of theenvironment is at stake.
2
9

10 ECONOMIC VALUATION OF NATURAL RESOURCES: A HANDBOOK
he term value, in the context of coastal issues, can have differ-ent meanings to those with different interests. To an ecologist,
the value of a salt marsh might mean the significance or importanceof the marsh to the reproductive capacity of certain species of fish.To a coastal engineer, the value of a salt marsh may be associatedwith its contribution to shoreline stabilization. In general, these val-ues are mathematical and functional: mathematical, meaning magni-tude, and functional, meaning the physical or biological relationshipsof one entity to another. These values exist whether or not humansprefer them or are even aware of them.
ECONOMIC VALUE
A fundamental distinction between the way economics andother disciplines such as ecology use the term value is the economicemphasis on human preferences. Thus, the functionality of economicvalue is between one entity and a set of human preferences. If acoastal area is degraded so it supports a lower abundance of organ-isms, an ecologist would characterize this degraded area as less valu-able for those organisms than a non-degraded area. In economicterms, however, a polluted area only has less value than an otherwiseequivalent non-polluted area if some individual members of societyprefer non-polluted to polluted areas. If no one cares that there arefewer organisms in the polluted area, then there is no difference ineconomic value. Typically, some members of society will display apreference for an environment that is less degraded.
Economic value is a measure of what the maximum amount anindividual is willing to forego in other goods and services in order toobtain some good, service, or state of the world. This measure of wel-fare is formally expressed in a concept called willingness-to-pay(WTP). Thus, the lost value from the degraded environment is themaximum amount individuals are willing to pay to have a statewhere that same area is free of pollution.
A common difficulty in understanding economic valuation isdistinguishing between what something is valued at by individualsand what its economic value really is. Thus, one can find commercialfish landings in the United States in 1993 valued at $3.5 billion andassume that is the value of our commercial fishery. But what is thewillingness-to-pay of commercial fishers to be able to land this catch?If all the fisheries were closed tomorrow, would we have to pay $3.5billion a year in compensation to leave them as well off as if the fish-ery were open? The answer would be yes only if fishing was a com-
T

pletely costless activity, which we know it isn’t. The har-vesters have to pay for fuel, gear, and, of course, theirtime which would have been available for alternative in-come earning endeavors. The fishery, therefore, is worthsomewhat less to the harvesters. Figuring how much it isworth is the subject of Chapter 5, Measuring the Value ofNon-Market Goods and Services.
In assessing the value of some policy or managementplan, the economist is interested in estimating how muchan individual’s (or society’s) well-being would change:how much it will decrease if a natural resource were lostor increase if a natural resource or resource service werebetter managed or its quality improved. In other words,when economists try to estimate the economic value of acoastal resource or resource service, they attempt to an-swer one of two questions:
• How much are people willing to trade (give up) ofother goods and services to have some natural re-source or resource service?
• How much better off would people be if a policy ormanagement plan action were implemented and the amount orquality of a resource or resource service were improved?
SCARCE RESOURCES, LARGE DEMANDS
The economic definition of value is rooted in a simple idea: allresoures are scarce, but the demands for those resources are large rela-tive to their availability. There is never enough labor or land or wa-ter to do all the things that all individuals might wish. Because re-sources are scarce, it is necessary to make choices about how societywill use what is available. We make choices about the amount ofmoney to devote to schools, roads, libraries, and natural resource pro-tection programs individually and collectively. These choices are of-ten based on complex tradeoffs; thus, value is revealed in decisionsabout how individuals and society collectively choose to allocatethese resources. People may recoil at the notion of placing a value onthe natural environment, but there are other uses or alterations ofthat environment that might be proposed. Society always has tocompromise, giving up something to get something else.
The most direct and visible monetary symbol for a good is its
Characteristics ofEconomic Value
¨̈ Products or services have valueonly if human beings valuethem, directly or indirectly.
¨̈ Value is measured in terms oftrade-offs, and is thereforerelative.
¨̈ Typically, money is used as aunit of account.
¨̈ To determine values for societyas a whole, values are aggrega-ted from individual values.
CHAPTER 2: CONCEPTS IN ENVIRONMENTAL VALUATION 11

12 ECONOMIC VALUATION OF NATURAL RESOURCES: A HANDBOOK
market price. The relationship between a good’s market price and itsvalue in terms of willingness-to-pay (WTP) can be confusing. Wemight think, for example, that because an individual buys a certaingood at a market price of $8, then $8 is what the individual is willingto pay for this good, and thus $8 is the value to the individual. Suchreasoning, however, is not necessarily true. If an individual spends$8 to obtain a good, we know only that the good is worth at leastthis much to the individual; he or she may also have been willing tospend more, for instance a maximum of $10, to obtain the good. Inthis case, the $8 market price is only a lower bound estimate of thetotal value of the good to the individual, that is, the individual’s totalWTP for the good.
You might conclude from this example that total market expen-ditures for a good (i.e., price times quantity sold) would constitute alower bound estimate of its consumer value. The problem with thisconclusion is that the appropriate economic measure of welfare orvalue is net benefit, not total value. The net benefits society derivesfrom a good is represented by net WTP, or the amount society wouldbe willing to pay to produce and/or use a good beyond that which it ac-tually does pay.
The same principle of economic value holds for non-marketgoods, goods that do not have observable market prices. For example,consider the case of a recreational fisher who would be willing tospend up to $30 a day to use a particular fishing site, but only has tospend $20 a day in travel and associated costs. The net benefit oreconomic value to the fisher of a fishing day at the site is not the $20expenditure, but the $10 difference between what that fisher wouldbe willing to spend and what he or she actually has to spend. If a de-velopment project eliminated all fishing opportunity at the site, thefisher would lose the satisfaction of fishing there, as represented by$10 a day in net benefits. The $20 a day he or she would have spentto visit the site would not be lost but would be available to spendelsewhere.
Because market expenditures are not measures of net benefits,we cannot use expenditures on the purchase of related goods as a di-rect measure of the social value of the good. Several steps must betaken to provide the information on social value.
Because a market provides a forum for society to express relativepreferences in monetary terms, market transactions can be used to in-fer preferences, and thus economic values. Also, non-market goodscan sometimes be valued based on information on preferences pro-vided by market transactions for related products. For example, we
can estimate the value of a recreational site by travel expenditures(i.e., gas, lodging, meals).
CONSUMER AND PRODUCER SURPLUS
In measuring the general satisfaction that society as a whole de-rives from a good or service, economists often use the concepts ofconsumer surplus and producer surplus to approximate the net willing-ness-to-pay (WTP). When a good is exchanged in a perfectly com-petitive market, its market price measures the consumer demand(marginal WTP) for the last unit of the good purchased. Marketprice is determined by the equilibrium of demand and supply, i.e., theprice and quantity that correspond to the level at which the con-sumer’s WTP for the next unit produced is equal to the cost of pro-ducing it. For all other units of the good purchased, however, theconsumer marginal WTP for each unit exceeds market price.
Before discussing consumer and producer surplus, it will be use-ful to first review supply and demand curves. Supply curves describethe relationship between the quantities of a producer’s good or ser-vice and the price the producer receives. This relationship is shown
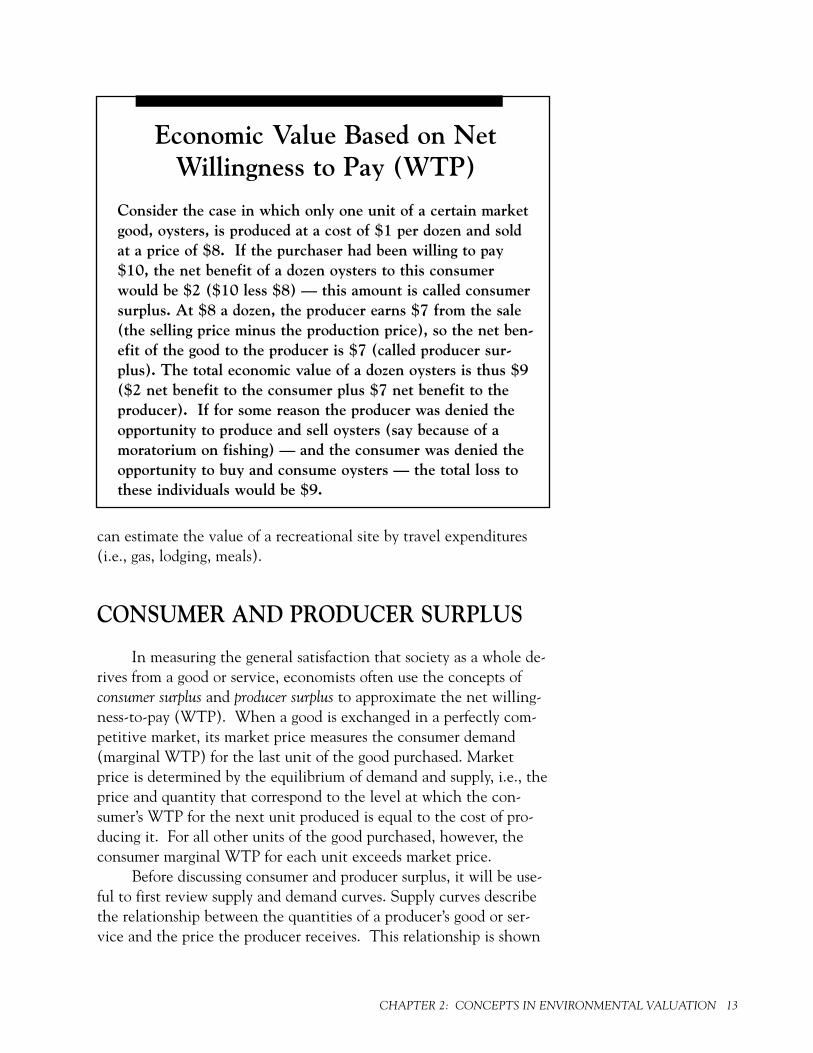
Economic Value Based on Net Willingness to Pay (WTP)
Consider the case in which only one unit of a certain marketgood, oysters, is produced at a cost of $1 per dozen and soldat a price of $8. If the purchaser had been willing to pay$10, the net benefit of a dozen oysters to this consumerwould be $2 ($10 less $8) — this amount is called consumersurplus. At $8 a dozen, the producer earns $7 from the sale(the selling price minus the production price), so the net ben-efit of the good to the producer is $7 (called producer sur-plus). The total economic value of a dozen oysters is thus $9($2 net benefit to the consumer plus $7 net benefit to theproducer). If for some reason the producer was denied theopportunity to produce and sell oysters (say because of amoratorium on fishing) — and the consumer was denied theopportunity to buy and consume oysters — the total loss tothese individuals would be $9.
CHAPTER 2: CONCEPTS IN ENVIRONMENTAL VALUATION 13

14 ECONOMIC VALUATION OF NATURAL RESOURCES: A HANDBOOK
in Figure 2.1. The price for fish and shellfish or whale watching trips,for example, might be represented by the ex-vessel price or fee, re-spectively. The greater the quantity of whale watching trips or fishproduced, the higher the incremental costs (e.g., fuel, ice and crewwages). The producer will produce a higher quantity only for a high-er price. Thus, supply curves are upward sloping. Industry supplycurves are the aggregation of the quantities of individual firm supplycurves.
Demand curves describe the price-quantity relationship for aparticular good or service for a consumer (Figure 2.2). They describewhat a consumer is willing to pay for various quantities of the goodor service, such as whale watching trips or fresh fish. As the numberof whale watching trips or fish offered to a consumer increases, satia-tion sets in and the consumer’s WTP for the marginal unit is less.Thus, the demand curve slopes downward to the right. Consumer de-mand curves are summations of the quantities of individual demandcurves.
The excess of what consumers are willing to pay over what theyactually do pay for the total quantity of a good purchased is calledconsumer surplus (Figure 2.3); it represents the good’s value to con-sumers in terms of net WTP, and is represented by the area under thegood’s demand curve, bounded by price (Figure 2.2). Moreover, agood’s market-clearing price — the price that satisfies suppply anddemand simultaneously, represented by the intersection of the supplyand demand curves — also corresponds to the marginal cost of pro-ducing the last unit of output. For all other units of the good pro-duced, however, the producer marginal production cost for each unitis less than market price.
The excess of what producers earn over their production costsfor the total quantity of a good sold is called producer surplus or eco-nomic rent. This value represents the production value or net bene-fit of the good to producers, and it is represented by the area over thegood’s supply curve, bounded by price (Figure 2.3). While not an ex-act measure of social welfare, the sum of consumer surplus and pro-ducer surplus provides a useful approximation of the net benefit of agood or service.
The concept and measurement of economic value, generally up-held in courts of law, has been evolving. There are clearly issues thathave not yet been resolved in this conceptual framework. For exam-ple, there is controversy about whether it is appropriate to use a min-imal amount one is willing to accept when estimating welfare lossesdue to environmental damage. Yet, these concepts are useful. Theybring us closer than we have ever been before to incorporating some

CHAPTER 2: CONCEPTS IN ENVIRONMENTAL EVALUATION 15

of the natural resource values that we all know exist into thetrade-off decisions that are made by government agencies and bycourts.
ENVIRONMENTAL VALUATION
Environmental valuation is a series of techniques that economistsuse to assess the economic value of market and non-market goods,namely natural resources and resource services. It applies the welfareeconomics concepts of producer and consumer surplus to issues in-volving natural resources and the state of the environment. Welfareeconomics tries to answer the question “Is society better off?” Envi-ronmental valuation is the application of welfare economics whenthe differences in circumstances relate to the uses or states of naturalresources or the quality of the environment.
When economists refer to evaluating societal benefits, it is nec-essary to recognize two “states of the world”: with and without. With-out is the base state if an activity, circumstance and policy does notchange. With is the state when the change occurs. A distinction ismade between with and without and before and after. Before and afterdoes not control for changes in the state of the world that do not re-sult from the action or policy in question. Economists try, for exam-
16 ECONOMIC VALUATION OF NATURAL RESOURCES: A HANDBOOK

ple, to weigh social benefits associated with a commercial develop-ment project against environmental benefits that would be lostshould the project be implemented. Such a social accounting analysistallies all real costs associated with an activity, including the cost oflost or damaged environmental assets and quality of life. Desirablecharacteristics of this social accounting scheme are these: it is inter-nally consistent (i.e., the underlying theory does not change with cir-cumstance), usually intuitively appealing, and acceptable in majorcourts of law.
The measurement of gains or losses is a net value (i.e., the valueof a site’s services over and above the next best alternative). As wewill see, the estimates of benefits are not restricted to losses in com-mercial enterprises, such as losses to commercial fisheries. Benefitmeasures attempt to account for the subjective preferences of societyregarding the use and existence of coastal or marine resources. Forexample, in siting a proposed development project, the locationshould be where the net benefits (commercial gains from the devel-opment) minus the costs of production and environmental damagesit causes, are maximized. If benefits are negative, then the develop-ment would represent an inefficient use of society’s resources. For ex-ample, a shopping mall built on wetlands provides less net benefitsthan the same project, just as convenient to shoppers, built on com-mon uplands.
As a general rule, the fewer substitutes available for a good orservice, the greater the loss. Thus, a site that provides excellentrecreational experiences might be adjacent to another site that pro-vides equally good recreational experiences. The loss to the recre-ationist from losing one site would be smaller than if there were noclose substitute. However, if elimination of one site causes conges-tion at another site and lowers the quality of the recreational experi-ence for everyone, then those losses must also be taken into account.
Gains from development will be higher where substitutes arefewer and more costly. Take again the simple case of a shoppingmall: gains from a new shopping mall would be the extra profits theretail stores could make plus the gains to consumers from havingshorter distances to travel to shop. However, if another mall existsnearby, consumers will gain little from the additional mall and theretail stores in the first mall may lose almost as much in profit asthose made by stores in the new mall. The net value to shoppers,real estate, and stores owners is the figure that should be compared tothe losses from building the mall.
CHAPTER 2: CONCEPTS IN ENVIRONMENTAL VALUATION 17

THE SOCIAL ACCOUNTING SCHEME: A CASE STUDY
Orian Corporation v. State of Washington Department of Ecologyillustrates how environmental economists employ social accountingtechniques as a first step in doing an economic valuation The caseprovides an example of the role environmental valuation could playin decisions related to development of environmentally sensitive ar-eas and, potentially, to the determination of compensation in theevent of a regulatory taking.
In the 1960s, the Orian Corporation proposed to dredge and filllands that they owned in the Padilla Bay tidelands of Skagit Countyin northwestern Washington State to create a Venetian-style com-munity. According to Charles Lean, former Assistant Attorney Gen-eral and counsel for the State of Washington in Orian, the plannedcommunity would have been the most populous town in SkagitCounty.
Padilla Bay is home to the largest contiguous expanse of eelgrassin the state, serves as a salmon and dungeness crab nursery, and iscritical habitat to thousands of ducks and geese, as well as endan-gered bald eagles and peregrine falcons. Recognizing the importanceof these natural resources, Skagit County’s 1976 Shoreline MasterProgram (administered by the Washington State Department ofEcology), required by the State’s Shoreline Management Act, desig-nated Padilla Bay tidelands “aquatic,” which prohibited all uses ex-
cept nonintensive recreation and aquaculture. Theuse restrictions in Skagit County’s Shoreline MasterProgram essentially barred Orian’s plans to dredge andfill the bay for an overwater housing development.
Orian Corporation argued the shoreline regula-tions constituted a “regulatory taking” and sued forthe right to develop the property. The courts had todetermine whether state interference with Orian’s useof the property was sufficiently restrictive to deny Ori-an any reasonable use of the land without offering fairmarket value. The Washington Supreme Court heldthat the shoreline regulations did not cause an uncon-stitutional taking on two grounds.
First, the court held that “the public trust doc-trine would have prohibited the intended develop-ment anyway, despite the Shoreline Management Act.Therefore, since there was no right to place fills or
Desirable Propertiesof a Social
Accounting Scheme¨̈ Accounts for all real costs or
benefits from an activity
¨ Internally consistent
¨ Intuitive
¨ Accepted in courts
18 ECONOMIC VALUATION OF NATURAL RESOURCES: A HANDBOOK

build houses in the first place, there was no taking. The state doesnot have to pay for taking a property right which never existed.”Second, the Supreme Court declared that the shoreline regulationsdid not violate the Constitution because “whenever the state imposesland use restrictions in order to safeguard the public interest inhealth, the environment, and the fiscal integrity of the area,” it is alegitimate use of police power and is “insulated” from takings claims.
The court, however, also recognized that regulations intendedto protect the Padilla Bay National Estuarine Research Reserve mayhave prevented reasonably profitable use of Orian’s tidelands. Be-cause the regulations were not intended to protect public health andsafety but instead served to enhance the value of the publicly ownedReserve, they could have caused a temporary taking. The Court sentthe case back to a lower court to resolve factual issues, where a juryheld that the Padilla Bay Reserve caused a temporary taking and Ori-an was due compensation.
The final settlement included the cost of the acreage plus inter-est accrued since the creation of the Padilla Reserve in 1980, in addi-tion to attorney fees. In exchange for $3.6 million, Orian released allclaims against the Department of Ecology and transferred all rights inPadilla Bay tideflats to the state. Thus in June 1993, the Padilla BayNational Estuarine Research Reserve in Skagit County quadrupled insize with the acquisition of 8,004 acres from the Orian Corporationand its Padilla Bay associates.
Now, suppose Washington wished to assess the potential bene-fits and costs of allowing the Orian Corporation to proceed with this
Stakeholders in Padilla Bay Development
LOSERS GAINERS
¨ Commercial Fishers ¨ Orian Corporation
¨ Recreational Fishers ¨ Wildlife Viewers
¨ Fish Consumers ¨ Consumers of Housing
¨ Wildlife Viewers
¨ Nonusers
CHAPTER 2: CONCEPTS IN ENVIRONMENTAL VALUATION 19
development project rather than incur legal costs and takings com-pensations. If this situation were analyzed from the environmentaleconomist’s perspective, the first step would be to ask: “Who are theplayers that would be affected by the decision?” That is, “Who arethe gainers and losers of limiting Orian’s ability to use the tidelandsas they wished?” Here is a summary of how some of the stakeholderscould be affected. First, the losers.
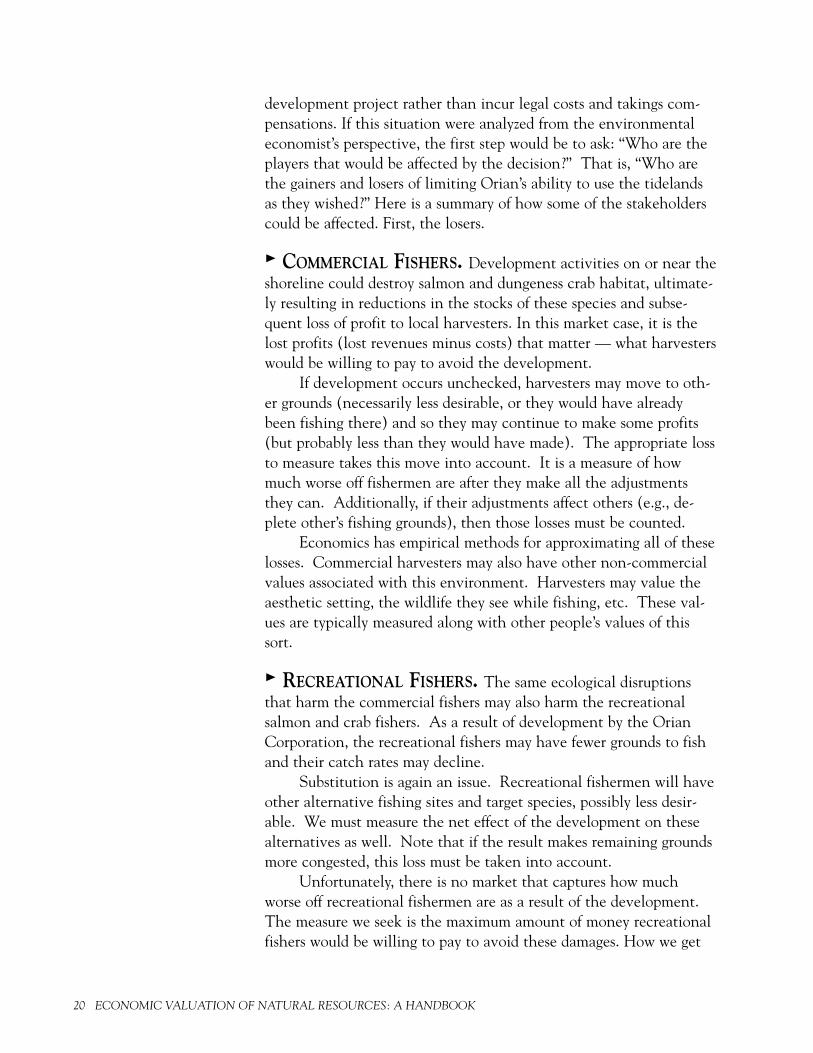
¨ COMMERCIAL FISHERS. Development activities on or near theshoreline could destroy salmon and dungeness crab habitat, ultimate-ly resulting in reductions in the stocks of these species and subse-quent loss of profit to local harvesters. In this market case, it is thelost profits (lost revenues minus costs) that matter — what harvesterswould be willing to pay to avoid the development.
If development occurs unchecked, harvesters may move to oth-er grounds (necessarily less desirable, or they would have alreadybeen fishing there) and so they may continue to make some profits(but probably less than they would have made). The appropriate lossto measure takes this move into account. It is a measure of howmuch worse off fishermen are after they make all the adjustmentsthey can. Additionally, if their adjustments affect others (e.g., de-plete other’s fishing grounds), then those losses must be counted.
Economics has empirical methods for approximating all of theselosses. Commercial harvesters may also have other non-commercialvalues associated with this environment. Harvesters may value theaesthetic setting, the wildlife they see while fishing, etc. These val-ues are typically measured along with other people’s values of thissort.
¨ RECREATIONAL FISHERS. The same ecological disruptionsthat harm the commercial fishers may also harm the recreationalsalmon and crab fishers. As a result of development by the OrianCorporation, the recreational fishers may have fewer grounds to fishand their catch rates may decline.
Substitution is again an issue. Recreational fishermen will haveother alternative fishing sites and target species, possibly less desir-able. We must measure the net effect of the development on thesealternatives as well. Note that if the result makes remaining groundsmore congested, this loss must be taken into account.
Unfortunately, there is no market that captures how muchworse off recreational fishermen are as a result of the development.The measure we seek is the maximum amount of money recreationalfishers would be willing to pay to avoid these damages. How we get
20 ECONOMIC VALUATION OF NATURAL RESOURCES: A HANDBOOK

this measure will be discussed in Chapter 5, Measuring the Value ofNon-Market Goods and Services.
¨ FISH CONSUMERS. If Orian’s development were to affect thefishery for salmon and crab so that significantly fewer salmon andcrab were available in the market, fish prices would rise and the con-sumers of fish would be negatively impacted.
Here, substitution possibilities are very important. The craband salmon consumers will substitute other products but will, by defi-nition, be worse off (or they would have made these choices to beginwith). In addition, if their substitution causes prices of other speciesof fish to rise, this rise should also be taken into account.
¨ WILDLIFE VIEWERS. If the Orian overwater housing develop-ment on Padilla Bay were to destroy the critical habitat of migratingshorebirds, bald eagles or peregrine falcons, the available area to viewthese birds may be reduced, as may the number of birds themselves,thus creating an overall reduction in birdviewing opportunities.There is no market to capture these losses directly and we will needto resort to non-market techniques.
¨ NONUSERS: NATURALISTS AND OTHERS WHO CAREABOUT THE ENVIRONMENT BUT DON’T USE THE TIDE-FLATS OF PADILLA BAY. Padilla tideflats are a relatively rareecosystem and provide critical habitat to endangered bald eagles andperegrine falcons. There may be individuals who do not visit thisarea but to whom the existence of these important natural resourcesis valuable. These people may be willing to pay some dollar amountto prevent the destruction of this habitat. Thus, in the event thatthe Orian development was allowed to occur and the unique re-sources of Padilla Bay were impacted or injured, these individualswould experience a loss of value.
If development did occur, the following stakeholders might begainers:
¨ ORIAN CORPORATION. Orian Corporation would probablybe able to increase its profits from the development over and abovewhat they would have made in the next best alternative (i.e. devel-oping housing somewhere else). Most, if not all, of the gains fromdevelopment will be measurable in markets.
CHAPTER 2: CONCEPTS IN ENVIRONMENTAL VALUATION 21

¨ WILDLIFE VIEWERS. The Orian development could enhanceaccess to the tidelands and thus improve bird-viewing opportunities.If these prospects were to occur, the benefits to wildlife viewer mightincrease. Again there is no market to capture these losses directlyand we will need to resort to non-market techniques to measurethem.
¨ CONSUMERS OF HOUSING. If the Orian development was tohave sufficient impact on the Skagit County housing market, theprice of housing might drop with the increased availability of housingprovided by Orian. Thus, the consumer would gain by the amount ofthe reduction in housing prices. Again, these gains could be mea-sured using market prices.
22 ECONOMIC VALUATION OF NATURAL RESOURCES: A HANDBOOK

Economic Impact Analysis 24
Cost-Effectiveness Analysis 26
Benefit-Cost Analysis 27
Natural Resource Damage Assessment 29
Sustainable Development Assessment 31
ECONOMIC TOOLS FOR USE IN COASTALMANAGEMENT DECISIONMAKING
Several types of economic information are useful for coastal decisionmaking. Environmental valueis important in some of these: benefit-cost analyis, natural resource damage assessments and sus-tainable development assessment. Other kinds of information such as economic impact analysisare often confused with value measures, but provide different information to the decision process.
3
23
oastal management and policy decision making requires infor-mation that ranges widely from land-use impacts on natural re-
sources to economic implications of changes to terrestrial and aquaticecosystems. While the availability of accurate information does notmean that such decision making will necessarily be good, it is clearthat the lack of accurate information will almost always contribute touninformed decisions.
While the focus of this handbook is on environmental valua-tion, namely, determining the dollar value of natural and environ-mental resources and resource services, it is important for coastalmanagers and planners to recognize a variety of alternative economicapproaches to generating and presenting economic information. Eachapproach calls for different skills and research procedures, and each isintended to answer a different question.
Which of these economic approaches planners choose dependson what they want to know. This chapter provides a brief review ofthe most important economic approaches that can be applied tocoastal zone planning and management.
ECONOMIC IMPACT ANALYSIS
Economic impact analysis is a methodology for determininghow some change in regulation, policy, or new technological break-through, or other action affects regional income and other economicactivities including revenues, expenditures, and employment. Eco-nomic impact analyses can be focused at any level, for example:
• Local environmental groups may want to assess the impact of awetlands law on the rate of population growth and tax base intheir community
• Regional groups might need to understand the impacts of a na-tional regulation on their particular economic circumstances
• International agencies might be interested in how efforts tocontrol CO2 emissions might impact the relative growth ratesof rich and poor countries
To begin with, we must first distinguish economic activity fromeconomic value. Companies supporting the worth of a proposed de-velopment plan, for example, will often cite figures on sales volumeor increases in jobs. They may claim that the new development willboost sales of other companies. These numbers are measures of eco-
24 ECONOMIC VALUATION OF NATURAL RESOURCES: A HANDBOOK
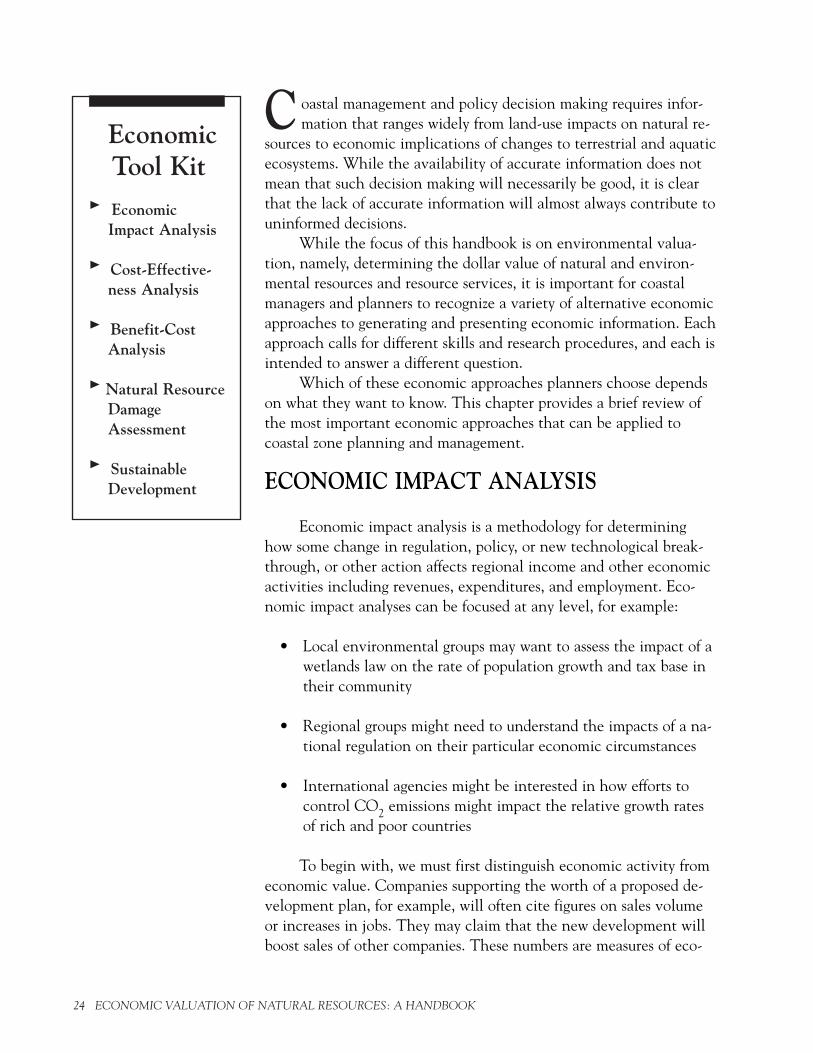
EconomicTool Kit
¨ Economic Impact Analysis
¨ Cost-Effective-ness Analysis
¨ Benefit-CostAnalysis
¨ Natural ResourceDamage Assessment
¨ Sustainable Development
C
nomic activity; they are not measures of social value, or what thingsare worth to people (see Chapter 2, Concepts in Environmental Val-uation). Techniques for measuring the economic or market activitythat such development generates is sometimes called economic im-pact analysis.
If a new establishment moves into a region, economic impactanalysis would measure the impact or effects of this new establish-ment on other businesses. Assume the establishment hires localworkers, buys products from local suppliers, and purchases transporta-tion facilities or other services. The individuals and firms that thenew establishment buys from may then increase their purchases fromother suppliers. Economic activity, then, measures the additional in-come that is generated by the new spending.
Economic impact analysis does not account for social benefit orvalue. It does not account for what is being given up, nor what alter-natives are foregone (i.e., opportunity costs). For example, an impactanalysis of recreational fishing does not contain an analysis of whatpeople would do with their time and money if, as the result of a fish-ery closure or moratorium, they couldn’t go fishing. Would they gobowling instead of fishing? If so, would they generate more or lesseconomic activity in the alternative activity? In addition, impactanalysis does not take into account anything that is not traded onthe market.
CHAPTER 3: ECONOMIC TOOLS FOR USE IN COASTAL MANAGEMENT DECISIONMAKING 25
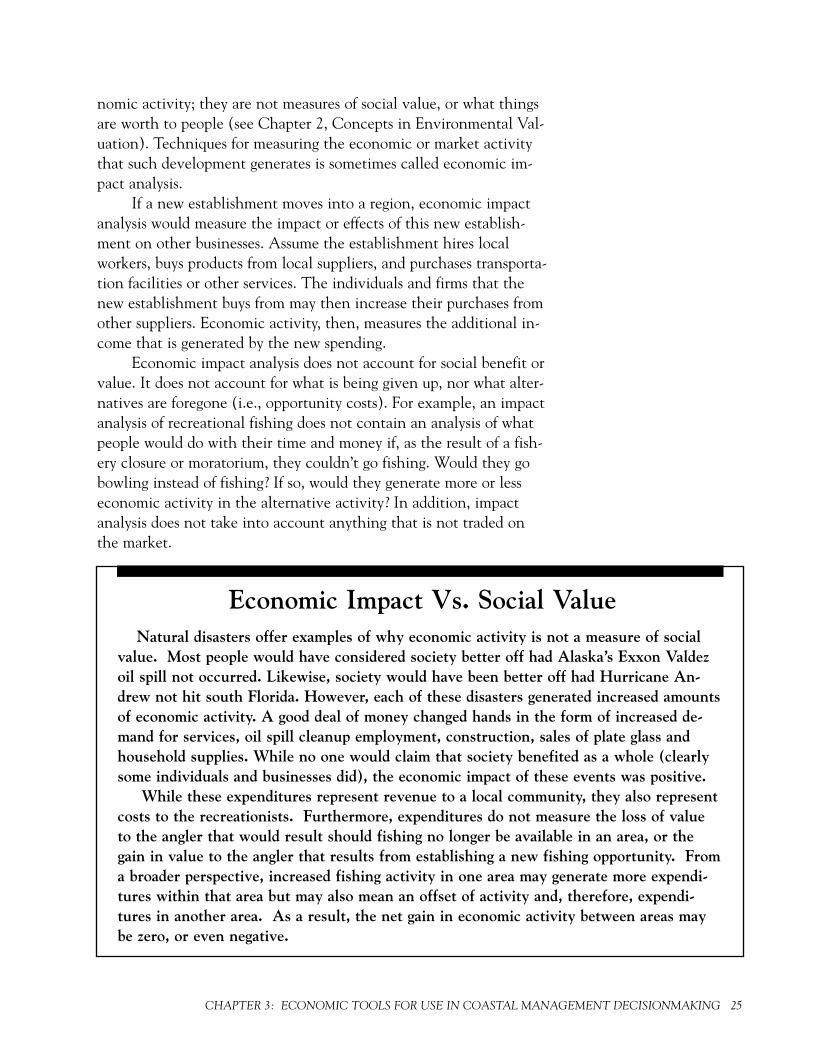
Economic Impact Vs. Social ValueNatural disasters offer examples of why economic activity is not a measure of social
value. Most people would have considered society better off had Alaska’s Exxon Valdezoil spill not occurred. Likewise, society would have been better off had Hurricane An-drew not hit south Florida. However, each of these disasters generated increased amountsof economic activity. A good deal of money changed hands in the form of increased de-mand for services, oil spill cleanup employment, construction, sales of plate glass andhousehold supplies. While no one would claim that society benefited as a whole (clearlysome individuals and businesses did), the economic impact of these events was positive.
While these expenditures represent revenue to a local community, they also representcosts to the recreationists. Furthermore, expenditures do not measure the loss of valueto the angler that would result should fishing no longer be available in an area, or thegain in value to the angler that results from establishing a new fishing opportunity. Froma broader perspective, increased fishing activity in one area may generate more expendi-tures within that area but may also mean an offset of activity and, therefore, expendi-tures in another area. As a result, the net gain in economic activity between areas maybe zero, or even negative.

COST-EFFECTIVENESS ANALYSISCost-effectiveness analysis is a methodology that can be applied
whenever it is unnecessary or impractical to consider the dollar valueof the benefits provided by alternatives under consideration (e.g.,each alternative has the same benefits expressed in monetary termsor each alternative has the same effects but dollar values have notbeen assigned). A project is cost-effective if it is determined to havethe lowest cost of competing alternatives in present value terms for agiven amount of benefits.
Suppose a community determined that its current water supplywas contaminated with some chemical, and that it had to switch toan alternative supply. Assume there are several possibilities: thecommunity could drill new wells into an uncontaminated aquifer, itcould build a connector to the water supply system of a neighboringtown, or it could build its own surface reservoir. A cost-effectivenessanalysis would estimate the costs of these different alternatives withthe aim of showing how they compared in terms of, say, the costs permillion gallons of delivered water into the town system.
A cost-effectiveness modeling approach avoids the issue of eval-uating benefits by setting desired objectives beforehand and search-ing for the lowest-cost ways of achieving these. Such an approachcan facilitate the comparison among alternative policy or manage-ment plans. Cost-effectiveness analysis can help you eliminate thoseactions that cost more than equally, or less, effective alternatives orthose actions that cost the same as more effective options. Such anapproach also allows decision makers to build a “frontier” of cost-ef-fective actions that highlights the higher marginal costs associatedwith different alternatives.
It may make good sense to do a cost-effectiveness analysis evenbefore there is a strong public commitment to the objective you arecosting out. In many cases, it may not be obvious how much peoplevalue a given objective. Once a cost-effectiveness analysis is done,they may be able to tell, at least in relative terms, whether any of thedifferent alternatives would be desirable. They may be able to saysomething like: “We don’t know exactly how much the benefits arein monetary terms, but we feel that they are more than the costs ofseveral of the alternatives that have been costed out, so we will goahead with at least one of them.”
26 ECONOMIC VALUATION OF NATURAL RESOURCES: A HANDBOOK

BENEFIT-COST ANALYSIS Benefit-cost analysis is a methodology that compares the pres-
ent value3 of all social benefits with the present value of opportunitycosts in using resources. It can give valuable insights into the eco-nomic efficiency of management and regulatory actions. If the netvalue (benefits minus costs) of a project or action is greater thanzero, then the that project is considered to be economically efficient.The more the benefits exceed the costs, the better off society is ineconomic terms as a result of the activity.
It is important to note at the outset that the basic benefit-costframework has limitations, among them, determining the discountrate of future costs and benefits, discounting and future generations,distributional issues, uncertainty and risk, and irreversibility; thesefactors will be discussed further in Chapter 7, Theory and Applica-tion: Reconciling Differences.
Despite these limitations, benefit-cost analysis is the major toolfor conducting economic evaluation of public programs in natural re-source management, such as flood control, irrigation, hydropower,harbor improvements, and alternative energy supply projects. It is afour-step process that includes the following elements.
¨ SPECIFY THE PROGRAM. Benefit-cost analysis is a tool ofpublic analysis, though there are actually many publics. Thus, thefirst step is to decide on the perspective from which the study is to bedone. If you are doing a benefit-cost study for a national agency, the“public” normally would be all the people living in the particularcountry. But if you are employed by a city or regional planningagency to do a benefit-cost analysis of a local environmental pro-gram, you would undoubtedly focus on benefits and costs accruing topeople living in those areas. The first step also includes a completespecification of the main elements of the project or program: loca-tion, timing, groups involved, connections with other programs, etc.
¨ DESCRIBE QUANTITATIVELY THE INPUTS AND OUTPUTSOF THE PROGRAM. For some projects, determining the input andoutput flows is reasonably easy. In planning a wastewater treatmentfacility, the engineering staff will be able to provide a full physicalspecification of the plant, together with the inputs required to buildit and keep it running. For other types of programs, such determina-tions can be much harder. A restriction on development in a partic-ular region, for example, can be expected to deflect development
CHAPTER 3: ECONOMIC TOOLS FOR USE IN COASTAL MANAGEMENT DECISIONMAKING 27
Benefit-CostAnalysis is
a Four-StepProcess
¨ Specifiy the pro-ject or programand alternatives.
¨ Describe quanti-tatively the in-puts and outputsof the program.
¨ Estimate thesocial costs andbenefits ofinputs andoutputs.
¨ Compare bene-fits and costs.
3 Field, B.C. 1994. Environmental Economics. McGraw-Hill, Inc., New York.

elsewhere into surrounding areas. In this step, we first have to recog-nize the great importance of the time it can take to complete largeundertakings: environmentally related projects or programs may re-quire years. Therefore, the job of specifying inputs and outputs in-volves predictions of future events, sometimes many years after a pro-ject begins. Consequently, having a good understanding of factorssuch as future growth patterns and future rates of technologicalchange and possible changes in consumers’ preferences is important.
¨ ESTIMATE SOCIAL COSTS. Assigning economic values to in-put and output flows is to measure costs and benefits. The methodsfor such measurements are the subject of Chapter 4, Measuring theValue of Goods and Services Traded in Markets and Chapter 5, Mea-suring the Value of Non-Market Goods and Services.
¨ COMPARE BENEFITS AND COSTS. In this final step, total es-timated costs are compared with total estimated benefits. Table 3.1illustrates the estimated benefits and costs associated with a regulato-ry program to control various airborne and waterborne pollutantscoming from a group of marinas.
28 ECONOMIC VALUATION OF NATURAL RESOURCES: A HANDBOOK
Benefit-costanalysis involvesmeasuring,adding up, andcomparing all thebenefits and allthe costs of aparticularpublic projector program.
Table 3.1. Results of a Benefit-Cost Analysis of a ProposedEmission Reduction Program for a Group of Marinas
Totals over life of the program ($ millions)
CostsPrivate compliance
Capital equipment 580Operating 560
Public monitoring and enforcement 96
Total $1,236
BenefitsIncreased benefits to recreators from improved
water quality 1,896Increased property value from reduced
air emissions 382Nonuse value increase related to
ecological integrity 749
Total $3,027
Net benefits $1,791
These emissions reduce the water quality in the bay on whichthey are located and contribute to air pollution in the vicinity of themarinas. The dollar values are totals of various cost and benefit cate-gories over the life of the regulatory program. Compliance costs inthe industry consist of $580 million of capital equipment costs and$560 million of operating costs. Public-sector monitoring and en-forcement required to achieve an acceptable level of compliance to-tal $96 million. There are three major benefit categories: recreation-ists (fishers and boaters) benefit from improved water quality at anestimated value of $1,896 million; property values of local homeown-ers are expected to increase to $382 million because of improved airquality and visibility resulting from reduced airborne emissions;
CHAPTER 3: ECONOMIC TOOLS FOR USE IN COASTAL MANAGEMENT DECISIONMAKING 29
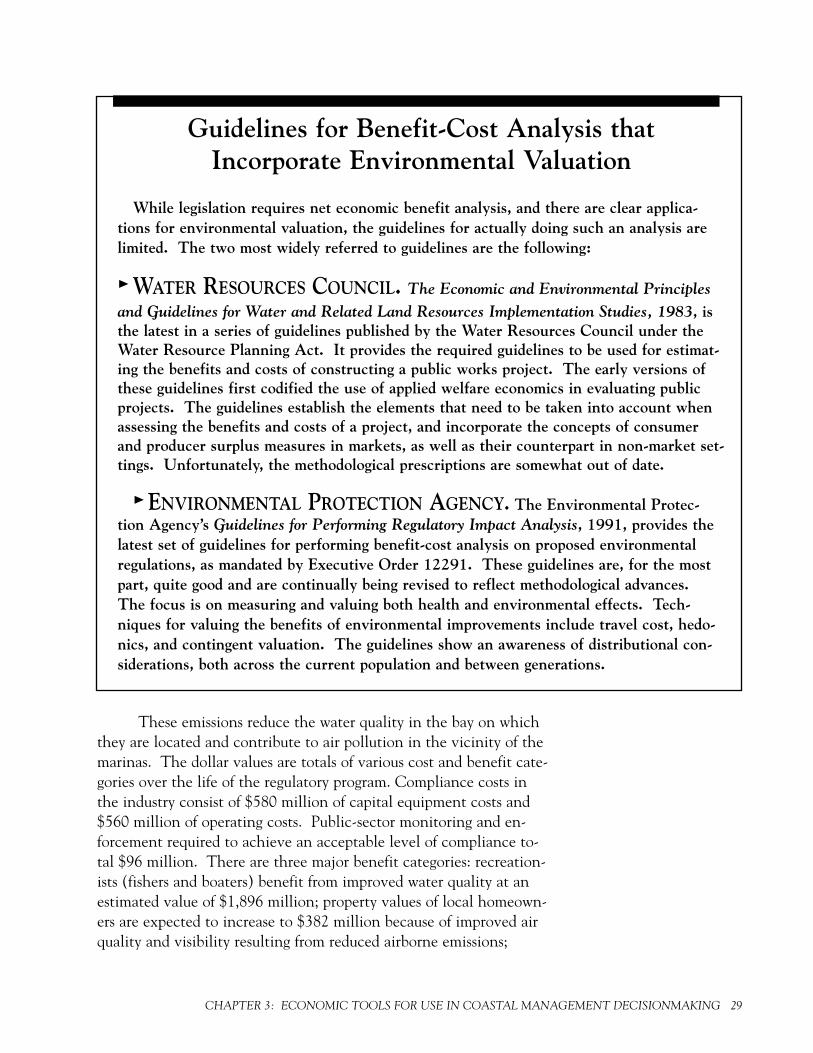
Guidelines for Benefit-Cost Analysis thatIncorporate Environmental Valuation
While legislation requires net economic benefit analysis, and there are clear applica-tions for environmental valuation, the guidelines for actually doing such an analysis arelimited. The two most widely referred to guidelines are the following:
¨ WATER RESOURCES COUNCIL. The Economic and Environmental Principlesand Guidelines for Water and Related Land Resources Implementation Studies, 1983, isthe latest in a series of guidelines published by the Water Resources Council under theWater Resource Planning Act. It provides the required guidelines to be used for estimat-ing the benefits and costs of constructing a public works project. The early versions ofthese guidelines first codified the use of applied welfare economics in evaluating publicprojects. The guidelines establish the elements that need to be taken into account whenassessing the benefits and costs of a project, and incorporate the concepts of consumerand producer surplus measures in markets, as well as their counterpart in non-market set-tings. Unfortunately, the methodological prescriptions are somewhat out of date.
¨ ENVIRONMENTAL PROTECTION AGENCY. The Environmental Protec-tion Agency’s Guidelines for Performing Regulatory Impact Analysis, 1991, provides thelatest set of guidelines for performing benefit-cost analysis on proposed environmentalregulations, as mandated by Executive Order 12291. These guidelines are, for the mostpart, quite good and are continually being revised to reflect methodological advances.The focus is on measuring and valuing both health and environmental effects. Tech-niques for valuing the benefits of environmental improvements include travel cost, hedo-nics, and contingent valuation. The guidelines show an awareness of distributional con-siderations, both across the current population and between generations.

nonuse values associated with the general improvement in the eco-logical integrity of the bay are estimated at $749 million.
We can compare total benefits and costs in several ways. Oneway is to subtract the total costs from total benefits to get “netbenefits.” In Table 3.1, the net benefits are $1,791 million ($3,027minus $1,236). Another criterion is the benefit-cost ratio, found bytaking the ratio of benefits and costs. This shows the benefits theproject will produce for each dollar of costs; the benefit-cost ratio is2.5 ($3,027 divided by $1,236)
NATURAL RESOURCE DAMAGE ASSESSMENT
Natural resource damage assessment is a methodology for deter-mining the liability for injury to natural assets that results from re-lease of oil or hazardous substances. Three federal statutes — theClean Water Act, CERCLA, and the Oil Pollution Act — all im-pose liability assessments for injury to natural assets that result fromoil spills or hazardous wasters and other substances. Under these actsregulations for comprehensive natural resource damage assessmentshave been developed by the Department of the Interior and NOAA.The process includes three steps: (1) injury determination; (2) quan-tification of service effects; and (3) damage determination. Environ-mental valuation plays a role in the latter step. Natural resourcedamages are the sum of:
• Restoration costs
• Compensable value (diminution in value of foregone natural re-source services prior to restoration)
• Damage assessment costs
¨ RESTORATION COSTS (which also include costs of rehabilita-tion, replacement, and/or acquisition of equivalent resources) includeboth direct and indirect costs. Direct costs are costs charged directlyto the conduct of the selected alternative, such as staff time, materi-als, equipment, and the like. Indirect costs are costs of activities oritems that support the selected alternative but cannot be directly ac-counted for, such as overhead.
¨ COMPENSABLE VALUE is the amount of money required tocompensate the public for natural resource services losses between
30 ECONOMIC VALUATION OF NATURAL RESOURCES: A HANDBOOK

the time of the release and the time when these services are fully re-stored to their baseline condition. Compensable value excludes anylosses associated with secondary economic impacts resulting from therelease, such as losses incurred by businesses patronized by users ofthe injured resources (e.g., bait and tackle shops).
¨ DAMAGE ASSESSMENT COSTS are the costs of peforming thestudies to determine the other costs mentioned above.
SUSTAINABLE DEVELOPMENT ASSESSMENT
Sustainable development — development that meets the eco-nomic needs of the present without compromising the ability of fu-ture generations to meet their economic needs — links two basicideas: ecological sustainability, which implies that biological ele-ments (including humans) and processes that keep ecosystems pro-ductive and resilient, should be maintained; and economic develop-ment, which seeks to maintain economic growth or expansion,should be undertaken.
Ecological sustainability and economic development must belinked when implementing policies that would lead to sustainable de-velopment. The ability to implement such policies requires multidis-ciplinary approaches which blend the perspectives, the goals, and ob-jectives of disciplines such as ecology, social science, and economics.
Determining the value of natural resources and environmentalassets in the sustainable development framework is useful in a num-ber of ways, including:
• National and regional income accounting
• Strategic benefit-cost analysis
• Project level benefit-cost analysis
¨ NATIONAL AND REGIONAL INCOME ACCOUNTING. En-vironmental values may be used to modify national income accountsso that they reflect improvements and declines in environmental re-sources. The objective is to obtain a better index of economicwell-being and avoid net loss transfers of wealth between the marketand non-market sectors. Standard gross domestic product (GDP) ac-counts reflect only a portion of a nation’s economic productivity (theportion traded in ordinary markets). Using standard accounts, a
CHAPTER 3: ECONOMIC TOOLS FOR USE IN COASTAL MANAGEMENT DECISIONMAKING 31

county or region could destroy its resource base but show an increasein wealth. For sustainable development to be operational in eco-nomic policy, environmental accounts and standard economic ac-counts must be integrated.
¨ STRATEGIC BENEFIT-COST ANALYSIS. The objective ofstrategic benefit-cost analysis is to set priorities and make trade-offsacross a range of alternative policies. Such analysis is motivated bythe economic consequences of environmental investments. For in-stance, strategic analysis may assess the benefits of investments insalmon habitat restoration relative to nonpoint source pollution con-trols. Alternatively, such an analysis may respond to questions suchas, “How much should we clean up? What level of investmentshould we make in nonpoint source pollution control or salmonhabitat restoration?” Beneficial policies are selected and put togetherto construct an overall policy package or agenda.
¨ PROJECT-LEVEL BENEFIT-COST ANALYSIS. Examines thebenefits and costs of specific policy actions and controls and extendsconventional benefit-cost procedures to the non-market sector. Thisextension is increasingly common in development decisions. For ex-ample, a study might estimate a household’s willingness to pay tohook up a centralized sewer system in order to reduce nonpointsource pollution. In controlling nonpoint source pollution,project-level analysis examines the benefits and costs of specific ac-tions. It addresses the means and methods of control once the gener-al direction of policy is set.
32 ECONOMIC VALUATION OF NATURAL RESOURCES: A HANDBOOK

Measuring Producer Surplus without Estimating Supply 34
Measuring Producer Surplus by Estimating Supply 36
Empirical Techniques for Measuring Consumer Surplus 38
Summary 40
MEASURING THE VALUE OF GOODS AND SERVICESTRADED IN MARKETS
If goods or services are traded in the market, there are well established and accepted empiricaltechniques for measuring welfare changes. For measuring producer surplus, it is not necessary toestimate the supply curve. For measuring consumer surplus, it is essential to estimate the demandcurves. These conventional techniques of measuring changes in value serve as a springboard forunderstanding non-market techniques of economic valuation.
4
33

5 Variable costs or costs which vary with output. Fixed costs are not included because, by de-finition, they do not change in the two scenarios. Thus, even if we bothered measuringthem, they would be netted out when comparing the two scenarios.
o estimate use values, economists employ market resource valu-ation methodologies. For those resources for which markets ex-
ist, economists typically rely on directly observable behavior in theform of market transactions to reveal preferences or the value thatindividuals place on goods and services and their willingness to payto avoid loss of such goods and services. The standard method formeasuring the use value of resources traded in the marketplace is theestimation of producer and consumer surplus using market price andquantity data.
MEASURING PRODUCER SURPLUSWITHOUT ESTIMATING SUPPLY
Sometimes the measurement of changes in producer surplusdoes not require complicated econometric modeling to estimate thesupply curve (see Chapter 2, Concepts in Environmental Valuation).Careful measurement of all the opportunity costs of production in al-ternative situations can be used to estimate the change in producersurplus. Consider the hypothetical case in which habitat degradationresults in a reduction of striped bass available to the commercial fish-ery in Chesapeake Bay, a reduction in catch from 8,000 to 5,000pounds a day. The ex-vessel price, below, refers to the price paid di-rectly to the harvesters for whole fish.
Prior to the reduction in stock size the state of the fishery wasestimated as follows:
Catch rate per day (pounds) = 8,000Ex-vessel price = $0.70/poundVariable costs per pound = $0.40Total days fished in season = 16Total revenue = 16 x 8,000 x 0.70 = $89,600Total variable cost5 = 16 x $0.40 x 8,000 = $51,200
Producer surplus = Total revenue minus total variable cost= $89,600 – $51,200 = $38,400
To simplify the analysis, we assume that the harvesters will notchange their fishing behavior, at least in the short run, due to the
34 ECONOMIC VALUATION OF NATURAL RESOURCES: A HANDBOOK
T

decrease in stock size. However, reduced stock size can affect har-vesters by lowering their catch rate and increasing their variablecosts of production. After the reduction in stock size, the state of thefishery is:
Catch rate per day = 5,000Ex-vessel price = $0.70 (note: for simplicity we assume no price
change)Variable costs per pound = $0.50 (uses more fuel searching for
fish)Total days fished in season = 16Total revenue = 16 x 5,000 x $0.70 = $56,000Total variable cost = 16 x $0.50 x 5000 = $40,000
Producer surplus = $56,000 – $40,000 = $16,000
The estimated change in producer surplus is $38,400 – $16,000= $22,400
Advantages of This Technique. We have a number that canbe compared against the producer surplus created by the activity thatresulted in the habitat degradation. For the average fisher, the degra-dation of striped bass habitat has created a welfare loss of $22,400 peryear. If there are 100 fishers, the estimated welfare loss would be$2,240,000. In practice the calculation would be more complicated.What will be the predicted response of harvesters due to the reduc-tion in stock size? Will some harvesters drop out of fishing or go af-ter a different species? If so, what is their producer surplus in thesealternative activities?
Disadvantage of This Technique. Such an analysis may beproblematic because of difficulties in accurately predicting thechanges in cost and earnings due to environmental change and infisher behavior. Also, the prices and cost of inputs and outputs (trueopportunity costs) may diverge from accounting costs. This is partic-ularly a problem with fisheries because of the common property na-ture of the resource. The intricacies of that problem are beyond ourstudy of environmental valuation.
Data Needs. The data required for such an analysis include de-tailed costs and earnings for a representative fisher. Such informa-tion could be obtained from an industry survey.
CHAPTER 4: MEASURING THE VALUE OF GOODS AND SERVICES TRADED IN MARKETS 35

MEASURING PRODUCER SURPLUS BY ESTIMATING SUPPLY
Econometric (statistics of economics), techniques can be usedto estimate the industry supply curve — these techniques are an al-ternative to the previous methods for directly calculating changes inproducer surplus. The method is directly linked to the previous ap-proach for measuring producer surplus because the industry supplycurve is another way of representing the variable costs of productionthat that method employs. The area under the industry supply curve(to any given quantity) is equal to the industry’s total variable cost toproduce that quantity.
From Figure 4.1 we can geometrically determine the producersuprlus: draw a rectangle connecting the price of striped bass (Y-axis)and the quantity caught (X-axis) through its point on the supplycurve (OABC). The area of this rectangle is simply price timesquantity or total revenue, the same as in the previous example. If wesubtract from this rectangular area, the area under the supply curve(area of ODBC, equal to total industry variable costs when producing
36 ECONOMIC VALUATION OF NATURAL RESOURCES: A HANDBOOK

that quantity), the remaining area (ABD) is equal to the producersurplus from the previous method.
The same exercise can be done to describe the situation afterthe decrease in the size of Chesapeake Bay striped bass populations.The reduction in stock size causes a shift left in the industry supplycurve because supply is dependent on the size of the stock. The dif-ference between the areas of the producer surplus triangles with andwithout the environmental impact is the change in producer surplus(Figure 4.2) or welfare loss (area EFGH).
Disadvantage of This Technique. The major problems associ-ated with this technique include the need to account for all the fac-tors that affect the supply curve over time (e.g., technical change infishing and regulations) to isolate the effect of the environmentalwelfare loss.
Data Needs. The data required for this analysis include timeseries data on input and output prices, landings, and stock abun-dance.
CHAPTER 4: MEASURING THE VALUE OF GOODS AND SERVICES TRADED IN MARKETS 37

EMPIRICAL TECHNIQUES FOR MEASURING CONSUMER SURPLUS
As in the case of producer surplus, econometrics can also beused to estimate consumer demand and thus changes in consumersurplus. The area under the demand curve is equal to the consumer’stotal willingness-to-pay. Suppose that initially fish consumers mustpay $3.50 per pound at the retail fish market. At that price 8,000pounds of fish are purchased. A simple calculation tells us:
consumer expenditures = $3.50 x 8,000 = $28,000
From Figure 4.3 we can draw a rectangle (area OBCD) connectingthe price of striped bass (Y-axis) and the quantity demanded (X-axis)through its point on the demand curve. The area of this rectangle issimply price times quantity or total expenditure, the same as calculat-ed above.
Some consumers may be willing to pay more than $3.50 perpound for their fish, but everyone pays the same price in the store.The area under the demand curve captures the information about thetotal amount consumers would be willing to pay for the various quan-tities offered. By subtracting what they actually pay, we obtain an es-
38 ECONOMIC VALUATION OF NATURAL RESOURCES: A HANDBOOK

timate of their net welfare from the consumption of striped bass. Inour example, the total area under the demand curve (area OECD)out to 8,000 pounds is the consumer total willingness-to-pay($34,000). Subtracting what the consumers must pay ($28,000) fromtheir total willingness-to-pay, the consumer surplus is equal to $6,000($34,000 – $28,000) — this is the area BEC.
This same exercise can be done to describe the situation afterthe decrease in the size of Chesapeake Bay striped bass populations.As outlined previously, the reduction in stock size will cause a shiftleft in the industry supply curve, causing the price of striped bass torise (Figure 4.4). The difference between the areas of the consumersurplus triangles with and without the environmental impact is thechange in consumer surplus (area BFGC).
Suppose now that with the decrease in stock size and subse-quent reduction (8,000 to 5,000 pounds) of striped bass being har-vested consumers see an increase in the retail price from $3.50 to$4.50 per pound. A simple accounting shows:
consumer expenditures = $4.50 x 5,000 = $22,500
In this new situation, the total area under the demand curve out to5,000 pounds is the consumer total willingness to pay ($23,750).Subtracting what the consumer must pay ($22,500) from their total
CHAPTER 4: MEASURING THE VALUE OF GOODS AND SERVICES TRADED IN MARKETS 39

willingness to pay, the new consumer surplus is equal to $1,250. Theestimated change in consumer surplus is then:
$6,000 – $1,250 = $4,750
or a loss of $4,750 to society.
Disadvantage of This Technique. The major difficulty withthis approach is that effects from changes in supply must be separatedfrom the effects on demand; and shifts in demand, if any, must be ac-counted for over time.
Data Needs. The data required for this analysis are time seriesinformation on market price for the product and quantity consumed,along with measures of other factors that affect demand.
SUMMARY
For environmental goods or services traded in markets, standardeconomic techniques of measuring supply and demand and determin-ing changes in producer and consumer surplus can be applied usingmarket price and quantity data. There is no difference in the tech-niques suggested here and measuring the economic value of any non-environmental good or service. In the next chapter, we demonstratetechniques economists have developed to deal with the situationwhen goods and services and other benefits do not result from markettransactions.
40 ECONOMIC VALUATION OF NATURAL RESOURCES: A HANDBOOK

Indirect Measurement Techniques 42
Travel Cost Model 43
Random Utility Models 46
Hedonic Techniques 49
Direct Techniques: Contingent Valuation Method 50
MEASURING THE VALUE OF NON-MARKET
GOODS AND SERVICES
Without the observable price and quantity data that are available when goods or services are trad-ed in the market, economists have devised innovative techniques for measuring changes in valuefor natural resources and the environment. Three of the techniques, travel cost, random utilityand hedonics use information to indirectly determine what a market might reveal in value if it didexist. The contingent value technique attempts to measure the change in value directly.
5
41
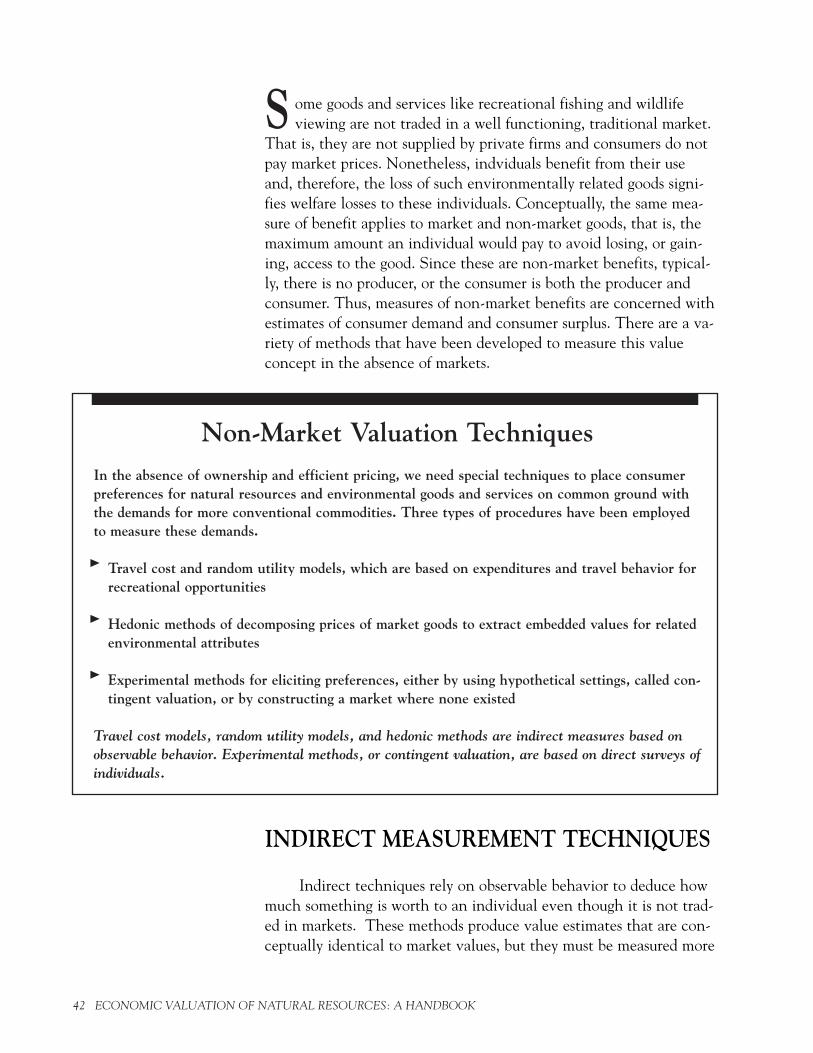
ome goods and services like recreational fishing and wildlifeviewing are not traded in a well functioning, traditional market.
That is, they are not supplied by private firms and consumers do notpay market prices. Nonetheless, indviduals benefit from their useand, therefore, the loss of such environmentally related goods signi-fies welfare losses to these individuals. Conceptually, the same mea-sure of benefit applies to market and non-market goods, that is, themaximum amount an individual would pay to avoid losing, or gain-ing, access to the good. Since these are non-market benefits, typical-ly, there is no producer, or the consumer is both the producer andconsumer. Thus, measures of non-market benefits are concerned withestimates of consumer demand and consumer surplus. There are a va-riety of methods that have been developed to measure this valueconcept in the absence of markets.
INDIRECT MEASUREMENT TECHNIQUES
Indirect techniques rely on observable behavior to deduce howmuch something is worth to an individual even though it is not trad-ed in markets. These methods produce value estimates that are con-ceptually identical to market values, but they must be measured more
42 ECONOMIC VALUATION OF NATURAL RESOURCES: A HANDBOOK
Non-Market Valuation TechniquesIn the absence of ownership and efficient pricing, we need special techniques to place consumerpreferences for natural resources and environmental goods and services on common ground withthe demands for more conventional commodities. Three types of procedures have been employedto measure these demands.
¨ Travel cost and random utility models, which are based on expenditures and travel behavior forrecreational opportunities
¨ Hedonic methods of decomposing prices of market goods to extract embedded values for relatedenvironmental attributes
¨ Experimental methods for eliciting preferences, either by using hypothetical settings, called con-tingent valuation, or by constructing a market where none existed
Travel cost models, random utility models, and hedonic methods are indirect measures based onobservable behavior. Experimental methods, or contingent valuation, are based on direct surveys ofindividuals.
S

creatively since market data are not available. Indirect techniquesinclude travel cost models, random utility models, and the hedonicpricing method.
¨ TRAVEL COST MODEL
Overview. The travel cost method is, in general, employed toestimate recreational values. This technique assumes that visitors toa particular site incur economic costs, in the form of outlays of timeand travel expenses, to visit the site. In effect, these economic ex-penditures reflect the “price” (albeit implicit) of the goods and ser-vices provided by the site, and are an indirectly observable indicationof the minimum amount that a visitor is willing to pay to use the site(with all its associated attributes).
By observing the characteristics of individuals visiting the site— for example, the specific attributes of their trip to and from thesite as well as the total number of visits — economists are able to es-timate the “derived demand” for the site. That is, for any given orimplicit price, the deriveddemand relationship willdetermine the number ofvisits consumers will “pur-chase” at that site.
The travel methodtechnique has a number ofapplications — it can beused, for example, to mea-sure the effects on a con-sumer’s willingness-to-paybecause of changes in ac-cess costs to a recreationalarea, or the elimination ofa site, or changes in envi-ronmental quality.
Advantages of This Technique. The travel cost technique isrelatively uncontroversial because it mimics empirical techniquesused elsewhere in economics. Economists generally tend to prefertechniques of this sort because they are based on actual behaviorrather than verbal responses to hypothetical scenarios. In the travelcost model, individuals are actually observed spending money andtime, and their economic values are deduced from their behavior. Inappropriate circumstances, this model can often be applied withoutenormous expense.
Issues that Require Attention in Travel Cost Modeling
¨ Costs, because time costs are often critical in recreationalconsumption
¨ Characterizing the quality dimensions of the site and takingproper account of substitute sites and their characteristics
¨ Estimating both the individual’s decision as to whether touse the site and his or her decision as to how much to useit
CHAPTER 5: MEASURING THE VALUE OF NON-MARKET GOODS AND SERVICES 43

Disadvantages of This Technique. The greatest disadvantageof travel cost and other indirect techniques is that they can not beemployed unless there is some easily observable behavior that can beused to reveal values. Thus, in the case of measurement of nonusevalues these methods are inappropriate. In the case of nonuse values,there is no observable interaction between the individual and the re-source in question
Travel cost models are also technically and statistically compli-cated. Understanding the conceptual measure requires understand-ing the connection between consumer surplus (measures of changesbehind demand curves) and the “maximum willingness to pay” con-cept. In addition, data must be employed to statistically estimate in-creasingly sophisticated econometric models that take into accountsuch factors as sample selection problems and non-linear consumersurplus estimates. Finally, the resulting estimates sometimes havebeen found to be rather sensitive to arbitrary choices of the function-al form of the estimating equation and the treatment of time.Though much technical work has been dedicated to improving thesemethods, they will continue to be subject to the problems that plagueall empirical economic estimation.
Data Needs. While the early travel cost models used informa-tion on the proportions of visitors from increasingly distant zones oforigin from which their travel occurred (called “zonal models”), cur-rent methodology requires data on individual travelers. Typically thisinformation is collected through surveys. On-site surveys can pro-vide heavy sampling of users, but these need to be augmented withsurveys of the general population in order to learn what proportion ofthe population uses the resource. A survey of the general populationalso provides data on the characteristics of the resource users as wellas information that helps the economist estimate the participationdecision.
Unfortunately, a travel cost study is best at assessing the currentsituation. To analyze the gains or losses from changes in the recre-ational resource, economists need to conduct travel cost studies un-der varying circumstances or they need a way of extrapolating the ef-fects of change. Ideally, an important recreational resource could besubject to periodic travel cost studies, so that the effect of differingconditions of the resource could better be estimated. This is espe-cially true if one is measuring the damages from a disaster such as theeffects of an oil spill on recreational boating. Economists would findinvaluable a travel cost study that had been completed before thedisaster.
44 ECONOMIC VALUATION OF NATURAL RESOURCES: A HANDBOOK

Estimating the Value of Recreational Bird-watching: Travel Cost Model
Suppose a development project calls for filling a wetlands area, an area that is a majorbird-watching site for the region. In this case the valuation question might be: Whatwould be a money measure of the lost value of observing birds in this area due to the de-velopment? The answer could be used as input to a benefit-cost analysis of the proposeddevelopment.
The first step in such an analysis is to survey participants on bird-watching tripsabout trip expenses. Thesecond step would exam-ine the relationship be-tween the number of par-ticipants and trip expens-es such as in the table.
In the absence ofsuch ideal studies, re-searchers would find anyinformation on the levelof use of the resourcebeneficial (e.g., historicalinformation on numberof users, their location ofresidence, and frequencyof use). Moreover, anyinformation that wouldhelp shape the sampling method would be valuable (e.g., when the resource is most heavi-ly used and by whom).
As with all environmental valuation, the researcher’s most difficult job is connectingthe environmental event with the effect on the user. Any insights here are invaluable.In the development case, the analysis would need to be accomplished as a hypotheticalcase. To use results from a travel cost model, researchers need to know how recreation-ists would be affected by the development activity and how that effect would translateinto changes in behavior.
From this and other data collected about the individual participants, we can estimate atravel cost demand curve with the travel cost as the price and the number of trips as thequantity shown in Figure 5.1. This demand curve will also be a function of other infor-mation collected from the individuals that help to explain their bird-watching behavior(e.g., income, ethnicity, education, etc.). We must also make adjustments econometrically
CHAPTER 5: MEASURING THE VALUE OF NON-MARKET GOODS AND SERVICES 45
Table 5.1. Travel Cost Data.
Trip Expense Range Number of Trips
< $10 50 $10-$19 25 $20-$29 13 $30-$39 8 $40-$49 5 $50-$59 3

¨ RANDOM UTILITY MODELS
Overview. Though conceptually similar to travel cost models,random utility models do not focus on the number of trips recre-ationists make to a given site in a season; rather, they focus on thechoices of recreationists among alternative recreational sites. Thistype of model is particularly appropriate when substitutes are avail-able to the individual so that the economist is measuring the value ofthe quality characteristics of one or more site alternatives.
46 ECONOMIC VALUATION OF NATURAL RESOURCES: A HANDBOOK
for the non-participants, the people who might go bird-watching in the area under differ-ent circumstances (e.g., if they had lower travel costs).
The travel cost demand curve applies to a representative individual from a particulargeographic region or socio-economic class. It is not the aggregate demand curve. To getan aggregate value measure, individual consumer surplus must be augmented by a popula-tion expansion factor which this individual represents.
This curve represents the recreational demand for bird-watching prior to the develop-ment. If bird-watching is completely eliminated at this site, then the total consumer sur-plus is lost. However, the more likely consequence is that the quality of the bird-watch-ing trip will be lowered. We will need to predict how the demand curve will shift, andthen measure the consumer surplus with and without the shift.

Advantages of This Technique. The same advantages that ap-ply to travel cost models are applicable with random utility models.Many economists consider this method as the state-of-the-art inrecreational demand modeling. Relative to the travel cost model,this approach deals well with substitute sites and environmentalquality considerations.
Disadvantages of This Technique. The approach has all thedisadvantages of the travel cost method, though it is much more dataintensive.
Data Needs. Because a researcher needs to know what alter-native sites are considered by recreationists, as well as recreationalbehavior with respect to all these alternative sites, the data require-ments are greater. In addition, accurate measurements of the charac-teristics of alternative sites are important.
CHAPTER 5: MEASURING THE VALUE OF NON-MARKET GOODS AND SERVICES 47
Estimating the Value of Recreational Bird-Watching: Random Utility Model
The superiority of the random utility model approach over the standardtravel cost method will be evident. In a hypothetical example (Table 5.2),suppose Site I is the birdwatching area proposed for development. However,there are two other relevant sites in that area, each having its own charac-teristics with regard to the experience the bird-watcher will have. These ex-periences are represented in the example by a species diversity index and a
Table 5.2. Multiple Sites with Quality Differences.
Site IProposed
Site Attributes Fill Site Site II Site III
Species Diversity Index 5.2 4.8 3.6 Bird-Spotting Index 8.7 5.9 6.3

48 ECONOMIC VALUATION OF NATURAL RESOURCES: A HANDBOOK
bird-spotting index. The greater the diversity of species and the morelikely the individual will see unusual birds, the greater the value ofthe recreational experience. Because of locational differences and thevalue of time, each individual will incur different costs to go to eachsite. Table 5.3 summarizes the pattern of visits to the different sitesby three different individuals. The data in these two tables are thetype typically used to determine the value of access to the site, orchanges in quality at a site. These data provide us with observable in-formation about how individuals make tradeoffs between the qualityof the site and the cost of accessing it. In the travel cost model, weonly have one site, so it is difficult to determine how individuals re-spond to quality changes unless the quality of that site has changedover time.
Note that the random utility model requires data about participa-tion at the study site as well as relevant alternative sites. Site charac-teristics are also implicitly considered in the decision model. In theexample, we looked at a species diversity index and an index of num-ber of bird spottings per hour as the relevant characteristics that varyacross sites.
Table 5.3. Trip Expenditures and Number of Trips Taken(Example of data from three individuals in our sample).
Individual Site I Site II Site III
1 Travel Costs $10 $20 $30Number of Trips 4 2 0
2 Travel Costs $15 $8 $40Number of Trips 0 5 1
3 Travel Costs $20 $20 $20Number of Trips 5 2 3

¨ HEDONIC PRICING METHODS
Overview. The hedonic pricing method is another techniqueto determine environmental value. In its earliest applications, thesetechniques were intended to capture the willingness-to-pay measuresassociated with variations in property values that result from thepresence or absence of specific environmental attributes, for instance,air pollution, noise, or water views. By comparing the market valueof two properties which differ only with respect to a specific environ-mental attribute, economists may assess the implicit price of thatamenity (or its cost when undesirable) by observing the behavior ofbuyers and sellers.
A variation on the approach of comparing the effects of an en-vironmental attribute would involve comparing the price of a singlepiece of property over successive sales. By correcting for other factorsthat might influence the value of the subject property, economists areable to isolate the implicit price of some amenity or bundle of ameni-ties which have changed over time. The price of a house may be af-fected by factors such as the number of bedrooms, the square footage,the existence of a pool, the proximity to local schools, shopping,highways. The price may also be affected by the proximity to, orquality of, environmental amenities. Air quality has been found tobe a determinant of housing prices in Los Angeles; whether or not aproperty abuts a woodland may also matter. Hedonic methods canalso be used to estimate the effect of certain disamenities on theprice of a house, for instance, the impact on the price of a residentialproperty adjacent to an area affected by a spill or some proposed un-favorable development.
The process for estimating an hedonic price function that re-lates housing prices to the quantities of various characteristics is rea-sonably straightforward. However, it is much more difficult to derivevalue measures from these estimated functions. Only under very re-strictive assumptions can values be obtained directly from these esti-mated functions. In most cases, a two-stage procedure that dependson information from multiple markets is necessary.
Advantages of This Technique. The hedonic techniques, liketravel cost and random utility models, depend on observable data re-sulting from the actual behavior of individuals. Market data on prop-erty sales and characteristics are available through real estate servicesand municipal sources and can be readily linked with other sec-ondary data sources.
CHAPTER 5: MEASURING THE VALUE OF NON-MARKET GOODS AND SERVICES 49

Disadvantages of This Technique. Most environmental inci-dents will have only small, if any, effects on housing prices. Evenwhere effects do exist, it may be difficult to estimate them usingeconometric methods because many factors, many of which are corre-lated, influence housing prices. For example, a house located near afactory with emissions that reduce air quality may be in a poorer sec-tion of town where schools are not as good and there are few otheramenities like parks. Even when implicit prices for environmentalamenities can be estimated, it is usually very difficult to obtain mea-sures of value from these models. The connection between the im-plicit prices and value measures is technically very complex andsometimes empirically unobtainable.
Data Needs. Data needs include prices and characteristics ofhouses sold in the housing market of interest. In particular, a measureor index of the environmental amenity of interest is needed.
DIRECT TECHNIQUES ¨ CONTINGENT VALUATION METHOD (CVM)
Overview. The most obvious way to measure nonmarket valuesis through directly questioning individuals on their willingness-to-payfor a good or service. Called the contingent valuation method, it is asurvey or questionnaire-based approach to the valuation of non-mar-ket goods and services. The dollar values obtained for the good orservice are said to be contingent upon the nature of the constructed(hypothetical or simulated) market and the good or service describedin the survey scenario.
The contingent valuation technique has great flexibility, allow-ing valuation of a wider variety of non-market goods and servicesthan is possible with any of the indirect techniques. It is, in fact, theonly method currently available for estimating nonuse values. Innatural resources, contingent valuation studies generally derive val-ues through the elicitation of respondents’ willingness-to-pay to pre-vent injuries to natural resources or to restore injured natural re-sources. Since the first published contingent valuation study onvaluing outdoor recreation appeared in 1963, more than 1,400 relat-ed documented papers, reports, and books have been published.
In contingent valuation methods, randomly selected samples orstratified samples of individuals selected from the general population
50 ECONOMIC VALUATION OF NATURAL RESOURCES: A HANDBOOK

are given information about a particular problem. They are then pre-sented with a hypothetical occurrence such as a disaster and a policyaction that ensures against a disaster; they are then asked how muchthey would be willing to pay — for instance, in extra utility taxes, in-come taxes, or access fees — either to avoid a negative occurrence orbring about a positive one. The actual format may take the form of adirect question ("how much?") or it may be a bidding procedure (a
CHAPTER 5: MEASURING THE VALUE OF NON-MARKET GOODS AND SERVICES 51
A Sampler of Contingent Valuation Questions ¨ Would you approve of the wetlands protection program if it reduced your income by
some dollar amount ($5-1500, posted price varied on questionnaires) per year in orderto have your bag or catch preserved at current levels (or 50% or 25%), rather thanhave your bag or catch reduced to zero because of continued marsh loss? (Circle oneletter.)
a. Yes b. No
Source: Bergstrom, J.C. et al. 1990. Economic Value of Wetlands-Based Recreation. Ecological Econom-ics (2):129-147.
¨ Suppose that the Terrebonne wetlands were to disappear tomorrow and that personslike yourself had a chance to save this particular area. What would you reasonably es-timate to be the maximum you would be willing to pay each year in order to guaranteethe use of this area for you and your household?
$0-$15 __ $45-60 __ $90-100 __ $200-250 __$15-30 __ $60-75 __ $100-150 __ More than $250 __$30-45 __ $75-90 __ $150-200 __
Source: Farber, S. 1988. The Value of Coastal Wetlands for Recreation: An Application of Travel Costand Contingent Valuation Methodologies. Journal of Environmental Management (26):299-312.
¨ What amount on the payment card, or any amount in between, is the most you (yourhousehold) would be willing to pay in taxes and higher prices each year to continue tokeep the nation's freshwater bodies from falling below the boatable level where they arenow? In other words, what is the highest amount you (your household) would be will-ing to pay for Goal C each year before you would feel you are spending more than it'sreally worth to you (all members of your household)? (Note: Payment card is incomedependent and shows average household public expenditures on various public programssuch as roads, education and defense.)
Source: Mitchell, R.C. and R.T. Carson. 1989. Using Surveys to Value Public Goods. Baltimore. JohnsHopkins University for Resources for the Future.

ranking of alternatives) or a referenda (yes/no) vote. Economistsgenerally prefer the referenda method of eliciting values since it isone most people are familiar with. The resulting data are then ana-lyzed statistically and extrapolated to the population that the samplerepresents.
Contingent valuation studies are conducted as face-to-face in-terviews, telephone interviews, or mail surveys. The face-to-face isthe most expensive survey administration format but is generallyconsidered the best, especially if visual material needs to be present-ed. Non-response bias is always a concern in all sampling frames. Inother words, people who do not respond have, on average, differentvalues than people who do respond.
52 ECONOMIC VALUATION OF NATURAL RESOURCES: A HANDBOOK
Pros and Cons of Contingent Valuation PROS
1. Based in economic utility theoryand can produce reliable estimates.
2. Most biases can be eliminated bycareful survey design and imple-mentation.
3. Currently the only method avail-able to measure important nonusevalues associated with natural re-sources.
4. Has been used successfully in a va-riety of situations.
5. Is being constantly improved tomake the methodology more reli-able.
CONS
1. Estimates of nonuse values are dif-ficult to validate externally.
2. Stated intentions of willingness topay may exceed true feelings.
3. Results may appear inconsistentwith tenets of rational choice
4. Respondents may be unfamiliarwith the good or service being val-ued and not have an adequate basisfor articulating their true value
5. Respondents may express a valuefor the satisfaction ("warm glow")of giving rather than the value ofthe goods or service in question
6. Respondents may fail to take ques-tions seriously because the financialimplications of their responses arenot binding.

Advantages of This Technique. In principle, contingent valu-ation methods can be used to estimate the economic value of any-thing, even if there is no observable behavior available to deducevalues through other means. It is the only method that has any hopeof measuring “existence values,” i.e., the value that individuals placeon simply knowing the natural resource exists in an improved state.This is because since existence values are not connected with useand all other methods depend on observing actual behavior associat-ed with the resource.
Though the technique requires competent survey analysts toachieve defensible estimates, it is not difficult to understand. The re-sponses must be statistically analyzed, but require no more than theunderstanding of a mean or median value.
Disadvantages of This Technique. When conducted to theexacting standards of the profession, contingent valuation methodscan be very expensive because of the extensive pre-testing and surveywork. In addition, while this technique appears easy, its applicationis fraught with problems, for example, the possibility of strategic biasby respondents or structural problems in questionnaire design.Moreover, question framing, mode of administration, payment for-mats, and interviewer interactions can all affect results.
Many questions have been raised about the reliability of thecontingent valuation method for the calculation of nonuse valuesparticularly in regard to natural resource damage assessment underOPA. Because this subject is complex and contentious and has rami-fications not applicable to the use of CVM in applications other thandamage assessment, it is not discussed here.
Data Needs. The quality of a contingent valuation question-naire depends upon the amount of information that is known before-hand about the way people think about the resource in question. In-formation on who uses the resource and who knows about it are criti-cal. When the contingent valuation method is applied to use values,the economist undertaking the survey will want to sample popula-tions most likely to use the resource. The key point is that while allthe information necessary for assessing an individual's value of theresource is collected in the survey, the economist needs help in iden-tifying a representative sample and information to allow extrapola-tion to the population.
CHAPTER 5: MEASURING THE VALUE OF NON-MARKET GOODS AND SERVICES 53
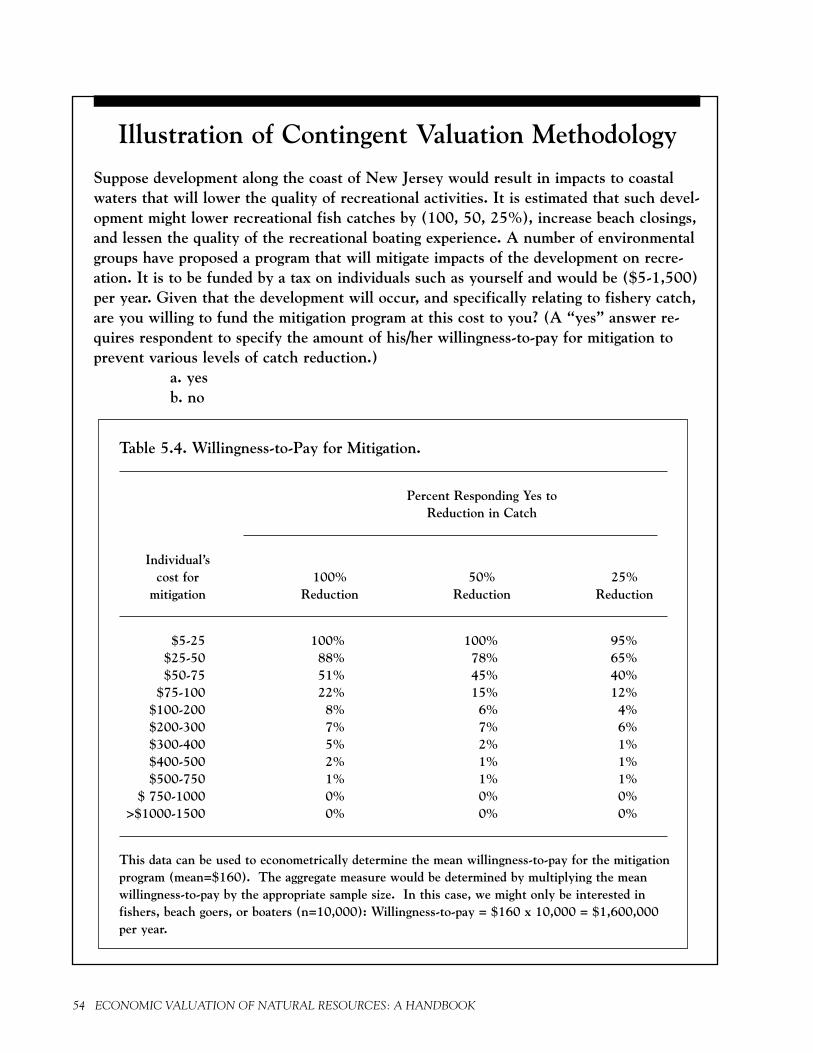
54 ECONOMIC VALUATION OF NATURAL RESOURCES: A HANDBOOK
Illustration of Contingent Valuation Methodology
Suppose development along the coast of New Jersey would result in impacts to coastalwaters that will lower the quality of recreational activities. It is estimated that such devel-opment might lower recreational fish catches by (100, 50, 25%), increase beach closings,and lessen the quality of the recreational boating experience. A number of environmentalgroups have proposed a program that will mitigate impacts of the development on recre-ation. It is to be funded by a tax on individuals such as yourself and would be ($5-1,500)per year. Given that the development will occur, and specifically relating to fishery catch,are you willing to fund the mitigation program at this cost to you? (A “yes” answer re-quires respondent to specify the amount of his/her willingness-to-pay for mitigation toprevent various levels of catch reduction.)
a. yesb. no
Table 5.4. Willingness-to-Pay for Mitigation.
Percent Responding Yes to Reduction in Catch
Individual’scost for 100% 50% 25%
mitigation Reduction Reduction Reduction
$5-25 100% 100% 95%$25-50 88% 78% 65%$50-75 51% 45% 40%
$75-100 22% 15% 12%$100-200 8% 6% 4%$200-300 7% 7% 6%$300-400 5% 2% 1%$400-500 2% 1% 1%$500-750 1% 1% 1%
$ 750-1000 0% 0% 0%>$1000-1500 0% 0% 0%
This data can be used to econometrically determine the mean willingness-to-pay for the mitigationprogram (mean=$160). The aggregate measure would be determined by multiplying the meanwillingness-to-pay by the appropriate sample size. In this case, we might only be interested infishers, beach goers, or boaters (n=10,000): Willingness-to-pay = $160 x 10,000 = $1,600,000per year.

General Assumptions 56
Methodology 57
Economic Methods/Evaluation 57
Resource 57
BENEFIT TRANSFER
Application of environmental valuation techniques may be expensive, particularly for local deci-sion-making where research budgets are limited. Benefit transfer offers a lower cost alternative toperforming a full-scale study for any particular issue.
6
55

enefit transfer is an application of a data set developed for ad-dressing one particular environmental or natural resource valua-
tion question to another context. Given the expense and time associ-ated with estimating values of non-market natural resources and ser-vices, benefit transfer can be a reasonable method for determiningsuch values. Benefit transfer applications can be divided into threeclasses:
• Estimates based upon expert opinion (e.g., the transfer of av-erage net willingness-to- pay or proxy values)
• Estimates based on observed behavior (e.g., transfer of the en-tire demand equation)
• Estimates based upon preference elicitation mechanisms, i.e.,the contingent valuation method
Benefits transfer are considered to be valid under well-definedconditions. Factors to consider in conducting a benefit-transfer deci-sion include some of the following considerations:
GENERAL ASSUMPTIONS
• For what purpose were the original value estimates generated?
• What user group(s) were considered in generating the initialestimate (e.g., duck hunters versus all citizens in an area)?
• Did the existing study address a specific or unique problemthat may have influenced the magnitude of the estimates ob-tained (e.g., during a period of heightened concern for the re-source in question)?
• Have general attitudes, perceptions, or levels of knowledgechanged in the period since the existing study was performedin a way that would influence the value of the benefit esti-mate? Are these values likely to be consistent over time?
• If the value being considered is for a generic resource category(e.g., common songbirds), are the species considered in theoriginal study relevant to the case at hand?
56 ECONOMIC VALUATION OF NATURAL RESOURCES: A HANDBOOK
B

• Were adjustments to the data made in the existing study? Forexample, were outliers deleted? Were any adjustments madefor perceived biases?
• Does the existing study consider the same or a similar geo-graphic area? Are the demographic and socio-economic char-acteristics of the two areas similar?
METHODOLOGY
• If the source being used presents a composite of existing val-ues based on an earlier literature review, what methods wereused to derive these composite values and what was the na-ture of the underlying studies?
• Were baseline conditions (e.g., ambient water quality) in theexisting study similar to baseline conditions in the case athand?
• Were variables omitted from the original study that are be-lieved to be relevant to the case at hand? To what extentdoes such omission prohibit the transfer?
• If current best research practices were not used to generatethe value estimate(s), can the estimate(s) be adjusted to re-flect changes in the state-of-the-art?
ECONOMIC METHODS/EVALUATION
• Was the study used to generate the value estimate publishedin a peer reviewed journal, or did it receive other forms ofpeer review?
• How is the original study viewed in the professional commu-nity? How was the study viewed by its sponsor?
RESOURCE
• How does the resource that was affected compare to that con-sidered in the referenced study (e.g., is the species of concern
CHAPTER 6: BENEFIT TRANSFER 57

more common in the policy study area than in the initialstudy area)?
• What was the nature of substitutes in the initial study area,and how does this compare to the policy study area (e.g., arealternative recreational opportunities more or less available inthe policy study area)?
• Was the original analysis conducted to value all organisms ofa given species, a sub-population, individual members of thespecies, or some other grouping?
Decision-makers should consider all available estimates, eachbased on the factors described above. Once a final set of values hasbeen chosen, consideration should be given to their general magni-tudes. If the existing value estimates differ significantly, or if valuesgenerated using alternative models differ significantly from one an-other, consideration should be given to whether they differ in a pre-dictable and consistent manner. In some cases it may be possible tocombine these estimates formally through meta analysis.5 In all cas-es, more defensible benefit estimates will result from comparativeanalysis.
In many cases the defensibility of the transferred economic ben-efit estimate will depend on the quality of the underlying research.However, no globally accepted, standard criteria are available tojudge the quality of existing studies. The professional and academiccommunity can provide guidance with regard to the current mini-mum conditions for quality assurance of the benefit transfer.
The Economic Analysis and Research Branch of the U.S. Envi-ronmental Protection Agency, Office of Policy Planning and Evalua-tion has prepared The Environmental Economics Database, a collectionof references for national resources and environmental amenity valu-ation studies collected over several years. Computer disks of thedatabase are available.
58 ECONOMIC VALUATION OF NATURAL RESOURCES: A HANDBOOK
5 Smith, V.K. 1992. On Separating Defensible Benefit Transfers from “Smoke and
Mirrors.” Water Resources Research, 28(3):685-694.
Discount Rates 60
Impacts across Generations 62
Uncertainty and Risk 63
Irreversibility 64
THEORY AND APPLICATION: RECONCILING
DIFFERENCES
In the practical application of environmental valuation, issues such as choosing a discount rate,dealing with intergenerational transers and equity, and decision-making under risk and uncertaintycan become important to the outcome and interpretation of the analysis. This chapter provides abrief introduction to these topics. Arguments about the appropriate discount rate can unduly ob-scure the underlying message that there is an economic value to natural resources and the environ-ment.
7
59
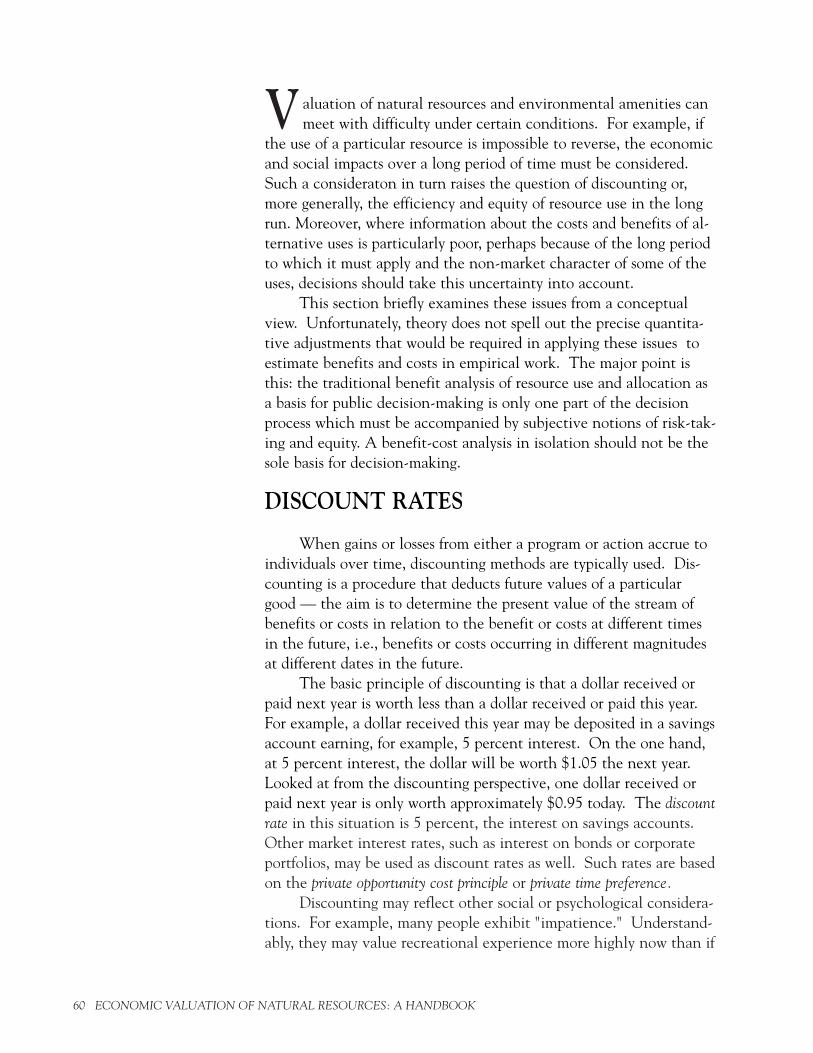
aluation of natural resources and environmental amenities canmeet with difficulty under certain conditions. For example, if
the use of a particular resource is impossible to reverse, the economicand social impacts over a long period of time must be considered.Such a consideraton in turn raises the question of discounting or,more generally, the efficiency and equity of resource use in the longrun. Moreover, where information about the costs and benefits of al-ternative uses is particularly poor, perhaps because of the long periodto which it must apply and the non-market character of some of theuses, decisions should take this uncertainty into account.
This section briefly examines these issues from a conceptualview. Unfortunately, theory does not spell out the precise quantita-tive adjustments that would be required in applying these issues toestimate benefits and costs in empirical work. The major point isthis: the traditional benefit analysis of resource use and allocation asa basis for public decision-making is only one part of the decisionprocess which must be accompanied by subjective notions of risk-tak-ing and equity. A benefit-cost analysis in isolation should not be thesole basis for decision-making.
DISCOUNT RATES
When gains or losses from either a program or action accrue toindividuals over time, discounting methods are typically used. Dis-counting is a procedure that deducts future values of a particulargood — the aim is to determine the present value of the stream ofbenefits or costs in relation to the benefit or costs at different timesin the future, i.e., benefits or costs occurring in different magnitudesat different dates in the future.
The basic principle of discounting is that a dollar received orpaid next year is worth less than a dollar received or paid this year.For example, a dollar received this year may be deposited in a savingsaccount earning, for example, 5 percent interest. On the one hand,at 5 percent interest, the dollar will be worth $1.05 the next year.Looked at from the discounting perspective, one dollar received orpaid next year is only worth approximately $0.95 today. The discountrate in this situation is 5 percent, the interest on savings accounts.Other market interest rates, such as interest on bonds or corporateportfolios, may be used as discount rates as well. Such rates are basedon the private opportunity cost principle or private time preference.
Discounting may reflect other social or psychological considera-tions. For example, many people exhibit "impatience." Understand-ably, they may value recreational experience more highly now than if
60 ECONOMIC VALUATION OF NATURAL RESOURCES: A HANDBOOK
V

CHAPTER 7: THEORY AND APPLICATION: RECONCILING DIFFERENCES 61
they were promised the same experience ten years from now. Thereasons are many — the immediate desire for pleasure and the relieffrom stress are only two. The result of preferring present consumptionor change in the state of the world is positive discount rates. Alterna-tively, a concern for future generations might lead to the opinionthat values in the future are worth as much as values today, implyinga zero discount rate.
In general, the application of discounting in a social value con-text incorporates the more complex concept of social time preferenceand is often very difficult to determine. The problem of measurementparallels that of market and non-market goods. The private rate oftime preference is revealed in markets, but the social rate is not.With respect to natural resources, the fundamental issue is one of de-fining a discount rate which reflects society's collective preferencesregarding resource utilization or retention. The discount rate in thenatural resource or environmental arena can be thought of as a mea-sure of the opportunity cost of not having immediate access to aresource.
Suppose a decision must be made on whether or not to imple-ment an oyster reef program in Chesapeake Bay. Assume a one-timestartup cost of $100,000 (Table 7.1). The benefits associated withthe program are projected for three years in increased returns to thelocal oyster industry: $15,000 in 1994, $80,000 in 1995, and $25,000in 1996. Discounting will be crucial in determining whether the reefprogram is an efficient use of society's resources.
Without discounting (or a zero discount rate), the net presentvalue of the reef program is $20,000 and the program may be consid-
Table 7.1. Discounted Net Present Value (NPV) of OysterReef Program.
Year 1993 1994 1995 1996 NPV
Benefits of Reef Program $0 $15,000 $80,000 $25,000 –Reef Development Cost – $0 $0 $0 –
0% Discount Rate – – – – $20,0003% Discount Rate – – – – $14,0415% Discount Rate – – – – $9,7757% Discount Rate – – – – $5,269
10% Discount Rate – – – – –$1,950

ered economically efficient. With a 5 percent discount rate, the netpresent value is $9,775. However, with a 10 percent discount ratethe program results in a net loss of $1,950, suggesting an inefficientuse of resources. Which discount rate is “correct”? The answer de-pends.
Difficulties arise in choosing the “correct” rate of discount.From the example, it is clear that the larger the discount rate, themore weight that is put on the present relative to the future. Largediscount rates give less weight to environmental benefits or damagesthat don’t accrue immediately but only in the long term. Real ratesof between 0 and 8 percent appear regularly in the economics litera-ture. Some have even argued for negative discount rates to reflectthe implicit interest of future generations in resource managementdecisions.
Despite the extensive literature, a consensus does not yet existon an appropriate procedure for discounting costs and benefits ofpublic programs and regulations. It is clear, however, that the char-acteristics of natural resources (e.g., slow-growing, renewable, andtypically held in public trust) necessarily imply that they should betreated differently than other private capital assets.
IMPACTS ACROSS GENERATIONS
We referred earlier to distributional implications of differentoutcomes. What happens when the distributional implications spangenerations? How do we compare situations when one generationgains and another loses? Discounting at some market-based rate ofinterest is commonly used to express future costs and benefits interms of present monetary value, assuming that a value received nowis worth more than the same value provided at some future date.Obviously, standard discounting procedures will weight the effect onthe current generation far more heavily. Thus, some critics feel thatdiscounting results in greater resource exploitation or use of naturalcapital now, at the expense of future generations. Is there an ethicalbasis for this discrimination against future generations?
Some economists have proposed that decisions affecting the fu-ture should be made with decision-makers placed behind a "veil of ig-norance" about which generation they belong to. This impartialitycriterion suggests equal use of irreplaceable resources across genera-tions, implying a zero discount rate. But with a zero discount rate, ifenough generations are involved, use of non-renewable resources
62 ECONOMIC VALUATION OF NATURAL RESOURCES: A HANDBOOK

(such as oil) approaches zero for any given generation. Likewise, ir-reversible development (such as building a dam in a unique naturalarea) is essentially precluded. Furthermore, a zero discount rate mayforeclose future options by undervaluing investments that producewealth and new technology that would be of great value to futuregenerations.
Clearly, some compromise is needed between a zero discountrate, which would preclude many resource uses and perhaps preventvaluable technological advances, and a typical market rate that re-flects only the atomistic time preferences of the current generation.This compromise has been called a social rate of discount; its argu-ment is that the government in this role should consider the wishes(the values) of both current and future generations. Because the wel-fare of future generations depends on current consumption patterns,the government should assure protection of future welfare by policiesthat force sufficient resource conservation. In essence, the govern-ment would proclaim what it deemed to be an appropriate discountrate.
Another argument takes a more democratic approach, recogniz-ing that the government is run by and for the current generation;thus, any saving for the future must rely on the values of the currentgeneration. The basis of this argument is that most citizens have aset of held values that include a concern for the larger group (includ-ing the future) as well as concern for self. If people do value the wel-fare of the future, then what is needed is a way for that value to beexpressed and measured — a way that avoids the singular context ofthe marketplace.
UNCERTAINTY AND RISK
In practice, environmental valuation must contend with a greatdeal of uncertainty. One source of uncertainty is in the problem ofpredicting the consequences of today's environmental policies andactions. Will the reduction in nutrients that enter coastal waterslead to increased fish populations? Will controls on developmentlead to cleaner estuaries? Another source of uncertainty results fromthe increasing use of models, both biological and economic, to pre-dict outcomes. Modeling is inherently a source of error, as is themeasurement error of data used to calibrate the models.
There is a branch of economics that deals with decision-makingunder uncertainty that should be an integral part of any environmen-tal valuation exercise. Uncertainty surrounding environmental mea-
CHAPTER 7: THEORY AND APPLICATION: RECONCILING DIFFERENCES 63

surements can be introduced explicitly into background analyses bythree methods:
• Direct enumeration, which requires us to list all possible out-comes
• Probability calculus, which employs formulae for the computa-tion of such statistics as the means and variance of a probabili-ty distribution
• Stochastic simulation, which is also known as Monte Carlosimulation or model sampling
While it is clear that the decision-maker should be given asmuch information as possible about the probability distribution ofpotential outcomes of environmental actions, there are no hard andfast rules as to the “correct” way to incorporate this information.
Risk is closely related to the notion of uncertainty, focusing onthe outcome that is affected by uncertainty. Every project or policydecision has risk associated with it. There is always some probabilitythat costs and benefits will not be exactly what are expected. For ex-ample, the major risk factors inherent in coastal wetlands projects areattributable to imperfect scientific knowledge of biophysical relation-ships, such as uncertainty about salinity effects on cordgrass growth,and probabilistic natural phenomena, such as varying meteorologicaland hydrological events.
A typical method of accounting for risk is to adjust discountrates upward for projects or decisions with more risk. An alternativeis to establish risk rankings of projects or decisions, along with othermeasures of anticipated benefits. Decision-makers may select actionswith lower net benefits, if they are more certain of the outcome. Thisis an example of risk aversion which enters into the decision process.
IRREVERSIBILITY
For many environmental risks, the possible negative impacts areirreversible in the sense that they cannot be undone by subsequentactions, for instance, the possible ecological effects of global warmingand species extinction.
The possibility of irreversible effects makes current policy deci-sions particularly important, since recovery from poor decisions is notpossible. In other words, we must live with the consequences of cur-
64 ECONOMIC VALUATION OF NATURAL RESOURCES: A HANDBOOK
Models are likemaps that try tochart a complex ter-ritory in which thelandscape cannot becompletely known— they depend onvariabilities in hu-man nature andecosystems them-selves.

rent policy choices without the possibility of future rectification. Ingeneral, the benefits of risk reduction are likely to be greater, if thepossible negative effects of a risky activity are irreversible, than theywould be if those effects could be offset, or reversed, by subsequentactions. For example, the introduction of a non-indigenous speciessuch as the Pacific oyster to an estuary or bay in the Mid-Atlantic isriskier when the consequences are irreversible than when they arenot.
The major implications of the existence of intertemporal con-flict and uncertainty with respect to the use of the natural environ-ment is that it will be most efficient to proceed very cautiously withany irreversible action.
CHAPTER 7: THEORY AND APPLICATION: RECONCILING DIFFERENCES 65

About the Case Studies 69
Case Study 1. Oyster Restoration in Chesapeake Bay 71
Case Study 2. Salmon Habitat Restoration in Alaska 77
Case Study 3. Florida Keys National Marine Sanctuary 81
Case Study 4. Coastal Barrier Island Preservation in North Carolina 89
Case Study 5. Artificial Reef Program in Lake Erie, Ohio 93
Case Study 6. Red Snapper Fishery Management in the Gulf of Mexico 99
Case Study 7. Wetland Restoration in Louisiana 107
Case Study 8. Nonpoint Source Pollution in California 115
CASE STUDIES
67

ABOUT THE CASE STUDIES
The case studies in this section represent a unique learning tool for applying the economic valua-tion techniques presented in the text of this handbook to real-world situations. Although some ofthe cases have been modified and have been placed in a hypothetical context, they closely mimicactual scenarios. In reading and responding to the exercises that follow each case study, the usersof this handbook can apply what they have already learned or return to the text to refresh theirunderstanding of the techniques to be used. Typically, at the workshops where facilitated traininghas been given, a participant will take part in two case-study sessions on the second day of thetraining. These case-study sessions are conducted by a workshop leader or by other individualswith particular subject matter expertise.
In putting together this handbook, the authors have been guided by the need to make it truly na-tional in scope. We have included cases dealing with questions that might arise in all regions ofthe Nation. While the cases deal with a specific state or regional context, they can be appliedthroughout U.S. coastal areas. In fact, we have learned that workshop participants sometimeslearn more easily from materials with which they do not have familiarity. We hope you will use allof these case studies to expand your understanding of the economic value of natural resources. Theauthors are grateful to the following people for assisting in the development of these materials:
Case Study 1: Oyster Restoration in Chesapeake BayWilliam Zieburtz of CH2M Hill.
Case Study 2: Salmon Habitat Restoration in AlaskaRebecca Baldwin, formerly regional economist with the U.S. Forest Service, Alaska Region.
Case Study 4: Coastal Barrier Island Preservation in North CarolinaWilliam Zieburtz of CH2M Hill.
Case Study 5: Artificial Reef Program in Lake Erie, OhioLeroy Hushak, Sea Grant Associate Director, Ohio State University and David Kelch, DistrictSpecialist of the Ohio Sea Grant College Program.
Case Study 6: Red Snapper Fishery Management in the Gulf of MexicoWayne Swingle of the Gulf of Mexico Fishery Management Council.
Case Study 8: Nonpoint Source Pollution Control in CaliforniaLeigh Taylor Johnson, San Diego Area Marine Advisor, and Erika McCoy, Program Represen-tative, University of California Sea Grant College Program, Cooperative Extension Service.
69

OYSTER RESTORATION IN
CHESAPEAKE BAY
Background
Since the mid-1800s the Chesapeake Bay has been amajor producer of oysters to an extended market reach-ing as far away as California and England. During the56-year period after 1834 when the business of packingoysters for shipment to the interior was established inBaltimore, Maryland, the average annual harvest fromthe Bay was 7 million bushels per year, or 392 millionbushels for the period. This massive yield from boththe Maryland and Virginia portions of the Bay was al-most entirely the result of natural production, that is,there was little farming of oysters.
Sometime after the turn of the century, Mary-land’s oyster harvests dropped below that of Virginia.This change in comparative productivity may have re-sulted from several factors: development of widespreadprivate leasing of Bay bottom grounds in Virginia whilein Maryland public grounds remained the primarysource of harvesting; growth of power dredging in Vir-ginia, which was highly restricted in Maryland; over-fishing of public beds in Maryland; and increasing de-struction of oyster reefs and their consequent smother-ing by siltation. In the early 1900s, Virginia became thelargest producer of oysters in the Chesapeake Regionand on the entire Atlantic seaboard.1
C A S E S T U D Y 1
Situation
The near-decimation of oysters inthe Chesapeake Bay by protozoandiseases has stirred interest in im-porting a disease-resistant species ofoyster for restoration of the fishery.Historical differences between theMaryland and Virginia oyster indus-tries, however, complicate the prob-lem of restoration. Competing inter-ests between the commercial fish-eries of both states as well as consid-erations of the role oysters play inthe Bay’s ecological health must betaken into account.
O2@@@@@@@6K??O2@@@@@@@@@@@@@6K O2@@6K
?O2@6Ke?O2@@(M?gI4@@@@@6K? ?O2@@@@@@@@@@@@6X??O2@@@@@@@@@@@@Hhe?I4@@@@@@@6K ?W2(M?hI4@@)K
?W2@@@@0MI4@@@@@@L ?I4@@@@@@6?2@@@@@@@6K? O&0Yhf?I4@6KW&@@@(M?g?I'1he?@f?I4@@@@@@@@@@@@@@@@@6K ?@(M ?I'@6X
?W&@@@0YheV'he?@g?I4@@0M??I'@eI4@@@@6X J@H? V4@)K?O&@(M? ?@ N@fI4@@@)K? ?W&5h?O2@6KhI'@6X?
?@@@0Y ?@gI'@@@@6K W&0Yg?O2@@@@@6Kg?V'@)K?@(M ?V4@@@@@@@@6K? ?O.Mf?O2@@@@@@@@(R'6Kg?@@@6X
O2@0Y? I4@@@@@@@@@@@6K? ?W20Y?e?W2@@?@@@@@@@He@@@@6K?O&@@@@)K??O2@@0M? ?I4@@@@@@@@6K? ?O26K? ?.M?fW&@@@@@@@@@@@?O&@@@@@@@@@@@@@@@@
?O2@(M @? ?I4@@@@6K? ?O2@@@@@@@ 7@@@@@@@@@@@@@@@@@@@@@@@0MeI'@@L??O2@@0Y? I4@@@@@6KO2@@@@@@6K? O2@6K?f?@@@0Mg?@@@@@6K ?J@@@@@@@@@@@@@@@@@@@0M?g?V4@)K
?W2@@0M? @@ I4@@@@@@@@@@@@@@@@@@@@@@@@6Khf?O2@@@@@@@@@@@@@@@@@@? I4@@@@@6K? @?g?7@@@@0M @@6XW&@(M?h?)X?f@@ @@ I4@@@@@@@@@@@@g?I4@@@@@@@@@@@@@@@0M ?I4@@@@@@@?@@@@@@6K? J@@(M? 3@@1
?O&@(Yhe?@)?f@@ ?I4@@@@@@@L?g?I'@@@@@@@@@0M I4@@@@e?I4@@@@@6K ?@h7@(Y V'@@L??W2@@@ @? ?I4@@@)KhN@@@(Me@? I4@@@6K? ?J@(Y? ?N@@)X?7@@@@)Kf?@ ?@g@? I'@@6Kg?@@@Y?e@@6X I4@@@@@@@6K? ?@h?7@Hf?W-X @@@)K?J@@@@@@@@? ?@ ?N@@@@6KeO2@@@@@@@@@@@)K??O2@@@6KhW2@@@@@@@@@@@6?2@@@@6K I4@@@@@@6X ?@@Lf?7@)X? 3@@@@@
?W&@@@@@@@@? @@@@@@@@@@@@@@@@@@@@@@@@@@@@@@@@6KO)X??W&@@@@@@@@@@@@@@@@@@@@@@6K? I4@@@)K? @@@@@@@@@@@6K? W2@@@)X?e?@@@)?@@@@@? N@e?@L??7@@@@@0M? W&K?f?J@@@@@@@@@@@@@@@@@@@@@@@@@@@@@@@@@@@@)KO&@@@@@@@@@@@@@@(MgI4@@@@6K ?I4@@6K? ?@@@@?hI'@@@@@@@@@6K? @@@?h?W&@@@@@)Kh3@@@5? ?@e?31?J@(Mhf'@6Xh?W&? *@@@@6K?O&@@@0?4@@@@0Mg?I4@@0MI4@@@@@@@@@@@@@@@@@@@@@@@@@@@H?h?I'@@@@@ ?I4@@@@6K? ?N@@@(M?eI4@@@6K? ?@e@MheO&@@@@@@@@6KgV4@0Y?eW2@@@@@6X?he?N@?7@H?hfV4@)X?g?*@? V4@@@@@@@@@0M? I4@@@@@@@@@@@@@@@@@@@@hfV'@@@@L?e@6X? I4@@@@@@@6K? @@@HhI4@@@@e?@@@@@@@@6KO2@6K ?@ W2@@@@(MeI'@@6Xhf7@@@@@@@)Xhf@?
?J@5 ?@)Xg?V'? ?I4@@0M? I4@@@@@@@@@@6Kg?V'@@@1?eN@)X I4@@@@@@@@@6K? @@@? ?@@@@@@@@@@@@@@@@@@@@6K?hf?O2@@( *@@@@0Y?e?V4@@)K?h?J@@(M?@@@@1hf@LW&(Yhe)Xf?3@1 I4@@@@@@@@@6X?fN@@@@?e?@@)K?O2@@@@@@6Khf?W@@@@@@@@@6K? W2@@@@@@6X ?I'@@@@@@@@@@@@@@@@@@@0Y N@@(M?g?I'@@6X?g?7@(Y??@@@@@L?he317@H?he@)f?V4@ I4@@@@@@)?2@@6X@@@@?e?@@@@@0M?I4@@@@@6KheO&@@@@@@@@@@@@@@@@@@@@6K O2@? ?O&@@@@@@@@)X? N@@@@@@@@@@@@@@@@@0Mh?O2@@@f?@(YheV'@@)Xg?@0Ye?@@@@@1?f?@fN@@@ ?@ ?I4@@@@@@@@@@@@@@?O2@@@@(MhI4@@@6?@K?O2@@@@@@@@@@@@@@@@@@@@@@@@@@@@@@6K ?O2@@@@@@@@?he?@@@@@@@@@@@?I4@@@)X?@@@6K ?@@@@@@@@@@@@@@@0MhW2@@@@@@fC(Y?he?V'@@1hf?@@@@@@?f?3L?e?@
?J@5h@? ?@ I4@@@@@@@@@@@@@@@@H?he?I4@@@@@@@@@@@@@@@@@@@@@@@@@@@@@@@@@@@@@@@@@@@@@@@@6K?g?O20M?eI4@@@?heJ@@@@@f?@L??I'@@1?@@@@@@6K??O2@@6K? ?@@@@@@@@@@@0Mhe?O&@@@@@@@eO2@H V'@@L?he?@@@@@@?f?N)Xe?@L??7@H @@hf@@@? ?I4@@@@@@@@@@@@@ ?I'@@@0Me?I4@@@@@@@@@@0M?fI4@@@@@@@@@0M?gI'@@6Kh7@@@@@L?e?@)XeN@@@?@@@@@@@@@@@@@@@@6?2@@@@6KO2@@@@@@@@@@@@@@0Mhe?O2@@0?'@@@@@@@@@? ?V'@)X @@@Lg31e?31?J@5? @@@? ?I'@@@@@@@@@ ?@h?I4@@@@@@@X?he?I4@@0M?he@@@@@@@?f@@@@@@)Ke?@@)X?J@@@@@@@@?e@@@@@@@@@@@@@@@@@@@@@@@@@@@0M?hf?O2@@@@@f@@@@@@0M V4@)K?hf@@@1gV'e?N@L
?W&(Y?W& @? V4@@@@@@@@@@@@6X ?W&@hfI'@@@@)X W&@@@@@@@?hI4@@@?J@@@)?&@@@@@@@5?e@@@@f@@@@@@@@@@@@@@@@(M ?W2@@@@@@@eO&@@@0M? I'@6X?he3@@@L?he@1?7(Ye&@ ?@6X I4@@@@@@@@@@@)K??O2@@@@@@@@@@@@@@@6KfW&@@@6X?h?N@@@@@)K? O2@@@?*@@@@@@X @@@@@@@@@@@@@@H?e@@@@f@@@@@@@@@@@@@@@0Y? O&0Me?W@@W2@@0M ?V'@)XheN@@@)Xhe3@J@H? @?hf?@@)h@? I4@@@@@@@@@@@@@@@@@@@@@@@@@@@@@@@6KO&@@@@@)Kh?J@@@@@@@6X?he?O2@@@@@@?eV'@@@@@)X? I4@@e?J@@@@f@@@@@@@@@@0M ?O2@(Mf?7@@@@(M V'@)X?h?@@@@)X?hN@
?W&5hf?W2@(? @L ?I@?4@@@@@@@@Xf@@@@@@@@@@0?4@@@@@@@6Kf?@@@@@@@@@)Kh?O2@@@@@@@@Lf@@@@@@)K ?7@@@@L? O2@@@(Y?fJ@@@@0Y? ?V'@)XheI'@@)Kh?@W&@HhfO&@0Y?f?W2@@( @1 I4@@@)K?e@@@@@@@@(Mg?I4@@@@@@?gI4@@@@@@@@6?2@@@@@@@@@@@@)K?O&@@@@@@@@@6K? ?3@@@@1? ?O2@@@@@@Hf?O&@@(M? V4@)K?h?V'@@@6Xg?@L?
?W&@@?heO2@<hW&@@0Y @@ I4@@@@@@@@@@@@@@ ?I4@@@@@@@@@@@@@@@@@@@@@@@(Me?I4@@@@@@@6K ?N@@@@@? ?O2@@@@@@@@?e?O2@@@0Y I'@@6KhV'@@@)X?fJ@)X?7@@@?h'@@@5?g?W&@0M @@ I@?4@@@@@@@@)K I4@@@@@@@@@@@@@@@@@@@(Y?heI4@@@@@6K? @@(M ?O2@(Mf@@@@@@@@@@0M ?V'@@@6Xg?V'@@@)Xe?W&@@1J@@@@?hV4@0Y?gO&@?h?'@6X? ?I4@@@@@@6K? I4@@@@@@@@@@@@@@@@(Y I4@@@@@@@@@? @(Y? O2@@@(Y?f@@@@@0M? V4@@@1hV4@@@)K?O&@@@@L?
?W&@e@@@@ ?@@@@?h?V4@)? I4@@@@@@6Ke?O2@6K ?I4@@0Y? ?I4@@@@@@?eO2@@6KO@K?f(Y ?W2@@@@@@@@@@He?W2@@(M? ?@@6X? ?@@@L?h?I'@@@@@@@@@)XW&@5e3@@@ ?@@@5? I4@@@@@@@@@@@@@@@@@@@@6K ?I4@@@@@@@@@@@@@@@ W&@@@@@@@@@@@?eO&@@0Y ?@@@,? ?3@@1?heV'@@@@e?@@)X?7@(YeV4@@ I(Y? ?@g@? I4@@@@@@@@@@@@@@@@@6K? ?I@M &@@0MI'@@@@@@@@@@(M? ?W&K?@@(Y? ?V'@@Lhe?V'@@@e?3@@)X
?J@@H? @? I4@@@@@@@@@@@@@@6K W2@? ?W2@hV'@@@@@@@@0Y W.e?7@@@@@H V'@)X?heV'@5e?V'@@)X??7@5 ?@@? ?@@? ?)X? ?I4@@@@@@@@6K? 7@@? W&@Hh?V4@@@@@0M .YeJ@@@@@@? ?V'@1?he?V+YfN@@@)XJ@@H ?@@? @K ?@@? ?@)? ?I4@@@@@@@@@6Kg@@@Le?W2@@? ?O&@@? @@0M N@@? ?@@@@)X?
?W&@@?h?@g?@@? @@@? I4@@@@@@@@@@@@@@@@@)K?O&@@@?fO26K ?O2@@@@?eW26X ?O@K ?3@? ?3@@@@)X?7@@@? @? I4@@@@@@@@@@@@@@@@@@6?2@@@@@@@@@6KO26K?O2@@@6?2@@@@@@@@@@?e7@@, W&KO2@@@@@@@ ?N@Lhf@?f?V'@@@@)K??@@@@@@? I4@@@@@@@@@@@@@@@@@@@@@@@@@@@@@@@@@@@@@@@@@@@@@@@@@?@@0Y 7@@@@@@@@@@5 ?@K? 31hf@?gN@?I'@@@?@@@@@@= ?'@? ?I4@@0M?eI4@@@0M? @Me@@?I4@0Y ?@@@@@@6X? N@hf@?g?@eV4@@?3@@eI4@? ?V'? ?)X? ?W-Xh@5 J@@@@@@@1? ?3@6X? ?3L?eI'@6X??N@@ ?@1? ?@ @?hW2@@ ?*@)h(Y 7@@@@@@@@L ?N@@1? ?N1?e?V'@)X3@L? ?@@? ?@ &0M?gW-X? ?N@H @@@@@@@@@1 3@@Lh?/K?g3LfV'@)X?N@1? W2@? W& 7@1?he?)X?e?W&? ?@e?J@? ?W2@6Xg?J@@@@@@@@@@ N@@@h?N@@(?fV/f?N@@1??3@Lf?W&K *@@? 7@h)Xhf@?he?@ @@@?he?@)?e?7@? /Xg?7@? ?7(?'1gW&@X?@@@@@@@ ?@@Hhe@0Y?hf@@@L?N@1f?*@@@?hf'@ V4@? W&g@5h3)X?he@?g?@ 3@5?e@?hf?3@L N)X?f?@@? J@H?V'g&@@)X@@@@@@@L? ?@@? @@@)X?3@L?e?V4@@?hfV' '@@? 7@L?f@HhN@)X ?@ V+Y?e@?hf?V4@hW& ?W2@f?@1? ?O&@he?I'@@@@@@@@@)X ?@@L @@@@)XN@1? V4@? ?W2@h@@1?f@?h?@@)X? ?W2@ 75 @? ?7@5f?@@? ?@@@@@L?he?@@@@@@@@@@1 ?@@1 I'@)X??@@? ?*@5h@@@? J@@@)Xg@6X? ?7@@ (Yf)X @?hf?W2@ ?@(Y ?/X?f?3@@@@)Xhe7@@@(?'@@@@@ ?@@@L? ?@f?V'@)X?@@?he@@ ?@ ?V+Yhe@@6Xe?@6Xg7@@@@)X?f3@1?g?@@@fJ@@5h)X 31 ?@@?f@@6Xhe?7@5 ?(Y? ?V/?f?N@@@@@(eO)X?e?J@@@@H?N@@@@5 J@@@)X N@@1?@@? ?@ @@@,e?@@1g@?I'@@1?fV'@?g?@@5e?W&@@Hh@1 N@ ?@@Lf@@@1he?@0Y @@@@(Y?'@@)Xe?7@@@5e?@@@@Hhf?W&@@@@) ?@@@L?J@5?fW& ?@ ?@@@ ?J@@(Ye?@@@g@??N@@@?f?V'?g?@@He?7@@@??O26X??J@5h?W.? ?@ ?3@1f@@@@ ?J@@@@H??V'@@)K??@@@(Ye?@@@@?hfW&@@@@@H ?/X?he?3@@1?
?W&@H?f*@ ?/X?f?3@@he@@fO&@@H?eJ@@@@6X??J@?e@@@? ?@@?e?3@?e@@@@,??7@HhW&H?f@@f?@g?@ ?N@@L??J@@@@L? /X W&@@@@fV'@@@@@@@@H?W2@@@@@Lhe?O&@@@@@@L ?N)Xhe?N@@@LO&@5gV' ?N)Xf?V4@he@@e@@@@@5f7@@@@@1??7@Le3@@? ?@@?e?V'?e3@@(Y??@@?h7@f?J@@ @@1??'@@@@)X V/f@? ?W&@@@@@L?e?V'@@@@@@@?O&@@@@@@1he@@@@@@@@@)X? @)X?he3@@1
O2@@0Y ?@ ?W26X?f31hf?'6Xg3@@@@Hf@Me?I@??3@1eN@@LhW2@?e?@@?hV40Ye?@@?h@@fO&@@ 3@5??V'@@@@, ?7@@@@@@)XfV'@@@@@@@@@@@@@@@@he3@@@@@@@@@)X ?I/?heV'@@O2@@0M ?&@@)XfV'hf?V')K?fV'@@@?hf?N@@e?3@1h7@@?e?@@? ?@@?h@@e?@@@@5 V+Y?eV4@@0Y ?3@@e?@@1f?V'@@@@@@@@@@@@@@@L?hV'@@@@@@@@@)K? @@@(e?V4@@6X?
O2@@(M @@ @1 N@@@6Ke?V'@@LgW&K?f3@L??V'@L?g3@5?e?@5? ?@@LeW2@?e@@L??@@@@Hf?O2@ @( O2@??N@@e?@@@gN@@(MI'@@@@@@@@@1?h?V'@@@@@@@@@@6K? @@(Yf?I4@)X?@@@@(Y? @@ ?@@@@@@?eV'@)K?e?O&@@@6XeN@1?eV'1?gV+Y?e?(Y?hW2@@e?@@1e7@@?e@@1??@@@5?eW2@@@@ (Y ?@@@H?e3@e?@@5g?@@?e?@@@@@@@@@@LheV4@@@@@@@@@@@@6K 3@H?g?I')X??@@@@Hh?W2@ ?@6X ?@@@h3@ ?@@@@@@@@Le?V'@@@@@@@@@@@@)X?J@@?e?N@L ?@@?e7@@5e?@@@e@@@Le@@@??3@@H?e7@@@@@ @? ?@@5fN@@@@@@?gJ@@)KO&@@@(M?I'@@)X?heI'@@@@@@@@@@@@@@ ?@heN@1??3@@@?h?&@@he?@@? I/ ?3@5hN@g@KheJ@@(M??I4@fV4@@@@@@(MI4@@)?&@@Lf@)K? ?@@?e@@0Ye?3@@L?@@@)K?@@@?e@@f@@@@@@fW2@?gW2@@ @? ?@@@@@(Yf?@(?'@@)X?f@@@@@@@@@@H?eN@@@)Xhe?V'@@@@@@@@@(M 7@he?3@L?N@@@? ?V+YhJ@g@@6Kh'@(Yhf?I4@@0Y?eI'@@@@@,f3@@@@6X?hf?@@?h?N@@)T@@@@@@@@@??'@@f@0M?f?W&@@?f?O&@@H O2@@@@e?N@@@@H?f?@H?V'@@1?fN@@@@@@@@@L?e?@@@@1hfV'@@@@@@@@ @@L?h?N@1@@@? 7@g@@@@@@@@fV'Y? ?V'@@@0YfV'@@@@1? 3@@@UI4@@@@@5??V'@L?heW&@@5?e@@@@@@@?f@@ @? O2@@@@@@L?e@@@@gJ@e?N@@@Lf?@@@@@@@@@)Ke?@@@@@hf?V'@@@@@@@1? 3@1?he3@@@@? ?J@@f?J@@@@@(M? @?he?@K?eV40Mg?V4@@@@? N@@@)X?I4@@@H?eN@1?h?O&@@(Y?e@@@@@@@?e?J@@ @? ?@@@@@@@@@?I/?e@@@@L?e?O&@f3@@1f?@@@@@e?I'@@@@@@@@@ V'@@@@@@@L V'@?heN@@@5?)X ?7@5f?7@(Y@@Hg@?h@?e?@g?@@@ )Xf?@@@@1e?I4@fJ@@?g?W2@@@(Yf?I'@@@@?e?7@@f@@@6K? ?@@@@@@@@5g@@@@)X?W2@@@fN@@@f?@@@@5fN@@@@@@@@@L?hf?V'@@@@@@@ ?N@Lhe?3L?@@H?@) @?hf?@@Hf?@0Y?@@? @?he?3@@ @Kg?@@@f@1f?@@@@@L?h7@@?gO&@@@0Y?gV4@@@?e?3@@fN@@@@6X? ?@?I4@@@@Hg@@@@@,?*@@@@f?@@@@@e?3@@@Hf?3@@@@@@@@)K V'@@@@@H 3)X?h?N)X@@L? )Xf?@@Lh?@@L ?V'@L? @@@@f?3@@f@@L?e?@@@@@@?h@@@?fW2@@ ?@@?e?V4@fJ@@@@@1?e?@@@@@@? @?h?@e?I'@@?f@@@@@@(Y?N@@@@f?@@@@@e?V'@@?f?N@@@@@@@@@@@6X?he?N@@@@@?g)XheV'1?he3)X?@@1? @)X?e?3@)X?g?@@)X? V4@?fW2@? 3@@@L?e?N@@L?e3@1?e?3@@0Mhe@@@@6K?O&@@@g?W26X?e?@@@@?g?W&@@@@@@Le?3@@@@5? @6X?e@Lh?@fN@@?f@@?I40Y?e@@@@f?@@@@@fN@@?g@@@@@@@@@@@@1?hf3@@@@?@6X?e3)K?h?N@?heN@1?@@@? ?@@@he@@1?e?V'@1?g?@@@)Kh@? *@5? V'@@)Xf3@@?eN@@?e?V+Mhf@@@@@@@@@@@@e?@e?7@@1?e?@@@@Lg?7@@@@@@@1e?V'@@0Y? '@ 3@)Ke@1e?@he?3@?f@5h@@@@f?@@?@@f?@@?g@@@@@@@@@@@@@?hfV'@@@?@@)?eN@@@he3@6Xh?3@L@@@? @@hJ@@@he@@@?fV4@?g?3@@@@@@g@?h'@6X V+Y?eW2@@@@@?f?V'@@)X?eN@H?e?@@@@? 3@@@@@@@(Mf?@e?@@@5?e?3@@@)K?f?3@@(?'@@@fV+M? V'fW26X N@@@@@@@e?@L?h?N@?f@Hh@@@@f?3@@@@L?eJ@@Lg3@@@@@@@@@@@@?hf?N@@@?@@H?e?3@@L?hN@@,h?N@1@@@? 3@h@0M?fO)X??J@@@@@?hf?V'@@@@@ V4@1 ?W&@@@@@@?gV'@@1?e?3L? N@@@@@@(Y?h?@@@H?e?N@@@V'@@@e?N@@H?N@@5he?W-Xhe?@@@ @@@@f?)X?e)X 7@@)X?f)X J@@@@@@@e?3)Xh?J@?f@?h@@@@f?N@@@@1?e'@@)X?fN@@@@(M?e@@@@6Xhf@@@@@@f?V'@1?h?@0Yhe@@L?@@@? ?@@? N@ W2@@1?W&@@@@@? V'@@@@ I@ ?*@@@@@@@?g?N@@@Le?N)XheW&K?eO2@@f?@@@@@@HheJ@@@g3@@?V4@@f@@e?@0Yhe?*@)X?h?@@@ 3@@@fJ@1?e@)X? @@@@1?f@)X?h'@@@6?&@@@@@@5e?N@1f)Xe?7@Lf@? 3@@@5?eV'@@)Xf?@@@@?f@@@@@)X?he3@@@@@gN@@? @@1?@@@? ?@ 7@@@5?7@@@@@5? ?N@@ W2@?g?V4@@@@@@@6Xg3@@1f@1h?W&@@@@@@@@@f?@@@@@@?h?W&@@5gN@@?g?J@@ ?N@@1?e)Xf?@@@ ?@@5f7@@?e@@1?fW2@6X?f@@@@@Lf@@)KhV4@@@@@@@@@@@Hf@@f@1eJ@@1 N@@0Y?e?N@@@)K?e?@@@@1f@@@@@@)XheV'@@@@g?3@L @@@?@@@? 3@@(Y?@@@@@(Y?h?@@?f@@ 7@@? I'@1gV4@@f@@L?g?7@@@@@@?I4@fJ@@@0Mhe?7@@(Yg?@@?g?'@@ @@@?e@)X?e?@@@ ?O&@@Hf@@@?e3@@?f*@@@)Xf3@@@@1f@@@@@? I'@@@Lf3@e?J@@?O&@@@L? J@h@M?I'6?2@(MI'@L?e@@@@@@@)X?h?V'@@@g?N@)X? @@@?@@@? ?W&? V'@He@@@@0Yhe?@@Lf@@f?@6X @@5?f@?h?V'@ @@1?g?@@@@@@@h7@ ?@@(Y?g?@@Lg?V4@h@6X?g@@5?e@@)?e?@@@f@??W26X?g?O2@@@5?e@@@@@?eV4@?fV4@@@)X?eN@@@@@f@@@@5?e)Xhe?N@@@)X?eV'e?7@@@@@@@@)X 7@L?heN@@@@HeV')Xe3@@@@@@@1?heN@@5h3@)X 3@@?@@@? ?&@? ?@ ?V'? ?3@1f@@f?@@) W2@@@@H? ?@ @@@?h?I'@@5g?J@@ ?@(Yh?@@1 3@)Kg@0Y?h?@@@g?7@@)Xg@@@@@(Y?e@@@@@? @@1?e?@@@@@f@@@@H?e31hf@@@@)XgJ@@@@@@@@@@)?2@? 3@)Khe?@@@@Le?V4)eN@@@@@@@@Lhe?3@?hV'@)X? N@@L@@@? ?@ W&K?e?V'@f3@he?@@@6Khe7@@@@@ ?O&@L?hf@@@?heN@@Hg?7@@h?@@?e?@H?h?3@@he?W2@f?@@@@@ ?@@@g?3@@@1g@MI40Yg?I@? @@5?e?@@@@@f3@@@fN@L?eW-X?e?J@@@@@1f?W&@@@@@@@@@@@@@@??O2@6Kh?@eV'@@@@@?gJ@@@@@h?3@@@@@@@)X?h?N@1h?N@@)X J@@1@@@? *@@@fV'fV'he?@@@@@6Xh@M ?@@@@@@@,??'@@@6X?e?J@@@?he?@@?g?@@@h?@@Le?@L?e?@6Xe?V4@he?7@@f7@@@@@ ?V4@@@L? @@H?eJ@@(M?fN@@@L?e?@1?e*@)XeW&@@@@@@L?e?7@0MI40M?fI4@@@@@@@@@6K?h?V'@@@@?g7@@@@Hh?N@@@@@@@@)Xhe3@he3@@1 @@@@@@@? @@@? V'@@L? ?@M??I4)X? W2@@fI4@@@(Y??V4@@@)Xe?7@?hfJ@@?g?@@@h?@@1e?@1?e?@@1 ?@@@f@@@@@@h?'6K ?I'@)K ?@6Ke@5f7@@Hg?@@@,?eJ@5?eV'@)KO&@@@e?@1?e?@ I'@@@@@@?I'6X?hV4@@@?f?J@@@@5?he3@@@@?I'@)X?hN@@@6XgV4@@h)XhN@@@@@@? 3@@? ?V4@@? ?B)X 7@@@g?I(YgI'@1e?@@?hf7@@? ?@@@e?3@?eJ@@@ ?@@@@@@@@@@0M?h?V'@6K V'@@6X ?W2@@6X?e?@@@@@(Yf@@@?hI(Y?e'@H?e?N@@@@@@@@e?@@?e?@ ?N@@@@@@eV'1?he?@5?fW&@@@@H?e?@6XfN@@@@??N@@1?h?3@@@1 @1h?@@@@@5? W2@@fN@5? 31 @@@@L? ?N@@he?O@?f@@@?eW2@?g@6X?e?@@5e?N@@6?&@@5h)XeW2@??@@@@@@@@(M?hfV'@@6K ?N@@@1f?@@(hO&@@@@,?e?@@@@(Y?e?J@@5? V'g3@@@@@@@h?@ @(M?f?V'Lhe?(Y?f&@@@@@f?@@)X?e?@@@@?e@@@?h?V'@@@ @@h?@@@@@H? &@@@L?e?(Y? ?)X? ?@@@hV'e?W.?hf@@@@)Xg@6K?g@@h@@@@@?h?W&@5?g3@)Xe?@@Hf@@@@@@@Hh@,e7@@?eI4@@@@(Yg?W2@6Xe?N@@@@@?f?@K?f?J@@@@f?@0Yf?'@@@@@@@0Y?eJ@@@(Yf?@@0Y? N@@@@0M?hJ@L?gO2@6K??J(YhN)X?e?/K? @@L?e?3@@)XeJ@@@@?@@@@@LheV'@@L? 3@h?@@@@@ ?I'@)X ?31? I@hf?.Y?hf@@eI/g3@@@@@(?e@@L?g3@@@@?hW&@(Y?gN@@)X??@5?f@@@@@@5?fO2@@(Ye3@@?f?@@@h?*@@@)X?e3@@@@?f?3@@(?e?7@@@5hf?V4@@@@@f?W&@@(Y? W-X?e?@(Mg?W&K?O&@)Kf?@@@@@@6?&H?h?3)Xe?N@@ @@,?e?V4@@)KO&@@@@?N@@@@)X?h?N@@1? N@L?g?@@5
?J@@L? ?@ N@@1hf?W26X?e?V'? @@heV4@@@0Y?e3@1?gV'@@@Lg?W&@@He?W2@e?3@@)K?@H?f@@@@@0Y?e?'@@@@H?eN@@?f?@@@1?g?V'@@@1?eV'@@@Lf?V40Y?eJ@@@@? I'@5f?*@@@H *@)Xe?@H?g?7@@@@@@@@@?e?@@@@@@@@@L?e?)X?e?V4)f@@he?@@@@(Y?gI4@@(Mf?@@@@@)Xhe3@@L ?@@?g?@@H?7@@1?f@6K? J@@5hf?7@@1? @@ N@@?g?V'@@)X?f?7@@@?e?7@@e?V'@@@@5f?J@@(Mg?V4@@@f?@@LfJ@@@@?hN@@@@?e?V'@@1hf7@@@@1 ?V+Yf?V'@@L O@g@?eN@@)?@@@L?g?3@@@@@@@@5?e?3@@(?4@@@1?e?@1? ?@@@0YheI(Y?f?@@@@@@)X?hV'@1 ?@H?g?@@??@@@@?f3@@@@@ ?W&@(Yf@@@@(?e?@@@5? @@L? ?@@?hN@@@)Xf?3@@5?e?3@@fV'@@@Hf?7@@H? ?@@)X??O&@(Me?W2@f?3@@@?fN@@@hf@@eI@fW2@@@@ V4@)K?hO2@@@@@@he?@@H?N@@)Kg?V40M?e?@H?e?N@@H?e@@@?e?@@? ?W2@f?@(M ?@@@@@@@)Xh?V'@ ?@h?@@?J@@@5?fV40?4@hf?W-X W&@(Y?f@@@0Y?eJ@@(Y? ?@ @?hf@@)K ?@@@@)X?e?V40Y?e?V'@f?N@@5?f?@@@ ?@@@)?2@@(Y?e?7@5f?V4@@?f?@@@@@@(g@@@5g?O&@(MheW-X?gI'@@@?f?@@@@@@@@5he?@5?e@@@@@@6Xhe?@g@@L?e3@5?eJ@@@6Xhf?7@5fJ@H? ?3@@@@@@@)X?hV'@6K?hfJ@hJ@@?7@@@H? ?&@) ?W&@@Hg@(M?f7@(Y @6X?e?@L? ?@6Xg@@@@6X ?I'@)XhfV'g3@ ?@@@@@@@@Hf?@@H ?@@@@@(Yf?J@@(Yf@@@@@@H?g/Xe7@)Kg?N@@@Lf?@(MI4@@0Yhe?@H?e3@@@@@@1 @@,?eN@H?e7@@@@)X?he?@(Yf7@ ?V4@@@@@@@)Xh?V'@@6X?h?W&@L?g7@@?@@@5 ?7@@@?g@Hg@0Y? @@)?e?@,? ?@@1hI4@)h?@hf?@@?gN@@1 V4)X ?@@@fW2@@@@@@@@@@@?fJ@@? ?@@@@0Y?fW&@@H?f@@@@@@hV/?J@@@@@@g@@@1f?(Y? ?@fN@@@@@@@L? ?J@(Y?eJ@e?J@@@@@@1?h?@@@H?f3@L? ?I'@@)X?hV'@@)XhW&@@1?g@@5?
?J@@(Y ?@@@@Lg@L ?(Y? ?3@@eO2@? ?3@?g?@@@ I/ ?O&@@@@@(Me@@@Lf7@@? I@M?f?O&@@@f?J@@@@@5he?7@@@@@@g3@@@ @?f?@f?@@?I'@@1? ?7@Hf7@e?7@(?'@@@Lh?3@@L?fN@)K N@@@)Xh?V'@@)X?g*@@@5?g@@H??7@@H? ?@@?e?@@@@1g3)K? ?V4@@@@@@? ?V'?g?@M? @@h?W2@@@@@@(Y?e3@@1e?J@@@@@@h@?he?O2@@@@@f?7@@@@0Y?@@@g?3@(M?@@L?f?@@@L? @?he?@@??N@@5?g@@@@f?@5?f@@e?3@H?V'@@)K?g?V'@1?fJ@@@6Khe@@ ?@@@@1heV'@@)XgV'@@H?g@@?@@@ I@gV4@@@? @@@@h?I'@@@5?f)X '@@6X?hf@6X?e@@L?g?7@@@@@@@?fV4@@e?7@@?I'@L? ?O2@@@@@@@f?@@?f?N@@h@He3@1?f7@@@,?h@6X? ?@@?e@(Y?f?J@@@@fJ(Y?h?N@?eV4@@@6K?gV'@?e?W&@@@@@@@@@6Xhf?W26X?e?@@@@@he?V'@@1g?N@@g?J@@?@@5 I4@? ?W2@g@@@@heV4@0Y?f@)X?eW& V4@@1?hf@@)Xe@@1?g?@0M?I'@@)X?h?@@@eN@)KhfO2@@@@@0?@MI4@f?@@?g@@g?7@?eV4@?e?J@@@0Y?h@@1? ?@@?e(YgO&@@@5e?W.Yhf@?fI4@@@@@?f?N@?e?7@@(?4@@@@@@1hfW&@@1?e?3@@@@@@heV'@@L?f?J@@L?f?7@@?@@HfW26K ?7@@g@(M?g@?hf3@)Xe&@hW-X?f'@6X I4@?fW&g@@@1e@@@?hfV'@@)Xh?@@@e?@@@6XhW2@@(M ?@@? ?@@?h?7@@X?he@@@L ?@@?h@@@@@@0YeW&H?hf@Lg?I'@@?g@?e?@@@H?e@@@@@@he?O&@@@@?e?N@@@@@@L?h?V'@)KO2@6?&@@1?f?@@@J@@?f7@@@(? ?@he?3@@g(Y ?@@1he?W&@,?fV'@)X?hf@@hf7@g@@@5 ?N@@@)X?g?@@@e?@@@@)h*@@@H? ?@@?hf?@@@@?h?@@V/?gW2@@@@@@f?@@@ @@@@0Me?W&@ @1hN@@?he?@@5f3@(?'@hW2@(M?h@@@@@@1?heV'@@@@@@@@@@@?f?@@@7@@?f@@@0Y? @@ ?@he?N@@ 7@@5heW&@(Y?f?V'@)Xf@Kg@@hf@@L?e?J@@(Y 3@@@)Xhe?'@@@@@HhV'@@L? '@6Xf?@@@@?hJ@@?h7@@@h?@@@ @@(Mf?7@@ @@L?gJ@@@@6X?g?@@HfN@H?V'L?g&@0Yhe@@@@@@@Lhe?V'@@@@@eI'@Lf?@@@@@@? @Kg?W2@ @@ 3@(Yh?W&@(YhN@@1f@@@6X? @@@?e?@@0Y? @@fV4@@@,he?V'@@@@?h?V'@1?eW26X V4@)X?f?@@?h7@5?h3@@@ ?O.?he@(Y?f?@@5fW2@6K?f@@1?g7@@@@@)?g?@@?f?@e?N)X @@@@@@@1hfN@@@@@e?V'1f?3@@
?J@@5? @@@6K?eO&@@ ?@@? W2@? V+Y?hW&@0Y?h?3@@L?e?I4@)X @@L?fI40Yf?W2@fV'@@@LheV4@?e7@@1 I')Kf?3@?h3@H?hN@@@ ?'@@@@H?h?J@Hg?@@?f&@@@@@f@@@Lg@MhfJ@@?fJ@f@)X? @@@@(Y@@hf?3@@@@fV'f?N@@L??7@@H? ?@@? ?@@@@@@@@@ 7@@? 7(M?he?V'@1?gI/K? @?e?J@@@?hf?7@@f?V'@@, 3@@@f@@h@@e?V'@@?e?V'?f@@eV'he?@@@ ?V4@@@heO&5?g?3@1 @@@@ ?W&@@Lf7@f3@)Xf@?hf@@@0Y?3@@@he?N@@@@hf3@1??@@@ ?3@@@(M? ?@K? 3@@? @H V'@?g?V4@ ?7@@H?hf?3@5gV40Ye?@6KheV+M?f@@ N@@L ?@@5 @@L?g?'@(Y?g?V4@ O2@??7@@@)X??J@@fN@@)X?he?@@@@@0MfN@@@hf3@@5hfN@@??@@@ O26Xh@@(Y ?@@6X? @?fV4@? ?'@@g@? ?V4@@? @? ?@he?@@5 ?V+Yhf?N@@6X @@f@?hJ@@1 ?@0Y 3@1?g?V+Y O2@@@@5??3@@@@1??@@@f?@@@)Xe?)X? ?3@@hfN@@Hhf?3@??@@@ ?@@@@@@@@1gO&@(Y? ?3@@)X ?V4@ ?I@? ?@0Y @@@)X? @Lg?O&@@@ ?O26K?he?@6KheN@@L W-X? W2(M?I40Y?e@@@@5?h?@@@@)K??@1? ?N@@hf?@@?hf?N@L?@@@L? ?3@@@@0MI@f@@@@0Y ?N@@@1 ?@heW& @@@@)? @)K?e?W2@@@@@ ?@@@@@@@@@h?3@@6?26X?f?@@,fO@h*@)XhW&K? ?W&(Y?g?7@@@0Y?hJ@@@@@@@@@5? @@hf?@5? @@?@@@)K ?V40M? 3@@@ W2@? J@L?h7@L? @@@@@?f?J@@@@H? 3@@@e?7@@?I4@ I4@@@@@5h?V'@@@@@)XfJ@0YeW2@5hV'@,h7@@6X? O&@HhJ@(Mf?O26X??W&@e?I4@@0Y? ?J@5hf?@he@?e?J@H?@@@@@@? V4@@ ?@he7@5? 7@)Kh@@)K?O26X? ?W.?hf@@@@@?fO&@@@@f?W2@ N@@@eJ@@@L?fW2@?e?@@6X?h@@@HheV4@@@@@)K?e.Mf&@0Yh?V+Yh@@@@1?hf?@@@@?h7@H?e?W2@@@)??&@@ O&@?hf?@)Kh@?e?7@LJ@@? '@(? )X @(Y? @6X?g@@@@@6X?f@@@@@@@@1? W&H? ?@@@@(M?f?7@@L?f?@@?f?3@5e7@@@1?f7@@?e?3@@1?h@@@? I4@@@@ ?I4@@? ?J@5f?*@@@@H? ?O2@@@@1hf?@@@6Xg@Le?@@1
?W&@5? V+Y? @)h?@@?g)Xg@H @@)Ke?O2@@@@@@@)Xe?J@@@@@@@@5?e?@@?he&@ ?@@@0Yg?@@@1?f?@@?f?V+Ye3@@@@?f3@@?e?V'@@?h@@5? I@M? @? ?W2@@?h'@f?7@Hf?V'@@@ @@@@@@@@L?he?3@@@1g31e?@@@W&@@H? @@@6KO2@@Hh?@@?g@)X?f@? @@@@6?2@@@@@@@@@@1e?@@@@@@@@@H?e?3@? @K ?@@@@L V+M?gV4@?fN@@Lh@(Y? @? ?7@?heV'fJ@5?gV4@@fW&K?fW.e?'@@@?g@@@(M?I4@?he?N@@@@gN@e?3@@
?W&@@@ O2@? @@6X ?@@@@@@L 3@)Xh?@@?e?@6Xe?J@@@@@@(M?I'@@@@@@5e?N@@@@(?'@f?N@?e?W-XfO)X?f3@@6X? ?@(??3@@@1 ?@@1g@@(Y ?@5? ?W&@H?hI@f*@@@e?W.Ye?V'@@?f?J@@@? @@@@gJ5e?N@@?7@@@@ @@@@@? 3@@1 )X ?@@@0?')X? N@@1f@?e?3@Le?@@)K?O&@@@@@@fN@@@@@@Hf3@@(Y?N@L?f@@6KO&@)K?O2@@)XfN@@@1?g)Xhe?(Y??V4@@@ ?@@@g@@H? ?(Y?f?@@?gW&@@ V'@He?.Y?fN@@?fW&@@@1 ?J@@@@g.Yf@@L?J@(M 3@@@@? V'@@ @)h?@ N@)K ?@@@e?J@?e?N@1e?@@@@@@@@(?'@@)Ke?@@@@@5?fN@@He?@)Kf@@@@@@@@@@@@@@@)X?e?3@@5?f?J@)X? ?@@@@? ?@@@g@@ ?@(? @? ?@@?g7@@5 ?V'?he?@@?f7@@@@@L? ?7@@@@hf@@1?7@H? V40Mf?W26X?g?V4@ ?@@@@?h@@f?@@5e?7@?f@@e?@@@@@@@(Y?N@@@@@??3@@@(Y?f?@@?e?@@@6Xe@@@@@@@@@@@@@@@@)Xe?N@@H?f?7@@1? ?3@@@?e@@h@@6Xhe?@@@g3@ ?(Y? @?f@? @@(Y ?@@?f@(?4@@)X ?@@@@5hf@@@?
?J@5 W&@@1? I4@? ?@(Ye?@@?f@@@@@@@@@@@(Y?e@@@@5??N@@@Hg?@@?e?3@@@)K?@@@@@@@(M??I'@@@@1f@@g?@@@@? ?V4@@?e@@h3@@)e?'@6X?e?@@5g?@f@@6X ?'6X @L @0Y? ?'@@@@@?f(YfI/X?hf?@@@(Yg@?f3@@??7@H 7@@@5? W2@? J@H?eJ@@?f3@@@@@@@@@(Yf3@@(Y?e3@5?gJ@@Le?V'@@@@@@@@@@@@HfN@@@@@hfJ@@@@?f?@@@ N@@He?V4@)?e?@0Yg7@f3@@, ?V4) @@ W2@? ?V'@@@5?he?N1?hf?3@@H?g@?fN@@LJ@@? 3@@@H? 7@5? ?O&@f7@@?fV'@@@@@@@@H?f?@@HfV+Y?f?W&@@1fV4@@@@@@@@@@@?fJ@@@@@he?O&@@@@@6Xe?3@@hO)X? ?@@? @@fV40Y @K 7@@?f?W2@ V4@0Y?hf@?hf?N@@h@?f?@@1
?W&@5? V4@@ ?O@?g@(Y? ?O2@@@e?J@@@?f?N@@@@@@@@g7@5?hfW&@@@@gI'@@@@@@@@@?e?W&@@@@@L?h@@@@@@@@@1e?N@@g?@@@)K ?@@@@@@@@? @?g@@6X @@@?f?7@@L?h?@ @@@@hf@@L?hf?@@@L?W&@(Y? @@5?g(Y ?)X? ?O2@@@@@eO&@@@Lf?J(M?I'@@@f?J@(Y?hf7@@@@@g?V'@@@(MI4@?eW&@@@@@@)KhN@@@@@@@@@L?e@@L?f?@@@@@6Xhf?@@@@@@@@? @@@) ?@@? @Mg?@@@1?h?@ @@@@hf@@1?hf?@@@1?7@(Y @?e@(Y? @?he?@)? ?O2@@@@@@@@@@@@@@)K?eO&H?eN@@@L?e?@0Y @@@@@@@6X?fV'@@H?g*@@@@@@@@@@@@@f?3@@e?I'@1?e3@1?f?@@@@@@)K?he?@@@@@0M ?@@L I4@?'@@?f?@ ?W2@@@@5hf@@@?hf?@@@@L
?J@0Y? @? @@0Y @? ?O2@@@@@@@@@@@@@@@@@@@@@@@fJ@@@1?hf@6X?f@@@@@@@@1?f?V'@L?gV4@0M??I4@@@@@f?V'@fN@@LeN@@?f?@@@(?4@@6?2@@@@f?@@@hf?W2@f?'@@g?O2(he?@ ?@e?@6Xf?3@1 V4@? ?@f?*@@@@@Hhf@@@?hf?@@@@1W&<? @?e?W2@@@@@(M?@@@@??I'@@@@?he7@@@@?he?J@@1?f@@@@@@@@@?gN@1? ?I4@@@gV'f?@@1e?3@@6KO2@@@@H??I4@@@@@@@fJ@@5hf?*@@L?e?V4@f?'@@(Y ?@@)X?e?V'@ ?@@? ?@f?V4@@@5?hf@@@?hf?@@@@@L?
?W&5 ?@ ?7@@@@@@H??@@@5?eN@@@5?h?J@@@@@LheW&@@@?e?J@?f?I@?gJ@@? ?@@@e?V'@@@@@@@@@L?e?I'@@@@5f7@@Hhf?N@@1?he?V40Y? ?3@@1?fV'L?hf?@@? @? ?@g?I'@H?hf@@@? ?I'@)XW&(Y ?@@@@@@@L??@@@f?@@@heW&@@@@@1h?O&@@@@?eW&@? 7@@L ?@@@fN@@@@@@@@@1?fN@@@(Yf@@5? @@@L '@6X ?V'@@Lf?V/? @? ?@hV' @@@? V'@1
?W&(Y? ?O@?he?@@@@6X? J@@@@@@@)K?@@@1?e?3@@1?g?O&@0M?I4@=?fO2@@@@@@@??O&@@? @@@)K? ?@ ?@@@@@(MI'@?f?@@0Y?f@0Y? 3@@, V'@)X? V4@@ W-X?hf?@L? @@5?g@?h?N@@W&@H ?@@@@?hfI4@@)K 7@@@@@@@@@@@@@@Le?V'@@Lg@@@?f?B@6?2@@(R'@@@@@@@@@@@@= @@@@@@@@@@ ?@L? @@@@@@@@H??N@@6K ?@@?gV40Y ?V'@1? 7@1?hf?@)Kg?@ @@H?g@?he@@
?W&@5? W2@? ?@M? ?I4@@6K? ?J@@@@@@@(?'@@@@@1fN@@1gN@5?g3@@@@(Y?V'@@@@@@(MeB@@@@@@@6Xg?I4@@@@@@5 J@)K @@@@@@@5f@@@@6X ?@@? V4@? ?@@? @@@?hf?@@@6K @@h@?he@@?7@@H? ?'6Xf@@@(e7@5? @@@@ W&@@@@@@(Y?N@@@@@@f?3@@g?(Y?gN@@@@He?N@@@@@@H?e?@@@@@@@@1heI4@@(Ye?W2@@@@6K??W&@@@@@@6K?heI'@@@Hf@@@@@1 ?@@@ ?N@? @@@? ?I'@@6K? @@h@?he@@?@@5 ?V'1f@@0Ye@0Y? @?he@@@5 ?O&@@@@@@@f@@@@@@L?e?N@@ J@@@@?f@@@@@@fJ@@@@@@@@@hfI(Y?e?7@@@@@@@6?&@@@@@@@@@@@@@@@6X?e?V4@@?f@@@@@@ ?@@@hf?@@? @? @@@?f?@heV4@@@@ ?J@@ @@L??@@H V' ?@ 3@(Y @@@@@@@@@@@@)X?J@@@@@@)Xe?J@@ 7@@@@?f@@@@@@@6KO&@@@@@@@@@L? ?@@@X?@@@@@@@@@@@?I'@@@@@@@@1?hf?I40M? @? I4@@ ?7@5 3@1?J@@? V+Y? @@@@@@@@@@@@@)?&@@(?'@@1e?7@5 ?J@@@@@Le?J(MI4@0?4@@@@@?e?I'@1? J@@@)X@@@0M??I'@@??N@@@@@@@@@L ?@@? @6X?hf@?f@@ ?W2( ?@@H N@@?@@@? @@@@@@@@@@@@@@@@@@H?V4@@e?3@? W&@@@@@)K?O&H?gI'@@@?fN@@? ?O&@@@@@@?gN@@?e3@@@@@@@@1 @@)? @@ ?@ W&(Y ?W2@6X J@@? ?@@?N@@? ?@ ?J@@@@@@@@@@@@@@@@@@L?g?N@)X?he?W&@@@@@@@@@@@L?g?N@@@?f?@@Lhf?O2@@@@@@@@?g?@@?eV'@(M?I'@@ ?W2@@(?@@@@? @@ ?@ ?W&(Y? O&@@@)h?@@? 7@@?g@?hf?@@?J@@? ?)X?f?@@@@@@@@@@@@@@@@@@@,?h@@)?2@(?gW&@@@@@@@@@@@@)Xh3@@Lf?3@1he?W2@@@@(MI'@@Lg?3@?e?V+Ye?V4@@@6X ?7@@(Y?@@@@? 3@L? W&(Y ?@@@@<hf?@@? @@@?f?J@?hf?@@?7@@? ?@ @@ ?@1?gI4@@@@@@@@fI'@(Y?h3@@@@0Y?f?W&@@@@@@@@@@0Y@@)K?gN@@1f?N@5heW&@@@@@HeN@@)X?f?N@Lhe?I'@@)K??O2@gW2@@gJ@@0Y? N@)X 7(Y? ?@(? ?3@@5? ?'@?hf?J@@5?f?75?hfJ@@?@@@? @@ ?@@Lh?I'@@@@@f?V+YheV40Mh?*@@@@@@@@@(M??3@@@6K?f?3@@g(Yh?O&@@@@@@?e?3@@1?f?J@1hfV'@@@@@@@5g7@@Hf?W&(M? @@6Kg?3@1 ?@@? (Y ?(Y?eW2@?hf?V40Y?g?W26X?f?V'?hf?7@@H?f?@H?hf7@@?@@@? J@@)K?O)X?fV'@@@@ @??V'@@@@@@@(Ye?N@@@@@6X?e?V'@L?hf?O2@@@@@@@@?e?N@@@Lf?7@@hf?V'@@@@@(Yg@@@?fW&(Y I4@@(?e?V4@ J@5? ?)X? 7@@? ?7@@)X ?@@5g?@ @@@?@@5? ?@6X 7@@@@@@@)?)Xe?N@@@@hfW& @?eN@@(M?I(Y?f@@@@@@1?fV'1?hf@@@@@@@@0Mg3@@1f?@@5 V'@@@(Y?g3@@?f7@H?hf@@@?e?O)XhI(Y? @0Y? ?@)? @@5? ?@@@@)X? ?@@Hg?@ @@@?
?J@(Y? ?@@) @0M?@@@@@@@1f@@@@L?he7@hf?J@?e?@0Yhe@@(?'@@Lf?V'?hf@@@@@?heV'@@f?@(Yg?@@?f?N@@@HhV'@Le?J@@ ?@@?e@@@) @6X? @0Y? ?3@@@@)K J@@?gJ5 @@5?W&@H @?f3@@@@@@@f@@@@)KO2@@@?f@@f@@g?'@L @0Y?V'@1 @@@@5?he?V'@@@@@@(Y?g?3@Lg@@@?h?V'1e?7@@g?@g7@5??J@(M? 3@,? ?V4@@@@@@6X? 7@@?g7H @@H?
?W&@5? N@@@@@@@@@@@@@@@@@@@@@@Lf@5hf?V4)X? ?N@@ ?J@@@(Y?hfV'@@@@(Yh?N@1g@@5?heN@e?3@@L?hf@@H??7@Hf?W&? V+Y? ?W26X?h?I4@1?hf?J@@5?g@?hf?J@5?7@@H? @? ?@@@@@@@@@@@@@@@@@@@@@@)K?e@? ?B)K 3@@6K? ?@@@@H ?N@@@@H?he@@L?f@@H?he?@e?V'@1?hf@@e?@@?f?75? ?&@@1?he?I@?hf?7@@H?g@?hf?7@H?@@@ ?@@@@(M??I'@@@@(MI4@@@@@@@@@@1heW&f@@@? V'@@@@@6K?f'6KO2@?N@@@?e?@@?he3@@@hf@@1?f@5f?@6XheN@@? ?(Y? ?W2@@@ I4@? ?@@5 J@@??@@@ ?W&? ?@@@@?heW& J@@@@HfV4@@(Yf@@@@@@@@@@h?W&@f3@@L ?V'@@@@@@(fV'@@@He3@5?e?3@?heV'@@hf@@@Lf(Yf?@@)he?@@L @6X? ?&0M W2@6X? J@(Y ?W&@5?J@@5 ?&@? ?@@@@?he&@ 7@@@5?gI(Y?f3@@@@@@@@@h?7@@L?eN@@1 V4@0MI(Yf?N@@@?eV+Y?e?V'?he?V'@L?f?@?2@@@@@)X? ?3@1 @?g@@1? W2@( 7@@@1?hf?W&@H? W&@(Y?7@@H @? I'@? ?J@@@@H? V'@@@@@@@@L?g?3@@)Xe?3@@W2@?f@@ 3@@L ?)X?eV4@?f?@@@@@@@@@)K ?V4@ ?I@? 7@(Y @@@@@?hf?7@@ 7@@H@@@? ?V'? ?@@@@@L? ?V'@@@@(?'1?g?V'@@)X??V'@@@@Le?J@5 ?@@1 J@)XhfI@M??I'@@@@@@?hf?O.? @0Y? ?@ ?@@5h@?he?J@@5?@@@? ?@6X ?N@@@@)Xg?W2@gN@@@(Y?V'?hN@@@)XeV4@@@)K?O&(Y ?W&@@@L? ?W&@@1 V'@@@@@Lg?)X?e@@H? ?@ ?@@Hg?J@?he?7@(Y?@@5? ?3@)X? @@@@@)K?fO&@5g?3@@H?hf?@@@@1g@@@@@(Y? ?&@@@@1? O&@@@5 ?N@@@@@)X?f?@)??J@@ ?W2( ?@@?g?7@?he?@@H@@H? ?V4@)? @@@@@@@@@@@@@@(Yg?V'@ ?@@@@@g@@@@@Hf?@@@(? ?I4@@?hfW2@@@@0Y @@@@@@)Kh?7@5 O&0Y ?@ J@@?g?@5?f@?fJ@@?@@ ?J@@@@@@@@@@@@@@H?hV' ?3@@@@@6X?e@@@@@?fJ@@(Y?g?@6X ?W&@ @@@@@@@@6Xg?@0Ye?W26X?heW2(M J@L? 7@@?g?@H?e?J@?f7@@?@@ W&@@@@@?f?@@5 ?N@@@@@@)Ke@@h@@@Hh?N@)K? ?7@@hf?W26X?h?I'@@@@@@1hf?7@@1?he7@H? '@1? /X @@5?gJ@f?7@?f@@5?@@ ?W&@@@@@@?f?@@H @6X??J@@@@@@@@@@@@hN@5?he3@@6K? ?@@@hf?*@@)XheN@@@@@@@L?he?3@@@Lhe@@ V4@? N)X? @@@? @@H?g75f?@5?e?J@@H?@@ ?7@@@@@@@?f?3@L 3@)KO&@@@@@@@@@?@@h?(Y?heV4@@@6K? ?@@@L?he?V4@@)X?hJ@eI'@@1?he?V'@@1f@@f@@ ?)X? ?@h?3)X ?J@@h@Hf?@H?e?7@@@@ ?@@? ?@@??@@@@Lg@)X? V4@@@@@@@?@@@@@?@@L? I4@@@6X? J@@@1?hf?I'@)Xh7@e?V4@@?hfV'@@L?h@@ ?'@(he?@)? ?V4) ?W&? ?7@5h@?fJ@f?@@5@@L? ?@@? ?@@? ?@@??@@@@)K?eO&@@)X I'@@@@@@@@@@@@@@)Xg?W&? ?I'@)Xhf?O&@@@5? V4@)h@@ ?N@@)Xh3@ ?V+Y ?*@? J@(Yh@?f@@f?@@H@@1? ?@@? ?@@?hf?@ ?@@@@@@@@@@@@@@@@@@1 @@@@@@@@@@@@@@@)X?fW&@? N@@)X?he@@@@@0Y? ?@K?e@@L? 3@@1hV' W2@? O2@( ?V'? 7@H? ?@@?@@@? ?3@? ?@@? ?@@? ?@@@@@@@@@@@@@@@@@@@ ?7@@?@@@@@@?eI'@@)Ke?O&@@Lg?@h?3@@)Xhe@0M?hf?'@6X?g?@@@@@@@@? N@@@ ?W&@@?hf?@@@(Y @@h?@hfJ@@?@@@? ?N@? ?@@@@@@@@@@@@@@@@@@5 ?@@@@@@@@@@?e?N@@@@@@@@@@@1 ?N@@@1 ?V4@)?hI4@@0Mhe?@@(h?@@@ ?7@@5?hf?@@(Y?he?W2@ ?O)X ?J@5hJ5hf7@@?3@@? @? @@ ?@(MI'@@@@@@@@?I'@@?g@@@@hf?@@@eI'@@@?f@@@@@@@@@@@@he?W&?e?J@@@@ ?@0Y ?@@?f?3@@H?hf?@0Yhf?7@@ @@@1 ?7@Hh7Hhf@@@??@@? @? ?@H??V4@0MI'@@eN@@1g?@@5hf?@@@e?N@@@?e?J@@@@@0M? ?*@?eW&U? ?W2@ ?@ ?V4@ @@eJ@@5 ?J@@@@ J@5?h@?he?J@@5?@@@? ?'@? ?@L?g?V4@e?3@@L?f7@@Hhf?@@@f@@@LeO&@(M? ?N@L?W&@1? ?&@@ ?/K?he?@ @@0Y ?7@@@@ 7@H?h@?he?7@@H??@@? ?V'? ?@)Khf?V4@)Kf@@5?hf?@@@L?e3@@)?2@@@H @)?&@@5?he?'@@6K ?N@6K? ?@@@ ?@@@@@ @@ J@@57@@? O2@? ?3@@6X @@@@@@@@H?hf?3@@,?eV'@@@@@@@? ?J@@@@@(Y?he?V'@@@@@@? 3@@6X?e'6X? ?3@@ ?@he?@@? @@ ?W&@@H
?J@@5? '6?2@@5? ?N@@@)K?hf3@@@@@@@L?g@@f?N@(Y?e?N@(M?I'@?hf?)X?f?7@@@@0Y V'@@@@@?he?W26X? V4@@)?eV')X ?V4@ ?@@? ?J@@ W&@@5??7@@H? V4@@@0Y? 3@@@@6K?heN@@@(MI4@? (Yg(Ye?V'?hf?@)?f?@@@0M ?N@@@@5?heO&@@)?g?/K? ?V4) ?@6X ?@@? ?7@5 ?O&@@(Y??@@@ @@ N@@@@@@@@6X?g?@@@H? ?@0M @@@@H?h?@@0M?h?N@6X? ?@@) ?3@?e?@@? ?@(Y @@@@(YJ@@@ ?@@@@@@@@@)Kg?@@@L? ?@6Xg/K 3@@5 @@1? ?V'?e?@@? @K J@H? @@@@H?7@@@ ?@@@@@@@@@@@6KfJ@@@1? J@@)X?fN@@@@6K? W2@(hfN@@H ?J@@@? ?W&? ?@@? 3@@@@? @@g?@ ?W&@ @@@@@@@@ ?@@@eI'@@@@@@6K?O&@@@@L 7@@@1?f?@@@@@@6X? ?W&@0Yhf?3@? ?7@@@? @?h?&@? ?@5?g?@6XfV4@@@? @@ ?7@@L? @@@5@@@@ ?3@@e?N@@@@@@@@@@@@@@@@g@@ @@@@@Lf?3@@0?'@)X W&0M ?N@? ?@@@@?eO2@@@@@6K? ?@H?g?3@, @@ ?@@@,?he?@6Xf@@@H3@@@ ?@ ?@ ?V'@L??J@@@@@@@@@@@@@(M? ?'@@@@@@@1f?N@?eN@@1 ?W&< 3=eO2@?hf@?f?@@@@@@@@@@@@@@@@@ ?@h?V+Y ?@@0Y?he?@@,f@@@?N@@@ V')KO&@@@@@@@0MI'@@H @@f?V'@@@@@@@g@?e?@@5 W&@?gW2@?hV'@@@@@?e?@@?g3LfJ@@@@@@@@0?4@@@@@5 @6X?h@? J(M?hf?@0Yf@@@??@@@ ?N@@@@@@(MgN@@? @@gV'@@@0M?he?3@Hf@@g?W&@@Lf?W&@H?h?V'@@@@?e?@@?gV/f7@(M?I40M?eI4@@0Y @@)X ?W&H @@@??@@@ 3@@@@(Y?g?@@? ?V'@h?@6Xe?V'?f@@g?*@@@1f?7@@hfN@@@@Le?@@?hf@(Y? 3@@)K? @@ @? W&@? @@@??@@@ N@@@@Hh?3@?g)X N@h?3@1he3@L?f?V4@@@L?eJ@@@hf?@@@@,e?@@?he?J@H ?@ V4@@@@ @@ 7@@? @@@??3@@ ?@@@@?he@Lg@)X? ?@L?g?N@@heN@1?hI')K?O&@@@f@@hI40Ye?@@?he?'@? ?W&?hfI4@@ ?J@@5?e?/X? @@@??N@@L? ?@@@@LhW&@)K?f@@1? ?@)Kg?J@@@6X?g?3@Lh?V'@@@@@@5e?J@@ J@@?he?V'? O26Xe?75?e?'6X @? ?7@@H?e?V/?h@@@(f3@@?@@1? W& ?3@@@)X?f?O&@@@@6K?e@@@L ?@@@@6K?eO&@@@@)Xg?V'1heV'@@@@@He?7@@hf?W&@5? W-X?hfW2@@@)e?(Y?e?V4) )X ?@ ?@@@ @@(YfN@@?@@@L 7@ ?V'@@@)K?O2@@@@@@@@@@@@@@@@)X? ?@@@@@@@@@@@@@@@@)hN@L?h?V4@@@5?e?3@@hf?7@(Y? 7@1?e?W2@g7@@0M? @@e?J@1 ?@@@ @@H?f?@@?@@@1 @@ @@L? N@@@@@@@(MgI40Me?I'@)K ?@@@(Me@@@(M?hf?@)XhfI(Y?e?N@@hf?@@H ?J@@@?e?7@@L?f@(M? ?@@@@?hW&@@ ?@@? J@@@ @@g?@@L3@@@ @5 @@@? ?@0M?@@@H? N@@@6Xhf?@@@H?e3@@H ?@@1 @@he?@@@5? ?'@@@?e?3@@1?f@?g@?he?@@@@?h7@@@g'@ ?@he)X '@ 7@@@ @@g?@@1N@@@ ?J@H ?@@@ ?@@@@)hf?3@@f?@@L ?@@@ ?@@(Y?g?@@? ?V'@@Le?N@@@?f@1g@? 3@@@gV' ?@he@1 V' ?J@@@5 @@L?f?@@@?@@@ ?75? ?@ ?@@@f?O2@@?g?@@@ ?V'@L?e7@@)K? ?@0Y N@@1f@@@?f3@L?e?J@? V4@@ @@ ?7@@(Y @@1?f?@@@?3@@L? ?(Y? ?@ ?@@@@@e?O2@Y@5?g?@@5 N@)Ke@@@@@6X? O26K ?'@6X? ?@@@f@@@LfV'1?e?7@? @? ?@@@H? @@@?f?@@@?N@@1? '@6X '6X? ?N@@@@@@@@@@?@H?fO2@@@H ?3@@@@@@@@@@)X ?@@@@@@@@(f@?2@@?h?V'@1?g?@@?hf?@@@e?J@@@@f?V'?eJ@5? ?)X? ?@@@ J@@@3@@L V4@) V4)? 3@@@@@@@@@@@f?@@@@@5? ?V4@@@@@@@@@@)K? ?I'@@@0Yf@@@@@LheN@@L ?@@5e?@@0M?he@0Y? ?@@? ?@ ?@1? ?@@@ 7@@@V'@1 N@@@@@@@@@@@fJ@@@@@ ?I'@@@@@@??B@6X?e?@@? N@(Mg@@@@@,he?@@1 ?W2@(?e?3@H ?W&? ?W2@ ?@@?g?@ J@@@ @?h@@@@?N@@L? ?@@@@@@@@@@@e?W&@e@@1?e?W-X V'@@@@@?e3@,? ?(Y?g@@@@(Yhe?3@@ ?&@0Y?e?V'? ?&@? ?7@5 ?3@?hf?W2@ 7@@@@@@?he?J5?g?J@@@@3@)X @@ ?@@@@@@@@@@@e?7@@e@@@?e?7@)KO2@(?h?V'@@@@?eS(Y? @@@(Y?he?N@@ @@@6X? ?@@H @@@?he?V'?hfO&@@ @@@? ?7H?g?7@@@@V'@)X? @@ ?@@0?'@@@@@@e?@@@e?I@?eJ@@@@@@0Y?heN@@@@??O&Hhf?W&? @@@@(Y 3@@6K? ?'@? @@@@)K ?@@? @@@? W2@@@@ @@5? ?@hJ@@@@5?V'@)X ?@ )X ?@M??V'@@@@@e?3@@h7@@@@0M?hf?@@@@@@@@?hf?7@? 3@@@H? V4@@@6K? ?V'? @@@@@@6Xh'@g?@@? ?W&@@@@@ @@H? ?@h7@@@@HN@@1 @@ @) V'@@@@e?V'@L?f?J@@@0M? ?3@@@@@@@?hf?@@? V'@@gW&K?h?I4@@@ @MI4@@@)X?gV' W&@@(M @@L? 3@@@5??3@@L? @H ?@@? ?V'@@@L?eV')Xf?7(M ?V4@@@@@@?fO2@6X?e?@5?e@6K?he?V4@g7@@@hf@@f@Kh?/X? I'@@,? ?@ 7@@@H? ?J@@)X @?hN@@@H??N@@1? @? ?@@? N@@@1?e?N@)X?eJ@H?hf)Xh@@@@@@6KO2@@@@)?e?@H?e@@@6X? ?J@@@5hf@@f@@6Kg?N1? ?)X?g@@@?f?V40Y? ?@hf?J@@@5 ?7@@@1 @?h?@@5@@@? @@ ?3@@@Le?J@@)?e7@hf?J@1h3@@@?I'@@@@@@@H?e?@f?I4@)? ?7@@(Yhf3@f3@@@6Xg@?he?)X?eJ@1?g3@@? ?'@@(Y ?@@@@@L?hf@?hJ@@H
?J@@@? @@ ?V'@@)K?O&(Mf@@hfO&@@hN@@@L??@@@@@@5 ?@@0Y?hfN@fV4@@@)g@?he?@)K?O&@@LgN@5? ?V40Y? ?@@V4@)X 7@5??@@@@? ?'@@ ?'6X V4@@@@@@H?e?J@@h?@@@@@@@h?3@@)?&@@@@@(Y ?@M??@@@@@6KgJ@g?@@Hg@?he?3@@@@@@@1g?3U? @6X?h?W-X J@@??I4) ?J@@H??N@@@? ?W2@@? ?V4@ ?V'1 I'@@@@L?eW&@@@@@@6Ke?@@@@@@@h?N@@@@@@@@@@H?f?)X? ?@@(MI'@@?f7@g?3@?g@?he?N@@@@0MI@g?N@6X? @@)?h?7@1 @@ 7@@? W&@53@@L ?&0M V' O2@6X? ?V'@@@)K?O&@@@@@@@@@@@?3@@@(M?he@M?I4@@@@@L?f?@1? ?@@HeN@@Lf@@g?N@?g@Lf?O@?f@@0Mhf@@1? ?W&? ?@@@ @@L? @@5?hf?@h?W&@@HN@@)X? ?@@@@@@@)?f?W2@ V'@@@@@@@@(Me?I4@@@?V@@@H ?I'@@@1?f?@@? ?@@?e?@@1f3@L?g@?f?J@)K??O2@@? ?J@@5? ?7@? ?@@@ ?@@?f@@1? ?J@(Y?hf?@hW&@@@??3@@)K ?3@@he?&@@ ?N@@@@@@@@H?gI'@@@@5?heW&gV'@@@Lf?@@L ?@@@fV'1?g@LfW&@@@@@@@@@L O&@@H? ?@@? ?3@?f3@@L ?7(Y 7@@??N@@@@6X ?@ ?V4@ 3@@@@@@@h?V'@@(Y?he&@g?V4@@1f?@@)K? ?3@@L?e?V'?g3)K??O&@@@@@@@@@@1 ?@@@@5 ?@@? ?N@?fN@@, J@H? ?J@@5?3@@@@1 V'@@@@@@heV'@H ?I4@f?@@@@@6K ?N@@1?hfN@@@@@@@@@@(M?I4@@ ?@@@@H @?f?@0Y 7@ O&@(Y?V'@@@@ ?V'@@@@@@6K?g?V'? J@@@@@@@@6K? 3@@?hf?@@@@@@@@@(YfI@g'6X?g?@@@@? @@@6X? ?J@@ @6?2@@0Y?N@@@@ ?'@@ V4@@@@@@@@6K ?W&@@V4@@@@@@@(?hf)XhfV'@? ?@@@@@@@H?hfV')X @@@@1? ?7@5 @@@@@?3@@@L? ?V4@ @@ I4@@@@@@6Xh?O26K? W&@@@??I4@@@@0Y?/Xhe@1hf?V'? ?@f@@ @1 @@ ?I4@@? ?@@? J@(Y ?J@@@@5?N@@@1? @@L? ?@@@@@@)X?e?@@@@@@@@6K? &@@@5?heN)K??O2@6?2@@@ ?@K?f?@f@@ ?7@@ @@ ?@@? 7@H? ?7@@@@H??@@@@L 3@1? ?@ ?@g?@@? ?3@@@@@@1?eJ@@@@@@@@@@@@@@?@@@?hfI(Y?he?@@@@@@@@@@@@@ ?@@@@@@@@@he@6K?g?@@5 @@ ?)X? ?J@@ ?W.?e?@@@@5?@@@@1 V'@L ?@ ?@ ?V4@@@@@@??O&@@@@@@@@@@@@?e3@@? ?3@@@@@@@?I'@@L? ?@@@(MI'@@he3@@@6Xf?@@H ?31? ?.M? ?7H?e?@@@@HI'@@ ?@e?@@? ?V4@ ?I4@@@@@@@@@@@@@@@@@@@@?eN@@@@@ @(MI'@@??V'@1? ?@@(Y??V'@L?hV4@@@,f?3@?heW& ?N@? ?@e?@@@@@5?@@ ?)X?g?@@? I4@@@@@@@@@@@@@@@@@?e?3@@@@ W2@6K?fO&@?eV4@?eV4@?e?W-Xe@@6Xe?O2@@@@@0YfN@)KheI40Yf?V'?h?W&5 @?hf?@ ?W-X J@@@@@H?
?7@@ ?@)? I4@@@@@@@(?'@@@?e?N@@@@e?W-Xh7@@@@@e?@@@@1 ?7@,e3@@)KO2@@@(Mh?3@@@? ?&0Y @?hf@@@? ?7@)X? 7@@@@@?@@@ ?@@? @@ ?I'@@@@He@@@?f@@@@eO&@)K?g@@g?3@@@@L?hfJ@(YeV4@@@@@@@@H?h?V'@5? @@@? ?3@@)Xhf?@f@@@@X?J@@@ @@ N@@@@?O&@@@?f@@@@@@@@@@@6X?f@@L?f?N@@@@)Xhf7@H?fI40MI'@@hfV+Y? @? @@@@ ?V'@@1f@?gJ5e?J@@@@@?7@@@ W2@? ?@@@@@@@@@@?f@(?'@@@@@@@@)Kf@@1?g@@@@@)X?he@@L?h?N@@ ?@@? @@@@ V4@@f@?g7He?7@@@@H?
?J@@@5 ?)X? 7@5? ?I'@@@@?f@H?V'@@@@@@@@@@@@@@@5?g@@@@@@)?he@@)Xhe@@g@@ W2@? @?e?@@@@5W&@@(Y ?@1? @?hf?J@(Y? V'@@@Lf@?eV4@@@@@(?'@@@@@@H?f?J@@ @@@)X?g?J@5g@@ @? 7@H? ?J5?eJ@@@(Y
?W&@@(Y? ?@@? @?hf?7(Y ?V'@@1f@LfI'@@@He@@@@@@gO&@@ @@@@)KgW&(Yg@@ @? ?J@5 ?7H?e7@@@H??7@@(Y ?@ @?hf?(Y? V4@@f@1f?V'@@?O&@@@@@5f?'@@@@ I'@@@?f&0Y? W&@H ?@f@@@5J@@(Y? W& @@L?fV'@@@@@@@@0Yf?V4@@@L?f?@@(h?V'@5? ?@ /X 7@5? @@@H7@@H '6X? &@ ?)X? 3@1?f?V'@@@@@0Mh?I'@)Xf?@0YheV+Y? ?@ V/ @@H? @?f@@@?@@5? V4)?hf?@6Xhe?@@? ?@)? W& V4@?gV4@@0MhfV'@)X? ?J@@ ?J@?e?J@@5?@@ ?@@) @@ &@ ?V'@1? ?7@@ ?7@?e?7@@H?@@1? ?@@? @6X?eV4@? ?@@? J@@5 J@@Le?@@@3@@? ?@H? )X @@)? 7@(Y 7@@@e?@@@N@@? ?@ @) '6X? ?J@@H? ?J@0M?e?@@5?@@? ?@ ?@ @? V4)? ?7@5 W&<?f?@@H?@@L ?@ @@ ?@(? J@@H ?W&@gJ@5??3@1 @@ '6X? ?(Y? ?W&@5? W&@@g7@H??N@@ V4)? O&@0Y?hf?W&@@@f?J@53@ @?g@? @@@(M? W&@@@5f?7@HN@L? W& @? @@ ?J@@(Y ?O&@@@(YfJ@5??@1? 75 W&@(Y?hf?O2@@@@(Y?f7@H??@@? (Y @?he@?hf?)X? ?@ @6X? 7@@Hhf?W2@@@@@(Yf?J@5?@@L ?31? ?@ ?@6Xg3@,? ?J@@5?hfW&(MeI(Y?fW&(Y?@@)X? ?@ ?V'? ?@@)gV+Y? @(g?'6X W&@(Y?he?O&0Y?h?W&(Y??3@@)X ?3@H (Yg?V4) 7@@?he?W2(M?heO&(Y?N@@@1 ?@ ?V'? ?J@@@1heW&(YheO2@(Y?3@@@ @? ?@ @? ?7@@@@he7(Y?hO2@@(YV'@@@@ ?@ ?@@@@@he(YhW2@@@0Y??N@@@@L? ?@@?hf@@6X J@@@@@ 7@@(M?3@@@1? ?@@@6X @?hN@@, ?@ 7@@0M?gW2@?he@@(YV'@@@L ?@@? @? I4@1 ?@0Y ?J@(M?h.Mh?O2@@(Y??V'@@)X? ?@@? ?@he?@ ?@@? ?@@?hf@? I@ ?)X? W&(Y W&KO2@@@0YV'@@)X ?@he?@ @? @6X? ?@@? ?@)? ?O&@H? ?W&@@@@@(M?N@@@1 @? @@)? ?@@? @@@5 W&@@@@@0Y?3@@@L? )X ?@(? @@ @@(Yg?W&?g7@@@(MV'@@1? @)X? ?@ ?(Y? @0Y?g?75?f?J@@@0Y??N@@@? @@)? ?W2( @? J(Y?f?7@@3@@? ?@@@ W& ?&0Y @@ @?h@? ?W.YgJ@@5V'@L ?@M? 7@ ?)X? ?7H?g7@(Y?N@1 @@ @? )Xhe?@,? ?@ ?W-XhJ5g?J@(Y?@@L? ?@@? @? @)he?(Y? W-X? ?7@)X?g.YgW&@H3@1? @@ O2(? J@5? O@ &@)? J@@@)? 7@5?N@@L W2@(Y? '@H? ?@@@ ?W&@(M ?J@(Y??@@1 ?W2@ &@0Y V' ?@@5 ?&@0Y?f?W&?gW&@H?@@@ ?.M? )X ?@@Hf)X W&5?g7@5??3@@L? @? 3)X?gW2(? ?@@?f@)f?)X? 7(Y?g@@H??V'@1? @@ N@1?g&0Y? ?@1? ?@ ?J(Yg?J@5N@@L @5 ?@@? ?@5? W2@?gW&H?g?7(Y?@@1 (Y ?W&? ?(Y? ?W&@@Lg&@hJ@H??3@@ @?he?@@?f@6X? W&@? ?7@@@1 ?W&@?V'@@6X? @? ?@6X N@1? *@@? J@@@@@eO2@?hW&@@V'@@)K @? ?@@1 ?@@L V'@? 7@@@@@@@(Mh?W&@@5?V4@@@6X ?3@@ ?@@1 ?)X? ?N@? ?/X? ?J@@@@@@@0Y?hW&@@(Y
I'@)K? ?V4@ ?@@@L? ?@)? @? ?V/? ?7@@@@@0M?h?O&@@@H??V4@@@6X ?@ ?@@@,? @L J@@@@(M?h?W2@@@@5
I4@)X? ?@ ?@@0Y? 31 7@@@0YheO&@@@@(YI4)K @6X? V' ?@@? ?J@@(MheO2@@@@@0Y?I'6X @@ ?@@??@6X @@(? N@1? ?N@?g?@ W&@(Y?hW2@@@@@(M??V')X? @? ?@@??3@)X? @0Y? ?@@? @? 7@(Yh?W&@@@@@0YV')X ?@@??V'@1? ?@@? '@@? @(Y?h?7@@@@0M?V'1 V4@? W& ?@@? V4@? ?O2@@@@Hhe?@@@V'L? &@ O2@@@@@@@?heJ@@5?V/K ?@@@@6X? ?@6Ke?@@@@0M?I'@?h?W&@(YV'6X ?@g?3@@@@,? ?'@? ?O@K?@@@@?h?S5?h?7@(Y??V')X? ?@g?V'@@(Y? @@he?V'? O2@@@@@@@@@?h?7H?hJ@@HN@)X V40Y ?@6X ?@@@@@@@@@@@@?hJ5h?W&@5??3@)X? ?@@, ?@@@@@@@@@@@@?h.YhW&@(Y??V4@)X ?@0Y @@ ?@ ?@@@@?I'@@@@@? ?W&@(Y?I')K? @@ ?@ ?@@@@??V40M? O&@(Y?V4@6K? @@ @@ ?@ W2@@@HI'@6X? @? @@ ?W2@@@ ?W2(g?W&@@@5??V4@)X @? @?heW. @@ @? ?7@0M? ?&0YgO&@@@(Y??I')K? ?@@@ @?he.Y @5hf?)X? ?@M? O2(?heW2@@@@(YV4@6K? ?3@@ )X (Yhf?@)?he?@ O2@0Y?h?W&@@@@(Y?I'@@@6K? ?V4@ @) )Xhe'@e?O.? ?W2( ?@0MhfO&@@@@0Y?V4@@@@@6K ?@ ?@ @1heV'e@0Y? ?&0Y W2@@@@@?
I4@@6X ?@ '@ 3@f?@ ?O&@@@@@@??I4)K? V' V' ?@ ?O2@hf?W2@@@@@0M?I46X? ?)X? W&h?@@@@@@@@@@@L?heO&@@@0M??I/K ?@)? ?/X? ?W&5hJ@@@@@@@@@@@)KeO2@@@@@@@@0MV'6X @@g?V/? @6X? W&(Yh7@@@@0M?@@@@@@@@@@@@@@@@0M?V')X? @H @@)?f?W&? &0Y?h@Mg@@@@@@@@@@@@@@0MV')X @? ?7@? @@@@@@0M?V')X? ?@@@ ?)X? ?@@? ?J@@@@(MV')X I@ ?31? ?W.?g?7@@@(Y??V4)K? @?hf?V'? @@ ?W&?hW&H?gJ@@@(Y?I'6X? W& @@ W&5?g?W&5g?W&@@0Y?V4)K ?W&? 7@ ?W&@H?g?&0Yg?7@(M?I'@@6K ?75?f?W2@ @?g@@ O&@@f?W2@heJ@@H?V4@@@6K ?(Y?f?&@@h?@@( @@ O2@@@@fW&@Hh?W&@5??I4@@@6X ?@0Y W2@@@(M?g7@@?h?7@@H??I4@@)K? @@ @@ @? 7@@@(Yh@@@?hJ@@5?I4@@6K? @@ ?J@@@(Y? ?W&@@H?I4@@@6X ?7@@(Y ?@K?O&@@@??I'@@)X? J@@0Y? ?3@@@@@@@?V4@@)X @0M?he?W-Xg@@@@@@5?I4@)X? ?@@? ?7@1f?7@@@@@@H?I')X ?@@? ?@@@fJ@@@@@@5?V')X? ?3@@L??W&@@@@@@HV')X ?N@@)KO&@@@@@@@??V')X? 3@@@@@@@@@(MV')K ?@@? ?O2@@?fN@@@@@@@@(Y??N@@6X ?@6Xg?@@? W2@@@@5?f?@@@@@@@(Y3@@1 ?3@1 *@@@@@H?f?3@@@@@(Y?V4@@L? ?V4@ W26KV@@@@@g?N@@@@0YI'1? @@@@6X ?W&@@@@@@@@@h@@0M?V'? @? @(?'@1 ?&@@@@@?I'@@@@
?@ (Y?V4@ ?I'@@??V'@@@?)X? N@@?eN@@@@@@@@??@)? W-X?e?@@LeJ@@@@@@@@?
?/X? ?O&@)Xe?3@)X?@@@@0M?@ ?V/? ?O2@@@@,e?V4@)?
?@6K ?@ ?O2@@@@@0Y?@@@6X @@@@@? ?@ O@e?@ O2@@@@@0M?I'@)K? 3@@@@?g?/X?f@? ?W2@@@ O2@@@@@0M??N@@@6X? N@@@5?g?N1?e?J5? ?W2@(?e?*@@@@ ?O2@@@@0M?@@@@)X ?@@0Y?h@?e?.Y? ?&@0Y?e?V40M? O2@@@@0M?I'@@)K? ?@M? ?O2@@@@@@@0MV4@@@6X? ?W2@@@@@@@@0M?I4@@)K ?@ O&@@@@@0M?I'@@@6X? ?O2@@@0M?V'@@@)K ?O2@@@0MV4@@@@@6X? ?O2@@0M?I'@@@@)K ?O2@@(M??V4@@@@@@6X? O26?2@@@6K ?O2@@@@@@@0Y
I4@@@@)K ?O2@@@@@@@@@@@@@@@@@@@@@@@@@@@@@@@@@@@@@@@@@(MI4@@@@6X @? ?O2@@@@@@@@@@@0MeI4@@@@@@@@@@@@@@@@@@@@@@@@@(Y?I4@@@)K? W&K? ?O2@@@@@0M ?I40?@MI4@@@@@@@@@@@@@0Y?I4@@6X? ?O&@@@@@@6K? O2@@@@0M?I4@)K ?@ ?O2@@@@@@@@0M??I4@?@@@6KhW2@@@@0M?I4@6K ?O2@@@@@@@@(M?h?I4@@6K?e?W&@@@(M
I46K ?O2@@@@@@@@@@@@@@@0Yhf?I4@@@6KO&@@@(Y?I'6K ?W2@@@@@@@@@@@@0M? ?I4@@@@@@@(Y?V'@@6X? O&@@@@@@@@@@0M I4@0Y?V4@@)K ?O2@@@@@@0M?I4@@6K O@?2@@@@@@@0M?I4@@6K ?O2@@@@@@@@0M??I4@@6K? ?O2@@@@@@@@@@0M?
I4@@@@@6K? ?O2@@@@@@@@@@@@0M??I4@@@@@@@6K ?O2@@@@@@@@@@@0M
?I4@@@@@@@6K ?O2@@@@@@@@@@0M??I4@@@@@@@6K O2@@@@@@@@@@@0M?
I4@@@@@@@@@@@6?2@@@6K?fO2@@@@@@@0M??I4@@@@@@@@@@@@@@@@@@@@@@@0M
?I4@@@@@@@@@@@@0M?
1 Hargis, W.J. and D.S. Haven. 1988. The Imperilled Oyster Industry of Virginia. Special Report No. 290 in Applied Marine Science and Ocean
Engineering. Virginia Sea Grant Marine Advisory Services.
71

In 1954, Chesapeake harvests rose dramatically in response to a 15 percent increase in ex-vessel price, which was itself the result of a decrease in mid-Atlantic harvests. However, thisboom did not last for long. In 1959, the protozoan pathogen Haplosporidium nelsoni (MSX) invad-ed the Chesapeake Bay and, soon after, Perkinsus marinus (Dermo) — both have been responsiblefor catastrophically killing most of the oysters in high-salinity regions of the Bay. In Virginia,leaseholders, or private growers, hold a majority of their leased bottoms in the high salinity areasaffected by MSX and Dermo — public grounds are in the lower-salinity waters. Unlike Marylandwatermen, who have depended for their harvests primarily on publicly open grounds, Virginia’s pri-vate industry has been virtually decimated.
In spite of the MSX invasion in the Bay, oyster production in Maryland in the 1960s in-creased for a short period. A major reason for that increase was the discovery of pre-historic fossilshell sources and the development of a dredge to extract the shell for use as a substrate to “catch”natural oyster seed. Subsequent employment of these resources by the State of Maryland was com-monly referred to as the “repletion program.”2
Prior to the repletion program, state legislation had required processors to make 10 percent oftheir shucked shell available for purchase by the state in order to ensure the availability of sub-strate for future oyster production. The legislation also provided funds for state shell-planting ac-tivities. The discovery of additional shell sources provided a cheap alternative to freshly shuckedshell and yielded significant production increases. Maryland’s oyster production doubled fromaround 1.5 million bushels to some 3 million annually. The increase in importance of the reple-tion program relative to natural oyster set helped transform the oyster fishery from traditional nat-ural resource gathering into a “put-and-take” state fishery.3 Watermen were temporarily relievedof the constraints of nature alone and no longer solely dependent on the “recycling” of processedoyster shell.
The use of relatively inexpensive dredged shell also changed the philosophy of oyster man-agement in Maryland from maintenance of a collapsing industry to revitalization, through reple-tion, of a potentially valuable one. The state switched from its regulatory role of oyster manager toa champion of production growth. Although production began to wane in the late 1960s and hascontinued to do so, until about 1981 Maryland oyster production remained over 2 million bushels.During this time there was concern that the market could not absorb, at an acceptable price, morethan about 2.5 million bushels. In this new scenario, the market, not nature, became the con-straining element.
Since the 1980s oyster production has been suffering from the reappearance of MSX and, es-pecially, Dermo. Maryland’s harvest has declined from over 2.5 million bushels during the 1980-
72 ECONOMIC VALUATION OF NATURAL RESOURCES: A HANDBOOK
2 The nature of oyster reproduction is such that young larvae require a hard substrate on which to attach; oyster shell provides such a material.
However, if the harvested shell is not replaced in the Bay by a suitable substrate, there is a strong likelihood that the future availability of oysters
will be reduced.
3 Lipton, D.W., E.F. Lavan, and I.E. Strand. 1992. Economics of Molluscan Introductions and Transfers: The Chesapeake Bay Dilemma. Joumal of
Shellfish Research 11(2):511-519.

1982 season to under 250 thousand bushels in the early 1990s. As a result of the decline in supply,ex-vessel prices have risen.4 In spite of the increased ex-vessel prices, the effect of the loss of pro-duction on the income of the Chesapeake watermen has been significant. Unlike past battles withMSX and Dermo disease, this most recent outbreak has not been relieved by the repletion pro-gram. Lipton, Laval and Strand explain that the sporadic nature of the protozoan infections havemade it difficult to develop a comprehensive strategy for oyster repletion.
Proposal to Revitalize Oyster Production
In contrast to the steep decline of oyster landings in Chesapeake Bay, oyster production onthe west coast of the United States grew between 1982 and 1988 by 600 thousand pounds. Thesource of this production increase is hatchery production of the introduced species Crassostrea gigas(originally from Japan). Because of evidence that C. gigas is more resistant to MSX and Dermo,there has been strong interest in introducing this species into the Chesapeake Bay to test its hardi-ness. Virginia growers, in particular, are interested in introducing such a non-native species ofoyster into their waters in an effort to revive their leased grounds and their processing industry.Maryland watermen, who harvest public grounds, have generally opposed introductions eventhough public grounds are not nearly as productive as they once were. In the meantime, harvestersin both Maryland and Virginia have turned to alternative resources — in Maryland, to softshellclams; in Virginia, to hardshell clams; in both states, to more intensive fishing effort for blue crabs,beginning earlier in the season and lasting later. Other watermen have left commercial fishing en-tirely.
The decision on whether or not to introduce C. gigas or some other non-native oyster intothe Chesapeake Bay is not as straightforward as it may appear. Several factors must be consideredincluding the costs and benefits of such an action. The net benefits to the different groups affect-ed by the introduction must be estimated. These benefits may be economic or ecological in na-ture. Other significant considerations in the decision process are the uncertainties involved.
Benefits of an Introduction
Among the expected benefits from the introduction of C. gigas. are those to commercial har-vesters and consumers. From the Virginia industry’s perspective, the argument in favor of introduc-ing a non-native species is based on the expected economic benefits, for instance, increases in in-come levels and employment, as well as in increases in producer surplus or economic rent.
The measurement of producer surplus is assessed as the revenue net of costs. In this case, cul-turing, processing, and harvesting costs are taken into account as well as the opportunity cost of a
CASE STUDY 1:OYSTER RESTORATION IN CHESAPEAKE BAY 73
4 Harvest prices are strongly influenced by the supply of the oyster yields. When both Maryland and Virginia harvests were low prior to 1960, real
prices, the actual prices adjusted for the general level of inflation, were high. The tremendous increase in Maryland’s production in 1966 caused
real prices to drop by as much as 40%.

producer’s labor — what he or she could earn in the next best employment opportunity.As Lipton, Lavan and Strand point out, if the introduction of C. gigas is for the purpose of
restoring a public fishery, the net benefit to producers will also depend on how the resource ismanaged. If an open access management regime is maintained, then net benefits to producers willbe less than if a bottom leasing program or limited entry program on public grounds is instituted.Simply replacing one species with another does not necessarily eliminate the human-induced fac-tors that caused the decline of the native species.
Consumers of oysters may also benefit from the introduction of C. gigas or some other non-native molluscan into the Chesapeake Bay implying further increases in social welfare. Increasesin consumer surplus may occur with expected increases in the quantity of oysters available and de-creases in price. Consumer welfare measures are assessed based on the demand for the introducedoyster. It is questionable, however, to what extent consumers are aware of or care about the oysterspecies they consume. It is entirely possible that the introduction of C. gigas into the Chesapeakewill have negative net benefits: one reason is the negative publicity surrounding the health andsafety aspects of eating molluscan shellfish. Consumer demand for the product may be highly in-elastic so that a slight increase in the available quantity will be accompanied by a large decline inprice.
In addition to market-oriented benefits from oyster introduction, there are potentially signifi-cant ecological functions and services that oysters may enhance, ultimately leading to long-termbenefits to society. Historically, the oyster was the dominant benthic organism in the ChesapeakeBay: according to many ecologists, as reef-forming organisms, oysters played a major role in ecosys-tem dynamics.5 Restoration of the oyster is seen therefore as highly desirable from an environmen-tal perspective. The oyster’s filter feeding functions could serve to filter the Bay’s large amounts ofalgae, which could perhaps help reverse eutrophication of the Chesapeake ecosystem. Related im-provements in water quality might ultimately provide ecosystem benefits in terms of improved fish-eries, aesthetics and recreation and could lead to avoided costs of sewage treatment or depurationfacilities.
Costs of a Species Introduction
The costs of introducing C. gigas or any other non-native mollusc into the Chesapeake Bayinclude direct costs such as the actual costs of performing the introduction, monitoring, and main-tenance. In addition, there are costs associated with the introduction in the form of research dol-lars. That is, before an introduction is implemented, research must be conducted to determine theimpact and probability of success of such an action.
Another critical cost is the risk of environmental injury resulting from species introductions.The history of molluscan introductions demonstrates that they can ferry in unintended or nuisancespecies that could potentially outcompete or displace a desirable native species. There are numer-
74 ECONOMIC VALUATION OF NATURAL RESOURCES: A HANDBOOK
5 Newell, R.I.E. 1988. Ecological changes in Chesapeake Bay: Are they the result of overharvesting the American Oyster, Crassotra virginica? In Un-
derstanding the Estuary: Advances in Chesapeake Bay Research Consortium. Newell estimated that prior to major harvesting (pre-1870) of oyster
beds, oysters filtered the entire water column in 3.3 days, while in 1988, the turnover time would have been 325 days. He further estimated that the
pre-1870 populations may have been capable of removing 23-41 percent of the 1982 phytoplankton carbon production, but by 1988, they could re-
move only 0.4 percent.

ous examples in terrestrial and aquatic environments.6 In addition, the introduction of a non-na-tive species such as C. gigas could have unforeseen, detrimental ecological impacts.
The magnitude of the risks involved in introducing a non-native species into the ChesapeakeBay is as yet undetermined. However, it is clear that an introduction poses fewer risks for Vir-ginia’s oyster fishing industry than for Maryland’s. Unlike Maryland’s oyster fishery, which thoughmuch diminished is still viable, Virginia’s oyster industry is failing. Thus, Virginia’s industry doesnot risk the devastation of native species with the unintended, negative ecological consequencesof an introduction. An introduction in Maryland’s waters, on the other hand, puts the nativeCrassostrea virginica potentially at risk.
Dealing with Risk and Uncertainty
Compounding the debate over C. gigas introduction into the Chesapeake Bay is the naturalecological connection between the industries of the two states. It is likely that introductions inVirginia waters will eventually affect Maryland waters. The decimated state of Virginia’s fishingindustry compels its oyster producers and managers to pursue the introduction or transfer of a mol-luscan species in an effort to save the industry. The less urgent circumstances surrounding Mary-land’s industry impels its producers and managers to act more cautiously. These contrasting agen-das inhibit consensus among the two states as to the appropriate course of action. The use of eco-nomics in the decision process could enhance the possibility of a resolution; towards this end, theuncertainties of an introduction can be considered within the benefit-cost framework.
Two principle methods of doing a benefit-cost analysis are through expected net benefits andgame-theoretic approaches. In the expected net benefits approach, the distributions about the costsand benefits are used and the value of net benefits are calculated. Conceptually, the procedure isstraightforward. However, the distributions about net benefits are not easy to ascertain, particular-ly when considering future events. As a result, a higher discount rate is often used with more riskyselections.7
Game theory8 can also be applied to the uncertainty involved in the decision on whether ornot to allow an introduction. The game theory method is based on the two choices presented —to allow or not to allow an introduction. The approach offers the option of taking either a conser-vative or a more risky position with regard to possible damages from unintended negative conse-quences or environmental costs. The conservative position utilizes the minimax principle inwhich the strategy that minimizes the maximum possible losses is chosen.9 The more risky position
CASE STUDY 1:OYSTER RESTORATION IN CHESAPEAKE BAY 75
6 Rosenfield, A. and R. Mann. 1992. Dispersal of Living Organisms into Aquatic Ecosystems. Maryland Sea Grant College, College Park, Maryland.
7 Lipton, D.W., E.F. Lavan, and I.E. Strand. 1992. Economics of Molluscan Introductions and Transfers: The Chesapeake Bay Dilemma. Joumal of
Shellfish Research 11(2):517.
8 Bishop, R.C. 1978. Endangered Species and Uncertainity: The Economics of a Safe Minimum Standard. American Journal of Economics
60(10):10-19.
9 Ciriacy-Wantrup, S.V. 1968. Resource Conservation: Economics and Policies. Berkeley and Los Angeles: University of California Division Agri-
cultural Sciences.
76 ECONOMIC VALUATION OF NATURAL RESOURCES: A HANDBOOK
makes use of probability distributions of net benefits and compares the expected value of the intro-duction and no-introduction scenarios, choosing the action with the greater expected value.Clearly for each strategy, measures of the consequences of introductions and damages must bemade. This procedure must determine how the stream of net benefits should be discounted overtime and the characteristics of the uncertainty of these measurements.
Exercise
The debate over the introduction of C. gigas or some other non-native oyster into Chesa-peake Bay waters is highly political and full of uncertainties. Watermen are unwilling to abandonan industry that has been a fundamental element of the region’s economy and culture for over acentury. Virginia watermen, in particular, see molluscan introductions as a means to revitalize thefailing industry. However, the uncertainty of the effects of an introduction clouds the issue. An-other complication is the fact that the decision will have effects that cross jurisdictional bound-aries.
The decision whether or not to allow an introduction is not isolated to the specific, individ-ual oyster beds within the two states of Maryland and Virginia. The Chesapeake Bay ecosystem isnot confined, of course, by political boundaries. Any decision that is made must take a multi-juris-dictional approach that transcends artificial divisions.
Suppose that you are a member of a Chesapeake Bay economic development council. Youare tasked with developing recommendations on a Bay wide oyster development plan. Considerthe role of environmental valuation in your analysis. Using the following questions as a guide,outline the study you would request of a local economist.
1. What values associated with oyster resources and services should be analyzed?
2. What techniques would you recommend in order to determine the values of these resourcesand services?
3. What are the limitations to the existing methodologies in this case?
4. What additional information do you need in order to determine the expected net econom-ic benefits of a C. gigas introduction plan?
5. What discount rate would you recommend in a benefit-cost analysis of a C. gigas introduc-tion plan?
6. Suppose that new technological developments offer alternative methods of oyster enhance-ment (e.g., bio-technological or bio-engineering of a native species immune to MSX orDermo). What role can environmental valuation play in assessing these alternatives?

SALMON HABITAT RESTORATION
IN ALASKA
Background
Alaska’s salmon fisheries account for sizeable contribu-tions to the state’s economy. In 1990, commerical har-vests, which were 94 percent of the 733.1 million poundslanded in the United States, were valued at $546.7 mil-lion. This amount does not account for the added valueof its recreational and subsistence fishing. The health ofthe salmon fishery, then, is vitally important to economichealth. The salmon fishery is influenced by many factors,environmental and human — from highly variable oceanconditions to the timing of harvesting, the levels of that harvesting, the impact of land-use practices onfreshwater and estuarine habitats, which can be criticalfor spawning.
Pacific anadromous salmonids include five speciesof salmon that are comprised of a large number of stocksoriginating from specific watersheds. Salmon juveniles orsmolts spawned in streams migrate to the ocean and then generally return to their natal streams tospawn. Because forestry practices can directly influence the quality and quantity of freshwaterhabitat, primarily through harvesting of timber and associated road building activities, their man-agement is particulalry important for the health of salmon returning to their home streams.
Even with salmon health generally high, with record harvest levels, and with a large propor-tion of the land base relatively undisturbed, specific stocks could still be in decline if forest prac-tices remove too much of the riparian vegetation or degrade channels. Under certain conditions, agiven run of salmon could be considered for listing as endangered under the Endangered SpeciesAct, which includes provisions for listing “distinct population segments.”
CASE STUDY 2: SALMON HABITAT RESTORATION IN ALASKA 77
C A S E S T U D Y 2
Situation
Harvesting of Alaskan forests canimpact salmon habitats and lead di-rectly to reduced spawning ofsmolts. A hypothethical example ispresented in which a proposed reg-ulation calls for a riparian bufferzone along critical stream habitat.

Hypothetical Alaskan Watershed
The following example provides a set of assumptions about the economics of logging andsalmon harvests — the exercise then poses a number of questions that consider issues of value. Tobegin with, suppose that harvesting within the Tough Choices watershed would generate 6,700million board feet of timber with a pond log value of $401 per million board feet — pond log val-ue reflects not just the price of the standing timber but also the costs incurred in bringing the tim-ber to the mill, for instance, logging, road construction, and transport. Assume that by buildingthe access roads across the watershed and by removing the trees, this timber sale will fragment theriparian habitat into patches and cause a reduction in the full capacity of the spawning ground forthe coho stock that inhabits the creek. This stock of salmon would show an expected decline rel-ative to the amount of habitat lost.
The impact of tree clearance would also affect the food web, for example, local bear and ea-gle populations that depend on salmon stocks could be adversely affected. Such impacts couldhave ripple effects, for instance, declines in recreational viewing which might be impacted becauseof tree harvesting and road-building. We will suppose that the only functions attributed to thesetrees is either commercial harvest or as an input into stream integrity and fish production, or neg-ative effects. The value of the salmon consists of its commercial and recreational value (in currentand future fisheries), as well as its subsistence and cultural value to the residents of the State ofAlaska.
As part of this hypothetical example, we assume that biologists have developed an expectedrelationships between land clearance and the capacity of the spawning ground associated with thestream. If all the commercial timber proposed is harvested, then the spawning capacity will be re-duced by 90 percent of its original capacity. If only 20 percent of the trees are harvested, a 10 per-cent reduction in fish capacity is expected. For every 10 percent increase in timber harvest fromthat level on, there will be a corresponding drop of 10 percent in fish spawning capacity. In addi-tion, consider the following information:
Spawning capacity: 9000Smolts per spawner: 106Ocean survival to maturity: 43%Commercial harvest rate: 47%Freshwater recreational harvest: 16%remainder available to spawn for future cycles
Ex-vessel Price: $1.42/lbAverage weight of salmon harvested: 12 lbsAnglers’ WTP: $15.92 per additional fish caught
78 ECONOMIC VALUATION OF NATURAL RESOURCES: A HANDBOOK

Exercise
Given the background and information provided above and keeping in mind the various per-spectives regarding “value,” analyze a proposed regulation calling for a 300-foot riparian bufferzone along critical salmon streams.
Questions to consider include:
1. Are there any additional value associated with the timber and salmon resources not men-tioned?
2. What measurement techniques would you employ to determine relevant values?
3. What additional data (aside from that provided) might you need to carry out empiricalanalysis?
4. What discount rate would be appropriate in the determination of net present value?
5. Society involves many individuals, and projects such as this often affect the welfare of in-dividuals differently. The implicit assumption in constructing the estimates of costs andbenefits in this example is that the welfare of all individuals is weighted equally. What ifyou were to eliminate this assumption and address the issues of equity and fairness? Howmight your decision change if you take future generations explicitly into consideration?How might you go about doing this?
6. Consider the issue of irreversibility. How might the potential for species extinction changeyour decision process and recommendation? How might you integrate the potential risk ofirreversible outcomes into your analysis?
CASE STUDY 2: SALMON HABITAT RESTORATION IN ALASKA 79

CASE STUDY 3: FLORIDA KEYS NATIONAL MARINE SANCTUARY 81
FLORIDA KEYS NATIONAL
MARINE SANCTUARY
Background
The marine ecosystem of the Florida Keys is the onlycomplete tropical marine ecosystem in the continentalUnited States. It includes extensive aquatic habitatssuch as coral reefs and seagrass beds. Ninety percent ofthe region’s commercially important species use thesehabitats for shelter, food, or nurseries during at least onestage of their life history. Several species of threatenedand endangered sea turtles are found in the Keys, includ-ing hawksbill, loggerhead, leatherback, green, andKemp’s ridley. In addition, dolphins and endangeredmanatees frequent the area, as well as countless species ofsea and shore birds. Another aspect of the area’s marineenvironment is the submerged cultural and historic re-sources, for example, submerged Paleo-Indian sites, na-tionally registered lighthouses, and wrecked ships goingback several hundred years.
The Keys ecosystem is threatened by impacts from anumber of different sources, indirect and direct. Indirectimpacts contributing to the decline of the reefs and sea-grass beds include polluted runoff from over-developed is-lands; heavy metals and other toxins which contaminatethe reefs; excess nutrients from human sewage, fertilizers,detergents, and animal wastes which create algal blooms;pesticides; offshore oil and mineral mining; and saltwa-ter/freshwater imbalances. Direct impacts include vessel
groundings, diver damage to coral, and boating traffic (anchor and prop dredging) which destroysseagrass beds, and destructive fishing methods.
C A S E S T U D Y 3
SituationWith the Florida Keys ecosystemthreatened by point and non-pointsource pollution, alternative man-agement strategies outlined in theFlorida Keys National MarineSanctuary Plan have focused onthe cost-effectiveness of differentissues or activities for achievingsustainable use of the Florida KeysNational Marine Sanctuary: boat-ing, fishing, recreation, land use,water quality, zoning, and educa-tion. This case study focuses ondifferent strategies of zoning.
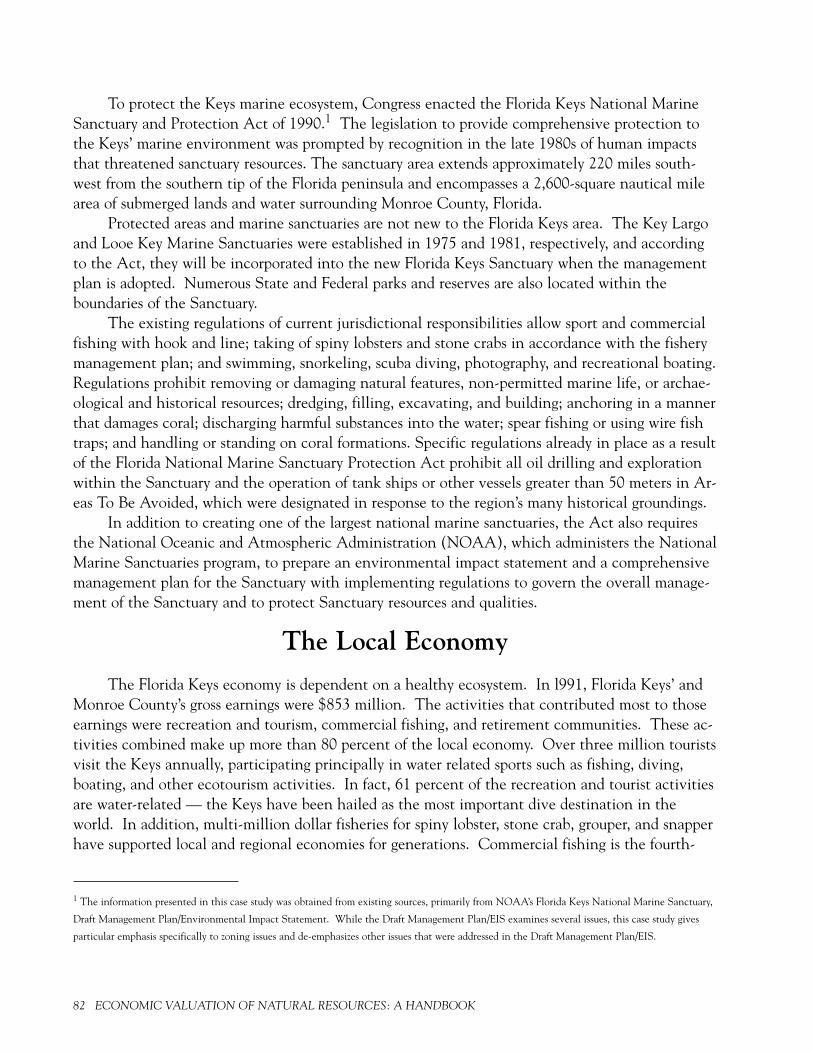
82 ECONOMIC VALUATION OF NATURAL RESOURCES: A HANDBOOK
To protect the Keys marine ecosystem, Congress enacted the Florida Keys National MarineSanctuary and Protection Act of 1990.1 The legislation to provide comprehensive protection tothe Keys’ marine environment was prompted by recognition in the late 1980s of human impactsthat threatened sanctuary resources. The sanctuary area extends approximately 220 miles south-west from the southern tip of the Florida peninsula and encompasses a 2,600-square nautical milearea of submerged lands and water surrounding Monroe County, Florida.
Protected areas and marine sanctuaries are not new to the Florida Keys area. The Key Largoand Looe Key Marine Sanctuaries were established in 1975 and 1981, respectively, and accordingto the Act, they will be incorporated into the new Florida Keys Sanctuary when the managementplan is adopted. Numerous State and Federal parks and reserves are also located within theboundaries of the Sanctuary.
The existing regulations of current jurisdictional responsibilities allow sport and commercialfishing with hook and line; taking of spiny lobsters and stone crabs in accordance with the fisherymanagement plan; and swimming, snorkeling, scuba diving, photography, and recreational boating.Regulations prohibit removing or damaging natural features, non-permitted marine life, or archae-ological and historical resources; dredging, filling, excavating, and building; anchoring in a mannerthat damages coral; discharging harmful substances into the water; spear fishing or using wire fishtraps; and handling or standing on coral formations. Specific regulations already in place as a resultof the Florida National Marine Sanctuary Protection Act prohibit all oil drilling and explorationwithin the Sanctuary and the operation of tank ships or other vessels greater than 50 meters in Ar-eas To Be Avoided, which were designated in response to the region’s many historical groundings.
In addition to creating one of the largest national marine sanctuaries, the Act also requiresthe National Oceanic and Atmospheric Administration (NOAA), which administers the NationalMarine Sanctuaries program, to prepare an environmental impact statement and a comprehensivemanagement plan for the Sanctuary with implementing regulations to govern the overall manage-ment of the Sanctuary and to protect Sanctuary resources and qualities.
The Local Economy
The Florida Keys economy is dependent on a healthy ecosystem. In l991, Florida Keys’ andMonroe County’s gross earnings were $853 million. The activities that contributed most to thoseearnings were recreation and tourism, commercial fishing, and retirement communities. These ac-tivities combined make up more than 80 percent of the local economy. Over three million touristsvisit the Keys annually, participating principally in water related sports such as fishing, diving,boating, and other ecotourism activities. In fact, 61 percent of the recreation and tourist activitiesare water-related — the Keys have been hailed as the most important dive destination in theworld. In addition, multi-million dollar fisheries for spiny lobster, stone crab, grouper, and snapperhave supported local and regional economies for generations. Commercial fishing is the fourth-
1 The information presented in this case study was obtained from existing sources, primarily from NOAA’s Florida Keys National Marine Sanctuary,
Draft Management Plan/Environmental Impact Statement. While the Draft Management Plan/EIS examines several issues, this case study gives
particular emphasis specifically to zoning issues and de-emphasizes other issues that were addressed in the Draft Management Plan/EIS.

largest industry in the Florida Keys region and represents 9 percent of Monroe County’s private-sector employment. Case Table 3.1 provides more information about the value of specific servicesprovided by the ecosystem and economic impacts.
NOAA’s Proposed Alternative Management Plans
In fulfillment of the mandate to prepare an environmental impact statement and a compre-hensive management plan for the Sanctuary, NOAA developed and assessed five alternative man-agement plans. These plans represent different levels of regulatory control over Sanctuary re-sources and restriction of uses, with Alternative I being the most restrictive (total restriction ofuses, except for research) and Alternative V the least restrictive (no action). The purpose ofNOAA’s proposed Alternative Management Plans is to ensure the sustainable use of the Key’s ma-rine environment by achieving a balance between comprehensive resource protection and multi-ple, compatible uses of those resources.
Case Table 3.1. Overview of Economic Situation.
Economic Value of Florida Keys Economic Impacts
Service Value Activity Impact
Annual non-market user value $660 million Gross earning provided 35%of water-related activities by tourism industry ($309 million)
Asset vlue of the Keys for water $22 billion Gross earnings provided 18.7%related activities (1990 dollars) by retail trade ($160 million)
1990 ex-vessel value of com- $46 million Population with jobs that 51%mercial fishing in sanctuary either directly or indirectly
support outdoor recreation
1986 ex-vessel value of Monroe $27.4 million Monies provided by $17 millionCounty’s seafood landings commercial fishing
Value of seafood landings at the $14.8 millionharvesting, wholesale, retail andrestaurant levels
CASE STUDY 3: FLORIDA KEYS NATIONAL MARINE SANCTUARY 83

84 ECONOMIC VALUATION OF NATURAL RESOURCES: A HANDBOOK
Each of the five alternative plans are comprised of a series of management strategies that fo-cus on the pertinent issues or activities considered to have potential resource impacts, positive ornegative. These issues or activities include:
1. Boating 2. Commercial and Recreational Fishing 3. Recreation 4. Land Use 5. Water Quality 6. Zoning 7. Education
For each issue, the potential impact themes of habitats, species, use and users, and water qualitywere examined.
Economic Impact Assessment
The purpose of the of the Florida Keys National Marine Sanctuary and Protection Act is toprovide for multiple uses of the Sanctuary as well as to ensure that its natural resources are protect-ed for the future.2 However, due to the implementation of management strategies, such as zoning,the Act may also result in the displacement of some Sanctuary users and consumers. Because the numerous users, consumers, and administrators of the Sanctuary have diverse andsometimes contradictory interests, a thorough examination and comparison of the ManagementPlans under consideration is essential. NEPA requires the assessment of environmental impacts inan Environmental Impact Statement. An analysis of the economic impacts, costs, and benefits ofthe proposed plans is an important part of this assessment, especially in light of the Keys’ econom-ic dependence on revenue generated from marine-related activities, and the value of the servicesprovided by the ecosystem.
An economic impact assessment was conducted as part of the Draft Management Plan/Envi-ronmental Impact Statement. However, a net economic benefit analysis, examining the socio-eco-nomic implications of proposed actions by comparing economic costs and benefits, was not con-ducted. The economic impact assessment summarizes the potential impacts of proposed manage-ment strategies on various user groups and the local economy, for example, sales, employment, in-come. The socioeconomic impacts associated with the management strategies were assessed by is-sue, as outlined above and discussed in qualitative terms. The key strategies within each issuewere assessed in terms of impact on user groups and expected socioeconomic costs and benefits.
Cost information for the analysis was based on negative impacts such as expected losses inuser values, income, or employment. The cost information used in this assessment was providedby federal, state, and local officials with responsibilities in the Keys. Low- and high-range esti-mates were given for both capital and annual operating costs and costs for each proposed manage-
2 The Coral Reef Coalition. Inside the New Florida Keys National Marine Sanctuary.

ment strategy. Information on the effects of proposed actions on human activities was also derivedas part of the process to develop a Sanctuary resource protection zoning scheme.
Resource Protection Zones — Zoning Categories
This section describes the findings of the assessment of social and economic implications forzoning strategies proposed in the Alternative Management Plans. Zoning, as noted in the previoussection, is one of the issues that has potential resource impacts.
The development of a management plan, then, provides the opportunity to establish differentregulations for separate areas within the Sanctuary. Thus, one of NOAA’s tasks under the Act isto consider temporal and geographic zoning to ensure protection of Sanctuary resources.
Zoning schemes were developed to ensure the protection of Sanctuary resources. The intentwas to reduce both damage to those resources and threats to environmental quality, while allowinguses that are compatible with resource protection. The zones are intended to protect habitats andspecies by limiting consumptive and/or conflicting user activities, thus enabling resources to evolvein a natural state with minimal human influence.3 Zoning will permit customary activities to con-tinue in some areas, while other areas will be designated for preservation, research, or restoration.The resource protection zoning scheme proposes five types of resource protection zones (these arethen described briefly):
1. Wildlife Management Zones2. Sanctuary Preservation Areas (SPAS)3. Existing Management Zones4. Special-Use Zones5. Replenishment Reserves
WILDLIFE MANAGEMENT ZONES. This strategy would affect user groups participating inwildlife observation or seeking access to these areas. Users participating in wildlife observationwould see a small socio-economic benefit due to greater assurances of continued wildlife and habi-tat protection. However, most of these zones are already within national wildlife refuges and areunder restrictions established by the U.S. Fish and Wildlife Service. As a result, the strategy islikely to have minimal socio-economic impacts on Sanctuary users.
REPLENISHMENT RESERVES. These reserves will encompass large diverse habitats and areintended to provide genetic protection for marine life. The goal is to increase the productivity inadjacent marine areas and enhance biodiversity. Sanctuary regulations will strictly limit resourceuse and consumption in these habitats. Some users, such as commercial lobster fishers, sport fish-ers, and tropical fish collectors will be displaced. However, compatible recreational activities willbe permitted. Although these zones would prohibit commercial and recreational fishing, they areexpected to have an overall benefit by protecting spawning and recruitment stocks from overfish-
3 National Oceanic and Atmospheric Administration. (December 1994). Florida Keys National Marine Sanctuary, Draft Management Plan/Envi-
ronmental Impact Statement. V2, pp. 194.
CASE STUDY 3: FLORIDA KEYS NATIONAL MARINE SANCTUARY 85

86 ECONOMIC VALUATION OF NATURAL RESOURCES: A HANDBOOK
ing, promoting genetic diversity within the fishery, producing “spill-over” benefits to other non-protected areas through the migration of organisms across boundaries, and providing importantbaseline data for use in managing fisheries in other areas. The zones become slightly larger and/ormore numerous moving from Alternative IV to Alternative II.
SANCTUARY PRESERVATION AREAS (SPAS). These zones will focus on the protec-tion of shallow, heavily used reefs where user conflicts occur and where concentrated visitor activi-ty leads to resource degradation. As with Replenishment Reserves, the groups that will benefit arethose that value an abundance and diversity of marine wildlife, including commercial and recre-ational fishers and participants in water-related recreation activities. However, tropical fish collec-tors, lobster fishermen, recreational fishers and spear fishers displaced from these areas will be neg-atively impacted.
EXISTING MANAGEMENT AREAS. Because these areas are already established by federal,state, or local authorities with competent jurisdiction in the Sanctuary, this strategy will have min-imal socio-economic impact.
SPECIAL-USE ZONES. This strategy will have negligible socio-economic impacts on users be-cause only a small number of areas will be established. Academic and scientific communities willbe the primary beneficiaries of this zone type.
The socio-economic information generated by this analysis was used along with the environ-mental impact assessment data in the selection of a Preferred Management Alternative.4
Exercise
While an economic impact assessment does provide some useful information in the evalua-tion of management alternatives, it does not provide more comprehensive information about theoverall result of a given project or policy change. All of the proposed management strategies as-sessed in the NOAA plan affect some aspect of Sanctuary resources, either directly or indirectly.
Sanctuary resources (both natural and historic) can be considered assets that produce a flowof goods and services with both market and non-market values to users and non-users. The con-cept of non-market value is significant to the Keys and its economy. The area’s natural resourcesare considered public resources, not common property or privately owned. Tradeoffs between theeffects of strategy implementation on economic values and economic impact are also pertinent tothe Keys. Restrictions may increase the costs of consumptive use; however, protecting a resourcemay not only increase its quality and value but also have a long-term economic benefit to bothconsumptive and non-consumptive users.
4 Alternative III was chosen as the Preferred Management Plan. Volume I of the Florida Keys National Marine Sanctuary, Draft Management
Plan/Environmental Impact Statement provides a description of the strategies recommended in the Management Plan. According to the selection
committee, the positive environmental impacts and associated beneficial economic impacts of the Preferred Alternative (Alternative III) outweigh
any potential negative impacts. Of the five alternatives, the one selected most closely meets the resource protection goals, while facilitating current
Sanctuary users and user activities.

Some of the proposed Sanctuary Preservation Areas will displace current commercial andrecreational fishers as well as tropical fish collection to non-zoned areas. This displacement mayresult in increased costs to fishers and consumers as well as decreased sales, employment, income,and tax revenues for the local economy dependent on this activity. However, the protection pro-vided to these areas may have economic value to non-consumptive users. Furthermore, if resourcedegradation can be halted or reversed, there may be long-term benefits for consumptive users.While the existing economic assessment attempted to take these types of tradeoffs into account foreach management strategy, it would be more informative to carefully consider how such an analy-sis is in fact operationalized. Such a consideration is one to examine in this exercise.
Reread this case study noting the economic values and costs that could be compared in abenefit-cost analysis.
1. What techniques would you recommend be used to measure the value of services identifiedabove?
2. What types of resource values are missing?
3. What data would you need to conduct these studies?
4. Give particular attention to the effects on displaced fishers versus fishers who are not dis-placed, as well as to the various other tradeoffs that are made.
5. How does this information differ from the impact assessment on Resource Protection Zonesprovided by NOAA?
CASE STUDY 3: FLORIDA KEYS NATIONAL MARINE SANCTUARY 87

COASTAL BARRIER ISLAND PRESERVATION
IN NORTH CAROLINA
Background
Old Baldy Island is a coastal barrier island in NorthCarolina.1 It is situated at the mouth of the Cape Buf-falo River, approximately three miles off the coast ofNorthport and about 30 miles south of Wilmatown, thefourth largest city in the state. Old Baldy Island is thelargest and southernmost of a series of small islands con-nected by extensive salt marshes that form an areaknown as Smith Island. It comprises approximately13,000 acres including upland, tidal marshes and creeks,shallow bays, and marshland. The island is 3-1/2 mileslong and 1-1/2 miles wide and features a moderate cli-mate often referred to as subtropical. The Old Baldy Is-land Lighthouse, built in 1817, serves as the Island’slandmark — it is North Carolina’s oldest lighthouse.
Located on the island is the Old Baldy Planned UnitDevelopment, primarily a second home development; itis somewhat of an island retreat in that its access is lim-ited to a privately operated ferry system which providesaccess to the mainland. While there are a limited num-ber of year-round residents (approximately 60 at pres-ent), some 1,200 families have homes there. The neigh-borhood is less than 50 percent developed.
THE MARITIME FOREST. Old Baldy Island ishome to a maritime evergreen forest. It is a globally im-periled forest community located on old stabilized dunesand flats protected from saltwater flooding and the most
CASE STUDY 4: COASTAL BARRIER ISLAND PRESERVATION IN NORTH CAROLINA 89
C A S E S T U D Y 4
Situation
A barrier island with a smallyear-round population and a largenumber of seasonal home ownershas the potential of greater devel-opment. The island is also home toa unique forest community as wellas other rare fauna. State plans topurchase large tracts of the islandfor preservation must consider theeconomic impact of shutting downfurther development that suchpreservation would entail and thealternative of purchasing a similartract for preservation on anotherisland.
1 While this case study is based on a real situation, place names and some facts have been modified for the purposes of the example.

90 ECONOMIC VALUATION OF NATURAL RESOURCES: A HANDBOOK
extreme salt spray. Encompassing approximately 355 acres, it is the largest in the state and still hasundeveloped, natural transition zones from ocean to sound. The topography is that of a dune ridgeand swale system: the ridges are broad and they slope gently into even broader swales, which canbe wet or dry, depending on local drainage patterns. The natural communities associated with thePhase I site include salt marsh, interdunal ponds, pine lowlands, palmetto lowlands, and non-forested freshwater wetlands.
While the State has been working closely with local officials to minimize impacts from devel-opment on the maritime forest, even low-intensity development on Old Baldy Island will tend tofragment the high-quality maritime forest communities. The proposed actions would precludeeven lower density development.
A special Maritime Forest Advisory Committee, set up by the North Carolina Coastal Re-sources Commission in 1990, recommended that the few remaining high quality tracts of maritimeforest be acquired and managed for conservation purposes. The committee ranked the undevel-oped maritime forest on Old Baldy Island among the top two or three maritime forests in NorthCarolina in terms of natural area values such as ecological integrity, uniqueness, diversity, rarespecies, size, and historical significance. Nags Head Woods and Buxton Woods are the two otherareas of significant natural value and these two areas have already been acquired for conservationpurposes.
VEGETATION. The Island is home to several species of plants that are unique. One of these isa plant commonly known as the Old Baldy Blue Curl, a small indigenous plant in the mint family.A significant feature of the forest is the many extremely old trees; they include palmettos, pines,cedars, oaks, and dogwoods. The undergrowth throughout the forest is quite dense with many vinespecies. The most common of the understory shrub layer are Red Bay, Wild Olive, Prunus carolini-ana, and French Mulberry. The Island also harbors two moss species, Beach Moss and Cubanscheliessmund that are recognized as “critically imperiled species.” Other plants that fall within the“critically imperiled species” designation are the Tough Bumelia and the Piedmont Flatsedge. Fi-nally, the dunes and cape at Old Baldy are host to a newly identified species, Dune Blue Curl,which is a candidate for state and federal protection.
WILDLIFE. Old Baldy Island is North Carolina’s most popular nesting area for the endangeredloggerhead sea turtle, which lays its eggs along the island’s 14-mile oceanfront. The Old BaldyConservancy has a successful sea turtle conservation program which claims a 95 percent hatchrate. Other fauna of the island complex include alligators, raccoons, large numbers of tern andgulls, over-wintering brown pelicans, and migrating peregrine falcons. The freshwater ponds andmarshes are used heavily by water birds, as are the extensive marshes, tidal creeks, bays, and mud-flats. Nearby Battery Island is North Carolina’s largest breeding rookery for egrets, herons, andibises.
Proposal for PreservationTo preserve maritime forest, the state of North Carolina is considering purchasing land cur-
rently scheduled for development. In Phase I of the proposed preservation plan, the State will ac-

quire approximately 125 acres of the remaining core maritime forest. In Phase II, the State willwork to acquire as much of the remaining undeveloped maritime forest and associated wetlands aspossible. It is anticipated that Phase II will include the purchase of additional areas along the un-developed estuarine shoreline. North Carolina is also considering acquisition of an ocean frontsection that would protect a portion of the island from ocean to sound.
The Old Baldy Phase I Purchase Tract is an irregular shaped area of 96.80 acres. The Pur-chase Tract can be generally characterized as a gently rolling and heavily wooded maritime forest.The plan would include a Maritime Forest Protection Overlay District, protective salt spray shearzone vegetation, forest wetlands, and relic dunes and dune ridges. In addition, there would be aprohibition against the removal of trees and shrubbery (except as necessary), the filling of wetlandsand ponds, and on-street parking. In addition, all construction would need to be contained to pre-vent runoff. To protect against the potential of introducing harmful exotic plants, only permissibleplants would be allowed. The maximum lot coverage for structures, including all impervious sur-faces, would not be allowed to exceed: (1) 25 percent of a building lot less than 9,000 square feet;(2) 50 percent of a lot less than 9,000 square feet in residential lots; (3) 60 percent of a commer-cial service or multi-family lot.
Economic Considerations
Implementing the proposed Old Baldy Island Phase I purchase would reduce the community’sad valorem tax base by approximately $10 million, the purchase price of the land. Based on thecurrent rate of development and the type of development that has occurred, approximately 50housing units with property values of approximately $7.5 million would be added per year, if thereare no restrictions. Because of the seasonal nature of most of these residences, each of the addi-tional residential units, if developed, would be anticipated to result in $250 per month in directexpenditures in the local community during the winter season (October-February) and $1,000 permonth during the summer season. It has been estimated that the addition of more than 200 newresidential units would result in the need for increased local public servants including one addi-tional police officer, one fireman, and several municipal maintenance staff persons.
Exercise
The Old Baldy purchase is only one active maritime forest preservation option available tothe State of North Carolina. Another is to purchase a similarly sized tract of maritime forest landon Little Barrier Island, also in North Carolina. The purchased land would become a nature pre-serve protected from development. The Old Baldy Little Barrier Islands are very similar — themain differences are smaller loggerhead sea turtle nesting areas and the absence of palmetto palmtrees and beach moss on Little Barrier Island. Little Barrier Island also lacks the historical signifi-cance of Old Baldy Island, home of the Old Baldy Island Lighthouse and Captain Charlie’s Stationcottages built in 1903.
Little Barrier Island has extremely limited development, with no existing plans for additionalconstruction activity. For this reason, purchasing the land is estimated to cost $2 million. Since
CASE STUDY 4: COASTAL BARRIER ISLAND PRESERVATION IN NORTH CAROLINA 91

92 ECONOMIC VALUATION OF NATURAL RESOURCES: A HANDBOOK
the land on Old Baldy Island is scheduled for development, its purchase price is expected to beroughly $10 million, the appraised value of the land. Given this information consider the follow-ing questions:
1. Suppose your agency is trying to decide between purchasing the land described above onOld Baldy Island and the similarly sized tract of maritime forest land on Little Barrier Is-land in North Carolina. Which tract of land would you recommend trying to purchase?
a. What additional information would you want?b. Does the schedule for development affect your decision?c. What operations other than purchase might be available (zoning, legislation,
takings)?
2. Which economic approach in this handbook would you typically use in evaluating the OldBaldy Island maritime preservation proposal?
3. How would the various economic approaches be of use to others in the decision process?a. Developers b. Local agencies making decisions regarding supporting public investment decisionsc. Interest groupsd. Public at largee. Federal regulators/decision-makers
4. The residential development on Old Baldy is “upscale,” but is protected by covenants andzoning restrictions. Transportation around the island is restricted to electric golf carts.Plants may not be introduced unless they are on a list of permissible shrubbery. Restrictionsalso exist limiting all impervious structures. You have responsibility for the enforcement ofzoning laws related to the environment. Two homeowners have approached you with aproposal. One, for aesthetic reasons, prefers not to pave his driveway. The other wishes topurchase her neighbor’s “right to pave” in order to build a tennis court on her property. Proponents of this proposal applaud the flexibility that allowing “tradable paving rights” af-fords. Property values could rise if residents are permitted to build tennis courts and otheramenities on their land. They also note that less pavement would exist than if the twohomeowners had paved driveways. Those opposed to the change argue that existing resi-dents originally did not have a choice between paving a driveway, building a tennis court,and selling their rights. Further, they argue, the right to pave is an intrinsic part of theproperty and cannot be transferred. Finally, they fear that this is an attempt to abolishpaving limitations altogether.
a. Should residents be allowed to sell paving rights?b. How would you deal with the right of a future homeowner to pave his driveway if
the previous owner has already sold the rights?c. Should your agency attempt to regulate the price for which paving rights will sell? If
so, what will you consider in setting that price?d. What problems might arise from setting such a price?

ARTIFICIAL REEF PROGRAM IN
LAKE ERIE, OHIO
Background
Artificial reefs are synthetically constructed under-water structures — they may be rock, sunken ships, autobodies, rubber tires, and wood. Designed for structurelessbottom areas in either fresh or salt water environments,they provide habitat for fish, habitat that includes food,shelter, protection, and spawning areas. Drawn by thenew habitat, fish concentrate in these areas. Often arti-ficial reefs are strategically placed at various depths andare built to particular heights to attract a specific speciesof fish.
Artificial reef construction may be a community ef-fort, with technical assistance provided by state and fed-eral agencies. Recreational fishing reefs are placed nearaccess areas such as launch ramps and marinas and in lo-cations where they will not interfere with navigation andcommercial fishing activities.1 Artificial reefs have beenconstructed all along the U.S. coast in salt water and inmany inland lakes and reservoirs. Artificial reef programshave been implemented in many coastal states, e.g.,Georgia, Florida, California, Texas, Alabama, Virginia, New Jersey, South Carolina, and Delaware.
Studies indicate that when artificial reefs are constructed with proper materials, placed ingood locations, and developed with a specific purpose and plan, they can enhance sustainable fish-eries. Research in South Carolina, for example, attributes increases in time spent fishing andcatch rates to the presence of artificial reefs. In many areas, new aquatic communities created bythe artificial reefs draw increased numbers of recreational and commercial fishers and scuba divers— one result is travel and tourism dollars brought in by visiting anglers and their families, thusleading to positive economic impacts to local communities.
CASE STUDY 5: ARTIFICIAL REEF PROGRAM IN LAKE ERIE, OHIO 93
C A S E S T U D Y 5
SituationArtificial reefs can be used for en-hancing fisheries and economic ac-tivity by providing the structurefor new fish habitats. Reefs placedin different locations in Lake Erieare demonstrating that improvedfisheries habitats lead to increasedrecreational fishing.
1 Kelch, D. O. and J.M. Reutter. 1991. Lake Erie’s Artificial Reef Program. Ohio Sea Grant Program, OHSU-FS-021.

94 ECONOMIC VALUATION OF NATURAL RESOURCES: A HANDBOOK
Artificial Reef Program
Ohio’s Lake Erie is the warmest, shallowest, and most productive of the Great Lakes; its west-ern basin is known as the “walleye capital of the world” and produces more walleye per hectarethan any other lake in the world. Historically, the western basin walleye fishery has made up themajor component of Ohio’s primarily recreational sport fishery.2 As a result, Ohio’s north coasthas developed into a major recreational economy. The historical predominance of the walleyefishery within the western basin of Lake Erie is also the result of easy access to areas where the fishcongregate.
Unlike the western basin, the central basin is deeper and larger — it also lacks the produc-tive bottom structures that provide habitat for fish. These features, combined with the fact thatschools of walleye are often located further from shore, make the walleye more difficult to locate inthe central basin. Access for boat anglers is another difficulty: the rocky bluff and high bank ter-rain of the central basin impedes the construction of marinas and launch ramps, which are readilyavailable to boat anglers in the western basin. As Kelch and Reutter point out, while there aremany excellent fishing areas in the central basin, not all are within safe running distance for small-er boats. Fishery managers have recognized that construction of artificial reefs strategically locatedin areas easily accessible to boat anglers could attract greater numbers of anglers in the centralbasin. Furthermore, if the artificial reefs yield the expected results — attracting fish and thus in-creasing angler participation and catch rates — the fishery’s role in helping develop a recreationaleconomy in the Central Basin communities could be enhanced.
Ohio began an artificial reef project in 1986. While artificial reefs have been planned forthe entire shoreline of Ohio, the central basin presently is the key area of development for reasonsoutlined above. The U.S. Army Corps of Engineers has granted permits for five sites. To date, tworeef structures have been constructed — the Lorain County reef and the Cuyahoga County reef.The purpose of the reef project is to create a demonstration project to evaluate the productivityand feasibility of reef construction in other areas of Lake Erie and the other Great Lakes. Evalua-tion of the demonstration project’s effects on recreational activity and the expected effects of simi-lar reef structure in other coastal areas are priority needs for sustainable coastal development policyof the central basin.
The Lorain County reef consists of two reef structures, one about 370 meters long and thesecond about 183 meters long. The Cuyahoga County reef, also known as the Cleveland site, ismade up of one reef structure 213 meters long in 8.5 meters of water and a series of unconnectedsandstone “rubble piles” in deeper water. The reefs were constructed from scrap rock and concreteand are located within close proximity to ports of shelter, an advantage for smaller vessels.
The Ohio artificial reef project plans to construct additional reefs in Lake and AshtabulaCounties, but the construction is awaiting scientific evaluation of the completed structures. Theonly evidence available regarding the ecological and economic benefits of the artificial reefs hasbeen anecdotal information from various anglers who report successful fishing within proximity to
2 Lake Erie’s total 1993 fish harvest yielded 12.9 million pounds of fish, only 4.3 million pounds of which were caught by commercial fish producers.
The bulk of the harvest (8.6 million pounds) were caught by recreational sport and charter boat anglers.

the reefs and some underwater videos taken in 1989 and 1990. No formal scientific data demon-strating the success of the structures has been gathered. According to Dave Kelch, District Spe-cialist with The Ohio State University’s Sea Grant Program and the project’s director, research isneeded for both the scientific community’s acceptance of the artificial reefs and for interestedshoreline communities.
Costs and Benefits of the Artificial Reef Program
COSTS. Ohio’s Artificial Reef project has been financed by the local communities, fishing pub-lic, local government, local business and industry, and fishing tackle companies. Donations ex-ceeded $100,000, the majority of which has been used to pay marine contractors for materialsplacement (more than 7,000 tons of material were used to build the reefs at the Lorain site and atotal of about 6,800 tons were used to construct the reefs at the Cleveland site). Much of the pro-ject supervision, fund raising and donation procurement, and materials site inspection was con-ducted by volunteers from the North Central Sea Grant Advisory Committee. Overall project su-pervision and monitoring was the responsibility of the Sea Grant District Specialist, which resultedin no monetary outlay for these services.
According to Kelch and Reutter, only $10,000 of state and federal dollars were made avail-able. Because of the donation of material, dollars, services, and labor, exact costs for the construc-tion of artificial reefs are difficult to assess. Estimates are that the cost of placement varied from $6to $14 a ton (based on 1984 to 1989 costs) depending on the contractor. Small, non-union con-tractors fees averaged $7.50 a ton, while unionized contractor fees were as much as $14.8.
BENEFITS. One rationale for the Ohio Artificial Reef project is to improve the integrity of thecentral basin area. In the past, eastern Ohio waters have been plagued by heavy pollution. At onetime the situation was so bad that the surface of the Cuyahoga River ignited. Since then, environ-mental enhancement measures have significantly improved water quality. Residents of the centralLake Erie region wanted assurance that the central basin could provide water-related recreationalpleasures similar to those available in the western basin. The construction of artificial reefs hasbeen perceived as an effective strategy to improve the area’s character.
Additional gains to local small boat anglers are also expected: anglers should experience in-creases in recreational fishing value as a result of the new, productive, quality fishing sites withinclose proximity to sheltered ports. In addition, communities as a whole should benefit from someincreases in tourist-related activities resulting from improved sportfishing opportunities.
Preliminary Analysis and Evaluation of the Artificial Reef Program
While scientific analysis of the effects of artificial reefs on fish production has not been con-ducted, data on angler hours and catch rates indicate that walleye harvests have increased substan-tially over the last two decades (Case Table 5.1).
Two research efforts began in 1992 to evaluate the success of the artificial reefs. The aim of
CASE STUDY 5: ARTIFICIAL REEF PROGRAM IN LAKE ERIE, OHIO 95

96 ECONOMIC VALUATION OF NATURAL RESOURCES: A HANDBOOK
one was to determine the fish concentration ability ofthe reefs; towards this end, an underwater video assess-ment was conducted at the Lorain artificial reef site.This effort involved monthly dives at both the reef siteand a non-reef control site to identify and enumeratefish as well as to determine habitat differences. Analy-sis reveals that the 1992 and 1993 total seasonal num-bers of fish were significantly higher at the reef sitethan at the control site. Thus, the reefs appear to beeffective as a fish concentration device.3
The second research effort to evaluate the effec-tiveness of the reefs sites was designed to identifychanges in social and economic values resulting fromthe artificial reef project. In 1992, survey data werecollected from a random sample of individuals at vari-ous launch sites and marinas regarding their recre-ational use and expenses on Lorain County waters.Initial analysis reveals that 87 percent of the 466 re-spondents (55 percent response rate) knew about thereef and 64 percent of these individuals used the reefduring 1992.
The typical respondent made 20 trips to LorainCounty waters during 1992 and 7.1 of those trips in-volved fishing out at the artificial reef for at least partof the trip. Of those respondents who traveled lessthan 40 miles to Lorain County, more than two-thirdsused the artificial reef. Of those who traveled 40 ormore miles to Lorain County, less than one-half usedthe artificial site. These figures indicate that the artifi-cial reef use is dominated by local sport anglers, asintended.4
Exercise
This case study suggests that there are significant potential economic benefits beyond posi-tive economic impacts from the construction of artificial reefs. Fishery managers of the Lake Erieregion have expressed satisfaction with the artificial program thus far. It has been highly visibleand generated much enthusiasm within the local sport-fishing community. Many believe that thereef has also helped improve the integrity of Lake Erie’s central basin. Given the information pro-
Case Table 5.1. Walleye sport boatharvest in Ohio, 1975-1993.*
Year Walleye(thousands)
1975 861976 6381977 2,1711978 1,5961979 3,2881980 2,1651981 2,9321982 3,0131983 1,8461984 4,0381985 3,7301986 4,4001987 4,4381988 4,8901989 4,1921990 2,2831991 1,5781992 2,0821993 2,669
*Fish Ohio. Division of Wildlife. 1993.Ohio’s Lake Erie — 1993 Sport andCommercial Harvests.
3 The Cleveland site is currently being investigated utilizing the video technique.
4 Glenn, S.J., D.O.Kelch, and L.J. Hushak. 1994. Economic Evaluation of the Lorain County Artificial Reef in 1992: An Overview. Ohio Sea
GrantProgram. Technical Summary OHSU-TS-022.

vided above, outline the economic analysis that you would recommend be included in an environ-mental impact statement of other similar reef programs. Use the following questions as a guide:
1. What type of economic analysis would be appropriate in determining whether to proceedwith an artificial reef project?
2. Some believe environmental valuation, which would assess the benefits of artificial reefprojects to society, should be standard protocol in all planned artificial reef projects withinthe Great Lakes. Do you agree?
3. Assuming adequate cost information exists, what sorts of value information would you needto assess in order to conduct a benefit-cost analysis of an artificial reef project?
4. What methodologies or techniques would you recommend for each of the value categoriesidentified above?
5. Fish and fishers move. How would you account for this movement in your analysis ofchanges in commercial or recreational fishing values?
6. Which of the various economic approaches described in this handbook would be used bydifferent stakeholders in the policy decision process?
• Developers• Local agencies making decisions regarding public investments• Interest groups• Public at large• Federal regulators/decision makers
7. How would economic information be developed and presented by each group?
CASE STUDY 5: ARTIFICIAL REEF PROGRAM IN LAKE ERIE, OHIO 97

CASE STUDY 6: RED SNAPPER FISHERY MANAGEMENT IN THE GULF OF MEXICO 99
RED SNAPPER FISHERY MANAGEMENT
IN THE GULF OF MEXICO
Background
In 1984 the Gulf of Mexico Fishery Management Councilimplemented the Reef Fish Fishery Management Plan —its goal was to manage the reef fish fishery with the Gulffor attaining the greatest overall benefit to the nation. In1988, a National Marine Fishery Service (NMFS) stockassessment indicated that red snapper was significantlyoverfished and that reductions in fishing mortality ratesof as much as 60 to 70 percent were necessary to rebuildred snapper stocks to a recommended 20 percent spawn-ing stock potential ratio. The 1988 assessment also iden-tified shrimp trawl bycatch as a significant source of juve-nile red snapper mortality.
In response, the Fishery Management Council amend-ed the 1984 Fishery Management Plan. The 1990Amendment 1 provided for a commercial quota of 3.1million pounds of red snapper. In 1991, the Total Allow-able Catch (TAC) was set at 4.0 million pounds with acommercial quota allocation of 2.04 million pounds and arecreational daily bag limit of seven fish (1.96 millionpounds). The 1991 Regulatory Amendment also con-tained an intent by the Council to establish a 50 percentreduction of the offshore shrimp trawler fleet snapper by-catch in 1994.
Despite the intent of the 1991 Regulatory Amendments, the effort capacity for the commer-cial red-snapper fishery continues to be excessively high, given current quota levels, as evidencedby the 2.04 million pound quota (1992) being filled in just 53 days. Under Amendment 6 of theReef Fish Fishery Management Plan, a quota increase to 3.06 million pounds provided some bene-fits but did not prevent a derby fishery from developing. Under the same quota, the 1994 seasonlasted for 77 days.
C A S E S T U D Y 6
SituationDeclines in red snapper stocks inthe Gulf of Mexico have impactedcommercial and recreational fish-ers. Among the potential manage-ment plan options is the use of In-dividual Transferrable Quotas(ITQ). While ITQs have been em-ployed within the commercial fish-ery sector, questions arise as totheir applicability within therecreational sector.

100 ECONOMIC VALUATION OF NATURAL RESOURCES: A HANDBOOK
In reaction to the current conditions in the red snapper fishery the Gulf of Mexico FisheryManagement Council is now considering a proposed Amendment to the existing Reef Fish FisheryManagement Plan1. Alternatives in this amendment include a proposal to establish a comprehen-sive effort management program for the red snapper fishery. The alternatives under considerationinclude:
1. No action (a system with additional effort controls beyond those currently allowed in theFishery Management Plan’s framework procedure for setting total allowable catch)
2. License limitation
3. Individual Transferable Quotas
Individual Transferable Quota Management System
The Council has identified an Individual Transferable Quotas scheme as the preferred alter-native. An ITQ program would involve issuing either a certain poundage or percentage of the to-tal annual commercial allocation of red snapper to each qualifying owner or operator, based on hisor her historical landings in the fishery. This poundage or percentage would be that person’s ini-tial share. Shares would be the property of the shareholder, probably subject to annual administra-tive fees for issuing coupons and for transfers of shares. Shares or quota coupons would be trans-ferrable. Under an ITQ system, a “bycatch” allowance for red snapper would not be needed—anyone who wanted to sell any red snapper would be required to have quota coupons in theamount of red snapper landed for sale.
The expectations are that an ITQ program will result in increased revenues to the fishing in-dustry as well as decreased total costs of harvesting. In addition, ITQs will afford fishermen greaterflexibility by adjusting their share holdings and determining when they will go fishing. Fishermenwho choose to exit the fishery may receive economic benefit if they sell their share of harvestprivilege.
Under limited access alternatives, fishers would receive specific privileges to participate inthe red snapper fishery based on an initial allocation scheme. Fishers who desire to subsequentlyenter or increase their participation in the fishery could do so only in conjunction with anotherfisher who decreases his or her participation or leaves the fishery. Thus, allocation of the commer-cial quota among users would be self-adjusting and ideally would be independent of measures toachieve or maintain the biological goals of the Fishery Management Plan. Unlike limited access,open access systems have no limits on the number of fishers in the fishery or the amount of fish
1 GMFMC. 1994. Draft Amendment 8 and Environmental Assessment (Effort Management Amendment) to the Reef Fishery Management Plan ofthe Reef Fish Resources of the Gulf of Mexico

any fisher can harvest in a season. Allocation among commercial fishers and total annual harvestare treated as a single combined issue and are controlled by limits on short-term effort or vesseltrip limits to spread out the harvest.
Costs of an ITQ System
Costs under ITQ management will be higher than under the other proposed alternative sys-tems largely due to the need for increased enforcement and the extensive records and tracking sys-tem for coupons (or similar accounting devices) and ITQ shares. If law enforcement can be in-creased only to the level necessary to enforce current regulations or license limitation systems,then the additional cost is estimated at $450,000 (Case Table 6.1). However, for “full” compli-ance, defined to be a compliance level of about 90 to 95 percent, the cost will be $1,540,000.Therefore, depending on the level of compliance desired or necessary to realize a substantial por-tion of the benefits which are possible under an ITQ program, the enforcement costs will be cov-ered by the range just described.
The public burden costs will be $67,000 initially and $64,000 annually thereafter. The Na-tional Marine Fisheries Service’s (NMFS) costs to design and maintain the ITQ system are esti-mated to be $230,000 for the first year and then $145,000 annually. The estimate of total costs forthe ITQ program, which includes the Council and NMFS administrative costs will range from$1.17 to $2.26 (Case Table 6.2) million the first year and from $659,000 to $1.75 million annually,depending on the level of law enforcement. Case Tables 6.1 and 6.2 summarize the differences incost between maintaining the status quo or imposing license limitations on the fishery.
Benefits
Changes in revenue to the commercial red snapper fishery are predicted based on historicalprices and expectations of how different management systems will affect overall prices. In brief,the status quo is expected to result in an overall price decline of $.15 to $.40 per pound. The li-cense limitation program is not expected to have much effect on current prices. The ITQ systemcan be expected to generate a price increase ranging from $.85 to $1.35 per pound based on thelevel of law enforcement. No information is available on the changes in benefits to recreationalfishermen.
Exercise
The Gulf reef fishery is a multispecies fishery with two major user groups, namely, the recre-ational and commercial sectors. In 1991, the recreational sector caught about 52 million poundsof fish in the Gulf, of which no less than 13 million pounds may be considered reef fish species un-der the management unit of the fishery plan. For this same year, about 1.6 million individuals(coastal and non-coastal) participated in marine recreational fishing in the Gulf region, and about
CASE STUDY 6: RED SNAPPER FISHERY MANAGEMENT IN THE GULF OF MEXICO 101

102 ECONOMIC VALUATION OF NATURAL RESOURCES: A HANDBOOK
Case Table 6.1. Costs associated with different management regimes for red snapper.
Status Quo License Limitation ITQ
Council/NMFS administrative costs $339,884 $339,884 $339,884
Initial public burdencost to apply for permits 2,000 3,000 3,000
Annual public burden costs tomaintain management system 28,000 32,000 64,000
Initial NMFS costs to design andimplement management system 0 20,000 85,000
Annual NMFS costs to maintainmanagement system 30,000 42,000 145,000
NMFS law enforcement costs toachieve acceptable compliance1 450,000 450,000 450,000
to1,540,000
Coast guard enforcementN.A.2 N.A. N.A.
Start-up plus first year 849,884 906,884 1,171,884to
2,261,884
Continuing annual cost 508,000 524,000 659,000to
1,749,000
1 Current level of expenditure is estimated at $400,000. Additional $450,000 is required for any of the major alternatives.2 To be estimated.
SOURCE: Gulf of Mexico Fishery Management Council, Draft Amendment 8 and Environmental Assessment to the Reef Fish Fish-
ery Management Plan for the Reef Fish Resources of the Gulf of Mexico, 1994.

15.5 million fishing trips were made by the recreational fishers. There are no current estimates onthe economic value of the recreational reef fishery in the Gulf.
In 1991, the commercial sector landed approximately 21.1 million pounds of reef fish with anex-vessel value of $34.6 million2. In 1992, the commercial reef fish sector was composed of about2,214 reef fish permitted vessels. Because of the moratorium on issuance of additional commercialpermits implemented in May 1992, the number of permitted vessels could not significantly bemore than the 1992 number. This moratorium is intended to remain in effect through 1995 unlessearlier supplanted with a comprehensive limited access management system or extended by theSecretary of Commerce upon recommendation of the Gulf Council.
A major question facing the Gulf of Mexico Fishery Management Council is this: If an ITQprogram for red snapper is developed, how will the initial quota be allocated between commercialand recreational fishers? All of the existing ITQ systems are designed to manage fisheries that aredominated by commercial fishing. There is no reason, however, why ITQs could not be used inrecreational or combined commercial/recreational (or mixed) fisheries such as the red snapper fish-ery. As in commercial fisheries, problems of unlimited entry and inefficient allocation to low val-ued users can be overcome through the transfer of catch rights in the recreational fishery.
Theoretically, recreational fishers who have a high value for the resource could buy catchrights from other recreational fishers or from commercial fishers. Similarly commercial fisherscould increase their individual share of total allowable catch by buying catch rights from recre-ational fishers. These sales of catch rights could be for part or all of a year or for the duration ofthe ITQ system. Although each group has a different motive for participating in the fishery, trans-fers of shares between different user groups would direct the share of rights to the most valued use.As a result, all harvest shares could be owned by either commercial or recreational fishers if theyare willing to buy the harvest rights. If fishery managers decide that they want to preserve someportion of the total catch for a particular group of users then some of the catch shares can be ex-empt from trading.
The Council has three options. It can create ITQs for: (1) the commercial fishery only withrecreational harvest regulated through bag limits and season closures; (2) a single class of ITQshares for both commercial and recreational sectors with no restrictions on transfers between com-mercial and recreational fishers; or (3) two separate classes of ITQ shares — one for the commer-cial sector and one for the recreational sector. Separate subgroups within a recreational share classfor certain groups of recreational fishers such as headboats, party boats, or other identified recre-ational groups could be established.
The rationale for these subgroups would be to protect certain recreational groups such asheadboats or to protect stocks in specific areas. Alternatively, the initial allocation of ITQ sharescould be used to address specific distributional concerns about recreational share ownership and al-low full transferability to determine the most desirable pattern of share ownership.
Suppose that you are on the Gulf of Mexico Fishery Management Council. You are taskedwith establishing a preferred option regarding initial allocation of ITQ shares within the currentred snapper fishery. Consider the role of environmental valuation in your analysis of options. Us-
2Waters. J. 1992. Economic Assessment of the Commercial Reef Fishery in the U.S. Gulf of Mexico. NMFS Beaufort Laboratory, Southeast Fish-
eries Science Center, Beaufort, NC.
CASE STUDY 6: RED SNAPPER FISHERY MANAGEMENT IN THE GULF OF MEXICO 103

104 ECONOMIC VALUATION OF NATURAL RESOURCES: A HANDBOOK
Case Table 6.2. Costs and benefits from alternative forms of management for red snapper.
Cost or Benefit Status Quo License Limitation ITQ
Change in expected Decrease of Not much change Increase ofannual revenue based $450,000 to $2,550,000 toon quota of three $1,200,000 $4,050,000million pounds
Change in cost of Significantly Not much change Significantlyharvesting higher lower
Effect on stockrecovery affectinglong-term revenues:
Low enforcementeffort Negative None NoneHigh enforcementeffort Negative None Positive
Public and private $849,884 $906,884 $1,171,884costs to implement to
$2,261,884
Continuing public $508,000 $524,000 $659,000private annual costs to
$1,749,000
Relative overall Significantly Not much change Significantlychange in net negative higher but benefits similar for
each level oflaw enforce-ment.
SOURCE: Gulf of Mexico Fishery Management Council, Draft Amendment 8 and Environmental Assessment to the Reef Fish Re-
sources of the Gulf of Mexico, 1994.

ing the following questions as a guide, outline the study you would request of the Council staffeconomist or outside contractor.
1. What information would be needed regarding the economic benefits of each allocationstrategy in order to make a well-informed decision?
2. What natural resources services should be analyzed?
3. What techniques would you recommend in order to determine the values of these resourcesand services?
4. What are the limitations to the existing methodologies in this case?
5. What discount rate would you recommend in a benefit-cost analysis of each allocation al-ternative?
6. Based on your hypothetical stakeholder perspective, the information given, and your hypo-thetical “back-of-the-envelope” benefit-cost calculations, what option would you recom-mend as the preferred allocation option?
CASE STUDY 6: RED SNAPPER FISHERY MANAGEMENT IN THE GULF OF MEXICO 105

WETLAND RESTORATION IN LOUISIANA
Background
The Louisiana coastal zone is one of the Na-tion’s foremost geological, biological, and culturalresources. Containing 40 percent of the country’scoastal wetlands, it includes 2.5 million acres ofmarshes (fresh, brackish, and saline) and 637,400acres of forested wetlands. The Louisiana coastalzone, created by the Mississippi River, is the mostactive deltaic land mass in North America, drain-ing 40 percent of the 48 contiguous states and sub-stantial areas in the Canadian provinces.1
Between 50 to 75 percent of Louisiana’s resi-dents live within 50 miles of the coast. These in-habitants benefit from the numerous resources andresource services that wetlands provide. They arethe source of livelihood to a substantial number ofpeople including fishers and foresters. Even thosewho do not depend economically on marshes ben-efit from the hurricane and flood protection theyprovide through absorption of storm surges andmitigation of flood damage. The coastal zone alsoserves valuable water quality treatment functions.
1 Coastal wetland formation: The land forms within the coastal zones (with the exception of salt domes) were formed as a result of the dynamic in-
teractions between river deposition, waves and currents, and subsidence. Over the past several thousand years, the Mississippi River has periodically
changed course. This “delta switching” causes some areas of land to build while others deteriorate. When the river shifts into a new channel, land is
built rapidly. The river builds a delta out into shallow shelf areas until its course becomes long, sinuous and inefficient, at which time it changes
course to follow a shorter, more efficient route to the Gulf. It is this change which switches the location of the delta. The periodic switching has re-
sulted in a series of delta lobes in various stages of abandonment and deterioration. These lobes, deprived of riverine sediment, slowly break up and
erode. However, because a new delta was always building, a natural balance between sinking and accretion existed. At any one location there could
be land gain or land loss. In fact, for the past 5,000 years, there has been a net coastal land gain in the Mississippi deltaic plain of between one and
two square miles a year. However, the natural cycle of deltaic development — the continuous building and eroding of river basins — is no longer
operative today due to human intervention (Coastal Resources Program-Louisiana Department of Transportation and Development. 1978. The Val-
ue of Wetlands in the Barataria Basin).
CASE STUDY 7: WETLAND RESTORATION IN LOUISIANA 107
C A S E S T U D Y 7
SituationCoastal wetlands in Louisiana play an es-sential role in the vitality of commercialand sport fishing and recreational hunt-ing. But these wetlands are being devas-tated by a host of continuing humanactivities that range from populationgrowth to artificial levees for flood con-trol to the mining of offshore oil fields.Wetland restoration is critical and posesdifficult choices that must take into ac-count short and long-term costs.

108 ECONOMIC VALUATION OF NATURAL RESOURCES: A HANDBOOK
While the natural beauty and abundant wildlife of the wetlands attract tourists from all over thecountry, the region possesses a unique cultural diversity that includes Native Americans, Europeanimmigrants, and Cajun ancestry.
Commercial importance of the Louisiana coastal wetlands includes major economic activitiesrelated to commercial fishing, recreational hunting, and sport fishing. Fishing is Louisiana’s oldestindustry and its prominence is directly attributable to the area’s extensive marsh and estuarine sys-tem.2 The region supports the largest coastal finfish and shellfish fisheries in the country, produc-ing two billion pounds of fish and shellfish annually. The Louisiana Wildlife and Fisheries Com-mission issued over 63,000 commercial fishing licenses in 1985, including almost 16,000 commer-cial shrimp licenses. The recreational hunting and fishing activity of the region are also substan-tial. The Louisiana coastal zone leads the Nation in trapping of fur-bearing animals and operates ahighly regulated harvest of alligator skins.3
Coastal Wetland Decline — Causes and Conflict
For decades artificial levees, managed by the U.S. Army Corps of Engineers with Congres-sional, State, and public support, have confined the Mississippi River to its present channel, pre-venting a change of course and the associated development of new delta regions. The purpose ofthe levees is to contain overflows for navigation and flood control. However, the ecological bal-ance and productive capacity of the adjacent wetlands are adversely affected by the lack of addi-tional fresh water and nutrient-rich material. The river control structures confine the sedimentsto the river channel and transport it to deep Gulf of Mexico waters so that most of these sedimentsare discharged over the edge of the continental shelf, forever lost to the sediment-starved coastalzone. In addition, the Mississippi’s tributary dams and other activities have significantly reducedthe sediment load carried by the river.
In addition to flood control activities, another major cause of coastal erosion is constructionof navigation, oil recovery, and access canals. Canals adversely impact the wetlands by interferingwith sheetwater flow, allowing destruction by wave action, reducing nutrient exchange, decreasinginterface, and increasing salinities. Spoil banks, created by the deposition of material dredgedfrom the canals also result in wetland deterioration. Approximately 8 percent of the marshes incoastal Louisiana have been converted to canals and associated spoil banks.4 Other activities, suchas land reclamation projects for agricultural, urban, and industrial purposes, have also destroyedmany acres of viable wetland. The pollution from toxic chemicals and oilfield brines contributesto wetland degradation as well.
Wetland loss due to flooding as a result of subsidence-related sea level rise is another prob-lem. Sea level rise occurs as land forms shrink, resulting in a relative rise in water level. Scien-tific evidence exists which suggests that sea level rise may accelerate significantly due to atmos-
2 Ibid., p. 36.
3 U.S. Department of the Interior. 1994. The Impact of Federal Programs on Wetlands, Vol. II. A Report to Congress by the Secretary of the Interi-
or. Washington, D.C., p. 143.
4 Coalition to Restore Coastal Louisiana. 1987. Coastal Louisiana: Here Today and Gone Tomorrow? A Citizens’ Program for Saving the Missis-
sippi River Delta Region to Protect Its Heritage, Economy, and Environment. Draft for public review, p. 10.

pheric warming resulting from the greenhouse effect.5 These rises would led to increased floodingand additional loss of coastal wetlands.6
The cumulative impact of human activities and natural processes on the coastal zone hasbeen devastating. At the turn of the century, coastal Louisiana contained 4.07 million acres ofwetlands. By 1978, 22 percent of the wetlands had been lost. Conservative estimates indicatethat another 3 million acres have been lost since then. Current loss rates are estimated to be about0.75 percent per year. It is projected that if losses are not reduced, another 167 million acres ofLouisiana coastal wetlands will disappear or be converted by the year 2000. These predictions in-dicate that the Gulf shoreline will advance inland as much as 33 miles in some areas. About 1,200businesses, residences, camps, schools, storage tanks, electric power substations, water controlstructures, and pumping stations would require protection or relocation. Furthermore, the U.S.Army Corps of Engineers estimates that without action to reverse projected wetland losses com-mercial fish and shellfish harvests will decline by 30 percent by the year 2040.7
The threatened disappearance of Louisiana coastal wetlands have potentially staggering eco-nomic, cultural, and environmental consequences. The loss of habitat for coastal fish, shellfish,and wildlife species would be colossal. The loss for social and cultural functions which depend onproper ecological functioning of the coastal zone would also be devastating. Furthermore, the pres-ent Louisiana coast would become uninhabitable as flooding moves further inland.
Coastal Wetland Restoration Management Plan
The prospective losses of wetland functions and services have motivated implementation of awetland restoration policy. That policy is based on the belief that technological ingenuity andmanagement can separate wetland destruction from some of the causes of that destruction, naviga-tion, flood control, oil and gas production, and urban development. The short-term costs of em-ploying advanced techniques and restoration strategies will undeniably be substantial; the long-term costs, however, of not employing environmental engineering technologies and not imple-menting management and restoration strategies may be far greater. A restoration program mightconcentrate on three tasks:
l. Enhancement of sediment and fresh water input into the coastal zone and capture of resus-pended sediments
2. Repair or restoration of disturbed wetlands and barrier island transacted by exiting canals
3. Phase-out and halt to construction or expansion of canals.
CASE STUDY 7: WETLAND RESTORATION IN LOUISIANA 109
5 Some scientists predict that sea level rise by 2075 may range from 38 to over 200 centimeters depending on the global level of combustion of fos-
sil fuels and emissions of other greenhouse gases.
6 Coalition to Restore Coastal Louisiana, op. cit., p. 10.
7 U.S. Department of the Interior, op. cit., p. 154.

110 ECONOMIC VALUATION OF NATURAL RESOURCES: A HANDBOOK
Benefits and Costs of Wetland Restoration Strategies
A wetland restoration policy for the Louisiana wetlands coastal zone must manage all of itsuses, both short term and long term. One key factor in developing a plan — recognition of theconflicts over multiple uses and societal tradeoffs — is determining the economic value of the wet-lands. Economic values provide a basis for realistic appraisal of the wide-ranging social impactsgenerated by various proposed restoration developments. Thus, the overall benefits and costs ofmaintaining and restoring Louisiana’s coastal wetland resources must be assessed.
A benefit-cost analysis can be conducted by assigning a dollar value to a unit-acre of wetland.However, the economic value of the services provided by wetlands is difficult to appraise due tothe lack of a market mechanism for directly pricing those functions. For example, the benefits de-rived from the wetland’s provision of food for commercial fish species and fur-bearing animals haveoften been ignored. Other values typically disregarded because of the difficulty in assigning eco-nomic value are recreational opportunities provided by the wetlands, such as hunting, crabbing,bird watching, swimming, and camping.8
Furthermore, the economic value of the protective services provided by wetlands, for in-stance, storm and flooding protection and the absorption of urban and agricultural waste products,are also difficult to assess, as are the option value and existence value. The option value is theamount which non-users place on a unique resource to know that it is there and could be used,while the existence value is the amount which non-users place on the knowledge that the wet-lands exist, even if they never intend to use them directly.
Despite the data and methodological limitations, analysts have developed several differentmethods by which to value wetlands, including (1) economic impact analysis (EIA); (2) willing-ness-to-pay (WTP); and (3) energy analysis (EA). These methodologies attempt to place econom-ic value on wetland-related activities and services. In general, some of the major services providedby wetlands can be classified into the following categories: commercial fishing, recreational fishing,commercial trapping, and recreation (subdivided into economic impact expenditures for recreationand the estimated value of user benefits related to recreational activity), and storm protection.
GROSS ECONOMIC CONTRIBUTION ANALYSIS. The gross economic contributionanalysis for wetland valuation focuses on the question of gross impact on the economy. In otherwords, values for major activities associated with wetlands are estimated on the basis of gross bene-fits to the economy. A per-acre value for each of the wetlands-dependent activities is determined,and the respective values are summed to derive the total estimated monetary worth of a wetlandacre in its natural state. Case Table 7.1 presents the estimated gross economic contribution of awetland acre in Louisiana’s Terrebonne Parish.9
8 Coastal Resources Program-Louisiana Department of Transportation and Development, op. cit., p. 85.
9 For consistency within the case study, the name of this coastal area has been changed. See the source, Coastal Resources Program-Louisiana De-
partment of Transportation and Development, op. cit., for additional information.

WILLINGNESS-TO-PAY (WTP). The willingness-to-pay approach to wetlands valuation isbased on the concept of consumer surplus — this is a measure of the amount a consumer would bewilling to pay to continue receiving the good or service, over and above what the consumer is al-ready paying. Thus, in the case of the Louisiana wetlands, WTP estimates the value of the wet-lands based on an evaluation of society’s willingness-to-pay to avoid the loss of an acre of wetlandsor wetland area. Theoretically, this estimate represents the maximum society would pay ratherthan do without. WTP assumes that the resources employed to produce the good are not part ofthe value of the resource but are transferable to other uses. The difficulty with the technique is inobtaining true estimates from all the potential beneficiaries for all the direct and indirect goodsand services provided by the wetlands. Costanza and Farber used WTP to assess the value of theTerrebonne Parish wetlands in Louisiana.10 Case Table 7.2 summarizes their estimates of theWTP valuation wetland service categories. Column 2 shows the annual values on a per-acre basis.The authors note that it may not be appropriate to place the storm protection values on a per-acrebasis.
CASE STUDY 7: WETLAND RESTORATION IN LOUISIANA 111
10 Costanza, R. and S. Farber. 1985. The Economic Value of Wetlands in Terrebonne Parish, Louisiana. Final Report to the Terrebonne Parish
Policy Jury.
Case Table 7.1. Estimated Gross Economic Contribution of a Wetland Acre in the Terre-bonne Wetlands.
Activity Director Annual Return Per Acre Present Value Per Acre
Fishing and Hunting
Commercial fishing $286.36 $5,540.42Non-commercial fishing 3.19 46.40Commercial trapping 11.69 170.05(Pelts and meats)
Recreation
Economic impact of 60.08 873.89recreation expenditures
Economic value of user 104.33 2,428.17benefits from recreation
Total $465.65 $9,058.93

112 ECONOMIC VALUATION OF NATURAL RESOURCES: A HANDBOOK
ENERGY ANALYSIS (EA). In contrast to WTP, energy analysis looks at the supply side ofwetland values, as opposed to the demand side. The method uses the total amount of energy cap-tured by natural ecosystems in primary production as an estimate of their potential to produce eco-nomically useful products such as fish and wildlife. The energy captured in photosynthesis is thebasis for the food chain that ultimately supports all the production in wetlands, or in any naturalsystem. Therefore, a suitable analysis of the inputs to these systems might provide a convenient in-dex of their ultimate value to society. However, there is no guarantee that all of the products ofwetlands are useful to society, and some values to society (e.g., aesthetics and recreational value)are omitted in EA estimates. Case Table 7.3 presents a summary of EA based value estimates forLouisiana wetlands as assessed by Costanza and Farber. These values range from $6,400 to$10,602/acre using an 8 percent discount rate to $17,000 to $28,600/acre using a 3 percent dis-count rate. Their “best estimate” for the value of an acre of wetlands is a range: $2,429 to $6,400per acre using an 8 percent discount rate, and $8,977 to $17,000 per acre using a 3 percent dis-count rate.
Exercise
The activities that have had the most damaging effects on the coastal region are primarily re-lated to the major economic uses of the Mississippi River and coastal zone for navigation, flood
Case Table 7.2. Summary of WTP valuation of Terrebonne Wetlands, using 1983 dol-lars*.
Per Acre Present Value Per Acre Present ValueAnnual per Acre Value at Various Discount at Various Discount
Valuation Category of Wetlands Rates Rates
(1) (2) (3) (4)
8% 3%
Commercial Fishery $25.37 $317.00 $846.00Trapping 12.04 151.00 401.00Recreation 3.07 46.00 181.00Storm Protection 128.30 1,915.00 7,549.00
Total $168.30 $2,429.00 $8,977.00
Option and Existence NA NA NA
*The present values for recreation and storm protection assume population growth rates of 1.3%
Source: R. Costanza and S. Farber. 1995. The Economic Value of Wetlands in Terrebonne Parish
Louisiana. A Final Report to the Terrebonne Policy Jury.
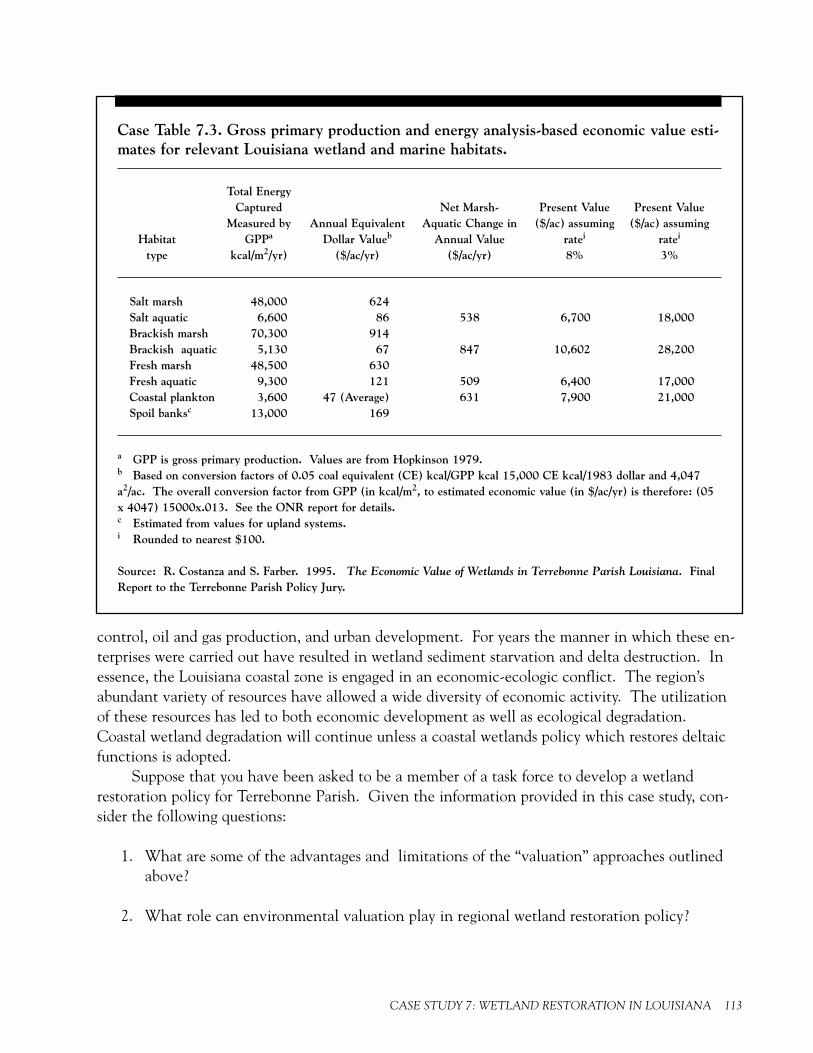
control, oil and gas production, and urban development. For years the manner in which these en-terprises were carried out have resulted in wetland sediment starvation and delta destruction. Inessence, the Louisiana coastal zone is engaged in an economic-ecologic conflict. The region’sabundant variety of resources have allowed a wide diversity of economic activity. The utilizationof these resources has led to both economic development as well as ecological degradation.Coastal wetland degradation will continue unless a coastal wetlands policy which restores deltaicfunctions is adopted.
Suppose that you have been asked to be a member of a task force to develop a wetlandrestoration policy for Terrebonne Parish. Given the information provided in this case study, con-sider the following questions:
1. What are some of the advantages and limitations of the “valuation” approaches outlinedabove?
2. What role can environmental valuation play in regional wetland restoration policy?
CASE STUDY 7: WETLAND RESTORATION IN LOUISIANA 113
Case Table 7.3. Gross primary production and energy analysis-based economic value esti-mates for relevant Louisiana wetland and marine habitats.
Total EnergyCaptured Net Marsh- Present Value Present Value
Measured by Annual Equivalent Aquatic Change in ($/ac) assuming ($/ac) assumingHabitat GPPa Dollar Valueb Annual Value ratei ratei
type kcal/m2/yr) ($/ac/yr) ($/ac/yr) 8% 3%
Salt marsh 48,000 624Salt aquatic 6,600 86 538 6,700 18,000Brackish marsh 70,300 914Brackish aquatic 5,130 67 847 10,602 28,200Fresh marsh 48,500 630Fresh aquatic 9,300 121 509 6,400 17,000Coastal plankton 3,600 47 (Average) 631 7,900 21,000Spoil banksc 13,000 169
a GPP is gross primary production. Values are from Hopkinson 1979.b Based on conversion factors of 0.05 coal equivalent (CE) kcal/GPP kcal 15,000 CE kcal/1983 dollar and 4,047a2/ac. The overall conversion factor from GPP (in kcal/m2, to estimated economic value (in $/ac/yr) is therefore: (05x 4047) 15000x.013. See the ONR report for details.c Estimated from values for upland systems.i Rounded to nearest $100.
Source: R. Costanza and S. Farber. 1995. The Economic Value of Wetlands in Terrebonne Parish Louisiana. FinalReport to the Terrebonne Parish Policy Jury.

114 ECONOMIC VALUATION OF NATURAL RESOURCES: A HANDBOOK
3. How would environmental valuation at the regional level differ from the use of economicsat the site level?
4. The capitalized value of an annual stream of wetland benefits is highly dependent on thediscount rate, which reflects the value which people today put on retention or productionof a resource for future use, and the predicted value of coastal wetlands for fish and wildlife,recreation, water quality management, storm buffer protection and other functions in fu-ture years. One can expect that the value of the coastal Louisiana wetlands would in-crease if their resources were to become scarce through lack of proper management. Whatdiscount would you suggest be used in this analysis?
5. It has been suggested that, to date, existing legal mechanisms for regulating activities inthe Louisiana coastal zone have not been sufficiently restrictive of access and navigationconstruction projects. A wetland restoration policy must develop more stringent regulatoryprograms in this regard by imposing mitigation requirements which will fully compensatefor direct and indirect land loss where dredging of canals is permitted. Construction of ac-cess and navigation canals should be drastically restricted by mandating use of alternativemeans of access for oil and gas equipment. With regard to urban development, it has beensuggested federal subsidies should be suspended (e.g., funds for low-income housing, mort-gage insurance, and National Flood Insurance for urban development projects) in environ-mentally significant wetlands. These expenditures currently offer significant incentives fordevelopment that impacts important wetlands. They also set the stage for future federaloutlays for damages caused by storms to developments located in naturally flood-prone ar-eas. Strictly on economic grounds, would it make sense (in terms of sound public policy) towithhold incentives for developing areas subject to high flooding risks?
6. Which of the various economic approaches would be used by different stakeholders in thepolicy decision process? How would economic information be developed and presented byeach group?
• Developers• Local agencies making decisions regarding public investments• Interest groups• Public at large• Federal regulators/decision makers
7. How can the various economic approaches aid in developing consensus among stakeholders?

NONPOINT SOURCE POLLUTION CONTROL
IN CALIFORNIA
Background
In the Coastal Zone Management Act (CZMA) of1972, as amended, Congress declared it to be nationalpolicy that state coastal management programs mustprovide for public access to the coasts for recreationalpurposes. Clearly, boating and adjunct activities andfacilities are an important means of public access. Theavailability of public access facilities and services suchas marinas has helped boating to become a major in-dustry in California. More than 650,000 pleasure boatsare registered with the state and during 1986, recre-ational boaters engaged in an estimated 56 millionboating-days.
Boater spending supports a wide range of business-es, among them, boat and equipment manufacturing,retailing, and various types of boating services. A 1986inventory of 5,035 boating businesses throughout Cali-fornia revealed that these businesses had total gross re-ceipts of $2.6 billion, employed 40,000 people, andpaid $476 million in payroll. Businesses that supportrecreational boaters paid over $191 million in stateand local taxes during that year. The direct spendingby boaters on goods and services stimulates the entireCalifornia economy. Including all the other businessesthat support the boating industries in California, the
C A S E S T U D Y 8
Situation
Recreational facilities such as mari-nas and activities such as boating canbe sources of dangerous contamina-tion in nearshore waters. Toxiccompounds from antifouling paints,batteries, detergents, and sewage area threat to water quality, livingresources, and human health. Man-agement safeguards and other controlmeasures to prevent pollutant run-off could, in the long run, cost lessthan environmental clean-up costs.
CASE STUDY 8: NONPOINT SOURCE POLLUTION CONTROL IN CALIFORNIA 115

116 ECONOMIC VALUATION OF NATURAL RESOURCES: A HANDBOOK
total economic activity traceable to boating in 1986 was more than $6.7 billion.1 Clearly, marinasand other public access facilities and services are integral to California’s economy.
However, when these facilities are poorly planned or managed, they can pose a threat to thehealth of aquatic systems; they can also introduce other environmental hazards. Because marinasare located at the water’s edge, there is often no buffering of the release of pollutants to waterways.Adverse environmental impacts may result from the following sources of pollution associated withmarinas and recreational boating:
• Pollutants illegally discharged from boats and fueling stations
• Pollutants transported in stormwater runoff from marina parking lots, roofs, and other sur-rounding impervious surfaces
• Physical alteration or destruction of wetlands and of shellfish and other bottom communi-ties during the construction of marinas, ramps, and related facilities
• Pollutants generated from boat maintenance activities on land and in the water2
Recreational boating and marinas are increasingly popular uses of the California coastal zone.In areas such as San Diego Bay, the growth of recreational boating, along with the growth ofcoastal development in general, has led to a growing awareness of the need to protect waterways.Normal marina operations such as waste disposal, boat fueling, and boat maintenance and cleaninggenerate contaminant runoff. Moreover, storage areas for the materials required for these activitiesare also a source of pollutants. Of special concern are substances such as paint sandings and chip-pings, waste oil and grease, batteries, fuel, detergents, and sewage that can be toxic to aquatic bio-ta, or degrade water quality and pose a threat to human health.
Historically, point source wastes from shipyards, boatyards and other repair facilities, andmarinas were dumped or washed directly into the San Diego Bay. Environmental legislation overthe past 20 years has put an end to these practices. However, large sinks of sand blast material andother paint-containing waste are still present in the Bay’s sediments. The effects of these sinks onwater quality is not known.3
Non-point source pollution continues to be a paramount concern as current boat mainte-nance activities, such as the use of antifouling paints on boat hulls, generate contaminants thatcan harm the marine environment. These paints that contain chemical pesticides are applied tothe hulls of boats to deter the attachment and growth of aquatic organisms — the buildup of such
1 D.M. Dornbusch and Company, Inc. 1988. Economic Impact of the Boating Industry in California. Prepared for the California Department of
Boating and Waterways.
2 U.S. Environmental Protection Agency. 1993. Guidance Specifying Management Measures for Sources of Nonpoint Polution in Coastal Waters.
EPA Document 840-B-92-002, pp:5.2-5.3.
3 Conway, J.B. and L.P. Locke. 1994. A Final Report on Marine Fouling and Underwater Hull Cleaning in San Diego Bay. Prepared for the Califor-
nia Regional Water Quality Control Board, San Diego Region.

organisms can promote hull corrosion and increase drag.Biocides from antifouling paints generally enter the marine environment in different ways:
(1) through the normal leaching process of paints as they age, and (2) through paint chips abradedfrom vessels’ hulls in the water during underwater hull cleaning. The concern is that the copper-based biocide chemicals released from antifouling paint applied to boat hulls may be deleterious tothe marinas’ aquatic environment. Because of the poor tidal flushing characteristics of San DiegoBay, copper concentrations can become elevated to levels harmful to aquatic organisms.
Numerous studies have shown that the concentrations of antifouling biocides are highestnear marinas and small yacht basins. A recent study assessing the average concentrations of totaland dissolved copper in San Diego and Mission Bays found that while ambient copper concentra-tions appeared to be non-toxic, several marinas did have average dissolved copper concentrationsthat were above the U.S. EPA’s Ambient Water Quality Criteria for saltwater aquatic life.4
Another study attempted to measure the deleterious effects (within the water column) of in-water maintenance of boats at recreational marinas. The study revealed that although copper re-leases can be significant in the immediate vicinity of a boat hull during cleaning, the water rapidlyreturns to pre-cleaning concentrations. However, the findings were inconclusive as to the extentand degree of dispersal of the contaminant plume and the total load to the Bay from a hull clean-ing operation. Other studies have found evidence of elevated levels of copper in the tissues of or-ganisms living in the San Diego Bay. These studies suggest that boat owners should be educatedabout biofouling processes and antifouling paints so that they can make sound, informed, and en-vironmentally sensitive decisions.
Nonpoint Source Control Solutions
It is important that marina operators such as those in San Diego Bay recognize that there arealternatives to obtaining permits to pollute. They can take steps to control or minimize the entryof polluting substances into marina waters. For the most part, this control can be accomplishedwith simple preventive measures such as locating service equipment where the risk of spillage is re-duced, providing adequate and well-marked disposal facilities, and educating the boating publicabout the importance of pollution prevention. Benefits of effective pollution prevention to themarina operator may be realized in terms of lower direct pollution control costs. The costs of pol-lution prevention could well be lower than environmental clean-up costs.
Section 6217 of the Coastal Zone Act Reauthorization Amendments of 1990 (CZARA) re-quires coastal states (including Great Lakes states) with approved coastal zone management pro-grams to address nonpoint pollution impacting or threatening coastal waters. States must submitCoastal Nonpoint Pollution Control Programs for approval to both the U.S. Environmental Pro-tection Agency (EPA) and the National Oceanic and Atmospheric Administration (NOAA). Re-quirements for state programs are described in Coastal Nonpoint Pollution Control Program: ProgramDevelopment and Approval Guidance and are summarized in a separate fact sheet. Some of the
4 McPherson, T.N. and G.B. Peters. 1995. The Effects of Copper-Based Antifouling Paints on Water Quality in Recreational Boat Marinas in San
Diego and Mission Bays. Prepared for the California Regional Water Quality Control Board, San Diego Region.
CASE STUDY 8: NONPOINT SOURCE POLLUTION CONTROL IN CALIFORNIA 117

118 ECONOMIC VALUATION OF NATURAL RESOURCES: A HANDBOOK
management measures outlined in the guidance include practices related to the best possible sitingfor marinas, best available design and construction, and appropriate operation and maintenance(e.g., solid waste management, liquid waste management, and petroleum control management).Other management efforts might include staff and boater education programs on all areas of non-point source control and best management practices; petroleum station management; improvedsewage pumpout systems; and installation of fuel spill controls.
California is currently revising its Nonpoint Source (NPS) Pollution Management Plan pur-suant to the 1990 CZARA. For each management measure, a Technical Advisory Committee ac-cepted or modified EPA’s management measure as it should be applied to California; for each man-agement measure, the report also addresses applicability, methods of implementation, specific im-plementors, enforcement mechanisms, triggers of enforcement actions, and the actions that arenecessary to begin implementation.
Costs of Compliance
The California Regional Water Quality Control Board, San Diego Region, could choose toimplement some of the operations and maintenance management measures outlined in the 1994Marina and Recreational Boating Technical Committee Report in an attempt to improve the quality ofSan Diego Bay. Implementation of these measures, unlike compliance with cleanup and abate-ment orders by boatyards, is not expected to impose significant costs on marina operators in thearea. The cost of providing recreational boating services will likely increase with implementationof management measures affecting the San Diego Bay marinas.
Nonpoint source control requirements have the potential to delay new facility constructionand/or business failures of existing marinas. Some of these costs are expected to be passed along torecreational boaters. In addition to costs passed on to boaters by marinas, boaters may incur costsassociated with more expensive non-toxic paints (silicone) and hull cleaners who are licensed, in-sured, approved under best management practices; higher cost boat maintenance (experienced la-bor, more frequent cleanings, required draping); and higher cost oil-change services which recycle.
Case Table 8.15 , though not directly related to the implementation of boat-cleaning manage-ment practices, presents some high estimates of the potential costs to San Diego Bay marinas of se-lected operation and maintenance practices. While operations and maintenance management mea-sures include waste disposal, education and boat-operation practices, this analysis is restricted tosolid-waste disposal practices and liquid-waste disposal practices. The specific costs are associatedwith purchasing a commercial vacuum to collect debris at hull-maintenance sites, providing cov-ered dumpsters for solid-waste collection, and purchasing liquid waste containers for storing and re-cycling oil, antifreeze, gasoline, diesel fuel, and kerosene.6
5 U.S. Environmental Protection Agency. 1992. Economic Analysis of Coatal Nonpoint Source Pollution Controls: Marinas. Original estimates
have been adjusted for the purposes of this hypothetical case study.
6 These cost estimates are based on large-scale repair facilities. Boat maintenance at San Diego area marinas is actually small-scale, general upkeep
done on individual boats

Benefits of Marina Operations and Management Measures
Numerous benefits are associated with the implementation of nonpoint source marina opera-tions and maintenance management measures. For example, increases in water quality will pro-vide improvements in the integrity of the San Diego Bay environment leading to increased recre-ational boating and fishing values, aesthetics and nonuse values, and reduced costs for dredgingwhen sediments are less contaminated. The steps in determining the benefits of such control mea-sures include:
1. Determination of the benefit categories which match potential management measures
Case Table 8.1. Costs of Selected Operation and Maintenance Management Practices:High Estimates.
Liquid Waste Management Commercial Vacuum Covered Dumpster
Marina Operating Operating OperatingNumber Capital ($) ($/yr) Capital ($) ($/yr) Capital ($) ($/yr)
1 90 112 1,063 19 0 1,6202 360 174 1.063 93 0 1,6203 4,080 407 1,063 372 0 7,0564 4,170 485 1,063 465 0 7,0565 15,980 1,652 4,252 1,860 0 21,1686 15,980 1,652 4,252 1,860 0 21,168
Key Assumptions: 1. Assume one vacuum is needed for every 250 slips of capacity.2. Assume one filter must be replaced annually for every 50 slips of capacity. Each filter
costs $93.3. Assume model marina owners pay for dumpster rental and collection.
Sources: Dickerson, George. Sales Representative for Capital Vacuum, Raleigh, NC. May 13,1992. Personal com-munication with Julie Duffin, Research Triangle Institute.
Musgrave, John. Sales Representative for Waste Industries, Inc., Durham NC. May 13, 1992. Personal communica-tion with Julie Duffin, Research Triangle Institute.
ROW (Revitalize Our Waterway). 1992. Comments of the Economic Analysis of Coastal Nonpoint Pollution Con-trols. Marinas. July 11 and August 18.
CASE STUDY 8: NONPOINT SOURCE POLLUTION CONTROL IN CALIFORNIA 119

120 ECONOMIC VALUATION OF NATURAL RESOURCES: A HANDBOOK
2. Estimation of the benefits of each management measure in terms of how each measure willaffect natural resource parameters. For example, if non-toxic hull cleansing is required, anattempt must be made to determine the linkage between reduction of pollutants such ascopper and the improvement of water quality.
3. Determination of how changes in ecological parameters affect human health, recreationalenjoyment, and aesthetic appreciation through impacts on market and nonmarket servicesprovided by the Bay. For example, how does an increase in water quality affect the quanti-ty or quality of recreational boating and other uses of San Diego Bay surface water?
4. Translation of these public health, recreational, aesthetic and ecological effects into esti-mates of monetary values.
In addition, there may be benefits from some best management practices such as the use of under-water hull cleaning. These benefits include increased vessel maneuverability and fuel efficiency aswell as the potential for increased paint life with a corresponding decrease in total antifoulingchemical discharge.
Exercise
Given the information provided above, develop an economic argument in favor of or againstthe implementation of boat-cleaning management measures in San Diego Bay marinas.
1. Do you see a role for environmental valuation in the development of your argument?Would it be most appropriately used in a case-by-case (marina-by-marina) implementationdecision basis or as an overall policy decision?
2. What natural resources and resource services do you think should be analyzed?
3. What techniques would you recommend in order to determine the values of these resourcesand services?
4. What are the limitations to the existing methodologies in this case?
5. Boat-cleaning management measures are only one set of management measures and prac-tices recommended in the EPA nonpoint source pollution control guidance. Using theeconomic techniques described in the seminar, how would you decide whether focusing onoperations and maintenance management actions is appropriate?
6. Would other economic approaches outlined in the seminar be of use to others in the deci-sion process?

• Developers• Local agencies making decisions regarding supporting public investment decisions• Interest groups• Public at large• Federal regulators/decision-makers
How would this information be developed and presented by each group?
How can these tools aid in the developing consensus among the various stakeholders?
7. There are numerous benefits that can be attached to the implementation of nonpoint-source management measures for marina operations and maintenance. These benefits maynot be directly incurred by individual marina operators (though some cost savings may beexpected), but are more likely to be felt by the public at large. Should those benefits beweighted similarly in your decision process or should one group or another be weightedmore heavily? Should the marina operators be compensated for the capital costs that theywill incur to implement the management measures?
8. To describe and measure the benefits of these measures, it is necessary to identify linkagesbetween the measures, the resources of the Bay, and the activities and user groups that de-rive economic value from the Bay. These relationships are complex and a single measuremay affect several different resource services at once. Conceptually, what would those link-ages look like? What kind of data would you need to collect to analyze those linkages?
CASE STUDY 8: NONPOINT SOURCE POLLUTION CONTROL IN CALIFORNIA 121

GLOSSARY
benefit-cost analysis — a technique to compare the relative economic efficiency of different statesof the world usually brought about by undertaking projects or policies. A comparison is made be-tween gross benefits of a project or policy and the opportunity costs of the action. Benefits andcosts are measured as changes in consumer and producer surpluses accruing to individuals in soci-ety.
consumer surplus — a money measure of an individual or group’s welfare from consumption of agood or service or the existence of a particular state of the world. This surplus is the difference be-tween the maximum the individual is willing to pay for consumption of the good and the amountthat has to be paid.
contingent valuation — a methodology to determine money measures of change in welfare by de-scribing a hypothetical situation to respondents and eliciting how much they would be willing topay either to obtain or to avoid a situation.
demand — in economics, the usual inverse relationship between quantity consumed (or otherwiseused or even preserved) and a person’s maximum willingness-to-pay for incremental increases inquantity. Market prices often (but not always) reveal the increments of willingness-to-pay. Otherfactors influencing willingness-to-pay include income, prices of substitutes, and, in recreationalfishing, catch rate. Unlike planning where demand refers to the size of the quantity variable, eco-nomic demand is a behavioral relationship.
discounting — is a procedure to use when comparing value streams (benefits or costs) occurring indifferent magnitudes at different dates in the future. The procedure “discounts” future values inorder to obtain the present value of the stream.
environmental valuation — procedures for valuing changes in environmental goods and services,whether or not they are traded in markets, by measuring the changes in the producer and con-sumer surpluses associated with these environmental goods.
existence value — see nonuse value
GLOSSARY 123
124 ECONOMIC VALUATION OF NATURAL RESOURCES: A HANDBOOK
gross domestic product (GDP) — aggregate annual output of the economy before deducting thevalue of the assets of the economy that have been used up or depreciated in the production processduring the year. Gross domestic product provides a summary measure of the Nation’s overall eco-nomic performance.
hedonic method — a methodology for estimating the relationship between the price of a good(e.g. housing) and the characteristics of the good (e.g. number of bedrooms, air quality, proximityto amenities, etc.). Can sometimes be used to value changes in environmental characteristics.
input-output model — a methodology that models the linkages between input supplies, outputs,and households in a regional economy that can be used to predict the impact of changes on eco-nomic activity (e.g., industry revenues and household incomes) within the region.
market benefits — benefits from goods or services bought and sold in normal commerce so thatthere is a revealed price that reflects consumers willingness-to-pay for the quantity offered and sup-pliers marginal production costs.
non-market benefits — benefits that accrue to individuals for goods, services, experiences orstates of nature that are not normally traded in commerce.
nonuse value (see also use value) — value of knowing that something exists in a particular stateeven though there is no sensory contact with the resource.
opportunity cost — the highest value a productive resource such as labor, capital, land or a natur-al resource could return if placed in its best alternative use.
producer surplus — total revenue minus the opportunity cost of production, including the oppor-tunity costs of the entrepreneurs skills, labor, capital, and ownership of natural resources.
random utility model (RUM) — an extension of the travel cost method which explicitly consid-ers individuals participation decisions and the selection among alternative recreation sites.
supply — schedule of the quantities of goods and services that a business is willing to sell at vari-ous prices. Other factors that affect supply include input prices.
travel cost method — a methodology which relies on travel-related costs as a surrogate for price ina non-market situation in order to estimate demand and money measures of willingness-to-pay.
use value — value derived from either the consumption of a good, the utilization of a service, orthat otherwise involves some sensory contact with the resource. For example, whale-watching isnot consumptive but involves visual contact with the whales.

value — what one is willing to give up in order to obtain a good, service, experience, or state ofnature. Economists try to measure this in dollars.
welfare economics — a field of inquiry within the broad scope of economics that is concernedwith money measures of individual and social well-being, particularly in changes in well-being dueto implementation of public policies.
GLOSSARY 125

LIST OF ACRONYMS
CERCLA — Comprehensive Environmental Response, Compensation and Liability Act
COP — NOAA Coastal Ocean Program
CVM — contingent valuation method or methodology
EPA — Environmental Protection Agency
GDP — gross domestic product
ITQ — individual transferable quotas
NEPA — National Environmental Policy Act
NMFS — NOAA National Marine Fisheries Service
NOAA — National Oceanic and Atmospheric Administration
OPA — Oil Pollution Act
WTP — willingness-to-pay
LIST OF ACRONYMS 127

FOR FURTHER READING
(Note: Some of these texts or articles may be technical, but often the introductory material onthe various topics in environmental valuation is useful.)
Anderson, R. and Rockel, M. 1991. Economics Valuation of Wetlands. Discussion Paper 065, pre-pared for American Petroleum Institute.
Braden, J.B. and C.D. Kolstad (editors). Measuring the Demand for Environmental Quality. NorthHolland, New York, 1991.
Bromley, D.W. and K. Segerson (editors). The Social Response to Environmental Risk: Policy Formula-tion in an Age Uncertainty. Kluwer Academic Publishers, Boston, 1992.
Brown, T.C. and G.L. Peterson. A Political-Economic Perspective in Sustained Ecosystem Management.Paper presented at the Conference on Sustainable Ecological Systems, Flagstaff, Arizona, July 12-15, 1993.
Edwards, S.F. An Introduction to Coastal Zone Economics: Concepts, Methods, and Case Studies.Taylor and Francis, New York, 1987. (Written for the non-economist, recommended.)
Edwards, S. F. An Economics Guide to Allocation of Fish Stocks Between Commercial and RecreationalFisheries. NOAA Technical Report NMFS 94, November 1990.
Environmental Protection Agency. Guidelines for Performing Regulatory Impact Analysis. EconomicAnalysis and Research Branch. December 1983 (Reprinted: March 1991).
Folmer, H. and E. Van Ierland (editors). Valuation Methods and Policy Making in Environmental Eco-nomics. Elsevier, New York, 1989.
Freeman, A. Myrick . The Benefits of Environmental Improvement. Resources for the Future, JohnsHopkins University Press, Baltimore, 1979. (Note: New expanded edition forthcoming.)
FOR FURTHER READING 129
130 ECONOMIC VALUATION OF NATURAL RESOURCES: A HANDBOOK
Hufschmidt, M.M., D.E. James, A.D. Meister, B.T. Bower and J.A. Dixon. Environment, NaturalSystems, and Development An Economic Valuation Guide. The Johns Hopkins University Press, Bal-timore, 1983.
Huppert, D.D. NMFS Guidelines on Economic Valuation of Marine Recreational Fishing. NOAATechnical Memorandum NOAA-TM-NMFS-SWFC-32, Department of Commerce, Washington,D.C., 1983.
Just, R.E., D.L. Hueth and A. Schmitz. Applied Welfare Economics and Public Policy. Prentice Hall,Englewood Cliffs, N.J., 1982. (Note: Out of print, but best text on valuation in the marketeconomy.)
Kneese, A.V. and J.L. Sweeney (editors). Handbook of Natural Resource and Energy Economics. Vol-umes I-III. Elsevier Science Publishing Company, New York, 1985.
Kopp, R.J. and V.K. Smith (editors). Valuing Natural Assets: The Economics of Natural ResourceDamage Assessment. Resources for the Future, Washington D.C., 1993.
Mitchell, R.C. and R.T. Carson. 1989. Using Surveys to Value Public Goods. Baltimore. JohnsHopkins University for Resources for the Future.
Randall, A. An Economic Approach to Natural Resource and Environmental Policy. John Wiley &Son, New York, 1987.
Tietenberg, T.H. Environmental and Natural Resource Economics. Scott, Foresman, Glenview, Ill.,1984.
Tietenberg, T.H. (editor). Innovation in Environmental Policy: Economic and Legal Aspects of RecentDevelopments in Environmental Enforcement and Liability. Ashgate Publishing Co., Brookfield, Vt.,1992.
Water Resources Council. Economic and Environmental Principles and Guidelines for Water and Re-lated Land Resources Implementation Studies. Water Resources Council, 1983. (Note: Methodolo-gies out of date, but good background on basic concepts.)
ADDITIONAL TEXTS ON ENVIRONMENTAL ECONOMICS
Baumol, W.J. and W.E. Oates. The Theory of Environmental Policy. Cambridge University Press,New York, 1988.
Dorfman, R. and N.S. Dorfman (editors). Economics of the Environment. W.W. Norton & Co.,New York, 1977.

Forsund, F.R. and S. Strom. Environmental Economics and Management: Pollution and Natural Re-sources. Croom Helm-Methuen, New York, 1988.
Krutilla, J.V. and A.C. Fisher. The Economics of Natural Environments. Johns Hopkins UniversityPress for Resources for the Future, Baltimore, 1975.
Neher, P. A. Natural Resource Economics: Conservation and Exploitation. Cambridge UniversityPress, New York, 1990.
Pearce, D.W. and R.K. Turner. Economics of Natural Resources and the Environment. Wheatsheaf,New York, 1990.
Rees, J.A. Natural Resources: Allocation, Economics and Policy. Routledge, New York, 1990.
Siebert, H. Economics of the Environment: Theory and Policy. Springer-Verlag, New York, 1987.
FOR FURTHER READING 131

OTHER TITLES IN THEDECISION ANALYSIS SERIES
No. 1. Able, Kenneth W. and Susan C. Kaiser. 1994. Synthesis of Summer FlounderHabitat Parameters.
No. 2. Matthews, Geoffrey A. and Thomas J. Minello. 1994. Technology and Success inRestoration, Creation, and Enhancement of Spartina alterniflora Marshes in the UnitedStates. 2 vols.
No. 3. Collins, Elaine V., Maureen Woods, Isobel C. Sheifer and Janice Beattie. 1994.Bibliography of Synthesis Documents on Selected Coastal Ocean Topics.
No. 4. Hinga, Kenneth R., Heeseon Jeon and Noëlle F. Lewis. 1995. Marine Eutrophica-tion Review.