economically active population survey (eaps) third quarter
TRANSCRIPT

28 October 2021
Economically Active Population Survey (EAPS) - Third Quarter of 2021. (1/22)
Economically Active Population Survey (EAPS) Third Quarter of 2021.
Effects of COVID–19 on the EAPS this quarter
• Employed persons absent from their place of work in the reference week have gone from 1,498,400 in the second quarter of 2021 to 3,810,400 in the third. The increase was due to holidays. Sick leave fell by 33,500 this quarter, while absences related to Temporary Workforce Reduction Schemea (ERTE) declined by 108,600. As a result, the number of hours worked decreased by 9.99% compared to the previous quarter.
• In annual variation, hours worked grew 5.06% in the third quarter compared to the same period in 2020. Compared with the third quarter of 2019, prior to the pandemic, the number of hours worked varied by 2.53%.
• Data for the third quarter shows a progressive return to the workplace. 8.0% of employed persons (1,596,500) worked from their own home more than half the days, compared to 9.4% in the second quarter of 2021 and 10.3% in the third quarter of 2020.
• The effects of COVID-19 on the EAPS can be reviewed more extensively on page 19 of this press release, as well as in the specific section on page 9.

Economically Active Population Survey (EAPS) - Third Quarter of 2021. (2/22)
Main results
• Employment registered an increase of 359,300 persons in the third quarter of 2021 as compared with the previous quarter (1.83%), standing at 20,031,000 employed persons. In seasonally adjusted terms, the quarterly variation was 1.29%. Employment has grown by 854,100 persons (4.45%) in the last 12 months.
• Employment increased this quarter by 44,500 people in the public sector and 314,800 in the private sector. In the last twelve months, employment has increased by 707,200 persons in the private sector and 146,900 in the public sector.
• Salaried employees increased this quarter by 409,100. Those with a permanent contract increased by 145,000, while those with a temporary contract increased by 264,200. The number of salaried employees increased by 808,500 in the annual rate (permanent employment by 300,700 persons and temporary employment by 507,800). The number of self-employed workers decreased by 49,600 this quarter and it increased by 38,700 in the last 12 months.
• Employment increased this quarter in Services (377,200 more employed persons) and in Industry (63,000), while it decreased in Agriculture (49,600 less) and in Construction (-31,200). In annual variation, employment increased in all sectors: 739,100 more were employed in Services, 44,300 more in Construction, 40,400 in Industry and 30,400 in Agriculture.
• Employment increased this quarter in the majority of the Autonomous Communities. The greatest increases took place in Cataluña (62,300 more), Canarias (50,000) and Illes Balears (47,900). In turn, employment fell in Andalusia (–7,200) and in La Rioja (–2,100). In annual variation, employment rose in all communities. The greatest increases took place in Andalucia (162,300 more unemployed persons), Cataluña (155,500) and Comunidad de Madrid (124,000).
• The number of unemployed persons decreased by 127,100 this quarter (-3.59%), standing at 3,416,700. In seasonally adjusted terms, the quarterly variation was -2.35%. Over the last 12 months, unemployment decreased by 306,200 persons (-8.23%). The unemployment rate stood at 14.57%, which is 69 hundredths less than the previous quarter. Within the last year, this rate has decreased by 1.69 points.
• By Autonomous Community, the greatest quarterly drops in unemployment occurred in Cataluña (51,900 less unemployed persons), Illes Balears (-28,400) and Castilla y León (-27,600). The largest increases were in Andalucía (41,100), Región de Murcia (13,800) and Canarías (4,000). In annual terms, the greatest decreases in unemployment took place in Cataluña (79,900 less), Comunidad de Madrid (-38,600) and Castilla y León (-27,100). In Comunidad Foral de Navarra (3,300), Canarias (2,100) and La Rioja (1,700) the number of unemployed increased in the annual variation.
• This quarter, the number of economically active persons increased by 232,200, up to 23,447,700. The activity rate increased by 56 hundredths standing at 59.14%. The economically active population has increased by 547,900 individuals compared to the third quarter of 2020.
Economically Active Population Survey (EAPS) - Third Quarter of 2021. (3/22)
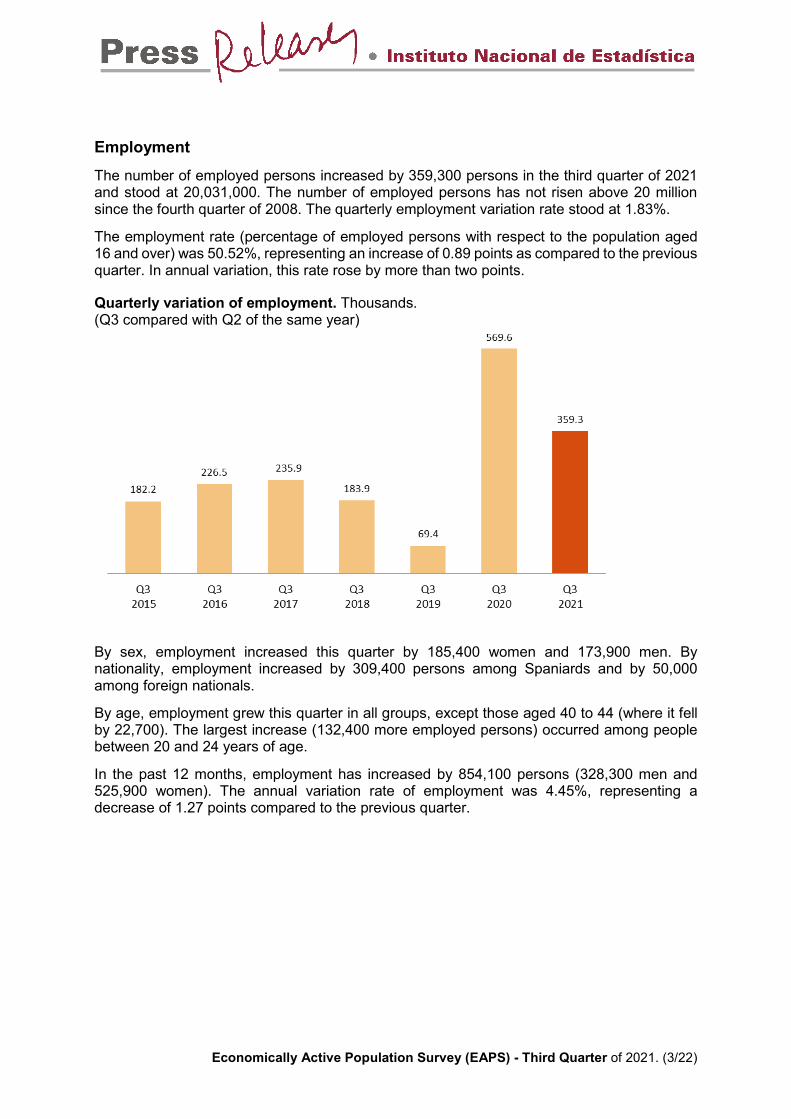
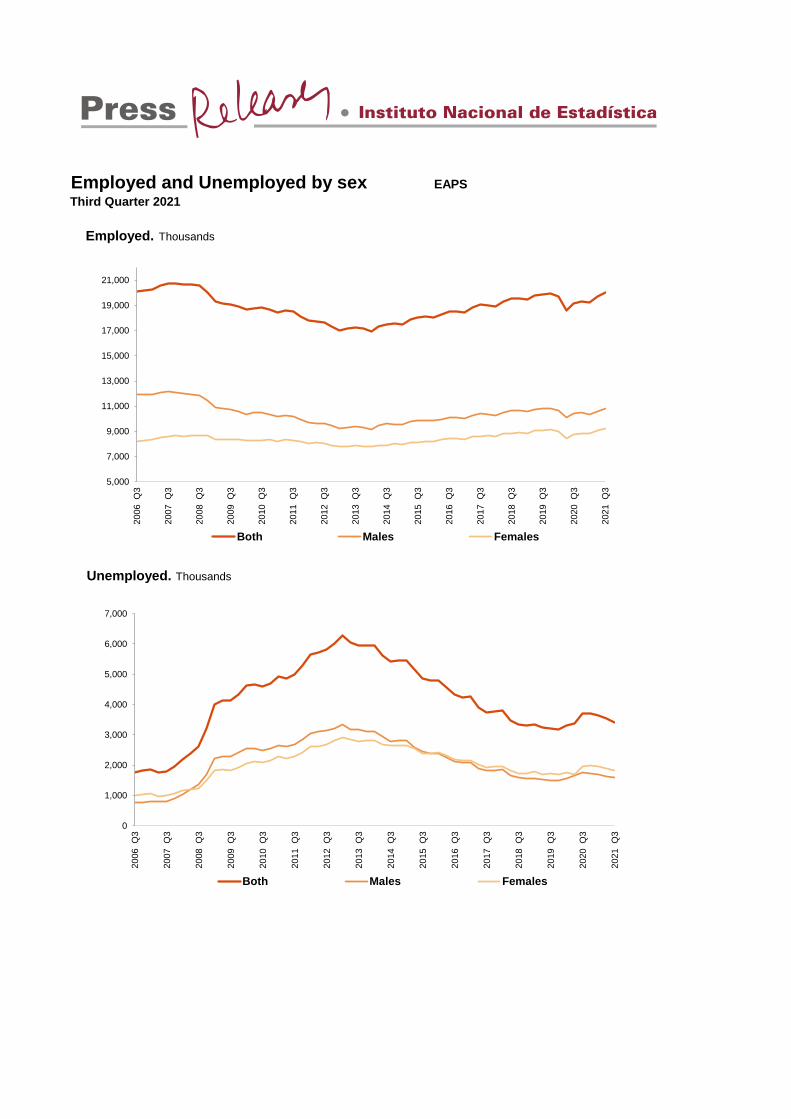
Employment The number of employed persons increased by 359,300 persons in the third quarter of 2021 and stood at 20,031,000. The number of employed persons has not risen above 20 million since the fourth quarter of 2008. The quarterly employment variation rate stood at 1.83%.
The employment rate (percentage of employed persons with respect to the population aged 16 and over) was 50.52%, representing an increase of 0.89 points as compared to the previous quarter. In annual variation, this rate rose by more than two points.
Quarterly variation of employment. Thousands. (Q3 compared with Q2 of the same year)
By sex, employment increased this quarter by 185,400 women and 173,900 men. By nationality, employment increased by 309,400 persons among Spaniards and by 50,000 among foreign nationals.
By age, employment grew this quarter in all groups, except those aged 40 to 44 (where it fell by 22,700). The largest increase (132,400 more employed persons) occurred among people between 20 and 24 years of age.
In the past 12 months, employment has increased by 854,100 persons (328,300 men and 525,900 women). The annual variation rate of employment was 4.45%, representing a decrease of 1.27 points compared to the previous quarter.
Economically Active Population Survey (EAPS) - Third Quarter of 2021. (4/22)
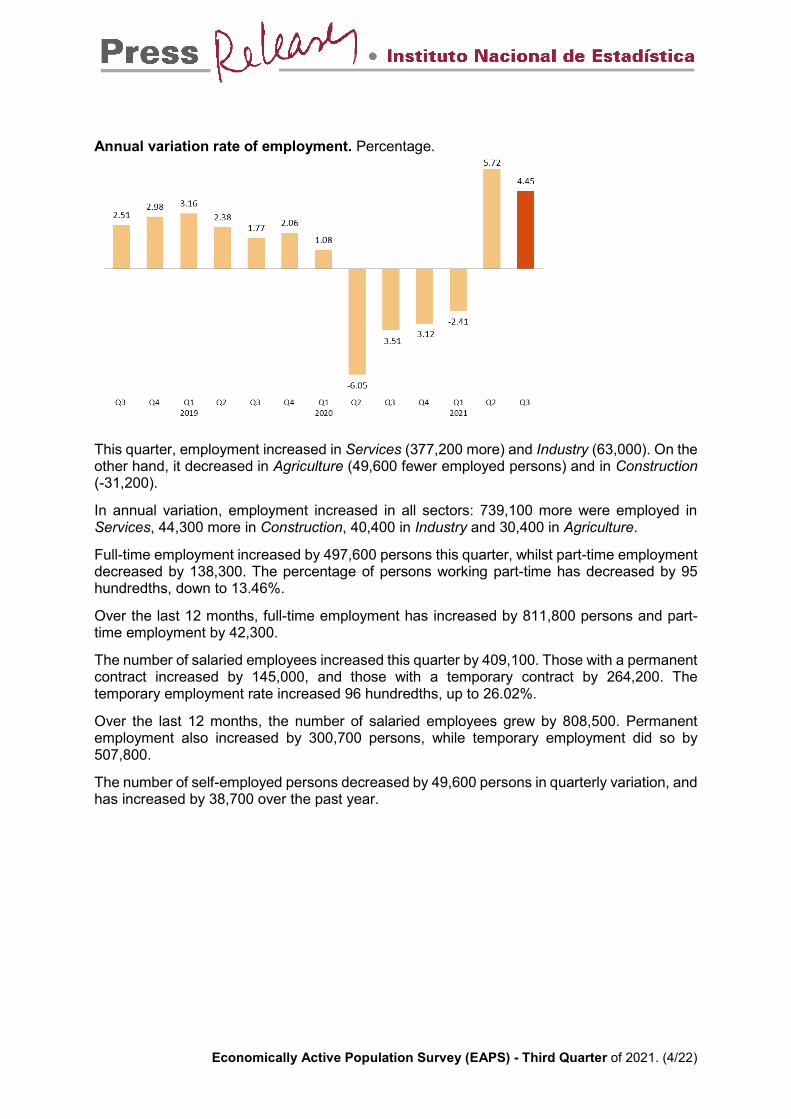
Annual variation rate of employment. Percentage.
This quarter, employment increased in Services (377,200 more) and Industry (63,000). On the other hand, it decreased in Agriculture (49,600 fewer employed persons) and in Construction (-31,200).
In annual variation, employment increased in all sectors: 739,100 more were employed in Services, 44,300 more in Construction, 40,400 in Industry and 30,400 in Agriculture.
Full-time employment increased by 497,600 persons this quarter, whilst part-time employment decreased by 138,300. The percentage of persons working part-time has decreased by 95 hundredths, down to 13.46%.
Over the last 12 months, full-time employment has increased by 811,800 persons and part-time employment by 42,300.
The number of salaried employees increased this quarter by 409,100. Those with a permanent contract increased by 145,000, and those with a temporary contract by 264,200. The temporary employment rate increased 96 hundredths, up to 26.02%.
Over the last 12 months, the number of salaried employees grew by 808,500. Permanent employment also increased by 300,700 persons, while temporary employment did so by 507,800.
The number of self-employed persons decreased by 49,600 persons in quarterly variation, and has increased by 38,700 over the past year.
Economically Active Population Survey (EAPS) - Third Quarter of 2021. (5/22)
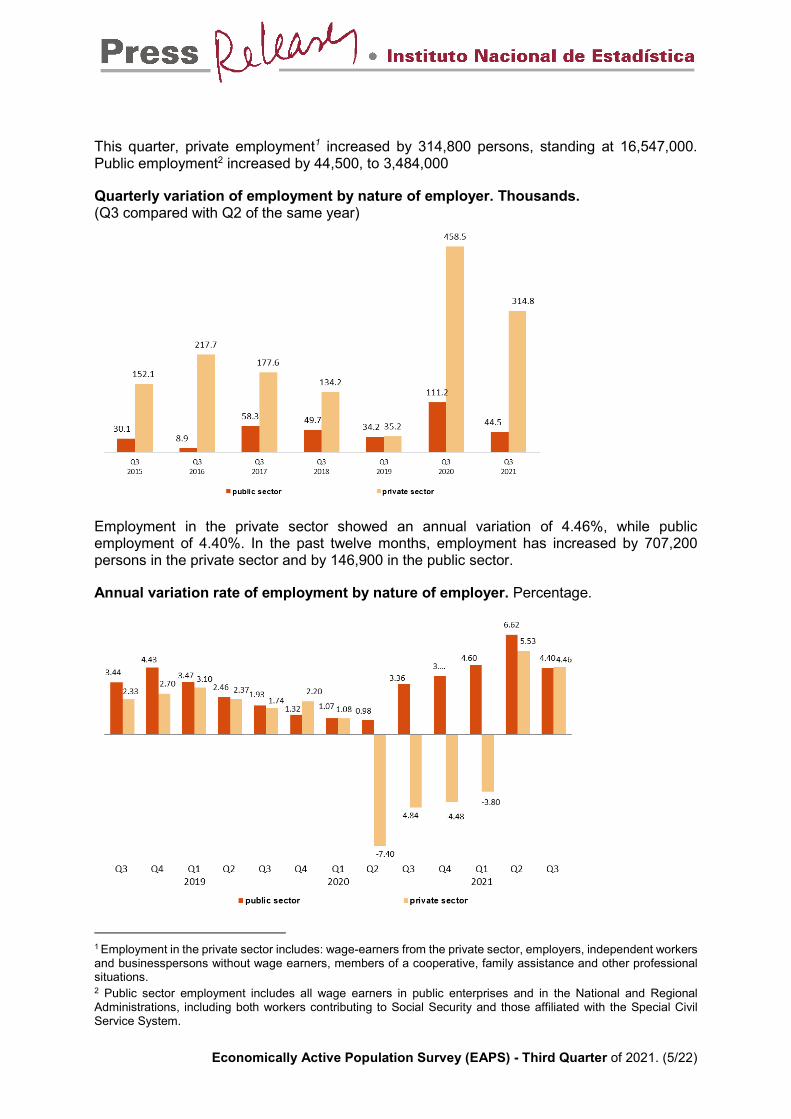
This quarter, private employment1 increased by 314,800 persons, standing at 16,547,000. Public employment2 increased by 44,500, to 3,484,000
Quarterly variation of employment by nature of employer. Thousands. (Q3 compared with Q2 of the same year)
Employment in the private sector showed an annual variation of 4.46%, while public employment of 4.40%. In the past twelve months, employment has increased by 707,200 persons in the private sector and by 146,900 in the public sector.
Annual variation rate of employment by nature of employer. Percentage.
1 Employment in the private sector includes: wage-earners from the private sector, employers, independent workers and businesspersons without wage earners, members of a cooperative, family assistance and other professional situations. 2 Public sector employment includes all wage earners in public enterprises and in the National and Regional Administrations, including both workers contributing to Social Security and those affiliated with the Special Civil Service System.

Economically Active Population Survey (EAPS) - Third Quarter of 2021. (6/22)
Unemployment and unemployment rate Unemployment decreased by 127,100 persons this quarter. The total number of unemployed persons stood at 3,416,700. In relative terms, the quarterly variation of unemployment was -3.59%.
Quarterly variation of employment. Thousands. (Q3 compared with Q2 of the same year)
The unemployment rate declined by 69 hundredths and stood at 14.57%. In the last 12 months, this rate has decreased by 1.69 points.
By sex, the number of unemployed women decreased by 95,100 this quarter, standing at 1,809,200. Among men, unemployment decreased by 32,000, reaching 1,607,500.
The female unemployment rate decreased by one point to stand at 16.36%. The male unemployment rate decreased by 41 hundredths and stood at 12.97%.
By age group, the greatest decline in unemployment was observed this quarter among people aged 25 to 54 (-119,500). It also decreased among young people aged 20 to 24 (–58,600) and among those aged 16 to 19 (–14,500). In turn, the number of unemployed persons increased by 65,500 among those 55 and above.
By nationality, unemployment decreased this quarter by 60,100 among Spaniards and decreased by 67,000 among foreigners. The unemployment rate of the Spanish population was 13.47%, while that of the foreign population was 21.74%.
This quarter, unemployment increased in Services (42,100 more unemployed), Industry (28,700) and Construction (20,600). On the other hand, it decreased in Industry (18,800 fewer unemployed individuals).
Unemployment decreased by 171,200 persons among those who lost their job over a year ago and by 28,500 among those who are seeking their first job.
The evolution of unemployment in annual variation was -8.23%. The total number of unemployed persons has decreased by 306,200 persons in one year, with a decrease of 156,400 among the women and 149,900 for men.

Economically Active Population Survey (EAPS) - Third Quarter of 2021. (7/22)
Annual variation rate of unemployment. Percentage.
By age, the number of unemployed in the last year decreased in all groups, except those aged 55 and over, where it increased by 118,200 people. The largest decrease was in the 25-54 age group (326,100 fewer unemployed persons).
In the past year, unemployment decreased in all sectors: in Services (475,100 more), in Industry (-67,200), in Construction (-16,500) and in Agriculture (-13,400). On the other hand, the number of unemployed persons who lost their jobs over a year ago has increased by 260,300 and that of unemployed persons looking for their first job has risen by 5,600.
Economically active population and activity rate The economically active population experienced an increase of 232,200 persons in the third quarter of this year, standing at 23,447,700. The number of economically active women increased by 90,300, and that of men by 141,900.
By nationality, the number of economically active persons increased this quarter by 249,200 among Spaniards and while it decreased by 17,000 among foreign nationals.
The economic activity rate increased 56 hundredths, reaching 59.14%. The economic activity rate for males rose 71 hundredths, standing at 64.31%, and that of females increased 42 hundredths, to 54.25%.

Economically Active Population Survey (EAPS) - Third Quarter of 2021. (8/22)
Quarterly variation of activity. Thousands. (Q2 compared with Q1 of the same year)
The economic activity rate of Spaniards increased 66 hundredths as compared with the previous quarter, standing at 57.74%. For foreigners it fell by 21 hundredths to 70.21%. The difference of more than 12 points between both activity rates is mainly explained by the different age structures for both populations.
In annual terms, the economically active population has increased by 547,900 persons. The annual variation rate of economically active persons was 2.39%.
Annual variation rate of activity. Percentage.

Economically Active Population Survey (EAPS) - Third Quarter of 2021. (9/22)
Households The number of households increased by 26,900 this quarter, standing at 18,923,400. Of these, 5,061,700 were single-person households.
Households in which all economically active members were unemployed decreased by 35,800 this quarter, reaching a total of 1,122,100. Of these, 314,700 were single-person households.
On the other hand, the number of households in which all of the economically active members were employed increased by 197,300, standing at 10,798,900. Of these, 2,153,100 were single-person households.
In annual comparison, the number of households with at least one economically active member in which those members were unemployed has decreased by 50,700, while those where all active members were employed has increased by 468,100.
Additional indicators on the quarterly evolution of the EAPS Given the rather extraordinary circumstances that occurred beginning on March 16th of 2020, it has been deemed advisable that certain results be added to this press release to provide a better understanding of what happened in the labour market since then.
Employed persons who have not worked The number of employed persons who had not worked during the reference week amounted to 3,810,400 this quarter, or 2,312,000 more than in the previous quarter.
Employed persons not working in the reference week. Thousands
The increase could be attributed to the holiday period (2,460,600 more employees were not working for this reason). Sick leave fell by 33,500 this quarter, while absences related to Temporary Workforce Reduction Schemea (ERTE) declined by 108,600.

Economically Active Population Survey (EAPS) - Third Quarter of 2021. (10/22)
Quarterly variation of employed persons not working in the reference week due to lay off or lack of work. Thousands.
Effective hours worked The total number of effective hours worked has decreased by nearly 10% compared to the previous quarter. In annual change, the effective hours worked grew 5.06%.
Quarterly variation of actual working hours in the reference week for all employed persons . Percentage (Q3 compared with Q2 of the same year)

Economically Active Population Survey (EAPS) - Third Quarter of 2021. (11/22)
Work from home and atypical hours Since the second quarter of 2020, the EAPS has offered quarterly results of the variables on work at home and atypical hours, which are usually annual. This makes it possible to compare these figures with those of the annual subsample from previous years, as a reference.
In the third quarter, 8.0% of employed persons (1,596,500) worked from their own home more than half the days, as compared to 4.81% in 2019. This percentage is 1.4 points lower than the previous quarter (9.4%). In the second quarter of 2020, the percentage was 16.2%, while in the third quarter it was 10.3%.
Considering weekend work, the percentage of employed persons who worked on a Saturday in the last month was 34.6% this quarter, compared to 34.4% in the previous quarter. The percentage of those who worked on a Sunday was 21.4%, compared to 20.5% in the second quarter.
The percentage of regular work in the afternoons (more than half the days) was 17.2% this quarter, compared to 16.5% in the previous quarter. Regular night work was 4.8%, compared to 4.2% in the second semester.
For their part, employees who worked shifts represented 21.6% of the total in the third quarter of 2021, compared to 20.3% in the second.
Inactive persons The number of economically inactive individuals decreased by 216,000 compared to the previous quarter. After the large increase in the number of inactive people in the second quarter of 2020, caused by strict confinement and the difficulty of entering the labour market, the progressive normalisation of economic activity has reduced the number of economically inactive individuals: levels are now similar to those prior to the pandemic.
Quarterly variation of inactive persons. Thousands. (Q3 compared with Q2 of the same year)

Economically Active Population Survey (EAPS) - Third Quarter of 2021. (12/22)
As of the third quarter of 2020, with the real possibility of seeking employment, a part of those who were previously inactive but available for work contributed to the increase in unemployment or moved directly to employment. In the first quarter of 2021, the inactive individuals available for work rebounded, while it decreased again in the second. The third quarter of 2021 saw a reduction of 11,500 people.
This quarter, there were 902,400 persons who were not able to seek employment despite being available for work. They have thus been unable to fulfil all the ILO conditions to be classified as unemployed. There were 137,400 more than those observed in the third quarter of 2019 (with 765,000).
Quarterly variation of inactive persons available to work. Thousands
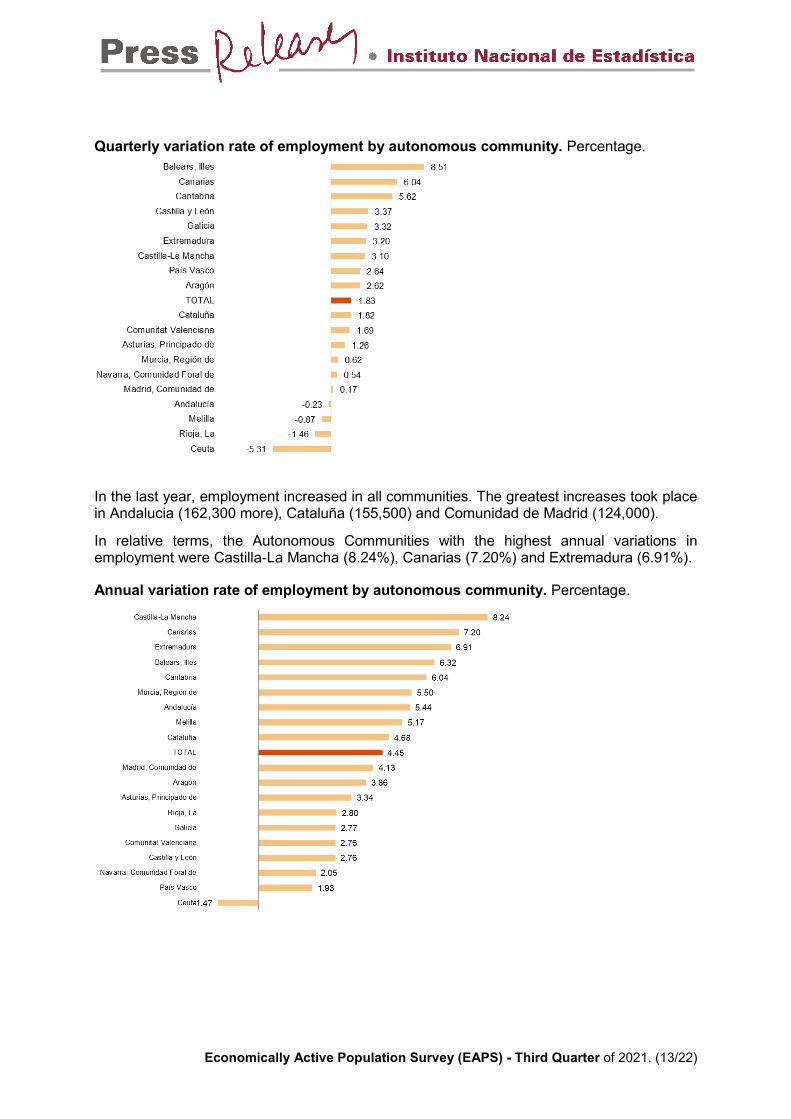
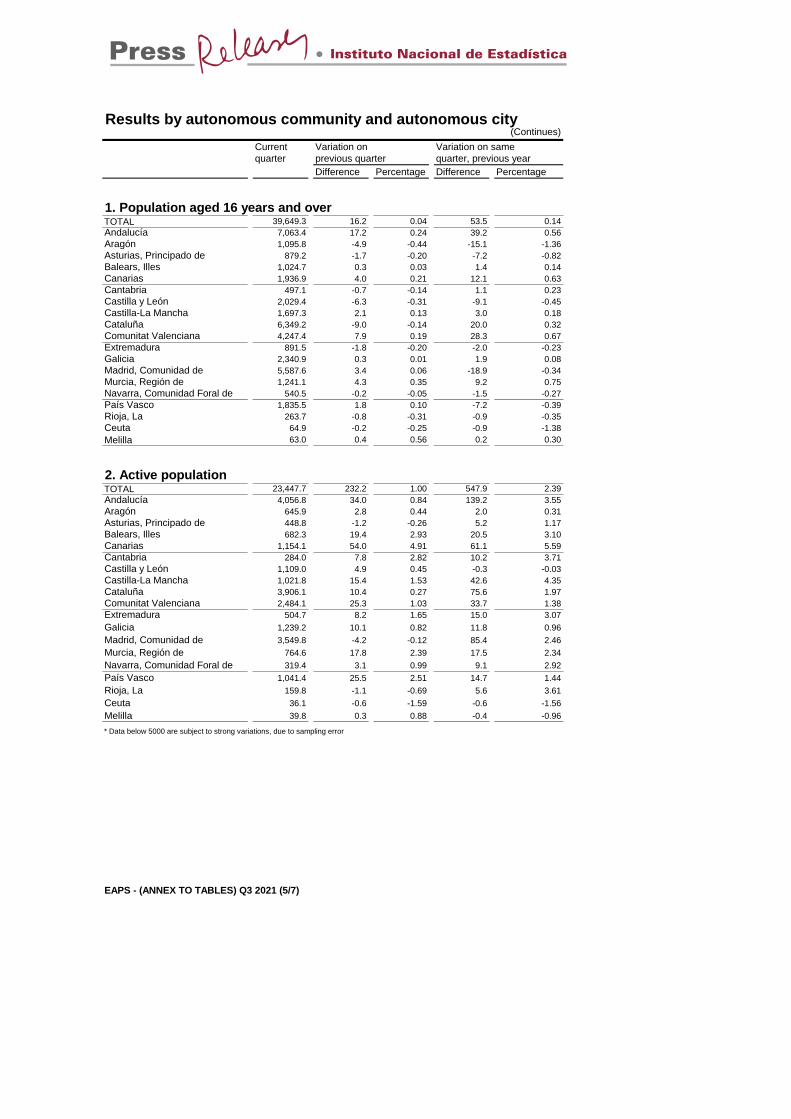
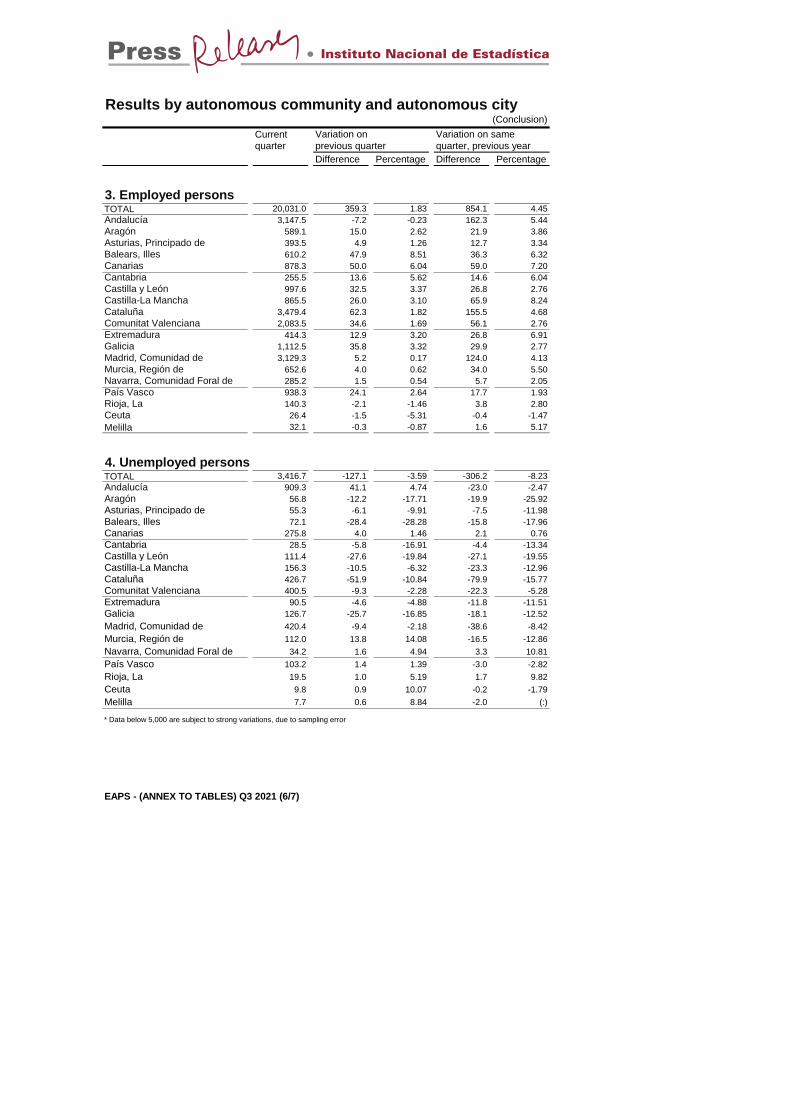
Results by Autonomous Communities3 The largest increases in employment this quarter were in Cataluña (62,300 more), Canarias (50,000) and Illes Balears (47,900). On the other hand, in Andalucia (–7,200) and in La Rioja (–2,100) there were declines in employment.
In relative terms, the Autonomous Communities with the greatest annual increase in employment were Illes Balears (8.51%), Canarias (6.04%) and Cantabria (5.62%).
3 As with the rest of the EAPS data, employment results in this section are presented according to the Autonomous Community where the persons interviewed in the survey reside, and not according to where their workplace is.
Economically Active Population Survey (EAPS) - Third Quarter of 2021. (13/22)
Quarterly variation rate of employment by autonomous community. Percentage.
In the last year, employment increased in all communities. The greatest increases took place in Andalucia (162,300 more), Cataluña (155,500) and Comunidad de Madrid (124,000).
In relative terms, the Autonomous Communities with the highest annual variations in employment were Castilla-La Mancha (8.24%), Canarias (7.20%) and Extremadura (6.91%).
Annual variation rate of employment by autonomous community. Percentage.

Economically Active Population Survey (EAPS) - Third Quarter of 2021. (14/22)
The greatest quarterly unemployment decreases occurred in Cataluña (-51,900), Illes Balears (-28,400) and Castilla-La Mancha (-27,600). On the other hand, the largest increases in unemployment occurred in Andalucia (41,100 more unemployed), Región de Murcia (13,800) and Canarias (4,000).
In annual terms, the greatest decreases in the number of unemployed persons occurred in Cataluña (-79,900), Comunidad de Madrid (-38,600) and Castilla y León (-27,100). On the other hand, the greatest unemployment increases over the last 12 months were observed in Comunidad Foral de Navarra (3,300 more unemployed people), Canarias (43,300) and La Rioja (1,700).
Aragón (8.79%), País Vasco (9.91%) and Cantabria (10.04%) recorded the lowest unemployment rates this quarter. At the other end of the scale, Canarias (23.89%), Andalucia (22.41%) and Extremadura (17.92%) showed the highest rates.
This quarter, the greatest increases in economic activity were registered in Canarias (54,000 more economically active individuals), Andalucia (34,000) and País Vasco (25,500). The greatest decreases were observed in Comunidad de Madrid (4,200 fewer active individuals), Principado de Asturias (–1,200) and La Rioja (–1,100).
The past 12 months have seen a general rise in the number of those who are economically active. Andalucía (139,200 more), Comunidad de Madrid (85,400) and Cataluña (75,600) presented the highest increases.
This quarter, the activity rates fluctuated between 66.58% for Illes Balears and 51.05% for Principado de Asturias.
Seasonally adjusted series In the third quarter of 2021, the quarterly employment variation rate, adjusted for seasonal effects, was 1.29%.
Quarterly variation rate of seasonally adjusted employment. Percentage.

Economically Active Population Survey (EAPS) - Third Quarter of 2021. (15/22)
As regards seasonally-adjusted unemployment results, there was a decrease of -2.35%.
Quarterly variation rate of seasonally adjusted unemployment. Percentage.
As explained in the methodology used for seasonal adjustment, the seasonal adjustment model is maintained for a year, with the first quarters corresponding to the time of the model’s re-identification, but the coefficients are recalculated quarterly, so that each quarter the previous results are reviewed (either by re-identification or by revision of coefficients) and therefore the latest series available must always be consulted.
The series of the quarterly variation rates of the seasonally adjusted results of employment and unemployment since 2005 and the description of the method used can be found in:
http://www.ine.es/daco/daco42/daco4211/epa_desestacional.xlsx
Flows in absolute values with respect to the previous quarter4 In this quarter there have been increases in the inflows to employment from the situations of inactivity and unemployment in the previous quarter and in the outflows from employment to both unemployment and inactivity. También se observa un aumento de los flujos al paro de los ocupados del trimestre anterior y un descenso del flujo de inactivos del trimestre anterior al paro en el actual. Los flujos de salida del desempleo han aumentado este trimestre.
Decreases in inactive persons aged 60 and over who were employed in the previous quarter were also observed, together with an increase in the flow of young people under 25 years of age into employment from a situation of inactivity previous quarter.
The relative normalization of economic activity in this quarter would at least partially explain these movements, which as a whole have led to a significant increase in the number of economically active persons.
4 This section compiles the results of the Economically Active Population Flow Statistics. Due to the methodology used in preparation, the results might not match the net balances of quarterly EAPS. The differences are caused by the “no data recorded” groups (persons turning 16 years old in the change between one quarter and the next and those who did not live in Spain in the previous quarter).

Economically Active Population Survey (EAPS) - Third Quarter of 2021. (16/22)
Flows of persons by labour status from Q2-2021 to Q3-2021
The total inflow into employment in the third quarter of 2021 was 1,618,700 people, 30,200 less than in the same quarter of the previous year.
However, the outflow from employment was 1,256,100 people, which is 4,100 more than in the same quarter of 2020.
Flows of persons becoming and ceasing to be employed each quarter. Thousands.
The number of persons who were unemployed three months ago but are not currently unemployed stood at 1,550,500, which is 13,500 fewer persons than in the same period in 2020.
Unemployed
Employed
Out of laboral market(not active)
Economically Active Population Survey (EAPS) - Third Quarter of 2021. (17/22)
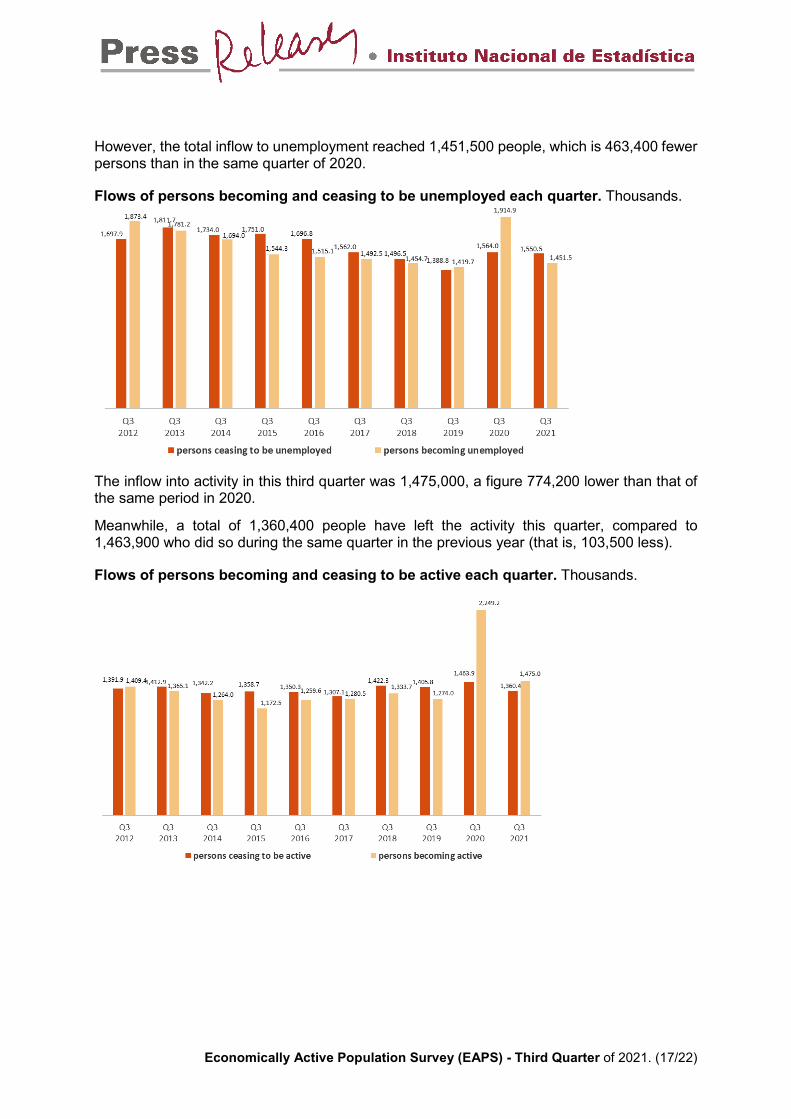
However, the total inflow to unemployment reached 1,451,500 people, which is 463,400 fewer persons than in the same quarter of 2020.
Flows of persons becoming and ceasing to be unemployed each quarter. Thousands.
The inflow into activity in this third quarter was 1,475,000, a figure 774,200 lower than that of the same period in 2020.
Meanwhile, a total of 1,360,400 people have left the activity this quarter, compared to 1,463,900 who did so during the same quarter in the previous year (that is, 103,500 less).
Flows of persons becoming and ceasing to be active each quarter. Thousands.
Economically Active Population Survey (EAPS) - Third Quarter of 2021. (18/22)
The outflow from employment to inactivity of people aged 60 and over was 114,200 this quarter. This figure is 6,000 higher than the one observed in the same period of 2020.
The number of people under 25 who have entered employment directly from inactivity this quarter stood at 281,900, a figure 63,200 higher than that observed in the same quarter of 2020.
The flow data on which these comments are based can be found in the annex to this press release http://www.ine.es/daco/daco42/daco4211/epafluj0321.xlsx
EAPS results by province The provincial results summary of the EAPS may be accessed via the following link:
http://www.ine.es/daco/daco42/daco4211/epapro0321.pdf
All the provincial information can also be accessed from the INEbase database:
http://www.ine.es/dynt3/inebase/index.html?padre=996
Data Review and Update The data published today are final. All results are available on INEBase.
Economically Active Population Survey (EAPS) - Third Quarter of 2021. (19/22)
Influence of COVID–19 on EAPS estimates
The pandemic caused by COVID-19, as well as the declarations of the high alert periods and the de-escalation periods, have had significant effects on the Labour Force Survey, both in terms of conducting the interviews and in terms of impact on the variables measured by the survey. What follows outlines a series of considerations to keep in mind when analysing the data.
Workers affected by a Temporary Workforce Reduction Scheme (ERTE) as a consequence of COVID-19 The consideration of workers affected by ERTE in the EAPS is in line with the recommendations given by the International Labour Organization (ILO) and the Statistical Office of the European Union (EUROSTAT) .
Specifically, according to Eurostat specifications for ERTEs in 2020, those suspended from employment are classified as employed so long as there is a guarantee of reincorporation into the workplace once the suspension period has ended.
A series of Royal Decrees published during the pandemic establish this guarantee.
For their part, workers affected by an ERTE with a reduction in working hours are employed, with this reduction being reflected in the hours of work performed.
Information on both cases can be found in the EAPS tables in INEbase.
In 2021, these criteria are continued in relation to ERTE to facilitate the continuity of the 2020 series.
Impact of the definition of unemployment During the situation caused by the pandemic, in which many activities have been halted and much of the population is in confinement during certain periods, many workers who have lost their jobs have not been able to carry out any type of job search because the companies that could hire them are closed. They are also unable to continue work as self-employed persons, or are unable to start a hypothetical job because the have to stay at home taking care of family dependents (children, the elderly, people with disabilities, etc.).
Failure to comply with either of these conditions for the definition of unemployment - active job search and availability to work - mean that the person is not classified as unemployed in the EAPS, but as rather as inactive. This contributes to the increase seen in the “inactive” category during the second quarter, as well as the subsequent, opposed evolution in subsequent quarters, once the de-escalation was generalized. The section on new questions and indicators describes those introduced to describe said evolution.
Economically Active Population Survey (EAPS) - Third Quarter of 2021. (20/22)
Circumstances related to data collection work Since the final weeks of the first quarter of 2020, it has not been possible to conduct face-to-face interviews. Due to the need to replace them with with telephone interviews in order to avoid health risks to informants and interviewers led to a decrease in the first interview sample size, since the phone numbers of all the new households entering the sample group for the first time were not available. This has not been the case for subsequent interviews, since these are mainly carried out by telephone.
Adding of questions in the second and third quarters. New indicators In the second quarter EAPS for 2020, exceptional questions were added -which have been kept in the third and fourth quarters, and extended to 2021- regarding work at home, why the person left or lost their last job, and atypical hours (on weekends, nights, etc.), which are usually only published in annual results. The purpose of this change is to analyse, in greater detail, the causes of lay-offs or job losses and the working day conditions.
At the same time, the following indicators are offered:
- Effective working hours for all employed persons
- Employed persons who have not worked, according to causes
- Transitions between different labour categories (employment, unemployment, inactivity)
- Persons who are not seeking employment even though they are able to work
- Persons who are seeking employment but are not able to join a workplace
The last two are new and were introduced during the pandemic. Their goal is to allow for analysis of increased inactivity.
Economically Active Population Survey (EAPS) - Third Quarter of 2021. (21/22)
Methodological note
The Labour Force Survey (EAPS) has been carried out since 1964. The methodology currently used was put in place in 2021, and adapts the previous methodology (begun in 2005) to the new regulations of the European Labour Force Survey.
It is a continuous, quarterly research addressed to families, whose main purpose is to obtain data on the labour force and its various categories (employed, unemployed), as well as on the population outside the labour market (inactive).
As of the third quarter of 2009, the survey includes an additional sample in Galicia that is collected by the Galician Statistics Institute (IGE) using the same fieldwork system and methodology as the INE.
Type of survey: quarterly continuous survey.
Population scope: population residing in family dwellings.
Geographical scope: the entire national territory.
Reference period of the results: the quarter.
Reference period of the information: the week before the interview.
Sample size: 3,822 census tracts, around 65,000 dwellings and 160,000 people. Of the 3,822 tracts, 234 correspond to the additional sample of Galicia. Gradually the number of sections will increase to a total of 5,298 in 2024, of which 288 correspond to the additional sample from Galicia. The number of homes selected per section will go from an average of 20 to 13.
Type of sampling: two-stage sampling with stratification in the first stage units. The first stage units are the census tracts and the second stage units are the inhabited family dwellings.
Collection method: personal, telephone, and web interview.
For more information, the methodology and technical details of the survey design and data quality assessment can be accessed at:
https://www.ine.es/dyngs/INEbase/es/operacion.htm?c=Estadistica_C&cid=1254736176918&menu=metodologia&idp=1254735976595
The standardized methodological report is at:
https://www.ine.es/dynt3/metadatos/es/RespuestaDatos.html?oe=30308
INE statistics are produced in accordance with the Code of Good Practice for European Statistics, which is the basis for the institution's quality policy and strategy. For more information, please see the Calidad en el INE y Código de Buenas Prácticas Quality at INE and the Code of Good Practices on the INE website.

Economically Active Population Survey (EAPS) - Third Quarter of 2021. (22/22)
The Statistics on Economically Active Population Flows (EAPFS) collect information regarding the follow-up of the population, or specific groups thereof, between one quarter and the previous one in absolute values, regarding its relation with labour market. This information links the interviewee's situations in two moments of time on the basis of the EAPS in order to study its evolution.
Given that in the EAPS sample one sixth is renewed each quarter and the remaining 5/6 parts are kept fixed between two consecutive quarters, the common part of the sample between the two conducts of the survey is used to obtain flow statistics from the questions relating to the situation in which the interviewee was in the current and previous quarters.
Type of survey: quarterly exploitation of the common EAPS sample between consecutive quarters that provides estimates in absolute values of the relation with the activity in the current period compared with that of the previous quarter.
Population scope: population residing in family dwellings.
Geographical scope: the entire national territory.
Reference period of the results: the quarter.
Reference period of the information: the week before the interview.
Sample size: 3,822 census tracts. The common EAPS sample between consecutive quarters is approximately 100,000 people aged 16 and older. Gradually the number of sections will increase to a total of 5,298 in 2024, of which 288 correspond to the additional sample from Galicia. The number of homes selected per section will go from an average of 20 to 13.
Type of sampling: two-stage sampling with stratification in the first stage units. The first stage units are the census tracts and the second stage units are the inhabited family dwellings.
Collection method: personal and telephone interview.
For more information the methodology can be accessed at:
https://www.ine.es/inebaseDYN/flujos30310/docs/metoflujos_valores_absolutos.pdf
The standardized methodological report is at:
https://www.ine.es/dynt3/metadatos/es/RespuestaDatos.html?oe=30310
For further information see INEbase: www.ine.es/en/ Twitter: @es_ine All press releases at: www.ine.es/en/prensa/prensa_en.htm Press Office: Telephone numbers: (+34) 91 583 93 63 /94 08 – [email protected] Information Area: Telephone number: (+34) 91 583 91 00 – www.ine.es/infoine/?L=1

Economically Active Population SurveyThird Quarter 2021
National results (Continues)
Current Variation on Variation on same
quarter previous quarter quarter, previous year
Difference Percentage Difference Percentage
1. Population aged 16 years and over by sex and labour statusBOTH SEXES
Population aged 16 years and over 39,649.3 16.2 0.04 53.5 0.14
Active population 23,447.7 232.2 1.00 547.9 2.39
- Employed persons 20,031.0 359.3 1.83 854.1 4.45
- Unemployed persons 3,416.7 -127.1 -3.59 -306.2 -8.23
Inactive population 16,201.6 -216.0 -1.32 -494.4 -2.96
Activity rate 59.14 0.56 - 1.30 -
Unemployment rate 14.57 -0.69 - -1.69 -
Population aged 16 to 64 years 30,534.7 -24.9 -0.08 -73.8 -0.24
Activity rate (16-64) 75.82 0.82 - 1.87 -
Unemployment rate (16-64) 14.68 -0.71 - -1.71 -
Employment rate (16-64) 64.69 1.24 - 2.86 -
MALES
Population aged 16 years and over 19,267.3 7.3 0.04 17.3 0.09
Active population 12,390.0 141.9 1.16 178.4 1.46
- Employed persons 10,782.5 173.9 1.64 328.3 3.14
- Unemployed persons 1,607.5 -32.0 -1.95 -149.9 -8.53
Inactive population 6,877.3 -134.7 -1.92 -161.1 -2.29
Activity rate 64.31 0.71 - 0.87 -
Unemployment rate 12.97 -0.41 - -1.42 -
Population aged 16 to 64 years 15,254.3 -11.9 -0.08 -42.9 -0.28
Activity rate (16-64) 80.12 1.00 - 1.29 -
Unemployment rate (16-64) 13.06 -0.44 - -1.44 -
Employment rate (16-64) 69.66 1.22 - 2.26 -
FEMALES
Population aged 16 years and over 20,382.0 8.9 0.04 36.2 0.18
Active population 11,057.7 90.3 0.82 369.5 3.46
- Employed persons 9,248.5 185.4 2.05 525.9 6.03
- Unemployed persons 1,809.2 -95.1 -5.00 -156.4 -7.95
Inactive population 9,324.3 -81.4 -0.87 -333.3 -3.45
Activity rate 54.25 0.42 - 1.72 -
Unemployment rate 16.36 -1.00 - -2.03 -
Population aged 16 to 64 years 15,280.4 -13.0 -0.08 -30.9 -0.20
Activity rate (16-64) 71.53 0.64 - 2.46 -
Unemployment rate (16-64) 16.48 -1.01 - -2.04 -
Employment rate (16-64) 59.74 1.25 - 3.46 -
2. Spanish population(1)
aged 16 years and over by labour status
SPANISH POPULATION AGED 16 YEARS AND OVER 35,198.7 27.3 0.08 86.9 0.25
Active population 20,322.8 249.2 1.24 559.9 2.83
- Employed persons 17,585.4 309.4 1.79 740.7 4.40
- Unemployed persons 2,737.4 -60.1 -2.15 -180.8 -6.20
Inactive population 14,876.0 -221.9 -1.47 -473.0 -3.08
Activity rate 57.74 0.66 - 1.45 -
Unemployment rate 13.47 -0.47 - -1.30 -(1) including dual nationality
28 October 2021
EAPS - (ANNEX TO TABLES) Q3 2021 (1/7)
National results (Continuation)
Current Variation on Variation on same
quarter previous quarter quarter, previous year
Difference Percentage Difference Percentage
3. Foreign population aged 16 years and over by labour status
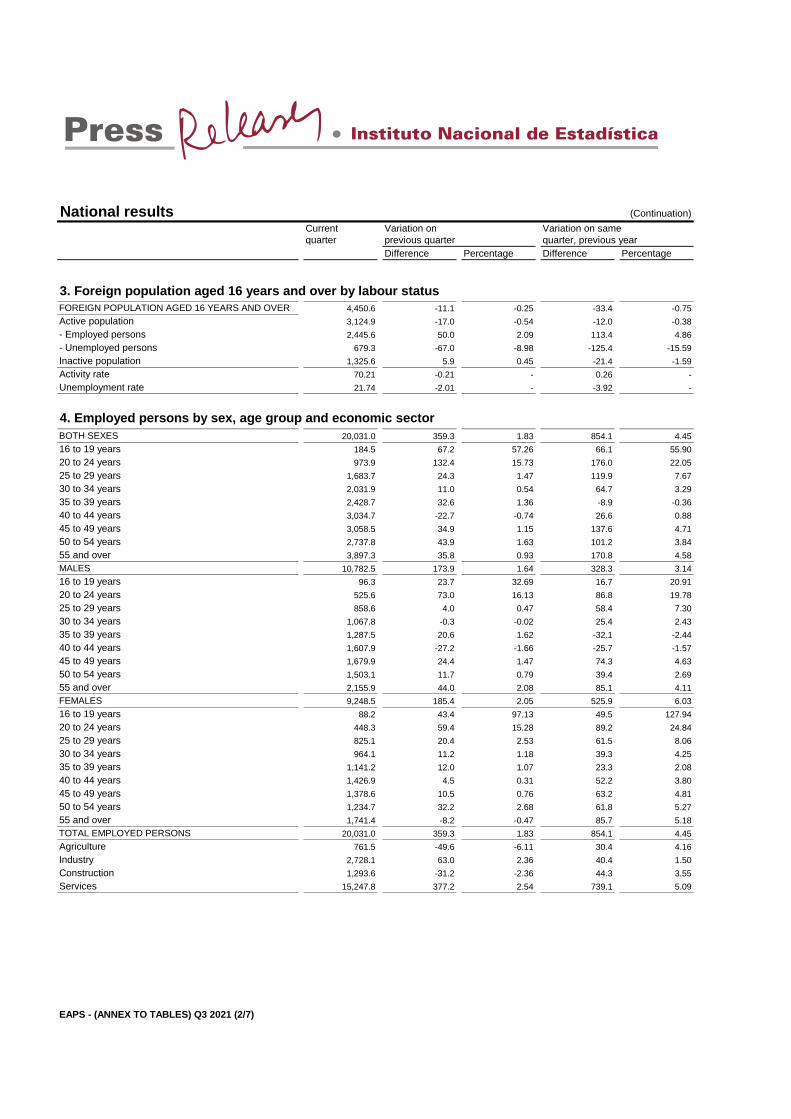
FOREIGN POPULATION AGED 16 YEARS AND OVER 4,450.6 -11.1 -0.25 -33.4 -0.75
Active population 3,124.9 -17.0 -0.54 -12.0 -0.38
- Employed persons 2,445.6 50.0 2.09 113.4 4.86
- Unemployed persons 679.3 -67.0 -8.98 -125.4 -15.59
Inactive population 1,325.6 5.9 0.45 -21.4 -1.59
Activity rate 70.21 -0.21 - 0.26 -
Unemployment rate 21.74 -2.01 - -3.92 -
4. Employed persons by sex, age group and economic sector
BOTH SEXES 20,031.0 359.3 1.83 854.1 4.45
16 to 19 years 184.5 67.2 57.26 66.1 55.90
20 to 24 years 973.9 132.4 15.73 176.0 22.05
25 to 29 years 1,683.7 24.3 1.47 119.9 7.67
30 to 34 years 2,031.9 11.0 0.54 64.7 3.29
35 to 39 years 2,428.7 32.6 1.36 -8.9 -0.36
40 to 44 years 3,034.7 -22.7 -0.74 26.6 0.88
45 to 49 years 3,058.5 34.9 1.15 137.6 4.71
50 to 54 years 2,737.8 43.9 1.63 101.2 3.84
55 and over 3,897.3 35.8 0.93 170.8 4.58
MALES 10,782.5 173.9 1.64 328.3 3.14
16 to 19 years 96.3 23.7 32.69 16.7 20.91
20 to 24 years 525.6 73.0 16.13 86.8 19.78
25 to 29 years 858.6 4.0 0.47 58.4 7.30
30 to 34 years 1,067.8 -0.3 -0.02 25.4 2.43
35 to 39 years 1,287.5 20.6 1.62 -32.1 -2.44
40 to 44 years 1,607.9 -27.2 -1.66 -25.7 -1.57
45 to 49 years 1,679.9 24.4 1.47 74.3 4.63
50 to 54 years 1,503.1 11.7 0.79 39.4 2.69
55 and over 2,155.9 44.0 2.08 85.1 4.11
FEMALES 9,248.5 185.4 2.05 525.9 6.03
16 to 19 years 88.2 43.4 97.13 49.5 127.94
20 to 24 years 448.3 59.4 15.28 89.2 24.84
25 to 29 years 825.1 20.4 2.53 61.5 8.06
30 to 34 years 964.1 11.2 1.18 39.3 4.25
35 to 39 years 1,141.2 12.0 1.07 23.3 2.08
40 to 44 years 1,426.9 4.5 0.31 52.2 3.80
45 to 49 years 1,378.6 10.5 0.76 63.2 4.81
50 to 54 years 1,234.7 32.2 2.68 61.8 5.27
55 and over 1,741.4 -8.2 -0.47 85.7 5.18
TOTAL EMPLOYED PERSONS 20,031.0 359.3 1.83 854.1 4.45
Agriculture 761.5 -49.6 -6.11 30.4 4.16
Industry 2,728.1 63.0 2.36 40.4 1.50
Construction 1,293.6 -31.2 -2.36 44.3 3.55
Services 15,247.8 377.2 2.54 739.1 5.09
EAPS - (ANNEX TO TABLES) Q3 2021 (2/7)
National results (Continuation)
Current Variation on Variation on same
quarter previous quarter quarter, previous year
Difference Percentage Difference Percentage
5. Employed persons by professional status, type of contract,
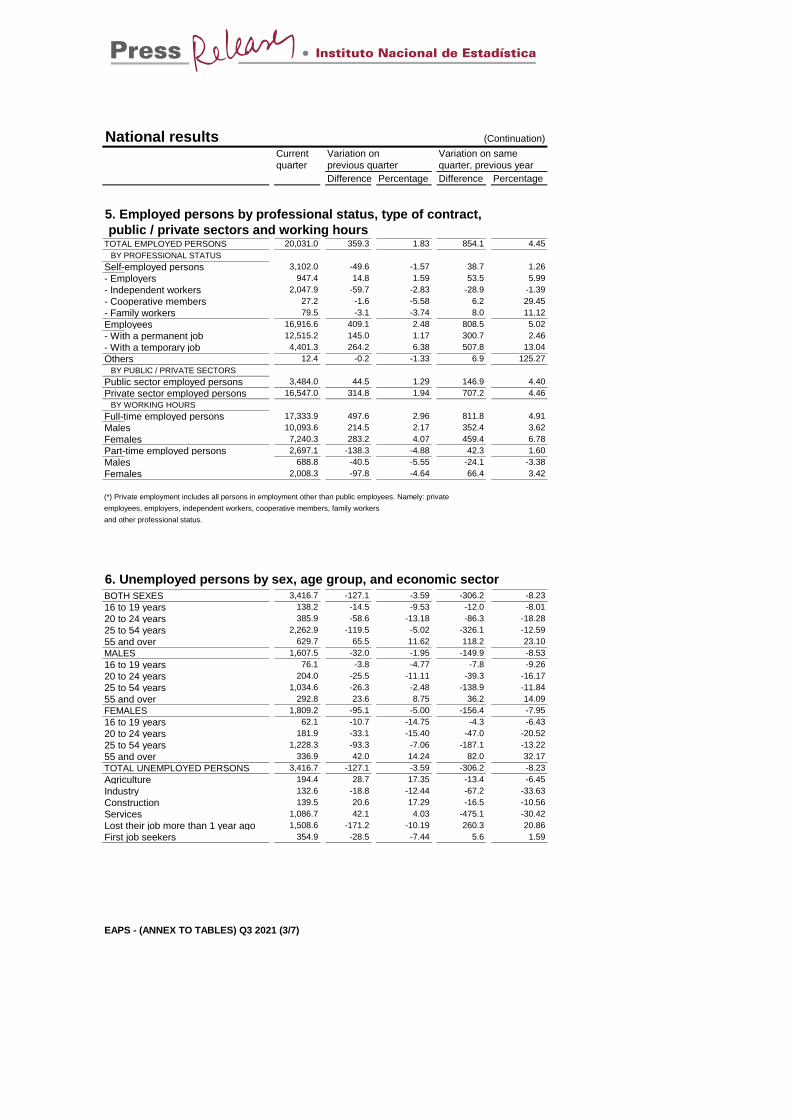
public / private sectors and working hoursTOTAL EMPLOYED PERSONS 20,031.0 359.3 1.83 854.1 4.45
BY PROFESSIONAL STATUS
Self-employed persons 3,102.0 -49.6 -1.57 38.7 1.26
- Employers 947.4 14.8 1.59 53.5 5.99
- Independent workers 2,047.9 -59.7 -2.83 -28.9 -1.39
- Cooperative members 27.2 -1.6 -5.58 6.2 29.45
- Family workers 79.5 -3.1 -3.74 8.0 11.12
Employees 16,916.6 409.1 2.48 808.5 5.02
- With a permanent job 12,515.2 145.0 1.17 300.7 2.46
- With a temporary job 4,401.3 264.2 6.38 507.8 13.04
Others 12.4 -0.2 -1.33 6.9 125.27
BY PUBLIC / PRIVATE SECTORS
Public sector employed persons 3,484.0 44.5 1.29 146.9 4.40
Private sector employed persons 16,547.0 314.8 1.94 707.2 4.46
BY WORKING HOURS
Full-time employed persons 17,333.9 497.6 2.96 811.8 4.91
Males 10,093.6 214.5 2.17 352.4 3.62
Females 7,240.3 283.2 4.07 459.4 6.78
Part-time employed persons 2,697.1 -138.3 -4.88 42.3 1.60
Males 688.8 -40.5 -5.55 -24.1 -3.38
Females 2,008.3 -97.8 -4.64 66.4 3.42
(*) Private employment includes all persons in employment other than public employees. Namely: private
employees, employers, independent workers, cooperative members, family workers
and other professional status.
6. Unemployed persons by sex, age group, and economic sector
BOTH SEXES 3,416.7 -127.1 -3.59 -306.2 -8.23
16 to 19 years 138.2 -14.5 -9.53 -12.0 -8.01
20 to 24 years 385.9 -58.6 -13.18 -86.3 -18.28
25 to 54 years 2,262.9 -119.5 -5.02 -326.1 -12.59
55 and over 629.7 65.5 11.62 118.2 23.10
MALES 1,607.5 -32.0 -1.95 -149.9 -8.53
16 to 19 years 76.1 -3.8 -4.77 -7.8 -9.26
20 to 24 years 204.0 -25.5 -11.11 -39.3 -16.17
25 to 54 years 1,034.6 -26.3 -2.48 -138.9 -11.84
55 and over 292.8 23.6 8.75 36.2 14.09
FEMALES 1,809.2 -95.1 -5.00 -156.4 -7.95
16 to 19 years 62.1 -10.7 -14.75 -4.3 -6.43
20 to 24 years 181.9 -33.1 -15.40 -47.0 -20.52
25 to 54 years 1,228.3 -93.3 -7.06 -187.1 -13.22
55 and over 336.9 42.0 14.24 82.0 32.17
TOTAL UNEMPLOYED PERSONS 3,416.7 -127.1 -3.59 -306.2 -8.23
Agriculture 194.4 28.7 17.35 -13.4 -6.45
Industry 132.6 -18.8 -12.44 -67.2 -33.63
Construction 139.5 20.6 17.29 -16.5 -10.56
Services 1,086.7 42.1 4.03 -475.1 -30.42
Lost their job more than 1 year ago 1,508.6 -171.2 -10.19 260.3 20.86
First job seekers 354.9 -28.5 -7.44 5.6 1.59
EAPS - (ANNEX TO TABLES) Q3 2021 (3/7)
National results (Conclusion)
Current Variation on Variation on same
quarter previous quarter quarter, previous year
Difference Percentage Difference Percentage
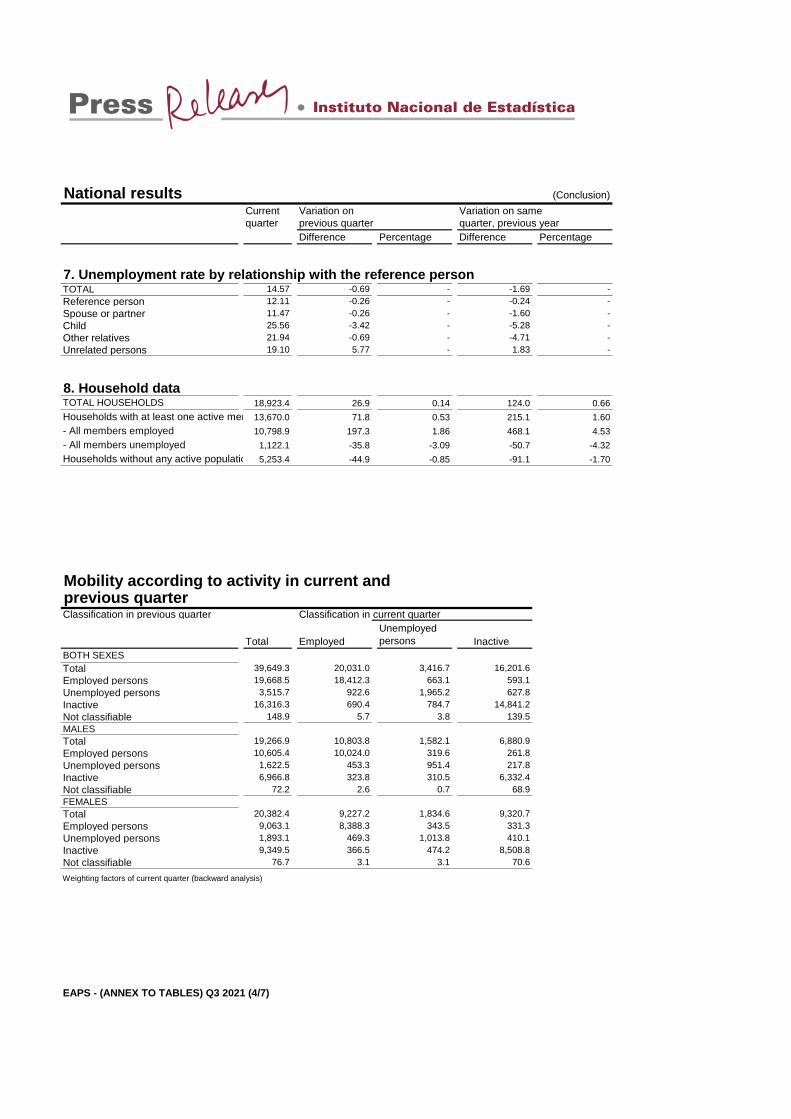
7. Unemployment rate by relationship with the reference personTOTAL 14.57 -0.69 - -1.69 -
Reference person 12.11 -0.26 - -0.24 -
Spouse or partner 11.47 -0.26 - -1.60 -
Child 25.56 -3.42 - -5.28 -
Other relatives 21.94 -0.69 - -4.71 -
Unrelated persons 19.10 5.77 - 1.83 -
8. Household dataTOTAL HOUSEHOLDS 18,923.4 26.9 0.14 124.0 0.66
Households with at least one active member13,670.0 71.8 0.53 215.1 1.60
- All members employed 10,798.9 197.3 1.86 468.1 4.53
- All members unemployed 1,122.1 -35.8 -3.09 -50.7 -4.32
Households without any active population 5,253.4 -44.9 -0.85 -91.1 -1.70
Mobility according to activity in current and previous quarterClassification in previous quarter Classification in current quarter
Total Employed
Unemployed
persons Inactive
BOTH SEXES
Total 39,649.3 20,031.0 3,416.7 16,201.6
Employed persons 19,668.5 18,412.3 663.1 593.1
Unemployed persons 3,515.7 922.6 1,965.2 627.8
Inactive 16,316.3 690.4 784.7 14,841.2
Not classifiable 148.9 5.7 3.8 139.5
MALES
Total 19,266.9 10,803.8 1,582.1 6,880.9
Employed persons 10,605.4 10,024.0 319.6 261.8
Unemployed persons 1,622.5 453.3 951.4 217.8
Inactive 6,966.8 323.8 310.5 6,332.4
Not classifiable 72.2 2.6 0.7 68.9
FEMALES
Total 20,382.4 9,227.2 1,834.6 9,320.7
Employed persons 9,063.1 8,388.3 343.5 331.3
Unemployed persons 1,893.1 469.3 1,013.8 410.1
Inactive 9,349.5 366.5 474.2 8,508.8
Not classifiable 76.7 3.1 3.1 70.6
Weighting factors of current quarter (backward analysis)
EAPS - (ANNEX TO TABLES) Q3 2021 (4/7)
Results by autonomous community and autonomous city (Continues)
Current Variation on Variation on same
quarter previous quarter quarter, previous year
Difference Percentage Difference Percentage
1. Population aged 16 years and over TOTAL 39,649.3 16.2 0.04 53.5 0.14
Andalucía 7,063.4 17.2 0.24 39.2 0.56
Aragón 1,095.8 -4.9 -0.44 -15.1 -1.36
Asturias, Principado de 879.2 -1.7 -0.20 -7.2 -0.82
Balears, Illes 1,024.7 0.3 0.03 1.4 0.14
Canarias 1,936.9 4.0 0.21 12.1 0.63
Cantabria 497.1 -0.7 -0.14 1.1 0.23
Castilla y León 2,029.4 -6.3 -0.31 -9.1 -0.45
Castilla-La Mancha 1,697.3 2.1 0.13 3.0 0.18
Cataluña 6,349.2 -9.0 -0.14 20.0 0.32
Comunitat Valenciana 4,247.4 7.9 0.19 28.3 0.67
Extremadura 891.5 -1.8 -0.20 -2.0 -0.23
Galicia 2,340.9 0.3 0.01 1.9 0.08
Madrid, Comunidad de 5,587.6 3.4 0.06 -18.9 -0.34
Murcia, Región de 1,241.1 4.3 0.35 9.2 0.75
Navarra, Comunidad Foral de 540.5 -0.2 -0.05 -1.5 -0.27
País Vasco 1,835.5 1.8 0.10 -7.2 -0.39
Rioja, La 263.7 -0.8 -0.31 -0.9 -0.35
Ceuta 64.9 -0.2 -0.25 -0.9 -1.38
Melilla 63.0 0.4 0.56 0.2 0.30
2. Active populationTOTAL 23,447.7 232.2 1.00 547.9 2.39
Andalucía 4,056.8 34.0 0.84 139.2 3.55
Aragón 645.9 2.8 0.44 2.0 0.31
Asturias, Principado de 448.8 -1.2 -0.26 5.2 1.17
Balears, Illes 682.3 19.4 2.93 20.5 3.10
Canarias 1,154.1 54.0 4.91 61.1 5.59
Cantabria 284.0 7.8 2.82 10.2 3.71
Castilla y León 1,109.0 4.9 0.45 -0.3 -0.03
Castilla-La Mancha 1,021.8 15.4 1.53 42.6 4.35
Cataluña 3,906.1 10.4 0.27 75.6 1.97
Comunitat Valenciana 2,484.1 25.3 1.03 33.7 1.38
Extremadura 504.7 8.2 1.65 15.0 3.07
Galicia 1,239.2 10.1 0.82 11.8 0.96
Madrid, Comunidad de 3,549.8 -4.2 -0.12 85.4 2.46
Murcia, Región de 764.6 17.8 2.39 17.5 2.34
Navarra, Comunidad Foral de 319.4 3.1 0.99 9.1 2.92
País Vasco 1,041.4 25.5 2.51 14.7 1.44
Rioja, La 159.8 -1.1 -0.69 5.6 3.61
Ceuta 36.1 -0.6 -1.59 -0.6 -1.56
Melilla 39.8 0.3 0.88 -0.4 -0.96
* Data below 5000 are subject to strong variations, due to sampling error
EAPS - (ANNEX TO TABLES) Q3 2021 (5/7)
Results by autonomous community and autonomous city (Conclusion)
Current Variation on Variation on same
quarter previous quarter quarter, previous year
Difference Percentage Difference Percentage
3. Employed personsTOTAL 20,031.0 359.3 1.83 854.1 4.45
Andalucía 3,147.5 -7.2 -0.23 162.3 5.44
Aragón 589.1 15.0 2.62 21.9 3.86
Asturias, Principado de 393.5 4.9 1.26 12.7 3.34
Balears, Illes 610.2 47.9 8.51 36.3 6.32
Canarias 878.3 50.0 6.04 59.0 7.20
Cantabria 255.5 13.6 5.62 14.6 6.04
Castilla y León 997.6 32.5 3.37 26.8 2.76
Castilla-La Mancha 865.5 26.0 3.10 65.9 8.24
Cataluña 3,479.4 62.3 1.82 155.5 4.68
Comunitat Valenciana 2,083.5 34.6 1.69 56.1 2.76
Extremadura 414.3 12.9 3.20 26.8 6.91
Galicia 1,112.5 35.8 3.32 29.9 2.77
Madrid, Comunidad de 3,129.3 5.2 0.17 124.0 4.13
Murcia, Región de 652.6 4.0 0.62 34.0 5.50
Navarra, Comunidad Foral de 285.2 1.5 0.54 5.7 2.05
País Vasco 938.3 24.1 2.64 17.7 1.93
Rioja, La 140.3 -2.1 -1.46 3.8 2.80
Ceuta 26.4 -1.5 -5.31 -0.4 -1.47
Melilla 32.1 -0.3 -0.87 1.6 5.17
4. Unemployed personsTOTAL 3,416.7 -127.1 -3.59 -306.2 -8.23
Andalucía 909.3 41.1 4.74 -23.0 -2.47
Aragón 56.8 -12.2 -17.71 -19.9 -25.92
Asturias, Principado de 55.3 -6.1 -9.91 -7.5 -11.98
Balears, Illes 72.1 -28.4 -28.28 -15.8 -17.96
Canarias 275.8 4.0 1.46 2.1 0.76
Cantabria 28.5 -5.8 -16.91 -4.4 -13.34
Castilla y León 111.4 -27.6 -19.84 -27.1 -19.55
Castilla-La Mancha 156.3 -10.5 -6.32 -23.3 -12.96
Cataluña 426.7 -51.9 -10.84 -79.9 -15.77
Comunitat Valenciana 400.5 -9.3 -2.28 -22.3 -5.28
Extremadura 90.5 -4.6 -4.88 -11.8 -11.51
Galicia 126.7 -25.7 -16.85 -18.1 -12.52
Madrid, Comunidad de 420.4 -9.4 -2.18 -38.6 -8.42
Murcia, Región de 112.0 13.8 14.08 -16.5 -12.86
Navarra, Comunidad Foral de 34.2 1.6 4.94 3.3 10.81
País Vasco 103.2 1.4 1.39 -3.0 -2.82
Rioja, La 19.5 1.0 5.19 1.7 9.82
Ceuta 9.8 0.9 10.07 -0.2 -1.79
Melilla 7.7 0.6 8.84 -2.0 (:)
* Data below 5,000 are subject to strong variations, due to sampling error
EAPS - (ANNEX TO TABLES) Q3 2021 (6/7)

Results by autonomous community and autonomous city (Absolute figures in thousands and rates in percentage)
5. Employed and unemployed persons by sex. Activity and unemployment ratesBoth sexes Males Females
Employed
persons
Unemployed
persons
Activity
rate
Unem.
rate
Employed
persons
Unemployed
persons
Activity
rate
Unem.
Rate
Employed
persons
Unemployed
persons
Activity
rate
Unem.
Rate
TOTAL 20,031.0 3,416.7 59.14 14.57 10,782.5 1,607.5 64.31 12.97 9,248.5 1,809.2 54.25 16.36
Andalucía 3,147.5 909.3 57.43 22.41 1,775.5 428.0 63.85 19.42 1,372.1 481.3 51.30 25.97
Aragón 589.1 56.8 58.94 8.79 315.8 27.1 63.97 7.91 273.3 29.7 54.11 9.79
Asturias, Principado de 393.5 55.3 51.05 12.32 206.6 26.7 55.91 11.43 186.9 28.7 46.66 13.29
Balears, Illes 610.2 72.1 66.58 10.57 329.1 35.7 71.65 9.78 281.1 36.4 61.58 11.47
Canarias 878.3 275.8 59.58 23.89 471.9 134.3 63.82 22.16 406.4 141.4 55.51 25.81
Cantabria 255.5 28.5 57.13 10.04 137.9 13.9 62.93 9.17 117.6 14.6 51.66 11.05
Castilla y León 997.6 111.4 54.65 10.05 551.6 46.2 59.83 7.72 446.0 65.3 49.62 12.77
Castilla-La Mancha 865.5 156.3 60.20 15.29 501.8 67.0 66.85 11.79 363.7 89.2 53.51 19.70
Cataluña 3,479.4 426.7 61.52 10.92 1,830.0 205.1 66.00 10.08 1,649.4 221.6 57.29 11.84
Comunitat Valenciana 2,083.5 400.5 58.48 16.12 1,140.1 185.8 63.96 14.01 943.4 214.7 53.27 18.54
Extremadura 414.3 90.5 56.61 17.92 239.8 37.4 62.99 13.49 174.5 53.1 50.40 23.32
Galicia 1,112.5 126.7 52.94 10.23 587.1 61.4 57.93 9.46 525.4 65.3 48.36 11.06
Madrid, Comunidad de 3,129.3 420.4 63.53 11.84 1,586.3 198.6 67.54 11.13 1,543.0 221.8 59.93 12.57
Murcia, Región de 652.6 112.0 61.61 14.65 365.5 53.7 68.27 12.82 287.1 58.3 55.08 16.87
Navarra, Comunidad Foral de 285.2 34.2 59.08 10.70 146.5 20.0 62.55 12.03 138.7 14.1 55.71 9.26
País Vasco 938.3 103.2 56.74 9.91 486.8 50.4 60.96 9.38 451.5 52.8 52.84 10.47
Rioja, La 140.3 19.5 60.60 12.21 75.5 8.3 65.28 9.96 64.8 11.2 56.17 14.69
Ceuta 26.4 9.8 55.70 27.07 15.3 4.2 61.90 21.68 11.0 5.5 49.81 33.45
Melilla 32.1 7.7 63.19 19.44 19.4 3.5 70.91 15.44 12.7 4.2 55.07 24.87
* Data below 5,000 are subject to strong variations, due to sampling errors
EAPS - (ANNEX TO TABLES) Q3 2021 (7/7)
Employed and Unemployed by sex EAPS
Third Quarter 2021
Employed. Thousands
Unemployed. Thousands
5,000
7,000
9,000
11,000
13,000
15,000
17,000
19,000
21,000
2006 Q
3
2007 Q
3
2008 Q
3
2009 Q
3
2010 Q
3
2011 Q
3
2012 Q
3
2013 Q
3
2014 Q
3
2015 Q
3
2016 Q
3
2017 Q
3
2018 Q
3
2019 Q
3
2020 Q
3
2021 Q
3
Both Males Females
0
1,000
2,000
3,000
4,000
5,000
6,000
7,000
2006 Q
3
2007 Q
3
2008 Q
3
2009 Q
3
2010 Q
3
2011 Q
3
2012 Q
3
2013 Q
3
2014 Q
3
2015 Q
3
2016 Q
3
2017 Q
3
2018 Q
3
2019 Q
3
2020 Q
3
2021 Q
3
Both Males Females

Activity and unemployment rates by sex EAPS
Third Quarter 2021
Unemployment rate. Percentage
Activity rate. Percentage
45
50
55
60
65
70
2006 Q
3
2007 Q
3
2008 Q
3
2009 Q
3
2010 Q
3
2011 Q
3
2012 Q
3
2013 Q
3
2014 Q
3
2015 Q
3
2016 Q
3
2017 Q
3
2018 Q
3
2019 Q
3
2020 Q
3
2021 Q
3
Both Males Females
5
10
15
20
25
30
2006 Q
3
2007 Q
3
2008 Q
3
2009 Q
3
2010 Q
3
2011 Q
3
2012 Q
3
2013 Q
3
2014 Q
3
2015 Q
3
2016 Q
3
2017 Q
3
2018 Q
3
2019 Q
3
2020 Q
3
2021 Q
3
Both Males Females

Employment by age EAPS
Third Quarter 2021
Employment. Thousands
0
500
1,000
1,500
2,000
2,500
3,000
3,500
4,000
4,500
14,100
14,300
14,500
14,700
14,900
15,100
15,300
Q42020
Q12021
Q22021
Q32021
Oth
er
gro
up
s
Gro
up
25
-54
year
s
16 - 19 years
20 - 24 years
25 - 54 years
55+ years
Gro
up
25-5
4
57.26
15.73
0.83
0.93
55.90
22.05
3.04
4.58
16 to 19 years
20 to 24 years
25 to 54 years
55 years andmore
Over the same quarter of the previous year Over the previous quarter
Variation of employment. Thousands

Unemployment by age EAPS
Third Quarter 2021
Unemployment. Thousands
0
100
200
300
400
500
600
700
2,100
2,300
2,500
2,700
2,900
3,100
Q42020
Q12021
Q22021
Q32021
Oth
er
gro
up
s
Gro
up
25
-54
16 - 19 years
20 - 24 years
25 - 54 years
55+ years
Gro
up
25
-54
-9.53
-13.18
-5.02
11.62
-8.01
-18.28
-12.59
23.10
16 to 19 years
20 to 24 years
25 to 54 years
55 years and more
Over the same quarter of the previous year Over the previous quarter
Variation of unemployment. Thousands

Third Quarter 2021 EAPS
Unemployment rate Percentage
14.57 )
Less than 12%
12 to less than 14%
14 to less than 18%
18% and more
(Spain=
1.83
-0.23
2.62
1.26
8.51
6.04
5.62
3.37
3.10
1.82
1.69
3.20
3.32
0.17
0.62
0.54
2.64
-1.46
-5.31
-0.87
4.45
5.44
3.86
3.34
6.32
7.20
6.04
2.76
8.24
4.68
2.76
6.91
2.77
4.13
5.50
2.05
1.93
2.80
-1.47
5.17
TOTAL
Andalucía
Aragón
Asturias, Principado de
Balears, Illes
Canarias
Cantabria
Castilla y León
Castilla-La Mancha
Cataluña
Comunitat Valenciana
Extremadura
Galicia
Madrid, Comunidad de
Murcia, Región de
Navarra, Comunidad Foral de
País Vasco
Rioja, La
Ceuta
Melilla
Over the previous quarter Over the same quarter of the previous year
Variation of employment. Percentage