economic’prospects’of’asean’economic’integraon’...
TRANSCRIPT

Economic Prospects of ASEAN Economic Integra5on RBAP 56TH CHARTER ANNIVERSARY SYMPOSIUM
12 November 2013
Felipe M. Medalla, Ph.D. Monetary Board Member

ASEAN COMMUNITY (AEC) BLUEPRINT TARGETS FREER FLOW OF:
GOODS SERVICES INVESTMENT CAPITAL SKILLED LABOR

WILL AEC CREATE TRADE OR JUST DIVERT TRADE? ASEAN Tariff Rates
Year
Ave. Tariff
Food, Beverage, Tobacco
Animal, Fish, Vegetable Products
Tex5les, Wood Pulp
Machinery, Transporta5on
ChemicalsPlas5cs
Singapore 2009 0% 0% 0% 0% 0% 0% Brunei 2011 1% 0% 0% 0% 4% 1% Malaysia 2010 1% 5% 1% 6% 5% 5% Indonesia 2011 6% 7% 5% 8% 5% 5% Myanmar 2008 6% 14% 6% 8% 2% 3% Philippines 2011 7% 11% 8% 8% 4% 4% Cambodia 2011 11% 19% 12% 6% 15% 10% Lao PDR 2008 11% 19% 16% 8% 9% 8% Thailand 2011 12% 28% 19% 9% 8% 6% Viet Nam 2009 12% 31% 13% 10% 8% 7%

PHILIPPINE MFN TARIFF RATES (COEFFICIENT OF VARION IN SMALLER FONT)
1996 1998 2000 2002 2004 All Industries 25.5 11.32 8.47 6.45 6.82
CV 1.02 0.96 0.99 1.17 1.07
Agriculture 29 15.9 11.5 10.4 11.3 CV 0.81 1.07 1.3 1.31 1.17
Fishing & forestry 22 9.4 6.7 5.8 6 CV 0.95 0.63 0.66 0.45 0.57
Manufacturing 28 11.38 8.5 6.39 6.76 CV 0.97 0.93 0.95 1.13 1.03

EXPORT GDP RATIOS (AT CURRENT PRICES) OF 5 ASEAN COUNTRIES
1990 1995 2000 2005 2007 2009 Indonesia 22.4 22.5 37.6 30 26.4 22.1 Malaysia 66.9 83.2 104.7 102.2 94.6 82.3 Philippines 18.5 23.5 50.2 41.7 35 23.9 Thailand 27 33.6 56.3 62.6 61.7 57.8 Vietnam 37.1 26.3 46.5 61.3 68.4 61.3

16 14 13
36 35 33
49 51 55
0102030405060708090
100
1989-‐1992 1993-‐2001 2002-‐2012
Share of Sectoral Output to GDP (in %)
Services
Industry
Agriculture
38 34 27
17 1716
45 49 57
0%10%20%30%40%50%60%70%80%90%100%
1989-‐1992 1993-‐2001 2002-‐2012
Sectoral Share of Total Employment(NEMPFTE)
Services
Industry
Agriculture
6

-‐10
-‐5
0
5
10
15
20
25
30
35
40
600
800
1,000
1,200
1,400
1,600
1,800
2,000
2,200Jan
Mar
May Jul
Sep
Nov Jan
Mar
May Jul
Sep
Nov Jan
Mar
May Jul
Sept
Nov Jan
Mar
May Jul
Sept
Nov Jan
Mar
May Jul
Sept
Nov Jan
Mar
May Jul
Sept
Nov Jan
Mar
May Jul
Sept
Nov Jan
Mar
May Jul
Sept
Nov Jan
Mar
May
July
2005 2006 2007 2008 2009 2010 2011 2012 2013
Overseas Filipinos' Remittances, Levels in US$ M and y-‐o-‐y growth in %
Cash Remittances, coursed thru banks (left scale)
Y-‐O-‐Y Growth Rate (%, right scale)
7

FTEs* Revenue Growth (%)(US$M) Change
from 2011Voice BPO 497,000 8,697 18.0%Non-‐voice BPO/KPO 154,380 2,470 20.0%ITO 57,078 1,160 17.0%Health and Info Mgt &Care 45,000 460 66.0%Engineering Services 10,836 206 20.0%Animation 9,000 132 3.0%Game Developments 3,500 50 251.0%Total FTEs 776,794 13,174 19.0%BPAP -‐ Business Process Association of the Philippines *FTE: Full-‐Time Equivalent
IT-‐BPAP OFFICIAL 2012 PERFORMANCE

0
5
10
15
20
25
30
35
40
Q1Q2Q3Q4Q1Q2Q3Q4Q1Q2Q3Q4Q1Q2Q3Q4Q1Q2Q3Q4Q1Q2Q3Q4Q1Q2Q3Q4Q1Q2Q3Q4Q1Q2Q3Q4Q1Q2Q3Q4Q1Q2Q3Q4Q1Q2Q3Q4Q1Q2Q3Q4Q1Q2Q3Q4Q1Q2Q3Q4Q1Q2
1998 1999 2000 2001 2002 2003 2004 2005 2006 2007 2008 2009 2010 2011 2012 2013
BPO output growth, year-‐on-‐year changes in %
(2000=100, under Renting and Other Business Activities) BPO output growth (1985=100, under Other Services, Private Business)
9

Philippine Total Factor Produc5vity growth (which used to be zero) now accounts for 40% of economic growth
-‐413
43 38 41
6-‐9
42
-‐4
73 70
4044
38
84
2 3
5
1622
13 1420
-‐20%
0%
20%
40%
60%
80%
100%
Percent Contribution to Potential GDP Growth Rate
Services FTE g.r.
Industry FTE g.r.
Capital Stock g.r.
Agri FTE g.r.
Trend TFP g.r.

14
16
18
20
22
24
26
28
1985
:04Q
1986
:02Q
1986
:04Q
1987
:02Q
1987
:04Q
1988
:02Q
1988
:04Q
1989
:02Q
1989
:04Q
1990
:02Q
1990
:04Q
1991
:02Q
1991
:04Q
1992
:02Q
1992
:04Q
1993
:02Q
1993
:04Q
1994
:02Q
1994
:04Q
1995
:02Q
1995
:04Q
1996
:02Q
1996
:04Q
1997
:02Q
1997
:04Q
1998
:02Q
1998
:04Q
1999
:02Q
1999
:04Q
2000
:02Q
2000
:04Q
2001
:02Q
2001
:04Q
2002
:02Q
2002
:04Q
2003
:02Q
2003
:04Q
2004
:02Q
2004
:04Q
2005
:02Q
2005
:04Q
2006
:02Q
2006
:04Q
2007
:02Q
2007
:04Q
2008
:02Q
2008
:04Q
2009
:02Q
2009
:04Q
2010
:02Q
2010
:04Q
2011
:02Q
2011
:04Q
2012
:02Q
2012
:04Q
2013
:02Q
Gross Capital Formation as a % of GDP, 2000=100, 1985-‐2013Q2
4-‐Quarter Moving Average
5-‐Year Moving Average
11
Low Investment Rate
Source of data: Bangko Sentral ng Pilipinas website: www.bsp.gov.ph, the Na=onal Income Accounts (NIA), NSCB.

12 Source of data: Bangko Sentral ng Pilipinas
-‐400
-‐200
0
200
400
600
800
1,000
1,200
Net Foreign Direct Investments (BPM6)* in Million USD, Jan 2011 to Jul 2013
DEBT INSTRUMENTS**
TOTAL EQUITY AND REIVESTMENT OF EARNINGS
T O TA L
* The BSP adopted the Balance of Payments, 6th edition (BPM6) compilation framework effective 22 March 2013 with the release of the full-‐year 2012 and revised 2011 BOP statistics.The major change in FDI compilation is the adoption of the asset and liability principle, where claims of non-‐resident direct investment enterprises from resident direct investors are now presented as reverse investment under net incurrence of liabilities/non-‐residents’ investments in the Philippines (previously presented in the Balance of Payments Manual, 5th edition (BPM5) as negative entry under assets/residents’ investments abroad). Conversely, claims of resident direct investment enterprises from foreign direct investors are now presented as reverse investment under net acquisition of financial assets/residents’ investments abroad (previously presentedas negative entry under liabilities/non-‐residents’ investments in the Philippines). ** BSP statistics on FDI covers actual investment inflows, which could be in the form of equity capital, reinvestment of earnings, and borrowings between affiliates. In contrast to investment data from other government sources, the BSP’s FDI data include investments where ownership by the foreign enterprise is at least 10 percent. Meanwhile, FDI data of Investment Promotion Agencies (IPAs) do not make use of the 10 percent threshold and includeborrowings from foreign sources that are non-‐affiliates of the domestic company. Furthermore, the BSP’s FDI data are presented in net terms (i.e., equity capital placements less withdrawals), while the IPAs’ FDI do not account forequity withdrawals.

13 Source of data: Bangko Sentral ng Pilipinas
-‐8000.0
-‐7000.0
-‐6000.0
-‐5000.0
-‐4000.0
-‐3000.0
-‐2000.0
-‐1000.0
0.0
1000.0
2000.0
-‐2500
-‐2000
-‐1500
-‐1000
-‐500
0
500
1000
1500
2000
2500
3000
Thailand: Net Foreign Direct Investment
Foreign Direct Investment: Net (left scale)
Growth Rate in % (right scale)
14 Source of data: Bangko Sentral ng Pilipinas
0
10000
20000
30000
40000
50000
60000
70000
-‐200
0
200
400
600
800
1000
1200
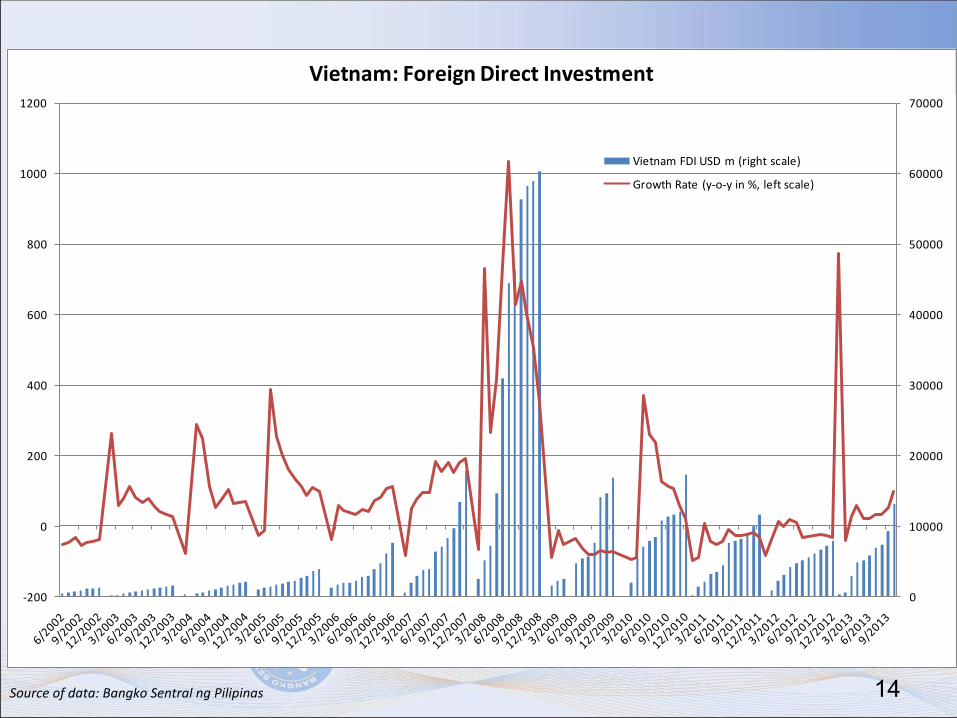
Vietnam: Foreign Direct Investment
Vietnam FDI USD m (right scale)
Growth Rate (y-‐o-‐y in %, left scale)

15 Source of data: Bangko Sentral ng Pilipinas
-‐100
-‐50
0
50
100
150
200
250
300
350
0
5,000
10,000
15,000
20,000
25,000
30,000
35,000
India: Foreign Direct Investment
India FDI, USD m (left scale)
Growth Rate in % (right scale)

16
Government’s Macroeconomic Outlook 2013
Projections2012 2013 2013
GDP Growth (%, 2000=100) 6.8 7.6 (H1) 6.0 -‐ 7.0 a/
Headline Inflation (%, 2006=100) 3.2 2.8 (Jan-‐Aug) 3.0 -‐ 5.0 a/
Exports Growth (%) Based on the BPM6 concept 20.9 7.9 (Q1) 11.0 a/
Based on NSO data 7.9 -‐3.4 (Jan-‐Jul)Imports Growth (%) Based on the BPM6 concept 11.3 -‐8.2 (Q1) 13.0 a/
Based on NSO data 2.7 -‐3.8 (Jan-‐Jun)OF Remittances1/
Amount (US$ Bn) 21.4 10.7 (Jan-‐Jun) 22.5b/
Growth Rate 6.3 5.6 5.0 b/
Current Account (US$ Bn) 7.1 3.4 (Q1) 7.0 b/
Balance of Payment (US$ Bn) 9.2 3.7 (Jan-‐Jun) 4.4b/
GIR (US$ Bn) 83.8 83.2 (end-‐Aug) 87.0 p/a/ Based on projections adopted by the Development Budget Coordinating Committee (DBCC) on 3 July 2013b/ Based on BSP projections presented during the Monetary Board meeting on 16 May 20131/ Cash remittances coursed through banksp/ revised
Actual

2012 and Sem1 2013 Philippine GDP stats look good, not just in the aggregate, but in terms of its components as well.
17
GDP Growth
By Industrial OriginShare to GDP
Growth Rate
Share to GDP
Growth Rate
Share to GDP
Growth Rate
Share to GDP
Growth Rate
Agriculture, Hunting, Forestry & Fishing 11.5 2.6 11.1 2.8 10.9 0.9 10.2 1.4 Industry 32.0 1.8 32.0 6.8 32.1 5.6 33.0 10.6 Of which: Manufacturing 22.4 4.7 22.1 5.4 22.1 4.1 22.6 9.9 Services 56.5 4.9 56.9 7.6 57.1 8.0 26.8 7.1 By ExpenditureHousehold Final Consumption 70.6 5.7 70.4 6.6 69.1 6.7 67.7 5.3 Government Final Consumption 9.9 2.1 10.3 12.2 11.5 13.2 12.3 15.3 Capital Formation 20.4 2.0 18.5 (3.2) 15.6 (15.7) 18.5 27.3 Of which: Fixed Capital 19.6 (2.0) 20.3 10.4 19.8 5.6 20.8 12.7 Of which: Public Construction 1.5 1.5 1.8 29.8 1.9 50.2 2.4 36.2 Private Construction 6.1 6.1 6.4 11.5 5.6 (4.9) 6.2 17.4 Durable Equipment 9.9 2.7 10.0 8.0 10.2 6.2 10.2 7.9 Exports 47.5 (2.8) 48.4 8.9 53.0 10.3 45.8 (7.0) Imports 48.3 (1.0) 47.6 5.3 49.0 3.3 45.2 (0.7) Source: NSCB
2011 2012 H1 2012 H1 20133.6 6.8 6.4 7.6

-‐3
-‐2
-‐1
0
1
2
3
4
Q1Q2Q3Q4Q1Q2Q3Q4Q1Q2Q3Q4Q1Q2Q3Q4Q1Q2Q3Q4Q1Q2Q3Q4Q1Q2Q3Q4Q1Q2Q3Q4Q1Q2Q3Q4Q1Q2Q3Q4Q1Q2Q3Q4Q1Q2Q3Q4Q1Q2Q3Q4Q1Q2Q3Q4Q1Q2
1999 2000 2001 2002 2003 2004 2005 2006 2007 2008 2009 2010 2011 2012 2013
Seasonally-‐Adjusted GDP Growth, in %
GDP Quarter on Quarter in %
4-‐Quarter Moving Average
In spite of sluggish global economic growth, seasonally-‐adjusted Philippine GDP Quarter-‐on-‐Quarter Growth are consistent with 6.0% growth.
18

19
Growth projec5ons are backed by infrastructure spending.
Particulars Levels (PHP Bn) 2012 Actual2013
Adjusted2014
Proposed2015
Projection 1/2016
Projection 1/
REVENUES 1,534.9 1,745.9 2,018.1 2,388.4 2,814.0 % of GDP 14.5 14.7 15.1 16.1 16.9 Growth Rate 12.9 13.7 15.6 18.4 17.8DISBURSEMENTS 1,777.8 1,983.9 2,284.3 2,685.4 3,146.1 % of GDP 16.8 16.7 17.1 18.1 18.9 Growth Rate 14.1 11.6 15.1 17.6 17.2 Current Operating Expenditures 1,393.0 1,558.5 1,736.5 1,895.6 2,060.1 Of which: Interest Payments 312.8 332.2 352.7 383.6 421.1 Capital Outlays 357.3 410.9 522.9 766.5 1,062.7 Of which: Infrastructure Outlays 2/ 237.3 299.4 418.2 601.5 834.5 % of GDP 2.3 2.5 3.1 4.0 5.0 Growth Rate 23.4 26.1 39.7 43.8 38.7 Net Lending 27.4 14.5 25.0 23.3 23.3Deficit (242.8) (238.0) (266.2) (297.0) (332.1) % of GDP (2.3) (2.0) (2.0) (2.0) (2.0)
Medium-‐Term Fiscal Program, FY 2012-‐2016Infrastructure spending to grow from 2.5% of GDP in 2013 to 5% in 2016

20
Doing Business Report 2014, The World Bank and IFC

21

22

23

24
2013-‐2014 2012-‐2013 2011-‐2012 Singapore 2 2 2Malaysia 24 25 21Brunei 26 28 28Thailand 37 38 39Indonesia 38 50 46Philippines 59 65 75Vietnam 70 75 65Cambodia 88 85 97
Source: GCI Report 2013, 2012, and 2011, World Economic Forum
Global Competitiveness Index Ranking

Why there might be a (mini or maxi?) renaissance of manufacturing
Yokohama is investing USD650m to expand capacity at its Clark facility by 140% from 21,000 tires per day to 50,000 by 2017. Initial expansion will be operational this year.
Pilipinas Kao Inc (PKI) is increasing its fatty alcohols production capacity by 40% which is expected to be operational by August 2013, with an estimated JPY3bn investment. In Misamis Oriental in Northern Mindanao.
Murata is investing JPY3bn investment in a factory in Laguna to produce laminated ceramic capacitors, components used for smartphones and tablets. The target for completion is October 2013.
Terumo Medical Products is expanding its existing capacity in Laguna, producing disposable syringes, blood bags, coronary stents, and other medical equipment, which is expected to be operational in the first quarter of this year.
Epson opened its second factory in Lipa, Batangas, investing USD110m, to increase capacity for 3LCD projectors and inkjet printers.
Austal an Australian company which produces military and civilian boats recently purchased a USD8ms shipyard in Cebu which will be used as the future global manufacturing hub for highspeed catamarans and trimarans.
25
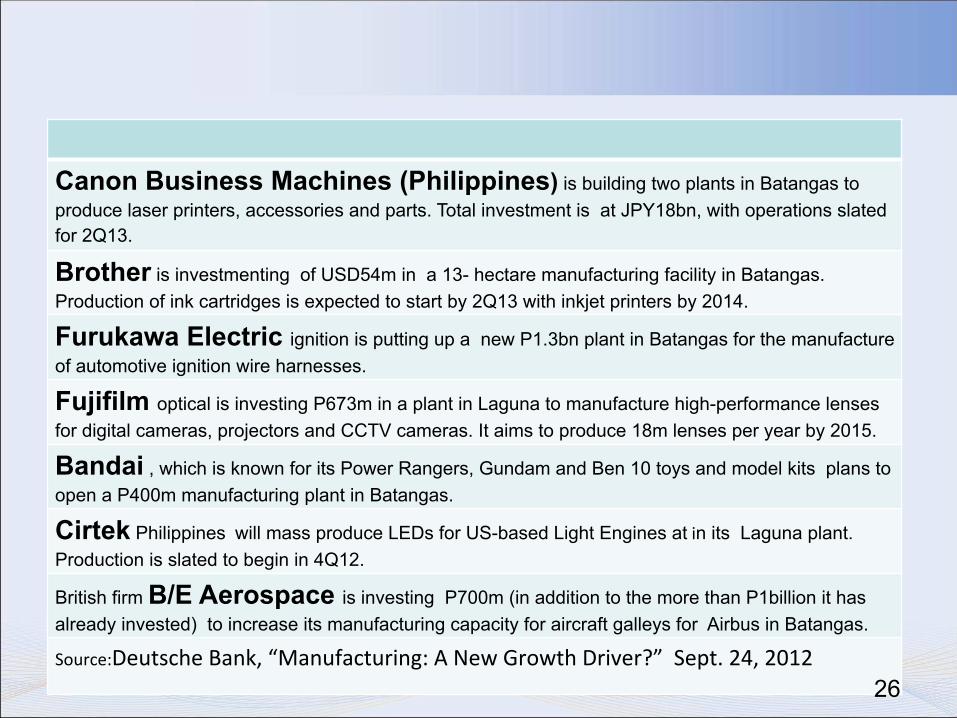
Canon Business Machines (Philippines) is building two plants in Batangas to produce laser printers, accessories and parts. Total investment is at JPY18bn, with operations slated for 2Q13.
Brother is investmenting of USD54m in a 13- hectare manufacturing facility in Batangas. Production of ink cartridges is expected to start by 2Q13 with inkjet printers by 2014.
Furukawa Electric ignition is putting up a new P1.3bn plant in Batangas for the manufacture of automotive ignition wire harnesses.
Fujifilm optical is investing P673m in a plant in Laguna to manufacture high-performance lenses for digital cameras, projectors and CCTV cameras. It aims to produce 18m lenses per year by 2015.
Bandai , which is known for its Power Rangers, Gundam and Ben 10 toys and model kits plans to open a P400m manufacturing plant in Batangas.
Cirtek Philippines will mass produce LEDs for US-based Light Engines at in its Laguna plant. Production is slated to begin in 4Q12.
British firm B/E Aerospace is investing P700m (in addition to the more than P1billion it has already invested) to increase its manufacturing capacity for aircraft galleys for Airbus in Batangas.
Source:Deutsche Bank, “Manufacturing: A New Growth Driver?” Sept. 24, 2012 26

Decline in popula5on growth rate is largely focused in the younger age groups. Moreover, the younger the age group, the larger the decline in the growth rate.
Philippine PopulaEon and Compounded Annual Growth Rate (CAGR) by Age Groups Age
Group
PopulaEon (in millions) Compounded Annual Growth Rate
Drop in CAGR (CAGR 1960 to 2000 minus CAGR 2007 to 2010)
1960 2000 2007 2010 1960 to 2000
2000 to 2010
2007 to 2010
Less than 10 8.9 19.4 21.2 20.5 2.0% 0.6% -‐1.0% 3.0% 10 to 19 6.2 17.0 19.5 19.8 2.5% 1.6% 0.5% 2.0% 20 to 24 2.5 7.1 7.8 8.4 2.7% 1.7% 2.4% 0.2% 25 to 64 8.7 30.2 36.4 39.3 3.2% 2.7% 2.7% 0.5% 65 or older 0.7 2.9 3.7 4.0 3.5% 3.2% 3.0% 0.5%

2 2 2 2 2 2
34 33 33 32 32 30
37 38 38 39 39 39
26 26 27 27 28 28
0%10%20%30%40%50%60%70%80%90%100%
2005 2006 2007 2008 2009 2010
Employment, by educational attainment
College
High School
Elementary
No Grade Completed
28
37 34 31
12 12 11
51 51 54
0%10%20%30%40%50%60%70%80%90%100%
2002-‐2007 2008-‐2009 2010 onwards
Employment, by class of workers
Wage and Salary
Unpaid Family
Self-‐employed

Large Share of Unproduc5ve Employment
-‐10
-‐5
0
5
10
15
-‐4 -‐2 0 2 4 6 8 10
Wage & Salary Emp. Growth Prev.
Qtr.
Y-‐o-‐Y GDP Growth
Wage & Salary Emp. and GDP Growth Rate
-‐10
-‐5
0
5
10
15
-‐5 0 5 10
Own Acct and Unpaid
Family Emp. Growth Prev.
Qtr
Y-‐o-‐Y GDP Growth
Own Acct. and Unpaid Family Emp. and GDP Growth Rate
R Square = .03
29
Correlation Coefficient 0.370t-‐statistic 3.009Probability 0.004
Correlation Coefficient -‐0.121t-‐statistic -‐0.921Probability 0.361

14.3
12.8
8.964.0
2011
Mindanao
Visayas
Other Luzon
NCR, Reg III and IV
14.4
12.7
8.864.1
2012
Mindanao
Visayas
Other Luzon
NCR, Reg III and IV
30
Poverty Incidence Among Popula5on by Region

Fer5lity rates among well-‐off and beker educated mothers are now not much higher than replacement rate. But those of poor and less educated mothers are significantly higher than their desired fer5lity and are nearly twice replacement rates.
ACTUAL VS WANTED FERTILITY (No. Of Children)
By Wealth Quin5le and Mother’s Educa5on
ACTUAL WANTED DIFFERENCE
WEALTH QUINTILE Lowest 5.9 3.8 2.1 Second 4.6 3.1 1.5 Middle 3.5 2.6 0.9 Fourth 2.8 2.2 0.6 Highest 2 1.7 0.3 MOTHER’S EDUCATION No educa5on 5.3 4.1 1.2 Elementary 5 3.3 1.7 High school 3.5 2.5 1 College or higher 2.7 2.2 0.5
31

Parents with large number of children invest less in the educa5on and health of their children.
32

Percent Not A`ending School: 2004 and 2008 Annual Poverty Incidence Survey
All Income Groups Poorest 30% Age Group 2004 APIS 2008 APIS 2004 APIS 2008 APIS 6 to 9 7.2% 5.8% 11.7% 9.4% 10 to 12 4.2% 3.3% 6.6% 5.2% 13 to 14 11.5% 10.1% 18.3% 15.9% 15 to 16 23.2% 24.0% 34.2% 33.6% 17 to 19 51.6% 53.1% 68.4% 67.4%
33

Percentage DistribuEon of Employed Persons by Highest Grade/Degree Not Completed, Age Group:
Labor Force Survey July 2009 Not Finished Elementary
Not Finished High School
Not Finished College
Total 17.8% 47.1% 85.6% 15 - 24 14.6% 46.6% 90.8% 25 - 34 11.6% 34.8% 79.3% 35 - 44 15.8% 44.4% 85.9% 45 - 54 20.2% 52.6% 86.0% 55 - 64 28.9% 63.5% 87.8% 65 and over 47.0% 82.1% 94.5%
34

35