economics department
TRANSCRIPT
Unclassified ECO/WKP(2010)54 Organisation de Coopération et de Développement Économiques Organisation for Economic Co-operation and Development 28-Jul-2010 ___________________________________________________________________________________________
English - Or. English ECONOMICS DEPARTMENT
KOREA'S GREEN GROWTH STRATEGY: MITIGATING CLIMATE CHANGE AND DEVELOPING NEW GROWTH ENGINES ECONOMICS DEPARTMENT WORKING PAPERS No. 798
by Randall S. Jones and Byungseo Yoo
All Economics Department Working Papers are available through the OECD internet website at www.oecd.org/workingpapers
JT03287023
Document complet disponible sur OLIS dans son format d'origine Complete document available on OLIS in its original format
EC
O/W
KP(2010)54
Unclassified
English - O
r. English
ECO/WKP(2010)54
2
ABSTRACT/RÉSUMÉ
Korea’s green growth strategy: mitigating climate change and developing new growth engines
Korea’s greenhouse gas emissions almost doubled between 1990 and 2005, the highest growth rate in the OECD area. Korea recently set a target of reducing emissions by 30% by 2020 relative to a “business as usual” baseline, implying a 4% cut from the 2005 level. Achieving this objective in a cost-effective manner requires moving from a strategy based on voluntary commitments by firms to market-based instruments. The priority is to establish a comprehensive cap-and-trade scheme, supplemented, if necessary, by carbon taxes in areas not covered by trading. Achieving a significant cut in emissions requires a shift from energy-intensive industries to low-carbon ones. Korea is strongly committed to promoting green growth through its Five-Year Plan, which envisages spending 2% of GDP per year through 2013. One challenge is to ensure that these expenditures are efficiently targeted so as to develop green technologies, while avoiding the risks inherent in industrial policy.
This Working Paper relates to the 2010 OECD Economic Survey of Korea (www.oecd.org/eco/surveys/korea) JEL classification: Q28, Q48, Q54, Q56, Q58 Keywords: Korean economy; climate change; greenhouse gas emissions; Kyoto protocol; green growth; emissions trading system; environmental taxes; energy subsidies; renewable energy; Clean Development Mechanism; carbon tax; energy efficiency; R&D; green certificates; National Strategy for Green Growth.
Stratégie de croissance verte pour la Corée : lutter contre le changement climatique et tirer parti des nouvelles sources de croissance
Les émissions de gaz à effet de serre ont pratiquement doublé en Corée entre 1990 et 2005, soit la progression la plus forte dans la zone de l’OCDE. La Corée s’est récemment fixé un objectif de réduction des émissions de 30 % en 2020 par rapport au statu quo, ce qui représente une baisse de 4 % par rapport au niveau de 2005. Pour réaliser cet objectif avec le meilleur rapport coût/efficacité possible, il faut passer d’une stratégie reposant sur des engagements volontaires des entreprises à la mise en place d’instruments de marché. La priorité est d’établir un dispositif complet de plafonnement et transfert, complété, si nécessaire, par une taxe sur le carbone dans les secteurs qui ne sont pas couverts par des permis d’émission. Réduire sensiblement les émissions implique de privilégier les industries sobres en carbone par rapport à celles à forte intensité énergétique. La Corée est déterminée à promouvoir la croissance verte via son plan quinquennal, qui prévoit de dépenser à cet effet 2 % du PIB par an jusqu’en 2013. L’un des principaux enjeux est de veiller à ce que ces dépenses soient efficacement ciblées sur le développement des technologies vertes tout en évitant les risques que présente toute politique industrielle.
Ce Document de travail a trait à l’Étude économique de l’OCDE de la Corée, 2010 (www.oecd.org/eco/etudes/coree). Classification JEL: Q28, Q48, Q54, Q56, Q58 Mots clés: économie coréenne ; changement climatique ; émissions de gaz à effet de serre ; Protocole de Kyoto ; croissance verte ; système d'échange de permis d'émission ; taxes environmentales ; subventions d'énergie; énergies renouvelables ; Mécanisme pour un développement propre ; taxes carbone ; efficacité énergétique ; R-D; certificats verts ; Stratégie nationale pour la croissance verte. © OECD 2010 Application for permission to reproduce or translate all, or part of, this material should be made to: Head of Publications Service, OECD, 2 rue André-Pascal, 75775 Paris Cedex 16, France.
ECO/WKP(2010)54
3
TABLE OF CONTENTS
KOREA’S GREEN GROWTH STRATEGY: MITIGATING CLIMATE CHANGE AND DEVELOPING NEW GROWTH ENGINES ........................................................................................................................... 5
Mitigating climate change ........................................................................................................................... 5 Overview of energy use and greenhouse gas emission trends in Korea .................................................. 7 Korea’s policy measures to address climate change ................................................................................ 9 Environmental taxes .............................................................................................................................. 12 Creating a new policy framework: getting the price right through market-based instruments .............. 13 Removing environmentally harmful energy subsidies .......................................................................... 15
Creating new growth engines for the future .............................................................................................. 16 The Five-Year Plan for Green Growth, 2009-13 ................................................................................... 17 R&D in green technologies ................................................................................................................... 19 Developing renewable energy sources .................................................................................................. 21 Promoting green industries .................................................................................................................... 23
Improving the quality of life through better air quality ............................................................................. 24 Conclusion ................................................................................................................................................. 26 Bibliography .............................................................................................................................................. 28
Tables
1. Trends in final energy consumption in Korea ......................................................................................... 8 2. Decomposition of greenhouse gas emission trends ............................................................................... 10 3. Share of taxes in energy prices .............................................................................................................. 13 4. Coal production and briquette price subsidy ......................................................................................... 16 5. Recovery rate of electricity price by sector in 2007 .............................................................................. 16 6. The Five-Year Plan for Green Growth (2009-13) ................................................................................. 18 7. Core green technologies ........................................................................................................................ 21 8. Per capita energy use by sector in major OECD countries ................................................................... 24
Figures
1. The mid-term target for reducing greenhouse gas emissions in Korea ................................................... 7 2. Korea has become one of the most energy-intensive economies in the OECD area ............................... 8 3. International comparison of greenhouse gas emissions .......................................................................... 9 4. Revenues from environmental taxes ..................................................................................................... 12 5. Government energy RD&D budget as a share of GDP ......................................................................... 20 6. Energy sources in the OECD area in 2007 ............................................................................................ 22 7. Share of energy-intensive industries and the service sector across OECD countries ........................... 25 8. International comparison of emissions of NOx and SOx in 2007 ........................................................... 26
ECO/WKP(2010)54
4
Boxes
Box 1. The National Strategy for Green Growth (announced in July 2009) ............................................... 6 Box 2. The main characteristics of a cap-and-trade emissions trading system ......................................... 14 Box 3. Summary of recommendations for Korea’s green growth strategy ............................................... 27
ECO/WKP(2010)54
5
KOREA’S GREEN GROWTH STRATEGY: MITIGATING CLIMATE CHANGE AND DEVELOPING NEW GROWTH ENGINES
Randall S. Jones and Byungseo Yoo1
Korea is strongly committed to promoting green growth. On the 60th anniversary of the founding of the Republic of Korea in August 2008, the President proclaimed “Low Carbon/Green Growth” as the nation’s vision to guide development during the next 50 years.2 In order to implement this vision, the government announced in July 2009 the “National Strategy for Green Growth” up to 2050, which includes mitigating climate change, creating new engines for economic growth and improving the quality of life (Box 1).3 This paper analyses policies to implement these strategies. Policy recommendations are summarised in Box 3 at the end of the paper.
Mitigating climate change
Climate change is one of the key challenges facing the world in the 21st century with serious environmental and economic implications. While there are significant uncertainties about the cost of inaction, it would undoubtedly be immense as sea levels rise, agricultural yields decline and infectious diseases become more prevalent.4 Climate change risks unpredictable and irreversible damage worldwide.
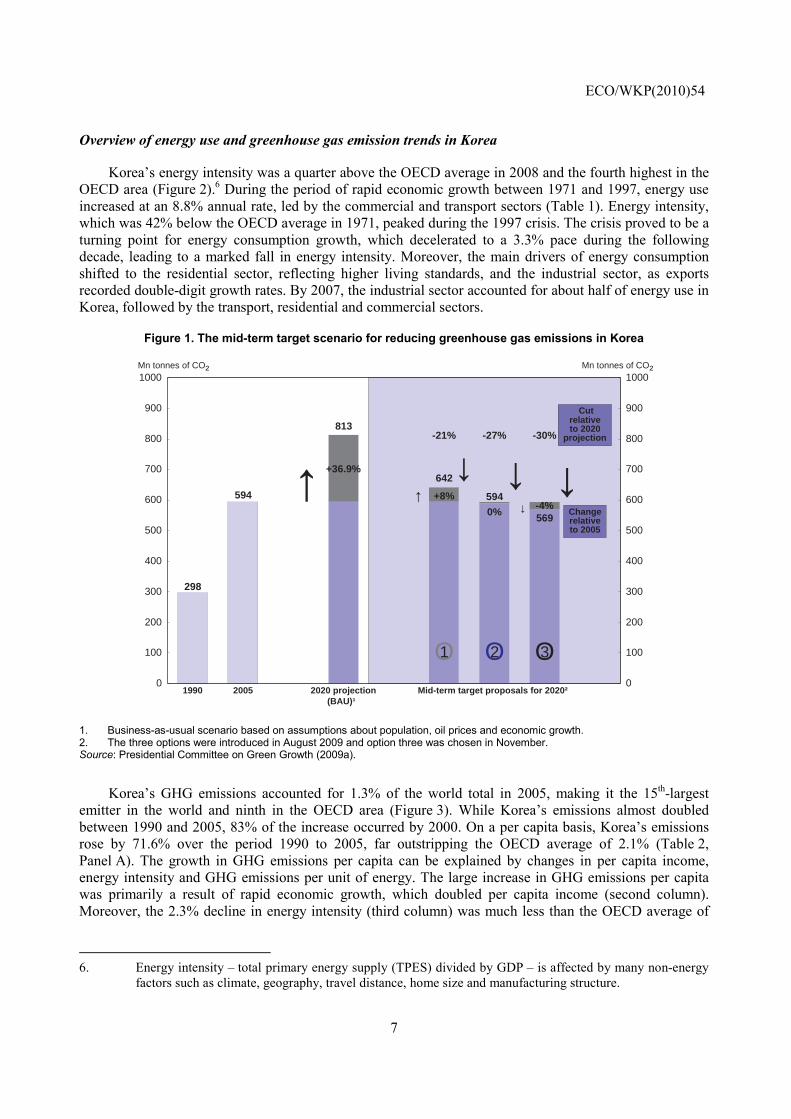
In August 2009, the government presented the options of cutting GHG emissions by 21%, 27% or 30% relative to the projected level in 2020, which is based on a “business-as-usual” (BAU) scenario of a 36.9% rise in emissions between 2005 and 2020 (Figure 1).5 Relative to 2005, the three options imply an 8% increase in emissions, no change or a 4% cut, respectively. After analysing the scenarios on the basis of
1. Randall S. Jones is head of the Korea/Japan Desk in the Economics Department of the OECD and
Byungseo Yoo is a senior economist on that desk. This paper initially appeared as a chapter in the OECD Economic Survey of Korea published in June 2010 under the responsibility of the Economic and Development Review Committee. The authors would like to thank Anne Carblanc, Andrew Dean, Alain de Serres, Jane Ellis, Robert Ford, Brendan Gillespie, Vincent Koen, Dirk Pilat and Masahiko Tsutsumi for comments on earlier drafts. Special thanks go to Lutécia Daniel for technical assistance and Nadine Dufour and Pascal Halim for editorial assistance.
2. Korea also pushed for green growth to feature prominently on the agenda of international organisations. In 2005, the “Seoul Initiative Network on Green Growth” was adopted at the Ministerial Conference of the United Nations Economic and Social Commission for Asia and the Pacific. In addition, Korea chaired the 2009 OECD Ministerial Council Meeting that adopted the “Green Growth Declaration”.
3. The government set a target of reducing energy intensity by one-third from the 2006 level by 2020, reaching the OECD average. This paper will not explicitly discuss increasing energy independence as it will be a natural consequence of mitigating climate change and shifting to a low-carbon economy.
4. Recent assessments show a permanent 14% loss in average world consumption per capita from both market and non-market impacts (Stern, 2007).
5. The BAU baseline makes assumptions on oil prices (from the Energy Information Agency), population (official projection) and economic growth (Korea Development Institute).
ECO/WKP(2010)54
6
Korea’s capacity to make reductions and the subsequent macroeconomic impact, the Cabinet selected the most ambitious option of a 30% reduction by 2020 relative to the BAU baseline, despite the industrial sector’s concern about the possible negative impact on their international competitiveness. The 2020 targets for Japan, the United States and the EU are for still larger emission reductions of approximately 30%, 17% and 13%, respectively, relative to 2005. Korea’s mid-term target is thus positioned between the advanced countries and developing countries. Mexico also pledged to reduce emissions by up to 30% relative to its BAU baseline by 2020, on the condition of adequate financial and technology transfer mechanisms from developed countries. In contrast, Korea’s target is not conditional on international agreements and support. Although not legally binding, the target should help guide Korea’s climate change policy framework. After examining the level of energy use and greenhouse gas (GHG) emissions, this section looks at Korea’s current policy framework and then proposes new measures to achieve the mid-term target.
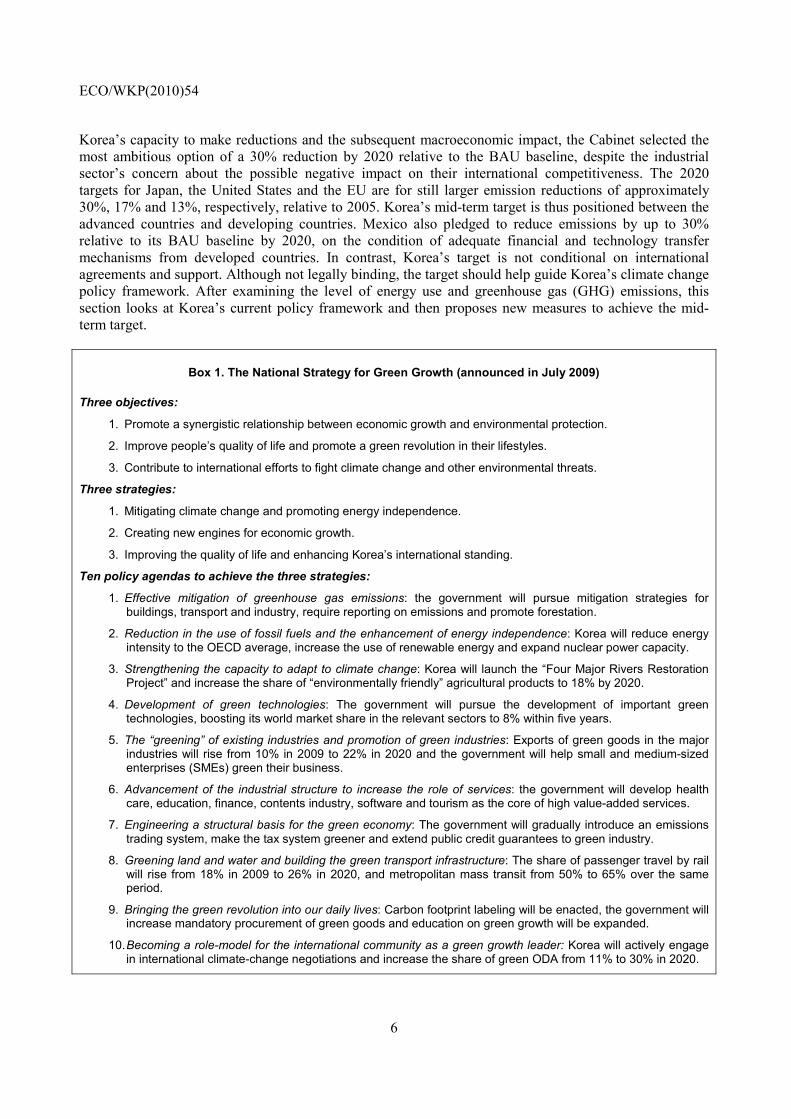
Box 1. The National Strategy for Green Growth (announced in July 2009)
Three objectives:
1. Promote a synergistic relationship between economic growth and environmental protection.
2. Improve people’s quality of life and promote a green revolution in their lifestyles.
3. Contribute to international efforts to fight climate change and other environmental threats.
Three strategies:
1. Mitigating climate change and promoting energy independence.
2. Creating new engines for economic growth.
3. Improving the quality of life and enhancing Korea’s international standing.
Ten policy agendas to achieve the three strategies:
1. Effective mitigation of greenhouse gas emissions: the government will pursue mitigation strategies for buildings, transport and industry, require reporting on emissions and promote forestation.
2. Reduction in the use of fossil fuels and the enhancement of energy independence: Korea will reduce energy intensity to the OECD average, increase the use of renewable energy and expand nuclear power capacity.
3. Strengthening the capacity to adapt to climate change: Korea will launch the “Four Major Rivers Restoration Project” and increase the share of “environmentally friendly” agricultural products to 18% by 2020.
4. Development of green technologies: The government will pursue the development of important green technologies, boosting its world market share in the relevant sectors to 8% within five years.
5. The “greening” of existing industries and promotion of green industries: Exports of green goods in the major industries will rise from 10% in 2009 to 22% in 2020 and the government will help small and medium-sized enterprises (SMEs) green their business.
6. Advancement of the industrial structure to increase the role of services: the government will develop health care, education, finance, contents industry, software and tourism as the core of high value-added services.
7. Engineering a structural basis for the green economy: The government will gradually introduce an emissions trading system, make the tax system greener and extend public credit guarantees to green industry.
8. Greening land and water and building the green transport infrastructure: The share of passenger travel by rail will rise from 18% in 2009 to 26% in 2020, and metropolitan mass transit from 50% to 65% over the same period.
9. Bringing the green revolution into our daily lives: Carbon footprint labeling will be enacted, the government will increase mandatory procurement of green goods and education on green growth will be expanded.
10. Becoming a role-model for the international community as a green growth leader: Korea will actively engage in international climate-change negotiations and increase the share of green ODA from 11% to 30% in 2020.
ECO/WKP(2010)54
7
Overview of energy use and greenhouse gas emission trends in Korea
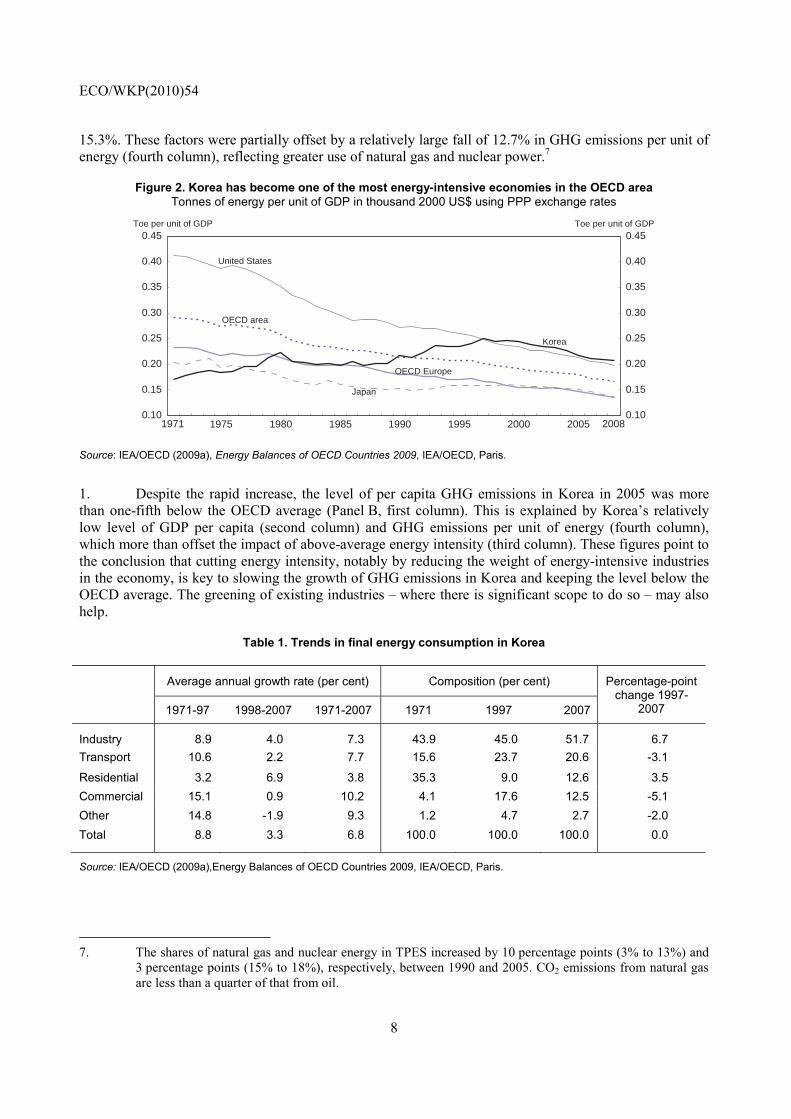
Korea’s energy intensity was a quarter above the OECD average in 2008 and the fourth highest in the OECD area (Figure 2).6 During the period of rapid economic growth between 1971 and 1997, energy use increased at an 8.8% annual rate, led by the commercial and transport sectors (Table 1). Energy intensity, which was 42% below the OECD average in 1971, peaked during the 1997 crisis. The crisis proved to be a turning point for energy consumption growth, which decelerated to a 3.3% pace during the following decade, leading to a marked fall in energy intensity. Moreover, the main drivers of energy consumption shifted to the residential sector, reflecting higher living standards, and the industrial sector, as exports recorded double-digit growth rates. By 2007, the industrial sector accounted for about half of energy use in Korea, followed by the transport, residential and commercial sectors.
Figure 1. The mid-term target scenario for reducing greenhouse gas emissions in Korea
0
100
200
300
400
500
600
700
800
900
1000 Mn tonnes of CO
0
100
200
300
400
500
600
700
800
900
1000Mn tonnes of CO
² ²
298
594
813
642
594
569
-21% -27% -30%
0%
+36.9%
+8%-4%
1990 2005 2020 projection Mid-term target proposals for 2020²(BAU)¹
Cut relativeto 2020
projection
Changerelativeto 2005
O O O1 2 3
↑ ↓ ↓ ↓↑↓
1. Business-as-usual scenario based on assumptions about population, oil prices and economic growth. 2. The three options were introduced in August 2009 and option three was chosen in November. Source: Presidential Committee on Green Growth (2009a).
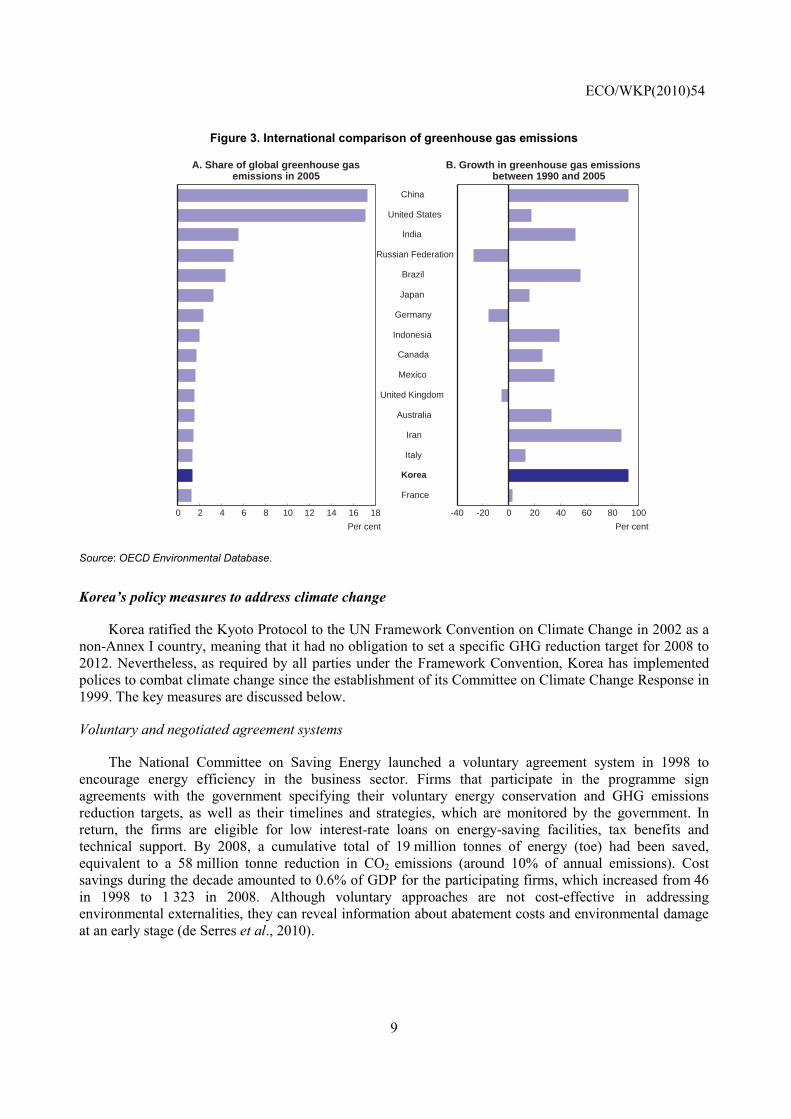
Korea’s GHG emissions accounted for 1.3% of the world total in 2005, making it the 15th-largest emitter in the world and ninth in the OECD area (Figure 3). While Korea’s emissions almost doubled between 1990 and 2005, 83% of the increase occurred by 2000. On a per capita basis, Korea’s emissions rose by 71.6% over the period 1990 to 2005, far outstripping the OECD average of 2.1% (Table 2, Panel A). The growth in GHG emissions per capita can be explained by changes in per capita income, energy intensity and GHG emissions per unit of energy. The large increase in GHG emissions per capita was primarily a result of rapid economic growth, which doubled per capita income (second column). Moreover, the 2.3% decline in energy intensity (third column) was much less than the OECD average of
6. Energy intensity – total primary energy supply (TPES) divided by GDP – is affected by many non-energy
factors such as climate, geography, travel distance, home size and manufacturing structure.
ECO/WKP(2010)54
8
15.3%. These factors were partially offset by a relatively large fall of 12.7% in GHG emissions per unit of energy (fourth column), reflecting greater use of natural gas and nuclear power.7
Figure 2. Korea has become one of the most energy-intensive economies in the OECD area Tonnes of energy per unit of GDP in thousand 2000 US$ using PPP exchange rates
1975 1980 1985 1990 1995 2000 20050.10
0.15
0.20
0.25
0.30
0.35
0.40
0.45 Toe per unit of GDP
0.10
0.15
0.20
0.25
0.30
0.35
0.40
0.45Toe per unit of GDP
United States
Korea
Japan
OECD area
OECD Europe
20081971
Source: IEA/OECD (2009a), Energy Balances of OECD Countries 2009, IEA/OECD, Paris.
1. Despite the rapid increase, the level of per capita GHG emissions in Korea in 2005 was more than one-fifth below the OECD average (Panel B, first column). This is explained by Korea’s relatively low level of GDP per capita (second column) and GHG emissions per unit of energy (fourth column), which more than offset the impact of above-average energy intensity (third column). These figures point to the conclusion that cutting energy intensity, notably by reducing the weight of energy-intensive industries in the economy, is key to slowing the growth of GHG emissions in Korea and keeping the level below the OECD average. The greening of existing industries – where there is significant scope to do so – may also help.
Table 1. Trends in final energy consumption in Korea
Average annual growth rate (per cent) Composition (per cent) Percentage-point change 1997-
2007 1971-97 1998-2007 1971-2007 1971 1997 2007
Industry 8.9 4.0 7.3 43.9 45.0 51.7 6.7 Transport 10.6 2.2 7.7 15.6 23.7 20.6 -3.1
Residential 3.2 6.9 3.8 35.3 9.0 12.6 3.5 Commercial 15.1 0.9 10.2 4.1 17.6 12.5 -5.1 Other 14.8 -1.9 9.3 1.2 4.7 2.7 -2.0 Total 8.8 3.3 6.8 100.0 100.0 100.0 0.0
Source: IEA/OECD (2009a),Energy Balances of OECD Countries 2009, IEA/OECD, Paris.
7. The shares of natural gas and nuclear energy in TPES increased by 10 percentage points (3% to 13%) and
3 percentage points (15% to 18%), respectively, between 1990 and 2005. CO2 emissions from natural gas are less than a quarter of that from oil.
ECO/WKP(2010)54
9
Figure 3. International comparison of greenhouse gas emissions
0 2 4 6 8 10 12 14 16 18
Per cent
A. Share of global greenhouse gasemissions in 2005
-40 -20 0 20 40 60 80 100
China
United States
India
Russian Federation
Brazil
Japan
Germany
Indonesia
Canada
Mexico
United Kingdom
Australia
Iran
Italy
Korea
France
Per cent
B. Growth in greenhouse gas emissions between 1990 and 2005
Source: OECD Environmental Database.
Korea’s policy measures to address climate change
Korea ratified the Kyoto Protocol to the UN Framework Convention on Climate Change in 2002 as a non-Annex I country, meaning that it had no obligation to set a specific GHG reduction target for 2008 to 2012. Nevertheless, as required by all parties under the Framework Convention, Korea has implemented polices to combat climate change since the establishment of its Committee on Climate Change Response in 1999. The key measures are discussed below.
Voluntary and negotiated agreement systems
The National Committee on Saving Energy launched a voluntary agreement system in 1998 to encourage energy efficiency in the business sector. Firms that participate in the programme sign agreements with the government specifying their voluntary energy conservation and GHG emissions reduction targets, as well as their timelines and strategies, which are monitored by the government. In return, the firms are eligible for low interest-rate loans on energy-saving facilities, tax benefits and technical support. By 2008, a cumulative total of 19 million tonnes of energy (toe) had been saved, equivalent to a 58 million tonne reduction in CO2 emissions (around 10% of annual emissions). Cost savings during the decade amounted to 0.6% of GDP for the participating firms, which increased from 46 in 1998 to 1 323 in 2008. Although voluntary approaches are not cost-effective in addressing environmental externalities, they can reveal information about abatement costs and environmental damage at an early stage (de Serres et al., 2010).
ECO/WKP(2010)54
10
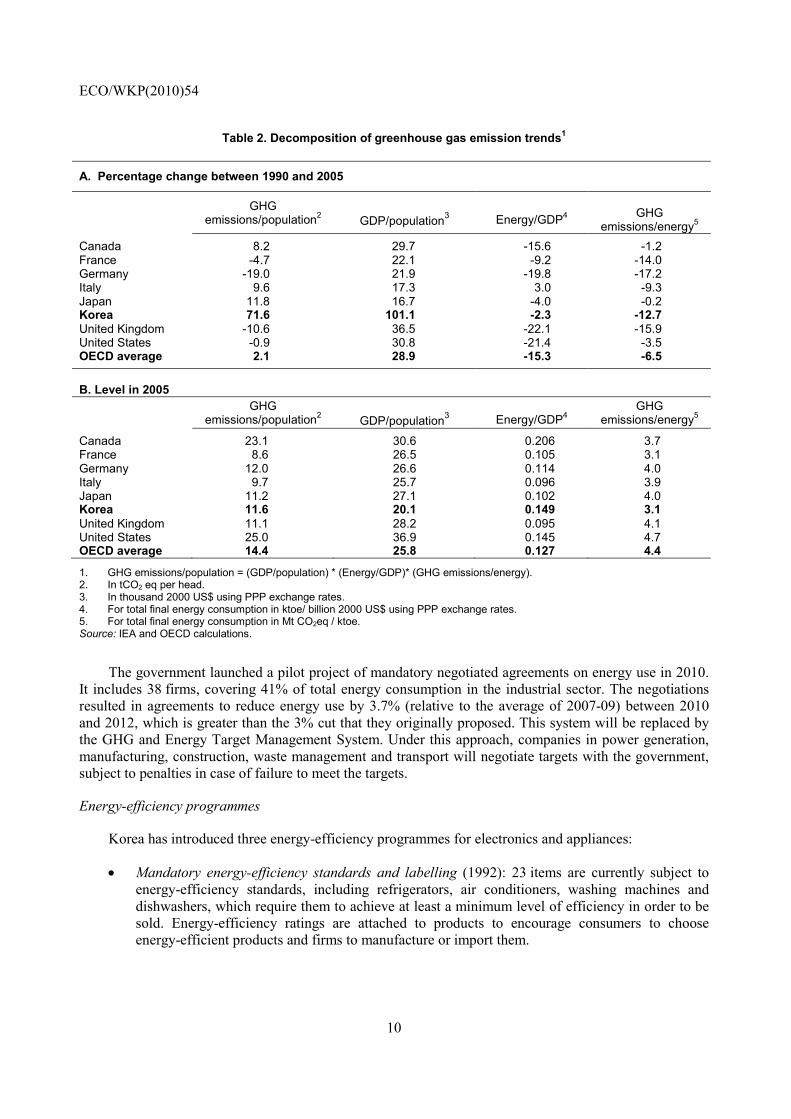
Table 2. Decomposition of greenhouse gas emission trends1
A. Percentage change between 1990 and 2005
GHG emissions/population2
GDP/population3
Energy/GDP4
GHG
emissions/energy5 Canada 8.2 29.7 -15.6 -1.2 France -4.7 22.1 -9.2 -14.0 Germany -19.0 21.9 -19.8 -17.2 Italy 9.6 17.3 3.0 -9.3 Japan 11.8 16.7 -4.0 -0.2 Korea 71.6 101.1 -2.3 -12.7 United Kingdom -10.6 36.5 -22.1 -15.9 United States -0.9 30.8 -21.4 -3.5 OECD average 2.1 28.9 -15.3 -6.5 B. Level in 2005
GHG emissions/population2
GDP/population3
Energy/GDP4
GHG emissions/energy5
Canada 23.1 30.6 0.206 3.7 France 8.6 26.5 0.105 3.1 Germany 12.0 26.6 0.114 4.0 Italy 9.7 25.7 0.096 3.9 Japan 11.2 27.1 0.102 4.0 Korea 11.6 20.1 0.149 3.1 United Kingdom 11.1 28.2 0.095 4.1 United States 25.0 36.9 0.145 4.7 OECD average 14.4 25.8 0.127 4.4
1. GHG emissions/population = (GDP/population) * (Energy/GDP)* (GHG emissions/energy). 2. In tCO2 eq per head. 3. In thousand 2000 US$ using PPP exchange rates. 4. For total final energy consumption in ktoe/ billion 2000 US$ using PPP exchange rates. 5. For total final energy consumption in Mt CO2eq / ktoe. Source: IEA and OECD calculations.
The government launched a pilot project of mandatory negotiated agreements on energy use in 2010. It includes 38 firms, covering 41% of total energy consumption in the industrial sector. The negotiations resulted in agreements to reduce energy use by 3.7% (relative to the average of 2007-09) between 2010 and 2012, which is greater than the 3% cut that they originally proposed. This system will be replaced by the GHG and Energy Target Management System. Under this approach, companies in power generation, manufacturing, construction, waste management and transport will negotiate targets with the government, subject to penalties in case of failure to meet the targets.
Energy-efficiency programmes
Korea has introduced three energy-efficiency programmes for electronics and appliances:
• Mandatory energy-efficiency standards and labelling (1992): 23 items are currently subject to energy-efficiency standards, including refrigerators, air conditioners, washing machines and dishwashers, which require them to achieve at least a minimum level of efficiency in order to be sold. Energy-efficiency ratings are attached to products to encourage consumers to choose energy-efficient products and firms to manufacture or import them.
ECO/WKP(2010)54
11
• The high-efficiency appliance certification (1996): the government awards labels to products with energy-efficiency levels that are higher than those required by law. A total of 46 items are subject to certification, including converters, LED lighting systems and oil-fired hot-water heaters.
• Standby electricity reduction programme (1999): manufacturers are encouraged to make products that automatically switch to power-saving mode when not in use in order to minimise standby electricity consumption. The government grants labels for 20 home electronic and office equipment products, such as televisions, microwaves, computers and printers, which meet the official standard. Warning labels are applied to products that fail to meet the standard.
In order to save fuel and reduce GHG emissions by cars, the government launched the Average Fuel Economy (AFE) regulation in January 2006, patterned on the US Corporate Average Fuel Economy (CAFE) system. Under Korea’s regulation, the average fuel economy of all cars sold by a manufacturer over one year must meet the standards, which depend on engine capacity. This system boosted average fuel economy by 6.6% (10.8 to 11.5 km/litre) between 2006 and 2008 and reduced CO2 emissions by 7.3%.
Clean Development Mechanism and the carbon market
The Clean Development Mechanism (CDM) is one of three programmes introduced by the Kyoto Protocol, which together with emissions trading and Joint Implementation (JI),8 constitute the official international carbon market.9 The CDM, which was launched in 2001, allows emission-reduction projects in developing countries to earn certified emission reduction (CER) credits, each equivalent to one tonne of CO2. CERs can be traded and used by Annex I countries to meet a part of their emission reduction targets under the Kyoto Protocol.10 Korea, as a non-Annex I country, has been actively involved in the CDM since unilateral projects – those funded by developing countries’ own money and not by Annex-1 countries – were allowed in 2005. Korean investment companies own the CERs and can sell them to any Annex-1 country in the market. Korea has 35 projects registered, with renewable energy projects accounting for a third of them.11 Another 47 projects are in the process of registration. As of February 2010, the UNFCCC expected Korea’s registered projects to reduce CO2 equivalent by an average of 15 million tonnes per year, accounting for 4.4% of the total, ranking Korea fourth behind China (59%), India (12%) and Brazil (6%).
Since 2005, the government has been operating a voluntary carbon market called Korea Certified Emissions Reductions (KCERs), which is open to firms that that have reduced CO2 emissions by more than 500 tonnes a year through improved energy efficiency and production processes and investment in renewable energy development. Companies receive KCERs for their voluntary GHG reduction projects, which can be traded in the market or purchased for around 5 000 won (about $4.50) per tonne. In practice, there are few buyers given the lack of a domestic reduction obligation, so the government buys most KCERs to promote and compensate measures to reduce GHG emissions. As of the end of 2009, 287 projects had generated 5.6 million KCERs, out of which 4.7 million had been purchased by the government for 23 billion won ($20 million). The government also launched a carbon fund of 105 billion
8. Like the CDM, JI is a project-based mechanism that feeds the carbon market by enabling industrialised
countries to carry out joint implementation projects with other developed countries.
9. The global carbon market doubled from $63 billion in 2007 to $126 billion in 2008. The allowance market occupied three-quarters while the project market, including CDM, accounted for the remaining quarter.
10. The projects are registered with the UNFCCC and pass through a rigorous process designed to ensure real and measurable emission reductions that are additional to what would have occurred without the project.
11. As of February 2010, a total of 2 209 projects has been registered, with anticipated annual CERs amounting to 342 million tonnes of CO2 equivalent.
ECO/WKP(2010)54
12
won with the participation of private money in 2007 to invest in CDM projects and purchase CERs or allowances.
Environmental taxes
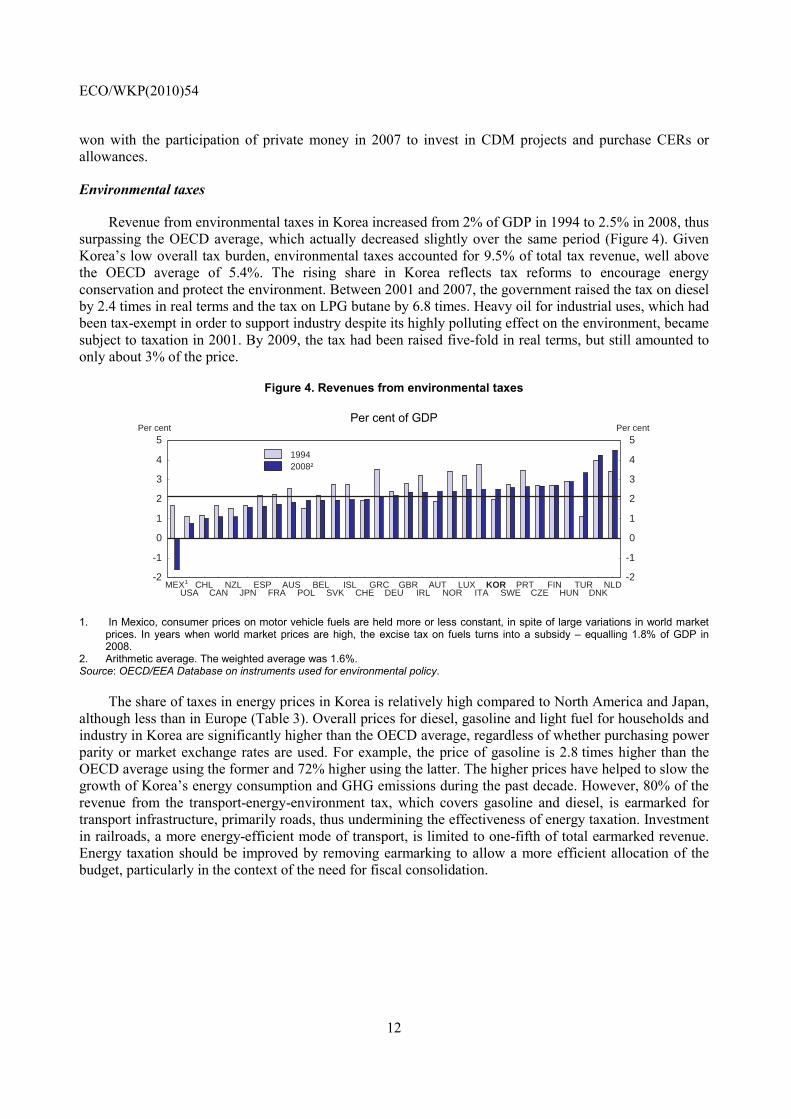
Revenue from environmental taxes in Korea increased from 2% of GDP in 1994 to 2.5% in 2008, thus surpassing the OECD average, which actually decreased slightly over the same period (Figure 4). Given Korea’s low overall tax burden, environmental taxes accounted for 9.5% of total tax revenue, well above the OECD average of 5.4%. The rising share in Korea reflects tax reforms to encourage energy conservation and protect the environment. Between 2001 and 2007, the government raised the tax on diesel by 2.4 times in real terms and the tax on LPG butane by 6.8 times. Heavy oil for industrial uses, which had been tax-exempt in order to support industry despite its highly polluting effect on the environment, became subject to taxation in 2001. By 2009, the tax had been raised five-fold in real terms, but still amounted to only about 3% of the price.
Figure 4. Revenues from environmental taxes
Per cent of GDP
-2
-1
0
1
2
3
4
5 Per cent
-2
-1
0
1
2
3
4
5Per cent
MEXUSA
CHLCAN
NZLJPN
ESPFRA
AUSPOL
BELSVK
ISLCHE
GRCDEU
GBRIRL
AUTNOR
LUXITA
KORSWE
PRTCZE
FINHUN
TURDNK
NLD ¹
2008²1994
1. In Mexico, consumer prices on motor vehicle fuels are held more or less constant, in spite of large variations in world market prices. In years when world market prices are high, the excise tax on fuels turns into a subsidy – equalling 1.8% of GDP in 2008.
2. Arithmetic average. The weighted average was 1.6%. Source: OECD/EEA Database on instruments used for environmental policy.
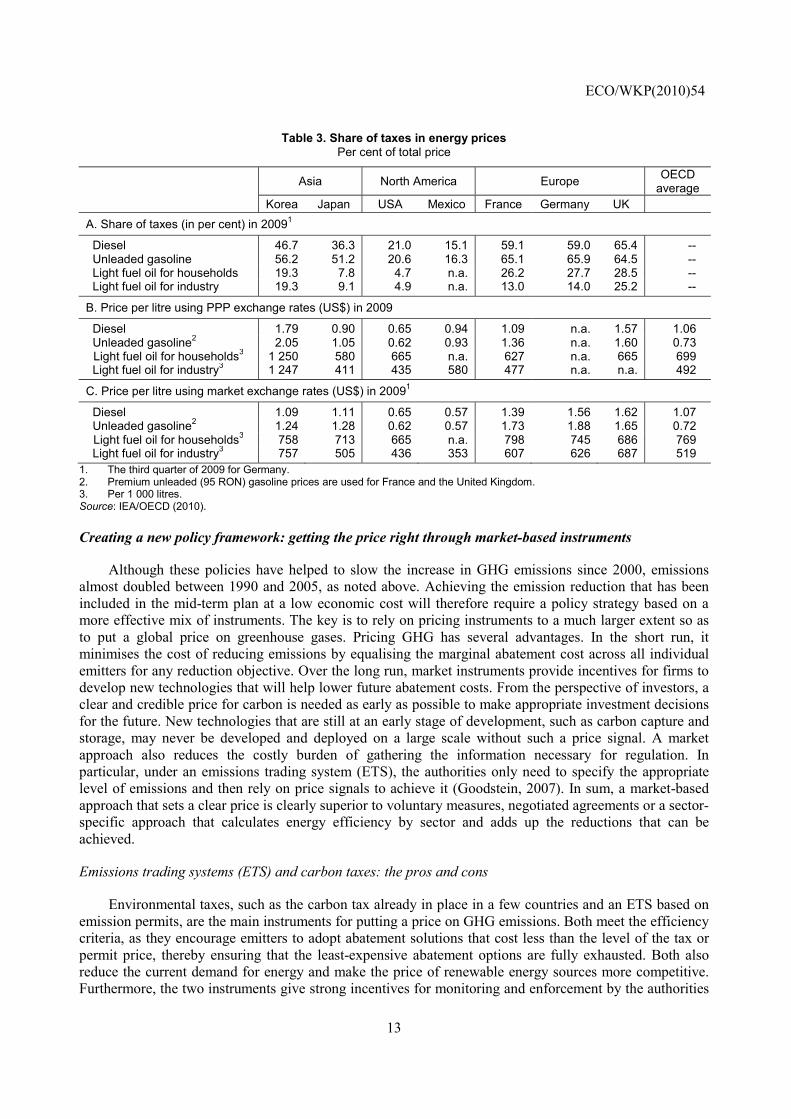
The share of taxes in energy prices in Korea is relatively high compared to North America and Japan, although less than in Europe (Table 3). Overall prices for diesel, gasoline and light fuel for households and industry in Korea are significantly higher than the OECD average, regardless of whether purchasing power parity or market exchange rates are used. For example, the price of gasoline is 2.8 times higher than the OECD average using the former and 72% higher using the latter. The higher prices have helped to slow the growth of Korea’s energy consumption and GHG emissions during the past decade. However, 80% of the revenue from the transport-energy-environment tax, which covers gasoline and diesel, is earmarked for transport infrastructure, primarily roads, thus undermining the effectiveness of energy taxation. Investment in railroads, a more energy-efficient mode of transport, is limited to one-fifth of total earmarked revenue. Energy taxation should be improved by removing earmarking to allow a more efficient allocation of the budget, particularly in the context of the need for fiscal consolidation.
ECO/WKP(2010)54
13
Table 3. Share of taxes in energy prices Per cent of total price
Asia North America Europe OECD average
Korea Japan USA Mexico France Germany UK
A. Share of taxes (in per cent) in 20091
Diesel 46.7 36.3 21.0 15.1 59.1 59.0 65.4 -- Unleaded gasoline 56.2 51.2 20.6 16.3 65.1 65.9 64.5 -- Light fuel oil for households 19.3 7.8 4.7 n.a. 26.2 27.7 28.5 -- Light fuel oil for industry 19.3 9.1 4.9 n.a. 13.0 14.0 25.2 --
B. Price per litre using PPP exchange rates (US$) in 2009
Diesel 1.79 0.90 0.65 0.94 1.09 n.a. 1.57 1.06 Unleaded gasoline2 2.05 1.05 0.62 0.93 1.36 n.a. 1.60 0.73
Light fuel oil for households3 1 250 580 665 n.a. 627 n.a. 665 699 Light fuel oil for industry3 1 247 411 435 580 477 n.a. n.a. 492
C. Price per litre using market exchange rates (US$) in 20091
Diesel 1.09 1.11 0.65 0.57 1.39 1.56 1.62 1.07 Unleaded gasoline2 1.24 1.28 0.62 0.57 1.73 1.88 1.65 0.72
Light fuel oil for households3 758 713 665 n.a. 798 745 686 769 Light fuel oil for industry3 757 505 436 353 607 626 687 519
1. The third quarter of 2009 for Germany. 2. Premium unleaded (95 RON) gasoline prices are used for France and the United Kingdom. 3. Per 1 000 litres. Source: IEA/OECD (2010).
Creating a new policy framework: getting the price right through market-based instruments
Although these policies have helped to slow the increase in GHG emissions since 2000, emissions almost doubled between 1990 and 2005, as noted above. Achieving the emission reduction that has been included in the mid-term plan at a low economic cost will therefore require a policy strategy based on a more effective mix of instruments. The key is to rely on pricing instruments to a much larger extent so as to put a global price on greenhouse gases. Pricing GHG has several advantages. In the short run, it minimises the cost of reducing emissions by equalising the marginal abatement cost across all individual emitters for any reduction objective. Over the long run, market instruments provide incentives for firms to develop new technologies that will help lower future abatement costs. From the perspective of investors, a clear and credible price for carbon is needed as early as possible to make appropriate investment decisions for the future. New technologies that are still at an early stage of development, such as carbon capture and storage, may never be developed and deployed on a large scale without such a price signal. A market approach also reduces the costly burden of gathering the information necessary for regulation. In particular, under an emissions trading system (ETS), the authorities only need to specify the appropriate level of emissions and then rely on price signals to achieve it (Goodstein, 2007). In sum, a market-based approach that sets a clear price is clearly superior to voluntary measures, negotiated agreements or a sector-specific approach that calculates energy efficiency by sector and adds up the reductions that can be achieved.
Emissions trading systems (ETS) and carbon taxes: the pros and cons
Environmental taxes, such as the carbon tax already in place in a few countries and an ETS based on emission permits, are the main instruments for putting a price on GHG emissions. Both meet the efficiency criteria, as they encourage emitters to adopt abatement solutions that cost less than the level of the tax or permit price, thereby ensuring that the least-expensive abatement options are fully exhausted. Both also reduce the current demand for energy and make the price of renewable energy sources more competitive. Furthermore, the two instruments give strong incentives for monitoring and enforcement by the authorities
ECO/WKP(2010)54
14
and, assuming that the permits are auctioned, generate revenues that can be used to reduce labour taxation, thereby increasing efficiency.
Although a carbon tax cannot set a fixed emission cap for the whole country, an advantage of an ETS (Box 2), it also provides a clear price signal that promotes private-sector investment in energy-saving technology. Moreover, a carbon tax has some advantages, as it is easy to adopt from a technical standpoint, has lower transaction costs and guarantees the maximum and minimum cost, although the optimal carbon tax rate can change over time.
In comparison, an ETS is generally more costly to implement, owing mainly to its more complex design. But once start-up costs are overcome, it has a number of clear advantages. First, an ETS can secure a more targeted level of emission reduction than a carbon tax. Indeed, there is less certainty as regards the amount of emission reductions associated with a certain level of tax, and thus it may require several iterations to achieve the desired level of emission cuts. Second, it facilitates linkages with foreign carbon markets, which could lower the cost of reducing emissions for Korea. Third, the participation of firms in the market for permits creates a constituency for maintaining the system.12 Fourth, unlike a carbon tax, a trading scheme does not need to be adjusted for inflation or growth.
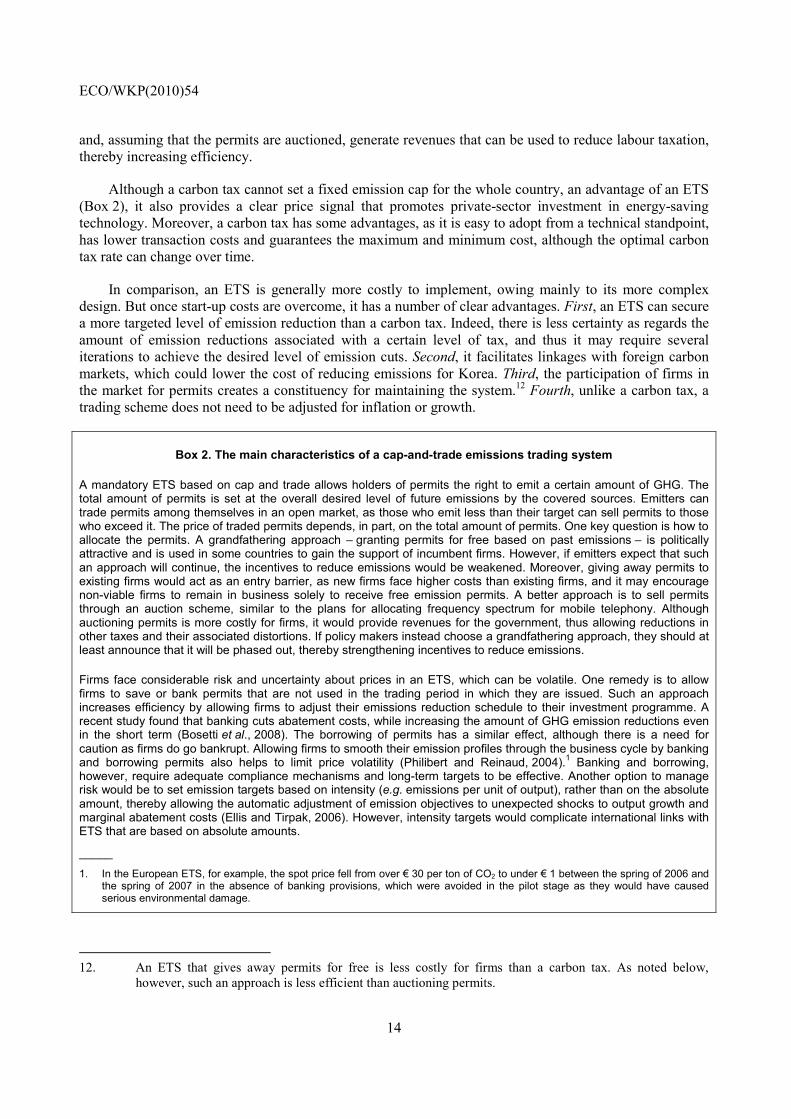
Box 2. The main characteristics of a cap-and-trade emissions trading system
A mandatory ETS based on cap and trade allows holders of permits the right to emit a certain amount of GHG. The total amount of permits is set at the overall desired level of future emissions by the covered sources. Emitters can trade permits among themselves in an open market, as those who emit less than their target can sell permits to those who exceed it. The price of traded permits depends, in part, on the total amount of permits. One key question is how to allocate the permits. A grandfathering approach – granting permits for free based on past emissions – is politically attractive and is used in some countries to gain the support of incumbent firms. However, if emitters expect that such an approach will continue, the incentives to reduce emissions would be weakened. Moreover, giving away permits to existing firms would act as an entry barrier, as new firms face higher costs than existing firms, and it may encourage non-viable firms to remain in business solely to receive free emission permits. A better approach is to sell permits through an auction scheme, similar to the plans for allocating frequency spectrum for mobile telephony. Although auctioning permits is more costly for firms, it would provide revenues for the government, thus allowing reductions in other taxes and their associated distortions. If policy makers instead choose a grandfathering approach, they should at least announce that it will be phased out, thereby strengthening incentives to reduce emissions.
Firms face considerable risk and uncertainty about prices in an ETS, which can be volatile. One remedy is to allow firms to save or bank permits that are not used in the trading period in which they are issued. Such an approach increases efficiency by allowing firms to adjust their emissions reduction schedule to their investment programme. A recent study found that banking cuts abatement costs, while increasing the amount of GHG emission reductions even in the short term (Bosetti et al., 2008). The borrowing of permits has a similar effect, although there is a need for caution as firms do go bankrupt. Allowing firms to smooth their emission profiles through the business cycle by banking and borrowing permits also helps to limit price volatility (Philibert and Reinaud, 2004).1 Banking and borrowing, however, require adequate compliance mechanisms and long-term targets to be effective. Another option to manage risk would be to set emission targets based on intensity (e.g. emissions per unit of output), rather than on the absolute amount, thereby allowing the automatic adjustment of emission objectives to unexpected shocks to output growth and marginal abatement costs (Ellis and Tirpak, 2006). However, intensity targets would complicate international links with ETS that are based on absolute amounts.
_____
1. In the European ETS, for example, the spot price fell from over € 30 per ton of CO2 to under € 1 between the spring of 2006 and the spring of 2007 in the absence of banking provisions, which were avoided in the pilot stage as they would have caused serious environmental damage.
12. An ETS that gives away permits for free is less costly for firms than a carbon tax. As noted below,
however, such an approach is less efficient than auctioning permits.
ECO/WKP(2010)54
15
A comprehensive cap-and-trade ETS appears to be the best option
On balance, the case for using an ETS as the main instrument to control carbon emissions in Korea is compelling, in spite of the initial start-up costs. However, given that an ETS works best at the level of relatively large emitters, even a fairly comprehensive ETS may exclude certain sectors, notably households and offices. Taxation, on the other hand, is the instrument of choice for small and diffuse sources such as households, farmers and small businesses, thus leaving scope for a carbon tax to co-exist with an ETS. It is important, though, to minimise overlap and complicated interactions between an ETS and a carbon tax that would raise uncertainty about the overall outcome (OECD, 2006). In particular, the two instruments should be set to minimise differences in the explicit and implicit carbon prices across sectors (de Serres et al., 2010).
The government will submit legislation in 2010 to establish a framework for an ETS under a cap-and-trade scheme and set the starting date.13 Given the ability of a well-designed system to reduce GHG emissions in a cost-effective manner, Korea should quickly introduce an ETS with wide coverage, ideally by auctioning the initial permits, in order to achieve its 2020 target.14 The scheme should include banking and possibly borrowing of permits to limit risk, uncertainty and volatility. In addition, Korea’s ETS should be as comprehensive as possible in its coverage. As for a carbon tax, the government is considering such an approach as well. If the ETS is not comprehensive, a carbon tax would be an effective policy to cope with excluded sectors, while limiting overlap and complicated interactions.
A key obstacle to the implementation of an ETS and/or a carbon tax in many countries is concern about their impact on the international competitiveness of domestic industries.15 An effective climate change policy requires that some firms do not survive, either because demand for their products falls or because more GHG-efficient firms – domestic or foreign – increase their market share. However, OECD analysis has found that the effects of climate policies on competitiveness are likely to be small and limited to only a few energy-intensive industries, particularly if an ETS has broad international coverage (OECD, 2009c). This illustrates the importance of wide coverage in the post-Kyoto framework. Otherwise, the emission cuts in some countries with an ETS and/or carbon tax would be partly offset by increases elsewhere, a phenomenon referred to as carbon leakage. However, recent OECD research found that unless only very few countries take action against climate change, leakage rates will be relatively small (OECD, 2009d).
Removing environmentally harmful energy subsidies
Another priority is to remove subsidies16 to fossil fuel-based energy production and consumption, which boost GHG emissions. A recent OECD study found that closing the gap between domestic and international fossil fuel prices could cut GHG emissions in the subsidising countries by as much as 30% relative to BAU levels by 2050, and by 10% globally (Burniaux et al., 2009). Moreover, eliminating subsidies would increase efficiency and save fiscal resources that could be used more productively.
13. ETS are already in place or are about to be implemented in the European Union, Australia, Canada, New
Zealand, Norway and some states in the north-eastern part of the United States. A growing number of other countries, including Japan, are considering introducing an ETS (Burniaux et al., 2008).
14. Korea’s introduction of an emission cap-and-trade programme in 2008 covering NOx, SOx and Total Suspended Particles (TSP) in the capital region is giving it experience in operating an ETS.
15. Another concern is a possible adverse impact of a carbon tax on income distribution, reflecting its regressive nature. This can be addressed, at least in principle, via the tax-benefit system (Duval, 2008).
16. The definition of subsidies in OECD analysis of the energy sector includes grants or soft loans to producers or consumers of energy, market price support and differential tax rates on different fuels (OECD, 2005a).
ECO/WKP(2010)54
16
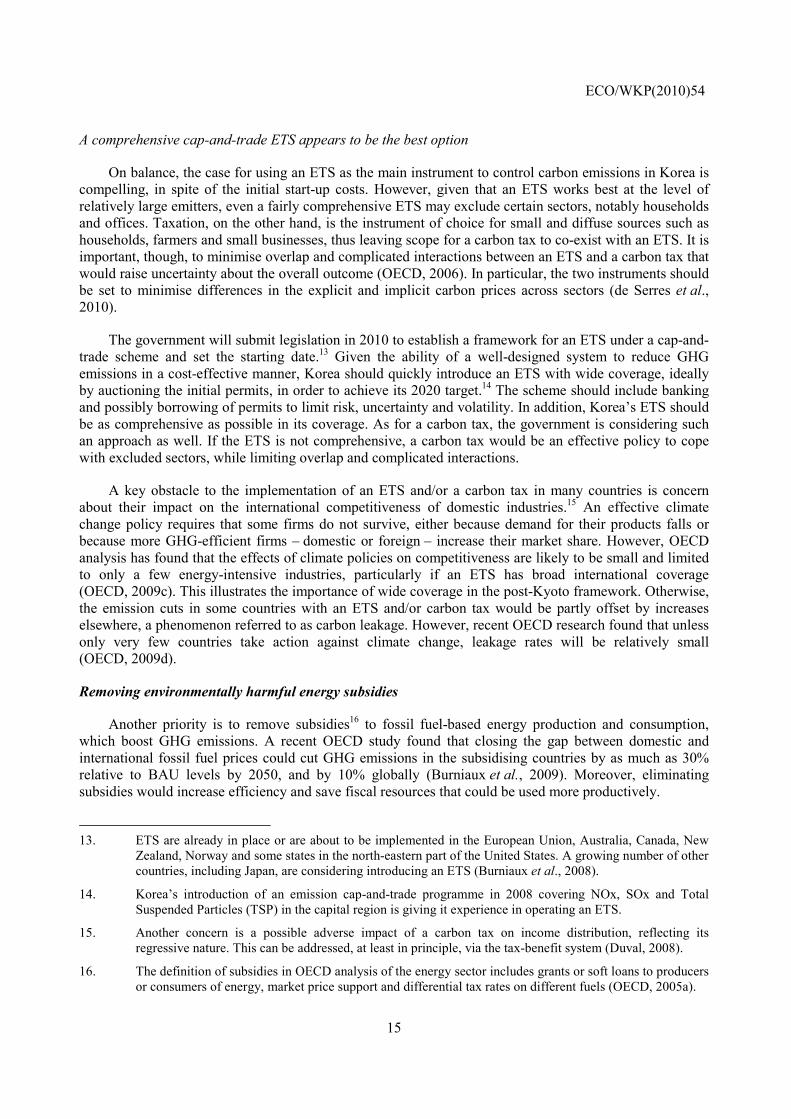
Korea has few explicit subsidies for fossil fuels and they do not protect any important domestic industries. The main subsidy is for the production of coal and its use in the form of charcoal briquettes by low-income households. In 2008, domestic coal production amounted to only 2.8% of Korea’s coal imports (Table 4). Nevertheless, this subsidy distorts resource allocation and encourages excessive consumption of coal, which has more harmful emissions than other fossil fuels. Despite the gradual decline in the subsidy, it still amounted to 267 billion won in 2009, equivalent to around 5% of total environment-related spending by the central government. The government should eliminate this subsidy in favour of more environmentally friendly measures to support low-income groups.
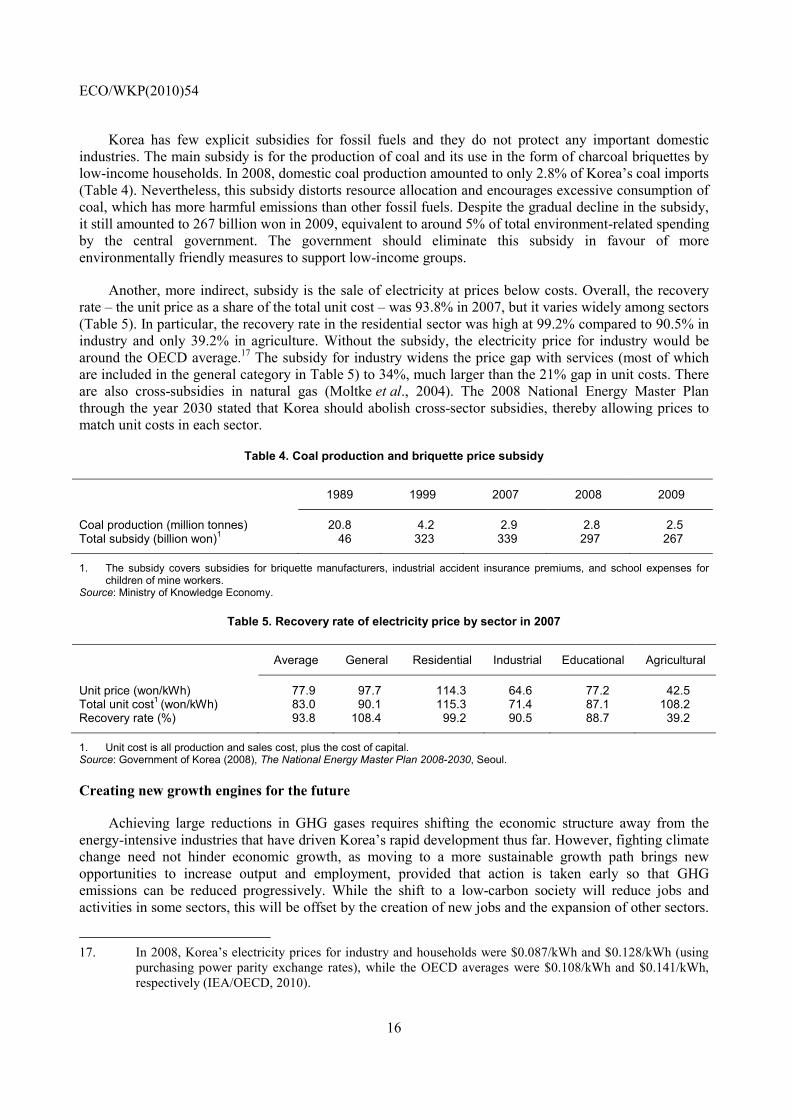
Another, more indirect, subsidy is the sale of electricity at prices below costs. Overall, the recovery rate – the unit price as a share of the total unit cost – was 93.8% in 2007, but it varies widely among sectors (Table 5). In particular, the recovery rate in the residential sector was high at 99.2% compared to 90.5% in industry and only 39.2% in agriculture. Without the subsidy, the electricity price for industry would be around the OECD average.17 The subsidy for industry widens the price gap with services (most of which are included in the general category in Table 5) to 34%, much larger than the 21% gap in unit costs. There are also cross-subsidies in natural gas (Moltke et al., 2004). The 2008 National Energy Master Plan through the year 2030 stated that Korea should abolish cross-sector subsidies, thereby allowing prices to match unit costs in each sector.
Table 4. Coal production and briquette price subsidy
1989 1999 2007 2008 2009
Coal production (million tonnes) 20.8 4.2 2.9 2.8 2.5 Total subsidy (billion won)1 46 323 339 297 267
1. The subsidy covers subsidies for briquette manufacturers, industrial accident insurance premiums, and school expenses for children of mine workers.
Source: Ministry of Knowledge Economy.
Table 5. Recovery rate of electricity price by sector in 2007
Average General Residential Industrial Educational Agricultural
Unit price (won/kWh) 77.9 97.7 114.3 64.6 77.2 42.5 Total unit cost1 (won/kWh) 83.0 90.1 115.3 71.4 87.1 108.2 Recovery rate (%) 93.8 108.4 99.2 90.5 88.7 39.2
1. Unit cost is all production and sales cost, plus the cost of capital. Source: Government of Korea (2008), The National Energy Master Plan 2008-2030, Seoul.
Creating new growth engines for the future
Achieving large reductions in GHG gases requires shifting the economic structure away from the energy-intensive industries that have driven Korea’s rapid development thus far. However, fighting climate change need not hinder economic growth, as moving to a more sustainable growth path brings new opportunities to increase output and employment, provided that action is taken early so that GHG emissions can be reduced progressively. While the shift to a low-carbon society will reduce jobs and activities in some sectors, this will be offset by the creation of new jobs and the expansion of other sectors.
17. In 2008, Korea’s electricity prices for industry and households were $0.087/kWh and $0.128/kWh (using
purchasing power parity exchange rates), while the OECD averages were $0.108/kWh and $0.141/kWh, respectively (IEA/OECD, 2010).
ECO/WKP(2010)54
17
Environmental policies can act as a catalyst for eco-innovation, in particular by creating new markets for low-carbon technologies and equipment. The net impact of environmental policies on employment could be positive insofar as green jobs tend to be concentrated in more labour-intensive sectors, such as renewable energy, recycling, public transport and construction. According to one estimate, boosting investment in renewable energy to $630 billion by 2030 would create at least 20 million additional jobs worldwide, making it a much larger source of employment than today’s fossil energy industry, which includes mining, petroleum extraction, refining and fossil power generation (UNEP, 2008).
The Five-Year Plan for Green Growth, 2009-13
To implement the National Strategy for Green Growth, which covers the years up to 2050 (Box 1), the government announced in July 2009 the Five-Year Plan for Green Growth. This initiative revives the practice of five-year plans, which were used between 1962 and the mid-1990s. While the government recognises that the “effectiveness of five-year plans dwindled as the Korean economy more broadly embraced market economy principles”, it believes that they are useful for national consensus building and to incorporate green growth spending in the national budget (Presidential Committee on Green Growth, 2009b). The Five-Year Plan absorbed the Green New Deal for 2009-12, which was announced in January 2009 to tackle the financial crisis through job creation and to secure new growth engines by transforming Korea into a green economy.18
The Five-Year Plan calls for spending 2% of GDP per year over the period 2009-13, completely financed by the central government budget except for 8.5 trillion won (0.8% of GDP) in spending by two public enterprises.19 The government estimates that the plan will induce production worth 182-206 trillion won (around 20% of 2009 GDP) and create 1.6 to 1.8 million jobs (a 10% rise in employment) by 2013, suggesting a relatively high fiscal multiplier of around two.
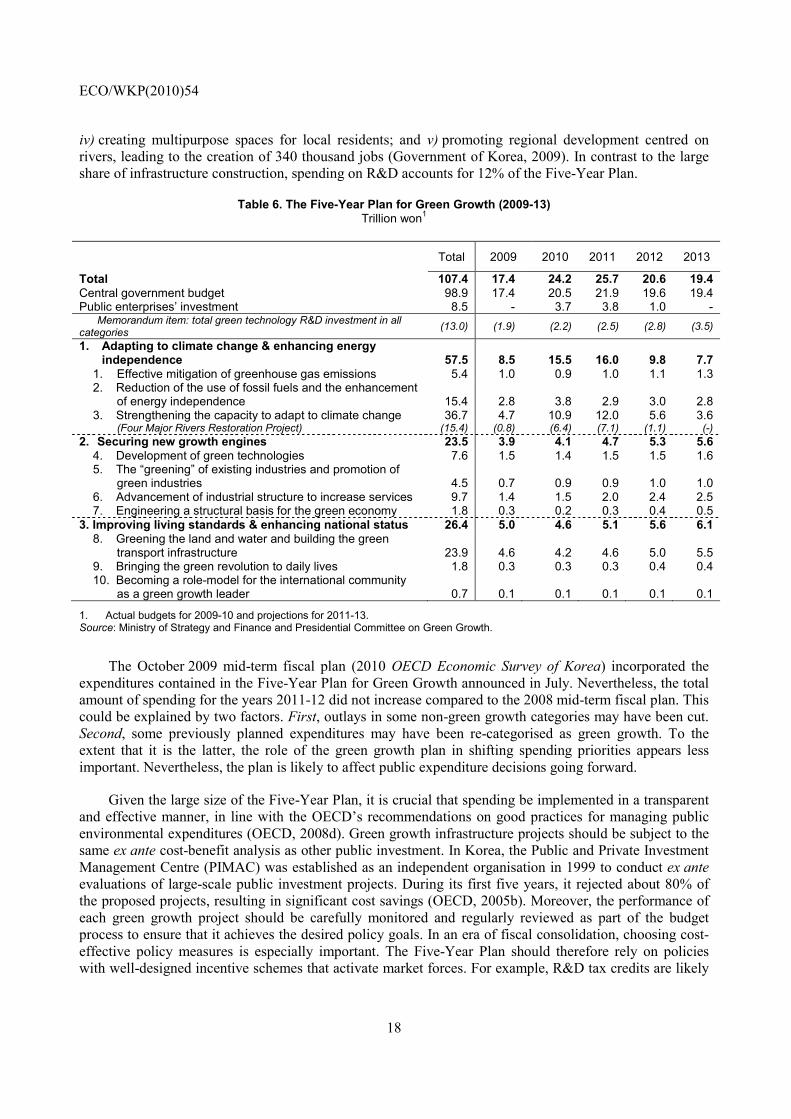
The high level of spending in the Five-Year Plan is due in part to the inclusion of large construction projects among the 600 projects (Table 6). Two of the ten spending categories, which are mainly focused on public construction, account for 61 trillion won – more than half of total expenditures. First, “Greening the land, water and building the green transport infrastructure” (category 8) includes ongoing railway projects as part of the government’s plan to boost the share of passenger transport by rail from 18% in 2009 to 26% in 2020. This will be achieved by further expanding the high-speed train system, Korea Train eXpress (KTX), which started in 2004 and already accounted for a little more than one-half of long-distance rail passengers in 2008.20 Second, “Strengthening the capacity to adapt to climate change” (category 3) includes water management, such as river restoration and sewage facility projects. The Korean peninsula experiences droughts in the spring and heavy monsoon rains in the summer and climate change is exacerbating this pattern. A large share of this spending (15.4 trillion won) is for the “Four Major Rivers Restoration Project”, which notably includes the construction of 16 new weirs (dams that allow water to flow over the top) on the four major rivers, two new dams on their tributaries and heightening the banks of 96 existing agricultural reservoirs. The Project has five aims: i) securing abundant water resources; ii) implementing comprehensive flood control; iii) improving water quality and restoring the ecosystem; 18. The Green New Deal included 36 projects, such as the Four Major Rivers Restoration Project and railroad
construction. Spending is divided between water and waste management (13 trillion won), railroad construction (11 trillion won), energy-efficient buildings (10 trillion won), low-carbon vehicles (3 trillion won) and renewable energy (3 trillion won). The government expects this programme to create 0.9 million jobs.
19. Local governments are developing their own five-year plans to implement the national plan.
20. The line connecting Daegu and Busan is to be completed by the end of 2010, while a line connecting Seoul to Mokpo in the southwest is to be completed by 2014. This spending would not be included in the OECD’s definition of environmental expenditure.
ECO/WKP(2010)54
18
iv) creating multipurpose spaces for local residents; and v) promoting regional development centred on rivers, leading to the creation of 340 thousand jobs (Government of Korea, 2009). In contrast to the large share of infrastructure construction, spending on R&D accounts for 12% of the Five-Year Plan.
Table 6. The Five-Year Plan for Green Growth (2009-13) Trillion won1
Total 2009 2010 2011 2012 2013
Total 107.4 17.4 24.2 25.7 20.6 19.4Central government budget 98.9 17.4 20.5 21.9 19.6 19.4 Public enterprises’ investment 8.5 - 3.7 3.8 1.0 - Memorandum item: total green technology R&D investment in all categories (13.0) (1.9) (2.2) (2.5) (2.8) (3.5)
1. Adapting to climate change & enhancing energy independence 57.5 8.5 15.5 16.0 9.8 7.7
1. Effective mitigation of greenhouse gas emissions 5.4 1.0 0.9 1.0 1.1 1.3 2. Reduction of the use of fossil fuels and the enhancement
of energy independence 15.4 2.8 3.8 2.9 3.0 2.8 3. Strengthening the capacity to adapt to climate change 36.7 4.7 10.9 12.0 5.6 3.6
(Four Major Rivers Restoration Project) (15.4) (0.8) (6.4) (7.1) (1.1) (-) 2. Securing new growth engines 23.5 3.9 4.1 4.7 5.3 5.6
4. Development of green technologies 7.6 1.5 1.4 1.5 1.5 1.6 5. The “greening” of existing industries and promotion of
green industries 4.5 0.7 0.9 0.9 1.0 1.0 6. Advancement of industrial structure to increase services 9.7 1.4 1.5 2.0 2.4 2.5 7. Engineering a structural basis for the green economy 1.8 0.3 0.2 0.3 0.4 0.5
3. Improving living standards & enhancing national status 26.4 5.0 4.6 5.1 5.6 6.18. Greening the land and water and building the green
transport infrastructure 23.9 4.6 4.2 4.6 5.0 5.5 9. Bringing the green revolution to daily lives 1.8 0.3 0.3 0.3 0.4 0.4 10. Becoming a role-model for the international community
as a green growth leader 0.7 0.1 0.1 0.1 0.1 0.1
1. Actual budgets for 2009-10 and projections for 2011-13. Source: Ministry of Strategy and Finance and Presidential Committee on Green Growth.
The October 2009 mid-term fiscal plan (2010 OECD Economic Survey of Korea) incorporated the expenditures contained in the Five-Year Plan for Green Growth announced in July. Nevertheless, the total amount of spending for the years 2011-12 did not increase compared to the 2008 mid-term fiscal plan. This could be explained by two factors. First, outlays in some non-green growth categories may have been cut. Second, some previously planned expenditures may have been re-categorised as green growth. To the extent that it is the latter, the role of the green growth plan in shifting spending priorities appears less important. Nevertheless, the plan is likely to affect public expenditure decisions going forward.
Given the large size of the Five-Year Plan, it is crucial that spending be implemented in a transparent and effective manner, in line with the OECD’s recommendations on good practices for managing public environmental expenditures (OECD, 2008d). Green growth infrastructure projects should be subject to the same ex ante cost-benefit analysis as other public investment. In Korea, the Public and Private Investment Management Centre (PIMAC) was established as an independent organisation in 1999 to conduct ex ante evaluations of large-scale public investment projects. During its first five years, it rejected about 80% of the proposed projects, resulting in significant cost savings (OECD, 2005b). Moreover, the performance of each green growth project should be carefully monitored and regularly reviewed as part of the budget process to ensure that it achieves the desired policy goals. In an era of fiscal consolidation, choosing cost-effective policy measures is especially important. The Five-Year Plan should therefore rely on policies with well-designed incentive schemes that activate market forces. For example, R&D tax credits are likely
ECO/WKP(2010)54
19
to lead to a more efficient allocation of resources than direct subsidies for specific projects (de Serres et al., 2010).
R&D in green technologies
Technological change is the key to minimising the cost of addressing the climate change problem (OECD, 2010e). To encourage innovation in green technologies, the first priority is to put a credible price on carbon, preferably through emissions trading, as noted above. Market forces would then provide a powerful incentive for the development of new low-carbon technologies and would guide resources to the best technologies, making them more cost-competitive.21 However, price signals alone cannot ensure adequate R&D and innovation given market failures, such as those related to learning-by-doing and market size, as well as the inability of innovators to fully capture the gains from their innovation. While such problems are common to all types of R&D, it is magnified in the area of climate change by policy uncertainty and weak protection of intellectual property rights (IPR).22 Given these market failures, public investment in R&D is needed to “kick-start” the innovation process. The government should focus on basic R&D to share the risk of developing new technologies with the private sector, particularly in large-scale projects.23 To promote the use of new technologies, the government can provide other measures, such as commercialisation support and information services (OECD, 2010a).
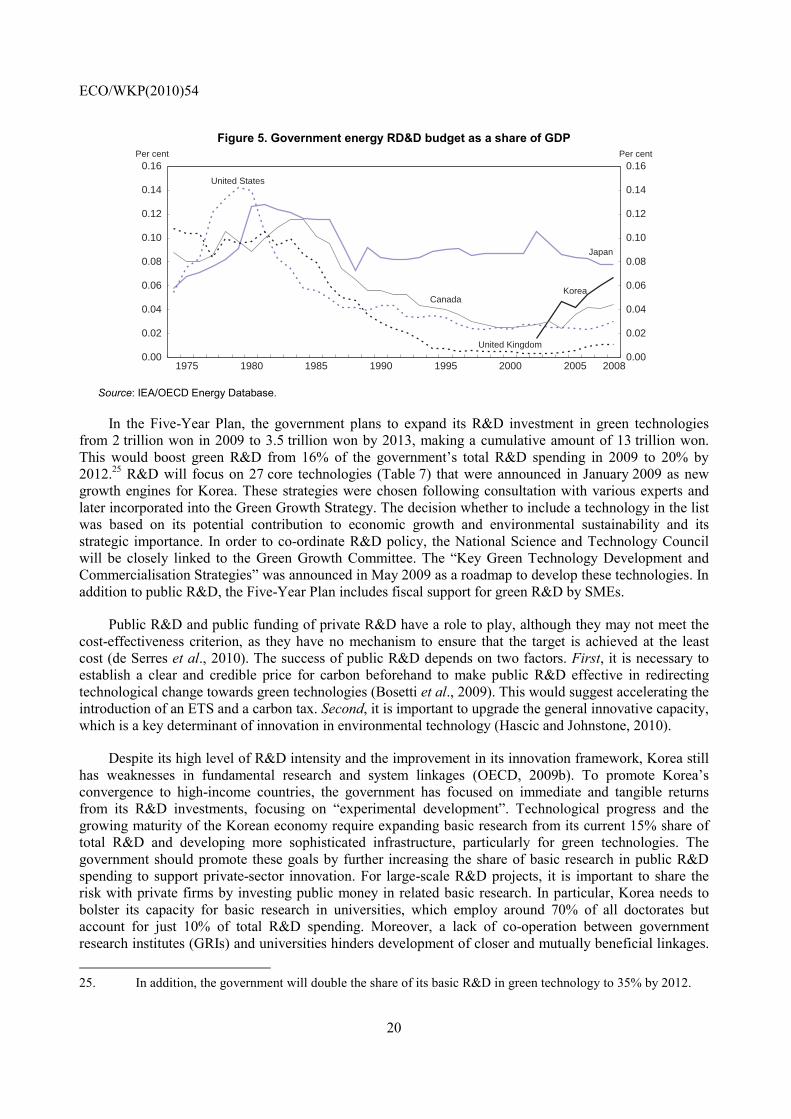
Government spending on energy research, development and demonstration (RD&D)24 fell as a share of GDP in many OECD countries between the early 1980s and the 1990s (Figure 5), reflecting the difficulties in the nuclear industry and the drop in oil prices from 1985 to 2002 (IEA/OECD, 2008a). To combat climate change and promote green growth, more public investment in RD&D worldwide appears to be needed. Korea’s RD&D budget in energy-related areas rose from 0.02% of GDP in 2002 to 0.07% in 2008, the second highest in the OECD area. In terms of the absolute amount, Korea ranks fourth after the United States, Japan and France. However, the share of green technology patents originating from R&D in the environment or energy is rather small, suggesting that innovation is very multi-disciplinary (OECD, 2010b). Therefore, the authorities should be careful in emphasising R&D in a particular area.
21. This is illustrated by the introduction of an emission cap-and-trade programme in 2008 covering NOx, SOx
and TSP in the capital region in 2008, which led to a large increase in the number of patents on technology to reduce emissions (Kim and Kang, 2009).
22. Weak protection of IPR is likely to be particularly problematic in R&D related to climate change for two reasons. First, developing countries may consider access to the most efficient abatement technologies to be an important condition for their participation in emission abatement efforts. This weakens the credibility of IPR and thus reduces firms’ incentive to innovate. Second, the value of R&D in climate change depends on the credibility of governments’ abatement policies. If firms are uncertain whether governments will follow through on their intended policies, their incentives to invest in such R&D are weakened (OECD, 2008b).
23. Breakthrough technologies, such as fuel cells, advanced biofuels or advanced nuclear technologies, are estimated to require large investment in R&D at the initial stage (de Serres et al., 2010).
24. In the area of energy R&D, “demonstration” – projects to show that new technology is feasible, for example in renewable energy sources – is an important compliment to R&D. Korean official statistics do not include outlays for demonstration. Instead, their target is for R&D alone.
ECO/WKP(2010)54
20
Figure 5. Government energy RD&D budget as a share of GDP
1975 1980 1985 1990 1995 2000 20050.00
0.02
0.04
0.06
0.08
0.10
0.12
0.14
0.16 Per cent
0.00
0.02
0.04
0.06
0.08
0.10
0.12
0.14
0.16Per cent
United States
Korea
Japan
Canada
United Kingdom
2008
Source: IEA/OECD Energy Database.
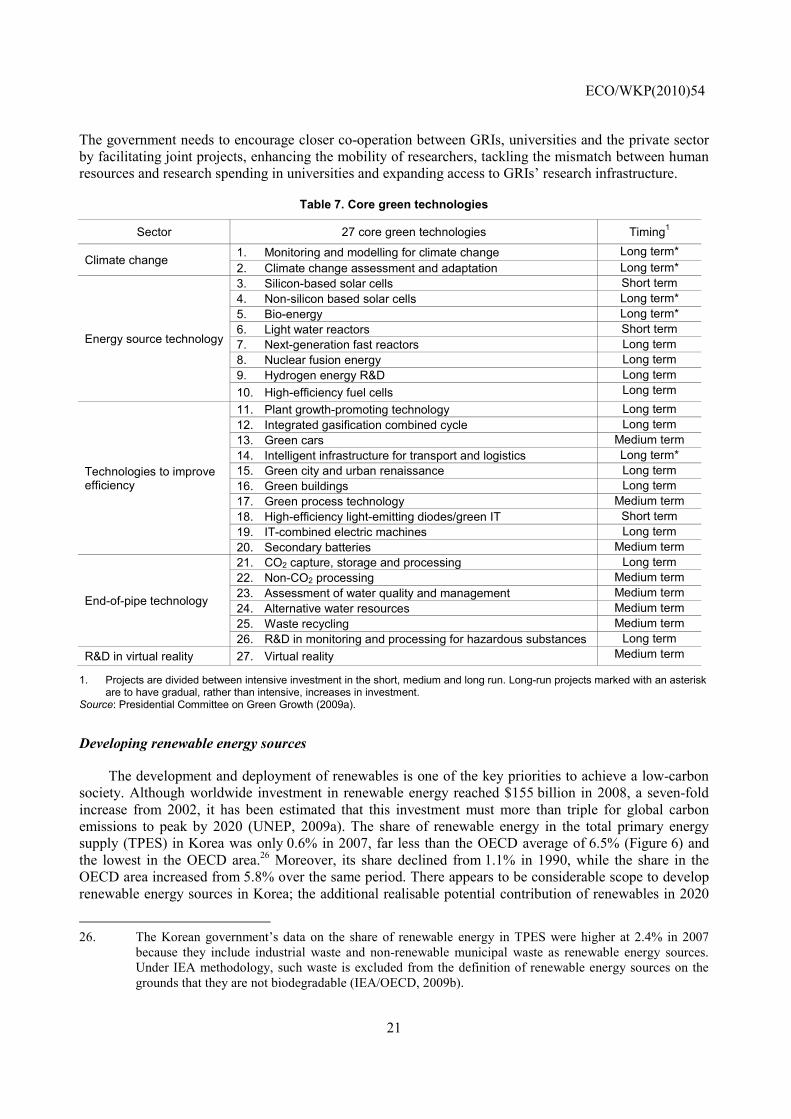
In the Five-Year Plan, the government plans to expand its R&D investment in green technologies from 2 trillion won in 2009 to 3.5 trillion won by 2013, making a cumulative amount of 13 trillion won. This would boost green R&D from 16% of the government’s total R&D spending in 2009 to 20% by 2012.25 R&D will focus on 27 core technologies (Table 7) that were announced in January 2009 as new growth engines for Korea. These strategies were chosen following consultation with various experts and later incorporated into the Green Growth Strategy. The decision whether to include a technology in the list was based on its potential contribution to economic growth and environmental sustainability and its strategic importance. In order to co-ordinate R&D policy, the National Science and Technology Council will be closely linked to the Green Growth Committee. The “Key Green Technology Development and Commercialisation Strategies” was announced in May 2009 as a roadmap to develop these technologies. In addition to public R&D, the Five-Year Plan includes fiscal support for green R&D by SMEs.
Public R&D and public funding of private R&D have a role to play, although they may not meet the cost-effectiveness criterion, as they have no mechanism to ensure that the target is achieved at the least cost (de Serres et al., 2010). The success of public R&D depends on two factors. First, it is necessary to establish a clear and credible price for carbon beforehand to make public R&D effective in redirecting technological change towards green technologies (Bosetti et al., 2009). This would suggest accelerating the introduction of an ETS and a carbon tax. Second, it is important to upgrade the general innovative capacity, which is a key determinant of innovation in environmental technology (Hascic and Johnstone, 2010).
Despite its high level of R&D intensity and the improvement in its innovation framework, Korea still has weaknesses in fundamental research and system linkages (OECD, 2009b). To promote Korea’s convergence to high-income countries, the government has focused on immediate and tangible returns from its R&D investments, focusing on “experimental development”. Technological progress and the growing maturity of the Korean economy require expanding basic research from its current 15% share of total R&D and developing more sophisticated infrastructure, particularly for green technologies. The government should promote these goals by further increasing the share of basic research in public R&D spending to support private-sector innovation. For large-scale R&D projects, it is important to share the risk with private firms by investing public money in related basic research. In particular, Korea needs to bolster its capacity for basic research in universities, which employ around 70% of all doctorates but account for just 10% of total R&D spending. Moreover, a lack of co-operation between government research institutes (GRIs) and universities hinders development of closer and mutually beneficial linkages. 25. In addition, the government will double the share of its basic R&D in green technology to 35% by 2012.
ECO/WKP(2010)54
21
The government needs to encourage closer co-operation between GRIs, universities and the private sector by facilitating joint projects, enhancing the mobility of researchers, tackling the mismatch between human resources and research spending in universities and expanding access to GRIs’ research infrastructure.
Table 7. Core green technologies
Sector 27 core green technologies Timing1
Climate change 1. Monitoring and modelling for climate change Long term* 2. Climate change assessment and adaptation Long term*
Energy source technology
3. Silicon-based solar cells Short term 4. Non-silicon based solar cells Long term* 5. Bio-energy Long term* 6. Light water reactors Short term 7. Next-generation fast reactors Long term 8. Nuclear fusion energy Long term 9. Hydrogen energy R&D Long term 10. High-efficiency fuel cells Long term
Technologies to improve efficiency
11. Plant growth-promoting technology Long term 12. Integrated gasification combined cycle Long term 13. Green cars Medium term 14. Intelligent infrastructure for transport and logistics Long term* 15. Green city and urban renaissance Long term 16. Green buildings Long term 17. Green process technology Medium term 18. High-efficiency light-emitting diodes/green IT Short term 19. IT-combined electric machines Long term 20. Secondary batteries Medium term
End-of-pipe technology
21. CO2 capture, storage and processing Long term 22. Non-CO2 processing Medium term 23. Assessment of water quality and management Medium term 24. Alternative water resources Medium term 25. Waste recycling Medium term 26. R&D in monitoring and processing for hazardous substances Long term
R&D in virtual reality 27. Virtual reality Medium term
1. Projects are divided between intensive investment in the short, medium and long run. Long-run projects marked with an asterisk are to have gradual, rather than intensive, increases in investment.
Source: Presidential Committee on Green Growth (2009a).
Developing renewable energy sources
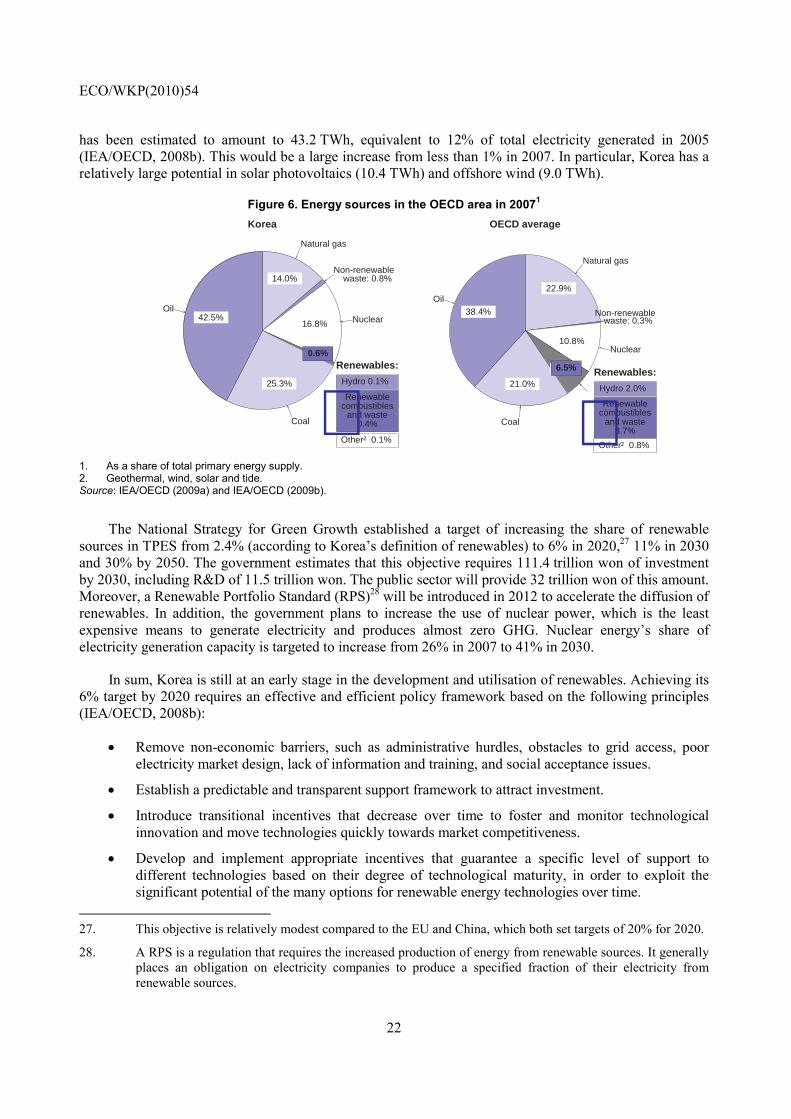
The development and deployment of renewables is one of the key priorities to achieve a low-carbon society. Although worldwide investment in renewable energy reached $155 billion in 2008, a seven-fold increase from 2002, it has been estimated that this investment must more than triple for global carbon emissions to peak by 2020 (UNEP, 2009a). The share of renewable energy in the total primary energy supply (TPES) in Korea was only 0.6% in 2007, far less than the OECD average of 6.5% (Figure 6) and the lowest in the OECD area.26 Moreover, its share declined from 1.1% in 1990, while the share in the OECD area increased from 5.8% over the same period. There appears to be considerable scope to develop renewable energy sources in Korea; the additional realisable potential contribution of renewables in 2020
26. The Korean government’s data on the share of renewable energy in TPES were higher at 2.4% in 2007
because they include industrial waste and non-renewable municipal waste as renewable energy sources. Under IEA methodology, such waste is excluded from the definition of renewable energy sources on the grounds that they are not biodegradable (IEA/OECD, 2009b).
ECO/WKP(2010)54
22
has been estimated to amount to 43.2 TWh, equivalent to 12% of total electricity generated in 2005 (IEA/OECD, 2008b). This would be a large increase from less than 1% in 2007. In particular, Korea has a relatively large potential in solar photovoltaics (10.4 TWh) and offshore wind (9.0 TWh).
Figure 6. Energy sources in the OECD area in 20071
14.0%
Natural gas
Non-renewable
16.8% Nuclear
25.3%
Coal
42.5%Oil
Renewables:
waste: 0.8%
Korea
Hydro 0.1%
Renewablecombustibles
and waste0.4%
Other² 0.1%
0.6%
22.9%
Natural gas
10.8%Nuclear
6.5%
21.0%
Coal
38.4%Oil
Renewables:
Non-renewablewaste: 0.3%
OECD average
Hydro 2.0%
6.5%
Renewablecombustibles
and waste3.7%
Other² 0.8%
1. As a share of total primary energy supply. 2. Geothermal, wind, solar and tide. Source: IEA/OECD (2009a) and IEA/OECD (2009b).
The National Strategy for Green Growth established a target of increasing the share of renewable sources in TPES from 2.4% (according to Korea’s definition of renewables) to 6% in 2020,27 11% in 2030 and 30% by 2050. The government estimates that this objective requires 111.4 trillion won of investment by 2030, including R&D of 11.5 trillion won. The public sector will provide 32 trillion won of this amount. Moreover, a Renewable Portfolio Standard (RPS)28 will be introduced in 2012 to accelerate the diffusion of renewables. In addition, the government plans to increase the use of nuclear power, which is the least expensive means to generate electricity and produces almost zero GHG. Nuclear energy’s share of electricity generation capacity is targeted to increase from 26% in 2007 to 41% in 2030.
In sum, Korea is still at an early stage in the development and utilisation of renewables. Achieving its 6% target by 2020 requires an effective and efficient policy framework based on the following principles (IEA/OECD, 2008b):
• Remove non-economic barriers, such as administrative hurdles, obstacles to grid access, poor electricity market design, lack of information and training, and social acceptance issues.
• Establish a predictable and transparent support framework to attract investment.
• Introduce transitional incentives that decrease over time to foster and monitor technological innovation and move technologies quickly towards market competitiveness.
• Develop and implement appropriate incentives that guarantee a specific level of support to different technologies based on their degree of technological maturity, in order to exploit the significant potential of the many options for renewable energy technologies over time.
27. This objective is relatively modest compared to the EU and China, which both set targets of 20% for 2020.
28. A RPS is a regulation that requires the increased production of energy from renewable sources. It generally places an obligation on electricity companies to produce a specified fraction of their electricity from renewable sources.
ECO/WKP(2010)54
23
• Consider the impact of large-scale penetration of renewable energy technologies on the energy system in terms of cost efficiency and system reliability.
As noted above, the government should develop a flexible framework that increasingly applies market principles as a renewable energy technology matures and its deployment advances. Moreover, as technology evolution is hard to predict, picking winners by subsidising specific projects is risky as it may lock in technologies that will not be economically efficient. For example, the high cost of biofuels suggests some caution in promoting this energy source. Indeed, the cost of support to biofuels is estimated at between $960 and $1 700 per tonne of CO2 saved (OECD, 2008a), compared to the price of $15 to $30 price per tonne in the European ETS.
Promoting green industries
The Five-Year Plan includes 23.5 trillion won (2.2% of 2009 GDP) to secure new growth engines, in part by greening existing industries and promoting new industries. For example, among the 17 new growth engines announced in January 2009, there were six in green technology industry; new renewable energy, low carbon energy, water technology, LED application, green transport system and high-tech green city (2010 OECD Economic Survey of Korea). The government has launched a number of initiatives to provide financial resources to green industry. First, it introduced tax incentives in 2010 for financial instruments that invest in green technology and industry. Dividends and interest from bonds, deposits and investment funds that invest at least 60% of their capital in firms and projects with green certificates (see below) are tax-exempt up to certain ceilings. Second, as part of the Five-Year Plan, government lending for green firms and projects will be expanded. Third, public credit guarantees for green firms will be increased from 2.8 trillion won in 2009 to 7 trillion won in 2013, and provided under more favourable conditions. Fourth, the government plans to launch a green private equity fund (UNEP, 2009b). These green finance measures will fund firms, projects and technologies that are granted “green certificates”, under a new programme that was introduced in April 2010. The certificates will be given by public institutes based on technologic impact, feasibility, the degree of greening and environmental impact. Green firms are defined as those for which certified green technology accounts for more than 30% of sales.
It is important to avoid the risk that granting green certificates to certain firms and projects might result in a bubble. Such a risk is demonstrated by the experience with the measures to jump-start the venture business sector in the late 1990s. Firms that met one of three criteria were designated as a venture business and received a number of financial benefits.29 The end result was a bubble in KOSDAQ, the second-tier stock exchange. Moreover, the qualifying conditions were sufficiently vague that it reduced the credibility of the venture business sector. After the introduction of tighter criteria in 2002, the KOSDAQ price index fell 90% from its 1999 peak (2005 OECD Economic Survey of Korea). In establishing green certificates, the government should plan an exit strategy in order to avoid another disruptive bubble.
Direct government support for green industries raises a number of policy challenges, such as choosing which sectors should receive support, the appropriate timing of assistance and the suitable policy instrument. These decisions entail inherent risks, as illustrated by the mixed results of past government efforts to identify growth engines (OECD, 2004). Efforts to “pick winners” are inherently risky given the pace of innovative change and the possibility of being locked into the wrong technology. Moreover, there is a risk of losing significant amounts of public funds. To avoid government failure, policies to promote
29. A firm could be certified as a venture business by the Small and Medium Business Administration if it met
one of three criteria: i) it received equity investment from venture capitalists amounting to more than 10% of its capital; ii) the amount (over 50 million won) and intensity of its R&D spending was high; and iii) it used new technologies. As of 2004, only 5% and 18% of venture businesses qualified under the first two criteria, while 77% were approved under the less stringent third criterion.
ECO/WKP(2010)54
24
green industries should be as neutral as possible, focusing on basic and long-term R&D in technologies that are still too far from commercial viability to attract private investment. In sum, measures to promote green growth should not revert to traditional industrial policies.
The priority should be to establish a framework that will promote the transformation to a low-carbon economy at a low cost. First, as noted above, it is essential to establish a price for carbon through an ETS and a carbon tax. Second, fossil fuel subsidies should be phased out. Third, the shift towards a low-carbon economy requires the reallocation of labour and capital resources across sectors. For workers, labour market flexibility to promote the redeployment of workers and effective training are required (OECD, 2010c). Fourth, strong competition, including openness to imports and foreign direct investment, is needed to stimulate the adoption of new technology. In particular, it is important to facilitate the entry of new firms, which account for a large share of radical innovations in some fields, and the exit of firms in declining industries. In addition, the government should reduce barriers to imports of products important for climate change technology. A recent OECD study found that Korea’s trade barriers in this regard are high compared to those in the EU, Japan and the United States (Steenblik and Kim, 2009).
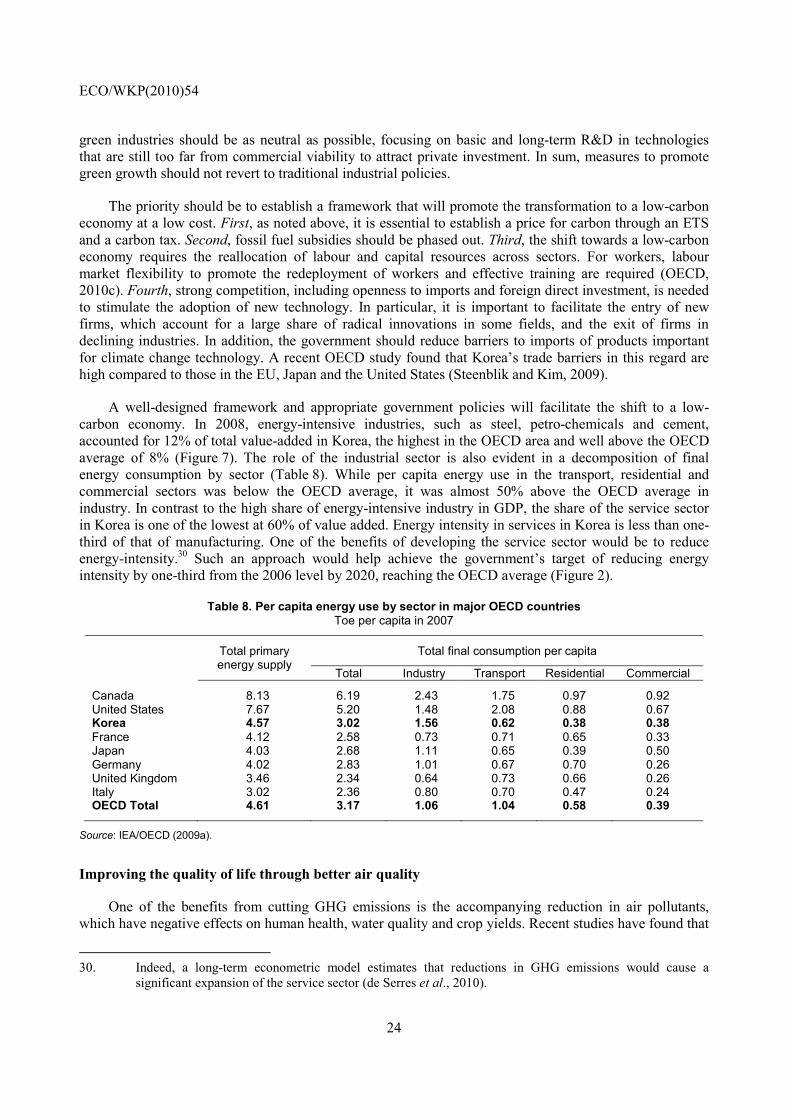
A well-designed framework and appropriate government policies will facilitate the shift to a low-carbon economy. In 2008, energy-intensive industries, such as steel, petro-chemicals and cement, accounted for 12% of total value-added in Korea, the highest in the OECD area and well above the OECD average of 8% (Figure 7). The role of the industrial sector is also evident in a decomposition of final energy consumption by sector (Table 8). While per capita energy use in the transport, residential and commercial sectors was below the OECD average, it was almost 50% above the OECD average in industry. In contrast to the high share of energy-intensive industry in GDP, the share of the service sector in Korea is one of the lowest at 60% of value added. Energy intensity in services in Korea is less than one-third of that of manufacturing. One of the benefits of developing the service sector would be to reduce energy-intensity.30 Such an approach would help achieve the government’s target of reducing energy intensity by one-third from the 2006 level by 2020, reaching the OECD average (Figure 2).
Table 8. Per capita energy use by sector in major OECD countries Toe per capita in 2007
Total primary energy supply
Total final consumption per capita
Total Industry Transport Residential Commercial
Canada 8.13 6.19 2.43 1.75 0.97 0.92 United States 7.67 5.20 1.48 2.08 0.88 0.67 Korea 4.57 3.02 1.56 0.62 0.38 0.38 France 4.12 2.58 0.73 0.71 0.65 0.33 Japan 4.03 2.68 1.11 0.65 0.39 0.50 Germany 4.02 2.83 1.01 0.67 0.70 0.26 United Kingdom 3.46 2.34 0.64 0.73 0.66 0.26 Italy 3.02 2.36 0.80 0.70 0.47 0.24 OECD Total 4.61 3.17 1.06 1.04 0.58 0.39
Source: IEA/OECD (2009a).
Improving the quality of life through better air quality
One of the benefits from cutting GHG emissions is the accompanying reduction in air pollutants, which have negative effects on human health, water quality and crop yields. Recent studies have found that
30. Indeed, a long-term econometric model estimates that reductions in GHG emissions would cause a
significant expansion of the service sector (de Serres et al., 2010).
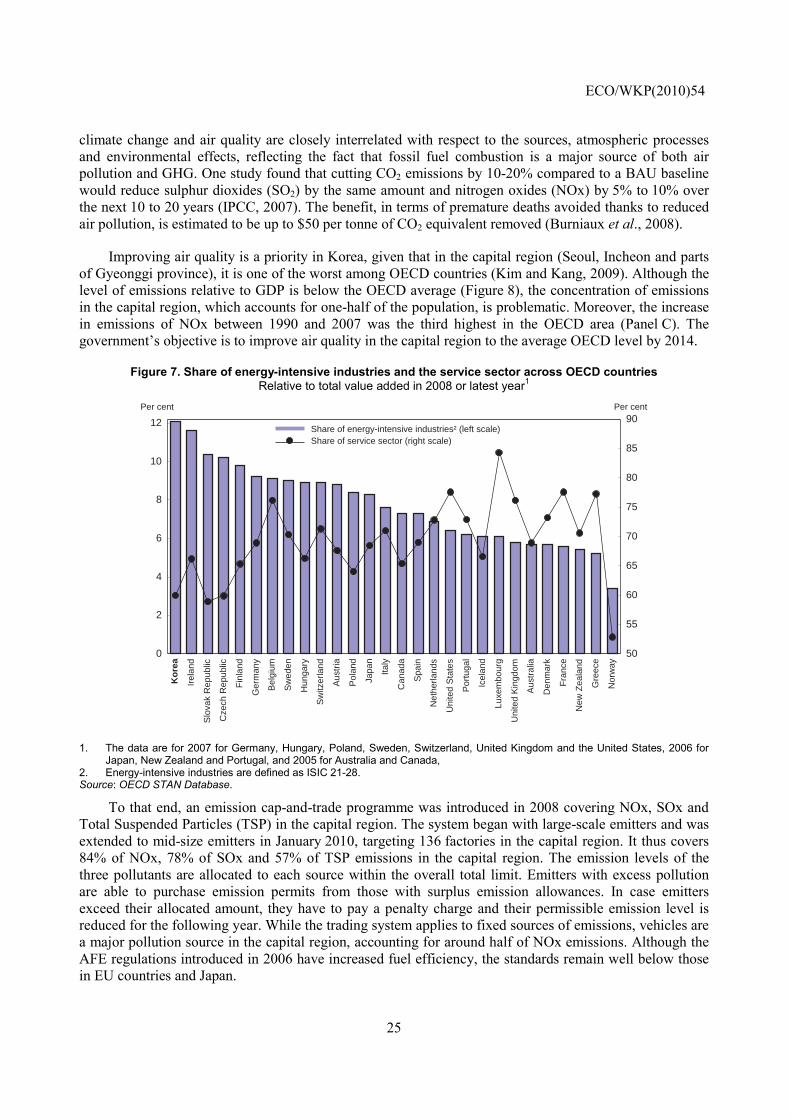
ECO/WKP(2010)54
25
climate change and air quality are closely interrelated with respect to the sources, atmospheric processes and environmental effects, reflecting the fact that fossil fuel combustion is a major source of both air pollution and GHG. One study found that cutting CO2 emissions by 10-20% compared to a BAU baseline would reduce sulphur dioxides (SO2) by the same amount and nitrogen oxides (NOx) by 5% to 10% over the next 10 to 20 years (IPCC, 2007). The benefit, in terms of premature deaths avoided thanks to reduced air pollution, is estimated to be up to $50 per tonne of CO2 equivalent removed (Burniaux et al., 2008).
Improving air quality is a priority in Korea, given that in the capital region (Seoul, Incheon and parts of Gyeonggi province), it is one of the worst among OECD countries (Kim and Kang, 2009). Although the level of emissions relative to GDP is below the OECD average (Figure 8), the concentration of emissions in the capital region, which accounts for one-half of the population, is problematic. Moreover, the increase in emissions of NOx between 1990 and 2007 was the third highest in the OECD area (Panel C). The government’s objective is to improve air quality in the capital region to the average OECD level by 2014.
Figure 7. Share of energy-intensive industries and the service sector across OECD countries Relative to total value added in 2008 or latest year1
0
2
4
6
8
10
12
Per cent
50
55
60
65
70
75
80
85
90Per cent
Ko
rea
Irel
and
Slo
vak
Rep
ublic
Cze
ch R
epub
lic
Fin
land
Ger
man
y
Bel
gium
Sw
eden
Hun
gary
Sw
itzer
land
Aus
tria
Pol
and
Japa
n
Italy
Can
ada
Spa
in
Net
herla
nds
Uni
ted
Sta
tes
Por
tuga
l
Icel
and
Luxe
mbo
urg
Uni
ted
Kin
gdom
Aus
tral
ia
Den
mar
k
Fra
nce
New
Zea
land
Gre
ece
Nor
way
Share of energy-intensive industries² (left scale) Share of service sector (right scale)
1. The data are for 2007 for Germany, Hungary, Poland, Sweden, Switzerland, United Kingdom and the United States, 2006 for Japan, New Zealand and Portugal, and 2005 for Australia and Canada,
2. Energy-intensive industries are defined as ISIC 21-28. Source: OECD STAN Database.
To that end, an emission cap-and-trade programme was introduced in 2008 covering NOx, SOx and Total Suspended Particles (TSP) in the capital region. The system began with large-scale emitters and was extended to mid-size emitters in January 2010, targeting 136 factories in the capital region. It thus covers 84% of NOx, 78% of SOx and 57% of TSP emissions in the capital region. The emission levels of the three pollutants are allocated to each source within the overall total limit. Emitters with excess pollution are able to purchase emission permits from those with surplus emission allowances. In case emitters exceed their allocated amount, they have to pay a penalty charge and their permissible emission level is reduced for the following year. While the trading system applies to fixed sources of emissions, vehicles are a major pollution source in the capital region, accounting for around half of NOx emissions. Although the AFE regulations introduced in 2006 have increased fuel efficiency, the standards remain well below those in EU countries and Japan.
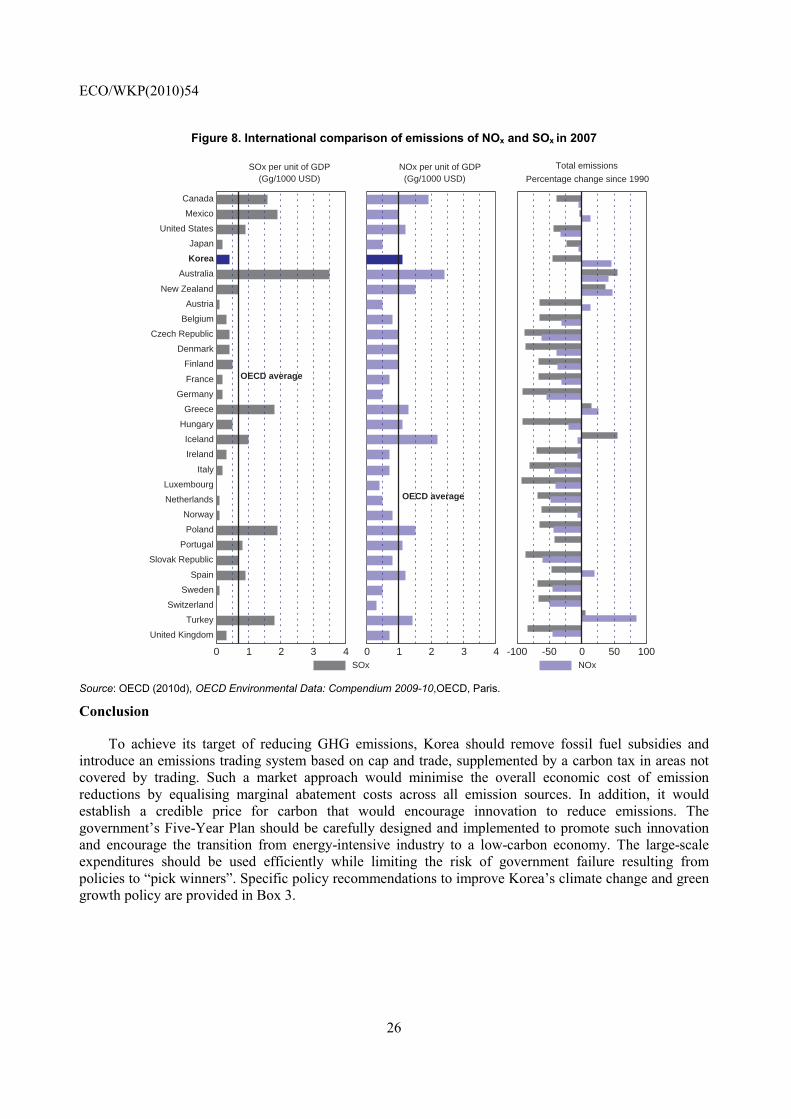
ECO/WKP(2010)54
26
Figure 8. International comparison of emissions of NOx and SOx in 2007
0 1 2 3 4
Canada
Mexico
United States
Japan
Korea
Australia
New Zealand
Austria
Belgium
Czech Republic
Denmark
Finland
France
Germany
Greece
Hungary
Iceland
Ireland
Italy
Luxembourg
Netherlands
Norway
Poland
Portugal
Slovak Republic
Spain
Sweden
Switzerland
Turkey
United Kingdom
SOx per unit of GDP (Gg/1000 USD)
OECD average
SOx NOx
0 1 2 3 4
NOx per unit of GDP (Gg/1000 USD)
OECD average
-100 -50 0 50 100
Total emissions
Percentage change since 1990
Source: OECD (2010d), OECD Environmental Data: Compendium 2009-10,OECD, Paris.
Conclusion
To achieve its target of reducing GHG emissions, Korea should remove fossil fuel subsidies and introduce an emissions trading system based on cap and trade, supplemented by a carbon tax in areas not covered by trading. Such a market approach would minimise the overall economic cost of emission reductions by equalising marginal abatement costs across all emission sources. In addition, it would establish a credible price for carbon that would encourage innovation to reduce emissions. The government’s Five-Year Plan should be carefully designed and implemented to promote such innovation and encourage the transition from energy-intensive industry to a low-carbon economy. The large-scale expenditures should be used efficiently while limiting the risk of government failure resulting from policies to “pick winners”. Specific policy recommendations to improve Korea’s climate change and green growth policy are provided in Box 3.
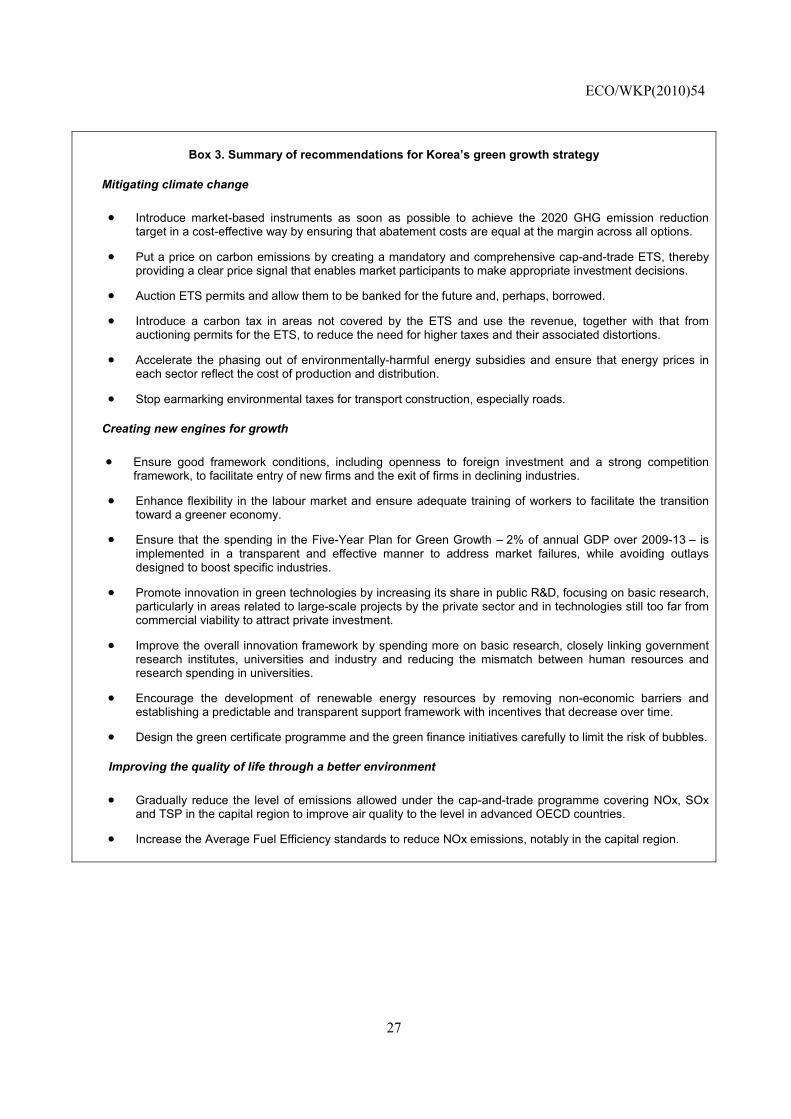
ECO/WKP(2010)54
27
Box 3. Summary of recommendations for Korea’s green growth strategy
Mitigating climate change
• Introduce market-based instruments as soon as possible to achieve the 2020 GHG emission reduction target in a cost-effective way by ensuring that abatement costs are equal at the margin across all options.
• Put a price on carbon emissions by creating a mandatory and comprehensive cap-and-trade ETS, thereby providing a clear price signal that enables market participants to make appropriate investment decisions.
• Auction ETS permits and allow them to be banked for the future and, perhaps, borrowed.
• Introduce a carbon tax in areas not covered by the ETS and use the revenue, together with that from auctioning permits for the ETS, to reduce the need for higher taxes and their associated distortions.
• Accelerate the phasing out of environmentally-harmful energy subsidies and ensure that energy prices in each sector reflect the cost of production and distribution.
• Stop earmarking environmental taxes for transport construction, especially roads.
Creating new engines for growth
• Ensure good framework conditions, including openness to foreign investment and a strong competition framework, to facilitate entry of new firms and the exit of firms in declining industries.
• Enhance flexibility in the labour market and ensure adequate training of workers to facilitate the transition toward a greener economy.
• Ensure that the spending in the Five-Year Plan for Green Growth – 2% of annual GDP over 2009-13 – is implemented in a transparent and effective manner to address market failures, while avoiding outlays designed to boost specific industries.
• Promote innovation in green technologies by increasing its share in public R&D, focusing on basic research, particularly in areas related to large-scale projects by the private sector and in technologies still too far from commercial viability to attract private investment.
• Improve the overall innovation framework by spending more on basic research, closely linking government research institutes, universities and industry and reducing the mismatch between human resources and research spending in universities.
• Encourage the development of renewable energy resources by removing non-economic barriers and establishing a predictable and transparent support framework with incentives that decrease over time.
• Design the green certificate programme and the green finance initiatives carefully to limit the risk of bubbles.
Improving the quality of life through a better environment
• Gradually reduce the level of emissions allowed under the cap-and-trade programme covering NOx, SOx and TSP in the capital region to improve air quality to the level in advanced OECD countries.
• Increase the Average Fuel Efficiency standards to reduce NOx emissions, notably in the capital region.
ECO/WKP(2010)54
28
Bibliography
Bosetti, V., C. Carraro and E. Massetti (2008), “Banking Permits: Economic Efficiency and Distributional Effects”, CESifo Working Paper Series, No. 2214, Munich.
Bosetti, V., C. Carraro, R. Duval, A. Sgobbi and M. Tavoni (2009), “The Role of R&D and Technology Diffusion in Climate Change Mitigation: New Perspectives Using the WITCH Model”, OECD Economics Department Working Papers, No. 664, OECD, Paris.
Burniaux, J., J. Chateau, R. Duval and S. Jamet (2008), “The Economics of Climate Change Mitigation: Policies and Options for the Future”, OECD Economics Department Working Papers, No. 658, OECD, Paris.
Burniaux, J., J. Chateau, R. Dellink, R. Duval and S. Jamet (2009), “The Economics of Climate Change Mitigation: How to Build the Necessary Global Action in a Cost-Effective Manner?”, OECD Economics Department Working Papers, No. 701, OECD, Paris.
de Serres, A., F. Murtin and G. Nicoletti (2010), “A Framework for Assessing Green Growth Policies”, OECD Economics Department Working Papers, No. 774, OECD, Paris.
Duval, R. (2008), “A Taxonomy of Instruments to Reduce Greenhouse Gas Emissions and their Interactions”, OECD Economics Department Working Papers, No. 636, OECD, Paris.
Ellis, J. and D. Tirpak (2006), Linking GHG Emission Trading Systems and Markets, OECD/IEA, Paris.
Goodstein, E. (2007), Economics and the Environment, John Wiley & Sons, Chichester, U.K.
Government of Korea (2008), The National Energy Master Plan 2008-2030, Seoul.
Government of Korea (2009), Restoration of Four Rivers, Seoul.
Hascic, I and N. Johnstone (2010), “The Invention and Transfer of Climate Change Mitigation Technologies: Evidence Based on Patent Data”, (www.oecd.org/environment/innvoation).
IEA/OECD (2006), Energy Policies of IEA Countries: Korea, IEA/OECD, Paris.
IEA/OECD (2008a), Energy Technology Perspectives, Scenarios & Strategies to 2050, IEA/OECD, Paris.
IEA/OECD (2008b), Deploying Renewables: Principles for Effective Policies, IEA/OECD, Paris.
IEA/OECD (2009a), Energy Balances of OECD countries, IEA/OECD, Paris.
IEA/OECD (2009b), Renewables Information, IEA/OECD, Paris.
IEA/OECD (2010), Energy Prices and Taxes, 1st Quarter, IEA/OECD, Paris.
Intergovernmental Panel on Climate Change (IPCC) (2007), Fourth Assessment Report, Climate Change 2007, Paris.
Kim, J. and K. Kang (2009), “A Case Study of the Innovation Impacts of the Korean Emission Trading System for NOx and SOx Emissions”, prepared as a contribution to OECD (2010e).
ECO/WKP(2010)54
29
Moltke, A., C. McKee and T. Morgan (2004), Energy Subsidies: Lessons Learned in Assessing their Impact and Designing Policy Reforms, United Nations Environment Programme.
OECD (2004), OECD Economic Survey of Korea, OECD, Paris.
OECD (2005a), Environmentally Harmful Subsidies: Challenges for Reform, OECD, Paris.
OECD (2005b), OECD Economic Survey of Korea, OECD, Paris.
OECD (2006), Political Economy of Environmentally Related Taxes, OECD, Paris.
OECD (2008a), Biofuel Support Policies: An Economic Assessment, OECD, Paris.
OECD (2008b), Climate Change Mitigation; What Do We Do?, OECD, Paris.
OECD (2008c), OECD Economic Survey of Korea, OECD, Paris.
OECD (2008d), Recommendation of the Council on Good Practices for Public Environmental Expenditure Management, (www.oecd.org/dataoecd/10/46/38787377.pdf), OECD, Paris.
OECD (2009a), OECD Economic Survey of Japan, OECD, Paris.
OECD (2009b), OECD Reviews of Innovation Policy: Korea, OECD, Paris.
OECD (2009c), OECD’s Strategic Response to the Financial and Economic Crisis, OECD, Paris.
OECD (2009d), “Progress Report on Climate Change”, (www.oecd.org/document /6/0,3343,en_21571361_42445076_42572486_1_1_1_1,00.html), OECD, Paris.
OECD (2010a), Eco-Innovation in Industry: Enabling Green Growth, OECD, Paris.
OECD (2010b), Measuring Innovation: A new Perspective, OECD, Paris (forthcoming).
OECD (2010c), OECD Economic Survey of Korea, OECD, Paris.
OECD (2010d), OECD Environmental Data: Compendium 2009-10, OECD, Paris (forthcoming).
OECD (2010e), Taxation, Innovation and Environment, OECD, Paris (forthcoming).
Philibert, C. and J. Reinaud (2004), “Emissions Trading: Taking Stock and Looking Forward”, http://www.oecd.org/dataoecd/58/59/32140134.pdf, OECD/IEA, Paris.
Presidential Committee on Green Growth (2009a), National Strategy for Green Growth and Five-Year Plan, Seoul (in Korean).
Presidential Committee on Green Growth (2009b), Road to our Future: Green Growth, Seoul.
Steenblik, R. and J. Kim (2009), “Facilitating Trade in Selected Climate Change Mitigation Technologies in the Energy Supply, Buildings, and Industry Sectors”, OECD Trade and Environmental Working Papers, 2009/2, OECD, Paris.
Stern, N. (2007), The Economics of Climate Change: The Stern Review, Cambridge University Press.
ECO/WKP(2010)54
30
UNEP (2008), Green Jobs: Towards Decent Work in a Sustainable, Low-Carbon World, September, UNEP, New York.
UNEP (2009a), Global Trends in Sustainable Energy Investment 2009, UNEP, New York.
UNEP (2009b), Overview of the Republic of Korea’s Green Growth National Vision: An Interim Report, UNEP, New York.
ECO/WKP(2010)54
31
WORKING PAPERS
The full series of Economics Department Working Papers can be consulted at www.oecd.org/eco/workingpapers/
797. Health-care reform in Korea (July 2010) by Randall S. Jones 796. The Korean financial system: overcoming the global financial crisis and addressing remaining
problems (July 2010) by Masahiko Tsutsumi, Randall S. Jones and Thomas F. Cargill 795. Are global imbalances sustainable? Post-crisis scenarios (July 2010) by Luiz de Mello and Pier Carlo Padoan 794. Is there a case for carbon-based border tax adjustment? An applied general equilibrium analysis (July 2010) by Jean-Marc Burniaux, Jean Chateau and Romain Duval 793. Promoting potential growth: The role of structural reform (July 2010) by Luiz de Mello and Pier Carlo Padoan 792. Catching-up and inflation in Europe: Balassa-Samuelson, Engel’s law and other culprits (July 2010) by Balázs Égert 791. Do product market regulations in upstream sectors curb productivity growth? Panel data evidence
for OECD countries (July 2010) by Renaud Bourlès, Gilbert Cette, Jimmy Lopez, Jacques Mairesse, Giuseppe Nicoletti
790. Preparing for Euro adoption in Poland (July 2010) by Rafal Kierzenkowski 789. Gauging the impact of higher capital and oil costs on potential output (June 2010) by Boris Cournède 788. The German banking system: lessons from the financial crisis (June 2010) by Felix Hüfner 787. Measuring competition in Slovenian industries - estimation of mark-ups (June 2010) by Margit Molnar 786. Enhancing financial stability through better regulation in Hungary (June 2010) by Margit Molnar 785. Chile: Boosting productivity growth by strengthening competition, entrepreneurship and innovation (June 2010) by Cyrille Schwellnus 784. Chile: Climbing on giants’ shoulders: better schools for all Chilean children (June 2010) by Nicola Brandt 783. Israel: Monetary and fiscal policy (June 2010) by Charlotte Moeser
ECO/WKP(2010)54
32
782. Policy options for reducing poverty and raising employment rates in Israel (June 2010) by Philip Hemmings 781. Israeli education policy: How to move ahead in reform (June 2010) by Philip Hemmings 780. Germany’s growth potential, structural reforms and global imbalances (June 2010) by Isabell Koske and Andreas Wörgötter 779 Energy policy and the transition to a low-carbon economy (June 2010) by Jeremy Lawson 778 Making the Luxembourg labour market work better (June 2010) by Jeremy Lawson 777 Coping with the job crisis and preparing for ageing: the case of Finland (June 2010) by Henrik Braconier 776. The political economy of fiscal consolidation (June 2010) by Robert Price 775. Structural and cyclical factors behind current-account balances (May 2010) by Calista Cheung, Davide Furceri and Elena Rusticelli 774. A framework for assessing green growth policies (May 2010) by Alain de Serres, Fabrice Murtin and Giusepppe Nicoletti 773. Modeling institutions, start-ups and productivity during the transition (May 2010) by Zuzana Brixiova and Balázs Égert 772. Can emerging asset price bubbles be detected? (June 2010) by Jesús Crespo Cuaresma 771. The nature of financial and real business cycles (2010) by Balázs Égert 770. The effects of fiscal policy on output: A DSGE analysis (May 2010) by Davide Furceri and Annabelle Mourougane 769. Health care systems: efficiency and institutions (May 2010) by Isabelle Joumard, Christophe André and Chantal Nicq 768. The OECD’s new global model (May 2010) by Karine Hervé, Nigel Pain, Pete Richardson, Franck Sédillot and Pierre-Olivier Beffy 767. Assessing the impact of the financial crisis on structural unemployment in OECD countries (May 2010) by Stéphanie Guichard and Elena Rusticelli