economics in meal planning. factors influencing food cost americans spend approximately 13 percent...
TRANSCRIPT

Economics in Meal PlanningEconomics in Meal Planning

Factors Influencing Food CostFactors Influencing Food CostAmericans spend approximately 13 percent of their disposable income on food which includes food consumed both in and outside the home
Crop production-cost, weather conditions.Crop production-cost, weather conditions.
Trade policies-cost of imports and exports, Trade policies-cost of imports and exports, agreements on food safety and biotechnology.agreements on food safety and biotechnology.
Food processing and packaging-fabrication, labor, Food processing and packaging-fabrication, labor, labeling, research and development.labeling, research and development.
Marketing-from farmer to consumer costs account for Marketing-from farmer to consumer costs account for 81% of cost of food.81% of cost of food.
Type of food store-supermarket, niche market, Type of food store-supermarket, niche market, convenience store, farmer’s market, coops, convenience store, farmer’s market, coops, warehouse or discount stores.warehouse or discount stores.

Factors in Selecting a MarketFactors in Selecting a Market
LocationLocation
CleanlinessCleanliness
Physical FeaturesPhysical Features
Services and PersonnelServices and Personnel
Overall Food QualityOverall Food Quality
Fresh ProduceFresh Produce
Meat and DairyMeat and Dairy
Delicatessen and BakeryDelicatessen and Bakery
Breadth of InventoryBreadth of Inventory
Food PricesFood Prices

Determinants of SpendingDeterminants of Spending
Number of family members, ageNumber of family members, age
Family incomeFamily income
Where meals are eatenWhere meals are eaten
Supplemental programsSupplemental programs
Location of marketLocation of market
Alternative marketing choicesAlternative marketing choices
Choice of food within a groupChoice of food within a group

Managing MarketingManaging Marketing
Prepare a list-organize by store, include Prepare a list-organize by store, include amount neededamount needed
Maximizing Shopping-timing and shopping Maximizing Shopping-timing and shopping decisionsdecisions
Shopping Aids like unit pricing, open Shopping Aids like unit pricing, open dating, and ingredient labelingdating, and ingredient labeling

Ways of EconomizeWays of EconomizeEat at homeEat at home
Check newspapers and advertisements, use Check newspapers and advertisements, use couponscoupons
Plan meals the family will eat, use a market listPlan meals the family will eat, use a market list
Use less meatUse less meat
Determine between scratch preparation and Determine between scratch preparation and convenienceconvenience
Limit spending on beverages and snacksLimit spending on beverages and snacks
Read labelsRead labels
Use larger sizesUse larger sizes
Avoid home wasteAvoid home waste

Convenience FoodsConvenience Foods
Defined as fully or partially prepared foods for Defined as fully or partially prepared foods for which significant preparation time, culinary which significant preparation time, culinary skills, or energy use have been transferred skills, or energy use have been transferred from the consumer’s kitchen to the food from the consumer’s kitchen to the food processor or distributorprocessor or distributor
Usually thought to have undergone a large Usually thought to have undergone a large amount of processing-ready prepared, amount of processing-ready prepared, prefabricated, or service readyprefabricated, or service ready
Consider cost, eating quality, nutritive value Consider cost, eating quality, nutritive value and savings of time and effortand savings of time and effort

Eating OutEating Out
According to the Continuing Survey of According to the Continuing Survey of Food Intakes by Individuals (CSFI II), Food Intakes by Individuals (CSFI II), 57% of individuals eat at least one food 57% of individuals eat at least one food away from home per day.away from home per day.
33% at fast food restaurants33% at fast food restaurants
27% at restaurants with table service27% at restaurants with table service
25% from grocery or convenience 25% from grocery or convenience storesstores
40-50% of calories and 26 nutrients are 40-50% of calories and 26 nutrients are provided by food eaten away from homeprovided by food eaten away from home

Eating Out ContinuedEating Out ContinuedTeenage males and higher income people Teenage males and higher income people are most likely to eat away from homeare most likely to eat away from home
3-5 year olds et 20% of calories away from 3-5 year olds et 20% of calories away from home, mostly at friends and day carehome, mostly at friends and day care
6-19 year olds eat 40% if calories away 6-19 year olds eat 40% if calories away from home, mostly at school and fast food from home, mostly at school and fast food placesplaces
See an increase in consumption of non-See an increase in consumption of non-citrus juice and soft drinkscitrus juice and soft drinks

Quality of Away From Home Quality of Away From Home EatingEating
16% of food eaten away from home in 1977-7816% of food eaten away from home in 1977-78
27% if food eaten away from home in 199527% if food eaten away from home in 1995
Fat 31.5% of calories in home foodsFat 31.5% of calories in home foods
37.6% of calories in foods away from home37.6% of calories in foods away from home
Fiber 25% less in foods away from homeFiber 25% less in foods away from home
Calcium 20% below benchmark in foods away Calcium 20% below benchmark in foods away from home while foods at home were at from home while foods at home were at benchmarkbenchmark

USDA Food PlansUSDA Food PlansPublished quarterly to help families achieve Published quarterly to help families achieve satisfying nutritious meals at affordable costs.satisfying nutritious meals at affordable costs.
Four current plans:Four current plans:
Thrifty plan has been used as the basis for the Thrifty plan has been used as the basis for the Food Stamp Program and is criticized as being Food Stamp Program and is criticized as being nutritionally inadequate if used for long periods nutritionally inadequate if used for long periods of timeof time
Low-cost and moderate-cost plans are in line Low-cost and moderate-cost plans are in line with diet of most families with diet of most families
Liberal plan is typical of diet where income Liberal plan is typical of diet where income permits more spending freedompermits more spending freedom

USDA Food Plans ContinuedUSDA Food Plans Continued
Cost differences among the food plansCost differences among the food plans
Low-costLow-cost 30% above thrifty30% above thrifty
Moderate-costModerate-cost 25% above low-cost25% above low-cost
LiberalLiberal 20% above moderate20% above moderate
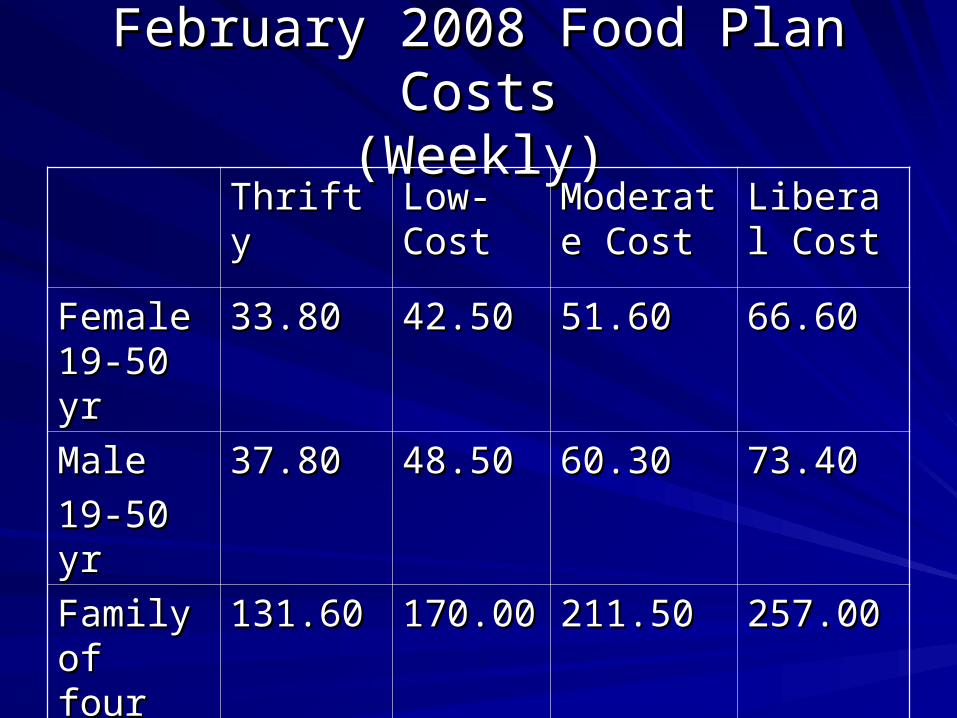
February 2008 Food Plan CostsFebruary 2008 Food Plan Costs(Weekly)(Weekly)
ThriftyThrifty Low-Low-CostCost
Moderate Moderate CostCost
Liberal Liberal CostCost
Female Female 19-50 yr19-50 yr
33.8033.80 42.5042.50 51.6051.60 66.6066.60
Male Male
19-50 yr19-50 yr
37.8037.80 48.5048.50 60.3060.30 73.4073.40
Family of Family of fourfour
131.60131.60 170.00170.00 211.50211.50 257.00257.00
Power Point Author
Dr. Jane RossDr. Jane Ross
The University of Vermont
Foods and Nutrition
Basic Concepts of Food