economics of autonomous trucks - virginia tech
TRANSCRIPT
Dale Lewis
07 July 2018
OPERATING ECONOMICS
OF AUTONOMOUS
LONG-HAUL TRUCKS
© Dale B. Lewis
www.dblewis.net
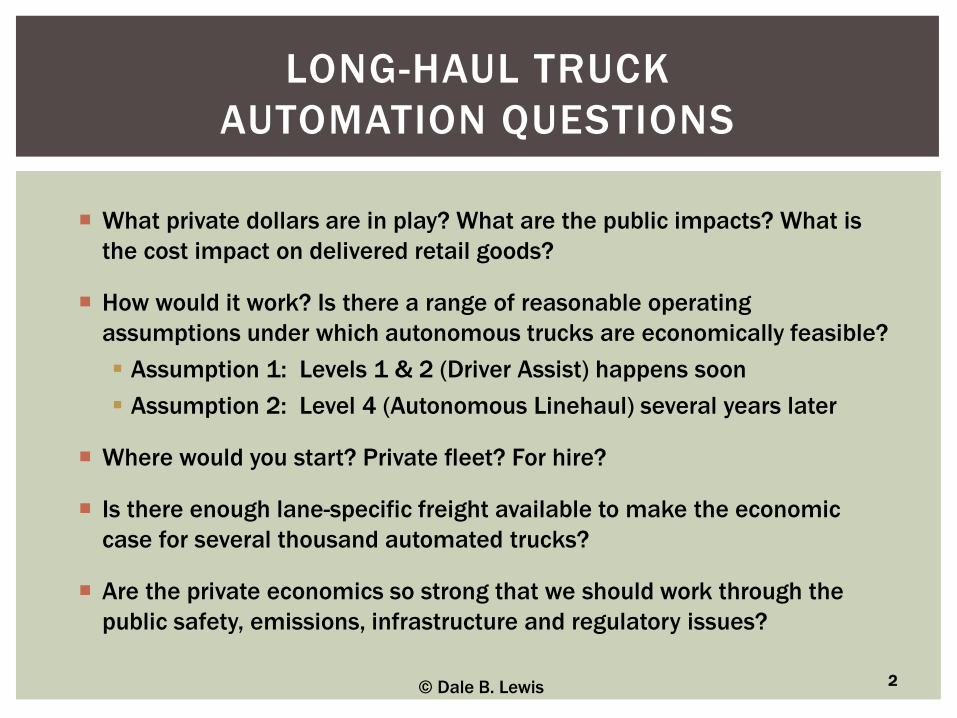
What private dollars are in play? What are the public impacts? What is
the cost impact on delivered retail goods?
How would it work? Is there a range of reasonable operating
assumptions under which autonomous trucks are economically feasible?
▪ Assumption 1: Levels 1 & 2 (Driver Assist) happens soon
▪ Assumption 2: Level 4 (Autonomous Linehaul) several years later
Where would you start? Private fleet? For hire?
Is there enough lane-specific freight available to make the economic
case for several thousand automated trucks?
Are the private economics so strong that we should work through the
public safety, emissions, infrastructure and regulatory issues?
LONG-HAUL TRUCK
AUTOMATION QUESTIONS
2© Dale B. Lewis
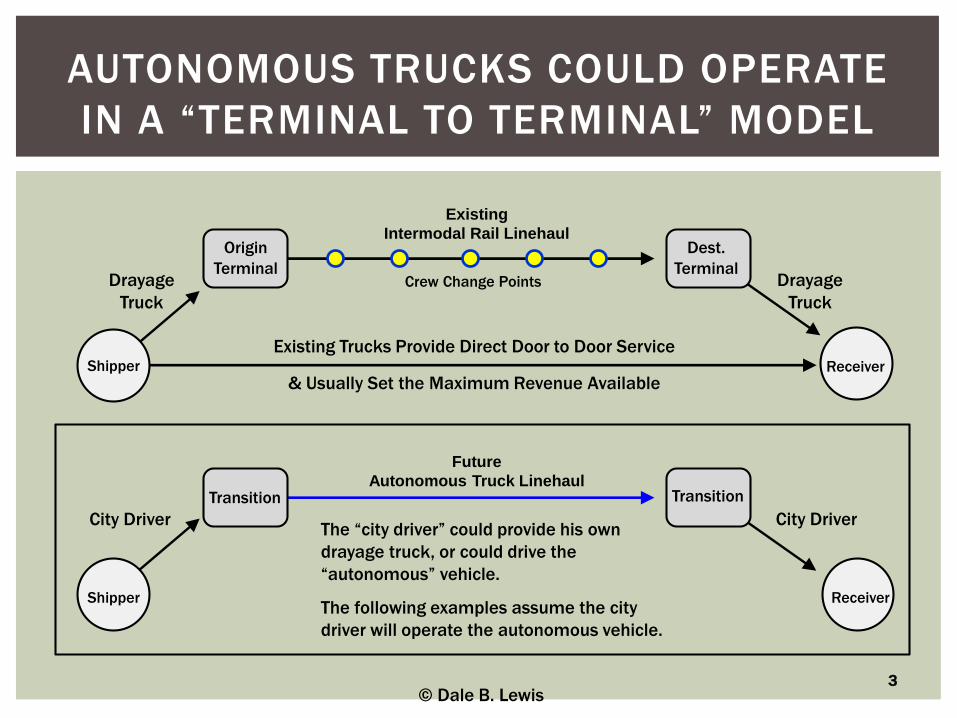
Existing Trucks Provide Direct Door to Door Service
& Usually Set the Maximum Revenue Available
AUTONOMOUS TRUCKS COULD OPERATE
IN A “TERMINAL TO TERMINAL” MODEL
Existing
Intermodal Rail LinehaulOrigin
Terminal
Dest.
TerminalDrayage
Truck
Drayage
Truck
Shipper Receiver
3
Future
Autonomous Truck LinehaulTransition Transition
City Driver City Driver
Shipper Receiver
The “city driver” could provide his own
drayage truck, or could drive the
“autonomous” vehicle.
The following examples assume the city
driver will operate the autonomous vehicle.
© Dale B. Lewis
Crew Change Points
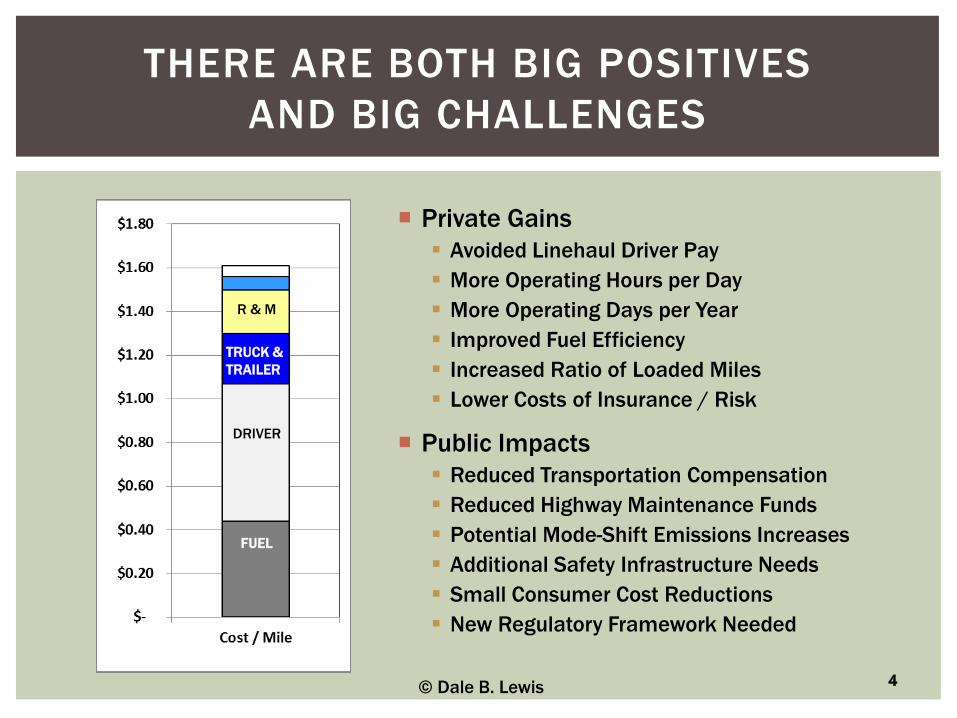
Private Gains
▪ Avoided Linehaul Driver Pay
▪ More Operating Hours per Day
▪ More Operating Days per Year
▪ Improved Fuel Efficiency
▪ Increased Ratio of Loaded Miles
▪ Lower Costs of Insurance / Risk
Public Impacts
▪ Reduced Transportation Compensation
▪ Reduced Highway Maintenance Funds
▪ Potential Mode-Shift Emissions Increases
▪ Additional Safety Infrastructure Needs
▪ Small Consumer Cost Reductions
▪ New Regulatory Framework Needed
THERE ARE BOTH BIG POSITIVES
AND BIG CHALLENGES
4© Dale B. Lewis
DRIVER
FUEL
TRUCK &
TRAILER
R & M

5
AVOIDING OPERATING PAYROLLS
WOULD HAVE A MAJOR IMPACT ON COSTS
Mid-Range Assumptions
Truck & Route:
$150,000 Truck (Level 0)
$3.00/Gal Diesel
7.2 MPG
70% Loaded Miles
119,000 Miles/Year
800,000 Mile Limit
6.8 Year Truck Life
$0.06 / Mile Insurance
Driver Pay:
$50,000 per year
270 Days in service
2,100 On Duty Hrs/Yr
14 Hour Days
11 Hours Driving
1 Hour Rest
10 Hours Sleep
Estimated $ per Load
Loaded Miles / Trip
This shows ONLY the
impact of eliminating
driver pay, but not the
new associated capital
and operating costs.
© Dale B. Lewis
Today
Without
Driver
These illustrations use a set of
generic starting assumptions.
Driver Pay Scale, Terminal
Dwell Time, Insurance Costs,
Freight Available and other
factors vary widely across
routes. Actual costs are route-
specific for each carrier.
6
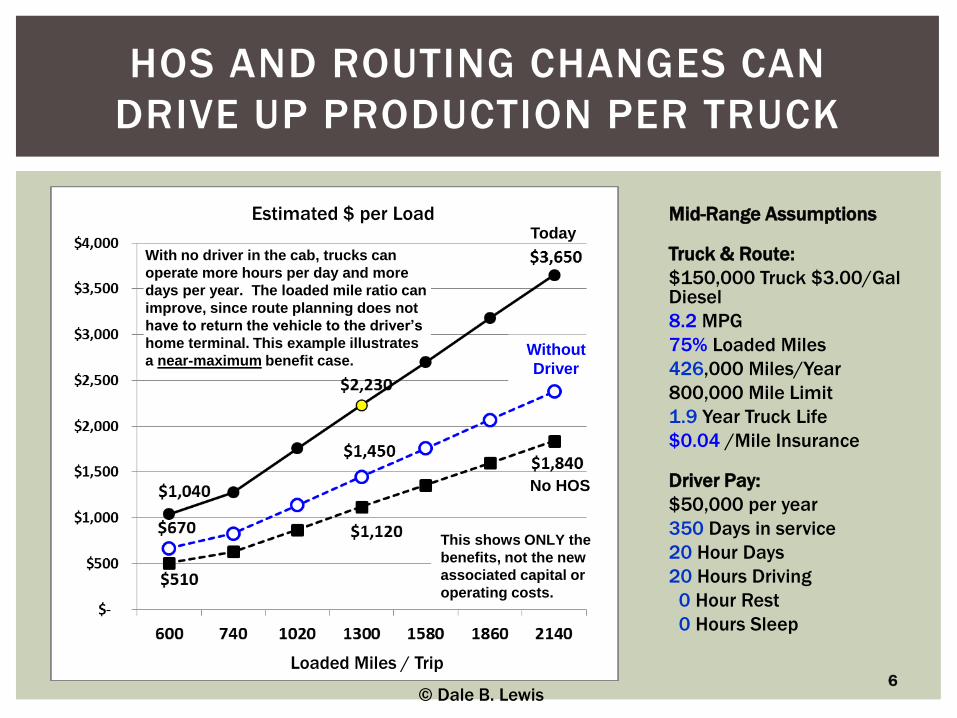
HOS AND ROUTING CHANGES CAN
DRIVE UP PRODUCTION PER TRUCK
Estimated $ per Load
Loaded Miles / Trip
Mid-Range Assumptions
Truck & Route:
$150,000 Truck $3.00/Gal Diesel
8.2 MPG
75% Loaded Miles
426,000 Miles/Year
800,000 Mile Limit
1.9 Year Truck Life
$0.04 /Mile Insurance
Driver Pay:
$50,000 per year
350 Days in service
20 Hour Days
20 Hours Driving
0 Hour Rest
0 Hours Sleep
This shows ONLY the
benefits, not the new
associated capital or
operating costs.
© Dale B. Lewis
Today
Without
Driver
No HOS
With no driver in the cab, trucks can
operate more hours per day and more
days per year. The loaded mile ratio can
improve, since route planning does not
have to return the vehicle to the driver’s
home terminal. This example illustrates
a near-maximum benefit case.

INITIALLY, THE TECHNOLOGY
WOULD SUPPORT TODAY’S DRIVERS
Mid-Range Assumptions
Truck & Route:
$190,000 Truck (L4)
$3.00/Gal Diesel
7.2 MPG
70% Loaded Miles
119,000 Miles/Year
800,000 Mile Limit
6.8 Year Truck Life
$0.06 / Mile Insurance
Driver Pay:
$50,000 per year
270 Days in service
2,100 On Duty Hrs/Yr
14 Hour Days
11 Hours Driving
1 Hour Rest
10 Hours Sleep
Estimated $ per Load
7Loaded Miles / Trip
© Dale B. Lewis
Technology dollars are invested first.
Benefits come later, as operations improve.
In particular, future insurance cost changes
will depend on driver and fleet-specific
performance.
This illustration assumes that the
L4 level of technology has a
$40,000 capital cost. Cost per load
would be higher than today until
the operating benefits are realized.
Today
8
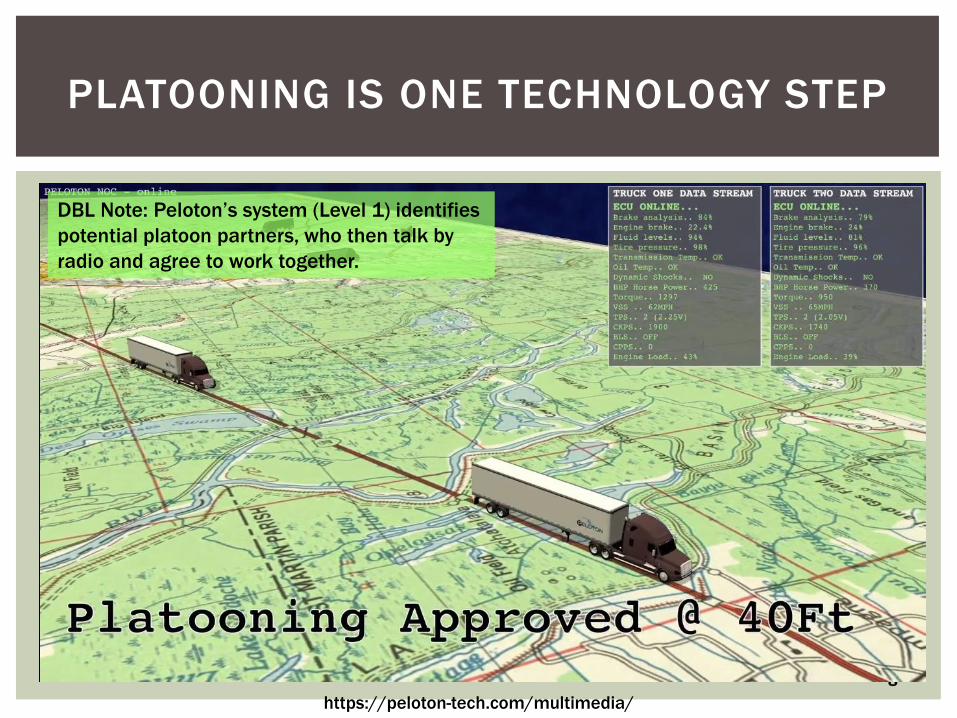
PLATOONING IS ONE TECHNOLOGY STEP
DBL Note: Peloton’s system (Level 1) identifies
potential platoon partners, who then talk by
radio and agree to work together.
https://peloton-tech.com/multimedia/
9
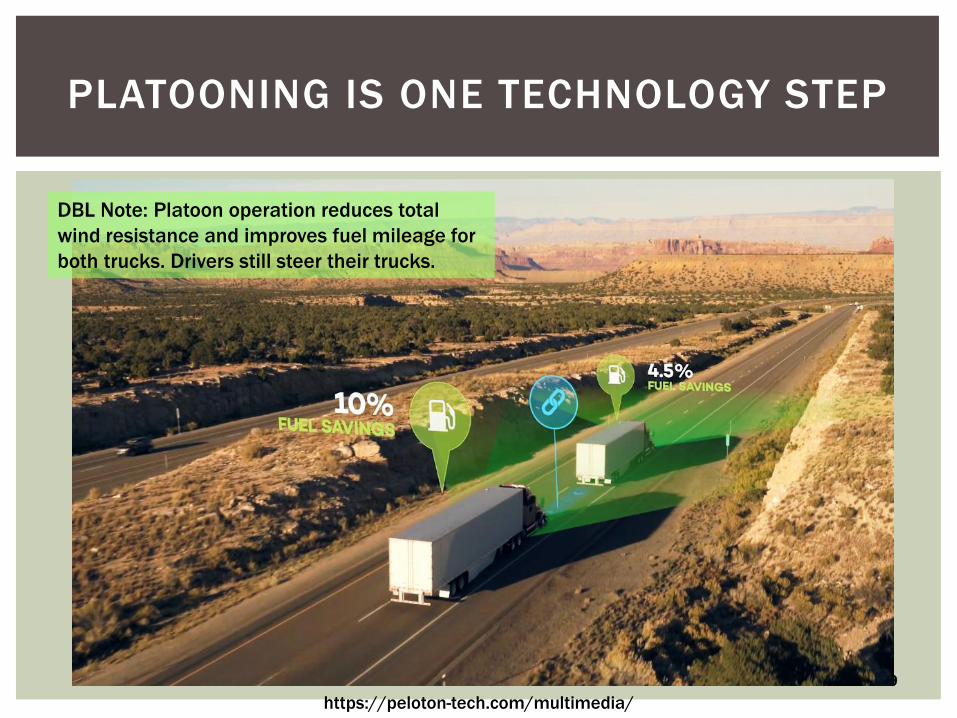
PLATOONING IS ONE TECHNOLOGY STEP
DBL Note: Platoon operation reduces total
wind resistance and improves fuel mileage for
both trucks. Drivers still steer their trucks.
https://peloton-tech.com/multimedia/

10
PLATOONING IS ONE TECHNOLOGY STEP
DBL Note: The following truck’s braking system
is wirelessly coupled to the lead truck, so both
trucks apply brakes at the same time.
https://peloton-tech.com/multimedia/
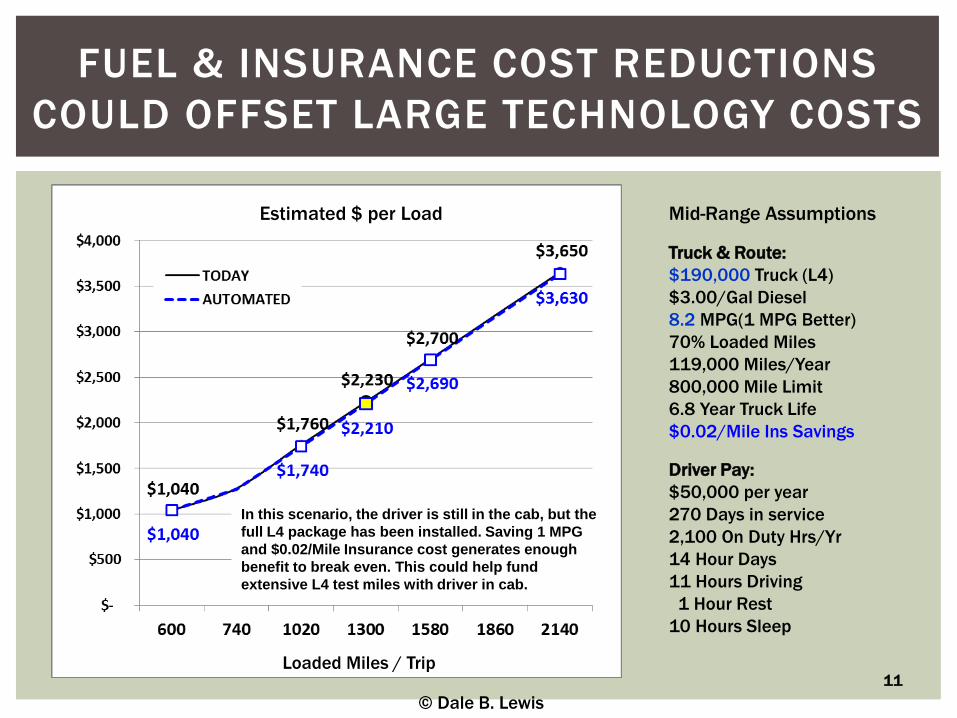
FUEL & INSURANCE COST REDUCTIONS
COULD OFFSET LARGE TECHNOLOGY COSTS
Mid-Range Assumptions
Truck & Route:
$190,000 Truck (L4)
$3.00/Gal Diesel
8.2 MPG(1 MPG Better)
70% Loaded Miles
119,000 Miles/Year
800,000 Mile Limit
6.8 Year Truck Life
$0.02/Mile Ins Savings
Driver Pay:
$50,000 per year
270 Days in service
2,100 On Duty Hrs/Yr
14 Hour Days
11 Hours Driving
1 Hour Rest
10 Hours Sleep
Estimated $ per Load
11Loaded Miles / Trip
© Dale B. Lewis
In this scenario, the driver is still in the cab, but the
full L4 package has been installed. Saving 1 MPG
and $0.02/Mile Insurance cost generates enough
benefit to break even. This could help fund
extensive L4 test miles with driver in cab.

AUTONOMOUS OPERATIONS COULD
BE SUPPORTED BY CITY DRIVERS
Estimated $ per Load
12Loaded Miles / Trip
© Dale B. Lewis
This view includes:
All benefits from HOS
changes, fuel use, improved
empty ratio and lower
insurance costs.
This view adds:
$200 “City Drivers” for
each load
$50,000 per year Linehaul
Monitors, who provide
remote oversight of the
move on the line of road
(each monitor observes 3
loads)
In this scenario, there is no line-haul driver in the cab.
Transition terminals would be located near towns,
where city drivers would take over driving duties. At 2
trips per day, this would be a very good job.
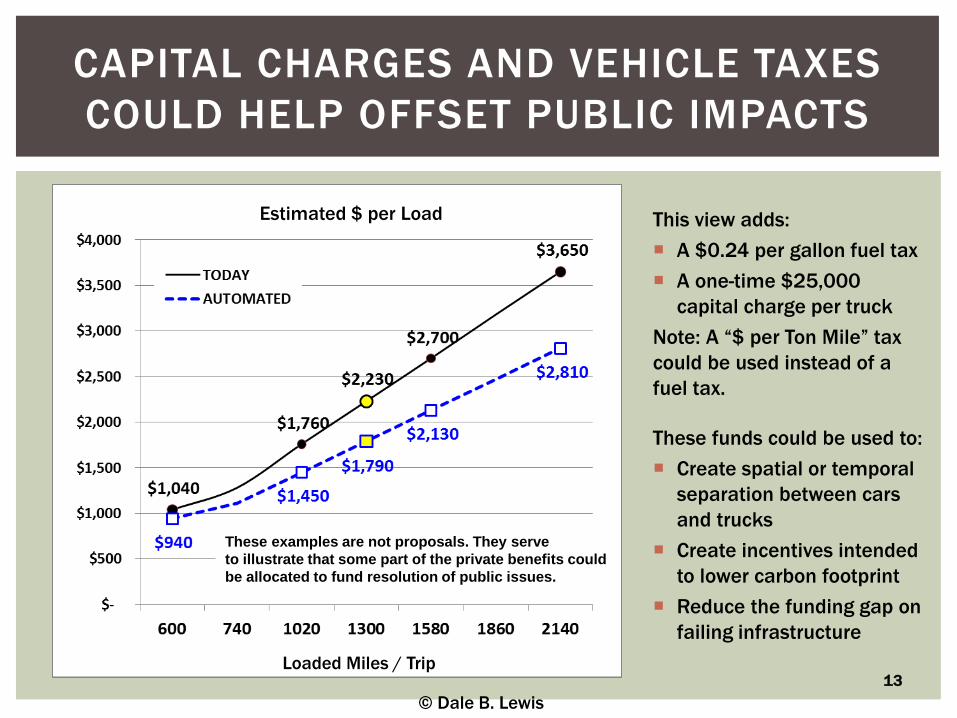
CAPITAL CHARGES AND VEHICLE TAXES
COULD HELP OFFSET PUBLIC IMPACTS
Estimated $ per Load
13Loaded Miles / Trip
© Dale B. Lewis
This view adds:
A $0.24 per gallon fuel tax
A one-time $25,000
capital charge per truck
Note: A “$ per Ton Mile” tax
could be used instead of a
fuel tax.
These funds could be used to:
Create spatial or temporal
separation between cars
and trucks
Create incentives intended
to lower carbon footprint
Reduce the funding gap on
failing infrastructure
These examples are not proposals. They serve
to illustrate that some part of the private benefits could
be allocated to fund resolution of public issues.

14
Transportation Payroll Impact:
Total operating dollars decline.

TOTAL “OPERATING PAY” PER LOAD
WOULD GO DOWN WITH L4 AUTOMATION
$25 per Hour
Linehaul Remote MonitorTerminal Terminal
$200/Load
City Driver
$200/Load
City Driver
Shipper ReceiverCity Driver $ + Linehaul Monitor $ per Trip
(3 Linehaul Trucks per Monitor)
Loaded Miles per Trip (70% LD Ratio)
15
© Dale B. Lewis
“Operating Pay” per
load using city
drivers at $200 per
load, along with a
linehaul monitor
being paid $25 per
hour, watching 3
trucks.
16
POTENTIAL LOADS:
INTERMODAL CONVERSION?
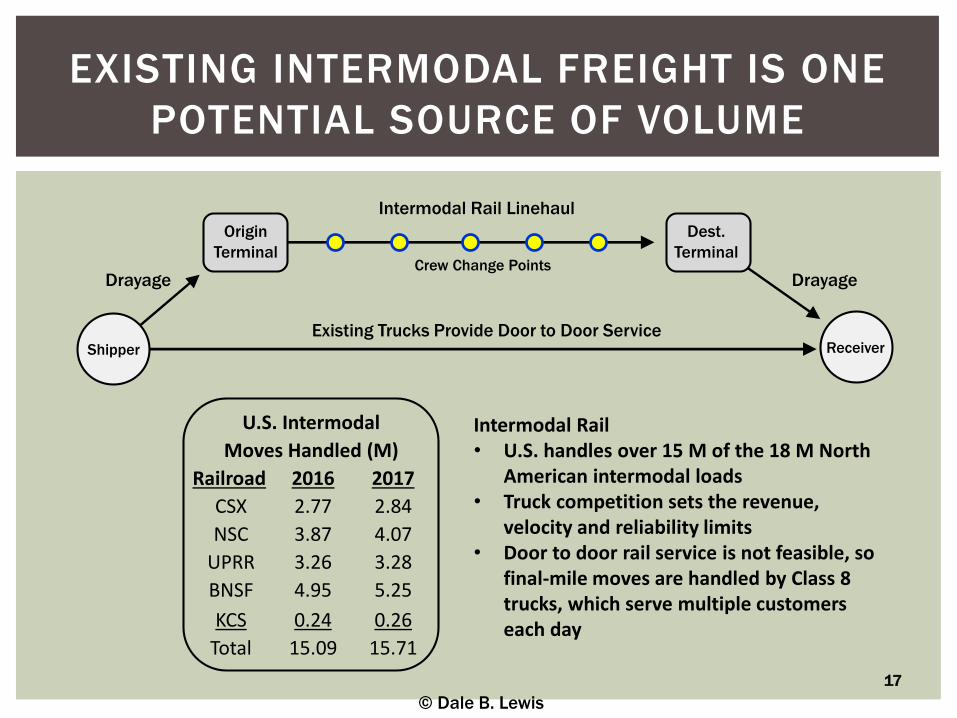
EXISTING INTERMODAL FREIGHT IS ONE
POTENTIAL SOURCE OF VOLUME
Intermodal Rail Linehaul
Origin
Terminal
Dest.
Terminal
Drayage Drayage
Existing Trucks Provide Door to Door ServiceShipper Receiver
Intermodal Rail• U.S. handles over 15 M of the 18 M North
American intermodal loads• Truck competition sets the revenue,
velocity and reliability limits• Door to door rail service is not feasible, so
final-mile moves are handled by Class 8 trucks, which serve multiple customers each day
U.S. Intermodal
Moves Handled (M)
Railroad 2016 2017
CSX 2.77 2.84
NSC 3.87 4.07
UPRR 3.26 3.28
BNSF 4.95 5.25
KCS 0.24 0.26
Total 15.09 15.71
17
© Dale B. Lewis
Crew Change Points

18
LALB
DEN
OAK
CHI
ATL
STL
MEM
COL
DFW
PHX
Juarez
Eagle Ford Shale
ALB
HOU
KC
POPULATION IS SPARSE IN THE WESTERN U.S.
NASA Earth at Night Image
OKC
TULSA
LV
SLC OMAHA
AUS
AMA
NORL

MEMPHISLA/LB
DALLAS
RAILROADS OFFER LONG-HAUL
INTERMODAL SERVICE IN THESE AREAS
LOS ANGELES to MEMPHIS
RAIL 2,100 Miles, 90 to 106 Hours
TRUCK 1,850 Miles, 55 to 65 Hours
LOS ANGELES to CHICAGO
RAIL 2,210 Miles, 100 to 105 Hours
TRUCK 2,030 Miles, 60 to 70 Hours
CHICAGO
19© Dale B. Lewis
BNSF Route Map
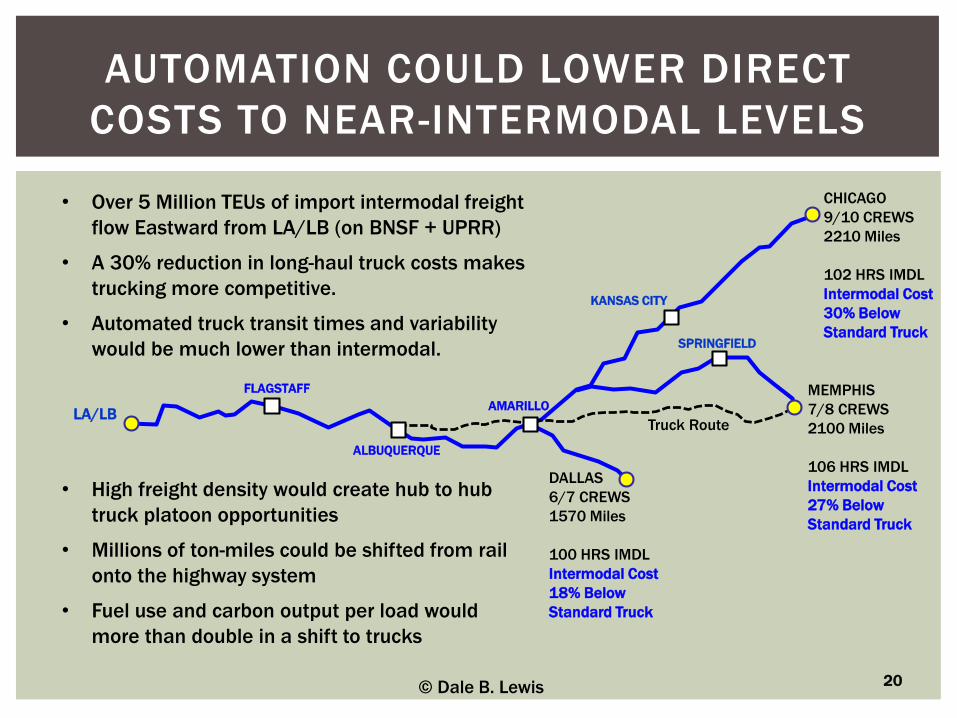
CHICAGO
9/10 CREWS
2210 Miles
102 HRS IMDL
Intermodal Cost
30% Below
Standard Truck
AUTOMATION COULD LOWER DIRECT
COSTS TO NEAR-INTERMODAL LEVELS
DALLAS
6/7 CREWS
1570 Miles
100 HRS IMDL
Intermodal Cost
18% Below
Standard Truck
MEMPHIS
7/8 CREWS
2100 Miles
106 HRS IMDL
Intermodal Cost
27% Below
Standard Truck
AMARILLO
SPRINGFIELD
LA/LB
KANSAS CITY
Truck Route
20© Dale B. Lewis
• Over 5 Million TEUs of import intermodal freight
flow Eastward from LA/LB (on BNSF + UPRR)
• A 30% reduction in long-haul truck costs makes
trucking more competitive.
• Automated truck transit times and variability
would be much lower than intermodal.
• High freight density would create hub to hub
truck platoon opportunities
• Millions of ton-miles could be shifted from rail
onto the highway system
• Fuel use and carbon output per load would
more than double in a shift to trucks
FLAGSTAFF
ALBUQUERQUE
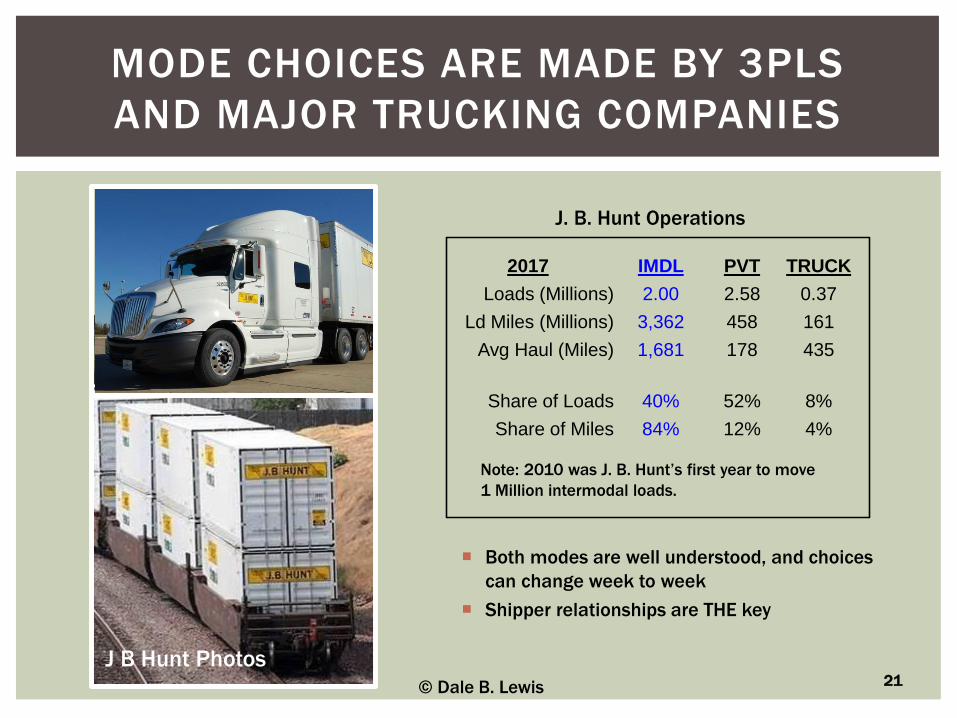
Both modes are well understood, and choices
can change week to week
Shipper relationships are THE key
MODE CHOICES ARE MADE BY 3PLS
AND MAJOR TRUCKING COMPANIES
2017 IMDL PVT TRUCK
Loads (Millions) 2.00 2.58 0.37
Ld Miles (Millions) 3,362 458 161
Avg Haul (Miles) 1,681 178 435
Share of Loads 40% 52% 8%
Share of Miles 84% 12% 4%
J. B. Hunt Operations
Note: 2010 was J. B. Hunt’s first year to move
1 Million intermodal loads.
21© Dale B. Lewis
J B Hunt Photos

22
CONSUMER IMPACT:
ENOUGH TO SPUR RETAIL SALES?
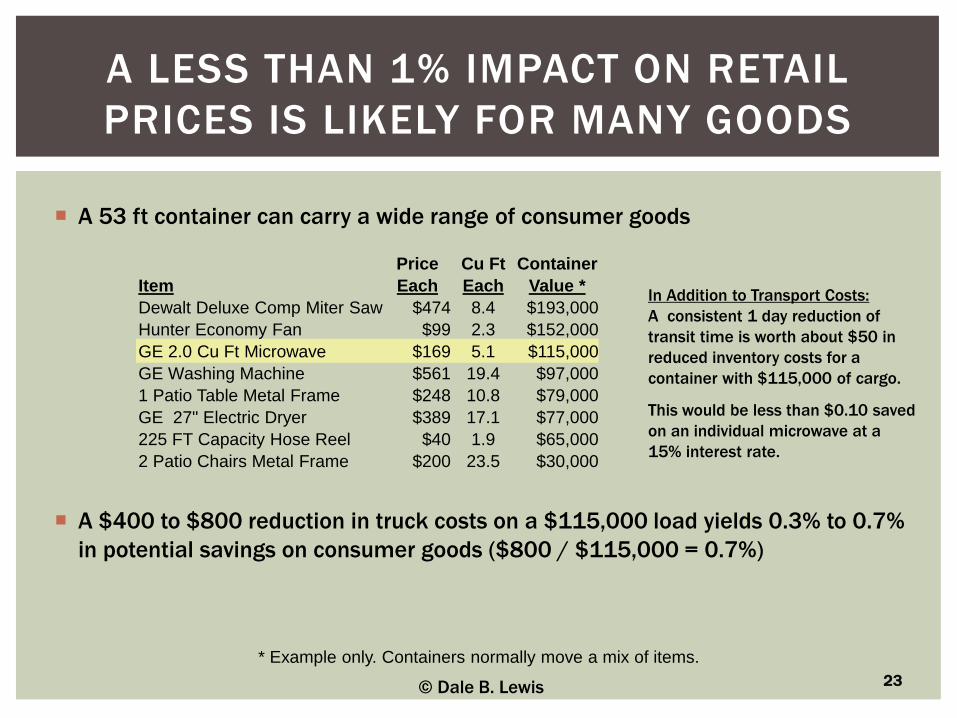
A 53 ft container can carry a wide range of consumer goods
A $400 to $800 reduction in truck costs on a $115,000 load yields 0.3% to 0.7%
in potential savings on consumer goods ($800 / $115,000 = 0.7%)
23
A LESS THAN 1% IMPACT ON RETAIL
PRICES IS LIKELY FOR MANY GOODS
© Dale B. Lewis
In Addition to Transport Costs:
A consistent 1 day reduction of
transit time is worth about $50 in
reduced inventory costs for a
container with $115,000 of cargo.
This would be less than $0.10 saved
on an individual microwave at a
15% interest rate.
Price Cu Ft Container
Item Each Each Value *
Dewalt Deluxe Comp Miter Saw $474 8.4 $193,000
Hunter Economy Fan $99 2.3 $152,000
GE 2.0 Cu Ft Microwave $169 5.1 $115,000
GE Washing Machine $561 19.4 $97,000
1 Patio Table Metal Frame $248 10.8 $79,000
GE 27" Electric Dryer $389 17.1 $77,000
225 FT Capacity Hose Reel $40 1.9 $65,000
2 Patio Chairs Metal Frame $200 23.5 $30,000
* Example only. Containers normally move a mix of items.
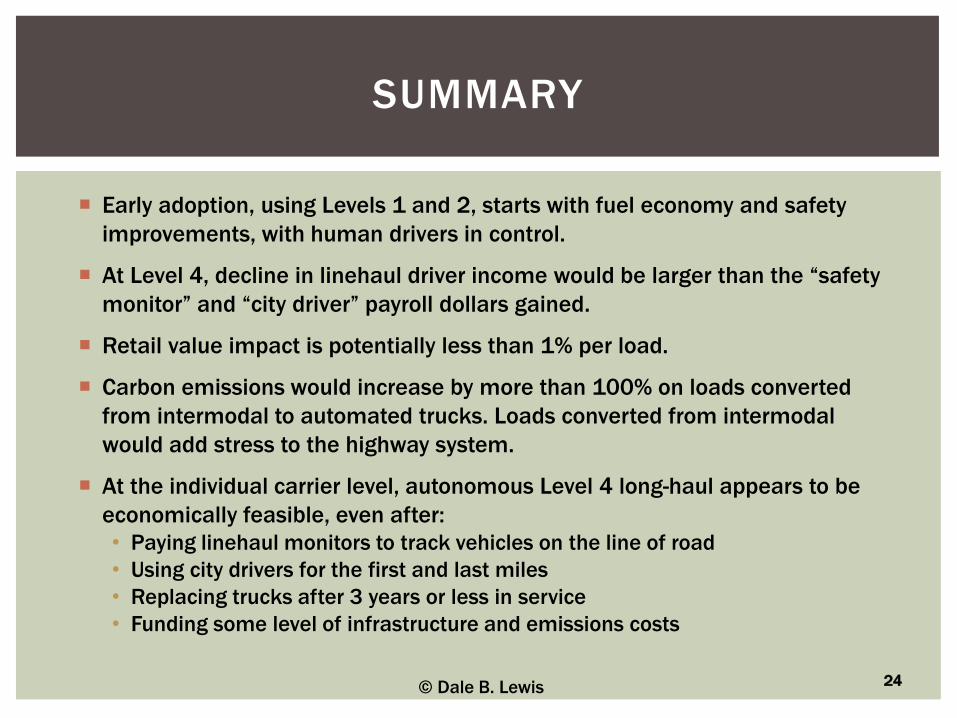
Early adoption, using Levels 1 and 2, starts with fuel economy and safety
improvements, with human drivers in control.
At Level 4, decline in linehaul driver income would be larger than the “safety
monitor” and “city driver” payroll dollars gained.
Retail value impact is potentially less than 1% per load.
Carbon emissions would increase by more than 100% on loads converted
from intermodal to automated trucks. Loads converted from intermodal
would add stress to the highway system.
At the individual carrier level, autonomous Level 4 long-haul appears to be
economically feasible, even after:
• Paying linehaul monitors to track vehicles on the line of road
• Using city drivers for the first and last miles
• Replacing trucks after 3 years or less in service
• Funding some level of infrastructure and emissions costs
SUMMARY
24© Dale B. Lewis

25
APPENDIX

Level 0 - The human driver does all the driving.
Level 1 - An advanced driver assistance system (ADAS) on the vehicle can sometimes
assist the human driver with either steering or braking/accelerating, but not both
simultaneously.
Level 2 - An advanced driver assistance system (ADAS) on the vehicle can itself actually
control both steering and braking/accelerating simultaneously under some circumstances.
The human driver must continue to pay full attention (“monitor the driving environment”) at
all times and perform the rest of the driving task.
Level 3 - An Automated Driving System (ADS) on the vehicle can itself perform all aspects
of the driving task under some circumstances. In those circumstances, the human driver
must be ready to take back control at any time when the ADS requests the human driver to
do so. In all other circumstances, the human driver performs the driving task.
Level 4 - An Automated Driving System (ADS) on the vehicle can itself perform all driving
tasks and monitor the driving environment – essentially, do all the driving – in certain
circumstances. The human need not pay attention in those circumstances.
Level 5 - An Automated Driving System (ADS) on the vehicle can do all the driving in all
circumstances. The human occupants are just passengers and need never be involved in
driving.
HTTPS://WWW.NHTSA.GOV/TECHNOLOGY-INNOVATION/AUTOMATED-VEHICLES-SAFETY#ISSUE-ROAD-SELF-DRIVING
NHTSA AUTOMATION LEVEL DESCRIPTIONS
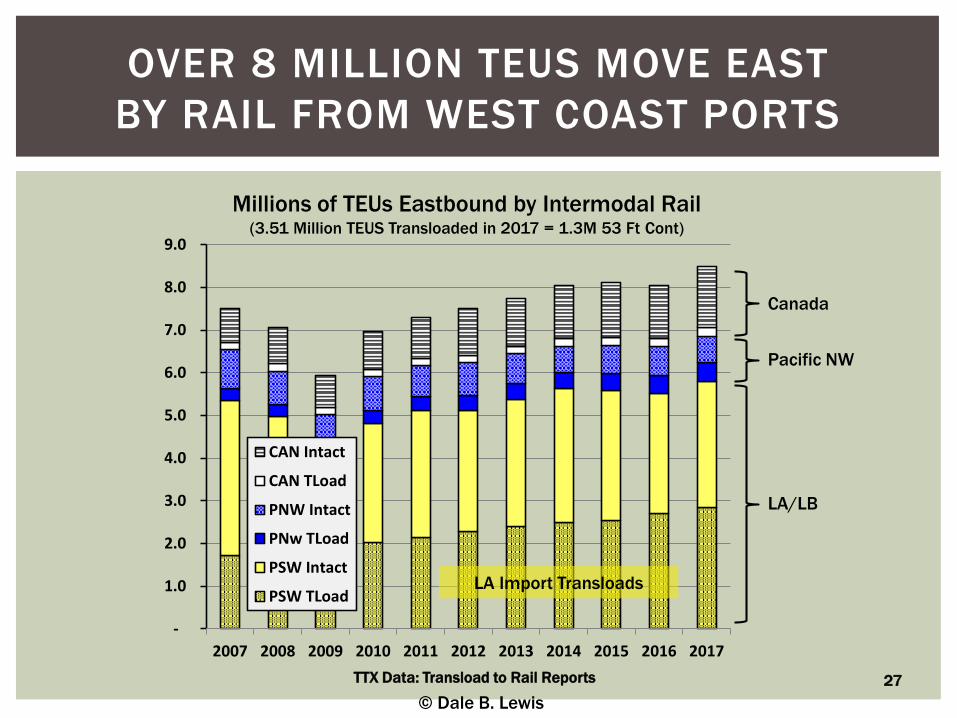
OVER 8 MILLION TEUS MOVE EAST
BY RAIL FROM WEST COAST PORTS
-
1.0
2.0
3.0
4.0
5.0
6.0
7.0
8.0
9.0
2007 2008 2009 2010 2011 2012 2013 2014 2015 2016 2017
CAN Intact
CAN TLoad
PNW Intact
PNw TLoad
PSW Intact
PSW TLoad
Millions of TEUs Eastbound by Intermodal Rail(3.51 Million TEUS Transloaded in 2017 = 1.3M 53 Ft Cont)
TTX Data: Transload to Rail Reports
Canada
Pacific NW
LA/LB
LA Import Transloads
27
© Dale B. Lewis