economics of riparian restoration on western washington farms june 29, 2004 american water resource...
TRANSCRIPT

Economics of Riparian Restoration on Western
Washington Farms
June 29, 2004
American Water Resource Association
Olympic Valley, CA
Carolyn J. Henri, PhD
Resource Consulting

Resource Consulting
Project Background• Origin
– Stillaguamish Implementation Review Committee (SIRC)
– Address concerns of farming community and provide sound data on economic impacts
• Funding– USFWS, WSDA, Snohomish
CD, Stillaguamish Tribe, City of Arlington, Snohomish County
• Technical Support– Snohomish CD, WA State
University Extension, SIRC Advisory Panel

Resource Consulting
Project LocationStillaguamish Stillaguamish WatershedWatershed
•448,000 acres• 2,214 miles streams & rivers
• ~44,000 population (2003 est.)
Land UseLand Use76% Forestry
17% Rural
5% Agriculture
2% Urban

Resource Consulting
Stillaguamish Agriculture
• 527 Farms (1997 Census)
• Approximately 38,000 acres in production
• 80% of farms are less than 50 acres in size
• Total value of agricultural production in 2002 was $57 million (est.)
• Key Agricultural sectors: Dairy, livestock, hay/corn, plant nurseries
• Net income losses in three out of last five years

Resource Consulting
Stream Miles on Agricultural Lands in the Stillaguamish• 160 Stream miles
cross or are adjacent to agricultural lands
• 67% are fish bearing streams
• Vast majority of ag land in 100 year flood plain
Resource Consulting
Objectives Output
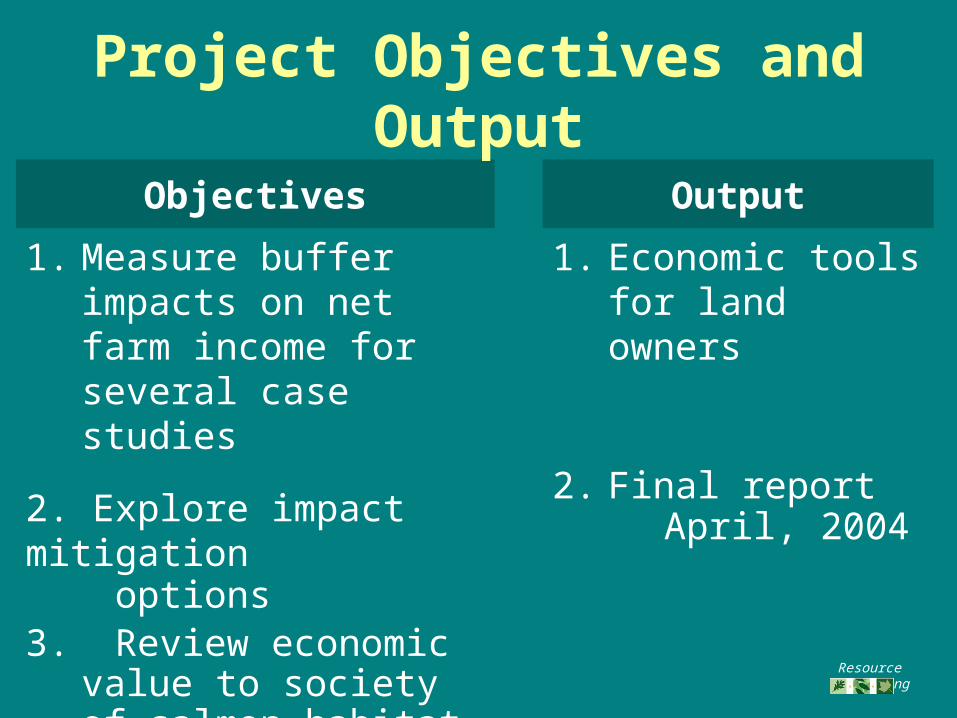
1. Measure buffer impacts on net farm income for several case studies
1. Economic tools for land owners
2. Explore impact mitigation options
2. Final report April, 2004
3. Review economic value to society of salmon habitat restoration
Project Objectives and Output

Resource Consulting
Methods: Economic Tools
• Economic tools: 3 models written in MS Excel– Dairy– Crop– Livestock
• Annual farm enterprise budgets– Revenues, variable & fixed costs– Capture annual impact on net
revenues

Resource Consulting
How The Models Work I• Producer inputs:
– Farm data: Crop yield or herd production, management, labor, capital & land investments, prices
– Buffer information: Stream types and lengths, type of buffer, cost sharing information

Resource Consulting
How The Models Work II
• Models produce enterprise budgets – Pre-buffer– Post-buffer
• Results are buffer impacts on net enterprise return
• All assumptions can be adjusted to run different buffer scenarios, and assess impacts and mitigation measures

Resource Consulting
Analysis
• Six commercial farm case Six commercial farm case studiesstudies– 3 Dairies, 2 silage crop farms, 1 beef 3 Dairies, 2 silage crop farms, 1 beef
enterpriseenterprise
• 12 buffer scenarios (for fish-12 buffer scenarios (for fish-bearing streams)bearing streams)– 35’, 75’, 180’ widths35’, 75’, 180’ widths– forested and forest/grass forested and forest/grass
combinationcombination– with and without financial assistancewith and without financial assistance

Resource Consulting
Results: Average Buffer Costs and Acreage Placed in Buffers
Total average cost per acre of riparian buffer ($):
Enterprise typeEnterprise type Total cost (PV)Total cost (PV) Annualized cost (15 Annualized cost (15 years)years)
Silage 4,432 403
Dairies 6,460 570
Beef 13,518 1,212
Average number of acres placed in riparian buffers:
Enterprise TypeEnterprise Type 35’ buffer35’ buffer 75’ buffer75’ buffer 180’ buffer180’ buffer
Silage (two case studies) 2.7 5.3 19.8
Dairies (three case studies) 2.2 3.9 14.1
Beef (1 case study) 3.0 9.0 24.6

Resource Consulting
Results: Buffer Widths• All three buffer widths created negative
economic impacts to the dairy, silage and beef case studies. Negative impact increased with width.
Average percent change in Net Enterprise Return after installation of riparian buffers*
Buffer Width
35' 75' 180'
Dairies -1.0 -1.5 -6.7
Silage Farms -6.3 -21.9 -157.0
Beef Operation -19.1 -46.5 -118.4
* Numbers represent average results for both forested and forest/grass buffers; no cost sharing or rental payments are considered.
Resource Consulting
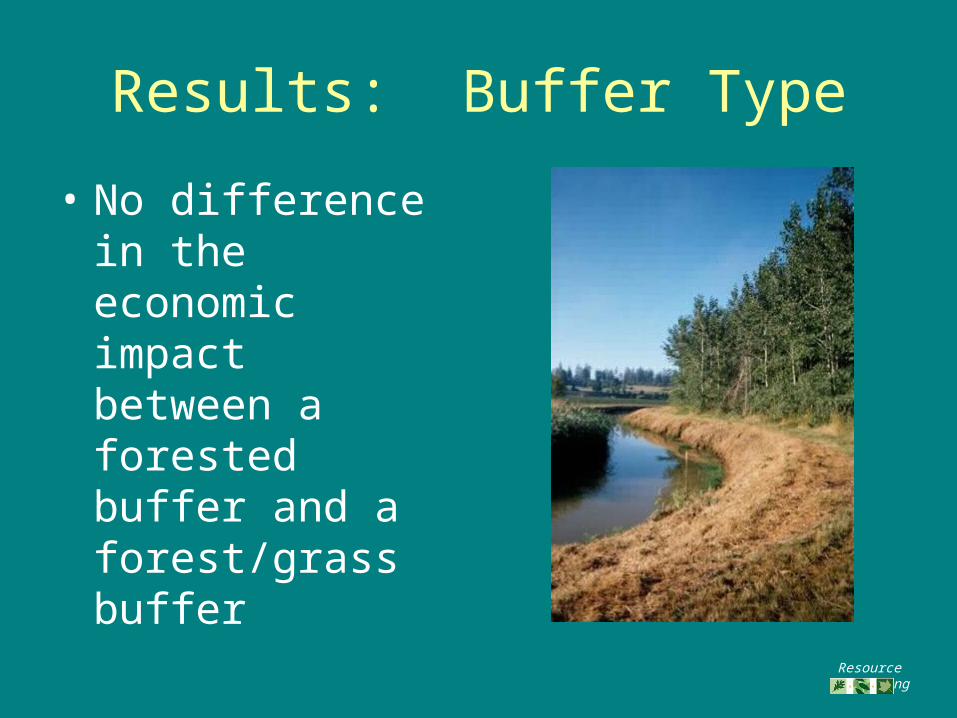
Results: Buffer Type
• No difference in the economic impact between a forested buffer and a forest/grass buffer

Resource Consulting
Results: Financial Assistance
• 100% cost-sharing and maximum rental payments were effective at completely offsetting economic impacts 36% of the time.
• Most successful at offsetting impacts to dairies
• Less successful at offsetting impacts from forest/grass than from forest-only buffers

Resource Consulting
Sector Specific Impacts
• Small dairy– Disproportionate impact– 42% of total buffer costs = feed
replacement– 17% of total buffer cost = DNMP
compliance costs
• Silage farms– 14% of total average buffer costs =
Foregone income from the buffer area
• Beef Enterprise– 63% of buffer costs = feed
replacement
Resource Consulting
Long Term Buffer Maintenance
• Important buffer cost factor for all case studies; 16-50% of total buffer costs
• Includes weed control, grass mowing and fence maintenance & repair
• Depending on the farm and buffer type, maintenance costs can extend beyond five years.

Resource Consulting
Buffer Solutions
• Target financial assistance to type of impact
• Allow income generation in the buffer area
• Market based solutions such as water quality and habitat credits

Resource Consulting
Applicability in other watersheds
• Economic models and types of impact are relevant in western Washington counties
• Actual buffer effect on net income is farm specific
Resource Consulting
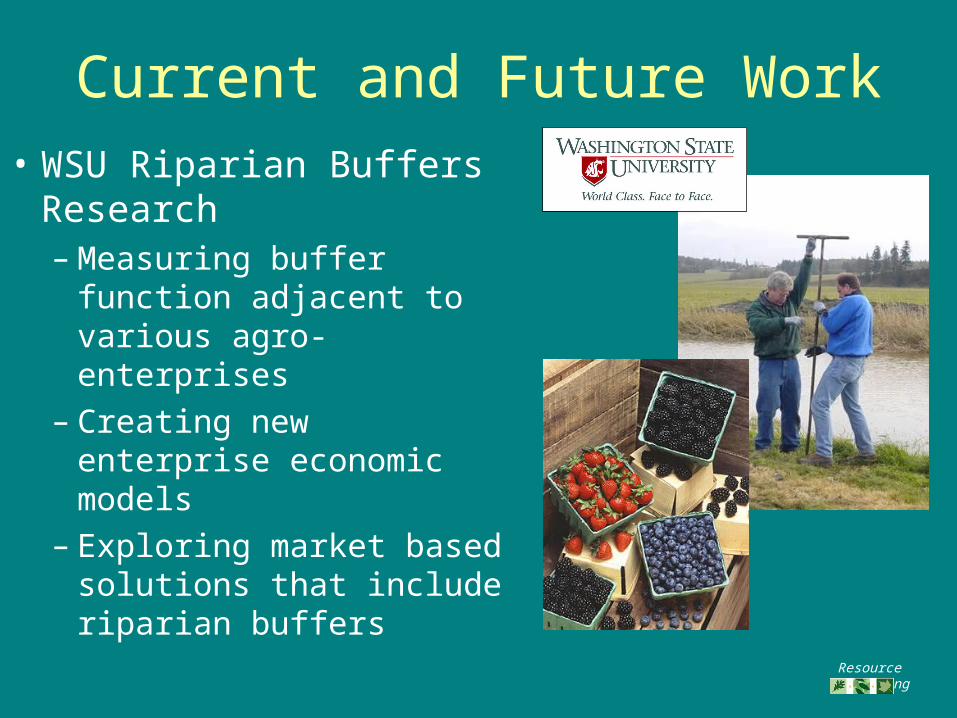
Current and Future Work
• WSU Riparian Buffers Research– Measuring buffer function
adjacent to various agro- enterprises
– Creating new enterprise economic models
– Exploring market based solutions that include riparian buffers

Resource Consulting
For more information contact:For more information contact:Resource ConsultingResource [email protected]@ResourceConsulting.us(360) 403-7241(360) 403-7241
Questions