economics research
DESCRIPTION
economics researchTRANSCRIPT
South Africa as a gateway
For more than a decade, South Africa has been a top FDI destination. Although sometimes pippedat the post by oil-producing states on the statisticsfront, investment in South Africa is broad-based andmulti-sectoral, reflecting its diversified economy.Since 1994 South Africa has also been one of thebiggest non-oil investors in Africa. The country’sFDI into the rest of Africa has increased at fourtimes the rate of its global FDI, from ZAR 3.8 billionin 1994 to ZAR 115.7 billion in 2009.2 However,just 8% of South Africa’s total foreign investment isin the rest of Africa.South African multinational companies haveexpanded their African networks rapidly, buildingbusinesses and skills that foreign investors areeyeing to build their own African footprint, resultingin a significant number of mergers and acquisitions.South Africa has the biggest and best capitalisedbanks, attracting investors who want to accessloans, trade finance and other products for Africanbusiness. The Johannesburg Stock Exchange (JSE)is by far the biggest bourse on the continent.The country has also positioned itself as a privateequity hub. In 2011, more than ZAR 100 billionfunds were under management, with an increasingchunk being directed to assets elsewhere in Africa.The Reserve Bank has relaxed exchange controlsboth for general investment into the continent andprivate equity. It has also relaxed local listing rulesto position the JSE as a gateway for investment inAfrican stocks.South Africa has the best infrastructure on thecontinent and in 2010 completed a four-year, $60billion infrastructure programme. However, thedemand for new infrastructure and expansion ofexisting assets is still largely unmet and delivery isslow.For decades South Africa has been the preferredtransport and logistics hub for Southern Africa,thanks to its superior infrastructure and servicesindustry. Despite its distance from regional markets,Durban has remained the port of choice for goodsfrom as far afield as the Democratic Republic of SO U TH A FRIC A A S A FRIC A’ S GAT EWAY : A P E RS P E CTIV E FRO M B U SIN E SS
3
Congo more than 2 000 kilometres away. OR TamboAirport in Johannesburg has maintained its positionas the best airport in Africa, and despite facing stiffcompetition, South African Airways remains thecontinent’s leading airline. South Africa’s locationbetween Asia and Latin America makes it wellpositioned for airlines, shipping and logistics.The Development Bank of Southern Africa(DBSA) and Industrial Development Corporation(IDC) are principal agencies of South Africa’seconomic diplomacy in Africa. Both are pivotalto South Africa’s regional ambitions, as financingcross-border infrastructure and projects highlightsthe country’s developmental role and opens upopportunities for South African-based companies. Asa result of South Africa joining BRICS, the DBSA andthe IDC have direct links with their counterparts inthose markets, enabling them to leverage mutualfunding and explore other partnerships. DBSA ispart of the BRICS Banking Mechanism3 and sits ona BRICS liaison group that is examining ways todevelop South–South trade.4 The IDC is lookingat new operating models with Brazil’s developmentbank, BNDES, and maintains close links withcounterpart banks in Europe, China and Japan.Policymakers are looking for sectors in whichSouth African can become the hub in Africa,including renewable energy, the petro-chemicalindustry, and ship building and repairs. Anotherarea is the trans-shipment of goods to other Africancountries from South Africa’s deepwater ports;South Africa is already an important centre forgoods and services in the rest of Africa, notablyequipment, car parts and food products.
CH A LL E N G E S TO SO U TH A FRIC A’ SGAT EWAY ST AT U SSouth Africa faces many challenges at home that arestarting to affect its reputation as the best place forforeign companies to establish themselves in Africa.External factors are also changing the way investorsmake their choices about such issues.E X T E RN A L F A CTORSGeography and logistics play an increasing role inmultinationals’ business decisions, leading to thecreation of multiple gateways into African regions.Increasingly, South Africa is seen as the gateway toSouthern Africa rather than sub-Saharan Africa.And even within SADC, Brazilian companies preferLuanda as an entry point into Africa.Although China’s political rhetoric highlightsSouth Africa as its gateway to Africa, its companies(and politicians) tend to deal with Africanstates directly from Beijing. The China–AfricaDevelopment Fund may have been established inJohannesburg, but now also has offices in Ethiopia,Zambia and Ghana.5Airline options are also increasing in Africa withthe network growth of African carriers such as KenyaAirways and Ethiopian Airlines as well as Emiratesfrom Dubai. This means that visitors no longer haveto fly via South Africa to other African destinations.The high cost of transporting goods across Africahas also led to companies shipping goods directly tomarket from overseas countries, not via South Africa.INT E RN A L F A CTORSSouth Africa is battling to balance the needsof investors with the political demands of itselectorate. Investors are concerned about the stronglabour unions, rising wages, low levels of technicaland management skills, declining state efficiencycoupled with greater government intervention inthe economy, the lack of policy transparency and arise in political populism.Frequent strikes are also a concern. In the firsthalf of 2011, more than 30 million man days werelost due to strikes – a 22% increase over 20106 andconsiderably more than the 4.75 million man dayslost to strikes in Nigeria between 2004 and 2009.7Labour productivity growth was negative during2011.8
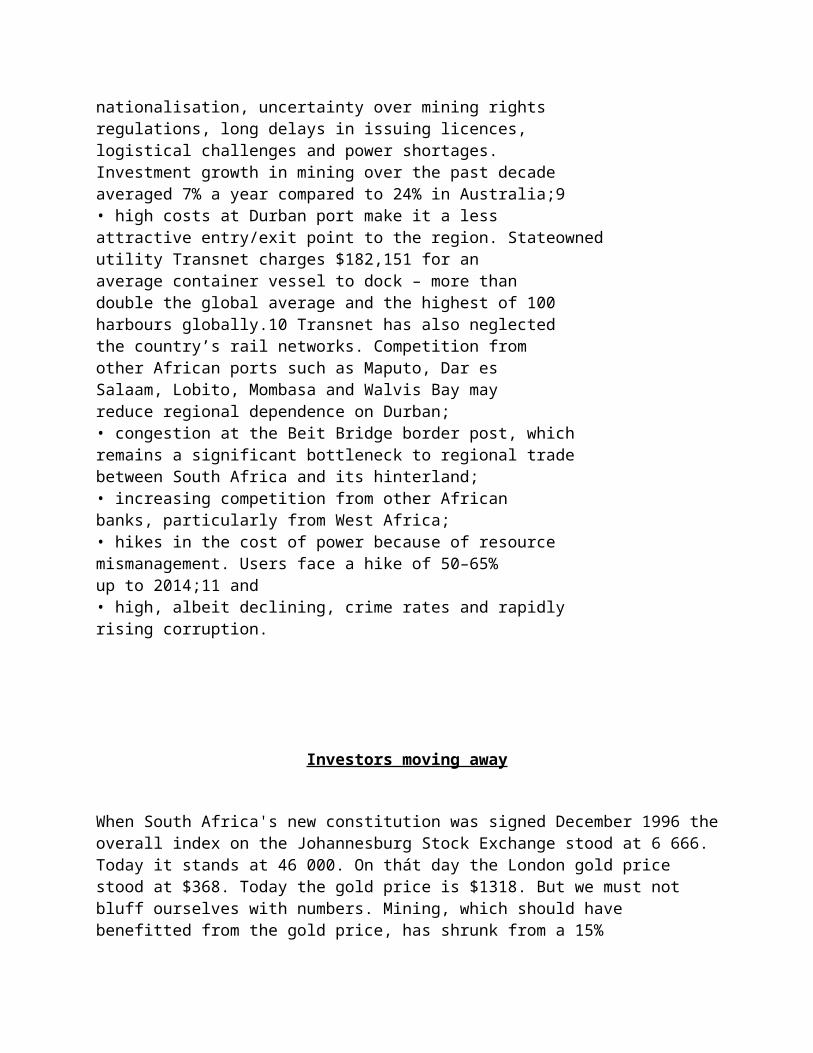
Investors are worried by the government’snegative attitude to foreign investment, despite itspublic pronouncements. This was highlighted bythe treatment of Walmart in its bid for local retailgiant Massmart.Other challenges to South Africa’s attraction as agateway include:• exchange controls, which are hardly present inother African countries, including the financialcentres of Mauritius and Botswana; • declining industrialisation, as exporters strugglewith high business costs, a volatile currency,onerous empowerment quotas, skills shortagesand rising labour costs. They battle to competewith cheap Asian goods flooding African markets;• the decline of key investment sectors, notablymining. South Africa has missed out on thecommodities boom because of concerns aboutnationalisation, uncertainty over mining rightsregulations, long delays in issuing licences,logistical challenges and power shortages.Investment growth in mining over the past decadeaveraged 7% a year compared to 24% in Australia;9• high costs at Durban port make it a lessattractive entry/exit point to the region. Stateownedutility Transnet charges $182,151 for anaverage container vessel to dock – more thandouble the global average and the highest of 100harbours globally.10 Transnet has also neglectedthe country’s rail networks. Competition fromother African ports such as Maputo, Dar esSalaam, Lobito, Mombasa and Walvis Bay mayreduce regional dependence on Durban;• congestion at the Beit Bridge border post, whichremains a significant bottleneck to regional tradebetween South Africa and its hinterland;• increasing competition from other Africanbanks, particularly from West Africa;• hikes in the cost of power because of resourcemismanagement. Users face a hike of 50–65%up to 2014;11 and• high, albeit declining, crime rates and rapidlyrising corruption.
Investors moving away
When South Africa's new constitution was signed December 1996 the overall index on the Johannesburg Stock Exchange stood at 6 666. Today it stands at 46 000. On thát day the London gold price stood at $368. Today the gold price is $1318. But we must not bluff ourselves with numbers. Mining, which should have benefitted from the gold price, has shrunk from a 15% contribution to the country's GDP to only 5,5% last year. Strikes and demands for unreasonable wage increases of 60% played a role in this. On that day a US dollar cost R4,69. Today a US dollar costs R10,15. Today the South African economy is slowly moving in the wrong direction.
The economic growth rate remains low, the government is not succeeding in reducing unemployment and problems of poverty remain very serious.
The honourable minister of Finance, to a large degree succeeded in maintaining a balance between financial restrictions and the demands placed on government spending. Without a radical change in the economic direction, the minister will not be able to maintain this balance much longer.
What is the main reason for the economy moving in the wrong direction? The main reason is the ANC's continual interference in the private sector and specifically the ANC's ambiguous message to the private sector and to foreign investors.
The minister of Finance pleads for more foreign investment because without it we will not be able to increase our economic growth rate. The FF Plus agrees with this.
He and the National Development Plan promise less red-tape and government interference to make it more attractive for national and international investors to invest in South Africa. We agree. The next moment, another minister announces stricter labour laws and more black economic empowerment measures. At the same time we get a new Bill on foreign investments which will increase the red-tape for foreign investors considerably and make it more difficult to invest here.
No wonder that investors are confused about South Africa. Does the government's right hand know what its left hand is doing?
Remember: "Investors have the memories of elephants, the hearts of lambs and the legs of hares".
Hulle onthou lank, is baie versigtig en vlug gou.
The days when investors could invest despite the problems in South Africa, have passed. They owe the ANC and South Africa nothing more. There are many other

counties which put in a lot of effort to make it as attractive as possible for investors. We in South Africa put new obstacles in their way and then we're surprised when the investments do not roll in.
With more rigid labour legislation we are doing the exact opposite to that which the International Monetary Fund (IMF) had advised South Africa to do to improve our economic growth rate and job-creation.
Die VF Plus stel voor dat alle klein en middelslag ondernemings vry van arbeidswetgewing gestel word en kyk dan hoe skep hulle werk. Gee beleidsekerheid aan beleggers deur die dubbele boodskappe te stop en kyk hoe nuwe beleggings instroom. Ons ekonomie sal ook nie baie langer kan voortgaan om aan ‘n kwart van die bevolking, 16 miljoen Suid-Afrikaners, staatstoelaes te betaal nie.
The FF Plus proposes that all small and medium-sized enterprises should be exempted from labour legislation and see how they will create jobs. Give policy assurance to investors by stopping the ambiguous messages and see how investors will stream to the country. Our economy will also not be able to continue much longer with paying a quarter of our population, that is 16 million South Africans, a state grant.
You can't indulge in a major programme of redistribution and welfare before you have experienced a period of high economic growth. You have to earn the money before you spend it.
We need a radical change of our economic direction to resolve South Africa's unemployment, poverty and growth rate problems, because the current policy direction is clearly not working.
Indicators of S.A
indicators take into consideration the monitoring of transformation of hithertoapartheid South Africa. The goals of transformation are embodied in theGovernment’s Reconstruction and Development Programme (RDP), and theGrowth, Employment and Redistribution (GEAR) strategy. The RDP is anintegrated, coherent socio-economic policy designed to ensure “a better lifefor all”. GEAR is the government’s macro-economic framework for rebuildingand restructuring the economy to meet the needs of the new democracy, andfocusing on the competitive world economy.Poverty alleviation, a critical issue in the transformation process, is a majorconcern to the Government. In this regard, initiatives to measure and monitorpoverty is now co-ordinated by the Policy Co-ordination and Advisory
Services unit (POCAS) formerly called the Co-ordination and ImplementationUnit (CIU) located in the Office of the Presidency. As a consequence, variousGovernment Departments have developed poverty monitoring indicators. (SeeReport of the technical workshop on poverty indicators and monitoring, 1998,
and Thorne-Erasmus, 1998).
LEVELS OF SOCIAL INDICATORS IN SOUTH AFRICAUnemployment rate3The global conferences did not set quantitative goals regarding levels ofunemployment. However, the Copenhagen World Summit emphasised themonitoring of employment and unemployment trends as an important factor insocial development (see UNECE, 2000). The trend in unemployment rates inSouth Africa is given below.According to the official definition, the unemployment rate has increasedslightly in recent years with over one-fifth of the economically activepopulation unemployed in 1997 (Table 1). The level of unemployment ishigher in the expanded than in the official definition since this wider definitionof unemployment excludes work-seeking behaviour (Table 1).Table 1. Unemployment rates1995 1996 1997 1998Official definition (%) 16.4 20.3 22.0 25.2Expanded definition (%) 28.3 34.4 37.4 37.5Source: Stats SAEconomic well-being: PovertyPoverty headcount ratio (% below $1 a day): The internationaldevelopment goal is to reduce the proportion of the population whoseincome/consumption falls below the poverty line (i.e. the prevalence ofpoverty or poverty headcount ratio) to less than 15% by 2015. At present, wecan only provide information on this indicator for the year 1995. As can beseen in Appendix 1, according to this measure, the proportion of thepopulation in extreme poverty was 18% in 1995. This is higher than the levelof the international goal (less than15% by 2015). However, by this figure,2 Stats SA wishes to thank the various Government Departments and other organisations fortheir input in compiling the core indicators. The Departments and organisations are indicated
in Appendix 1.3 Stats SA uses two definitions – official and expanded definitions - of unemployment incompiling its unemployment statistics. In conformity with the ILO, the unemployed accordingto the official definition, are those people within the economically active population, who: (a)did not work during the seven days prior to interview, (b) want to work and are available tostart work within a week of the interview, (c) have taken active steps to look for work or tostart some form of self-employment in the four weeks prior to the interview. The expandeddefinition of the unemployed excludes criterion c above.6South Africa had in 1995, attained the goal set for sub-Saharan Africa (18%by the year 2015).Poverty Gap ratio: Similarly, the poverty gap ratio (the combinedmeasurement of prevalence and depth of poverty) in 1995 (6%) indicates thatSouth Africa has attained the goal set for Sub-Saharan Africa (7% by 2015).However, the international goal is 5% by 2015.Inequality of income: share of poorest 20%: In 1995, the poorest one-fifthof all households in South Africa had only 3% of all household income.Social DevelopmentNet enrolment ratio in primary education and literacy and gender equality ineducation: The percentage of children of primary school age who are enrolledin primary education (net enrolment ratio) increased slightly from 95% in 1995to 96% in 1997. This level, though less than the international goal (99% by2015), is much higher than the average level in sub-Saharan Africa in 1995(56%). About 79% of those aged 15 years and over were literate in 1996 –this is much higher than the level for sub-Saharan Africa in 1995 (57%) butfalls short of the international goal (88% by 2015). The female/male grossenrolment ratio was 108% in 1997. It would appear that South Africa by thisfigure, achieved the international goal (100% by 2005) unlike the generalposition in sub-Saharan Africa where the female/male gross enrolment ratiowas 79% in 1995. However, the gross female/male enrolment ratio of 108% inSouth Africa should be interpreted with caution. It does not necessarily implyequal opportunity for boys and girls to participate in primary and secondaryeducation. It is an indication that proportionately more girls than boys olderthan the school going age, are enrolled at school. This is evident from the

higher gross female enrolment ratio of 111% in 1997 compared with the malegross enrolment ratio of 110%.Childhood mortalityRelative to the international goal of reducing infant mortality to 22 perthousand live births, and under-five mortality to 31 per thousand by 2015,childhood mortality is still high in South Africa. It should also be noted that theinfant mortality rate appears to have increased in recent years in South Africa.The level was estimated as 56 per thousand live births in 1996 while in 1990 itwas estimated as 55 per thousand.Reproductive healthThe estimated maternal mortality ratio of 150 per 100 000 live births in SouthAfrica in 1998 is the lowest of any country in sub-Saharan Africa (exceptBotswana which has a similar level), and well below the international goal(245 per 100 000 live births in 2015). The average level in sub-Saharan Africawas 979 per 100 000 live births in 1990. The contraceptive prevalence rate(50% in 1998) in South Africa is also the highest of any country in sub-Saharan Africa (18% in 1993-95 in the whole region) consequently; the totalfertility rate in 1996 (3,2) is also the lowest in the region. Despite these levels,7teenage pregnancy and HIV are quite common. As of 1998, about 35% ofwomen had been pregnant before they reached the age of 19 years. Also,about 26% of women aged 20-24 years attending public antenatal clinics in1999 were HIV positive.EnvironmentIn 1998, about 18% of households had no access to piped water, 12% ofhouseholds had no access to a toilet facility, while 10% of households had noaccess to refuse removal facilities. Thus on a daily basis, members of thesehouseholds confront various health hazards related to environmentalcontamination including diarrhea. Notably, South Africa has an environmentalmanagement Act.By 1998, only 5% of the total land area of South Africa was protected toconserve biodiversity compared with the international goal of 10% for eachmajor ecological region.Carbon dioxide emissions increased from 299 million metric tons in 1995, to314 million metric tons in 1998 reflecting increased industrial processes in the
country.

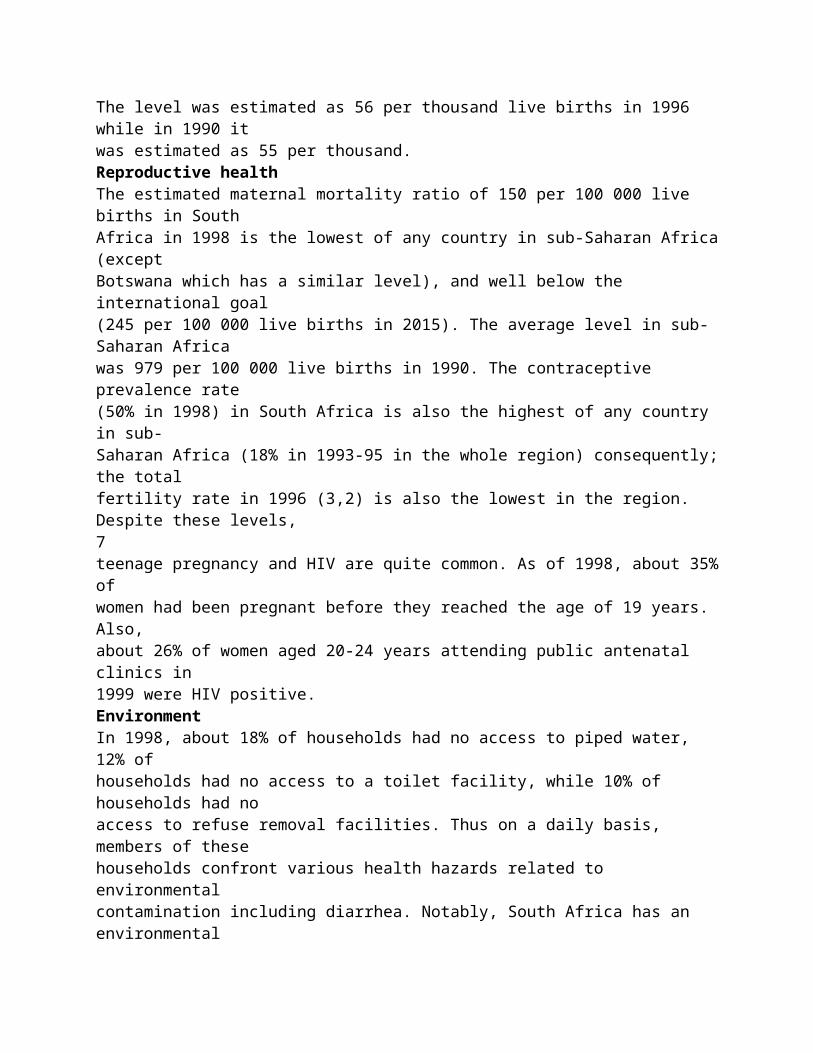
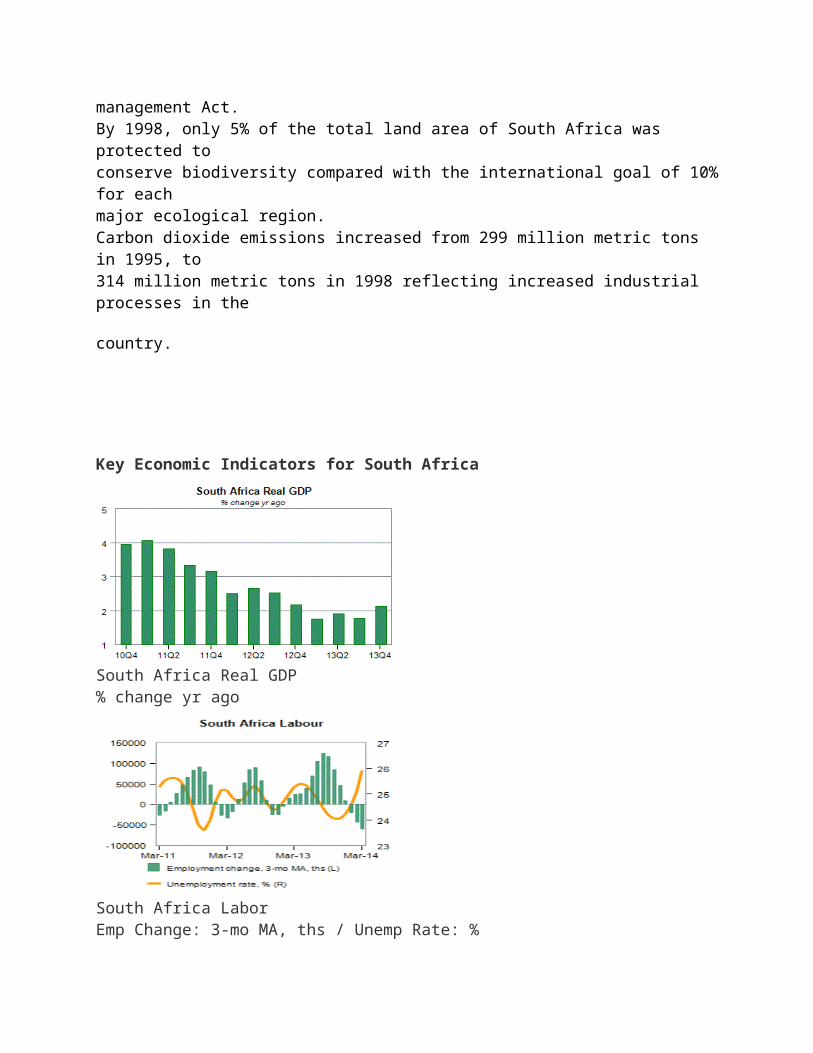
Key Economic Indicators for South Africa
South Africa Real GDP % change yr ago
South Africa LaborEmp Change: 3-mo MA, ths / Unemp Rate: %
South Africa Inflation % change yr ago
South Africa Industrial Production % change yr ago, 3-mo MA
View Economic Calendar Economic Indicators for South Africa Latest Previous Next Release
Indicators of Nigeria
Nigeria is a West African economy with a long coastline along the Atlantic Ocean. The country shares international borders with Benin, Chad, Cameroon and Niger. Nigeria ranks 32 in the world in terms of total area. The terrain of the country consists of southern lowlands and plateaus in the central region. The south east region has a mountainous surface, while the north consists of plains. According to the 2009 estimates, the country has a total population in excess of 154 million, of which almost 70% live below the international poverty line. Nigeria’s economy is overly dependent on the petroleum sector.
Nigeria Economy: Introduction
The Nigerian economy is one of the most developed economies in Africa. According to the UN classification, Nigeria is a middle-income nation with developed financial, communication and transport sectors. It has the second largest stock exchange in the continent.
The petroleum industry is central to the Nigerian economic profile. It is the 12th largest producer of petroleum products in the world. The industry accounts for almost 80% of the GDP share and above 90% of the total exports. Outside the petroleum sector, the Nigerian economy is highly amorphous and lacks basic infrastructure. Several failed efforts have been made after 1990 to develop other industrial sectors.
Owing to the surge in international oil prices during 2007-08, Nigeria managed an annual GDP of US$352.3 billion. The nation ranks 33 in the world in terms of GDP. The GDP per capita is US $2,400.
Nigeria Economy: Statistical Snapshot
Here are some of the vital statistics related to the Nigerian economy:
Labor force 47.33 million (2009 est.)
Labor in agriculture 70%
Budget revenues $10.49 billion
Budget expenditures $18.08 billion (2009 est.)
Industrial production growth rate -1.8% (2009 est.)
Current account balance -$9.394 billion (2009 est.)
Exports $45.43 billion (2009 est.)
Imports $42.1 billion (2009 est.)
Foreign exchange reserve $46.54 billion (December 2009 est.)
External Debt $9.689 billion (December 2009 est.)