economies of scale in gold mining of scale in gold mining in africa. it uses mine level data between...
TRANSCRIPT

No 222 – April 2015
Economies of Scale in Gold Mining
Ousman Gajigo and Mouna Ben Dhaou
Editorial Committee
Steve Kayizzi-Mugerwa (Chair) Anyanwu, John C. Faye, Issa Ngaruko, Floribert Shimeles, Abebe Salami, Adeleke O. Verdier-Chouchane, Audrey
Coordinator
Salami, Adeleke O.
Copyright © 2015
African Development Bank
Immeuble du Centre de Commerce International d'
Abidjan (CCIA)
01 BP 1387, Abidjan 01
Côte d'Ivoire
E-mail: [email protected]
Correct citation: Gajigo, Ousman and Ben Dhaou, Mouna. (2015), Economies of Scale in Gold Mining, Working Paper Series N° 222 African Development Bank, Abidjan, Côte d’Ivoire.
Rights and Permissions
All rights reserved.
The text and data in this publication may be
reproduced as long as the source is cited.
Reproduction for commercial purposes is
forbidden.
The Working Paper Series (WPS) is produced by the
Development Research Department of the African
Development Bank. The WPS disseminates the
findings of work in progress, preliminary research
results, and development experience and lessons,
to encourage the exchange of ideas and innovative
thinking among researchers, development
practitioners, policy makers, and donors. The
findings, interpretations, and conclusions
expressed in the Bank’s WPS are entirely those of
the author(s) and do not necessarily represent the
view of the African Development Bank, its Board of
Directors, or the countries they represent.
Working Papers are available online at
http:/www.afdb.org/
Coordinator
Economies of Scale in Gold Mining
Ousman Gajigo1 and Mouna Ben Dhaou2
1 Ousman Gajigo ([email protected]) is Principal Research Economist at the Development Research Department,
African Development Bank. The authors are grateful for comments from colleagues from the Development Research
Department. 2 Ms. Mouna Ben Dhaou ([email protected]) is a consultant at the Development Research Department,
African Development Bank.
AFRICAN DEVELOPMENT BANK GROUP
Working Paper No. 222
April 2015
Office of the Chief Economist

Abstract This paper analyzes the presence of economies of scale in gold mining in Africa. It uses mine level data between 2005 and 2010 and the data is collected from countries that account for 83% of the continent’s gold production. Our analysis
shows that the gold mining industry in Africa exhibits significant economies of scale. In other words, the unit cost of production falls significantly as mines get larger.
JEL Classification: D24, L72, L250, Q31, Q380.
Keywords: Cost, Gold, Mining, Scale economies, Semi-parametric, Technology.

5
1. Introduction
Mergers and acquisitions news have become ubiquitous in the mining industry. In some
commodities (such as steel and iron ore), global production has become increasingly concentrated
within a small number of larger firms. A large part of these concentrations have been driven by
vertical integration, especially in steel, to reduce cost for key inputs such as iron, ore and
manganese (Crompton and Lesourd 2008; Gajigo et al. 2011). In addition to mergers and
acquisitions, the average sizes of mines have become larger. As documented in Crowson (2003),
the number of mines has decreased while the average size of mines has increased significantly for
a number of minerals, including gold. Since the overall global mineral production is growing over
time, this implies that the average output per mine has gone up. It is therefore likely that economies
of scale may be present, with the unit costs declining with the level of production.
A lot of evidence would support the hypothesis that scale economies exist in the mining industry.
There have been significant advances in the technology, and resulting increases in capacity of
machinery (Sullivan 1990). Better technologies tend to lead to increasing automation, and higher
efficiencies in machinery. For example, some mining companies have already begun
experimenting with driverless trucks. So it would not be surprising if the unit cost declines as
output expands over a given mine. However, there are some complicating factors standing in the
way of a simple conclusion that economies of scale is inevitable. As explained in Roman and
Daneshmend (2000), greater capacity and newer but more complex technology may increase
operating cost through higher maintenance. Larger underground mines lead to other costs such as
the need for larger ventilation systems and its accompanying energy demand. So whether there is
economies of scale, and over which range in a given mining industry is an empirical issue.
Several papers have looked at economies of scale in mining for a number of minerals. Crompton
and Lesourd (2008) uses data from 9 steel plants in 27 countries between 2001 and 2003, they
found that scale effect is present in the industry. Crowson (2003) examines the relationship
between mine size and cost for copper. The author finds that economies of scale is present in the
copper industry but not quite strongly. On the other hand, even if scale economies is present,
diseconomies of scale could set in at some range of production (Bozorgebrahimi et al. 2005). A
number of other papers have examined economies of scale in other industries (Christensen and
6
Green; Yatchew 1997). The semi-parametric analysis used in Yatchew (1997) is the approach we
use in this paper.
This paper focuses on the gold mining industry in Africa. African countries account for 20% of
the global gold production of 2500 million metric tons. South Africa is the largest producer of the
mineral on the continent but other major producers include Ghana, Guinea, Mali and Tanzania.
Overall, about 20 African countries produce at least one ton per annum. The countries represented
in our sample account for 83% Africa’s gold production. We use a semi-parametric approach that
allows us to estimate the relationship between unit cost and production level without imposing any
functional form assumption that would be required under a fully parametric approach. Our results
suggest that economies of scale is present in the gold mining industry. This means that the trends
observed in large-scale mining, as well as mergers and acquisitions in the industry are likely driven
by economies of scale.
2. Data
We assemble a panel data set at the level of mines that were in production between 2005 and 2010
in Africa (the full list of mines is provided in Table A1 in the appendix). The data was compiled
using publicly available information stored in annual reports of mining companies, and filed with
the System for Electronic Document Analysis and Retrieval (SEDAR). It covers 30 gold mines in
7 African countries. The 7 countries (Botswana, Burkina Faso, Ghana, Guinea, Mali, Niger and
South Africa) account for 83% of Africa’s total gold production over the 2005-2010 period (US
Geological Survey 2011). The summary statistics of the key variables used in the analysis are
presented below in Table 1.
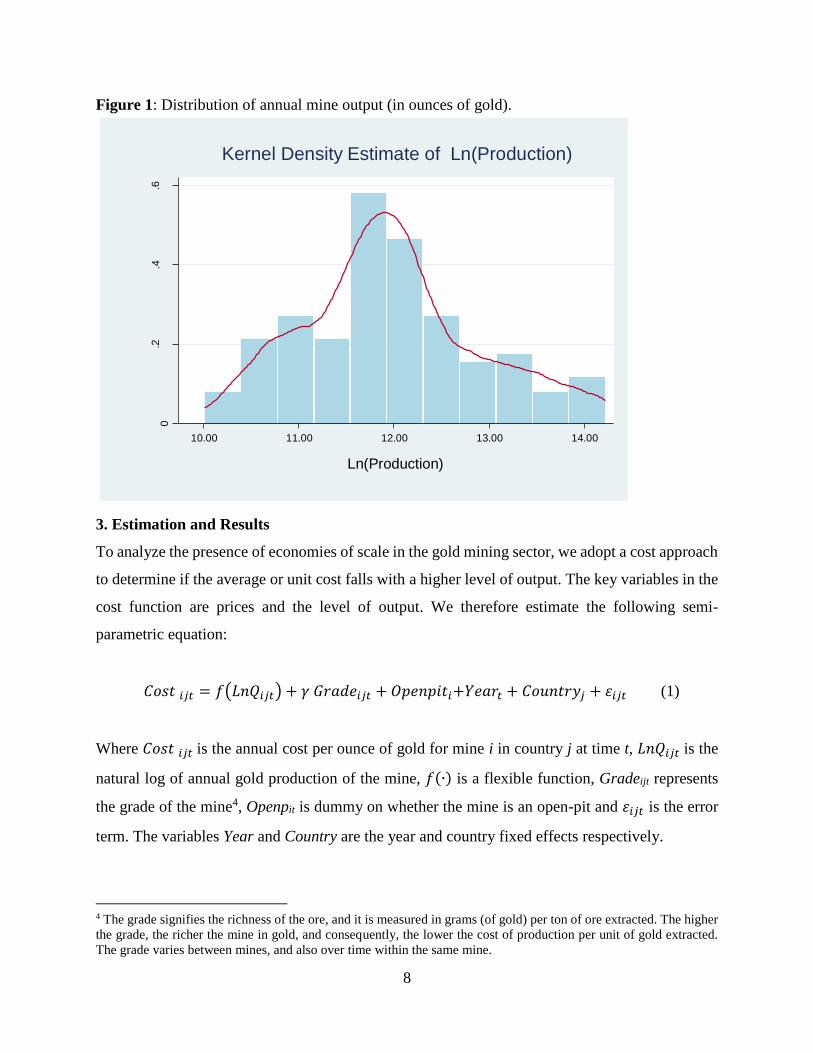
The median gold output per mine is about 143,217 ounces per year and is lower than the average
of 245,511. This is due to the presence of some very large mines in the data. Figure 1 provides the
full distribution of the annual mine output in our sample. About half of the mines are open-pit
mines3. The grades of the mines also vary significantly, not only across mines but also over time
in the same mine. Most of the mines in our sample are profitable. In fact, only about 5% of the
3 An open pit mine is the type of mining where the surface ground is removed in a large pit to extract the mineral, as
opposed to an underground mine where tunnels are dug deep below the surface.
7
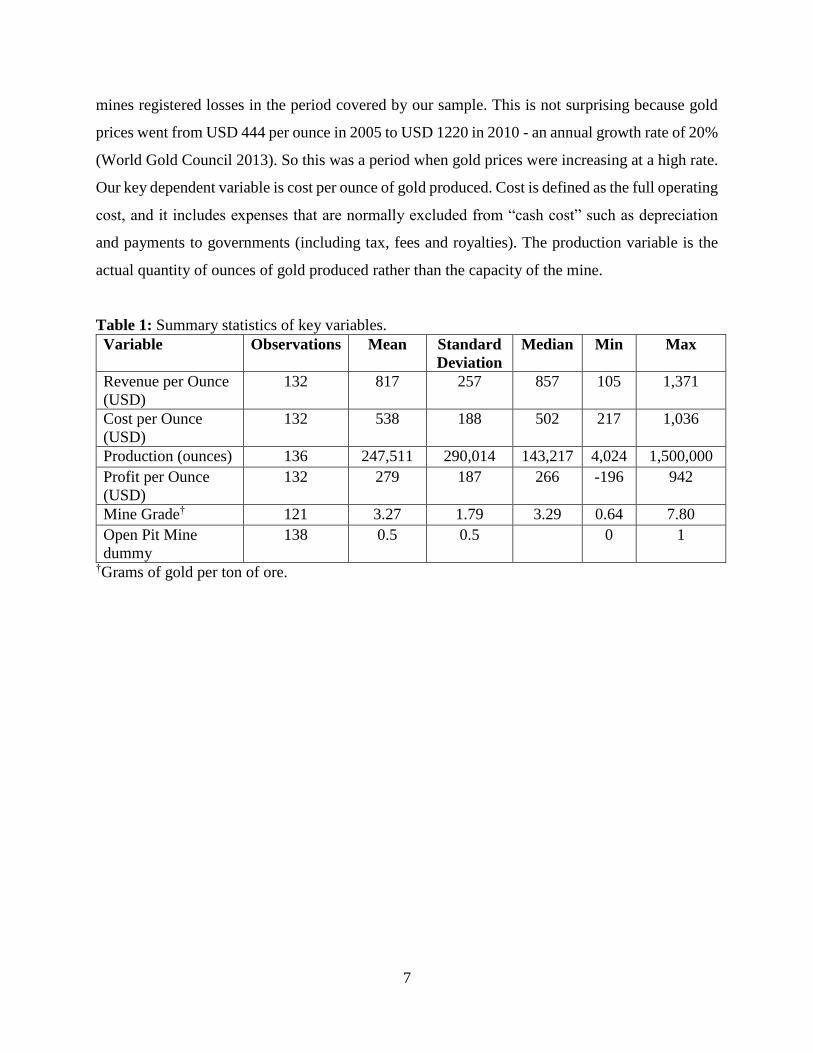
mines registered losses in the period covered by our sample. This is not surprising because gold
prices went from USD 444 per ounce in 2005 to USD 1220 in 2010 - an annual growth rate of 20%
(World Gold Council 2013). So this was a period when gold prices were increasing at a high rate.
Our key dependent variable is cost per ounce of gold produced. Cost is defined as the full operating
cost, and it includes expenses that are normally excluded from “cash cost” such as depreciation
and payments to governments (including tax, fees and royalties). The production variable is the
actual quantity of ounces of gold produced rather than the capacity of the mine.
Table 1: Summary statistics of key variables.
Variable Observations Mean Standard
Deviation
Median Min Max
Revenue per Ounce
(USD)
132 817 257 857 105 1,371
Cost per Ounce
(USD)
132 538 188 502 217 1,036
Production (ounces) 136 247,511 290,014 143,217 4,024 1,500,000
Profit per Ounce
(USD)
132 279 187 266 -196 942
Mine Grade† 121 3.27 1.79 3.29 0.64 7.80
Open Pit Mine
dummy
138 0.5 0.5 0 1
†Grams of gold per ton of ore.
8
Figure 1: Distribution of annual mine output (in ounces of gold).
3. Estimation and Results
To analyze the presence of economies of scale in the gold mining sector, we adopt a cost approach
to determine if the average or unit cost falls with a higher level of output. The key variables in the
cost function are prices and the level of output. We therefore estimate the following semi-
parametric equation:
𝐶𝑜𝑠𝑡 𝑖𝑗𝑡 = 𝑓(𝐿𝑛𝑄𝑖𝑗𝑡) + 𝛾 𝐺𝑟𝑎𝑑𝑒𝑖𝑗𝑡 + 𝑂𝑝𝑒𝑛𝑝𝑖𝑡𝑖+𝑌𝑒𝑎𝑟𝑡 + 𝐶𝑜𝑢𝑛𝑡𝑟𝑦𝑗 + 𝜀𝑖𝑗𝑡 (1)
Where 𝐶𝑜𝑠𝑡 𝑖𝑗𝑡 is the annual cost per ounce of gold for mine i in country j at time t, 𝐿𝑛𝑄𝑖𝑗𝑡 is the
natural log of annual gold production of the mine, 𝑓(∙) is a flexible function, Gradeijt represents
the grade of the mine4, Openpit is dummy on whether the mine is an open-pit and 𝜀𝑖𝑗𝑡 is the error
term. The variables Year and Country are the year and country fixed effects respectively.
4 The grade signifies the richness of the ore, and it is measured in grams (of gold) per ton of ore extracted. The higher
the grade, the richer the mine in gold, and consequently, the lower the cost of production per unit of gold extracted.
The grade varies between mines, and also over time within the same mine.
0.2
.4.6
De
nsity
10.00 11.00 12.00 13.00 14.00
Ln(Production)
Kernel Density Estimate of Ln(Production)
9
Our data set is suited to the task of analyzing economies of scale. The price of gold is exogenous
to mining firms given the large number of producers5 and the fact that it is an internationally traded
commodity. In fact, the average revenue per ounce of gold does not vary across firms in a given
year in our sample. So we used the year fixed effect to control for both time and price. Grade and
country-specific characteristics are controlled for since the former is an exogenous and important
determinant of cost and the latter helps us to control for other country-specific costs such as quality
of infrastructure. Given that the data is captured at the mine level, it avoids the aggregation
challenges that would be present in a dataset where the unit of observation is a firm with multiple
mines.
The above semi-parametric estimation allows us to estimate the relationship between unit cost and
output level without imposing any functional form assumption, while at the same time allowing
for other controls to enter linearly. Equation (1) can be written as
𝐶𝑜𝑠𝑡 𝑖𝑗𝑡 = 𝑓(𝐿𝑛𝑄𝑖𝑗𝑡) + 𝑋𝑖𝑗𝑡′ 𝛽 + 𝜀𝑖𝑗𝑡, (2)
where X is a vector of independent variables that enter linearly. The semi-parametric procedure
estimates the parametric component first
𝐶𝑜𝑠𝑡 𝑖𝑗𝑡 = 𝑋𝑖𝑗𝑡′ 𝛽 + 𝜀𝑖𝑗𝑡 (3)
and then smoothes
𝐶𝑜𝑠𝑡 𝑖𝑗𝑡̂ − [𝑋𝑖𝑗𝑡
′ �̂�] = 𝑓(𝐿𝑛𝑄𝑖𝑗𝑡) + 𝜖𝑖𝑗𝑡 (4)
(where is a vector of the estimated parameters for mine grade, open pit, country fixed effects
and year fixed effects). The non-parametric component, 𝑓(∙), is estimated in this paper using
locally weighted scatter-plot regression (LOWESS). The use of LOWESS (as opposed to
polynomial smoothing) is advantageous in that it is robust to outliers since the smoothing is ‘local’
as the bandwidth can be made small to ensure nearby data-points are given greater weights relative
to outliers (Cleveland 1979; Lokshin 2006; Yatchew 1997).
Our main test for the presence of economies of scale is whether gradient of the function, 𝑓(∙) is
downward sloping (negative gradient). The range of production where 𝑓(∙) is downward sloping
5 Gold supply in a period usually comes from mine production, sale from recycled gold (either from the jewelry market
and governments). Therefore, even though mine gold production is dominated by relatively few firms, the total number
of sellers is quite large, which tends to limit market power by individual mining companies.
10
would suggest economies of scale. In other words, unit cost of production is falling with increasing
scale or mine output. And conversely, the range of production where 𝑓(∙) is rising would suggest
diseconomies of scale.
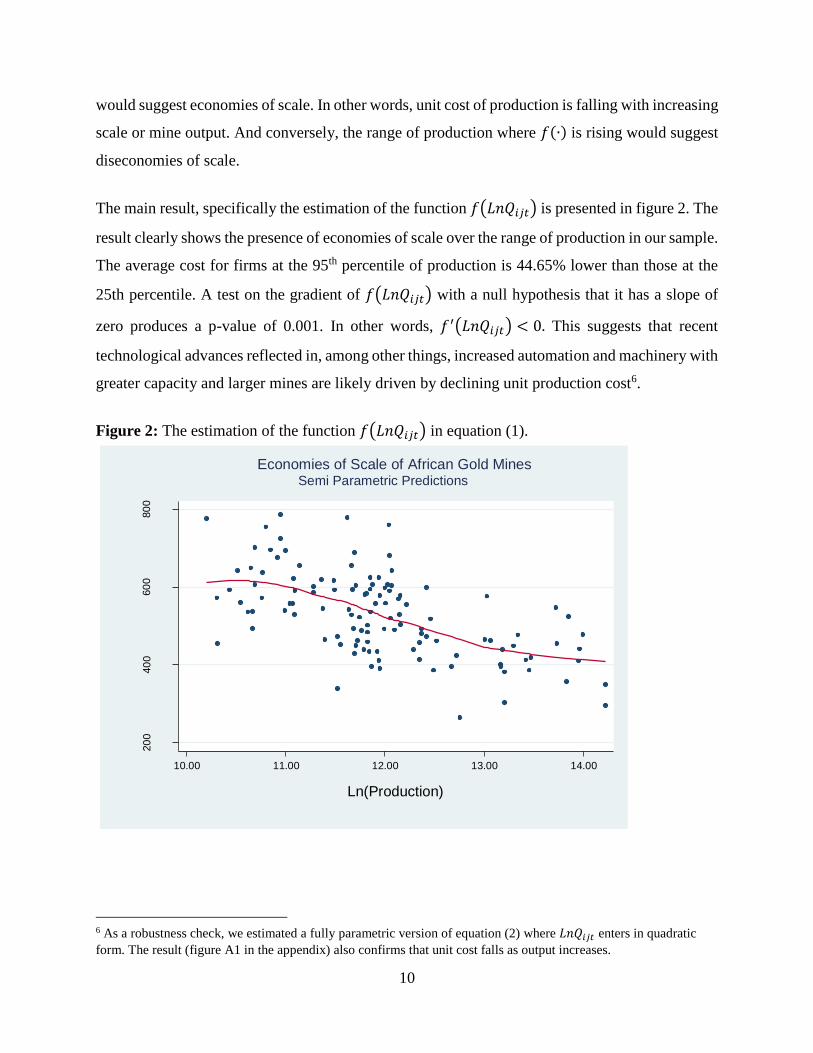
The main result, specifically the estimation of the function 𝑓(𝐿𝑛𝑄𝑖𝑗𝑡) is presented in figure 2. The
result clearly shows the presence of economies of scale over the range of production in our sample.
The average cost for firms at the 95th percentile of production is 44.65% lower than those at the
25th percentile. A test on the gradient of 𝑓(𝐿𝑛𝑄𝑖𝑗𝑡) with a null hypothesis that it has a slope of
zero produces a p-value of 0.001. In other words, 𝑓′(𝐿𝑛𝑄𝑖𝑗𝑡) < 0. This suggests that recent
technological advances reflected in, among other things, increased automation and machinery with
greater capacity and larger mines are likely driven by declining unit production cost6.
Figure 2: The estimation of the function 𝑓(𝐿𝑛𝑄𝑖𝑗𝑡) in equation (1).
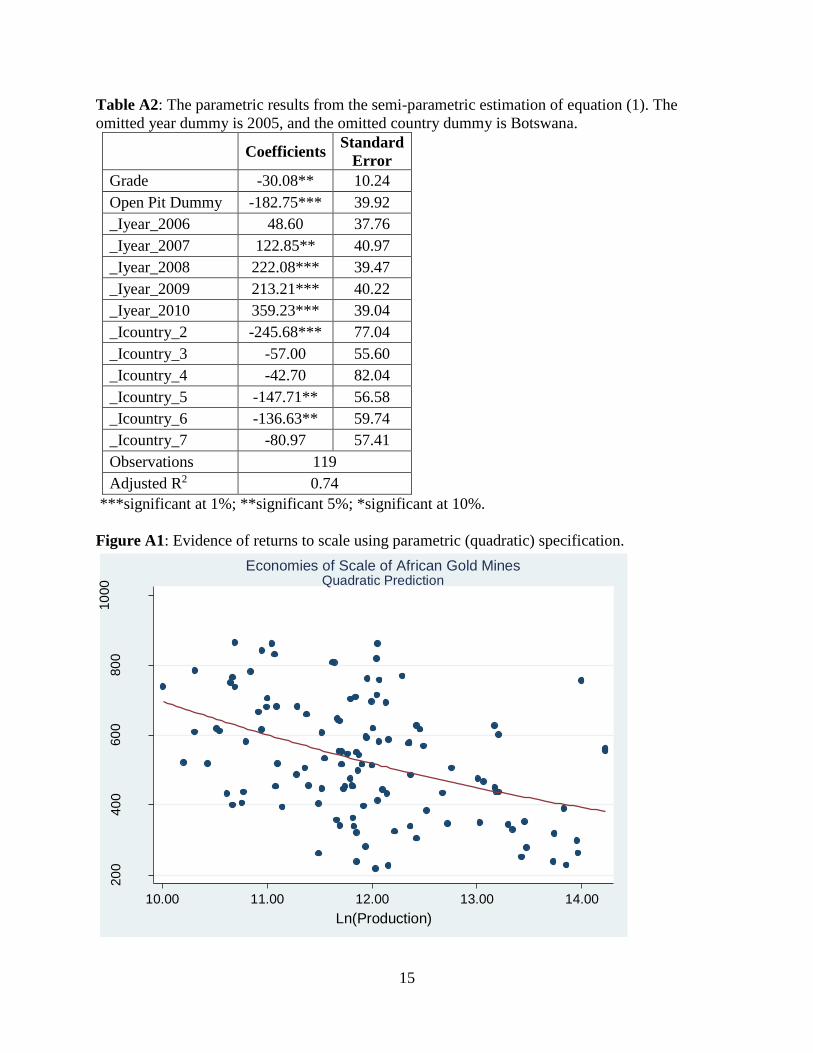
6 As a robustness check, we estimated a fully parametric version of equation (2) where 𝐿𝑛𝑄𝑖𝑗𝑡 enters in quadratic
form. The result (figure A1 in the appendix) also confirms that unit cost falls as output increases.
20
040
060
080
0
Co
st
pe
r O
unce
of
Gold
in U
SD
10.00 11.00 12.00 13.00 14.00
Ln(Production)
Economies of Scale of African Gold MinesSemi Parametric Predictions
11
The parametric results from the estimation of equation (1) are presented in Table A2 in the
appendix. As expected, the grades of mines are negatively associated with cost. In other words,
the higher the grade, the lower the unit cost of production. Open pit mines are also significantly
associated with lower unit cost of production. Specifically, open pit mines have average lower cost
by about USD 182 per ounce.
4. Policy issues
The trend of increasingly larger mines has implications for policy in resource rich countries.
Specifically, the presence of economies of scale has consequences for environmental mitigation
and inclusiveness of the mining industry.
Larger mines, which are more likely to be open-pit, are bound to have a significant adverse effect
on the local ecosystem. On the other hand, large mines tend to be operated by major mining firms,
which are becoming increasingly cognizant of environmental effects due to pressures from
regulatory agencies and non-governmental organizations. Nevertheless, countries should not be
passive about this development and need to ensure that mining codes and mineral laws are kept
updated with these new trends. Specifically, standards for reclamation of mines would need to be
more stringent given the potential impact on the ecosystem as the average mine size continues to
increase.
To the extent that inclusiveness is expected through employment generation, the mining industry
is not inclusive relative to sectors such as agriculture and manufacturing (Gajigo et al. 2012a). This
is mainly due to fact that it is capital-intensive, and only limited processing occurs in African
countries. Economies of scale would tend to reinforce this effect since larger mines would be more
capital-intensive, and would require greater automation. So low direct job creation from the
industry is likely to continue. Hence, focus should be on the distribution of resource rents to help
broaden the benefits of the industry since labor share of costs for mining firms would likely decline
further. The extent of rent-sharing between mining companies and countries is determined by the
fiscal regimes in the mining codes that specify royalty payments and dividend sharing (Gajigo et
al. 2012b). Governments would not only have to ensure that rent sharing occurs, but these benefits
are shared by local communities.
12
5. Conclusion
Whether higher capacity reduces unit cost of production in mining is an empirical question. Greater
automation reduces labor requirement and larger capacity equipment can accomplish larger
workload in a given time period. On the other hand, greater technological complexity may increase
the frequency of equipment breakdown, slowing work and increasing cost. So it is not obvious at
first glance whether economies of scale may exist in mining. This paper investigates the presence
of economies of scale in the gold mining industry. The data, which is at the mine level, comes
from mines in countries that account for 83% of Africa’s gold production. We find that economies
of scale is present as the unit cost of production decreases significantly with the level of annual
production of mines while controlling for relevant variables.
13
References
Bozorgebrahimi, A., R.A. Hall and MA Morin. 2005. “Equipment size effects on open pit mining
performance”, International Journal of Surface Mining, Reclamation and Environment, 19(1): 41-
56.
Christensen, L.R. and W.H. Greene. 1976. “Economies of scale in US electric power generation”,
Journal of Political Economy, 84(4): 655-676.
Cleveland, W. S. 1979. “Robust locally weighted regression and smoothing scatterplots”,
Journal of the American Statistical Association, 74: 829–836.
Crompton, P. and J-B Lesourd. 2008. “Economies of scale in global iron-making”, Resources
Policy, 33(2): 74-82.
Crowson, P. 2003. “Mine size and structure of cost”, Resources Policy, 29(1-2): 15-36.
Crowson, P. 2012. “Some observations on copper yields and ore grades”, Resources Policy, 37(1):
59-72.
Gajigo, O. E. Mutambatsere and E. Adjei. 2011. “Manganese industry analysis”, African
Development Bank, Tunis.
Gajigo, O., E. Mutambatsere and G. Ndiaye. 2012a. “Gold Mining in Africa: Maximizing
Economic Returns for Countries”, Working Paper, African Development Bank.
Gajigo, O., E. Mutambatsere and G. Ndiaye. 2012b. “Royalty Rates Revisited in African Mining”,
Economic Brief, African Development Bank.
Lokshin, M. 2006. “Difference-based semiparametric estimation of partial linear regression
models”, Stata Journal, 6(3): 377–383.
Roman, P.A. and L. Daneshmend. 2000. “Economies of Scale in Mining – Assessing Upper
Bounds with Simulation”, Engineering Economist, 45(4): 326-338.
Sullivan, T.W. 1990. “New Technology and Economies of Scale in Shovel-Truck Sizing”, in Mine
Planning and Equipment Selection, Singhal & Vavra (eds.), Rotterdam.
System for Electronic Document Analysis and Retrieval (SEDAR). 2014. Canada
United State Geological Survey. 2011. Mineral Information: Gold., Washington DC.
Yatchew, A. 1997. “An elementary estimator of the partial linear model”, Economic
Letters, 57: 135–143.
World Gold Council. 2013. Gold prices. UK
14
Appendix
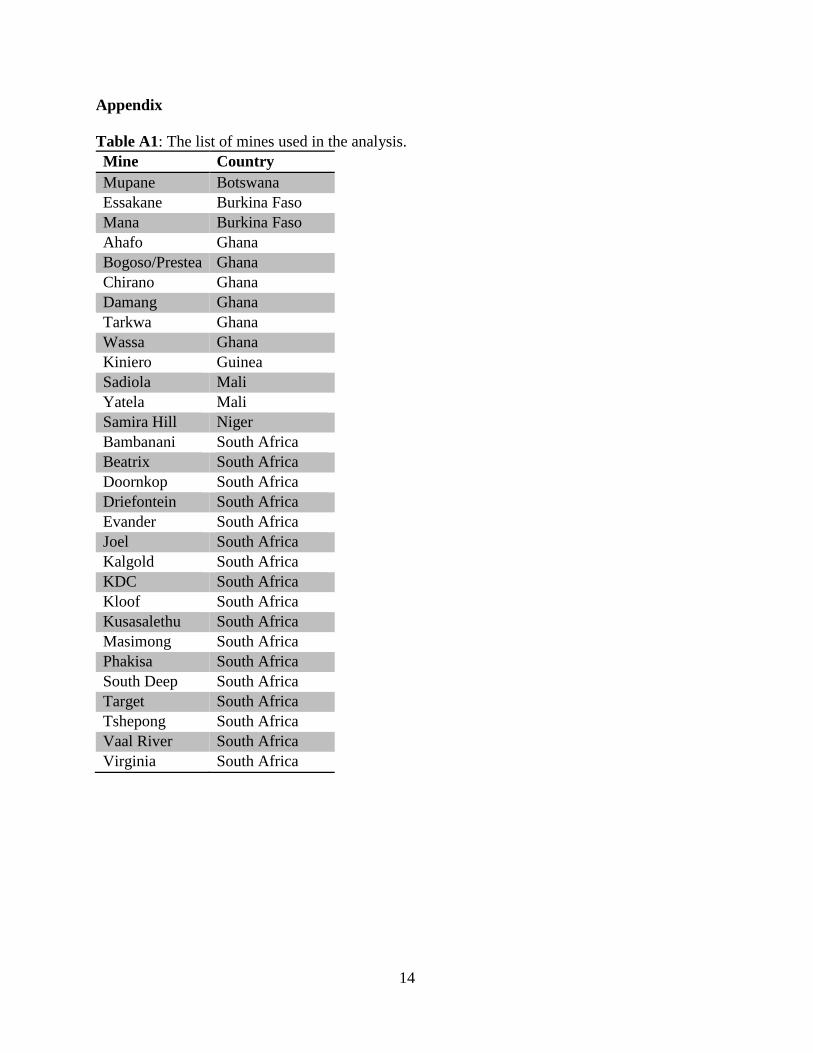
Table A1: The list of mines used in the analysis.
Mine Country
Mupane Botswana
Essakane Burkina Faso
Mana Burkina Faso
Ahafo Ghana
Bogoso/Prestea Ghana
Chirano Ghana
Damang Ghana
Tarkwa Ghana
Wassa Ghana
Kiniero Guinea
Sadiola Mali
Yatela Mali
Samira Hill Niger
Bambanani South Africa
Beatrix South Africa
Doornkop South Africa
Driefontein South Africa
Evander South Africa
Joel South Africa
Kalgold South Africa
KDC South Africa
Kloof South Africa
Kusasalethu South Africa
Masimong South Africa
Phakisa South Africa
South Deep South Africa
Target South Africa
Tshepong South Africa
Vaal River South Africa
Virginia South Africa
15
Table A2: The parametric results from the semi-parametric estimation of equation (1). The
omitted year dummy is 2005, and the omitted country dummy is Botswana.
Coefficients
Standard
Error
Grade -30.08** 10.24
Open Pit Dummy -182.75*** 39.92
_Iyear_2006 48.60 37.76
_Iyear_2007 122.85** 40.97
_Iyear_2008 222.08*** 39.47
_Iyear_2009 213.21*** 40.22
_Iyear_2010 359.23*** 39.04
_Icountry_2 -245.68*** 77.04
_Icountry_3 -57.00 55.60
_Icountry_4 -42.70 82.04
_Icountry_5 -147.71** 56.58
_Icountry_6 -136.63** 59.74
_Icountry_7 -80.97 57.41
Observations 119
Adjusted R2 0.74
***significant at 1%; **significant 5%; *significant at 10%.
Figure A1: Evidence of returns to scale using parametric (quadratic) specification.
20
040
060
080
010
00
Co
st
pe
r O
unce
of
Go
ld in
US
D
10.00 11.00 12.00 13.00 14.00
Ln(Production)
Economies of Scale of African Gold MinesQuadratic Prediction
16
Recent Publications in the Series
nº Year Author(s) Title
221 2015 Anthony M. Simpasa, Abebe
Shimeles and Adeleke O. Salami
Employment Effects of Multilateral Development Bank
Support: The Case of the African Development Bank
220 2015 Zerihun Gudeta Alemu Developing a Food (in) Security Map for South Africa
219 2015 El-hadj Bah Impact of the Business Environment on Output and
Productivity in Africa
218 2015 Nadege Yameogo Household Energy Demand and the Impact of Energy
Prices: Evidence from Senegal
217 2015 Zorobabel Bicaba, Zuzana Brixiová,
and Mthuli Ncube
Capital Account Policies, IMF Programs and Growth in
Developing Regions
216 2015 Wolassa L Kumo Inflation Targeting Monetary Policy, Inflation Volatility and Economic Growth in South Africa
215 2014 Taoufik Rajhi A Regional Budget Development Allocation Formula for Tunisia
214 2014 Mohamed Ayadi and Wided
Matoussi From Productivity to Exporting or Vice Versa? Evidence from Tunisian Manufacturing Sector
213 2014 Mohamed Ayadi and Wided
Matoussi
Disentangling the Pattern of Geographic Concentration
in Tunisian Manufacturing Industries
212 2014 Nadège Désirée Yameogo, Tiguéné
Nabassaga, and Mthuli Ncube
Diversification and Sophistication of Livestock
Products: the Case of African Countries