economy & surface access sustainable development plan...
TRANSCRIPT
ECONOMY & SURFACE ACCESSECONOMY & SURFACE ACCESSECONOMY & SURFACE ACCESSECONOMY & SURFACE ACCESS
ECONOMY & SURFACE ACCESS
SUSTAINABLE DEVELOPMENT PLAN 2015
ECONOMY AND SURFACE ACCESS
eastmidlandsairport.com

01
This Economy and Surface Access Plan sets out the ambitions and the opportunities for the airport in the light of the current activity, the national economic prospects, changes in airline operations and the prospects for future growth. The Sustainable Development Plan documents were published as drafts and circulated for comment in spring 2014. This provided an opportunity for a wide range of stakeholders to contribute to the Plan and let us have their views. We are grateful to all those who responded and took the time to look at our plans.
It is intended to keep the Sustainable Development Plan and its supporting documents under review so that they remain relevant and reflect the evolution and the development of East Midlands Airport. This will follow the guidance in the 2013 Aviation Policy Framework and the review will be undertaken at least every five years.
INTRODUCTION
OUR AIRPORT
SUSTAINABLE DEVELOPMENT PLAN ECONOMY AND SURFACE ACCESS
The Sustainable Development Plan sets out the high-level strategic objectives for the growth and development of East Midlands Airport. It is supported by four detailed plans that cover:
• Community;
• Economy and Surface Access;
• Environment; and
• Land Use
This Economy and Surface Access Plan is intended to:
• Identify how the airport can support the sustainable growth of the local, regional and national economy;
• Set out how the airport can capitalise on the economic strength of transport, distribution and logistics and the strength of the employment cluster in the local area;
• Set out a policy for the promotion and development of surface access at East Midlands Airport that is integrated with the Land Use, Community and Environment Plans;
• Provide up-to-date input into various long term plans including the North West Leicestershire Core Strategy Local Plan, Highways England Route Based Strategies, Local Transport Plans, Network Rail route studies and Local Enterprise Partnerships; and
• Provide guidance and information to the airport users, occupiers, developers, statutory agencies and the local community.

02
This is a major benefit to the development of the passenger and the cargo business. There are 11.6 million people that live within a 90 minute drive of East Midlands Airport. This is more than any other airport in the Midlands.
East Midlands Airport is located around 14 miles from Nottingham city centre, 14 miles from Derby and 19 miles from Leicester, with the towns of Loughborough and Long Eaton being 10 and 9 miles away respectively. It is a unique airport in the UK in that it is the only airport that serves in relatively equal proportions, three key cities in opposite directions.
CAA survey data for 2013 shows that the airport’s biggest passenger catchment is Nottinghamshire with 16% followed by Derbyshire 14% and Leicestershire with 12%.
The airport is very well connected by road, with direct access to the M1 and A42 and very close to the A453, A50 and A52. There is a 24-hour a day, 7 day a week bus network connecting the airport to Derby Bus Station, Derby Train Station, Nottingham Broadmarsh Bus Station (with a five minute walk to Nottingham Train Station) and Nottingham City Centre, Leicester St Margaret Bus Station, Long Eaton and Long Eaton Train Station and Loughborough town centre. There is no direct rail link but the airport is well connected to rail via the Skylink network of buses. East Midlands Parkway rail station is approximately 6 miles away.
Whilst improving the public transport network remains a key priority, the need for accessibility through the highway network continues to be important, particularly for cargo and freight distribution. Targeted and focussed local improvements to the strategic road network are important areas for development, both to protect access to the airport site and also to manage the growth in non-airport traffic.
OVERVIEW
OUR AIRPORT
SUSTAINABLE DEVELOPMENT PLAN ECONOMY AND SURFACE ACCESS
In 2014 East Midlands Airport handled over 4.5 million passengers and around 309,000 tonnes of cargo. Passenger numbers peaked in 2008 when there were 5.6 million. There has been some growth in the volume of cargo transported over recent years. The airport is in a strategic location in the centre of the UK with direct access on to the national motorway system (M1/A42/M42).
CAA Survey 2013 – EMA catchment %
Nottinghamshire County 16%
Derbyshire County 14%
Leicestershire County 12%
South Yorkshire 8%
Lincolnshire County 6%
Staffordshire County 5%
West Midlands 5%
Northamptonshire County 3%
03
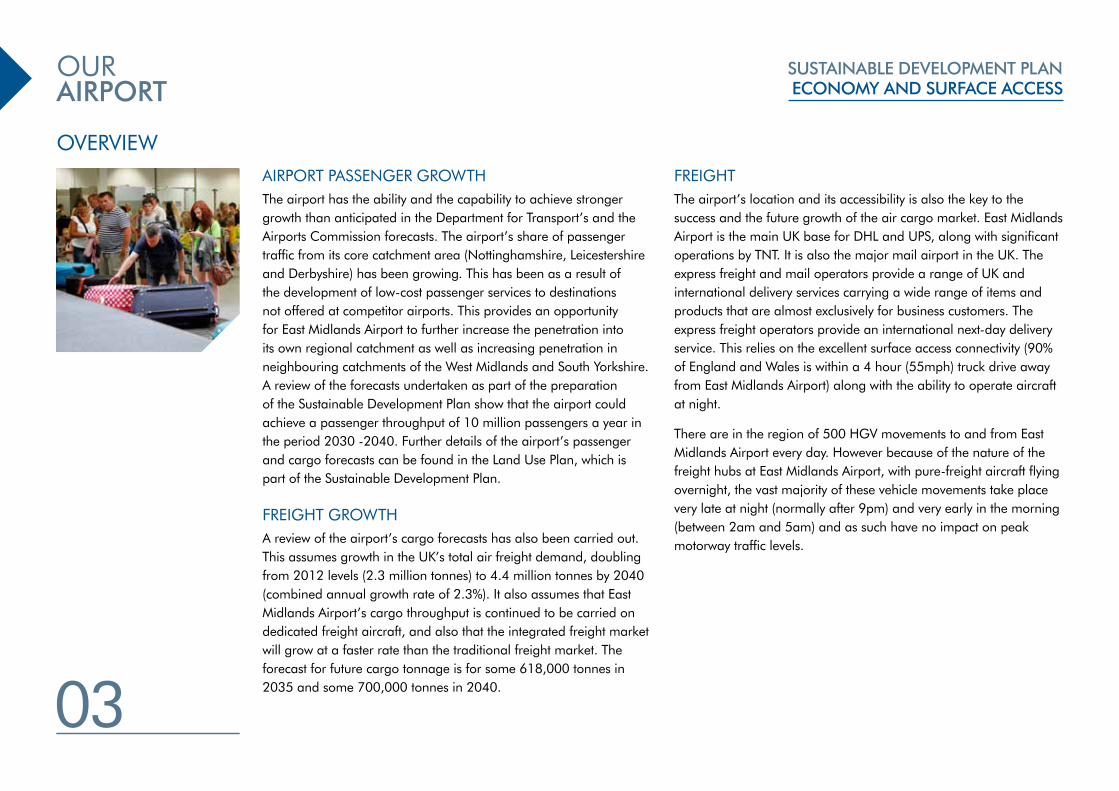
AIRPORT PASSENGER GROWTHThe airport has the ability and the capability to achieve stronger growth than anticipated in the Department for Transport’s and the Airports Commission forecasts. The airport’s share of passenger traffic from its core catchment area (Nottinghamshire, Leicestershire and Derbyshire) has been growing. This has been as a result of the development of low-cost passenger services to destinations not offered at competitor airports. This provides an opportunity for East Midlands Airport to further increase the penetration into its own regional catchment as well as increasing penetration in neighbouring catchments of the West Midlands and South Yorkshire. A review of the forecasts undertaken as part of the preparation of the Sustainable Development Plan show that the airport could achieve a passenger throughput of 10 million passengers a year in the period 2030 -2040. Further details of the airport’s passenger and cargo forecasts can be found in the Land Use Plan, which is part of the Sustainable Development Plan.
FREIGHT GROWTHA review of the airport’s cargo forecasts has also been carried out. This assumes growth in the UK’s total air freight demand, doubling from 2012 levels (2.3 million tonnes) to 4.4 million tonnes by 2040 (combined annual growth rate of 2.3%). It also assumes that East Midlands Airport’s cargo throughput is continued to be carried on dedicated freight aircraft, and also that the integrated freight market will grow at a faster rate than the traditional freight market. The forecast for future cargo tonnage is for some 618,000 tonnes in 2035 and some 700,000 tonnes in 2040.
FREIGHTThe airport’s location and its accessibility is also the key to the success and the future growth of the air cargo market. East Midlands Airport is the main UK base for DHL and UPS, along with significant operations by TNT. It is also the major mail airport in the UK. The express freight and mail operators provide a range of UK and international delivery services carrying a wide range of items and products that are almost exclusively for business customers. The express freight operators provide an international next-day delivery service. This relies on the excellent surface access connectivity (90% of England and Wales is within a 4 hour (55mph) truck drive away from East Midlands Airport) along with the ability to operate aircraft at night.
There are in the region of 500 HGV movements to and from East Midlands Airport every day. However because of the nature of the freight hubs at East Midlands Airport, with pure-freight aircraft flying overnight, the vast majority of these vehicle movements take place very late at night (normally after 9pm) and very early in the morning (between 2am and 5am) and as such have no impact on peak motorway traffic levels.
OVERVIEW
OUR AIRPORT
SUSTAINABLE DEVELOPMENT PLAN ECONOMY AND SURFACE ACCESS

04
The East Midlands is the 9th largest regional economy in the UK1 with a headline GVA of around £81bn. This is some 6% of the UK’s total GVA. The East Midlands region is a significant base for UK manufacturing and a greater proportion of the region’s economic output comes from manufacturing than any other country or region in the UK (16%)2.
The East Midlands region is a significant base for the UK manufacturing industry. In 2012 16% of the region’s GVA was generated by the manufacturing sector. This is the largest proportion of any UK region or county. In terms of its spatial distribution, the East Midlands is an unusual region, this is because most regions are dominated by a single (or at the most two) cities or city-regions. The East Midlands is different with three regional cities of similar economic significance, Nottingham, Leicester and Derby. East Midlands Airport sits almost equidistant between the three cities.
There are major multinational companies with bases in the East Midlands and these include Caterpillar near Leicester, Toyota near Derby which exports 80% of the vehicles that it makes; Bombardier – the UK’s sole manufacturer of locomotives and rolling stock; Rolls Royce who design and manufacture aircraft engines; and JCB which has its major manufacturing base and global headquarters at Rocester near Uttoxeter. Over 500 automotive manufacturers are based in the East Midlands region, making the automotive supply chain one of the strongest in Europe3.
Tourism is an important economic sector in the region. Domestic tourism dominates the number of visitors with approximately 8 UK visitors to 1 international visitor. However the balance, in terms of spend is more even, with international visitors spending around £400 per visit compared to £140 per visit for domestic tourists. Air services are therefore central to driving the international visitor economy4.
There are two Local Enterprise Partnerships in the region, Leicester & Leicestershire Enterprise Partnership and D2N2 Local Enterprise Partnership. The Leicester & Leicestershire Enterprise Partnership area has a population of almost one million with an estimated GVA of £19.4bn. The Leicestershire economy is relatively diverse however there is a nationally significant strength in logistics and transport. The Leicester & Leicestershire Local Enterprise Partnership’s Strategic Economic Plan aims to create 45,000 new jobs, lever £2.5bn of private investment and increase GVA by £4bn from £19bn to £23bn. The airport and its surrounding area is one of five Growth Areas (the East Midlands Enterprise Gateway) in the Local Enterprise Partnership’s Strategic Economic Plan.
ECONOMIC PLANWe aim to maximise our economic contribution to the East Midlands region, whist always maintaining a fair and respectful relationship with our supply chain and business partners.
OUR ECONOMIC IMPACT
SUSTAINABLE DEVELOPMENT PLAN ECONOMY AND SURFACE ACCESS
1 Office for National Statistics Regional Profiles: Economy – East Midlands, 2012.2 Office for National Statistics Regional Profiles: Economy – East Midlands, 2012.3 York Aviation LLP 2011.4 York Aviation LLP 2011.
05
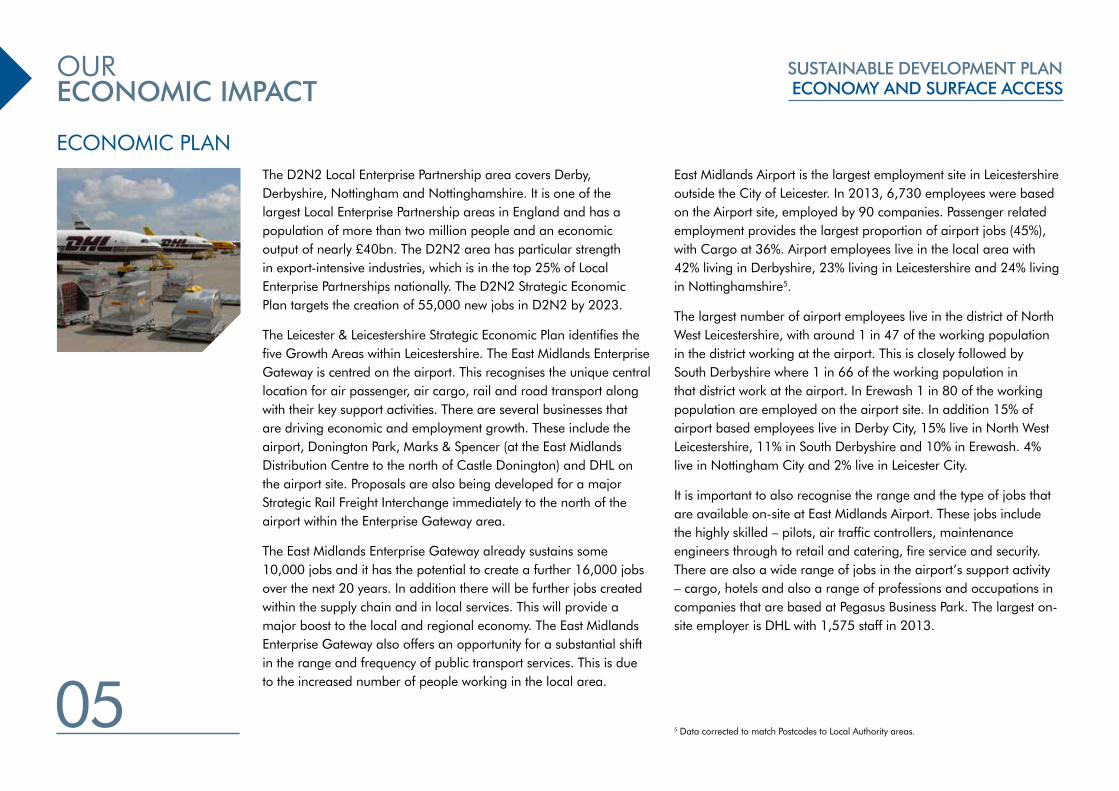
East Midlands Airport is the largest employment site in Leicestershire outside the City of Leicester. In 2013, 6,730 employees were based on the Airport site, employed by 90 companies. Passenger related employment provides the largest proportion of airport jobs (45%), with Cargo at 36%. Airport employees live in the local area with 42% living in Derbyshire, 23% living in Leicestershire and 24% living in Nottinghamshire5.
The largest number of airport employees live in the district of North West Leicestershire, with around 1 in 47 of the working population in the district working at the airport. This is closely followed by South Derbyshire where 1 in 66 of the working population in that district work at the airport. In Erewash 1 in 80 of the working population are employed on the airport site. In addition 15% of airport based employees live in Derby City, 15% live in North West Leicestershire, 11% in South Derbyshire and 10% in Erewash. 4% live in Nottingham City and 2% live in Leicester City.
It is important to also recognise the range and the type of jobs that are available on-site at East Midlands Airport. These jobs include the highly skilled – pilots, air traffic controllers, maintenance engineers through to retail and catering, fire service and security. There are also a wide range of jobs in the airport’s support activity – cargo, hotels and also a range of professions and occupations in companies that are based at Pegasus Business Park. The largest on-site employer is DHL with 1,575 staff in 2013.
The D2N2 Local Enterprise Partnership area covers Derby, Derbyshire, Nottingham and Nottinghamshire. It is one of the largest Local Enterprise Partnership areas in England and has a population of more than two million people and an economic output of nearly £40bn. The D2N2 area has particular strength in export-intensive industries, which is in the top 25% of Local Enterprise Partnerships nationally. The D2N2 Strategic Economic Plan targets the creation of 55,000 new jobs in D2N2 by 2023.
The Leicester & Leicestershire Strategic Economic Plan identifies the five Growth Areas within Leicestershire. The East Midlands Enterprise Gateway is centred on the airport. This recognises the unique central location for air passenger, air cargo, rail and road transport along with their key support activities. There are several businesses that are driving economic and employment growth. These include the airport, Donington Park, Marks & Spencer (at the East Midlands Distribution Centre to the north of Castle Donington) and DHL on the airport site. Proposals are also being developed for a major Strategic Rail Freight Interchange immediately to the north of the airport within the Enterprise Gateway area.
The East Midlands Enterprise Gateway already sustains some 10,000 jobs and it has the potential to create a further 16,000 jobs over the next 20 years. In addition there will be further jobs created within the supply chain and in local services. This will provide a major boost to the local and regional economy. The East Midlands Enterprise Gateway also offers an opportunity for a substantial shift in the range and frequency of public transport services. This is due to the increased number of people working in the local area.
ECONOMIC PLAN
OUR ECONOMIC IMPACT
SUSTAINABLE DEVELOPMENT PLAN ECONOMY AND SURFACE ACCESS
5 Data corrected to match Postcodes to Local Authority areas.

06
The airport provides an important stimulus to the local and the regional economy. The economic impacts of the airport can be categorised as:
• DIRECT EMPLOYMENT AND GVA – Employment and GVA that is wholly or largely related to the operation of the airport and generated within the Airport Operational Area or within the immediate vicinity. Businesses in this category include the Airport Company, airlines, handling agents, control authorities, cargo operators, hotels and on-site offices (including the Pegasus Business Park);
• INDIRECT EMPLOYMENT AND GVA – Employment and GVA that is generated in the chain of suppliers of goods and services to the direct businesses in the Operational Area. This may include utilities, retailing, advertising, cleaning, business services and construction; and
• INDUCED EMPLOYMENT AND GVA – Employment and GVA that is generated by the spending of incomes that have been earned in the direct and the indirect activities.
ECONOMIC PLAN
OUR ECONOMIC IMPACT
SUSTAINABLE DEVELOPMENT PLAN ECONOMY AND SURFACE ACCESS

07
The district of North West Leicestershire (in which the airport is located) has 25% of its workforce employed in distribution, transport and logistics. This is a substantial local strength compared with the national average of 9%.7.
UK air cargo grew rapidly during the 1980’s and 1990’s and has stabilised over the last 10 years. Overall the UK has more air freight imports than exports, with very little domestic freight. Mail is the principal domestic air cargo. The principal routes for air freight in and out of the UK are the trans-Atlantic routes to the United States and also routes to the major Asian economies. In the UK, express freight has grown over the last decade, both in total and as a proportion of air cargo and it is estimated that express freight represents 25% of the total UK air cargo market. The UK’s principal express freight airports are East Midlands Airport and London Stansted Airport.
There are a small number of express freight operators. These are global businesses, four of which have operations in the UK (DHL, FedEx, TNT and UPS). Between them they directly employ 38,000 people and indirectly support almost 82,000 UK jobs. They are responsible for over 95% of the UK’s daily international courier and express shipments8.
The express freight sector is important to the UK and it is estimated to contribute some £2.3bn to UK GDP (2010) and to enable £11bn of UK exports annually. Express services are used by a number of sectors of the economy but are used primarily to achieve the next-day delivery of goods and of documents, allowing UK businesses to compete in the global market. These services have to be provided by air. Next-day deliveries are part of ‘just-in-time’ production systems and reduce the high cost of warehousing and enable businesses to achieve rapid, time-definite delivery of high value goods and documents across the world. Although the value of export shipments by the express freight operators is substantial, they do underestimate the true value of the goods carried. This is because they can be, for example, essential spare parts for a manufacturing process with a sale price of a few hundred pounds but without the part, lost production could carry costs of thousands or millions of pounds.
REGIONAL ECONOMIC IMPACTResearch into the economic and social impact of the airport has shown that including indirect and induced impacts, East Midlands Airport generates some £239m of annual GVA in the region6.
OUR ECONOMIC IMPACT
SUSTAINABLE DEVELOPMENT PLAN ECONOMY AND SURFACE ACCESS
6 York Aviation. 2011.7 Leicester & Leicestershire Local Enterprise Partnership. 2013.8 Association of International Courier and Express Services (AICES) submission to the Airports
Commission – Discussion Paper 2: Aviation Connectivity and the Economy 2013.
Gross Value Added Impacts East Midlands Airport in the East Midlands Region
Direct On-Site £153m
Direct Off-Site £0
Direct Total £153m
Indirect £43m
Induced £43m
Regional Impact £239m

08
Maintaining a network of international connections is vital to UK business and to the UK economy. Surveys undertaken by Oxford Economics have shown that 80% of the UK businesses surveyed stated that their business would be badly affected if international next-day deliveries were no longer available9. UK businesses are more dependent on express services than those based in continental Europe. In part this is due to the UK’s success in attracting foreign inward investment and may also reflect the fact that the UK is an island. These businesses operate with international supply chains that also include just-in-time inventory systems. These processes rely heavily on express freight services. In their research Oxford Economics10 concluded that, should next-day delivery services not be available in the UK, then UK GDP would be reduced by £3bn annually. This is due to the disruption to the logistics network and the adverse effects on business investment.
As the express freight operators’ product is next-day or guaranteed delivery, in the UK packages are generally collected at the end of the business day for delivery early the following day. For this schedule to succeed, the main part of the delivery and transportation process needs to take place during the night. Night flights will always be vital to UK express freight services and this is provided at East Midlands Airport.
Connectivity and capacity is essential for the air cargo industry, in particular the express freight operations. In air freight terms, this connectivity is expressed as the ability to source and deliver goods in a manner that enables the UK operations to be competitive with their services elsewhere in Europe. This requires available airport runway capacity, a central geographic location, a full 24hr operation, good access to labour excellent surface access connections across the UK and land available for expansion. These key strengths are available at East Midlands Airport and are the reasons for the establishment of the express freight operations. These strengths at East Midlands Airport also provide a substantial opportunity for future growth.
The airport works to be a responsible and a considerate neighbour, carefully considering the needs of local communities whilst making a positive contribution to regional economic development. A proactive education and employment programme is in place and it will be developed to target the benefits of local employment and to support the education of the airport’s future workforce. The education programme with local schools focusses on work experience, particularly the world of work and the breadth of opportunities that are available. Further details of the airport’s community programme are included in the Community Plan, part of the Sustainable Development Plan.
REGIONAL ECONOMIC IMPACT
OUR ECONOMIC IMPACT
SUSTAINABLE DEVELOPMENT PLAN ECONOMY AND SURFACE ACCESS
9 The Economic Impact of Express Carriers in Europe: United Kingdom. Oxford Economics 2011.10 Response to the Department for Transport’s Night Flights Consultation. Oxford Economics 2013.
9
REGIONAL ECONOMIC IMPACT
OUR ECONOMIC IMPACT
SUSTAINABLE DEVELOPMENT PLAN ECONOMY AND SURFACE ACCESS
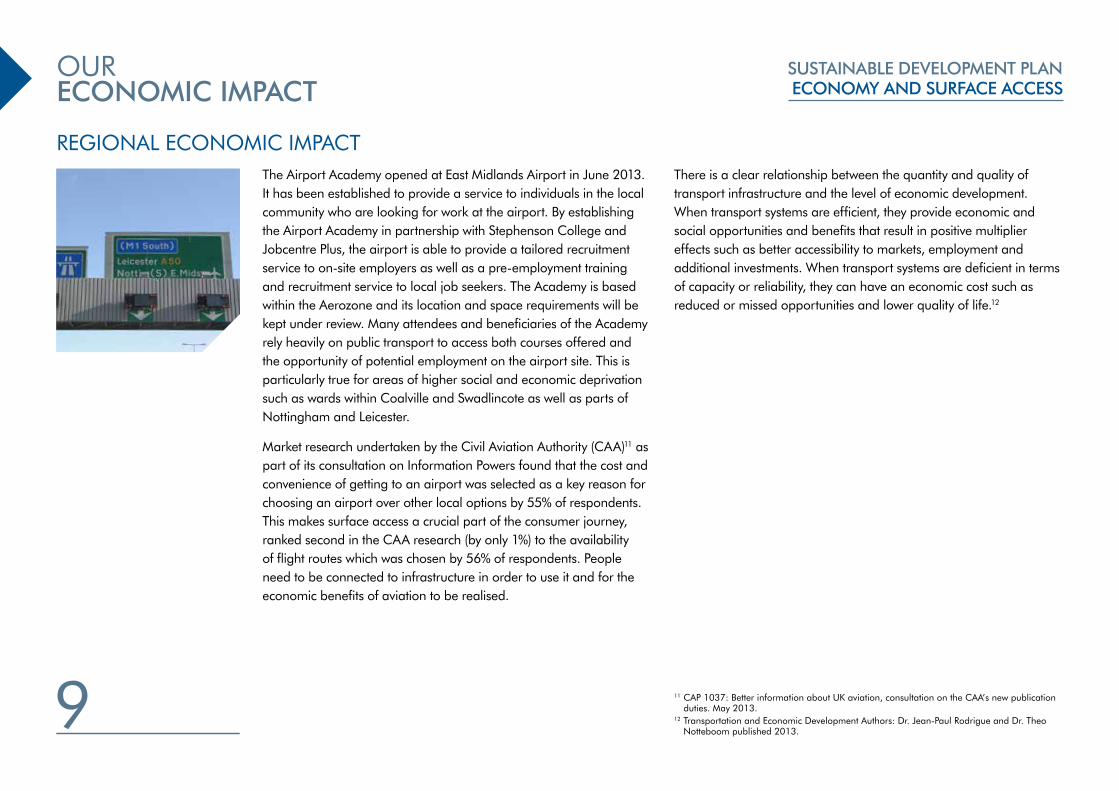
The Airport Academy opened at East Midlands Airport in June 2013. It has been established to provide a service to individuals in the local community who are looking for work at the airport. By establishing the Airport Academy in partnership with Stephenson College and Jobcentre Plus, the airport is able to provide a tailored recruitment service to on-site employers as well as a pre-employment training and recruitment service to local job seekers. The Academy is based within the Aerozone and its location and space requirements will be kept under review. Many attendees and beneficiaries of the Academy rely heavily on public transport to access both courses offered and the opportunity of potential employment on the airport site. This is particularly true for areas of higher social and economic deprivation such as wards within Coalville and Swadlincote as well as parts of Nottingham and Leicester.
Market research undertaken by the Civil Aviation Authority (CAA)11 as part of its consultation on Information Powers found that the cost and convenience of getting to an airport was selected as a key reason for choosing an airport over other local options by 55% of respondents. This makes surface access a crucial part of the consumer journey, ranked second in the CAA research (by only 1%) to the availability of flight routes which was chosen by 56% of respondents. People need to be connected to infrastructure in order to use it and for the economic benefits of aviation to be realised.
There is a clear relationship between the quantity and quality of transport infrastructure and the level of economic development. When transport systems are efficient, they provide economic and social opportunities and benefits that result in positive multiplier effects such as better accessibility to markets, employment and additional investments. When transport systems are deficient in terms of capacity or reliability, they can have an economic cost such as reduced or missed opportunities and lower quality of life.12
11 CAP 1037: Better information about UK aviation, consultation on the CAA’s new publication duties. May 2013.
12 Transportation and Economic Development Authors: Dr. Jean-Paul Rodrigue and Dr. Theo Notteboom published 2013.

10
REGIONAL ECONOMIC IMPACT
OUR ECONOMIC IMPACT
SUSTAINABLE DEVELOPMENT PLAN ECONOMY AND SURFACE ACCESS
The economic impacts of transportation can be direct, indirect or related:
• DIRECT IMPACTS (also known as induced) the outcome of accessibility changes where transport enables employment, added value, larger markets and enables to save time and costs.
• INDIRECT IMPACTS the outcome of the economic multiplier effects where the price of commodities, goods or services drop and/or their variety increases. Indirect value-added and jobs are the result of local purchases by companies directly dependent upon transport activity. Transport activities are responsible for a wide range of indirect value-added and employment effects, through the linkages of transport with other economic sectors (e.g. office supply firms, equipment and parts suppliers, maintenance and repair services, insurance companies, consulting and other business services).
• RELATED IMPACTS the outcome of economic activities and firms partly relying on efficient transport services for both passengers and freight. For instance, the steel industry requires cost efficient import of iron ore and coal for the blast furnaces and export activities for finished products such as steel booms and coils. Manufacturers and retail outlets and distribution centres handling imported containerized cargo rely on efficient transport and seaport operations.
Economies that possess greater mobility are often those with better opportunities to develop than those with scarce mobility. Reduced mobility impedes development while greater mobility is a catalyst for development. Mobility is therefore a reliable indicator of development.

11
The M&S Distribution Centre is part of the East Midlands Distribution Centre site just north of Castle Donington. There are expected to be around 1,400 employees at this site and at peak times of the year this could increase to 2,000, with two main shift times operating at 6am-2pm and 2pm-10pm.
Plot 2 of the East Midlands Distribution Centre (900,000 sq ft) at Castle Donington is now being promoted for logistics, dstribution and transport uses. The main access to the site would be similar to M&S with vehicles accessing from the A50 to the north.
A planning application for the Park Lane development at Castle Donington, comprising around 900 dwellings, primary school, public house, employment land and a western relief road (bypass) has been approved by North West Leicestershire District Council. When constructed, the bypass will connect with Back Lane to the north and Castle Donington Road to the south.
There do not appear to be any improvements proposed along the A453 or at J23A, J24 or J24A as part of this development. Local highway improvements are proposed towards Sawley Interchange on the A50 and a contribution proposed towards traffic management in Castle Donington.
The area immediately to the west of M1 J24 and north of the Airport has been identified as a potential Strategic Rail Freight Interchange and is a Transformational Priority in the Leicester & Leicestershire Enterprise Partnership’s Strategic Economic Plan. The promoter
Roxhill has developed and submitted plans to deliver this distribution centre with a rail terminal capable of providing up to 6 million sq ft of large scale warehousing on land immediately north of East Midlands Airport.
The development potentially includes an upgrade of the M1 Junction 24, improvements to the A50-M1 link and a new access junction off the A453 incorporating a Kegworth Bypass. The development would include a branch to the south off the Nottingham to Willington railway line. A planning application to the Planning Inspectorate was made in 2014. If it receives planning permission, the East Midlands Gateway has the potential to almost double the number of people working within the East Midlands Enterprise Gateway area. Around 6,000 employees are anticipated to be working at the Strategic Rail Freight Interchange once it is fully operational. Should consent be granted for the Strategic Rail Freight Interchange the increased volume of employment should provide an opportunity for more use of the existing public transport network as well as the potential for additional bus services.
OTHER DEVELOPMENTS IN THE ENTERPRISE GATEWAY AREA
OUR ECONOMIC IMPACT
SUSTAINABLE DEVELOPMENT PLAN ECONOMY AND SURFACE ACCESS

12
Good surface access is a key element in the decisions of airlines and their passengers to use a particular airport. It is also central to ensuring that employers based on the airport site have access to a diverse range of employees and that residents living in the towns and cities near the airport have access to jobs.
The Surface Access Plan seeks to manage the growth in airport-related road traffic in a responsible and in a sustainable way. This is because of:
• The need to manage emissions from airport-related road traffic – CO2 and emissions that contribute to local air quality;
• Increasing congestion on the strategic road network, particularly the M1 and the A42;
• Other major developments in the local area; and
• National and local policy to encourage travel by the most sustainable mode.
The Surface Access Plan has been reviewed and it sets out the airport’s proposals in more detail.
SURFACE ACCESS PLANEast Midlands Airport is committed to delivering a good quality and reliable transport infrastructure with improved sustainable travel choices for both passengers and site employees. It is intended to increase the efficiency of the business by combatting the effects of congestion around the airport and assist with the recruitment and retention of employment by making journeys to and from the airport easier, cheaper and more reliable.
OUR PLAN
SUSTAINABLE DEVELOPMENT PLAN ECONOMY AND SURFACE ACCESS
Given the airport’s rural location the private car will continue to be the primary mode of airport access. However the airport will continue to develop its Surface Access Plan to reduce levels of airport-generated road traffic (per passenger) and to continue to encourage and invest in the use of public transport as a mode of access. A number of local highway and public transport improvements are planned that could result in improved access to the airport.

13
MODE SHARE TARGETSMode share targets were set in the 2006 Master Plan. They were to reduce employee single occupancy car use to 70% by 2016 and to increase passenger access by public transport to 10% by 2016. These targets were in the context of passenger numbers growing to 10 million passengers per annum in this period, and a cargo throughput of 1.2 million tonnes being handled by the airport each year.
Although the passenger and cargo throughput levels are substantially behind those forecast in 2006, the airport is already very close to achieving the 2016 modal share targets, with employee single occupancy car use of 71% in 2012 and passenger modal share of 8% according to the CAA 2013 survey. However it is important to note that mode share for both passengers and employees has been fairly stable for the past few years, and that without a significant step change in the provision of public transport services, there are unlikely to be any substantial increases in mode share. However, it should be possible to achieve small incremental improvements in mode share particularly for the employment market should key initiatives be introduced that encourage a behavioural change.
The success of travel planning depends on capitalising on the benefits of economies of scale, more destinations and increased frequency.
EMPLOYEE MODAL SHAREFor the past 10 years the airport has conducted an annual Travel to Work survey in order to monitor progress against committed targets to improve sustainable mode share. Mode share has improved incrementally over this period and as the trend-line is very stable it was decided that these surveys would then take place every two years in future. In summer 2012 face to face field research was undertaken across the airport, interviewing 1,249 members of staff from across approximately 80 employers on the site, representing a statistically valid 20% response rate.
Of those interviewed, 30% came from Derbyshire, 25% from Leicestershire, 16% from Nottinghamshire and 2% from Staffordshire. In addition 9.3% live in Derby City and 8.8% live in Nottingham City.
The results of the 2012 survey showed a continuation of the stable trends over past years, with single occupancy car use of 71%. The target is 70% single occupancy car use. The sustainable modal share split is 9.4% bus use, 13.9% car share and 1.6% cycling.
SUSTAINABLE DEVELOPMENT PLAN ECONOMY AND SURFACE ACCESS
SURFACE ACCESS PLAN
OUR PLAN

14
EMA Passenger Modal Choice2003
40%
35%
30%
25%
20%
15%
10%
5%
0Private CarDropped off
Private CarParked
TaxiMinicab
Hire Car Local Bus NationalRegional Coach
Other
2012
EMA Passenger Modal Choice2003
40%
35%
30%
25%
20%
15%
10%
5%
0Private CarDropped off
Private CarParked
TaxiMinicab
Hire Car Local Bus NationalRegional Coach
Other
2012
EMA Passenger Modal Choice2003
40%
35%
30%
25%
20%
15%
10%
5%
0Private CarDropped off
Private CarParked
TaxiMinicab
Hire Car Local Bus NationalRegional Coach
Other
2012
EMA Passenger Modal Choice2003
40%
35%
30%
25%
20%
15%
10%
5%
0Private CarDropped off
Private CarParked
TaxiMinicab
Hire Car Local Bus NationalRegional Coach
Other
2012
EMA Passenger Modal Choice2003
40%
35%
30%
25%
20%
15%
10%
5%
0Private CarDropped off
Private CarParked
TaxiMinicab
Hire Car Local Bus NationalRegional Coach
Other
2012
EMA Passenger Modal Choice2003
40%
35%
30%
25%
20%
15%
10%
5%
0Private CarDropped off
Private CarParked
TaxiMinicab
Hire Car Local Bus NationalRegional Coach
Other
2012
EMA Passenger Modal Choice2003
40%
35%
30%
25%
20%
15%
10%
5%
0Private CarDropped off
Private CarParked
TaxiMinicab
Hire Car Local Bus NationalRegional Coach
Other
2012
EMA Passenger Modal Choice2003
40%
35%
30%
25%
20%
15%
10%
5%
0Private CarDropped off
Private CarParked
TaxiMinicab
Hire Car Local Bus NationalRegional Coach
Other
2012
EMA Passenger Modal Choice2003
40%
35%
30%
25%
20%
15%
10%
5%
0Private CarDropped off
Private CarParked
TaxiMinicab
Hire Car Local Bus NationalRegional Coach
Other
2012
EMA Passenger Modal Choice2003
40%
35%
30%
25%
20%
15%
10%
5%
0Private CarDropped off
Private CarParked
TaxiMinicab
Hire Car Local Bus NationalRegional Coach
Other
2012
EMA Passenger Modal Choice2003
40%
35%
30%
25%
20%
15%
10%
5%
0Private CarDropped off
Private CarParked
TaxiMinicab
Hire Car Local Bus NationalRegional Coach
Other
2012
90%
Car Sharer Car (Driver Only)
Bus Taxi Bicycle On Foot Motorcycle/Scooter
Train Van Other Not Stated
80%
70%
60%
50%
40%
30%
20%
10%
0%
2008 – 2052 responses2009 – 1179 responses2010 – 2581 responses2012 – 1249 responses
EMPLOYEE MODE OF TRANSPORT USED TO TRAVEL TO WORK BETWEEN 2008 AND 2012
OUR PLAN
SUSTAINABLE DEVELOPMENT PLAN ECONOMY AND SURFACE ACCESS
Car Sharer Car (Driver Only) Bus Taxi Bicycle On Foot Motorcycle/
Scooter Train Van Other Not Stated
2008 13.1% 73.2% 11.5% 0.2% 0.7% 0.1% 1.2% 0.0% 0.0% 0.0% 0.0%
2009 9.1% 77.3% 8.0% 0.2% 1.9% 0.2% 1.9% 0.5% 0.0% 0.4% 0.4%
2010 12.9% 71.5% 10.2% 0.1% 2.0% 0.4% 2.1% 0.2% 0.5% 0.1% 0.0%
2012 13.9% 71.0% 9.4% 0.2% 1.6% 0.5% 2.6% 0.0% 0.0% 0.9% 0.0%
SURFACE ACCESS PLAN

15
When looking at trends over a longer period of time it is clear that despite ups and downs which can be attributable to statistical anomalies, economic highs and lows, and changing employment trends, there is a definite improvement in the number of employees using sustainable modes of travel over the decade. Single car occupancy has declined from 79% in 1999 to 71% in 2012, which means a related growth in sustainable travel modes from 21% in 1999 to 29% in 2012. In particular bus usage has shown a dramatic improvement, rising from around 3% in 1999 to around 10% in 2012.
Car sharing has stayed broadly the same with around a 13% take-up rate across the decade and cycling remains below 2% of total modal share. However when looked at terms of numbers of commuters rather than in percentage terms, the growth is more significant, as employment numbers have grown from 5,266 employees in 1999 to 6,730 employees in 2013.
This means also that in real terms cycling has increased from around 74 commuters to around 107 commuters. Bus users have increased from around 174 to around 633, and car sharers have increased from around 700 to around 935. This means that on an average working day, there are around 1,200 less cars on the road twice a day than if the airport was not actively promoting and encouraging sustainable travel.
These improvements, particularly in bus mode share, have been as a result of the implementation of a clear strategy of improving bus services to ensure that they are fit for purpose for both employees and passengers at the airport, as well as ensuring a high quality of product quality, reliability and marketing.
The airport has achieved these results through the very strong partnerships that it has built over the past decade with local authorities, transport providers, funding agencies and the members of the Transport Forum.
Whilst mode share has levelled-off over the past few years, it is important to keep promoting the services that have been developed. The advances made over the past decade, as well as modest growth in sustainable mode share, are achievable through ongoing promotion and marketing, as well as the implementation of initiatives that continue to encourage behavioural change. Such initiatives include offering interest-free loans for employees to purchase annual bus tickets and finding ways to reward employees financially for not using their car parking space. The real cost of providing car parking (maintenance, lighting, security, rates and taxes etc.) is estimated to be around £800 a year and by not using a staff car parking space, land is freed up for other uses such as passenger car parking. It is proposed to incentivise non-car use by ‘sharing the savings’ with employees, giving a real incentive to leave their car at home.
Significant growth in mode share will only be possible in the event that there are real improvements to the public transport network, which may be achieved through improvements proposed by local developments taking place near the airport. The airport will continue to build on the strong partnerships that already exist as well as developing partnerships with new employers in the area to ensure that the benefits of an increased number of businesses and employees in the area can fully contribute to improved public transport services.
OUR PLAN
SUSTAINABLE DEVELOPMENT PLAN ECONOMY AND SURFACE ACCESS
SURFACE ACCESS PLAN
16
TARGETS
OUR PLAN
SUSTAINABLE DEVELOPMENT PLAN ECONOMY AND SURFACE ACCESS
SURFACE ACCESS PLAN
EMPLOYEE MODE SHARE• Should there be significant improvements in bus
routes, frequencies and operating hours, it may be possible to achieve an employee mode share of 65% Single Occupancy Car use by the time a passenger throughput of 10 million passengers is reached. Key partners have agreed that the sustainable travel targets are challenging, however such targets will be reviewed every 5 years by the airport’s Transport Forum. Should they be met earlier than forecast, further stretching targets would be set.
• However should developments in the public transport network not take place, it will still be possible to achieve modest growth in sustainable modal share, by implementing initiatives that would encourage behavioural change.

17
TARGETS
PASSENGER MODE-SHAREGood progress has also been made towards achieving the target for passenger mode share. Every three or four years the CAA (Civil Aviation Authority) independently carries out surveys of the airport’s passengers in a number of areas including mode of access to the airport.
The following table and chart use this CAA survey data to show progress made towards achieving the target of 10% of passengers using a mode other than a car. The period between 2003 and 2015 has seen significant improvements in bus services and enhanced rail connections. As a result we have seen a sharp increase in passenger sustainable mode share, with use of local bus services increasing from around 2% to 8%. Sustainable surface access currently reduces passenger CO2 emissions by 1,200 tonnes in absolute terms compared with what it would be if those passengers making use of public transport had travelled by car. If all passengers had made use of sustainable transport options, there would have been a reduction of 11,200 tonnes of CO2, or 35.8%. The airport’s direct CO2 emissions are reported annually in the M.A.G Corporate Social Responsibility Report.
Whilst a significant improvement in mode share has been achieved over the past 10 years, it would appear that growth in sustainable modes for passengers has levelled off following initial increases established as a result of the significant investment in 24/7 bus services.
Significant growth in mode share will only be possible in the event that there are real improvements to the public transport network, which may be achieved through improvements proposed by local developments taking place near the airport.
OUR PLAN
SUSTAINABLE DEVELOPMENT PLAN ECONOMY AND SURFACE ACCESS
SURFACE ACCESS PLAN
PASSENGER MODE SHARE• Should significant improvements in bus routes,
frequencies and operating hours be achieved, it may be possible to achieve a modal share of 15% public transport use by airport passengers. We will remain committed to developing public transport services to the airport and will work to achieve these higher levels of public transport usage. Key partners have agreed that our public transport targets are challenging, however such targets will be reviewed every 5 years by the Airport’s Transport Forum. Should they be met earlier than forecast, further stretching targets will be set.
• In addition to monitoring public transport usage to East Midlands Airport, we will continue to report against these objectives at the Airport Transport Forum and to our Independent Consultative Committee. We will also report progress towards meeting our targets to key stakeholders through the annual East Midlands Airport Community Investment Report and the M.A.G Corporate Social Responsibility report. In addition the airport will report every two years on the delivery of the Sustainable Development Plan.

18
EMA Passenger Modal Choice2003
40%
35%
30%
25%
20%
15%
10%
5%
0Private CarDropped off
Private CarParked
TaxiMinicab
Hire Car Local Bus NationalRegional Coach
Other
2013
It is encouraging to note that the ‘private car dropped off’ mode has decreased slightly from 36% to 33% over the past decade. While sustainable modes of travel may not be possible or convenient for all passengers, passengers are encouraged to park rather than be dropped off, as every parked car creates two journeys, while passengers dropped off and then picked up create four journeys.
This trend is likely to be as a result of economic factors, as passengers become more cost conscious and ask for favours from friends and family rather than pay for car parking.
PASSENGER MODAL CHOICE GRAPH
OUR PLAN
SUSTAINABLE DEVELOPMENT PLAN ECONOMY AND SURFACE ACCESS
2003
2013
SURFACE ACCESS PLAN

19
PARTNERSHIP WORKINGEast Midlands Airport has built up strong partnerships over the past decade with a number of partners including local authorities, transport operators, travel and transport groups, and it is through these partnerships that we have delivered many of the improvements seen over the past decade. The airport will continue to work in partnership with others through its Transport Forum and other forums to where possible increase opportunities for improving the public transport network and infrastructure. The airport is also represented on the Leicester and Leicestershire Transport Advisors Group – the advisory group to the LLTEG (Leicester and Leicestershire Transport Executive Group) who advise the Leicester and Leicestershire Transport Board who have responsibilities for identifying potential measures for transport investment and distributing funding for major schemes.
Local Enterprise Partnerships have become increasingly important in recent years and we will continue to work with them to deliver high levels of accessibility and access to employment.
The airport will continue to work closely with Highways England and its management subcontractors as well as local highway authorities, in particular Leicestershire County Council who manage the roads nearest the airport.
We will continue to build working relationships and partnerships with other large employers within the East Midlands Enterprise Gateway area. Relationships have already been forged with the new M&S Distribution Centre. Working together will mean that we are jointly able to capitalise on the critical mass that so many large employers in one geographic area can bring. The proposed Castle Donington Park Lane development includes a proposal for a half-hourly hopper bus service between Castle Donington and the airport.
Other working relationships will continue to be built with other planned developments in the East Midlands Enterprise Gateway area, such as the East Midlands Gateway Rail Freight Interchange and further development of the East Midlands Distribution Centre in Castle Donington. This work could lead to improvements in the local network of bus services. Should these developments take place it is likely that there will be an improved frequency of services, enhancements to the operating hours of some services such as the route to Coalville, and the development of new routes, potentially to Ilkeston, Clifton, Burton upon Trent, Swadlincote and Ashby-de-la-Zouch.
OUR PLAN
SUSTAINABLE DEVELOPMENT PLAN ECONOMY AND SURFACE ACCESS
SURFACE ACCESS PLAN

20
ROADThe section of the M1 between Junction 23 and Junction 25, and particularly around Junction 24 is of strategic importance to the region and should be considered a high priority for future infrastructure investment. It is essential that the growth of the airport and surrounding developments on the strategic highway network is fully taken into account.
Airport road traffic is a relatively small percentage of the overall traffic on the local road network and the adjacent motorway, particularly at peak times. The airport’s traffic tends to be spread during the day rather than concentrated at peak times, and while in total the Airport’s traffic volumes may be large, they do not contribute a large proportion of traffic during the peak hours in future plans.
A study in 2013 undertaken by independent consultants Arup showed that in April 2013 the average total number of vehicles recorded entering and leaving the airport site (all three entrances averaged over 5 days) was 1,674 in the morning peak hour and 1,598 in the evening peak hour. By comparison, surveys carried out in September 2003 showed that the average total number of vehicles recorded entering and leaving the airport site (all three
entrances) was 1,963 in the morning peak hour and 2,282 in the evening peak hour.
Because September sees around 20% more passengers than April, the adjusted 2013 trips were 1,561 in the morning peak hour and 1,815 in the evening peak hour.
The local road network in the immediate vicinity to the airport (A453 and M1 Junction 23A) currently has the capability to support growth in the airport’s passenger and freight throughput. However it is essential that the cumulative impact of airport and surrounding development on the strategic network is fully taken into account. As part of its efforts to reduce its impact on the strategic road network, and to mitigate the effects of future growth on the network, the airport has invested heavily over the past decade into significant improvements to the public transport network serving the site. The airport has contributed over £2,4 million in bus subsidies to build up the network of bus services that operate to its site, and has attracted nearly as much again in partner investment and funding bids, bringing the total invested in the network to just under £5 million over a ten year period.
OUR PLAN
SUSTAINABLE DEVELOPMENT PLAN ECONOMY AND SURFACE ACCESS
SURFACE ACCESS PLANThe Airport has excellent road links with access off the A453, and M1 Junctions 23A and 24, which provide direct connections to the M1 and A42 (M42). The airport is also very close to the A453 to Nottingham, the A50 and A52.

21
Across the wider network, the M1 is congested during the peak hours, particularly at and to the north of Junction 24. Traffic count data for 2013 indicates that peak traffic flows on the A453 Ashby Road at the airport entrance are broadly similar to flows a decade ago. According to work undertaken by consultants Arup in 2013 the following observations and judgements were made.
• Traffic flows on the A453 Ashby Road are likely to be within available link capacity at peak times. The DHL Roundabout, the airport’s main access junction and Pegasus roundabout are likely to be operating without significant delays.
• Traffic data for the M1 corridor indicates the following. – South of J23A – peak hour one way traffic flows are up to 4,200 (within the 3 lane capacity)
– Between J23A and J24 – peak hour one way traffic flows are up to 5,500 (within the 4 lane capacity)
• North of J24 – peak hour one way traffic flows are 5,200 (equal to the 3 lane capacity)
• Junction 23A experiences some delays at peak times
• Junction 24 of the M1 experiences congestion at peak times, and Highways England recognises that there are no further improvements that are possible within the existing junction constraints
• Junction 24A of the M1 experiences congestion at peak times, in part due to queuing on the A50 blocking back from Junction 24.
The traffic impact of future developments in the East Midlands Enterprise Gateway area will need to be fully considered as part of the planning and development process.
Given the time-critical nature of the type of freight being moved to and from the airport, there is a strong dependency by the cargo carriers on the reliability of journey times on the strategic network. The airport works very closely with Highways England, their maintenance contractors and the local highway authorities to ensure that overnight closures of key roads due to essential maintenance works are minimised as much as possible. Route diversions caused by overnight road closures can have a detrimental effect on the freight integrators’ ability to meet their contracted delivery times and adversely impact upon their and their client’s businesses. Route diversions caused by overnight road closures can have a very detrimental effect on the freight integrators’ ability to meet their contracted delivery times and adversely impact upon their and their client’s businesses.
OUR PLAN
SUSTAINABLE DEVELOPMENT PLAN ECONOMY AND SURFACE ACCESS
SURFACE ACCESS PLAN

22
SUSTAINABLE DEVELOPMENT PLAN ECONOMY AND SURFACE ACCESS
OUR PLAN
ROAD – FUTURE DEVELOPMENTSThe widening of the A453 between the M1 Junction 24 and the A52 at Nottingham to a dual carriageway standard is to be completed in spring 2015. It will improve journey times and reliability to East Midlands Parkway and to Nottingham City Centre. However, the works do not include any improvement to M1 J24 other than widening on the entry and exit of the A453 from Nottingham.
M1 J24 is a key junction on the M1 as it links the A50 and A453 trunk roads as well as the A6. The A50 links the M6 and M1 and provides a strategic link to the Derby sub-region. The A453 provides a strategic link to Nottingham. The M1 junction also serves East Midlands Airport. Junction 24 suffers from severe congestion during both morning and evening peak periods on all approach arms. This will be further exacerbated by the A453 widening scheme and is currently a constraint to development in the area. Highways England and its local authority partners consider that existing traffic congestion at M1 J24 is a constraint on development and there is a strong support from Leicester and Leicestershire Local Enterprise Partnership for improvements to address this issue.
In 2012 Highways England announced a number of road improvement schemes as part of the national Pinch Point Programme to remove bottlenecks on motorways and major A roads. The Pinch Point Programme forms part of the UK Government’s growth initiative. The schemes included the M1 Junction 24. This scheme has been designed to tackle congestion by changing the way traffic on the A50 eastbound enters the M1 southbound. A new carriageway has been created through the junction, removing traffic travelling from the A50 to the M1
southbound from the circulatory carriageway and redirecting this traffic to the on-slip at M1 Junction 23A via the A453 to the south of the junction.
The scheme focuses on addressing immediate problems at the junction as well as supporting economic growth in the Derby and Nottingham sub-regions in the short – medium term. Investment in local highway works will assist the operation of the highway network and improve journey times and reliability for vehicles accessing the Airport.
Highways England are preparing a series of regional route-based strategies which will inform longer term investment beyond 2015. These are intended to provide a smarter approach to future highway improvement schemes and Highways England’s investment planning. The work being undertaken will identify operational, maintenance and improvement priorities, and will inform a new Roads Investment Strategy for the periods 2015 to 2021 and then beyond 2021. The aim of the strategy is to deliver the required network performance, whilst helping to facilitate local economic growth. It will be informed by evidence from local stakeholders and road user groups, with a total of 18 routes covering the whole network. The route-based strategies for the M1 and the North and East Midlands identify existing and future performance or capacity issues along with the key future improvement opportunities. The key priorities will inform a new Roads Investment Strategy in 2015. The Airport will continue to work with Highways England and other transport authorities to develop solutions that continue to provide excellent access to East Midlands Airport.
SURFACE ACCESS PLAN

23
As part of the wider network improvements taking place, a strategic review of Airport signing on the highway network is to be promoted. We will work closely with Highways England and local highways authorities to ensure that the airport is well signposted on the strategic road network and in the local area.
INTERNAL ROAD NETWORKThere is also an internal road network within the airport site that provides access to the cargo areas, the maintenance zone, the Central Passenger Zone and the Pegasus Business Park. The internal road network also serves the airport’s passenger and staff car parks. As the airport develops, the internal road network will be improved to ensure the free flow of vehicles around the site. Facilities for pedestrians and cyclists will also be improved.
SUSTAINABLE DEVELOPMENT PLAN ECONOMY AND SURFACE ACCESS
OUR PLAN
SURFACE ACCESS PLAN

24
1,800,000
1,600,000
1,400,000
1,200,000
1,000,000
800,000
600,000
400,000
200,000
2,000,000
004-05 12-1311-1210-1109-1008-0907-0806-0705-06 13-14
SKYLINK PASSENGER NUMBERS 2004-14
Bus and train information
pick up a timetable for your specific route or onward journey
Arrivals Coach Park
Dep
artu
res A
B.D.P
B.D.P
B C D
Car Park
All services operate on Bank Holidays, excluding Christmas Day, Boxing Day.
Every 20 minutes
Every 30 minutes
Every 60 minutes
Train Station
P re-booked shuttle service
5 minute walk to train station
1-2 minute walk
Bus d rop off pointB.D.P
Car Park Coaching B
Airlink 155 - Coalville, Castle Donington,National Express and hotel shuttles
A
skylink - Leicester, LoughboroughD
skylink - Nottingham, Derby, Long EatonC
Derby Train StationNottinghamTrain Station
Alvaston
Kegworth
Sutton Bonington
Hathern
Shardlow
Castle Donington
Diseworth
Long Whatton
Long EatonTrain Station
East MidlandsParkway
Long Eaton Green
Sawley
BeestonTrain Station
Queen’s Medical Centre
Nottingham Broadmarsh
Nottingham Friar Lane
Derby Bus Station
Loughborough
Leicester
Coalville
Direct trains to Chesterfield,Sheffield, Leeds and Birmingham
Direct trainsto Lincoln
Direct trains to London and the southRoute map key
SUSTAINABLE DEVELOPMENT PLAN ECONOMY AND SURFACE ACCESS
OUR PLAN
For over a decade the airport has been very active in developing and heavily investing in public transport to and from its neighbouring cities of Derby, Leicester and Nottingham, the towns of Loughborough and Long Eaton and villages including Castle Donington, Kegworth and Diseworth to the airport, helping both passengers and staff with their travel needs.
BUSThe airport has attracted a total investment of around £4.9 million to develop high quality, frequent buses that operate 24-hours a day, 7 days a week. Of this investment over £2.4 million has been directly funded by the airport, with the remainder being made up by funding bids into the development agency as well as a Department for Transport Kickstart funding bid, with match funding from partners including Nottingham City Council, Derby City Council and Leicestershire County Council.
Usage and popularity of the Skylink network has grown over the decade from around 200,000 bus users in 2004 to over 1.7 million passengers in 2013/14.
SURFACE ACCESS PLAN

25
It is recognised that whilst in the long term it is necessary for public transport services to the airport to be commercially viable, it is often necessary to provide the seed funding necessary to allow new routes or improvements to become established. There has been a long-standing policy of ‘pump-priming’ bus services, which over the past decade have gradually become more commercial, with the majority of the network now operating on an entirely commercial basis.
The two main markets for the Skylink services have historically been airline passengers and employees, although it is important to recognise that over recent years local commuting has formed an important part of the bus network passenger makeup. Local use is now the key to the commercial success of the network and the services no longer rely solely on ‘end to end’ users as they operate along more densely populated routes, serving many local commuting needs.
Each year a survey of bus users is undertaken, which provides valuable information about the nature of trips made and the quality of the service and customer satisfaction. This survey demonstrates that as the services have grown, airport use, whilst growing in numbers, has proportionally declined as ‘local use’ has become more dominant.
A decade ago, local villages near the airport had only a handful of bus services operating hourly between 7am and 7pm. Without the airport acting as the catalyst for the development of high quality bus services operating 24 hours a day, 7 days a week, it would never have been financially viable for such services to launched. Both local users and airport users in isolation would not have been sufficient to sustain such high quality services, but together the two very different user groups support the commercial viability of the service.
SUSTAINABLE DEVELOPMENT PLAN ECONOMY AND SURFACE ACCESS
OUR PLAN
NOTTINGHAM SKYLINK
DERBY/LEICESTER SKYLINK
Travelling along the route 69%
Travelling along the route 77%
Catching a flight/just landed 14%
Catching a flight/just landed 6%
Travelling to/from work at airport 14%
Travelling to/from work at airport 16%
Other 3%
Other 1%
SURFACE ACCESS PLAN

26
The bus user survey also shows just how important the bus network is for airport users, with 84% of bus passengers using the services to get to the airport for work having no access to a car, and an average of 60% of passengers accessing the airport for flights that would otherwise have no other way of accessing the site.
The East Midlands is the only region where the average number of cars and vans per household has remained the same between 2001 and 2011. According to the 2011 Census, Nottingham has one of the largest proportions of car-free households outside of London at 44%. Leicester is not far behind with 37% and in Derby there are 29% of households with no car or van. The more rural parts of the region have higher car ownership, and for Derbyshire, Nottinghamshire and Leicestershire the figures are between 15-20% of households with no car or van. Because people do not own cars does not mean that they do not wish to be economically active and it is therefore essential that ways are provided to make sure these populations have access to the airport both as passengers and for work.
The survey also shows that there is a consistently high level of satisfaction with both Skylink services, with 96% of Skylink Nottingham/Long Eaton passengers and 93% of Skylink Derby/Leicester passengers rating the services as ‘good’ or ‘excellent’. In addition 92% of passengers responded that they will use the service again. 91% of Nottingham/Long Eaton Skylink passengers found that it followed a convenient route: it suited 94% of local travellers and 82% of those accessing the airport. This is reassuring given that the route was changed in 2012, significantly reducing the subsidy required to operate the service, but also adding additional journey time to the route. Nine out of ten of Derby/Leicester Skylink passengers described the route as convenient – it suited local and airport travellers equally.
A significant amount of work has gone into promoting and publicising the Skylink network of services since they were launched. All transport services to the airport are now marketed as an integrated ‘family’, which offer uniformly high standards of service and provide an instantly recognisable product for the traveller. It was towards this aim that in 2007 the Airline Shuttle was rebranded following the replacement of the bus fleet with brand new vehicles and a 24-hour timetable, bringing it into the Skylink family of services and enabling a more streamlined marketing approach. Marketing spend can be concentrated more effectively on regional Skylink campaigns that benefit all services. The Skylink family ticket is a good example of how the services have benefited from the streamlined marketing approach with the Skylink branding across the main bus services. In addition ongoing relationship building takes place with around 90 employers on the airport site, providing the channel for direct marketing with around 6,700 employees. Regular marketing of bus services to employees includes posters, leaflets, emails as well as roadside publicity at onsite bus stops.
There are currently around 9% of employees on site who use the bus, and according to our most recent Travel to Work survey (2012) a further 17.8% of respondents say they could consider using the bus, showing the potential for further modal change improvements. However such improvements may involve enhancements to services such as new routes, cheaper fares and enhanced frequency.
SUSTAINABLE DEVELOPMENT PLAN ECONOMY AND SURFACE ACCESS
OUR PLAN
SURFACE ACCESS PLAN

27
BUS – FUTURE DEVELOPMENTThe public transport network serving East Midlands Airport has seen a number of incremental improvements over recent years including fleet renewals, the introduction of free WiFi on board the buses, and increased frequencies. In the early part of 2014 the Nottingham/Long Eaton Skylink saw further frequency enhancements, with core hours increasing from half-hourly to every 20 minutes. The Derby/Leicester Skylink followed shortly after, increasing its frequency to every 20 minutes in September 2014. It is realistic to believe that as passenger numbers grow, the bus operator will continue to have confidence in ongoing incremental enhancements as they become commercially viable.
Options for new bus links to the airport have been explored in recent years but will be challenging with the current passenger and staff numbers. Potential funding streams and partners have also been reduced by Government spending cuts. This is unlikely to change in the short and medium term. Over the short term, increasing bus usage is likely to be confined to encouragement of its use through Travel Plan initiatives.
In the medium term (5-10 years) as the economy enters a period of growth, and as business at the airport grows, there would be opportunities to look at increased frequency/operating hours or extensions of existing services and to investigate options for new bus routes. The airport is committed to continue to invest in public transport.
Employment catchment areas such as Coalville (who currently only have a day-time service) and Ilkeston, both of which have larger than average indices of social deprivation and unemployment will be of high priority for airport bus service development. This would complement work in partnership with the Airport Academy, Job Centre Plus, local authorities and other agencies to provide access to jobs.
SUSTAINABLE DEVELOPMENT PLAN ECONOMY AND SURFACE ACCESS
OUR PLAN
SURFACE ACCESS PLAN

28
TARGETS TARGETS
SUSTAINABLE DEVELOPMENT PLAN ECONOMY AND SURFACE ACCESS
OUR PLAN
SURFACE ACCESS PLAN
BUSThe following targets for bus routes and improvements have been identified as being of highest importance for both employment catchment and passenger access. As the airport grows, and should the economic conditions be such that improvements to the network show sufficient signs of becoming commercially viable or pump-priming funds become available then growth in public transport use can be generated. The enhancements below should be seen as a ‘wish-list’ however the airport is committed to improving public transport to its site and will continue to work to deliver these aspirations:
• Increase in frequency for Derby, Nottingham, Leicester, Loughborough and Long Eaton;
• Airport to Ilkeston via an extension of the No 15;
• Airport to Coalville via Shepshed – increase in operational hours to include 3-4am start and midnight finish;
• Airport to Ashby-de-la-Zouch with extension to Swadlincote and Burton-upon-Trent;
• Airport to Clifton Park and Ride via East Midlands Parkway and Kegworth. Bus links to East Midlands Parkway should be routed via Kegworth to maximise Kegworth’s connections to rail and in particular to Nottingham;
• Coach links to Birmingham; and
• Other areas that should be explored as employment numbers at the airport and surrounding employment sites increase or funding becomes available include (but not limited to) East Leake, Gotham, Melbourne and Heanor.
29
SUSTAINABLE DEVELOPMENT PLAN ECONOMY AND SURFACE ACCESS
OUR PLAN
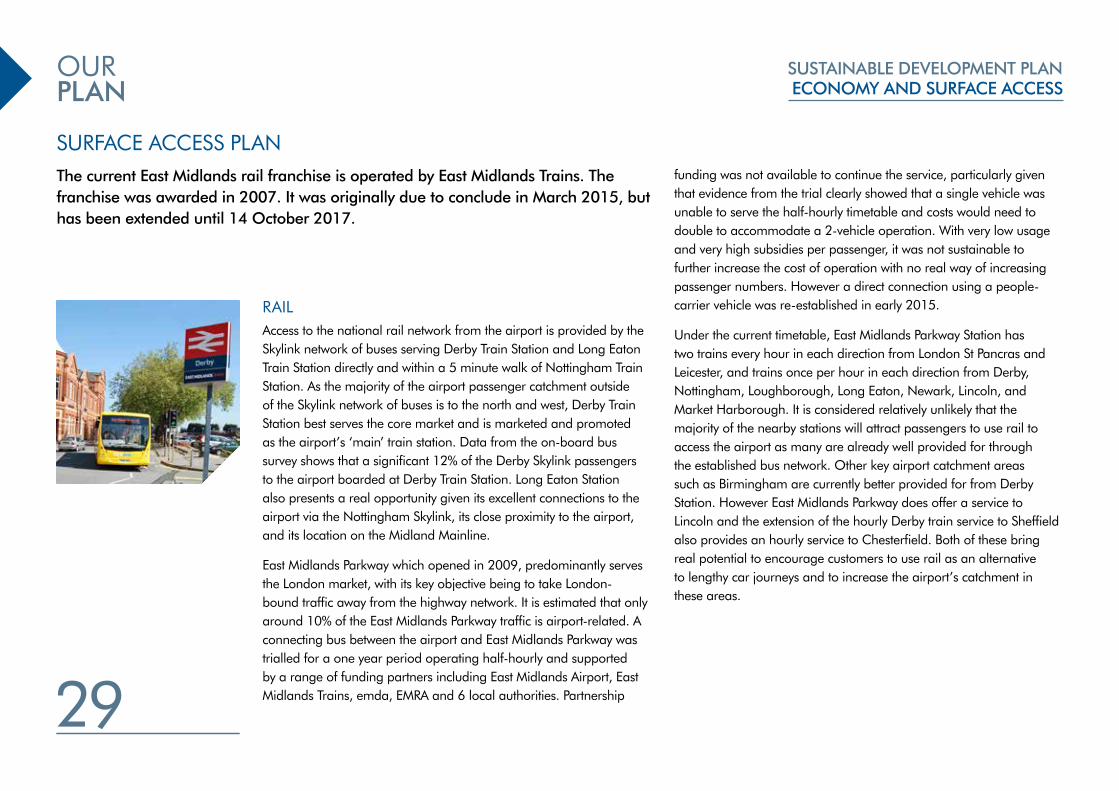
The current East Midlands rail franchise is operated by East Midlands Trains. The franchise was awarded in 2007. It was originally due to conclude in March 2015, but has been extended until 14 October 2017.
RAILAccess to the national rail network from the airport is provided by the Skylink network of buses serving Derby Train Station and Long Eaton Train Station directly and within a 5 minute walk of Nottingham Train Station. As the majority of the airport passenger catchment outside of the Skylink network of buses is to the north and west, Derby Train Station best serves the core market and is marketed and promoted as the airport’s ‘main’ train station. Data from the on-board bus survey shows that a significant 12% of the Derby Skylink passengers to the airport boarded at Derby Train Station. Long Eaton Station also presents a real opportunity given its excellent connections to the airport via the Nottingham Skylink, its close proximity to the airport, and its location on the Midland Mainline.
East Midlands Parkway which opened in 2009, predominantly serves the London market, with its key objective being to take London-bound traffic away from the highway network. It is estimated that only around 10% of the East Midlands Parkway traffic is airport-related. A connecting bus between the airport and East Midlands Parkway was trialled for a one year period operating half-hourly and supported by a range of funding partners including East Midlands Airport, East Midlands Trains, emda, EMRA and 6 local authorities. Partnership
funding was not available to continue the service, particularly given that evidence from the trial clearly showed that a single vehicle was unable to serve the half-hourly timetable and costs would need to double to accommodate a 2-vehicle operation. With very low usage and very high subsidies per passenger, it was not sustainable to further increase the cost of operation with no real way of increasing passenger numbers. However a direct connection using a people-carrier vehicle was re-established in early 2015.
Under the current timetable, East Midlands Parkway Station has two trains every hour in each direction from London St Pancras and Leicester, and trains once per hour in each direction from Derby, Nottingham, Loughborough, Long Eaton, Newark, Lincoln, and Market Harborough. It is considered relatively unlikely that the majority of the nearby stations will attract passengers to use rail to access the airport as many are already well provided for through the established bus network. Other key airport catchment areas such as Birmingham are currently better provided for from Derby Station. However East Midlands Parkway does offer a service to Lincoln and the extension of the hourly Derby train service to Sheffield also provides an hourly service to Chesterfield. Both of these bring real potential to encourage customers to use rail as an alternative to lengthy car journeys and to increase the airport’s catchment in these areas.
SURFACE ACCESS PLAN

30
RAIL – FUTURE DEVELOPMENTSThe Airport will continue to work with train operators and Network Rail in the future to encourage better use of East Midlands Parkway Station in order to maximise usage and increase the number and destinations of trains serving the station.
Rail commitments to the electrification of the Midland Mainline as well as speed improvements along the line are expected to provide faster journey times and more capacity for rail services. This should also allow for better stopping patterns at East Midlands Parkway for the current Nottingham, Derby and Sheffield trains, and should free up capacity to allow other trains currently not stopping at the station to schedule a stop.
The route between London St Pancras and Bedford can already run electric trains and the new investment will mean older diesel engines will be replaced with electric services to Kettering, Corby, Leicester, Nottingham and Derby before heading north to Sheffield. The improvement will bring faster journey times, longer trains and slightly more capacity, with the possibility of one additional service in each direction. The timetable for completion is 2019.
Network Rail is undertaking preparatory and consultative work to inform their long-term Route Strategy programme. The strategy will inform choices for funders to 2023 and also set out a long-term vision to 2043. It will also be aligned with the Department for Transport’s franchising programme. The East Midlands Route Strategy is expected to be published in early 2015. The airport will work with Network Rail on this study.
There is no direct rail link to East Midlands Airport and no likelihood of one being provided in the foreseeable future. In 2006 the airport committed to investigating the future need for a fixed link between the new East Midlands Parkway Station and the Airport, and in 2008 a study was commissioned in partnership with the East Midlands Development Agency, the East Midlands Regional Assembly and Highways England, and a Steering Group was formed to guide the study. It was concluded that the most effective way of linking the airport to inter-city train services in the medium and long term is to provide a bus-based transit system from the East Midlands Parkway Station, running along the A453. Fixed link connections between the airport and East Midlands Parkway Station were not considered viable in 2006. However this will be kept under review in the light of other local developments. Direct rail access to the airport via a heavy rail link from the Midland Mainline is not viable due to cost, expected usage and environmental impact.
SUSTAINABLE DEVELOPMENT PLAN ECONOMY AND SURFACE ACCESS
OUR PLAN
SURFACE ACCESS PLAN
31
SUSTAINABLE DEVELOPMENT PLAN ECONOMY AND SURFACE ACCESS
OUR PLAN
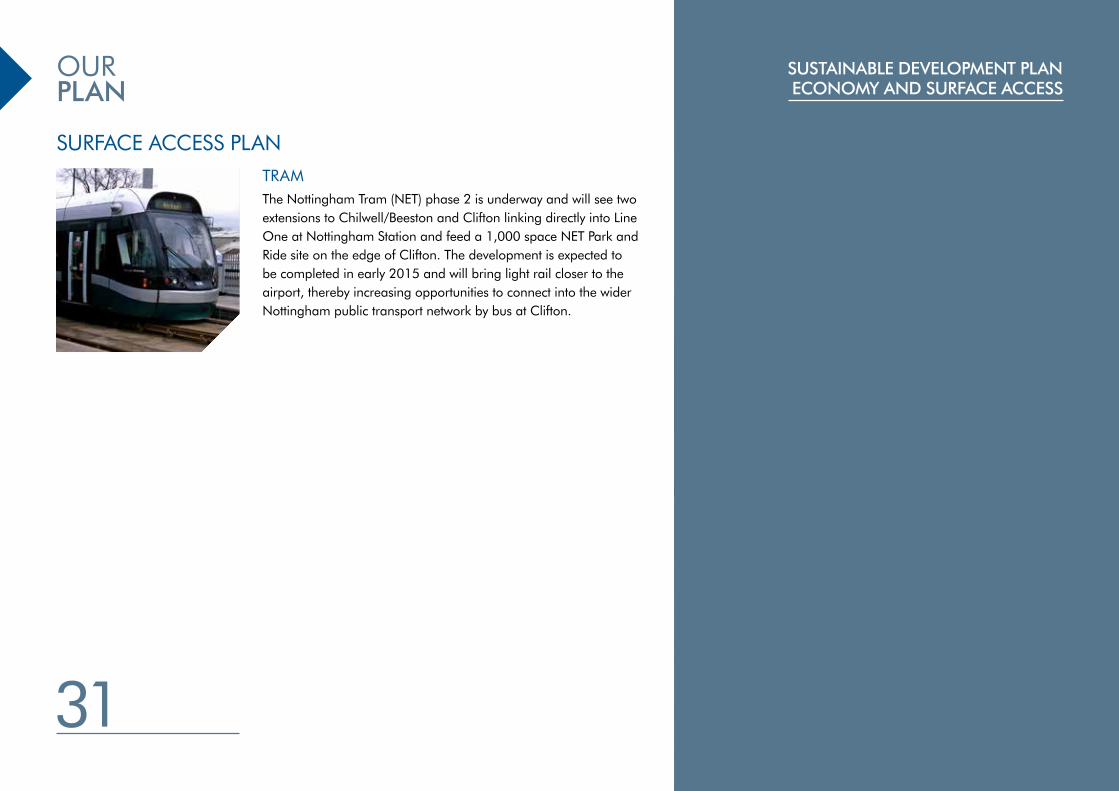
SURFACE ACCESS PLANTRAMThe Nottingham Tram (NET) phase 2 is underway and will see two extensions to Chilwell/Beeston and Clifton linking directly into Line One at Nottingham Station and feed a 1,000 space NET Park and Ride site on the edge of Clifton. The development is expected to be completed in early 2015 and will bring light rail closer to the airport, thereby increasing opportunities to connect into the wider Nottingham public transport network by bus at Clifton.

32
ManchesterPicadilly
Liverpool
First PhaseSecond Phase
Crewe
Sheffield
Leeds City Centre
Meadowhall
Nottingham
ENGLAND
HS2 ROUTE MAP
WALES
Toton Sidings
BirminghamEast Midlands Airport
KEY
London
Miles
0 100
HIGH SPEED RAILHS2 is the UK’s planned new high speed rail network, connecting London with the West Midlands, Manchester and Leeds. HS2 is intended to provide additional rail network capacity, fast and frequent connections between the UK’s major cities and act as a catalyst for economic growth by shortening journey times. This investment in the UK’s national transport system is supported. The HS2 line north of Birmingham is due to be completed by 2037. HS2 represents an important economic opportunity for the East Midlands region.
The HS2 route as currently proposed is to run in a tunnel under the airport to the East Midlands Hub station at Toton which is approximately 10km or a 20 minute drive to the north. The East Midlands Hub station must have excellent fast frequent and high quality public transport connections to Derby, Nottingham, Leicester and other major towns and cities across the region.
It is not likely that HS2 will have any direct impact on East Midlands Airport’s passenger catchment. It is not anticipated that passengers from London and the South will be using HS2 to access flights from East Midlands Airport. However it is feasible to expect that a proportion of passengers could migrate from the Midland Mainline to HS2, potentially freeing up capacity on the strategic rail network which could then be better placed to serve East Midlands Airport at Parkway Station.
HS2 is a substantial investment in national infrastructure and it is important that the East Midland region fully capitalises on the economic and connectivity benefits that it will bring. The airport will continue to work with HS2 and regional partners in order that the region can take full advantage of connectivity into a national high speed rail network.
SUSTAINABLE DEVELOPMENT PLAN ECONOMY AND SURFACE ACCESS
OUR PLAN
SURFACE ACCESS PLAN

33
COACH East Midlands Airport is served by the National Express 240 Airport service, which operates 6 times a day serving Bradford Interchange, Leeds, Meadowhall, Sheffield, Chesterfield, Nottingham, East Midlands Airport, Leicester, Luton Airport, Heathrow Airport, Gatwick Airport. In addition passengers are able to connect with the wider National Express network through a through-ticketing arrangement between the Skylink bus services and National Express at Broadmarsh Bus Station in Nottingham and St Margaret’s Bus Station in Leicester.
COACH – FUTURE DEVELOPMENT The demand for the national coach services will be driven by the passenger numbers, and frequency of the existing services and destinations are unlikely to be enhanced in the short term. In the medium term, there are many opportunities to work in partnership with operators to support their business cases to increase these services if there is a sustained growth in passenger numbers. Operators have expressed an interest in operating coach services between East Midlands Airport and Birmingham. In 2011 an independent coach operator successfully ran a coach service to Birmingham for the summer season, however there were unfortunately not enough passengers to sustain an all-year service. However as passengers grow this should help to create sufficient demand for a viable service.
OUR PLAN
TAXISThe airport Taxi service is operated under a concession agreement with Arrow Cars. The taxi concession operates to strict service standards set by the airport. The airport needs to operate a taxi concession on this basis to ensure that taxis are readily available to passengers 24 hours a day. The service level agreement covers issues such as the availability of taxis, quality of vehicle, maximum waiting times, minimum number of taxis available and driver standards. The concession agreement gives Arrow Cars exclusive access to a dedicated taxi rank outside the Terminal and a booking desk within the airport arrivals hall. However this does not prevent external taxi operators from serving passengers as long as they have been pre-booked by customers. All other taxi operators have access to the Rapid Drop off lanes and have access to the same facilities as any other person dropping off or collecting passengers.
DEMAND RESPONSIVE TRANSPORT SCHEMES The airport has explored the opportunity of Demand Responsive Transport (DRT) schemes by operating two trials. The schemes operated in Swadlincote and in the Greenhill area of Coalville. Whilst both were successful in providing previously non-existent links to employment, unfortunately the subsidy level per person assisted was extremely high and not sustainable or likely to become commercially viable in the medium or even long term. This experience was consistent with the national evidence, which shows a high level of failure, due primarily to the expensive running costs and high per-passenger subsidies. DRT is therefore not likely to form a part of the Airport’s Surface Access Strategy going forward.
SURFACE ACCESS PLAN
SUSTAINABLE DEVELOPMENT PLAN ECONOMY AND SURFACE ACCESS

34
EMPLOYEE TRAVEL PLAN INITIATIVESPassenger related employment provides the largest proportion of airport jobs (45%), with Cargo at 36%. Airport employees live in the local area with 42.4% living in Derbyshire, 23.2% living in Leicestershire and 23.5% living in Nottinghamshire. 15% of airport based employees live in Derby, 15% live in North West Leicestershire, 11% in South Derbyshire and 10% in Erewash. 4% live in Nottingham City and 2% live in Leicester City. The vast majority of staff work shifts with shift patterns in many airport businesses structured around the flight schedules for both passenger airlines and freight airlines. The number of airport staff that drive to work on their own is currently 71% despite the high level of shift-working.
The main opportunities for reducing employee reliance on single occupancy car use are the use of the Skylink network of buses operating across the 3-cities region. Travel to Work survey results indicate that 9.4% of employees across the site are currently traveling to and from work by bus. The airport has worked with local bus operators to ensure that regular user ticket prices are as affordable as possible and information about the bus network is promoted to all employers across the site.
OUR PLAN
Since first publishing a Surface Access Strategy in 2001 the airport has sought to reduce the reliance of single occupancy vehicle use by staff working on site. East Midlands Airport is the largest employment site in Leicestershire outside the City of Leicester. In 2013, 6,730 employees were based on the airport site, employed by 90 companies.
CAR-SHARE There is also a significant number of staff on site who rely on car-sharing whether formally through the online matching service offered by Liftshare.com, or through informal arrangements with colleagues. While the mode share for car-share is quite high at 13.9%, it is clear that the vast majority of these matches are made through colleagues sharing with people that they know rather than through the scheme. There remains a reluctance to share with strangers. The reasons most frequently cited by car users for not car sharing according to the most recent Travel to Work survey data are ‘no one lives near me’ (48.6%) and ‘shift times’ (38%), while the vast majority of car-sharers (60.9%) site ‘money saving’ as their main reason for car-sharing. Car-sharing will continue to be promoted as a sustainable travel mode among the on-site working population.
Given the operational nature of the airport business there is little opportunity for home working by airport staff except for administrative staff.
SURFACE ACCESS PLAN

35
CYCLING AND WALKINGThere are several cycle path links to the airport. The airport funded the A453 cycle crossing which connects the National Cycle Network (NCN) on-road route (15) to Diseworth with the section that runs through the airport connecting with the cycle parking located near the passenger terminal. NCN 15 continues along Viscount Road and Beverley Road within the Airport site before connecting with the off road cycle path from Pegasus Business Park to Finger Farm roundabout, where there are uncontrolled crossings over the A453. To the west cyclists can use the relatively light trafficked internal Airport roads which link with an off road route to Castle Donington.
The local cycle network is restricted due to severance by the M1 and the A453. The airport will encourage the provision of cycle-friendly routes in future highway schemes. Examples of local routes that could be developed include the Derbyshire Melbourne Greenway. The airport will work with Derbyshire County Council, Sustrans and others to see whether there are safe off road /on road links to the Melbourne Greenway and whether this route can be developed and then promoted. Should the proposed Strategic Rail Freight Interchange be developed, it will improve safe cycling routes by providing safer access from locations to the east of the M1 through Kegworth via the new junction on the A453.
Whilst there are no dedicated cycle paths around the perimeter of the site, the local roads are considered to be sufficiently quiet not to require dedicated cycle paths. Within the site the internal road network is to be maintained to provide an environment that is friendly to cyclists.
Cycle parking facilities are provided within the Central Passenger Zone, at DHL in Cargo West and within the Pegasus Business Park. Cycle parking and associated facilities will be encouraged in future new developments on the airport site.
Cycling remains a fairly small contributor to the airport’s overall modal share target, with only 1.6% of employees choosing this option. According to the Travel to Work survey, a further 5.2% of respondents would consider cycling, showing the potential for further modal change improvements. However such improvements would require the introduction of improvements to infrastructure, and further roll-out of initiatives like cycle loan schemes across other employers. The cycling map published by the airport on its web site will be kept as up to date as possible in order to ensure that safe cycling routes are promoted.
In addition to seeking opportunities to improve safe access, the airport promotes cycling throughout the year including Biker’s Breakfasts and Dr Bike events. The airport also launched Cyclescheme – a tax free cycle loan scheme – in 2009 to all airport employees and seeks to encourage other employers on the site to do the same.
SUSTAINABLE DEVELOPMENT PLAN ECONOMY AND SURFACE ACCESS
OUR PLAN
SURFACE ACCESS PLAN

36
SUSTAINABLE DEVELOPMENT PLAN ECONOMY AND SURFACE ACCESS
OUR PLAN
SURFACE ACCESS PLANThe airport’s rural location makes walking to the site impractical for most staff and passengers. There are footways along the main internal roads, which provide a connection to the footway to Castle Donington and the footways to Diseworth and Kegworth. Walking is only a viable option for travel to the airport for a very small minority of people living in these neighbouring villages, all of which lie in excess of 2km away.
The Airport Trail provides an attractive recreational walking route around the airport site. The use of the Airport Trail by walkers will continue to be encouraged and promoted. Safe pedestrian routes will continue to be provided within the Central Passenger Zone and across the airport site.

37
Further development of the airport’s passenger terminal facilities will be required for the airport to have the capability to handle up to 10 million passengers a year. This will require a substantial extension and the remodelling of the existing passenger terminal building. This work will need to be flexible to cater for the changing customer and operational requirements and to also maximise the useful life of the existing building.
As the terminal development works are undertaken, consideration will be given to the internal road network to ensure that it meets the needs of passengers, visitors and public transport operators. The internal road network around the passenger terminal will be improved as the airport develops. The control of traffic around the terminal is important for safety and security and is also part of a policy to reduce the numbers of passengers that are dropped off or picked up. This is coupled with a car park strategy to make long-term car parking attractive and also to help alleviate fly-parking on local roads and in local villages.
The passenger terminal has an annual capacity of around 6 million passengers a year. It is of a single-storey with the short-stay car park to the front. The Arrivals area has an hourly capacity of approximately 1,000 passengers an hour which equates to an annual capacity of around 5 million a year. Further details of the airport’s passenger capacity and development plans are described in the Land Use Plan which is part of the Sustainable Development Plan.
SUSTAINABLE DEVELOPMENT PLAN ECONOMY AND SURFACE ACCESS
AIRPORT INFRASTRUCTURE
OUR INFRASTRUCTURE

38
Since the launch of the first Skylink service 2004, public transport has served the terminal from facilities located outside Departures and Arrivals at the front of the terminal. This high-profile location is just one of many ways in which the airport has demonstrated real commitment to the importance of public transport to the business.
In 2007 enhancements to the coach park facility were developed including a canopy over the four coach bays and comfortable waiting areas. This area serves the National Express coach, as well as car park bussing, facilities for coaching for diverted aircraft, hotel courtesy coaching, airline crew coaches, various ad-hoc holiday coach companies as well as numerous deliveries to the terminal building.
In 2008 enhancements were made to the public transport facilities on the terminal front serving the Skylink network as well as other buses serving the site. These improvements included a fully covered walkway between arrivals and departures serving 5 dedicated bus bays as well as significant investment into real-time passenger information systems.
In 2013 as part of the terminal redevelopment and a £12 million investment into improving the security processing facility as well as a number of internal improvements to the terminal, it was necessary to close off the terminal front road. Public transport services, car park bussing and the taxi concessionaire are currently being accommodated to the south of the departures hall for passenger drop off and within the coach park for passenger collection arrangements.
As the passenger terminal is developed in the future, new and improved facilities are to be provided for public transport users, car park bussing and the taxi concessionaire. The future development incorporates high quality landscaping and high specification of facilities outside of the terminal building including bus waiting facilities. This high level of quality is important to encourage wider use of public transport as a means of access to the airport.
Opportunities will be brought forward to revise the internal terminal front road layout, including the potential reversal of traffic flow, with vehicles operating in a clockwise direction. This will improve the overall passenger experience for all passengers by providing the highest level of safety and convenience possible as well as a streamlined and efficient process.
In addition to improved convenience, safety and efficiency, amendments to the road layout would provide an opportunity for bus and car park coaches to use a different entrance point to users of the short stay car park and coach park, which would relieve pinch-points and alleviate congestion on the internal roads.
The public transport facilities will need to be extended to accommodate the increased levels of public transport use and the increased number of services. As the airport is developed to a 10 million passenger capacity, the development of a full public transport interchange will be required. This would be situated within the Passenger Terminal Zone and provide high quality bus and coach facilities and passenger waiting areas.
SUSTAINABLE DEVELOPMENT PLAN ECONOMY AND SURFACE ACCESS
PUBLIC TRANSPORT FACILITIES
OUR INFRASTRUCTURE
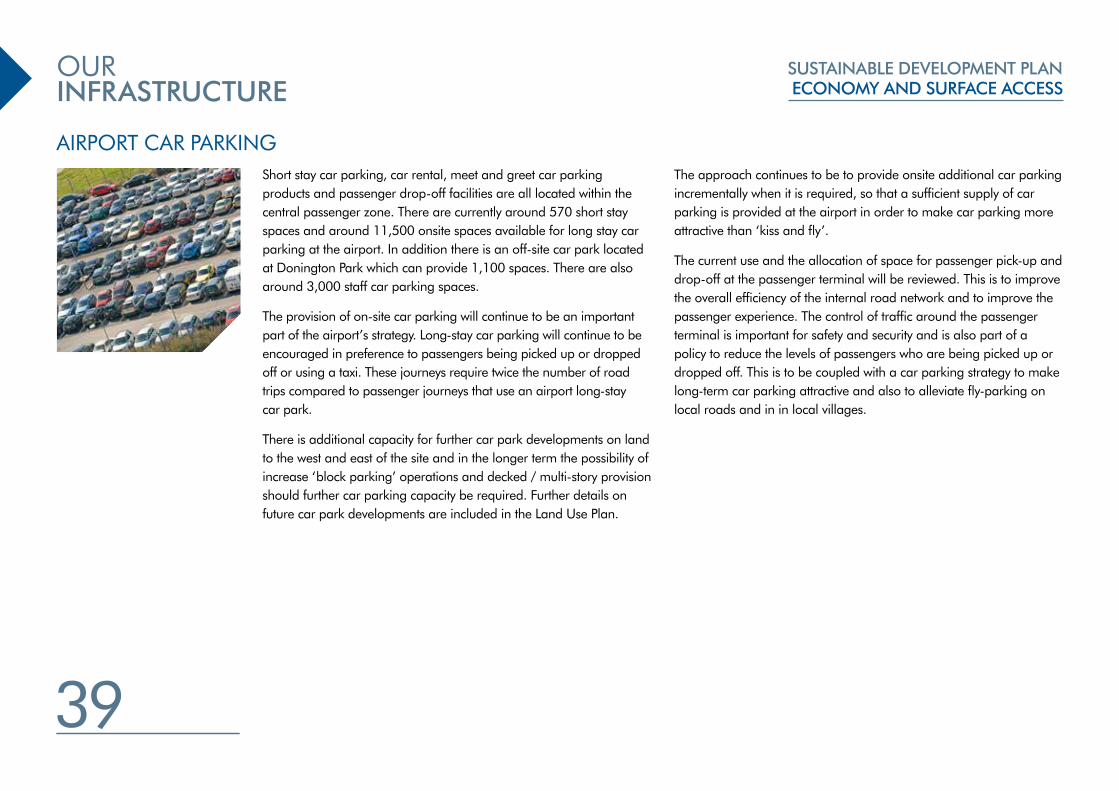
39
Short stay car parking, car rental, meet and greet car parking products and passenger drop-off facilities are all located within the central passenger zone. There are currently around 570 short stay spaces and around 11,500 onsite spaces available for long stay car parking at the airport. In addition there is an off-site car park located at Donington Park which can provide 1,100 spaces. There are also around 3,000 staff car parking spaces.
The provision of on-site car parking will continue to be an important part of the airport’s strategy. Long-stay car parking will continue to be encouraged in preference to passengers being picked up or dropped off or using a taxi. These journeys require twice the number of road trips compared to passenger journeys that use an airport long-stay car park.
There is additional capacity for further car park developments on land to the west and east of the site and in the longer term the possibility of increase ‘block parking’ operations and decked / multi-story provision should further car parking capacity be required. Further details on future car park developments are included in the Land Use Plan.
The approach continues to be to provide onsite additional car parking incrementally when it is required, so that a sufficient supply of car parking is provided at the airport in order to make car parking more attractive than ‘kiss and fly’.
The current use and the allocation of space for passenger pick-up and drop-off at the passenger terminal will be reviewed. This is to improve the overall efficiency of the internal road network and to improve the passenger experience. The control of traffic around the passenger terminal is important for safety and security and is also part of a policy to reduce the levels of passengers who are being picked up or dropped off. This is to be coupled with a car parking strategy to make long-term car parking attractive and also to alleviate fly-parking on local roads and in in local villages.
SUSTAINABLE DEVELOPMENT PLAN ECONOMY AND SURFACE ACCESS
AIRPORT CAR PARKING
OUR INFRASTRUCTURE

ECONOMY & SURFACE ACCESS
eastmidlandsairport.com
The Sustainable Development Plan is an important document for East Midlands Airport. There are many stakeholders who have an interest in the airport and the views and comments from Government, local authorities, neighbours, the business community and customers are an important part of the planning process. The airport is committed to being open in sharing the vision for East Midlands Airport, the region and the local area. The plan looks to where possible, reflect local views and ideas.
Neighbours, stakeholders and a wide range of organisations in the region have been consulted to obtain their views and wherever possible these have been reflected in the final document. The Sustainable Development Plan will be monitored on an ongoing basis with progress reports produced every two years and a full review of the plan every five years.
HOW TO CONTACT USTo view the Sustainable Development Plan:
Visit: www.eastmidlandsairport.com/developmentplan
To contact us about anything relating to the Economy and Surface Access Plan:
Write: East Midlands Airport Castle Donington Derby DE74 2SA
email: [email protected]