economy watch - ey - united · pdf fileprepared by macro-fiscal unit, policy advisory group,...
TRANSCRIPT

August 2017
Economy Watch
Monitoring India’s macro-fiscal performance

Contents
Foreword: capital expenditure targeted to grow in line with GDP growth ......................................... 2
1 Growth: sharp contraction in manufacturing and services post GST ......................................... 3
2 Inflation: CPI inflation rises for the first time in four months due to slowdown in rate of
contraction in food price ....................................................................................................... 4
3 Fiscal performance: fiscal deficit reached 81% of annual budgeted target during 1QFY18 ......... 5
4 India: comparative economic prospects .................................................................................. 7
5 In focus: measuring economic complexity of countries and products: India shows significant
potential ............................................................................................................................ 10
6 Money and finance: RBI has reduced the repo rate by 25 basis points in August 2017 review .. 13
7 Merchandise exports: growth slows down further ................................................................. 15
8 Global economy: pick-up in global growth anticipated by the IMF in April remains on track ...... 16
9 Index of aggregate demand: improves further in June 2017 .................................................. 18
10 Appendix: capturing macro-fiscal trends .............................................................................. 19
Prepared by Macro-fiscal Unit, Policy Advisory Group, EY India D. K. Srivastava, Chief Policy Advisor, EY: [email protected] Muralikrishna Bharadwaj, Manager, EY: [email protected] Tarrung Kapur, Senior Consultant, EY: [email protected] Ragini Trehan, Consultant, EY: [email protected]

Economy Watch: August 2017 2
Highlights 1. RBI reduced the repo rate by 25 basis
points in its August 2017 review.
2. CPI inflation increased for the first time in four months to 2.4% in July 2017. This was primarily due to a slower contraction in vegetable prices, which decreased by (-) 16.5% in June 2017 and by (-) 3.6% in July.
3. PMI signals sharp contraction in manufacturing and services following GST.
4. IIP contracted for the first time in June
2017 to its lowest level in the last four years as a result of subdued demand and GST-related uncertainties.
5. The Center’s fiscal deficit during 1QFY18
stood at 80.8% of the annual budgeted target, while the revenue deficit during this period was at 119.3% of the corresponding budgeted target.
6. Gross central tax revenues grew by 15.2%
in the first quarter of FY18, while non-tax revenues contracted by (-) 6.5% during this period.
7. Following demonetization and the
implementation of GST, the number of PIT assesses has gone up significantly, signaling tangible compliance improvement over the medium term.
8. Currency in circulation (excluding non-
demonetized currency) had decreased to 84.0% of the total demonetized currency by 23 July 2017 from 84.5% on 14 July 2017, indicating the beginning of a slowdown in the rate of re-monetization.
9. Growth in non-food credit at 4.8% in June
2017 remained extremely low, although it does represent an improvement from 4.1% in May 2017.
10. The IAD at 4.5% in June 2017, increasing
from 3.8% in May 2017 signals continued strengthening of aggregate demand. However, indications are that the trend was reversed in July 2017.
Foreword: Capital expenditure targeted to grow in line with GDP growth
The Indian economy is developing on a twin track mode. On the one hand, growth parameters such as IIP and PMI indicate subdued growth performance. On the other hand, stock prices have shot up, indicating considerable optimism about the Indian economy. On the monetary side also, while there is clamor for further reduction in the policy rate, there is excessive liquidity in the system. It is this excess liquidity that, to a large extent, has been driving up the stock prices, and any rate reduction would not
lead to an increase in the demand in the system given that liquidity is already abundant. If the Indian economy is drawn into a low real growth and low inflation phase, the nominal growth would come down and, given the tax buoyancies, the overall tax revenue growth would fall below budget expectations, thereby putting pressure on maintaining the fiscal deficit target.
The RBI has reduced its dividend to the Central Government by more than half over the previous year, from INR65, 876 crore to INR30, 659 crore (Economic Times, 11 August 2017). An important reason behind this move is the increased costs of re-monetization for the RBI.
The Government has come out with a Medium Term Expenditure Framework, indicating its expenditure projections for the period up to FY20. The fiscal deficit targets have been retained at 3.2% in FY18 and 3% each in FY19 and FY20. This is in line with the recommendations of the Fiscal Responsibility and Budget Management (FRBM) Review Committee. Given the fiscal deficit targets and limited increases in the tax to GDP ratio, the Central Government’s capital expenditure to GDP ratio remains stagnant at 1.8% for the three-year period until FY20, implying that in absolute terms, it will grow in line with GDP growth. Clearly, the Government would remain constrained in expanding infrastructure through increased capital expenditure. The potential crowding-in of private investment would also remain largely unrealized.
Given that at the end of the first quarter of FY18, the actual fiscal deficit is already 81% of the annual budgeted amount and the uncertainties relating to GST might adversely affect the indirect tax revenues in the second and third quarters of FY18, the Government could be facing an uphill task in meeting the fiscal deficit target. It is quite possible that the Government might lean relatively more on non-GST indirect taxes and cesses for making up for the shortfall in domestic indirect tax revenues. Given lackluster growth prospects, the need for augmenting government expenditure while maintaining the fiscal deficit target might prove to be an uphill task.
The mid-term review’s admission of a growth slowdown from the pre-Budget Economic Survey projection of an average growth exceeding 7% is candid and realistic. Apart from two consecutive although short-term impacts emanating from de-monetization and the GST, the economy continues to show deficient investment and export demand, driving the appreciation of the rupee. There are macro implications from farm loan wavers in addition to sectoral problems in the power and telecommunication sectors. These are expected to weigh down India’s growth pulse in the short run. We should reach closer to our potential growth exceeding 7.5% in FY19.
D.K. Srivastava Chief Policy Advisor, EY India

Economy Watch: August 2017 3
A. Industry growth: IIP contracts to a four-year low in June 2017
IIP contracted for the first time in June 2017 to its lowest level in the last four years as a result of subdued demand and GST-related uncertainties and partly due to the base effect.
► IIP contracted (with 2011—12 as base) by (-) 0.1% (y-o-y) in June 2017, as compared to a growth of 2.8% (revised)
in May 2017 (Chart 1). IIP growth has shown a falling trend for the four consecutive quarters since 2QFY17. It fell to
2.0% in 1QFY18 from 3.1% in 4QFY17.
► The manufacturing sector, which accounts for over 77% of the overall IIP, witnessed a contraction of (-) 0.4% in June
from a growth of 2.6% (revised) in May 2017.
► Output of the capital goods industry contracted sharply by (-) 6.8% in June 2017 as compared to (-) 1.4% (revised) in
May 2017. Output of consumer durables contracted by (-) 2.1% in June 2017 from a growth of 0.8% (revised) in May
2017. Output growth of infrastructure/construction goods continued to remain subdued at 0.6% in June 2017,
although it was marginally higher than 0.2% (revised) in May 2017.
► Output of eight core infrastructure industries, with a weight of 40.3% in the overall IIP, grew at a meager 0.4% (y-o-
y) in June 2017 (4.1% in May 2017). This was due to moderation in the output of electricity (0.7%) and crude oil
(0.6%) and a contraction in the output of coal ((-) 6.7%), cement ((-) 5.8%) and petroleum refineries ((-) 0.2%) during
the month.
Chart 1: IIP growth (% y-o-y)
Source: Office of the Economic Adviser, Ministry of Commerce and Industry
Chart 2: NIKKEI PMI
Source: NIKKEI PMI, Markit Economics
B. PMI: Signals sharp contraction in manufacturing and services post-GST
Disruption in business activities and the adverse impact of rate hike on demand after GST dragged down the PMI for manufacturing and services in July 2017. Although GST-related uncertainties may betemporary, a revival in overall demand is crucial for a sustained recovery in PMI.
► Headline manufacturing PMI (sa) dipped to 47.9 in July after the introduction of GST, the lowest level since February
2009 (Chart 2). The downturn was broad-based across all sub-sectors, namely, consumer, intermediate and
investment goods. New orders and output decreased for the first time since the demonetization-related downturn
recorded in December 2016, with rates of contraction the steepest since February 2009 in both cases.
► Headline services PMI (sa) contracted even more sharply from June’s eight-month high of 53.1 to 45.9 in July 2017,
its lowest level since September 2013. This was due to uncertainties related to GST and continued overall lack of
demand in the system.
► Composite PMI Output Index (sa) fell sharply to 46 in July 2017 from 52.7 in June 2017, reflecting the contraction
in services and manufacturing output in July.
-2
1
4
7
10
Ju
n 1
5
Au
g 1
5
Oct
15
De
c 1
5
Fe
b 1
6
Ap
r 1
6
Ju
n 1
6
Au
g 1
6
Oct
16
De
c 1
6
Fe
b 1
7
Ap
r 1
7
Ju
n 1
7
IIP (overall) IIP (core)
42
44
46
48
50
52
54
56
58
60
Ju
l 1
3
Oct
13
Ja
n 1
4
Ap
r 1
4
Ju
l 1
4
Oct
14
Ja
n 1
5
Ap
r 1
5
Ju
l 1
5
Oct
15
Ja
n 1
6
Ap
r 1
6
Ju
l 1
6
Oct
16
Ja
n 1
7
Ap
r 1
7
Ju
l 1
7
PMI (mfg.) PMI (ser.) Benchmark
1 Growth: Sharp contraction in manufacturing and services after GST

Economy Watch: August 2017 4
CPI inflation increased for the first time in four months to 2.4% in July 2017 primarily due to a slower contraction in vegetable prices.
► CPI-based inflation (Chart 3) increased to a three-month high of 2.4% in July 2017 from a historic low of 1.5% in the
previous month as the fall in food price inflation reflected by the Consumer Food Price Index eased to (-) 0.3% in July
2017 from (-) 2.1% in the previous month.
► Contraction in the price of vegetables eased significantly to (-) 3.6% from (-) 16.5% in June 2017.
► Fuel and lighting inflation increased to 4.9% in July 2017 from 4.5% in June 2017. Administered prices of LPG and
kerosene are set to rise with the calibrated reduction in subsidy.
► Core CPI inflation (excluding food and fuel and light) increased to 4.2% in July 2017 after declining to 3.9% in June
2017 from a peak of 5.1% in March 2017. Inflation in medicines and health-related services increased from 3.5% in
June to 4.0% in July 2017.
► As per the RBI monetary policy statement released on 2 August 2017, the future trajectory of inflation would depend
upon (a) the impact of the implementation of house rent allowances (HRA) under the 7th Central Pay Commission
(CPC), (b) the impact of the price revisions withheld ahead of the GST and (c) the disentangling of the structural and
transitory factors shaping food inflation.
Chart 3: Inflation (y-o-y; %)
Source: MOSPI
WPI-based inflation also rose to 1.9% in July 2017 from an 11-month low of 0.9% in June 2017 because of a sharp rise in food price inflation.
► Inflation in vegetables turned positive at 21.9% in July 2017 from (-) 21.2% in June 2017 after 11 successive months
of contraction.
► WPI-based inflation for food articles increased to 2.1% in July 2017 after reaching a historic low of (-) 3.5% in the
previous month due to increase in vegetable prices. This was despite further fall in the inflation in food grains (cereals
and pulses) to a historic low of (-) 7.8% ((-) 4.7% in June 2017). Particularly, inflation in pulses was at (-) 32.6% in July
2017 as compared to (-) 25.5% in June 2017..
► Fuel and power inflation slowed to a seven-month low of 4.4% in July 2017 from 5.3% in June 2017.
► In contrast to the overall trend, WPI core inflation increased marginally to 2.2% in July 2017 from 2.1% in June 2017.
► Inflation based on the newly constructed WPI food price index, consisting of primary food articles and manufactured
food products, reached 2.1% from (-) 1.3% in the last month.
-8-6-4-202468
101214
Ju
l 1
3
Oct
13
Ja
n 1
4
Ap
r 1
4
Ju
l 1
4
Oct
14
Ja
n 1
5
Ap
r 1
5
Ju
l 1
5
Oct
15
Ja
n 1
6
Ap
r 1
6
Ju
l 1
6
Oct
16
Ja
n 1
7
Ap
r 1
7
Ju
l 1
7
New CPI inflation Core CPI
WPI inflation Inflation target: upper end
Inflation target: lower end
2 Inflation: CPI inflation rises for the first time in four months due to a slowdown in the rate of contraction in food price
CPI-based inflation reached within the target range of 2%—6% in July 2017 after having slipped to a historic low of 1.5% in June 2017. Besides other important factors, its future trajectory would be influenced by the timing and quantum of farm loan waivers announced by states.

Economy Watch: August 2017 5
A. Tax and non-tax revenues
Gross central tax revenues grew by 15.2% in the first quarter of FY18, while non-tax revenues contracted by (-) 6.5% during this period.
► Gross taxes grew by 15.2% in 1QFY18, compared to 30.6% in the corresponding period of FY17 (Chart 4).
► Growth in direct taxes up to June FY18 was lower at 16.6% as compared to 26.9% in the same period of FY17.
► Growth in indirect taxes was also lower at 14% during 1QFY18 as compared to the corresponding value of 33.6% in
FY17. Growth in indirect tax revenues may get adversely affected in the coming few months as a result of a
contraction in manufacturing and services, as also reflected in the contraction in the July 2017 numbers for
manufacturing and services PMI due to uncertainties after the introduction of GST.
► Growth in income tax revenues was at 10.6% during April-June FY18 as compared to 53.4% in the corresponding
period of FY17 (Chart 5).
► Corporate tax revenues witnessed a growth of 24.3% during 1QFY18 as compared to just 3.9% in 1QFY17.
► Growth in excise duties was much lower at 7.9% during April—June FY18 as compared to the corresponding value of
60.5% in FY17 due to a slowdown in production.
► Growth in customs duties was at 15% during April—June FY18 as compared to the corresponding value of 17.8% in
FY17.
► Service tax revenues grew by 20.4% up to June FY18, compared to 28.5% in the corresponding period of FY17.
► During April—June FY18, non-tax revenues contracted by (-) 6.5% as compared to (-) 40.6 in the same period of
FY17.
► Total receipts from disinvestment up till 3 August 2017 amounted to INR8,427.59 crore, which is 11.6% of the
annual budgeted target.
B. Expenditures: Revenue and capital ► Total expenditure grew by 27.1% during April—June FY18, down from 54% up till May 2017. However, this was
higher as compared to the corresponding value of 18.8% in FY17.
3 Fiscal performance: Fiscal deficit reached 81% of annual budgeted target during 1QFY18
Chart 4: Growth in cumulated gross tax revenues up to June 2017
Chart 5: Growth in cumulated tax revenues up to June 2017
25.0
4.2 3.4
17.5
30.6
15.2
-10
0
10
20
30
40
50
FY13 FY14 FY15 FY16 FY17 FY18-30
-10
10
30
50
70
90
110
FY13 FY14 FY15 FY16 FY17 FY18
Income tax (LHS) Customs duty (LHS)
Union excise duties (LHS) Service tax (LHS)
Corporate tax (RHS)
Source: Monthly Accounts, Controller General of Accounts, Government of India

Economy Watch: August 2017 6
► Growth in revenue expenditure was at 25.8 % up to June FY18 as compared to 24.3% in the same period of FY17
(Chart 6).
► Growth in the Center’s capital expenditure increased sharply to 39.5% during April—June FY18 as compared to a
contraction of (-) 16.4% in FY17. Unlike previous years, advancement of the Budget presentation enabled the
Central Government to frontload capital expenditure in the beginning of the fiscal year (Chart 7).
► As per the recently released Medium Term Expenditure Framework by the Ministry of Finance (10 August 2017), the
Center’s total expenditure is projected to grow by 9% and 10.9% in FY19 and FY20 respectively. The corresponding
growth rates for revenue expenditure are 8.8% and 10.3%, while for capital expenditure these stand at 10.1% and
14.4%. These projections are contingent on certain assumptions with respect to nominal GDP growth, fiscal and
revenue deficit, and gross tax to GDP ratio for the two years.
The advancement of the Budget presentation for FY18 enabled the Central Government to frontload capital expenditure in the beginning of the fiscal year. It grew by 39.5% during 1QFY18 as compared to a contraction of (-) 16.4% in the corresponding period of FY17.
C. Fiscal imbalance
► Fiscal deficit in 1QFY18 stood at 80.8% of the annual budgeted target as compared to 61.1% in the corresponding
period of FY17 due to a sharp rise in the Center’s revenue as well as capital expenditure (Chart 8).
► The Center’s revenue deficit had crossed the 100% mark up till June 2017. Revenue deficit during 1QFY18 was at
119.3% of the annual budgeted target as compared to 79.7% during 1QFY17 (Chart 9).
The Center’s fiscal deficit during 1QFY18 stood at 80.8% of the annual budgeted target, while the revenue deficit during this period was at 119.3% of its annual budgeted target.
Chart 8: Fiscal deficit up to June 2017 as a % of annual budgeted estimate for FY18
Chart 9: Revenue deficit up to June 2017 as a % of annual budgeted estimate for FY18
37.1
48.456.1
51.661.1
80.8
0
10
20
30
40
50
60
70
80
90
100
FY13 FY14 FY15 FY16 FY17 FY18
43.6
55.465.9
58.6
79.7
119.3
0102030405060708090
100110120
FY13 FY14 FY15 FY16 FY17 FY18
Chart 6: Growth in cumulated revenue expenditure up to June 2017
Chart 7: Growth in cumulated capital expenditure up to June 2017
20.3 20.7
11.0
2.4
24.325.8
0
10
20
30
40
50
FY13 FY14 FY15 FY16 FY17 FY18
12.5
35.8
-8.6
17.6
-16.4
39.5
-20
-10
0
10
20
30
40
50
FY13 FY14 FY15 FY16 FY17 FY18
Source: Monthly Accounts, Controller General of Accounts, Government of India
Source: Monthly Accounts, Controller General of Accounts, Government of India

Economy Watch: August 2017 7
► OECD projects India’s private consumption growth to be the highest among major developing and some key developed nations.
► In most of the countries, growth in private consumption is forecasted to be largely stagnant because of slower wage growth.
► In 2017 and 2018, private consumption in Russia and Brazil is expected to recover from a sharp contractionary phase witnessed in 2015 and 2016.
► Growth in real public consumption expenditure is also projected to be the highest in India in 2017 and 2018.
► Elsewhere, public consumption growth is projected to be largely subdued in 2017 with some pick-up projected in 2018 for selected countries such as the US, Germany and Australia.
► In Russia and Brazil, public consumption expenditure is forecasted to continue to contract.
4 India: Comparative economic prospects
Table 1: Real private consumption expenditure (%, y-o-y)
Country 2014 2015 2016 2017 (f)
2018 (f)
India* 6.8 7.3 7.2 7.7 8.2
Australia 2.8 2.7 2.7 2.6 2.9
US 2.9 3.2 2.7 2.4 2.4
UK 2.2 2.4 2.8 2.0 1.1
Euro area 0.8 1.8 1.9 1.4 1.4
Germany 1.0 1.9 1.9 1.3 1.4
Russia 2.0 -9.7 -4.5 1.2 2.7
Japan -0.9 -0.4 0.4 0.9 0.6
South Africa 0.7 1.7 0.8 0.8 1.5
Brazil 2.3 -3.9 -4.3 -0.6 1.5
Chart 10: Real private consumption expenditure (%, y-o-y) — selected countries
Table 2: Real public consumption expenditure (%, y-o-y)
Country 2014 2015 2016 2017 (f)
2018 (f)
India* 9.4 2.9 17.0 10.3 9.2
Australia 0.9 3.5 3.9 1.9 2.0
Germany 1.2 2.8 4.0 1.7 2.3
UK 2.3 1.3 0.8 1.4 1.1
Euro area 0.6 1.3 1.8 1.2 1.3
South Africa 1.1 0.5 2.0 0.8 0.8
US -0.7 1.6 0.8 0.5 2.4
Japan 0.5 1.7 1.5 0.3 0.1
Russia -2.1 -3.1 -0.5 -0.5 -2.5
Brazil 0.8 -1.1 -0.5 -0.8 0.7
Chart 11: Real public consumption expenditure (%, y-o-y) — selected countries
6.8 7.3 7.2 7.7 8.2
2.3
-3.9 -4.3 -0.6
1.52.0
-9.7
-4.5
1.22.7
-12
-10
-8
-6
-4
-2
0
2
4
6
8
10
2014 2015 2016 2017 (f) 2018 (f)
India* Brazil Russia
9.4
2.9
17.0
10.39.2
-2.1
-3.1
-0.5 -0.5-2.5-6
-4
-2
0
2
4
6
8
10
12
14
16
18
20
2014 2015 2016 2017 (f) 2018 (f)
India* Russia Brazil
Source (Basic Data): OECD Economic Outlook, June 2017
*Data pertains to fiscal year, (f) indicates forecast
Source (Basic Data): OECD Economic Outlook, June 2017
*Data pertains to fiscal year, (f) indicates forecast

Economy Watch: August 2017 8
► Growth in goods and services export volumes for key developing and developed economies is projected to rebound from the slowdown witnessed in 2016.
► In 2017, China is expected to witness the highest export growth, followed by Australia, Japan and India.
► In the UK, export growth is projected to be subdued in 2017 mainly because of the implications of Brexit.
► China is projected to have the highest import growth in 2017, followed by Brazil and Russia.
► In case of India, import growth is expected to recover from the contraction observed in 2015 and 2016 but will remain muted in 2017.
► In 2018, however, India’s import growth is likely to exceed that of China’s.
Table 3: Export volumes of goods and services (%, y-o-y)
Country 2014 2015 2016 2017 (f)
2018 (f)
China 4.2 -2.3 1.9 8.9 4.3
Australia 6.9 5.8 7.6 6.7 7.2
Japan 9.3 2.9 1.2 6.4 3.4
India* 1.7 -5.4 2.3 5.5 6.1
Brazil -1.0 6.2 1.8 4.7 4.6
South Africa
3.2 3.9 -0.1 4.3 4.5
Germany 4.0 4.6 2.5 4.2 3.7
Russia 0.6 3.6 3.1 3.4 3.0
US 4.3 0.1 0.4 2.9 3.0
UK 1.5 6.1 1.8 1.9 2.6
Chart 12: Export volumes of goods and services (%, y-o-y) — selected countries
Table 4: Import volumes of goods and services (%, y-o-y)
Country 2014
2015 2016 2017 (f)
2018 (f)
China 8.3 2.6 6.6 7.5 3.5
Brazil -1.9 -13.9 -10.3 5.2 2.7
Russia -7.1 -26.0 -4.0 5.0 2.2
US 4.4 4.6 1.1 4.7 5.1
Germany 4.0 5.0 3.7 4.1 3.9
UK 2.5 5.5 2.8 3.8 1.3
Australia -1.1 1.8 0.4 3.5 3.7
Japan 8.3 0.8 -2.3 3.2 1.9
South Africa
-0.5 5.4 -3.7 2.9 5.9
India* 0.8 -5.9 -1.2 2.0 4.9
Chart 13: Import volumes of goods and services (%, y-o-y) — Selected countries
4.2
-2.3
1.9
8.9
4.3
1.7
-5.4
2.35.5
6.1
1.5
6.1
1.8 1.9 2.6
-8
-6
-4
-2
0
2
4
6
8
10
2014 2015 2016 2017 (f) 2018 (f)
China India* UK
8.3
2.6
6.67.5
3.5
0.8
-5.9
-1.2
2.0
4.9
-8
-6
-4
-2
0
2
4
6
8
10
2014 2015 2016 2017 (f) 2018 (f)
China India*
Source (Basic Data): OECD Economic Outlook, June 2017
*Data pertains to fiscal year, (f) indicates forecast
Source (Basic Data): OECD Economic Outlook, June 2017
*Data pertains to fiscal year, (f) indicates forecast

Economy Watch: August 2017 9
► Import penetration is defined as goods and services import volume (expressed in 2010 US$ prices) as a percentage of total final expenditure (expressed in 2010 US$ prices).
► This ratio has been fairly constant across years for each of the selected countries.
► Germany, followed by the UK, had the highest import penetration among major developing and developed economies during 2014 to 2016. This trend is expected to continue in 2017 and 2018.
► Among major developing and developed nations, Germany is the only country that posted a fiscal surplus for the general government during 2014 to 2016. This trend is expected to continue in 2017 and 2018.
► India is forecasted to post a high general government fiscal deficit in 2017 and 2018 due to the high public consumption expenditure growth projected during these two years.
Table 5: Import penetration (%, y-o-y)
Country 2014 2015 2016 2017 (f)
2018 (f)
Germany 28.6 29.3 29.7 30.1 30.5
UK 24.2 24.8 25.1 25.5 25.6
South Africa
23.3 24.0 23.3 23.6 24.5
China 23.8 23.1 23.1 23.2 22.7
Australia 17.4 17.3 17.0 17.1 17.1
India* 20.2 18.1 16.9 16.2 15.9
Japan 14.9 14.9 14.5 14.7 14.8
Brazil 16.6 15.0 14.1 14.7 14.8
US 13.7 14.0 13.9 14.2 14.5
Russia 16.7 13.2 12.8 13.1 13.2
Chart 14: Import penetration (%, y-o-y) — selected countries
Table 6: General government financial balance (surplus (+) or deficit (-) as a % of nominal GDP)
Country 2014 2015 2016 2017 (f)
2018 (f)
Germany 0.3 0.7 0.8 0.7 0.6
Euro area -2.6 -2.1 -1.6 -1.2 -0.9
Australia -2.1 -1.5 -2.0 -1.6 -1.2
China -0.3 -1.3 -2.0 -2.1 -2.2
UK -5.6 -4.3 -3.3 -3.1 -2.4
Russia -1.0 -3.4 -3.7 -3.3 -2.7
South Africa
-4.1 -3.9 -3.5 -3.3 -3.0
US -5.0 -4.4 -5.0 -4.7 -5.2
Japan -5.4 -3.5 -4.6 -5.0 -4.4
India* -6.5 -7.5 -7.0 -6.7 -6.4
Brazil -6.0 -10.2 -9.0 -8.2 -8.0
Chart 15: General government financial balance — selected countries
28.6 29.3 29.7 30.130.5
20.218.1
16.9 16.2
15.916.7
13.2 12.8 13.113.2
5
10
15
20
25
30
35
2014 2015 2016 2017 (f) 2018 (f)Germany India* Russia
-0.3
-1.3-2.0 -2.1
-2.2
-6.5 -7.5-7.0
-6.7-6.4
-6.0
-10.2
-9.0-8.2
-8.0
-12.0
-10.0
-8.0
-6.0
-4.0
-2.0
0.02014 2015 2016 2017 (f) 2018 (f)
China India* Brazil
Source (Basic Data): OECD Economic Outlook, June 2017
*Data pertains to fiscal year, (f) indicates forecast
Source (Basic Data): OECD Economic Outlook, June 2017
*Data pertains to fiscal year, (f) indicates forecast

Economy Watch: August 2017 10
In recent contributions, Hausmann and Hidalgo et.al (2014, 2011) propose an Index of Economic Complexity and postulate that a country’s growth prospects improve with increase in its Index of Economic Complexity. Traditional analysis in economics focuses on factors of production such as land, labor and capital. In the analytical framework proposed by Hausmann and Hidalgo et al., the key factor of production is knowledge. Modern economies are characterized by products that have become progressively more complex, dependent as they are on a variety of sub-products and processes that largely derive from growth in human knowledge, which depends more and more on exchange of ideas across people, countries and generations using modern methods of storing and communicating knowledge through networking and other similar technologies. Hausmann and Hidalgo et.al distinguish between complexity of products and complexity of countries, which in turn is based on complexity of products. They distinguish between two kinds of knowledge: explicit and tacit. Explicit knowledge is transferable by text, conversation, and other means of communication. Tacit knowledge is difficult to transfer as it depends on individual skills and inherited knowledge. Thus, products that require greater use of tacit knowledge constrain the process of growth and development as their transferability is limited. This transferability is individual or company-specific and specific to groups of firms or specialists etc. who in turn may be specific to groups of countries — for example, technologies relating to liquid fuels used in long-distance rockets as also in specialized advanced jet engines etc. Sometimes shareability of knowledge is constrained by specific policies followed by governments, which give them a monopoly advantage in the development and export of certain products. Tacit knowledge is dependent on specialization. Just as individuals specialize, organizations also specialize and represent collective capabilities.
The complexity of an economy is related to the multiplicity of useful knowledge embedded in it covering design, marketing, finance, technology and human resource management, operations and institutional frameworks. In these dimensions, different countries have different capabilities. Economic complexity is therefore the composition of a country’s productive output, which reflects the structures and the knowledge combinations that make their production possible. Hausmann and Hidalgo et.al assert that “economic complexity is necessary for a society to be able to hold and use a larger amount of productive knowledge” and it can be measured from the mix of products that a county is able to make. The higher the economic complexity of a country, the higher the capacity of that country to produce a more diverse set of products. This is why all products are not produced in all countries. Products that demand large volumes of knowledge are feasible only in few countries. Thus, we can consider a product in terms of its two characteristics: ubiquity and diversity. Ubiquitous products require a lower degree of complexity and can be produced across most countries. Diversity requires specialized knowledge. The more complex the knowledge requirement associated with products, the higher the diversity dimension of that product. Generally, countries with higher measures of economic complexity would be able to produce a more diverse range of products. Hausmann and Hidalgo et.al define an Index of Economic Complexity as well as product complexity index. The former depends on the latter.
To make international comparisons possible, Hausmann and Hidalgo et.al utilize product export data and differentiate between products that are high on product complexity index. Countries with a larger share of export of products with high product complexity index would have a higher ranking in their economic complexity index. To illustrate the point, Singapore and Pakistan, which export roughly 133 products each, are compared. Although the number of products exported is comparable between two countries, the mix of products in terms of high and low product complexity indices is very different. Singapore has a much larger basket of products with high product complexity rankings. This gives Singapore a much higher economic complexity ranking as compared to Pakistan. Their GDP at market prices are, however, similar. However, Singapore is 38 time richer than Pakistan in per-capita terms because of its higher economic complexity ranking.
The top five and bottom five products by complexity and their product groups are shown in Table 7. The top 5 products by complexity are mostly machinery and appliances. The bottom 5 products are mostly primary commodities including minerals in their raw form.
Table 7: Products by complexity
Top 5 products Bottom 5 products
# Product Index
# Product Index
1 Machines and appliances for specialized particular industries
2.27 1 Crude oil -3.00
2 Instrument and appliances for physical or chemical analysis
2.21 2 Tin ores and concentrates -2.63
3 Appliances based on the use of X-rays or radiation
2.16 3 Cotton, not carded or combed -2.63
5 In focus: Measuring economic complexity of countries and products — India shows significant potential

Economy Watch: August 2017 11
4 Lubricating petrol oils and other heavy petrol oils
2.10 4 Cocoa beans -2.61
5 Other machine tools for working metal or metal carbide
2.05 5 Sesame seeds -2.58
Source: Hausmann and Hidalgo et.al (2016)
Using this framework and international trade data, Hausmann and Hidalgo et.al rank 128 countries. The top 5 countries are Japan, Germany, Switzerland, Sweden and Austria. Except Japan, the last four are in Western Europe. The bottom 5 countries are Papua New Guinea, Republic of Congo, Sudan, Angola and Mauritania. Except Papua New Guinea, which is in the East Asia and the Pacific, the last four belong to sub-Sharan Africa. The US has the 13th rank, China the 29th rank and India the 51st rank.
Table 8: Country wise economic complexity index: selected countries
# Country Rank
# Country Rank
1 Japan 1 11 Mexico 20
2 Germany 2 12 The Netherlands 23
3 Switzerland 3 13 Hong Kong 24
4 Sweden 4 14 China 29
5 Austria 5 15 India 51
6 UK 9 16 Brazil 52
7 France 11 17 Greece 53
8 South Korea 12 18 Argentina 57
9 US 13 19 Australia 79
10 Israel 19 20 Bangladesh 103
Source: Hausmann and Hidalgo et.al (2016)
Japan and Germany are the two countries with the highest levels of economic complexity. If a good cannot be produced in Japan or Germany, the likely list of countries where such a good can be produced would be very small. On the other hand, if a product cannot be made in the low complexity countries, the list of countries where it can be made is likely to be very large. Some countries that are rich in natural resources, such as Qatar, Kuwait, Oman, Venezuela and Chile, are rich because they possess large volumes of natural resources and not because of their capacity to produce complex goods. If a product cannot be produced in these mineral-rich states, it is likely to be produced in many other countries. Hausmann and Hidalgo et.al show that the gap between a country’s economic complexity and the level of per-capita income is an important determinant of future growth. Countries tend to converge to the level of income that can be supported by the knowhow that is embedded in their economy reflected by Index of Economic Complexity.
India’s growth as related to the complexity index: Achievement and potential
In terms of the Index of Economic Complexity, India has the 51st rank. Hausmann and Hidalgo et.al have used their analysis to estimate the growth in per-capita GDP up to 2020 and have also estimated the expected GDP growth until 2020 based on the Index of Economic Complexity. In this context, we compare India and China. In terms of expected growth in per-capita income up to 2020, China and India are ranked first and second respectively. The relevant estimated values are given in table below.
Table 9: Estimated GDP and per-capita GDP growth based on economic complexity
Overall GDP
Country Rank Expected
growth (2009—20)
Growth (1999—
08)
Rank income
2009 (US$)
Income 2009 (US$)
Rank income
2020(US$)
Income 2020 (US$)
Expected population
growth
China 20 4.66% 9.4% 81 3,744 70 5,962 0.34%
India 8 5.51% 5.4% 99 1,192 97 1,886 1.25%
Per-capita GDP
Rank Expected
growth (2009—20)
Growth (1999—
09)
Rank Income
2009 (US$)
Income 2009 (US$)
Rank Income
2020 (US$)
Income 2020 (US$)
China 1 4.32% 9.6% 81 3,744 70 5,962
India 2 4.26% 5.6% 99 1,192 97 1,886 Source: Hausmann and Hidalgo et.al (2016)
Hausmann and Hidalgo et.al also rank countries in terms of their expected contributions to world GDP growth in the period up to 2020. Here, China and India have the 2nd and 4th ranks respectively. The US and Japan have the 1st and 3rd ranks respectively. This contribution obviously depends on the size of the economy and its economic complexity. The following

Economy Watch: August 2017 12
table lists the countries with the first five ranks. India’s contribution is the highest in the South Asian region, where it has the first rank.
Table 10: Expected contributions to world GDP growth based on economic complexity
Rank Country Contribution to world GDP growth
Region
1 United States 22.41% North America
2 China 14.21% East Asia and Pacific
3 Japan 7.11% East Asia and Pacific
4 India 4.89% South Asia
5 Germany 3.88% Western Europe
Source: Hausmann and Hidalgo et.al (2016)
Critique of the Economic Complexity Atlas:
In the literature on this subject, it has generally been recognized that measuring economic complexity, which reflects an economy’s latent value of the underlying knowledge and capabilities used in the production of products, is a new and valuable way of looking at differences in relative growth and prosperity across countries. It has also been subjected to some critique, many of which relate not to the basic concept of capabilities resulting in complexity of the product mix attained by a country but to the way it has been measured.
The use of trade data rather than production data and the use of only goods rather than also services have been indicated to be important omissions in measuring economic complexity. It does underestimate the level of complexity for countries that are heavily reliant on non-tradables. Furthermore, many countries, including India, are service-based economies where the share of services in GDP is relatively high. This implies that India’s growth achievement and potential might have been underestimated in this framework. Another shortcoming of the measurement framework used by Hausmann and Hidalgo et al. (2014, 2011) is that their focus is on domestic production capacity and processes. It does not give enough importance to capacities and processes that are partitioned in different countries across the globe in the products where material and hardware may be produced in one place and software in other countries. Stojkoski et al (2016) found that complexity indices for services are on average higher than those of goods and argue that diversification and sophistication of services exports can provide growth for economies. The future of the world economy, ageing as it is at a fast rate, will depend heavily on exports of services such as health exports. Furthermore, large population economies like India will provide complex education services, which may largely be domestically produced and consumed. Inclusion of services and expansion of the product space to cover not only exports but the entire range of production might improve India’s rankings in the economic complexity measures.
This entire analysis also offers an additional way of giving new direction and interpretation to the Make in India campaign, where emphasis may be placed not so much on increasing the size of manufacturing but the complexity of goods and services featuring in India’s production basket. Thus, the focus should be on expanding production both of goods and services that require relatively more complex products, technologies and processes.

Economy Watch: August 2017 13
A. Monetary sector
i. Monetary policy
► In the monetary policy review held on 2 August 2017, the MPC recommended by a majority of 4 to 2 the reduction
of the policy repo rate by 25 basis points to 6.0% (Chart 16). Consequently, the reverse repo rate stands adjusted at
5.75%.
► In RBI’s assessment, upside risks to inflation that were perceived earlier have either abated or not materialized,
thereby opening some space for monetary accommodation. However, the MPC expects inflation to increase from the
current low levels and has therefore decided to retain a neutral policy stance.
► The increase in July 2017 CPI and WPI inflation rates confirms RBI’s apprehensions.
Given the persistence of the downward trend in CPI inflation, both core and overall, the Monetary Policy Committee decided to support growth through a rate reduction. However, the transmission of this rate reduction is likely to be limited due to the existence of excess liquidity and lack of private investment demand.
ii. Money stock
► Growth in broad money stock (M3) marginally improved to 7.4% in June 2017 from 7.0% in May 2017. Growth in
time deposits (accounting for over 76% of the broad money stock) fell further to 9.1% in June from 9.3% in May
2017, while demand deposits grew by 25.5% in June 2017 from 22.4% in May 2017.
► Growth in narrow money (M1) turned positive for the second time since November 2016, growing by 1.7% in June
2017 as compared to a contraction of (-) 0.9% in May 2017 (Chart 17). Currency in circulation (excluding non-
demonetized currency) had fallen to 84.0% of the total demonetized currency by 23 July 2017 from 84.5% on 14
July 2017, indicating the beginning of a slowdown in the rate of re-monetization.
iii. Aggregate credit and deposits
► Credit by scheduled commercial banks continued to grow at a meager pace of 6.0% (y-o-y) in June 2017, although it
marginally improved from 5.1% in May 2017 (Chart 18). During 1QFY18, average growth in bank credit fell to its
historic low levels of 5.5% from 6.6% in 4QFY17, pointing toward slackness in demand conditions.
► Growth in non-food credit increased to 4.8% in June 2017 from 4.1% in May 2017 led by recovery in the growth of
credit to the services sector as well as of personal loans. Growth in personal loans, a major component of retail
sector credit, increased to 14.1% in June (13.7% in May 2017), while growth in services sector credit improved to
4.7% in June from 4.0% in May 2017.
6 Money and finance: RBI reduced the repo rate by 25 basis points in its August 2017 review
Chart 16: Movements in repo rate
Chart 17: Growth in narrow and broad money
6.00
4
5
6
7
8
9
10
Au
g 1
0
Fe
b 1
1
Au
g 1
1
Fe
b 1
2
Au
g 1
2
Fe
b 1
3
Au
g 1
3
Fe
b 1
4
Au
g 1
4
Fe
b 1
5
Au
g 1
5
Fe
b 1
6
Au
g 1
6
Fe
b 1
7
Au
g 1
7
Repo rate
-25
-15
-5
5
15
25J
un
10
De
c 1
0
Ju
n 1
1
De
c 1
1
Ju
n 1
2
De
c 1
2
Ju
n 1
3
De
c 1
3
Ju
n 1
4
De
c 1
4
Ju
n 1
5
De
c 1
5
Ju
n 1
6
De
c 1
6
Ju
n 1
7
Narrow money (M1) Broad money (M3)
Source: Database on Indian Economy, RBI

Economy Watch: August 2017 14
► Credit growth to industries declined for the ninth straight month although at a relatively slower pace of (-) 1.1% in
June 2017 as compared to (-) 2.1% in May 2017. (Chart 19).
► Aggregate bank deposits marginally grew by 11.1% in June 2017 as compared to 10.9% (y-o-y) in May 2017. With
banks slashing interest rate paid on deposits, we expect bank deposits to become relatively less attractive, thereby
leading to a fall in deposit growth.
Chart 18: Growth in credit and deposits
Chart 19: Growth in industrial and personal loans
B. Financial sector
i. Interest rates
► Interest rate paid by banks on term deposits with more than one-year maturity was in the range of 6.31% to 6.95% in
May and June 2017 as compared to 6.50% to 7.00% in April 2017.
► On 31 July 2017, the State Bank of India (SBI), for the first time since 2011, lowered the interest rate on savings
accounts (with balances up to INR1 crore) by 50 basis points to 3.5%. The intention behind such a move might have
been to increase the bank’s net interest margin, given subdued demand for credit. It is expected that other banks
may soon follow SBI in lowering the interest rate.
► The average yield on 10-year government securities broadly averaged around 6.6% in June and July 2017, falling
from 7.1% in May 2017. Bond yields were influenced by a sharp fall in the CPI inflation in June 2017 to levels below
the lower end of RBI’s target range of 2% to 6% and by the news of reduction in current account deficit during the
4QFY18.
ii. FPI and stock market
► The benchmark S&P NIFTY continued its
positive trend for the sixth consecutive month
to reach 9,607 points (average), increasing by
170 points in June 2017 from 9,437 points in
May 2017 (Chart 20). Although the trends
remained positive during the month, investor
sentiments were partly dented by uncertainties
regarding the transition to GST, Fed’s decision
to increase the interest rates and RBI’s
directives to banks to increase the provisioning
for band loans.
► As per provisional data, overall FIIs decreased to
US$7.1 billion in June 2017 from US$8.4 billion
(revised) in May 2017 because of a decrease in
FDI inflows during the month.
► Net FDI inflows decreased to US$2.5 billion in
June 2017 from US$3.8 billion in May 2017,
while FPI inflows were marginally lower at US$4.5 billion in June 2017 as compared to US$4.6 billion in May 2017.
0
5
10
15
20
25
30
Ju
n 0
8
De
c 0
8
Ju
n 0
9
De
c 0
9
Ju
n 1
0
De
c 1
0
Ju
n 1
1
De
c 1
1
Ju
n 1
2
De
c 1
2
Ju
n 1
3
De
c 1
3
Ju
n 1
4
De
c 1
4
Ju
n 1
5
De
c 1
5
Ju
n 1
6
De
c 1
6
Ju
n 1
7
Aggregate deposits (% ann)Bank credit (% ann)
Source: Database on Indian Economy, RBI
-10
0
10
20
30
40
Ju
n 0
9
De
c 0
9
Ju
n 1
0
De
c 1
0
Ju
n 1
1
De
c 1
1
Ju
n 1
2
De
c 1
2
Ju
n 1
3
De
c 1
3
Ju
n 1
4
De
c 1
4
Ju
n 1
5
De
c 1
5
Ju
n 1
6
De
c 1
6
Ju
n 1
7
Credit to industry (% ann)Personal loans (% ann)
Source: Database on Indian Economy, RBI
Chart 20: Stock market movement
0
2000
4000
6000
8000
10000
12000
-10
-5
0
5
10
15
Ju
n-2
01
3
Oct
-20
13
Fe
b-2
01
4
Ju
n-2
01
4
Oct
-20
14
Fe
b-2
01
5
Ju
n-2
01
5
Oct
-20
15
Fe
b-2
01
6
Ju
n-2
01
6
Oct
-20
16
Fe
b-2
01
7
Ju
n-2
01
7
Net FPI US$ billion (LHS) S&P CNX NIFTY Index (RHS)
Source: Database on Indian Economy, RBI
Economy Watch: August 2017 15
7 Merchandise exports: Growth slows down further
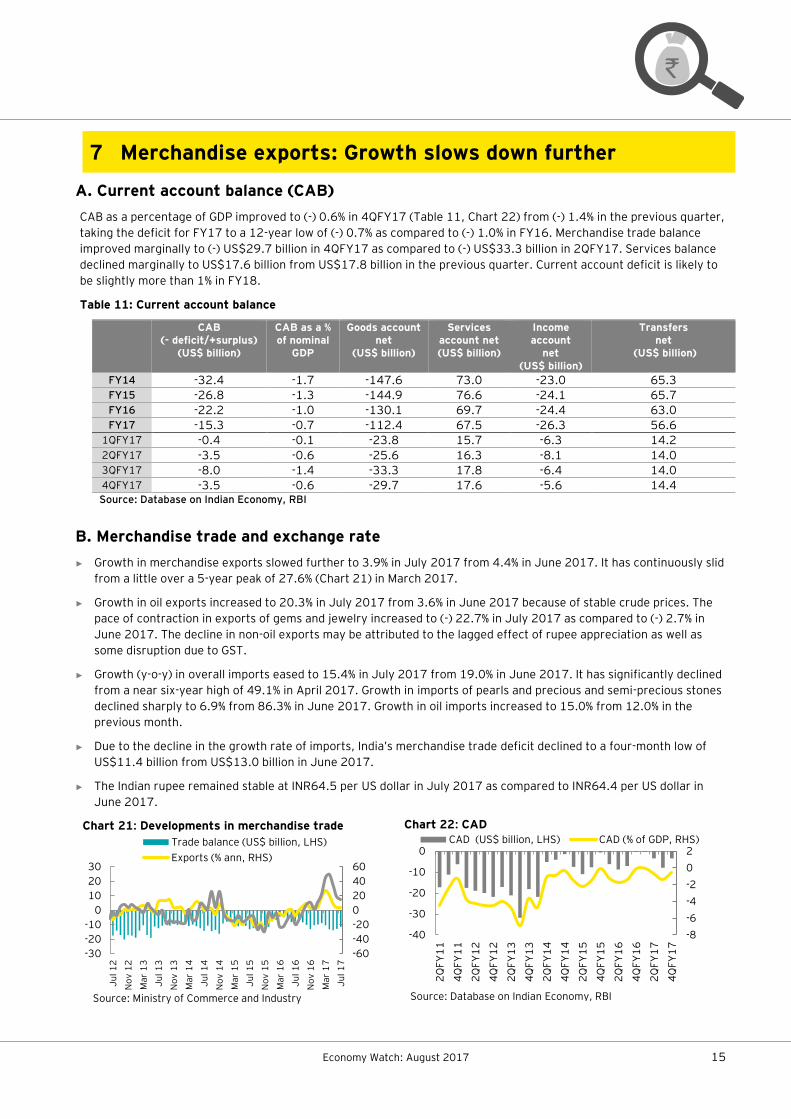
A. Current account balance (CAB)
CAB as a percentage of GDP improved to (-) 0.6% in 4QFY17 (Table 11, Chart 22) from (-) 1.4% in the previous quarter,
taking the deficit for FY17 to a 12-year low of (-) 0.7% as compared to (-) 1.0% in FY16. Merchandise trade balance
improved marginally to (-) US$29.7 billion in 4QFY17 as compared to (-) US$33.3 billion in 2QFY17. Services balance
declined marginally to US$17.6 billion from US$17.8 billion in the previous quarter. Current account deficit is likely to
be slightly more than 1% in FY18.
Table 11: Current account balance
CAB (- deficit/+surplus)
(US$ billion)
CAB as a % of nominal
GDP
Goods account net
(US$ billion)
Services account net (US$ billion)
Income account
net (US$ billion)
Transfers net
(US$ billion)
FY14 -32.4 -1.7 -147.6 73.0 -23.0 65.3 FY15 -26.8 -1.3 -144.9 76.6 -24.1 65.7 FY16 -22.2 -1.0 -130.1 69.7 -24.4 63.0 FY17 -15.3 -0.7 -112.4 67.5 -26.3 56.6
1QFY17 -0.4 -0.1 -23.8 15.7 -6.3 14.2 2QFY17 -3.5 -0.6 -25.6 16.3 -8.1 14.0 3QFY17 -8.0 -1.4 -33.3 17.8 -6.4 14.0 4QFY17 -3.5 -0.6 -29.7 17.6 -5.6 14.4 Source: Database on Indian Economy, RBI
B. Merchandise trade and exchange rate
► Growth in merchandise exports slowed further to 3.9% in July 2017 from 4.4% in June 2017. It has continuously slid
from a little over a 5-year peak of 27.6% (Chart 21) in March 2017.
► Growth in oil exports increased to 20.3% in July 2017 from 3.6% in June 2017 because of stable crude prices. The
pace of contraction in exports of gems and jewelry increased to (-) 22.7% in July 2017 as compared to (-) 2.7% in
June 2017. The decline in non-oil exports may be attributed to the lagged effect of rupee appreciation as well as
some disruption due to GST.
► Growth (y-o-y) in overall imports eased to 15.4% in July 2017 from 19.0% in June 2017. It has significantly declined
from a near six-year high of 49.1% in April 2017. Growth in imports of pearls and precious and semi-precious stones
declined sharply to 6.9% from 86.3% in June 2017. Growth in oil imports increased to 15.0% from 12.0% in the
previous month.
► Due to the decline in the growth rate of imports, India’s merchandise trade deficit declined to a four-month low of
US$11.4 billion from US$13.0 billion in June 2017.
► The Indian rupee remained stable at INR64.5 per US dollar in July 2017 as compared to INR64.4 per US dollar in
June 2017.
Chart 21: Developments in merchandise trade
Chart 22: CAD
-60
-40
-20
0
20
40
60
-30
-20
-10
0
10
20
30
Ju
l 1
2
No
v 1
2
Ma
r 1
3
Ju
l 1
3
No
v 1
3
Ma
r 1
4
Ju
l 1
4
No
v 1
4
Ma
r 1
5
Ju
l 1
5
No
v 1
5
Ma
r 1
6
Ju
l 1
6
No
v 1
6
Ma
r 1
7
Ju
l 1
7
Trade balance (US$ billion, LHS)
Exports (% ann, RHS)
Source: Ministry of Commerce and Industry
-8
-6
-4
-2
0
2
-40
-30
-20
-10
0
2Q
FY
11
4Q
FY
11
2Q
FY
12
4Q
FY
12
2Q
FY
13
4Q
FY
13
2Q
FY
14
4Q
FY
14
2Q
FY
15
4Q
FY
15
2Q
FY
16
4Q
FY
16
2Q
FY
17
4Q
FY
17
CAD (US$ billion, LHS) CAD (% of GDP, RHS)
Source: Database on Indian Economy, RBI

Economy Watch: August 2017 16
A. Global growth outlook
► The IMF (WEO Update, July 2017) has projected global growth at 3.5% in 2017 and 3.6% in 2018, unchanged from
the April WEO projections. However, the projections mask different growth performance at the country level (Chart
23).
► Growth in advanced economies is forecasted at 2% in 2017 and it has been revised down to 1.9% in 2018. This is
due to the downward revision of growth projections in the US and the UK.
► In the US, GDP growth is now projected at 2.1% in 2017 and 2018 (from
2.3% and 2.5% respectively). This is due to the weak growth outturn in
1Q17 and the assumption that fiscal policy would be less expansionary
going forward than previously anticipated.
► Growth forecast has also been revised down by 0.3% point for the UK at
1.7% in 2017 due to weaker than expected activity in 1Q17.
► In contrast, growth projections for 2017 have been revised up for many Euro area countries, including France,
Germany, Italy and Spain. For the Euro area as a whole, growth has been revised up to 1.9% in 2017 and 1.7% in
2018.
► Growth forecast for 2017 has also been revised up for Canada and marginally for Japan. In Japan, growth in the
first quarter of 2017 was supported by private consumption, investment and exports.
► Growth in EMDEs is projected at 4.6% in 2017 and 4.8% in 2018. The forecast for 2017 reflects an upward revision
of 0.1% point relative to April 2017.
► In China, GDP growth is projected at 6.7% in 2017, same as in 2016, and projected to decline to 6.4% in 2018. The
forecast for 2017 has been revised up by 0.1% point, reflecting stronger than expected growth in 1Q17. For 2018,
an upward revision of 0.2% point reflects the expectation of a delay in the fiscal adjustment to meet the country’s
target of doubling 2010 real GDP by 2020. However, this delay comes at the cost of a large increase in debt.
► In both Brazil and Russia, GDP growth is projected to recover gradually in 2017 and 2018. Growth in South Africa in
2017 has undergone a slight upward revision, reflecting a bumper crop due to better rainfall and increase in mining
output prompted by a moderate rebound in commodity prices. However, the growth forecast for 2018 is lower
because of political uncertainty and weak consumer and business confidence.
► Growth in world trade volume of goods and services1 has been revised upwards to 4% in 2017 and 3.9% in 2018.
Chart 23: Global growth projections
Chart 24: Global crude and coal prices
Source: IMF World Economic Outlook Update, July 2017, * Forecast pertains to the fiscal year.
1 Simple average of growth rates for export and import volumes (goods and services).
3.6
1.3
1.4
0.6
1.7
1.5
2.1
1.2
6.4
7.7
3.5
0.3
1.4
1.3
1.9
1.7
2.1
1.0
6.7
7.2
0.0 5.0 10.0
Global growth
Brazil
Russia
Japan
Euro area
The UK
The US
South Africa
China
India*
2017
2018
-100
-50
0
50
100
150
200
Ju
l 0
9N
ov 0
9M
ar
10
Ju
l 1
0N
ov 1
0M
ar
11
Ju
l 1
1N
ov 1
1M
ar
12
Ju
l 1
2N
ov 1
2M
ar
13
Ju
l 1
3N
ov 1
3M
ar
14
Ju
l 1
4N
ov 1
4M
ar
15
Ju
l 1
5N
ov 1
5M
ar
16
Ju
l 1
6N
ov 1
6M
ar
17
Ju
l 1
7
Coal average price (US$/mt)
Coal inflation rate (% ann)
Crude Oil (US$/brl)
Souce: World Bank, Pinksheet
8 Global economy: Pick-up in global growth anticipated by the IMF in April remains on track
The IMF has projected global growth at 3.5% in 2017 and 3.6% in 2018, unchanged from the April WEO projections. However, the growth performance varies by country.

Economy Watch: August 2017 17
B. Global energy prices ► Global crude prices increased marginally to US$47.7/bbl. in July 2017 from US$46.2/bbl. in June 2017 (Chart 24).
Oil prices peaked in February 2017 (US$54.4/bbl.) following the OPEC deal, but the effect was offset by increased
shale oil production in the US and output increases by Libya and Nigeria, which are exempt from supply cuts. As per
IEA’s latest Oil Market Report, OPEC compliance rate has dropped to 78%, the lowest rate this year largely due to
continued output increase by Saudi Arabia.
► Average global coal prices increased to a six-month high of US$82.7/bbl. in July 2017 from S$77.4/mt in June
2017. This is still lower than the peak price of US$92/bbl. in November 2016.

Economy Watch: August 2017 18
The IAD at 4.5% in June 2017, rising from 3.8% in May 2017, signals continued strengthening of aggregate demand. However, the indications are that the trend was reversed in July 2017.
► An IAD has been developed to reflect demand conditions in the agriculture, manufacturing and services sectors on a
monthly basis. It takes into account movements in PMI for manufacturing and services, which traces the demand
conditions in these sectors. Demand conditions in the agricultural sector have been captured by movements in
monthly agricultural credit off-take.
► The sectoral weights in constructing the IAD are based on their respective shares in nominal GVA in the base year
(2011—12): agriculture (18.4), industry (33.1) and services (48.5).
► The y-o-y growth in IAD increased for the second straight month to 4.5% in June 2017 from 3.8% in May 2017
(Chart 25). Growth in IAD was supported largely by increased growth in the services as well as the agricultural
sector, while growth in the manufacturing sector slowed down.
Chart 25: Growth in IAD (y-o-y)
Source (Basic data): NIKKEI PMI - Markit Economics, RBI and EY estimates
Table 12: IAD
Month Oct-16 Nov-16 Dec-16 Jan-17 Feb-17 Mar-17 Apr-17 May-17 Jun-17
IAD 126.3 110.3 112.2 116.3 121.0 124.2 120.8 123.0 122.9
Growth
(% y-o-y) 7.7 -3.6 -4.0 -2.6 4.1 2.4 -0.1 3.8 4.5
4.5
-40
-30
-20
-10
0
10
20
30
40
Ju
n 0
9
Oct
09
Fe
b 1
0
Ju
n 1
0
Oct
10
Fe
b 1
1
Ju
n 1
1
Oct
11
Fe
b 1
2
Ju
n 1
2
Oct
12
Fe
b 1
3
Ju
n 1
3
Oct
13
Fe
b 1
4
Ju
n 1
4
Oct
14
Fe
b 1
5
Ju
n 1
5
Oct
15
Fe
b 1
6
Ju
n 1
6
Oct
16
Fe
b 1
7
Ju
n 1
7
9 Index of Aggregate Demand (IAD): Improves further in June 2017

Economy Watch: August 2017 19
Table A1: Industrial growth indicators (annual, quarterly and monthly growth rates, y-o-y)
Fiscal year/quarter/month
IIP Mining Manufactu
ring Electricity
Core IIP
Fiscal year/quarter/month
PMI mfg. PMI ser.
% change y-o-y
FY14 3.3 -0.2 3.6 6.0 2.6 FY14 50.5 48.5
FY15 4.0 -1.3 3.8 14.8 4.9 FY15 52.2 51.7
FY16 3.3 4.3 2.9 5.7 3.0 FY16 51.3 51.7
FY17 4.6 5.3 4.3 5.8 4.8 FY17 51.6 51.0
2QFY17 4.5 -1.5 5.5 3.1 3.8 2QFY17 52.2 52.9
3QFY17 3.8 6.7 3.1 6.1 5.3 3QFY17 52.1 49.3
4QFY17 3.1 7.9 2.2 4.3 3.1 4QFY17 51.2 50.2
1QFY18 2.0 1.3 1.8 5.3 2.7 1QFY18 51.7 51.8
Mar-17 4.4 10.1 3.3 6.2 5.2 Apr-17 52.5 50.2
Apr-17 3.4 3.2 3.2 5.4 2.8 May-17 51.6 52.2
May-17 2.8 0.2 2.6 8.3 4.1 June-17 50.9 53.1
Jun-17 -0.1 0.4 -0.4 2.1 0.4 July -17 47.9 45.9
Source: Office of the Economic Adviser- Ministry of Commerce and Industry and NIKKEI PMI-Markit Economics
Table A2: Inflation indicators (annual, quarterly and monthly growth rates, y-o-y)
Source: Office of the Economic Adviser, Ministry of Commerce and Industry and MOSPI
10 Appendix: Capturing macro-fiscal trends
Fiscal year/quarter/month
CPI Food Price Index
Fuel and lighting
WPI Food Index Mfg. products
Fuel and power
% change y-o-y % change y-o-y
FY14 9.4 12.1 7.7 5.2 9.6 3.0 7.1
FY15 5.9 6.4 4.2 1.3 4.3 2.6 -6.1
FY16 4.9 4.9 5.3 -3.7 1.2 -1.8 -19.7
FY17 4.5 4.2 3.3 1.7 5.9 1.3 -0.3
2QFY17 5.2 6.1 2.8 1.0 7.2 0.8 -6.8
3QFY17 3.7 2.2 3.2 1.7 4.8 1.9 1.7
4QFY17 3.6 1.5 4.2 5.0 4.7 3.3 21.3
1QFY18 2.2 -0.9 5.4 2.3 0.4 2.6 11.2
Apr-17 3.0 0.6 6.1 3.9 2.5 3.1 17.1
May-17 2.2 -1.0 5.5 2.2 0.1 2.6 11.7
Jun-17 1.5 -2.1 4.5 0.9 -1.3 2.3 5.3
Jul-17 2.4 -0.3 4.9 1.9 2.1 2.2 4.4

Economy Watch: August 2017 20
Table A3: Fiscal indicators (annual growth rates, cumulated monthly growth rates, y-o-y)
Source: Monthly Accounts, Controller General of Accounts-Government of India, Union Budget Documents Table A4: Monetary and financial indicators (annual, quarterly and monthly growth rates, y-o-y)
Fiscal year/month
Repo rate
(end of period)
Fiscal year/quarter/month
M1 M3 Bank credit
Agg. deposits
10 yr. Govt. B
Yield
Net FDI Net FPI FX reserves
% % change y-o-y % US$ billion
US$ billion
US$ billion
FY14 8.00 FY14 8.5 13.4 14.9 14.2 8.4 21.6 4.8 304.2
FY15 7.50 FY15 11.3 10.9 11.0 12.1 8.3 31.3 42.2 341.6
FY16 6.75 FY16 13.5 10.1 9.7 10.5 7.7 36.0 -4.1 355.6
FY17 6.25 FY17 3.6 10.6 8.0 11.7 7.0 35.6 7.6 370.0
Jan-17 6.25 2Q FY17 21.0 14.6 10.4 10.7 7.0 17.0 6.1 372.0
Feb-17 6.25 3Q FY17 -18.6 6.6 6.5 13.2 6.6 9.7 -11.3 360.3
Mar-17 6.25 4Q FY17 3.6 10.6 5.8 13.6 6.9 5.0 10.8 370.0
Apr-17 6.25 1Q FY18 1.7 7.4 5.5 11.2 7.0 8.0 12.4 386.5
May-17 6.25 Mar-17 3.6 10.6 8.2 15.3 7.0 -0.1 8.9 370.0
Jun-17 6.25 Apr-17 -2.3 7.1 5.2 11.5 7.2 1.7 3.2 372.7
Jul-17 6.25 May-17 -0.9 7.0 5.1 10.9 7.1 3.8 4.6 378.8
Aug-17 6.00 Jun-17 1.7 7.4 6.0 11.1 6.6 2.5 4.5 386.5
Source: Database on Indian Economy-RBI
Fiscal year/month
Gross tax revenue
Corporate tax
Income tax
Custom duty
Excise duty
Service tax
Fiscal deficit Revenue deficit
% change y-o-y % of GDP % of GDP
FY15 9.3 8.7 8.7 9.2 11.6 8.6 4.0 2.9
FY16 17.0 6.0 8.5 11.9 51.9 25.8 3.9 2.5
FY17 17.9 6.7 21.5 7.4 32.7 20.4 3.5 2.0
FY18 (BE) 12.2 9.1 24.9 12.9 5.0 11.1 3.2 1.9
Cumulated growth (% y-o-y) % of budget target
Nov-16 21.5 9.0 20.9 6.8 46.0 27.1 85.8 98.4
Dec-16 18.3 4.8 20.5 4.9 43.7 25.0 93.8 (RE) 113.9 (RE)
Jan-17 17.7 3.2 19.7 5.2 42.9 23.3 105.6 (RE) 130.2 (RE)
Feb-17 17.6 3.5 20.9 5.2 40.3 21.3 113.4 (RE) 142.8 (RE)
Mar-17 17.9 6.7 21.5 7.4 32.7 20.4 100.1 (RE) 99.1 (RE)
Apr-17 33.0 322.4 8.0 16.5 429.1 14.3 37.6 55.5
May-17 25.0 2068.2 11.4 17.6 15.9 10.2 68.3 100.7
Jun-17 15.2 24.3 10.6 15.0 7.3 20.4 80.8 119.3

Economy Watch: August 2017 21
Table A5: External trade and global growth
Source: Database on Indian Economy- RBI, Pink Sheet-World Bank and IMF World Economic Outlook April 2017 and IMF World Economic Outlook Update, July 2017; * estimated data, ** forecasted data
Table A6: Macroeconomic aggregates (annual and quarterly real growth rates, % change y-o-y)
Expenditure components Output: aggregate and selected sectors
Fiscal year/quarter GDP PCE GCE GFCF EX IM GVA Agri. Ind. Serv.
FY14 6.5 7.4 0.6 1.8 7.8 -8.1 6.2 5.6 4.2 7.7
FY15 7.3 6.2 9.6 3.2 1.8 0.9 7.0 -0.2 6.8 9.7
FY16 8.0 6.1 3.3 6.5 -5.3 -5.9 7.9 0.7 8.8 9.7
FY17 (PE) 7.1 8.7 20.8 2.4 4.5 2.3 6.6 4.9 5.6 7.7
4QFY15 6.7 6.6 -3.3 5.4 -6.3 -6.1 6.1 -0.1 5.2 9.0
1QFY16 7.6 2.0 0.1 4.7 -6.1 -5.8 7.6 2.4 7.3 9.3
2QFY16 8.4 3.9 4.1 5.0 -4.4 -3.7 8.2 2.3 7.1 10.1
3QFY16 7.4 5.9 5.1 7.0 -8.7 -10.0 7.3 -2.1 10.3 9.6
4QFY16 9.0 11.8 2.4 3.9 -1.6 -3.7 8.7 1.5 10.3 10.0
1QFY17 7.9 8.4 16.6 7.4 2.0 -0.5 7.6 2.5 7.4 9.0
2QFY17 7.5 7.9 16.5 3.0 1.5 -3.8 6.8 4.1 5.9 7.8
3QFY17 7.0 11.1 21.0 1.7 4.0 2.1 6.7 6.9 6.2 6.9
4QFY17 6.1 7.3 31.9 -2.1 10.3 11.9 5.6 5.2 3.1 7.2
Source: National Accounts Statistics, MOSPI
External trade indicators (annual, quarterly and monthly growth rates) Global growth (annual)
Fiscal year/quarter/month
Exports Imports Trade balance
Ex. rate (avg.)
Crude prices (avg.)
Coal prices (avg.)
Calendar year
World GDP
Adv. econ.
Emer. econ.
% change y-o-y US$ billion INR/US$ US$/bbl US$/mt % change y-o-y
FY14 4.7 -8.3 -135.8 60.5 103.7 76.1 2009 -0.1 -3.4 2.9
FY15 -1.3 -0.5 -137.7 61.1 83.2 65.9 2010 5.4 3.1 7.5
FY16 -15.5 -15.0 -117.7 65.5 46.0 52.7 2011 4.2 1.7 6.3
FY17 5.0 0.0 -105.6 67.1 47.9 70.4 2012 3.5 1.2 5.3
2QFY17 -0.9 -12.2 -23.7 67.0 44.7 63.5 2013 3.3 1.2 5.0
3QFY17 1.0 -1.4 -33.5 67.4 49.1 87.7 2014 3.4 1.9 4.6
4QFY17 19.2 10.4 -29.2 67.0 52.9 79.8 2015 3.4 2.1 4.3
1QFY18 11.2 34.3 -40.1 64.4 49.4 75.3 2016* 3.2 1.7 4.3
Apr-17 19.8 49.1 -13.2 64.5 52.2 76.8 2017** 3.5 2.0 4.6
May-17 8.3 33.1 -13.8 64.4 49.9 71.7 2018** 3.6 1.9 4.8
Jun-17 4.4 19.0 -13.0 64.4 46.2 77.4 2019** 3.7 1.9 4.9
July-17 3.9 15.4 -11.4 64.5 47.7 82.7 2020** 3.7 1.7 4.9

Economy Watch: August 2017 22
List of abbreviations
Sr. no Abbreviations Description
1 AD Aggregate demand
2 bbl. Barrel
3 CAB Current account balance
4 CPI Consumer Price Index
5 CSO Central Statistical Organization
6 Disc. Discrepancies
7 EMDEs Emerging market and developing economies
8 EXP Exports
9 FII Foreign investment inflows
10 FPI Foreign portfolio investment
11 FRBM Fiscal Responsibility and Budget Management
12 FY Fiscal year (April—March)
13 GDP Gross domestic product
14 GFCE Government final consumption expenditure
15 GFCF Gross fixed capital formation
16 GST Goods and Services Tax
17 GVA Gross value added
18 IAD Index of Aggregate Demand
19 IEA International Energy Agency
20 IIP Index of Industrial Production
21 IMF International Monetary Fund
22 IMP Imports
23 MCLR Marginal cost of funds based lending rate
24 m-o-m Month-on-month
25 mt Metric tonne
26 MPC Monetary Policy Committee
27 NDU Non-departmental undertaking
28 NEXP Net exports (exports minus imports of goods and services)
29 OECD Organisation for Economic Cooperation and Development
30 OPEC Organization of the Petroleum Exporting Countries
31 PFCE Private final consumption expenditure
32 PMI Purchasing Managers’ Index (reference value = 50)
33 PSU Public sector undertaking
34 RE Revised estimate
35 WEO World Economic Outlook
36 WPI Wholesale Price Index
37 y-o-y Year on year

Our offices Ahmedabad 2nd floor, Shivalik Ishaan Near C.N. Vidhyalaya Ambawadi Ahmedabad - 380 015 Tel: + 91 79 6608 3800 Fax: + 91 79 6608 3900 Bengaluru 6th, 12th & 13th floor “UB City,” Canberra Block No.24 Vittal Mallya Road Bengaluru - 560 001 Tel: + 91 80 4027 5000 + 91 80 6727 5000 + 91 80 2224 0696 Fax: + 91 80 2210 6000 Ground Floor, ‘A’ wing Divyasree Chambers # 11, O’Shaughnessy Road Langford Gardens Bengaluru - 560 025 Tel: +91 80 6727 5000 Fax: +91 80 2222 9914 Chandigarh 1st Floor, SCO: 166-167 Sector 9-C, Madhya Marg Chandigarh - 160 009 Tel: +91 172 331 7800 Fax: +91 172 331 7888 Chennai Tidel Park, 6th & 7th Floor A Block (Module 601,701-702) No.4, Rajiv Gandhi Salai Taramani, Chennai - 600 113 Tel: + 91 44 6654 8100 Fax: + 91 44 2254 0120 Delhi NCR Golf View Corporate Tower B Sector 42, Sector Road Gurgaon - 122 002 Tel: + 91 124 464 4000 Fax: + 91 124 464 4050 3rd & 6th Floor, Worldmark-1 IGI Airport Hospitality District Aerocity, New Delhi - 110 037 Tel: + 91 11 6671 8000 Fax + 91 11 6671 9999 4th & 5th Floor, Plot No 2B Tower 2, Sector 126 NOIDA - 201 304 Gautam Budh Nagar, U.P. Tel: + 91 120 671 7000
Fax: + 91 120 671 7171
Hyderabad Oval Office, 18, iLabs Centre Hitech City, Madhapur Hyderabad - 500 081 Tel: + 91 40 6736 2000 Fax: + 91 40 6736 2200 Jamshedpur 1st Floor, Shantiniketan Building Holding No. 1, SB Shop Area Bistupur, Jamshedpur – 831 001 Tel: +91 657 663 1000 BSNL: +91 657 223 0441 Kochi 9th Floor, ABAD Nucleus NH-49, Maradu PO Kochi - 682 304 Tel: + 91 484 304 4000 Fax: + 91 484 270 5393 Kolkata 22 Camac Street 3rd Floor, Block ‘C’ Kolkata - 700 016 Tel: + 91 33 6615 3400 Fax: + 91 33 2281 7750 Mumbai 14th Floor, The Ruby 29 Senapati Bapat Marg Dadar (W), Mumbai - 400 028 Tel: + 91 22 6192 0000 Fax: + 91 22 6192 1000 5th Floor, Block B-2 Nirlon Knowledge Park Off. Western Express Highway Goregaon (E) Mumbai - 400 063 Tel: + 91 22 6192 0000 Fax: + 91 22 6192 3000 Pune C-401, 4th floor Panchshil Tech Park Yerwada (Near Don Bosco School) Pune - 411 006 Tel: + 91 20 6603 6000
Fax: + 91 20 6601 5900

Ernst & Young LLP
EY | Assurance | Tax | Transactions | Advisory
About EY
EY is a global leader in assurance, tax, transaction and advisory services. The insights and quality services we deliver help build trust and confidence in the capital markets and in economies the world over. We develop outstanding leaders who team to deliver on our promises to all of our stakeholders. In so doing, we play a critical role in building a better working world for our people, for our clients and for our communities.
EY refers to the global organization, and may refer to one or more, of the member firms of Ernst & Young Global Limited, each of which is a separate legal entity. Ernst & Young Global Limited, a UK company limited by guarantee, does not provide services to clients. For more information about our organization, please visit ey.com.
Ernst & Young LLP is one of the Indian client serving member
firms of EYGM Limited. For more information about our
organization, please visit www.ey.com/in.
Ernst & Young LLP is a Limited Liability Partnership, registered
under the Limited Liability Partnership Act, 2008 in India, having
its registered office at 22 Camac Street, 3rd Floor, Block C,
Kolkata - 700016
© 2017 Ernst & Young LLP. Published in India.
All Rights Reserved.
EYIN1708-093
ED None
This publication contains information in summary form and is therefore intended for general guidance only. It is not intended to be a substitute for detailed research or the exercise of professional judgment. Neither Ernst & Young LLP nor any other member of the global Ernst & Young organization can accept any responsibility for loss occasioned to any person acting or refraining from action as a result of any material in this publication. On any specific matter, reference should be made to the appropriate advisor.
EY refers to the global organization, and/or one or more of the independent member firms of Ernst & Young Global Limited